strategic flood risk assessment jan 2012
TRANSCRIPT

Brighton and Hove Council Strategic Flood Risk Assessment
Final January 2012
Brighton and Hove City Council Hove Town Hall Norton Road Hove BN3 3BQ
2011s5199 B&H SFRA - Final Report (v2 Jan12).doc i
JBA Office JBA Consulting Aberdeen House South Road Haywards Heath West Sussex RH16 4NG
JBA Project Manager Francesca Hurt
Revision History
Revision Ref / Date Issued Amendments Issued to
Draft Report (v1) - Lyndsey Beveridge (Senior Planning Officer)
Final Report (v1) Comments from Lyndsey Beveridge
Mike Holford (Senior Planning Officer)
Final Report (v2) Comments from Mike Holford
Mike Holford (Senior Planning Officer)
Contract This report describes work commissioned by Lyndsey Beveridge, on behalf of Brighton and Hove City Council, by a letter dated 26th July 2011. Francesca Hurt and Liu Yang of JBA Consulting carried out this work.
Prepared by .................................................. Francesca Hurt BSc MSc
Analyst
....................................................................... Liu Yang BSc CEnv MCIWEM C.WEM
Senior Analyst
Reviewed by ................................................. Marc Pinnell BSc MSc CEnv MCIWEM C.WEM
Divisional Manager
Purpose This document has been prepared as a final report for Brighton and Hove City Council. JBA Consulting accepts no responsibility or liability for any use that is made of this document other than by the Client for the purposes for which it was originally commissioned and prepared.
JBA Consulting has no liability regarding the use of this report except to Brighton and Hove City Council.

2011s5199 B&H SFRA - Final Report (v2 Jan12).doc ii
Copyright © Jeremy Benn Associates Limited 2012
Carbon Footprint
264g
A printed copy of the main text in this document will result in a carbon footprint of 264g if 100% post-consumer recycled paper is used and 336g if primary-source paper is used. These figures assume the report is printed in black and white on A4 paper and in duplex.
JBA is aiming to achieve carbon neutrality.
Contents
2011s5199 B&H SFRA - Final Report (v2 Jan12).doc
1 Introduction .............................................................................................................. 1
1.1 Background to the study ............................................................................................ 1 1.2 Study Area ................................................................................................................. 1 1.3 SFRA objectives ........................................................................................................ 2 1.4 Over arching legislation ............................................................................................. 2 1.5 Approach ................................................................................................................... 4
2 Data Sources ............................................................................................................ 6
2.1 Overview .................................................................................................................... 6 2.2 Significant updates to data ........................................................................................ 7
3 Approach to Strategic Flood Risk Assessment ................................................... 12
3.1 Overview .................................................................................................................... 12 3.2 Sequential approach ................................................................................................. 13 3.3 Sequential Test .......................................................................................................... 13 3.4 Exception Test ........................................................................................................... 16
4 Flood risk in Brighton and Hove ............................................................................ 20
4.1 Introduction ................................................................................................................ 20 4.2 Fluvial flood risk ......................................................................................................... 20 4.3 Tidal flood risk ........................................................................................................... 21 4.4 Surface water flood risk ............................................................................................. 26 4.5 Groundwater flood risk .............................................................................................. 26 4.6 Sewer flood risk ......................................................................................................... 27 4.7 Flood risk from artificial sources ................................................................................ 27
5 Level 2 Strategic Site Allocations .......................................................................... 28
5.1 Introduction ................................................................................................................ 28 5.2 Brighton and Hove City Plan sites ............................................................................. 28 5.3 Site specific assessment for the City Plan sites ........................................................ 28 5.4 Addressing flood risk in site allocations .................................................................... 28
6 Recommendations and Guidance ......................................................................... 30
6.1 Using SFRA risk information ..................................................................................... 30 6.2 For Brighton and Hove City Council .......................................................................... 30 6.3 For Developers .......................................................................................................... 32
Appendices ........................................................................................................................... I
A Maps.......................................................................................................................... II
B City Plan site summary sheets .............................................................................. XIII
C Recommendations for Future Developments ...................................................... XIV
D Requirements for Future Development................................................................. XIX

2011s5199 B&H SFRA - Final Report (v2 Jan12).doc
List of Figures Figure 1.1: Key documents and strategic planning links - Flood Risk - (©JBA) ................... 3
Figure 1.2 Flood risk management hierarchy......................................................................... 5
Figure 4.1 Illustration of residual risk associated with defence failure ................................... 22
Figure 4.2 Illustration of residual risk associated with wave overtopping .............................. 23
Figure 4.3 Impact of wave overtopping: comparison between Flood Zone 3b with and without the effect of waves.................................................................................... 24
Figure 4.4 Impact of wave overtopping: increases in flood risk extent when effect of waves is included .................................................................................................. 24
Figure 6.1: Use of SFRA information .................................................................................... 30
Figure C 1: Permanent flood barriers ..................................................................................... XV
Figure C 2: Groundwater source protection zones across Brighton and Hove ..................... XVII
Figure C 3: Example of a green roof in Fulham ..................................................................... XVIII
List of Tables Table 1.1 Roles and responsibilities ..................................................................................... 4
Table 2.1: Summary of data used to compile SFRA ............................................................. 7
Table 3.1 Annual probabilities of flooding associated with PPS25 Flood Zones(Source: PPS25 Practice Guide Figure 3.3) ........................................................................ 12
Table 3.2 Flood Risk Vulnerability Classification (Source: PPS25 Table D2) ....................... 18
Table 3.3 Flood risk vulnerability and Flood Zone compatibility (Source: PPS25 Table D3)......................................................................................................................... 19
Table 4.1 Difference in Extreme Sea Level (mAOD) ............................................................. 25
Table 4.2 Properties at risk of surface water flooding in a 1 in 200 year event (Source Table 5.1 Brighton and Hove PFRA, 2011)* ......................................................... 26

2011s5199 B&H SFRA - Final Report (v2 Jan12).doc 2
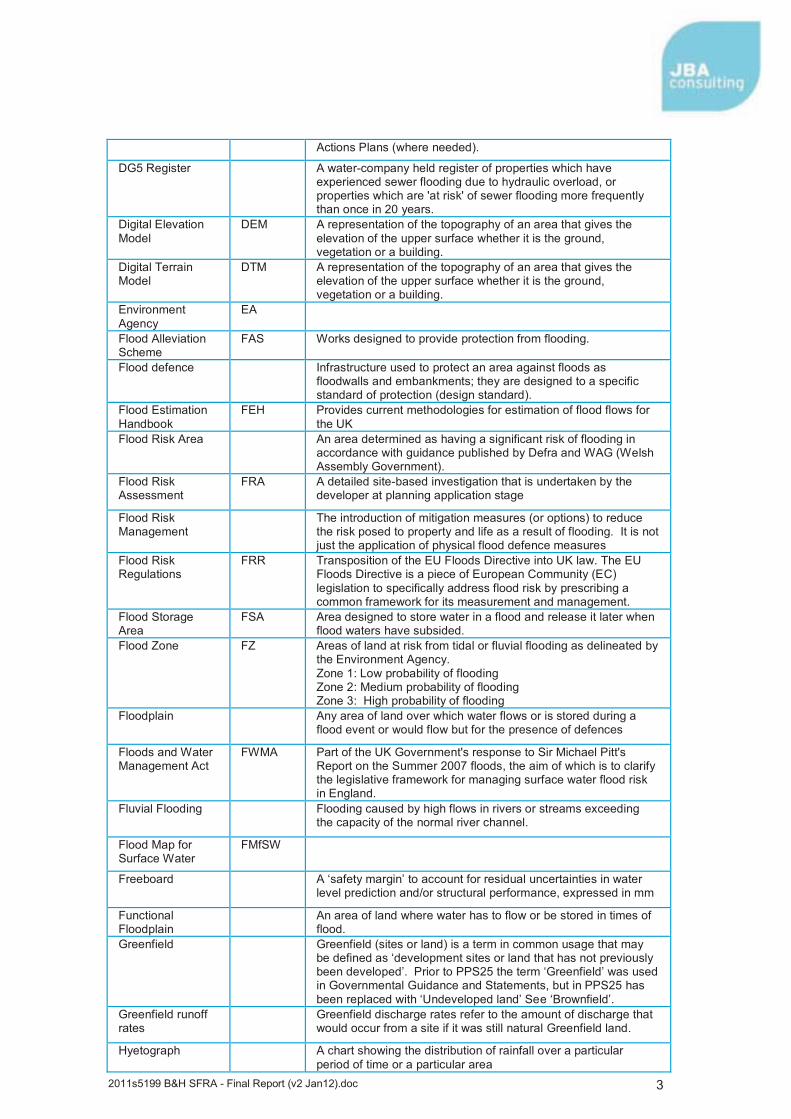
Glossary and Abbreviations Term Abbr Definition 2D model Two-dimensional hydraulic model Actual Risk The risk posed to development situated within a defended area
(i.e. behind defences), expressed in terms of the probability that the defence will be overtopped, and/or the probability that the defence will suffer a structural failure, and the consequence should a failure occur
Annual Exceedance Probability
AEP The probability that an event is exceeded in any given year.
Aquifer A source of groundwater comprising water bearing rock, sand or gravel capable of yielding significant quantities of water.
Area Benefiting from Defence
ABD Those areas which benefit from formal flood defences in the event of flooding from rivers with a 1% chance in any given year or from the sea with a 0.5% chance in any given year. If the defences were not there, these areas would be flooded.
Areas Susceptible to Surface Water Flooding
AStSWF Areas that are susceptible to surface water flooding
Brighton and Hove City Council
BHCC
Brownfield Brownfield (sites or land) is a term in common usage that may be defined as ‘development sites or land that has previously been developed’. Prior to PPS25 the term ‘Brownfield’ was used in Government Guidance and Statements, but in PPS25 has been replaced with ‘Previously-developed land’ see ‘Greenfield’.
Catchment Flood Management Plan
CFMP A high-level planning strategy through which the Environment Agency works with their key decision makers within a river catchment to identify and agree policies to secure the long-term sustainable management of flood risk.
CIRIA Construction Industry Research and Information Association CLG Government Department for Communities and Local
Government Climate Change Long term variations in global temperature and weather patterns
caused by natural and human actions.
City Plan CP The City Plan is the council's key planning document and will provide the overall strategic vision for the future of Brighton & Hove to 2030. It will set out how the council will respond to local priorities, meet the challenges of the future and identify the broad locations, scale and types of development needed together with the supporting infrastructure.
Critical Drainage Area
A discrete geographic area (usually a hydrological catchment) where multiple and interlinked sources of flood risk (surface water, groundwater, sewer, main river and/or tidal) cause flooding in one or more Local Flood Risk Zones during severe weather thereby affecting people, property or local infrastructure.
Culvert A channel or pipe that carries water below the level of the ground.
Defended Area An area offered a degree of protection against flooding through the presence of a flood defence structure
Department for Environment, Food and Rural Affairs
Defra A Government Department.
Development Plan Documents
DPDs These documents have Development Plan Status and consequently form part of the statutory development plan for the area. A DPD will be subject to an independent examination. Typical documents that will have DPD status include the City Plan, Site-specific Allocations of Land, Proposals Map, and Area
2011s5199 B&H SFRA - Final Report (v2 Jan12).doc 3
Actions Plans (where needed).
DG5 Register A water-company held register of properties which have experienced sewer flooding due to hydraulic overload, or properties which are 'at risk' of sewer flooding more frequently than once in 20 years.
Digital Elevation Model
DEM A representation of the topography of an area that gives the elevation of the upper surface whether it is the ground, vegetation or a building.
Digital Terrain Model
DTM A representation of the topography of an area that gives the elevation of the upper surface whether it is the ground, vegetation or a building.
Environment Agency
EA
Flood Alleviation Scheme
FAS Works designed to provide protection from flooding.
Flood defence Infrastructure used to protect an area against floods as floodwalls and embankments; they are designed to a specific standard of protection (design standard).
Flood Estimation Handbook
FEH Provides current methodologies for estimation of flood flows for the UK
Flood Risk Area An area determined as having a significant risk of flooding in accordance with guidance published by Defra and WAG (Welsh Assembly Government).
Flood Risk Assessment
FRA A detailed site-based investigation that is undertaken by the developer at planning application stage
Flood Risk Management
The introduction of mitigation measures (or options) to reduce the risk posed to property and life as a result of flooding. It is not just the application of physical flood defence measures
Flood Risk Regulations
FRR Transposition of the EU Floods Directive into UK law. The EU Floods Directive is a piece of European Community (EC) legislation to specifically address flood risk by prescribing a common framework for its measurement and management.
Flood Storage Area
FSA Area designed to store water in a flood and release it later when flood waters have subsided.
Flood Zone FZ Areas of land at risk from tidal or fluvial flooding as delineated by the Environment Agency. Zone 1: Low probability of flooding Zone 2: Medium probability of flooding Zone 3: High probability of flooding
Floodplain Any area of land over which water flows or is stored during a flood event or would flow but for the presence of defences
Floods and Water Management Act
FWMA Part of the UK Government's response to Sir Michael Pitt's Report on the Summer 2007 floods, the aim of which is to clarify the legislative framework for managing surface water flood risk in England.
Fluvial Flooding Flooding caused by high flows in rivers or streams exceeding the capacity of the normal river channel.
Flood Map for Surface Water
FMfSW
Freeboard A ‘safety margin’ to account for residual uncertainties in water level prediction and/or structural performance, expressed in mm
Functional Floodplain
An area of land where water has to flow or be stored in times of flood.
Greenfield Greenfield (sites or land) is a term in common usage that may be defined as ‘development sites or land that has not previously been developed’. Prior to PPS25 the term ‘Greenfield’ was used in Governmental Guidance and Statements, but in PPS25 has been replaced with ‘Undeveloped land’ See ‘Brownfield’.
Greenfield runoff rates
Greenfield discharge rates refer to the amount of discharge that would occur from a site if it was still natural Greenfield land.
Hyetograph A chart showing the distribution of rainfall over a particular period of time or a particular area
2011s5199 B&H SFRA - Final Report (v2 Jan12).doc 4
Indicative Flood Risk Areas
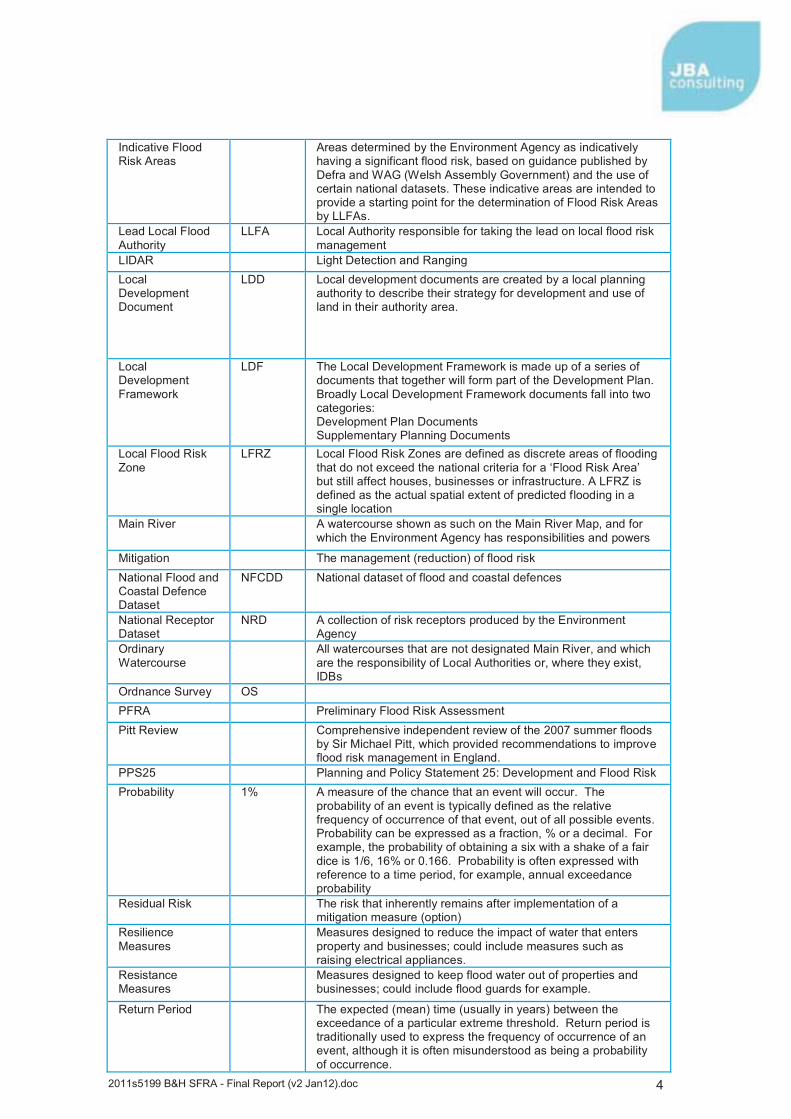
Areas determined by the Environment Agency as indicatively having a significant flood risk, based on guidance published by Defra and WAG (Welsh Assembly Government) and the use of certain national datasets. These indicative areas are intended to provide a starting point for the determination of Flood Risk Areas by LLFAs.
Lead Local Flood Authority
LLFA Local Authority responsible for taking the lead on local flood risk management
LIDAR Light Detection and Ranging Local Development Document
LDD Local development documents are created by a local planning authority to describe their strategy for development and use of land in their authority area.
Local Development Framework
LDF The Local Development Framework is made up of a series of documents that together will form part of the Development Plan. Broadly Local Development Framework documents fall into two categories: Development Plan Documents Supplementary Planning Documents
Local Flood Risk Zone
LFRZ Local Flood Risk Zones are defined as discrete areas of flooding that do not exceed the national criteria for a ‘Flood Risk Area’ but still affect houses, businesses or infrastructure. A LFRZ is defined as the actual spatial extent of predicted flooding in a single location
Main River A watercourse shown as such on the Main River Map, and for which the Environment Agency has responsibilities and powers
Mitigation The management (reduction) of flood risk National Flood and Coastal Defence Dataset
NFCDD National dataset of flood and coastal defences
National Receptor Dataset
NRD A collection of risk receptors produced by the Environment Agency
Ordinary Watercourse
All watercourses that are not designated Main River, and which are the responsibility of Local Authorities or, where they exist, IDBs
Ordnance Survey OS PFRA Preliminary Flood Risk Assessment Pitt Review Comprehensive independent review of the 2007 summer floods
by Sir Michael Pitt, which provided recommendations to improve flood risk management in England.
PPS25 Planning and Policy Statement 25: Development and Flood Risk Probability 1% A measure of the chance that an event will occur. The
probability of an event is typically defined as the relative frequency of occurrence of that event, out of all possible events. Probability can be expressed as a fraction, % or a decimal. For example, the probability of obtaining a six with a shake of a fair dice is 1/6, 16% or 0.166. Probability is often expressed with reference to a time period, for example, annual exceedance probability
Residual Risk The risk that inherently remains after implementation of a mitigation measure (option)
Resilience Measures
Measures designed to reduce the impact of water that enters property and businesses; could include measures such as raising electrical appliances.
Resistance Measures
Measures designed to keep flood water out of properties and businesses; could include flood guards for example.
Return Period The expected (mean) time (usually in years) between the exceedance of a particular extreme threshold. Return period is traditionally used to express the frequency of occurrence of an event, although it is often misunderstood as being a probability of occurrence.

2011s5199 B&H SFRA - Final Report (v2 Jan12).doc 5
Risk In flood risk management, risk is defined as a product of the probability or likelihood of a flood occurring, and the consequence of the flood.
Sewer flooding Flooding caused by a blockage or overflowing in a sewer or urban drainage system.
SIRF Sewer Incident Report Form. A system operated by Southern Water to collate information on sewer flooding incidents.
Standard of Protection
SoP The return period to which properties are protected against flooding
Strategic Flood Risk Assessment
SFRA The assessment of flood risk on a catchment-wide basis for proposed development in a Borough
Strategic Flood Risk Management
SFRM Considers the management of flood risk on a catchment-wide basis, the primary objective being to ensure that the recommended flood risk management ‘measures’ are sustainable and cost effective
Supplementary Planning Documents
SPD Supplementary Planning Documents or SPD support DPDs in that they may cover a range of issues, both thematic and site specific. Examples of SPD may be design guidance or development briefs. SPD may expand policy or provide further detail to policies in a DPD. They will not be subject to independent examination.
Surface water flooding
Flooding as a result of high intensity rainfall when water is ponding or flowing over the ground surface before it enters the underground drainage network or watercourse, or cannot enter it because the network is full to capacity, thus causing flooding.
Surface Water Management Plan
SWMP The SWMP study is the process of producing the action plan. The SWMP study is undertaken in order to provide the evidence base to produce the action plan.
Sustainability Appraisal
SA A Sustainability Appraisal is a systematic process to predict and assess the economic, environmental and social effects likely to arise from DPDs and SPDs, enabling each document to be tested and refined, ensuring that it contributes towards sustainable development.
Sustainable Drainage Systems
SUDS Methods of management practices and control structures that are designed to drain surface water in a more sustainable manner than some conventional techniques.
Tidal Flooding Flooding caused by extreme tide levels Uncertainty A reflection of the (lack of) accuracy or confidence that is
considered attributable to a predicted water level or flood extent

2011s5199 B&H SFRA - Final Report (v2 Jan12).doc 1
1 Introduction
1.1 Background to the study This version of the Brighton and Hove City Council Strategic Flood Risk Assessment (BHCC SFRA) replaces the previous document "Brighton & Hove Strategic Flood Risk Assessment, Final, March 2008". The primary objective for updating the previous version of the SFRA was to prepare a document that was compliant with the latest guidance described in the Planning Policy Statement 25 (PPS25) Practice Guide1, and the key issues being:
the information on sequential testing needed updating; the flood modelling needed to be updated to reflect recent updates; and the flood outlines needed to be updated to reflect the latest master planning
proposals. The report contains information on flood zones and an assessment of risks from all sources of flooding and also contains more detailed information on the nature of flood hazards that exist in areas that do flood. In addition, the strategic responses that should be considered to address the effect of proposed development allocations are described to address conditions as they are now and as they will be in the future.
1.2 Study Area The study area comprises the whole of the City of Brighton and Hove (270km2), located on the south coast of England and is adjoined by the districts of Adur, Mid Sussex and Lewes. Brighton and Hove has the largest population in the South East England region and over 50 per cent of the council's boundary is urban, with rural, open countryside only being found north of the A27, and to the east of Brighton; 40% of Brighton and Hove is within the South Downs National Park. The South Downs National Park Authority is responsible for all planning in the South Downs National Park.
In line with national planning policy, the majority of Brighton and Hove's development sites are brownfield.
The study area is outlined in Map 1.
There are no designated main rivers, or ordinary watercourses, within Brighton and Hove, although the City area shares approximately 14km of its boundary with the sea. The topography of the administrative area varies due to its proximity to the Downs in the north and the coast in the south. Situated on the south of the South Chalk Downs, the geology of the area is dominated by the South Downs Chalk, with isolated pockets of clay, silt and sand lying in the south west of this area. The chalk layers of the South Downs are covered by generally shallow and well-drained topsoils, which allow rainfall to quickly seep into the chalk aquifers below.
The underlying geology throughout Brighton and Hove is outlined in Map 2.
There has been a wide range of flooding events within Brighton and Hove over the last 15 years with surface and groundwater flooding being the most notable sources of flooding. The autumn and winter event of 2000/2001 is the largest recorded event when extreme weather conditions caused flooding across the City.
Map 3 outlines known incidents of flooding in Brighton and Hove.
Note a detailed breakdown of historic flood events can also be found within the Brighton and Hove PFRA.
1 Planning Policy Statement 25: Development & Flood Risk Practice Guide (Communities and Local Government,
December 2009)

2011s5199 B&H SFRA - Final Report (v2 Jan12).doc 2
1.3 SFRA objectives SFRAs should be a key part of the evidence base to help inform the allocation of development in a local plan area through the preparation of Local Development Documents. The primary objective of the SFRA is that is should form part of the evidence base of the Local Development Framework to inform City Plan allocations and ensure that they are in accordance with PPS25. In order to achieve this, the Practice Guide1 states that SFRAs need to provide sufficient detail on all types of flood risk to enable the Local Planning Authority (LPA)
to apply the Sequential and, where necessary, Exception Tests in determining land use allocations;
fully understand flood risk from all sources within its area and also the risks to and from surrounding areas in the same catchment;
inform the Sustainability Appraisal so that flood risk is fully taken account of when considering options and in the preparation of LPA land use policies;
prepare appropriate policies for the management of flood risk within LDDs; identify the level of detail required for site-specific flood risk assessments in particular
locations; and determine the acceptability of flood risk in relation to emergency planning capability.
To meet these objectives it will also be a requirement that those preparing information for assessment and testing of flood risk understand the assessment process and the specific characteristics of the flooding that affects the Borough. The SFRA should also
identify strategic measures required to address the effects of proposed development; and
influence and provide evidence that assists when making decisions on windfall planning applications.
1.4 Over arching legislation
1.4.1 Hierarchy
The over arching aim of planning policy on development and flood risk is to ensure that flood risk is taken into account at all stages of the planning process. Following announcements by Communities and Local Government (CLG) (on the 6th July 2010 the Secretary of State announced that all regional strategies were to be revoked)2 . Regional Spatial Strategies will no longer be attributed substantial weight in the local planning process. It can be concluded that the role of Regional Flood Risk Appraisals is also reduced, since the context for their preparation will be removed. The new landscape for the assessment of flood risk is now illustrated in Figure 1.1.
Figure 1.1 shows that the Flood Risk Regulations (2009) and the Flood and Water Management Act (2010) introduce a wider requirement for the exchange of information and the preparation of strategies and management plans than existed previously. SFRAs contain information that should be referred to in responding to the Flood Risk Regulations and the formulation of local flood risk management strategies and plans. As previously, SFRAs are also linked to the preparation of Catchment Flood Management Plans, Shoreline Management Plans and Surface Water Management Plans and Water Cycle Strategies.
It should be recognised that there is also a requirement for decisions to be based on sustainability appraisals and the information in the SFRA should be used to inform this process at local level.
The Local Development Documents for Brighton and Hove also include Supplementary Planning Documents (SPDs). Each SPD forms a part of the Local Development Framework and is intended to provide detailed guidance on how policies in the saved Local Plan and replacement DPDs such as the City Plan will be implemented. There are currently 11 adopted SPDs covering areas such as the Brighton Centre through to Nature Conservation and
2 This was challenged at Judicial review in November 2010 - but the outcome was not affected

2011s5199 B&H SFRA - Final Report (v2 Jan12).doc 3
Development, and it is intended these are taken into account when determining planning applications. Figure 1.1: Key documents and strategic planning links - Flood Risk - (©JBA)
1.4.2 Responsibilities
The new and emerging responsibilities under the Flood and Water Management Act and the Flood Risk Regulations are summarised in Table 1.1.
National
Site
Local
County / Catchment
EU
National Planning
Local Development Framework (Plan) Including: Urban Extensions SPD; Infrastructure Delivery Plan; Green Infrastructure Plan; Emergency planning; and
Sustainability, climate change &
Strategic Flood Risk Assessment
Flood Risk Assessments
Planning Applications
Planning Decisions
Legend: Responsibilities are indicated using colour coding as follows:
EC "Floods" Directive
Surface Water
Management Plan*
* Can be harmonised with Flood & Water Management Act Requirements
Flood Risk Regulation Statutory National Strategy for Flood Risk and Coastal Erosion Risk Management
Statutory Local Flood Risk Management Strategy
Catchment Flood Management Plan
Shoreline Management Plan
Preliminary Flood Risk Assessment (PFRA) & significant flood risk areas
Flood Risk & Flood Hazard Mapping
(Local) Flood Risk Management Plan*
Flood Water Management Act Planning Acts
Water Cycle Strategy**
**Also influenced by requirements of the River Basin Management Plan
National Government
Local Planning Authority
Environment Agency / LLFA/ Maritime Local
Developer European Union

2011s5199 B&H SFRA - Final Report (v2 Jan12).doc 4
Table 1.1 Roles and responsibilities Risk Management Authority (RMA)
Strategic Level Operational Level
Environment Agency
National Statutory Strategy Reporting and general supervision
Main rivers Sea Reservoirs and for these flood sources prepare and publish: PFRA; Significant Flood Risk Areas; Flood Risk and Hazard Maps; and Flood Risk Management Plan (or exercise "Exception")
Lead Local Flood Authority
Input to National Strategy Formulate and implement Local Flood Risk Management Strategy
Surface Water Groundwater and other sources of flooding and for these sources prepare and publish: PFRA; Significant Flood Risk Areas; Flood Risk and Hazard Maps; and Flood Risk Management Plan (or exercise "Exception")
District Councils Internal Drainage Board
Input to National and Local Statutory Strategies
Ordinary watercourse and Sea (with EA approval)
Thus those making use of flood risk information described in the Brighton and Hove SFRA should also make reference to and be aware of the following:
River Adur Catchment Flood Management Plan (CFMP), published September 2009 Brighton and Hove City Preliminary Flood Risk Assessment, published September
2011 Brighton and Hove Surface Water Management Plan by Brighton and Hove City
Council [ongoing, due to be issued in 2015] Following the introduction of the Flood and Water Management Act and the Flood Risk Regulations the responsibility for the formulation of the Surface Water Management Plan (SWMP) now lies with Brighton and Hove City Council. When preparing the SWMP BHCC should use the information in the SFRA to assist with the understanding of flood risk, the identification of Critical Drainage Areas and ensure that specific flood risk management measures, identified in the SFRA, are included in the SWMP. At the time of preparation for this SFRA the SWMP was yet to be completed. Thus it will be imperative that those using this SFRA in the future also make reference to the other relevant documents.
1.5 Approach
1.5.1 General assessment of flood risk
The SFRA adopts the flood risk management hierarchy advocated in the Practice Guide1 as summarised in Figure 1.2.
2011s5199 B&H SFRA - Final Report (v2 Jan12).doc 5
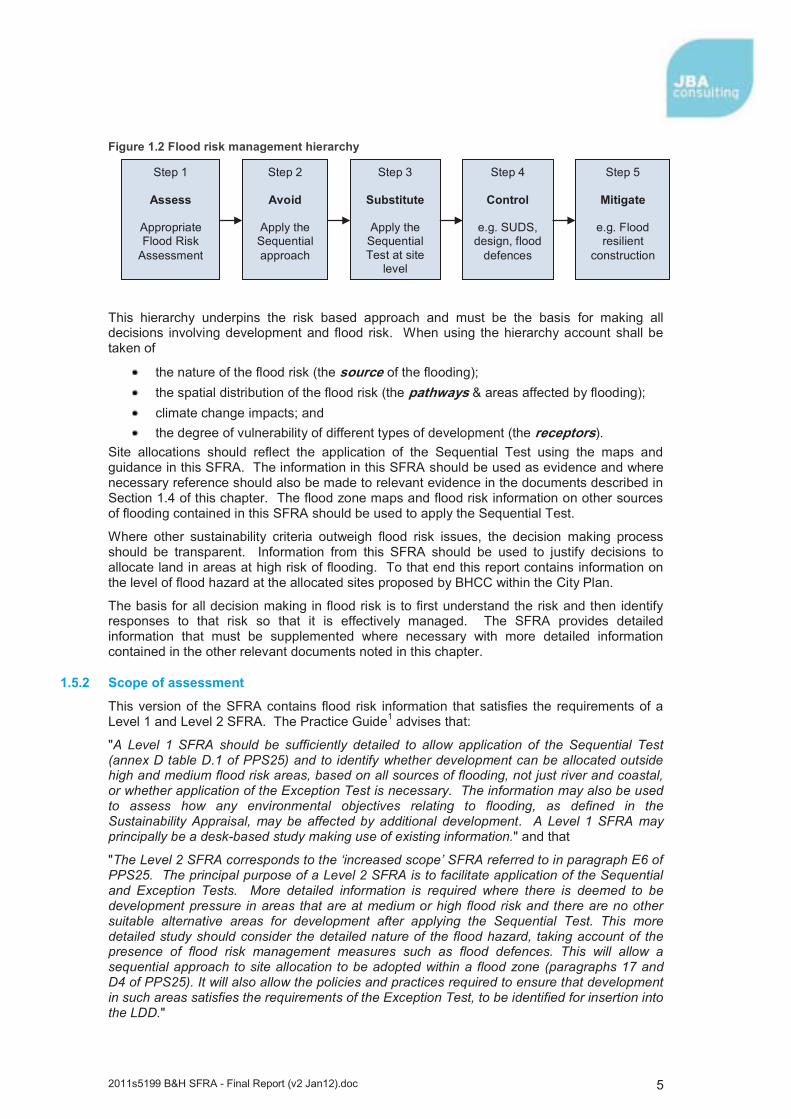
Figure 1.2 Flood risk management hierarchy
This hierarchy underpins the risk based approach and must be the basis for making all decisions involving development and flood risk. When using the hierarchy account shall be taken of
the nature of the flood risk (the source of the flooding); the spatial distribution of the flood risk (the pathways & areas affected by flooding); climate change impacts; and the degree of vulnerability of different types of development (the receptors).
Site allocations should reflect the application of the Sequential Test using the maps and guidance in this SFRA. The information in this SFRA should be used as evidence and where necessary reference should also be made to relevant evidence in the documents described in Section 1.4 of this chapter. The flood zone maps and flood risk information on other sources of flooding contained in this SFRA should be used to apply the Sequential Test.
Where other sustainability criteria outweigh flood risk issues, the decision making process should be transparent. Information from this SFRA should be used to justify decisions to allocate land in areas at high risk of flooding. To that end this report contains information on the level of flood hazard at the allocated sites proposed by BHCC within the City Plan.
The basis for all decision making in flood risk is to first understand the risk and then identify responses to that risk so that it is effectively managed. The SFRA provides detailed information that must be supplemented where necessary with more detailed information contained in the other relevant documents noted in this chapter.
1.5.2 Scope of assessment
This version of the SFRA contains flood risk information that satisfies the requirements of a Level 1 and Level 2 SFRA. The Practice Guide1 advises that:
"A Level 1 SFRA should be sufficiently detailed to allow application of the Sequential Test (annex D table D.1 of PPS25) and to identify whether development can be allocated outside high and medium flood risk areas, based on all sources of flooding, not just river and coastal, or whether application of the Exception Test is necessary. The information may also be used to assess how any environmental objectives relating to flooding, as defined in the Sustainability Appraisal, may be affected by additional development. A Level 1 SFRA may principally be a desk-based study making use of existing information." and that
"The Level 2 SFRA corresponds to the ‘increased scope’ SFRA referred to in paragraph E6 of PPS25. The principal purpose of a Level 2 SFRA is to facilitate application of the Sequential and Exception Tests. More detailed information is required where there is deemed to be development pressure in areas that are at medium or high flood risk and there are no other suitable alternative areas for development after applying the Sequential Test. This more detailed study should consider the detailed nature of the flood hazard, taking account of the presence of flood risk management measures such as flood defences. This will allow a sequential approach to site allocation to be adopted within a flood zone (paragraphs 17 and D4 of PPS25). It will also allow the policies and practices required to ensure that development in such areas satisfies the requirements of the Exception Test, to be identified for insertion into the LDD."
Step 1
Assess
Appropriate Flood Risk
Assessment
Step 2
Avoid
Apply the Sequential approach
Step 3
Substitute
Apply the Sequential Test at site
level
Step 4
Control
e.g. SUDS, design, flood
defences
Step 5
Mitigate
e.g. Flood resilient
construction
2011s5199 B&H SFRA - Final Report (v2 Jan12).doc 6
2 Data Sources
2.1 Overview A key element of the SFRA process is the collation and review of existing data. The SFRA uses best available data at the time of production, and in updating the SFRA, data has been collected from Brighton and Hove City Council and the Environment Agency. In conjunction with this, the recently completed PFRA was also a source of information as it was assumed all other interested stakeholders would have contributed to the preparation of this document. As such data from this has also been used, where appropriate.
The SFRA should be considered a ‘live’ document, and should be kept up to date with the latest information; for example Environment Agency Flood Zones, which are continuously being improved by a variety of studies, detailed models, data, and actual flooding information. Table 2.1 provides a summary of data used to compile and update the SFRA (2008).

2011s5199 B&H SFRA - Final Report (v2 Jan12).doc 7
Table 2.1: Summary of data used to compile SFRA Data Description
Source Comments
National planning policy statements and guidance
PPS25, PPS 25 Practice Guide, FD2320
CLG, Defra
Local Plan/LDF
City Plan (previously Core Strategy)
Brighton and Hove City Council
Ordnance Survey mapping
1:10,000 and 1:50,000 mapping for Brighton and Hove
Brighton and Hove City Council
Existing assessment of flood Risk
Brighton and Hove SFRA and Brighton and Hove PFRA
Brighton and Hove City Council
Existing models
Arun to Adur flood modelling April 2011
Environment Agency
Shoreham Harbour flood modelling June 2011
Environment Agency
Geological data
Groundwater vulnerability, groundwater protection, bedrock geology
Brighton and Hove City Council & Environment Agency
Groundwater flood Risk data
Areas Susceptible to Groundwater Flooding (AStGWF)
Environment Agency
Flood Zones
Environment Agency Flood Zones
Environment Agency
Flood warning and coastal defence
GIS layers of flood warning areas and defence line from NFCDD
Environment Agency
Note no defence levels are present in tables extracted from NFCDD
Flood risk assessments
Various FRAs submitted to the Brighton and Hove City Council as part of planning applications
Brighton and Hove City Council
Surface Water flood risk data
Flood map for surface water flood risk (FMfSW)
Environment Agency
Areas Susceptible to Surface Water flooding layer (AStSWF)
Environment Agency
PFRA (2011) Brighton and Hove City Council
2.2 Significant updates to data
2.2.1 Flood Maps
The Flood Map is a multi-layered map which provides information on flooding from rivers and the sea for England and Wales. The Flood Map also has information on flood defences and the areas benefiting from those flood defences.
The Environment Agency's Flood Map is updated quarterly to provide the best latest information to the public on flood risk. The updates include taking account of information received from the event of actual flooding and more detailed models when developed.

2011s5199 B&H SFRA - Final Report (v2 Jan12).doc 8
The Flood Maps used for the SFRA (2008) were version 3.5 and dated June 2007, the flood maps used in this update are version 4.4.
A study to investigate flood risk between and including the River Arun at Littlehampton and the River Adur in Shoreham was completed in April 2011, as was a more detailed study looking at risk in the Shoreham Harbour area. These projects are summarised in section 2.2.4. Such information will be used to improve the Environment Agency Flood Map, but at the time of writing the flood map had not been updated with this data. As a result of having more detailed studies, the flood zone 3a and 3b used to prepare maps for this SFRA have been updated accordingly when assessing flood risks for Brighton and Hove council and the City Plan sites.
2.2.2 Surface Water
A summary of historical surface water flooding within Brighton and Hove and a series of maps providing an indication of those areas which suffered from this type of flooding were included in the SFRA (2008).
Since the Brighton and Hove SFRA was completed in March 2008, the UK Government accepted the recommendations of the Pitt review of the 2007 summer floods in December 2008. As a result of the final Recommendation 2, the Environment Agency took on a national overview of all flood risk, including surface water and groundwater flood risk, with immediate effect. The Environment Agency released two key datasets to provide more information about surface water flood risk. These are summarised below:
Areas Susceptible to Surface Water Flooding (AStSWF) The AStSWF forms the first generation of surface water mapping and identifies the susceptibility to flooding in three bandings: More Susceptible, Intermediate Likelihood and Less Susceptible. The AStSWF assesses the pluvial flood risk based on a rainfall event with a return period of 1 in 200 years occurring in any given year with a 6.5 hour storm duration. The AStSWF assumes the drainage capacity of any available surface water network is at capacity.
Flood Map for Surface Water (FMfSW) The FMfSW forms the second generation of surface water mapping, and is the latest dataset. The EA has produced the FMfSW to assess the flood risk with a return period of 1 in 30 years in order to demonstrate the onset of flooding. "The 1 in 30 rainfall was used as it is the largest common design standard for urban drainage. Therefore it seeks to capture the ‘onset’ of flooding in many urban locations"3. The maps display the flood hazard in two depth bandings; greater than 0.1m (Surface water flooding) and greater than 0.3m (Deeper Surface Water Flooding). The FMfSW has two datasets based on a rainfall event with a return period of 1 in 30 years and 1 in 200 years occurring in any given year with a 1.1 hour storm duration. The most notable difference from the AStSWF is that the FMfSW takes into consideration infiltration using percentage runoff values of 39% in rural areas and 70% in urban areas. In addition, the FMfSW takes account of the sewer network capacity by a reduction of 12mm/hr in urban areas.
Both surface water flood risk datasets were reviewed to update the SFRA (2008) and details of the surface water flood risk within Brighton and Hove area are given in Section 4.4 and shown in Maps 7 - 9.
Brighton and Hove PFRA
The Flood Risk Regulations 2009 (FRR) Part 2 (Section 10) place a duty upon Brighton and Hove City Council as a Lead Local Flood Authority (LLFA) to prepare a Preliminary Flood Risk assessment by June 2011, and where necessary a Surface Water Management Plan.
The Preliminary Flood Risk Assessment is a high level screening exercise to facilitate flood risk management. The PFRA report was used in this SFRA update for the Brighton and Hove council. Notable information used related to the surface water flood risk and sewer flood risk, as well as the historic flood events experienced throughout the study area.
3 EA (2010) What is the Flood Map for Surface Water
2011s5199 B&H SFRA - Final Report (v2 Jan12).doc 9
2.2.3 Groundwater
An analysis of physical, hydrological and environmental spatial data sets within a Geographical Information System (GIS) platform using the EA groundwater vulnerability, geology and bedrock layers was carried out for the previous Brighton and Hove SFRA.
The Areas Susceptible to Groundwater Flooding data was requested of the Environment Agency for the SFRA update.
Areas Susceptible to Groundwater Flooding (AStGWF) is a strategic scale map showing groundwater flood areas on a 1km square grid. The data is annotated to show what percentage of the 1km area could be at risk of groundwater flooding. This provides an indication as to the degree of risk from groundwater flooding that is present within an area.
The details of groundwater flooding are in section 4.5 and Map 10 indicates the risk of groundwater flooding within the Brighton and Hove administrative area.
2.2.4 Studies
More detailed modelling studies and site-specific flood risk assessments were reviewed as part of the SFRA update and used where applicable.
The details of each study that was used to update the SFRA are summarised below:
Arun to Adur Flood Modelling June 2011
A project was commissioned by the Environment Agency's Southern Region (now South East Region), in cooperation with the Shoreham Harbour Regeneration Partnership4, to investigate flood risk between and including the River Arun at Littlehampton and the River Adur in Shoreham. The study used comprehensive extreme sea level and wave information, good quality topographic data and advanced floodplain inundation modelling techniques to produce revised tidal Flood Zones 2 and 3, to identify Areas Benefiting from Defences, and to examine the potential impacts of climate change on flood risk.
The modelled flood outlines are used to improve the Flood Zone 3a, 3b and 2 at the Shoreham Harbour area. The model results from climate change and overtopping scenarios are used to update the understanding of the impact of climate change and residual risk.
Shoreham Harbour Regeneration: Design and Flood Risk Study June 2011
This study was commissioned by the Environment Agency in cooperation with the Shoreham Harbour Regeneration Partnership to develop an evidence base for the Shoreham Harbour Regeneration Scheme in terms of flood and erosion risk exposure and associated management options.
Three potential Flood and Coastal Risk Management (FCRM) Design Scenarios were developed for the coastal frontage as part of this study. The preferred options and their associated components and costs were summarised. Engineering designs and costs were not produced for the canal area and tidal river in the same way as the coastal frontage. However, three basic tidal river/canal area flood defence options were developed in order to evaluate their merits and impacts in terms of flood risk in the Shoreham Harbour Regeneration Area.
The results of the modelling indicated that the Shoreham Harbour Regeneration Area was indeed susceptible to flood risk. The results also indicate that the proposed River/Canal Flood Defence Options are likely to provide the desired level of flood protection for the development areas and are not expected to increase sea-levels significantly, illustrating that defending these areas is unlikely to increase flood risk elsewhere. None of the analysis carried out for this study has included the presence of the proposed River Adur Tidal Walls (West Bank) scheme.
4 The Shoreham Harbour Partnership consists of Adur District Council, Brighton and Hove City Council, West Sussex
County Council, Shoreham Port Authority, South East England Development Agency (SEEDA) and the Homes and Communities Agency (HCA). The partnership are working together to deliver the long term strategic objective "to regenerate the Harbour area so that it provides the homes, jobs, facilities and services that are needed by all communities in the area, and to reduce deprivation and inequalities".

2011s5199 B&H SFRA - Final Report (v2 Jan12).doc 10
The study results are incorporated when assessing the Shoreham Harbour development area in the City Plan.
Shoreham Adur Tidal Walls Project
This Environment Agency project is ongoing, for the SFRA update we were provided with a briefing note summarizing the Shoreham Adur Tidal Walls Project Board Meeting July 2011.
The Rivers Arun to Adur Flood and Erosion Management Strategy recommends the standard of protection (SoP) for the River Adur west bank (A27 to the river mouth) be improved or sustained to 0.33% AEP. For the River Adur east bank, it has been recommended to improve the SoP to 0.5% AEP for north section (A27 to footbridge) and sustain the SoP at 0.5-100% AEP for central section (footbridge to Kingston Beach lighthouse) and undertake no active intervention for east section (Kingston Beach lighthouse to the lock gates). The Strategy identified that the west bank be completed by 2012 and the east bank the following year.
The affects of the construction of the West Bank defences on the flood risk along the east bank were discussed and it was stated that:
"Based on the findings of the JBA flood modelling (undertaken between February and May 2011), the main impact of raising the West Bank defences is to increase the flood extent and the depth of flooding to some properties on the east bank."
The location where the flood extent and depth are shown to increase are outside the Brighton and Hove study area, and are therefore not considered further in this update.
The Keep flood risk assessment October 2010 (FRA for a planning application)
GTA Civils ltd were appointed by East Sussex County Council to carry out a flood assessment at The Keep, Falmer in respect of a proposed new archive facility with access road and associated service yard and parking areas. This report also refers to a flood risk/drainage report carried out in relation to the highways balancing pond by GTA Civils ltd dated July 2009, which identified that the Highways Agency balancing pond posed little risk of flooding up to the 1 in 200 year storm event.
Brighton Marina Flood Risk Assessment June 2008 (FRA for a planning application)
This report states it is an update of the "May 2007 Flood Risk Assessment planning application document for the Explore Living: Brighton Marina Regeneration project".
This FRA highlights the various sources of flooding that could affect the site. These included surface water flooding, foul flooding, tidal flooding, and residual risk due to defence breaches or overtopping.
The FRA highlighted that although there were no records of foul flooding in Brighton Marina, the capacity of the existing sewer system will need to be increased to allow for the proposed high density of residential units to be constructed without increasing the risk of foul flooding.
It was also highlighted that Brighton Marina is currently defended from tidal flooding for the design event (1 in 200 years), however the defences would need to be raised in the future due to predicted sea level rises. Modelling has shown that if the defences are not raised, the likely impact of a design tide in year 2115 would include flood depths of flooding of the order of 3m and an onset of flooding of less than 10 minutes, which would be catastrophic with potential loss of life.
The FRA undertook some breach analysis to quantity residual risk to the development site. The FRA state that in the worse case of no maintenance over many years, multiple breaches could occur and the likely impact of a design tide in year 2115 will be similar to above with flood depth up to 3m and a rapid onset of flooding.
Brighton Marina Flood Risk and Surface Water Drainage Assessment March 2011 (FRA for a planning application)
This report reiterates the flood risk as outlined in the previous 2008 FRA. It highlighted that the Brighton Marina Area was defended to a high level. It provided a comparison of the defence heights and extreme tide levels, this highlighted the need to increase the defence heights in the future to account for sea level rise.

2011s5199 B&H SFRA - Final Report (v2 Jan12).doc 11
A more detailed assessment of drainage capacity was undertaken as part of this investigation. A Micro Drainage model was built in an attempt to establish the capacity of the surface water sewer system. This assessment made many assumptions, and there were no detailed mapping of the model results. It is unlikely therefore that this assessment will be able to be factored into the SFRA update but will be referenced as part of the Level 2 assessment for Brighton Marina.
Other FRAs
A number of other detailed FRAs were reviewed, but did not provide any additional information for use in this update. These were:
Community Stadium FRA, September 2008 PortZed FRA, August 2010 Site J Land East of Brighton Station New England Quarter Brighton

2011s5199 B&H SFRA - Final Report (v2 Jan12).doc 12
3 Approach to Strategic Flood Risk Assessment
3.1 Overview The SFRA is a planning tool that can be used to inform the spatial planning process. The SFRA should be used to refine the information relating to the areas within Brighton and Hove which may flood, taking into account all sources of flooding and climate change. This information should form the basis of the Council’s future flood risk management policies. In addition the SFRA will inform the LDF, and provide the information to enable the Sequential and Exception Tests to be applied during the site allocation and development control process.
Land can be separated into four distinct Flood Zones which are at risk from different probability river (fluvial) and/or tidal flooding events.
Table 3.1 Annual probabilities of flooding associated with PPS25 Flood Zones(Source: PPS25 Practice Guide Figure 3.3)
Flood Zone Annual probability of flooding 1 < 1 in 1,000 (<0.1 %) from river or sea flooding 2 Between 1 in 1,000 (0.1%) and 1 in 100 (1%) for river flooding or between
1 in 1,000 (0.1%) and 1 in 200 (0.5%) for flooding from the sea 3a 1 in 100 (>1%) for river flooding and > 1 in 200 (>0.5%) for flooding
from the sea
3b Functional floodplain
Flood Zone 1 indicates areas with a ‘low’ probability of inundation from tidal or fluvial sources. Flood Zone 1 essentially covers everywhere outside of Flood Zones 2 and 3.
It is important to remember that the ‘low’ probability classification only refers to tidal and fluvial flood risk. Flood risk from other sources, such as groundwater, surface water and sewer flooding may also be present.
Flood Zone 2 indicates areas with a ‘medium’ probability of flooding from tidal or fluvial sources.
Flood Zone 3a indicates areas with a ‘high’ probability of flooding from tidal or fluvial sources. If the fluvial and tidal zones overlap, the one with the greatest extent defines the Flood Zone. Flood Zone 3a is entirely within the boundaries of Flood Zone 2.
Flood Zone 3b indicates the ‘functional floodplain’, defined as an area of land where water has to flow or be stored in times of flood. This is usually taken to be either the envelope defined by the 5% annual probability of flooding, also referred to as a return period of 20 years or less or an area that is designed to flood in a more extreme event. The PPS25 practice guide1 also states that:
"Areas which would naturally flood with an annual exceedence probability of 1 in 20 (5 per cent) or greater, but which are prevented from doing so by existing infrastructure or solid buildings, will not normally be defined as functional floodplain."
"Developed areas are not generally part of the functional floodplain. Only water compatible and essential infrastructure (the latter requiring the Exception Test to be passed) are considered suitable development types in the functional floodplain."
"However, PPS25 does not differentiate between developed and undeveloped areas. This is because some developed areas may still provide an important flood storage and conveyance function, such as a car park that has been designed to flood periodically to preserve flood storage volumes at a riverside commercial development. Roads and other linear spaces can act as flow routes and the functionality of such areas should be considered when defining Flood Zones 3a and 3b, taking into account strategic flood risk management policies."
"The area defined as functional floodplain should take into account the effects of defences and other flood risk management infrastructure. Some areas, such as flood storage areas, may flood at a lower frequency than other parts of Flood Zone 3b, but

2011s5199 B&H SFRA - Final Report (v2 Jan12).doc 13
should still be classified as functional for the part that they play in managing the impacts of large scale floods."
The Environment Agency publicly publishes maps of Flood Zone 2 and Flood Zone 3 on their website (www.environment-agency.gov.uk). It should be noted that Flood Zones 2 and 3a do not take account of the presence of flood defences.
3.2 Sequential approach In line with PPS25 guidelines, the Environment Agency recommend that site allocations should be made outside of the flood risk areas (i.e. in Flood Zone 1) wherever possible. If there are no reasonably appropriate Flood Zone 1 sites, site allocations should be made in Flood Zone 2 first, considering flood risk vulnerability of land uses. Only where there are no reasonably available sites in Zones 1 or 2 should Flood Zone 3 site allocations be made. In order to demonstrate that there are no lower risk sites available the Sequential Test needs to be carried out.
3.3 Sequential Test The Sequential Test must be performed when considering the placement of future development and for planning application proposals. Again, details of the test are described in PPS25 and the accompanying Practice Guide. The Practice Guide gives detailed instructions on how to perform the test. These instructions on how to perform the test should be used with the following information from the SFRA
identify the area to be assessed (including alternatives) on the Flood Zone Maps that are provided with this assessment;
establish the risk of flooding from other sources again using the maps in this SFRA; and
follow the instructions given in Chapter 4 of the Practice Guide. The Practice Guide gives specific guidance on the application of the Sequential Test in relation to allocation of land, individual planning applications, windfall sites, renewable energy projects, redevelopment of an existing single property and change of use.
The Sequential Test is used to direct all new development (through the site allocation process) to locations at least risk of flooding, giving highest priority to Flood Zone 1. Before the sites being considered in this SFRA can be allocated for development BHCC must complete the Sequential Test to determine whether these sites are appropriate as strategic allocations given the flood risks associated with them.
The output from the Strategic Housing Land Availability Assessment (SHLAA) will be critical evidence in this process. If these sites do not pass the Sequential Test they should not be allocated and alternative sites should be brought forward. Where the Sequential Test alone cannot deliver acceptable sites, the Exception Test will need to be applied.
The Environment Agency (2009)5 recommends that the following approach is used by local planning authorities to apply the Sequential Test to planning applications located in Flood Zones 2 or 3. The same approach should also be used for the LDF site selection process, which is undertaken at the larger city scale. There are three stages to the test, as follows:
Stage 1 – Strategic application & development vulnerability Stage 2 – Defining the evidence base Stage 3 – Applying the Sequential Test
5 Environment Agency (2009) Demonstrating the flood risk (PPS25) Sequential Test for Planning Applications, PPS25 FRSA (national) version 2.0 Advise issued on 27 January 2009

2011s5199 B&H SFRA - Final Report (v2 Jan12).doc 14
Stage 1 – Strategic application & development vulnerability
1.A Has the Sequential Test already been carried out for this development at the
development plan level? If yes, reference should be provided to the site allocation and Development Plan Document (DPD) in question.
1.B Is the flood risk vulnerability classification of the proposal appropriate to the Flood Zone in which the site is located according to Tables D1 and D3 of PPS25? The vulnerability of the development should be clearly stated.
Finish here if the answer is ‘Yes’ to both questions 1.A. and 1.B.
Only complete Stages 2 and 3 if the answer to either questions 1.A and 1.B is ‘No’.
Stage 2 – Defining the evidence base
2.A State the geographical area over which the test is to be applied. 2.B If greater or less than the city boundary justify why the geographical area for applying
the test has been chosen.
2.C Identify the source of reasonable available sites, either:
o Background / evidence base documents (state which), or if not available o Other sites known to BHCC that meet the functional requirements of the
application
Identify the source of ‘reasonably available’ alternative sites – these sites will usually be drawn from the evidence base / background documents that have been produced to inform the emerging LDF. For example, an important source of information from housing sites and employment land will be provided by the SHLAA and the Employment Land Review (ELR).
The status of the SHLAA should be considered and / or in the absence of background documents, ‘reasonably available’ sites would include any sites that are known to BHCC and that meet the functional requirements of the application in question, and where necessary, meet the LDF Policy criterion for windfall development (see below)
Identify the geographical area of search over which the test is to be applied – this will usually be over the whole of the administrative area but may be reduced where justified by the functional arrangements of the development (e.g. catchment area for a school or doctors surgery) or relevant objectives in the LDF. Equally, in some circumstances it may be appropriate to expand the search area beyond the city for uses that have a sub-regional, regional or national market.
The Sequential Test can be considered adequately demonstrated if both of the following criteria are met
the Sequential Test has already been carried out for the site (for the same development type) at the strategic level (development plan) in line with paragraphs D5 and D6 of PPS25; and
the development vulnerability is appropriate to the Flood Zone (see table D1 of PPS25).

2011s5199 B&H SFRA - Final Report (v2 Jan12).doc 15
Windfall sites
2.D State the method used for comparing the flood risk between sites, whether it is this
SFRA or an alternative (e.g. Environment Agency flood map, site specific flood risk assessment) as new information becomes available.
Stage 3 – Applying the Sequential Test
3.A State the name and location of the reasonably available site options being compared
to the application site 3.B Indicate whether flood risk on the reasonable available options is higher or lower than
the application site. State the Flood Zone or SFRA classification for each site. 3.C State whether the reasonably available options being considered are allocated in the
Development Plan. Confirm the status of the plan. 3.D State the approximate capacity of each reasonably available site being considered.
This should be based on: o the density policy within a Local Development Document (LDD) o the current Strategic Housing Land Availability Assessment for the city o past performance
3.E Detail any constraints to the delivery of identified reasonably available options; for example, availability within a given time period or lack of appropriate infrastructure i.e. flood defences which protect the site through its design lifetime. This part of the test should include recommendations on how these constraints should be overcome and when.
Compare the reasonably available sites identified under stage 2 with the application site. Sites should be compared in relation to flood risk; development plan status; capacity; and constraints to delivery including availability, policy restrictions, physical problems or limitations, potential impacts of the development, and future environmental conditions that would be experienced by the inhabitants of the development.
"Windfall sites are those which have not been specifically identified as available in the local plan process. They comprise previously-developed sites that have unexpectedly become available." (Source PPS3, footnote 31) Government policy in PPS3 para. 59 advises that LPAs should not normally rely on windfall sites to meet housing needs.
The Environment Agency recommend that the acceptability of windfall applications in flood risk areas should be considered at the strategic level through a policy setting out broad locations and quantities of windfall development that would be acceptable or not in Sequential Test terms. Evidence on this position should be provided as support to the soundness of the Core Strategy. Guidance on determining the housing potential of windfall (where justified) for broad locations can be found in paras 50-52 of Strategic Housing Land Availability Assessments, Practice Guide to PPS3.
In the absence of flood risk windfall policy, it may be possible (where data is sufficiently robust) for the LPA to apply the Sequential Test taking into account historic windfall rates and their distribution across the district relative to Flood Zones. Where historic and future trends evidence or indicate that housing need in the district through windfall can be met largely/entirely by development outside high flood risk areas, this may provide grounds for factoring this into the consideration of ‘reasonably available’ alternative sites at the planning application stage.
2011s5199 B&H SFRA - Final Report (v2 Jan12).doc 16
Sequential Test conclusion
Are there any reasonably available sites in areas with a lower probability of flooding, which would be appropriate to the type of development or land use proposed?
Next step
3.4 Exception Test Where departures from the Sequential Test are justified by the need to locate development in higher risk zones than is appropriate, in order to meet the wider aims of sustainable development, it is necessary to apply the Exception Test. PPS25 acknowledges that flood risk is one of many issues (including transport, housing, economic growth, natural resources, regeneration and the management of other hazards) which need to be considered in spatial planning.
PPS25 explains where and for what type of development the Exception Test needs to be applied. In some situations, for certain types of development, it is not appropriate to use the Exception Test to justify development, for example, development which is highly vulnerable to flooding cannot be justified within the high risk zone through the use of the Exception Test. The situations where it is necessary and appropriate to apply the Exception Test are outlined below.
Where the Exception Test is required, it should be applied as soon as possible to all site allocations for development and all planning applications other than for minor development6. All three elements of the Exception Test have to be passed before development is allocated or permitted. For the Exception Test to be passed:
a. It must be demonstrated that the development provides wider sustainability benefits to the local community that outweigh flood risk, informed by an SFRA, where one has been prepared;
b. The development should be on developable previously developed land or, if it is not on previously developed land, that there are no reasonable alternative sites on developable, previously developed land; and
c. A Flood Risk Assessment must demonstrate that the development will be safe, without increasing flood risk elsewhere, and, where possible, will reduce flood risk overall.
6 Definition of minor development: -Minor non-residential extensions: Industrial/Commercial/Leisure etc. extensions with a footprint less than 250m2 -Alterations: development that does not increase the size of buildings e.g. alterations to external appearance. -‘Householder’ development: e.g. sheds, garages, games rooms etc. within the curtilage of the existing dwelling in
addition to physical extensions to the existing dwelling itself. This definition EXCLUDES any proposed development that would create a separate dwelling within the curtilage of the existing dwelling e.g. subdivision of houses into flats.
Exception Test – Where necessary, the Exception Test should now be applied in the circumstances set out by table D.1 and D.3 of PPS25.
Applying the sequential approach at the site level – In addition to the formal Sequential Test, PPS25 sets out the requirements for developers to apply the sequential approach (see para. 14 and D8) to locating development within the site. The following questions should be considered:
Can risk be avoided through substituting less vulnerable uses or by amending the site lay-out?
Has the applicant demonstrated that less vulnerable uses for the site have been considered and reasonably discounted?
Can layout be varied to reduce the number of people or flood risk vulnerability or building units located in higher risk parts of the site?
2011s5199 B&H SFRA - Final Report (v2 Jan12).doc 17
Compliance “with each part of the Exception Test should be demonstrated in an open and transparent way”.
Table 3.3 summarises the applicability of the Exception Test for different development sites; housing allocations are classified as ‘more vulnerable’ and employment allocations are ‘less vulnerable’.
The advice and guidance given in PPS25 should be used in conjunction with the mapping issued in this version of the SFRA. The Practice Guide gives specific guidance on:
The identification of wider sustainability benefits; How to determine what is safe; and Access and egress requirements.
When considering development in areas that are protected by flood defences consideration should also be given to the residual risk that is either a result of the failure or overtopping of defences. Where necessary detailed FRAs should determine the level of hazard (hazard mapping) that would affect people, property and infrastructure if the existing flood defences failed (due to breaching) or if an event exceeded their original design standard. The methods used to generate the hazard mapping are as described in the PPS25 Practice Guide. This information can also be used by those preparing for flood emergencies or requiring tactical information during a flood event.
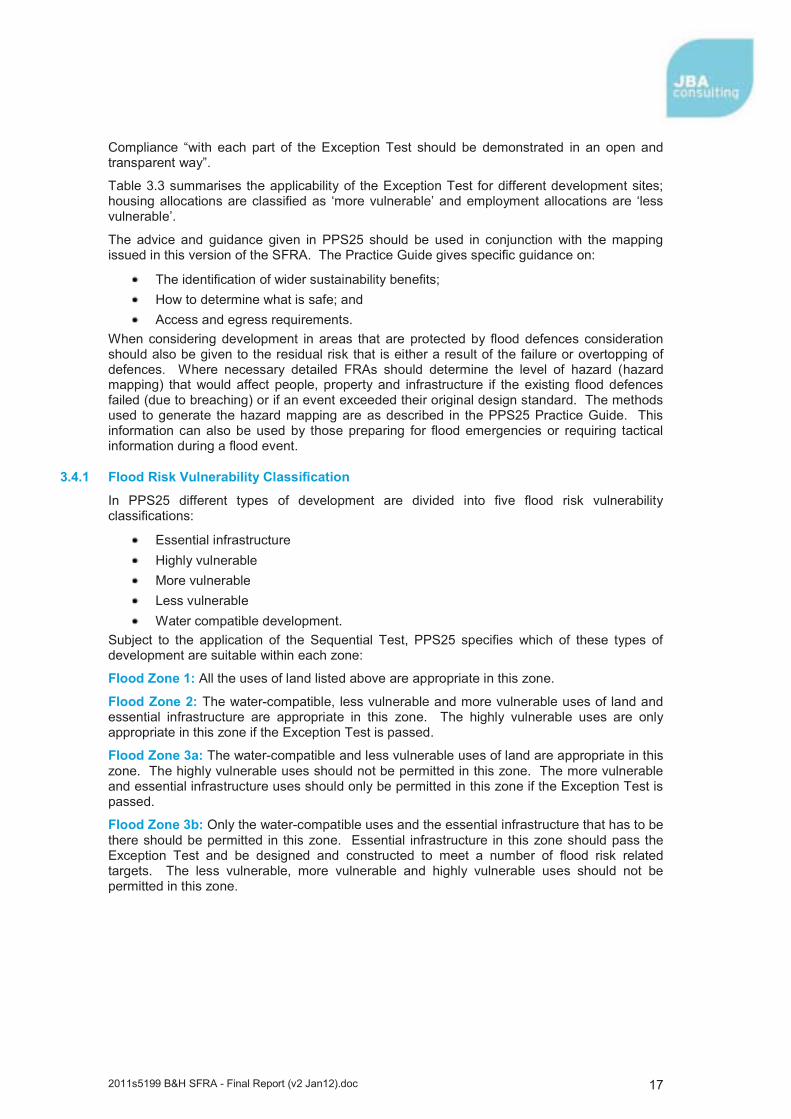
3.4.1 Flood Risk Vulnerability Classification
In PPS25 different types of development are divided into five flood risk vulnerability classifications:
Essential infrastructure Highly vulnerable More vulnerable Less vulnerable Water compatible development.
Subject to the application of the Sequential Test, PPS25 specifies which of these types of development are suitable within each zone:
Flood Zone 1: All the uses of land listed above are appropriate in this zone.
Flood Zone 2: The water-compatible, less vulnerable and more vulnerable uses of land and essential infrastructure are appropriate in this zone. The highly vulnerable uses are only appropriate in this zone if the Exception Test is passed.
Flood Zone 3a: The water-compatible and less vulnerable uses of land are appropriate in this zone. The highly vulnerable uses should not be permitted in this zone. The more vulnerable and essential infrastructure uses should only be permitted in this zone if the Exception Test is passed.
Flood Zone 3b: Only the water-compatible uses and the essential infrastructure that has to be there should be permitted in this zone. Essential infrastructure in this zone should pass the Exception Test and be designed and constructed to meet a number of flood risk related targets. The less vulnerable, more vulnerable and highly vulnerable uses should not be permitted in this zone.
2011s5199 B&H SFRA - Final Report (v2 Jan12).doc 18
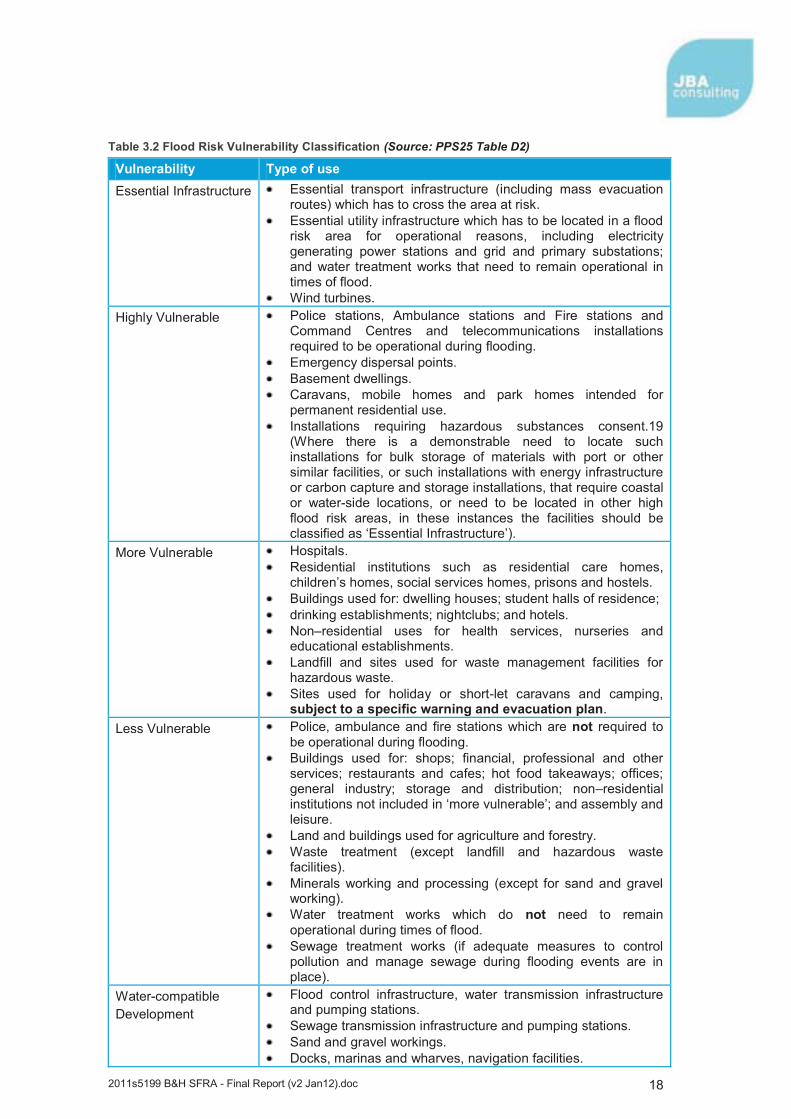
Table 3.2 Flood Risk Vulnerability Classification (Source: PPS25 Table D2)
Vulnerability Type of use Essential Infrastructure Essential transport infrastructure (including mass evacuation
routes) which has to cross the area at risk. Essential utility infrastructure which has to be located in a flood
risk area for operational reasons, including electricity generating power stations and grid and primary substations; and water treatment works that need to remain operational in times of flood.
Wind turbines. Highly Vulnerable Police stations, Ambulance stations and Fire stations and
Command Centres and telecommunications installations required to be operational during flooding.
Emergency dispersal points. Basement dwellings. Caravans, mobile homes and park homes intended for
permanent residential use. Installations requiring hazardous substances consent.19
(Where there is a demonstrable need to locate such installations for bulk storage of materials with port or other similar facilities, or such installations with energy infrastructure or carbon capture and storage installations, that require coastal or water-side locations, or need to be located in other high flood risk areas, in these instances the facilities should be classified as ‘Essential Infrastructure’).
More Vulnerable Hospitals. Residential institutions such as residential care homes,
children’s homes, social services homes, prisons and hostels. Buildings used for: dwelling houses; student halls of residence; drinking establishments; nightclubs; and hotels. Non–residential uses for health services, nurseries and
educational establishments. Landfill and sites used for waste management facilities for
hazardous waste. Sites used for holiday or short-let caravans and camping,
subject to a specific warning and evacuation plan. Less Vulnerable Police, ambulance and fire stations which are not required to
be operational during flooding. Buildings used for: shops; financial, professional and other
services; restaurants and cafes; hot food takeaways; offices; general industry; storage and distribution; non–residential institutions not included in ‘more vulnerable’; and assembly and leisure.
Land and buildings used for agriculture and forestry. Waste treatment (except landfill and hazardous waste
facilities). Minerals working and processing (except for sand and gravel
working). Water treatment works which do not need to remain
operational during times of flood. Sewage treatment works (if adequate measures to control
pollution and manage sewage during flooding events are in place).
Water-compatible Development
Flood control infrastructure, water transmission infrastructure and pumping stations.
Sewage transmission infrastructure and pumping stations. Sand and gravel workings. Docks, marinas and wharves, navigation facilities.

2011s5199 B&H SFRA - Final Report (v2 Jan12).doc 19
MOD defence installations. Ship building, repairing and dismantling, dockside fish
processing and refrigeration and compatible activities requiring a waterside location.
Water-based recreation (excluding sleeping accommodation). Lifeguard and coastguard stations. Amenity open space, nature conservation and biodiversity,
outdoor sports and recreation and essential facilities such as changing rooms.
Essential sleeping or residential accommodation for staff required by uses in this category, subject to a warning and evacuation plan.
Notes: This classification is based partly on DEFRA/Environment Agency research on Flood Risks to People (FD2321/TR2)
and also on the need of some uses to keep functioning during flooding. Buildings that combine a mixture of uses should be placed into the higher of the relevant classes of flood risk.
Developments that allow uses to be distributed over the site may fall within several classes of flood risk sensitivity. The impact of a flood on the particular uses identified within this flood risk vulnerability classification will vary within
each vulnerability class. Therefore, the flood risk management infrastructure and other risk mitigation measures needed to ensure the development is safe may differ between uses within a particular vulnerability classification.
Table 3.3 Flood risk vulnerability and Flood Zone compatibility (Source: PPS25 Table D3)
Vulnerability classification
Essential Infrastructure
Water compatible
Highly vulnerable
More vulnerable
Less Vulnerable
Flood Zone
Zone 1 � � � � � Zone 2 � � Exception
Test required
� �
Zone 3a Exception Test required
� x Exception Test required
�
Zone 3b 'Functional floodplain'
Exception Test required
� x x x
Key: � Development is appropriate x Development should not be permitted

2011s5199 B&H SFRA - Final Report (v2 Jan12).doc 20
4 Flood risk in Brighton and Hove
4.1 Introduction The administrative area of Brighton and Hove is a compact city of 8,267 hectares built on rolling hills and valleys, constrained between the South Downs and the sea. Approximately 252,000 people reside in the developed area which comprises around half of the city’s extent (2004). There are no designated main rivers, or ordinary watercourses, within Brighton and Hove, although the city area shares approximately 14km of its boundary with the sea. Underlying geology is dominated by the extensive chalk downland, which serves to provide the city’s water supply (as an aquifer). The highly permeable nature of this bedrock contributes a risk of flooding through emergent groundwater.
4.1.1 How flood risk is assessed
A flood is now formally defined in the Flood and Water Management Act (2010).
A flood is defined by the act as "any case where land not normally covered by water becomes covered by water". The act also states that a flood, as defined above, can be caused by:
(a) heavy rainfall (b) a river overflowing or its banks being breached (c) a dam overflowing or being breached (d) tidal waters (e) groundwater (e) anything else (including any combination of factors).
In the context of the FWMA (2010) a flood does not include:
(a) A flood from any part of a sewerage system, unless wholly or partly caused by an increase in the volume of rainwater (including snow and other precipitation) entering or otherwise affecting the system.
(b) A flood caused by a burst water main (within the meaning given by section 219 of the Water Industry Act 1991).
The FWMA (2010) states that flood risk "means a risk in respect of flood", where risk is "assessed and expressed (as for insurance and scientific purposes) as a combination of the probability of the occurrence with its potential consequences".
Thus it is possible to define flood risk as:
Flood Risk = (Probability of a flood) X (scale of the consequences)
On that basis it is useful to express the definition as follows:
4.2 Fluvial flood risk With no main rivers or ordinary watercourses within Brighton and Hove the SFRA does not include an assessment of fluvial flood risk.
The council's previous SFRA (PBA, 2008) does make reference to a so-called ‘lost river’, the River Wellesbourne, which was reported to run below Preston Park, London Road and The Level, discharging to the sea in the vicinity of Palace Pier, but investigations found that this watercourse no longer exists, and it has therefore not been considered further in this updated SFRA.
Consequences = X
X X Flood Hazard Magnitude
Receptor presence
Receptor Vulnerability
Probability Flood Risk
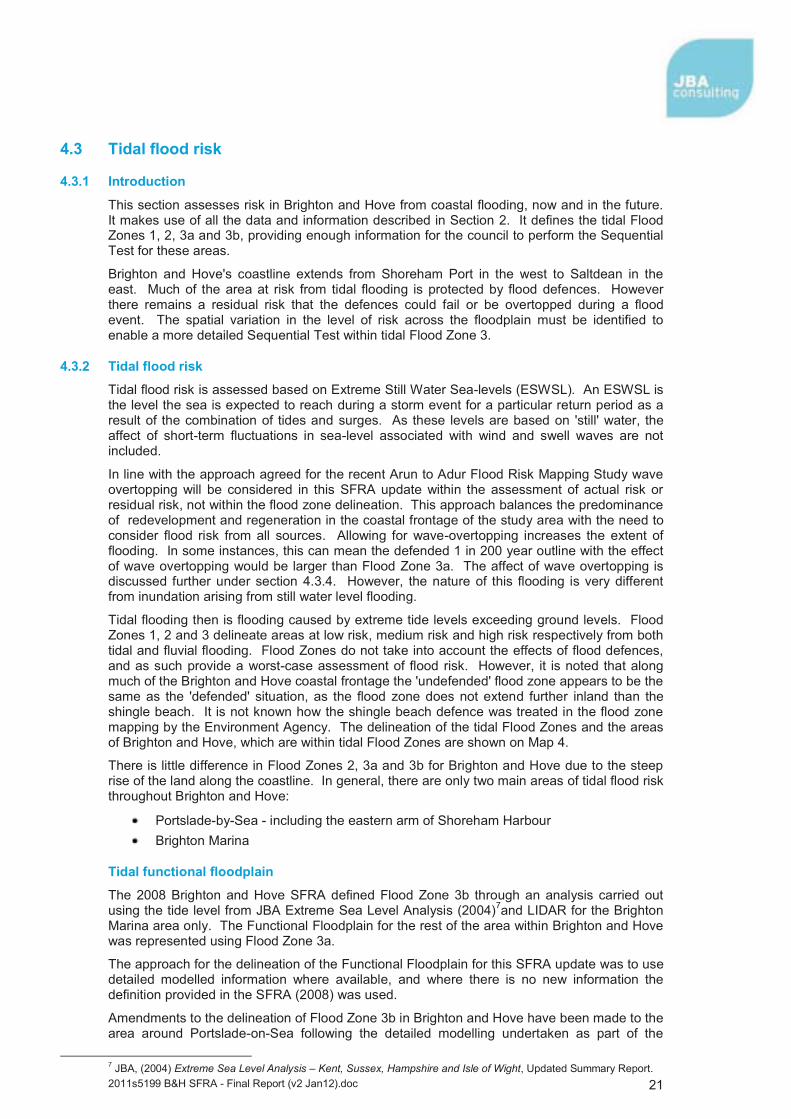
2011s5199 B&H SFRA - Final Report (v2 Jan12).doc 21
4.3 Tidal flood risk
4.3.1 Introduction
This section assesses risk in Brighton and Hove from coastal flooding, now and in the future. It makes use of all the data and information described in Section 2. It defines the tidal Flood Zones 1, 2, 3a and 3b, providing enough information for the council to perform the Sequential Test for these areas.
Brighton and Hove's coastline extends from Shoreham Port in the west to Saltdean in the east. Much of the area at risk from tidal flooding is protected by flood defences. However there remains a residual risk that the defences could fail or be overtopped during a flood event. The spatial variation in the level of risk across the floodplain must be identified to enable a more detailed Sequential Test within tidal Flood Zone 3.
4.3.2 Tidal flood risk
Tidal flood risk is assessed based on Extreme Still Water Sea-levels (ESWSL). An ESWSL is the level the sea is expected to reach during a storm event for a particular return period as a result of the combination of tides and surges. As these levels are based on 'still' water, the affect of short-term fluctuations in sea-level associated with wind and swell waves are not included.
In line with the approach agreed for the recent Arun to Adur Flood Risk Mapping Study wave overtopping will be considered in this SFRA update within the assessment of actual risk or residual risk, not within the flood zone delineation. This approach balances the predominance of redevelopment and regeneration in the coastal frontage of the study area with the need to consider flood risk from all sources. Allowing for wave-overtopping increases the extent of flooding. In some instances, this can mean the defended 1 in 200 year outline with the effect of wave overtopping would be larger than Flood Zone 3a. The affect of wave overtopping is discussed further under section 4.3.4. However, the nature of this flooding is very different from inundation arising from still water level flooding.
Tidal flooding then is flooding caused by extreme tide levels exceeding ground levels. Flood Zones 1, 2 and 3 delineate areas at low risk, medium risk and high risk respectively from both tidal and fluvial flooding. Flood Zones do not take into account the effects of flood defences, and as such provide a worst-case assessment of flood risk. However, it is noted that along much of the Brighton and Hove coastal frontage the 'undefended' flood zone appears to be the same as the 'defended' situation, as the flood zone does not extend further inland than the shingle beach. It is not known how the shingle beach defence was treated in the flood zone mapping by the Environment Agency. The delineation of the tidal Flood Zones and the areas of Brighton and Hove, which are within tidal Flood Zones are shown on Map 4.
There is little difference in Flood Zones 2, 3a and 3b for Brighton and Hove due to the steep rise of the land along the coastline. In general, there are only two main areas of tidal flood risk throughout Brighton and Hove:
Portslade-by-Sea - including the eastern arm of Shoreham Harbour Brighton Marina
Tidal functional floodplain
The 2008 Brighton and Hove SFRA defined Flood Zone 3b through an analysis carried out using the tide level from JBA Extreme Sea Level Analysis (2004)7and LIDAR for the Brighton Marina area only. The Functional Floodplain for the rest of the area within Brighton and Hove was represented using Flood Zone 3a.
The approach for the delineation of the Functional Floodplain for this SFRA update was to use detailed modelled information where available, and where there is no new information the definition provided in the SFRA (2008) was used.
Amendments to the delineation of Flood Zone 3b in Brighton and Hove have been made to the area around Portslade-on-Sea following the detailed modelling undertaken as part of the
7 JBA, (2004) Extreme Sea Level Analysis – Kent, Sussex, Hampshire and Isle of Wight, Updated Summary Report.

2011s5199 B&H SFRA - Final Report (v2 Jan12).doc 22
Shoreham Harbour and Adur to Arun studies. The defended 1 in 20 year outline for the Shoreham Harbour study has been used to determine the Functional Floodplain in the Portslade-on-Sea area. The new outline is significantly reduced along the Eastern Harbour Arm, however, it should be noted that this area suffers from wave overtopping which should be considered in land use planning decisions (section 4.3.4).
The exclusion of wave overtopping in the delineation of the Functional Floodplain is considered appropriate, when making land use planning decisions. However, it must be ensured that wave overtopping is managed effectively through the design of development. The effect of wave overtopping should therefore be investigated thoroughly in flood risk assessments accompanying development applications in these areas. The allocation of land uses within these areas should be made on a sequential risk basis and suitable mitigation measures incorporated to manage the affects of wave overtopping where this cannot be avoided.
4.3.3 Tidal defences
The Brighton and Hove seafront is protected from tidal flooding by formal defences. The beaches to the west of Brighton Marina comprise of shingle ridges controlled by groynes. At low water the foot of the shingle ridge can be seen with sand running out seaward. The coastline to the east of Brighton Marina is dominated by chalk cliffs and a wave cut platform. The location of the extensive tidal flood defences in Brighton and Hove is shown on Maps 5 and 6.
Coastal defences for the area are included in the Environment Agency’s National Fluvial and Coastal Defence Database (NFCDD) although this dataset is not populated with the defence crest level. The SFRA (2008) extracted the defence crest levels from technical reports describing the condition and standard of protection of existing flood and coastal defences (Halcrow, 2003)8. No further information was obtained for this SFRA update, therefore the same information will be used.
4.3.4 Tidal residual risk
‘Residual risk’ is defined as the flood risk remaining with flood mitigation measures in place. The land behind the defences is only at risk of flooding through failure or overtopping of the defences.
Failure of flood defences
Flood zones represent the undefended situation and therefore highlight whether there would be a residual risk from failure of a defence. Based on Flood Zone 3a, the areas shown to be at risk of a failure of the defences level are Brighton Marina and Portslade South.
Figure 4.1 Illustration of residual risk associated with defence failure
The impact of a failure in the defences has not been modelled as part of this SFRA. In the site specific assessment for Brighton Marina and Shoreham Harbour (Chapter 5 and Appendix A)
8 Brighton Marina to River Adur Tidal and Coastal Defence Strategy Plan, Halcrow, 2003.
Lower residual risk area
Rapid Inundation Zone
Sea Defence Floodplain Level calculated from breach modelling
Level inferred by Flood Zone Map

2011s5199 B&H SFRA - Final Report (v2 Jan12).doc 23
comment has been made about the residual risk and it is recommended that this be fully assessed as part of an FRA for any future development proposals.
Wave Overtopping
Tidal flooding along much of the south coast is characterised by the presence of risk associated with wave overtopping. In exposed locations along the coast, landward flooding is more likely to occur as a consequence of wave overtopping than inundation. Wave overtopping is a term, which encompasses a number of complex physical processes, which result in the transfer of water from the sea onto the coastal floodplain. The amount of wave overtopping that occurs during an extreme event is dependent on the local water depth, the properties of incoming waves and the geometry of local flood defences. Figure 4.2 outlines the process of wave overtopping in relation to the Extreme Still Water Sea-level.
Figure 4.2 Illustration of residual risk associated with wave overtopping
Wave overtopping is one of the principal mechanisms of flooding for the coastal frontage. The Shoreham Harbour and Adur to Arun studies undertook some modelling to show the affect of wave-overtopping. Figure 4.3 and Figure 4.4 compares the effect of wave overtopping in the 1 in 20 year and 1 in 200 year events. The outlines for both return periods are significantly more extensive. The effect of wave overtopping has not been included in the flood zone delineation. However, wave overtopping is of material concern to the coastal frontage of Brighton and Hove, therefore any future development proposal should be accompanied by a flood risk assessment, which appropriately considers the effects of wave overtopping.
Offshore Waves
Wave overtopping Nearshore Waves
Wave transformation Still water-level
Surge
Tide
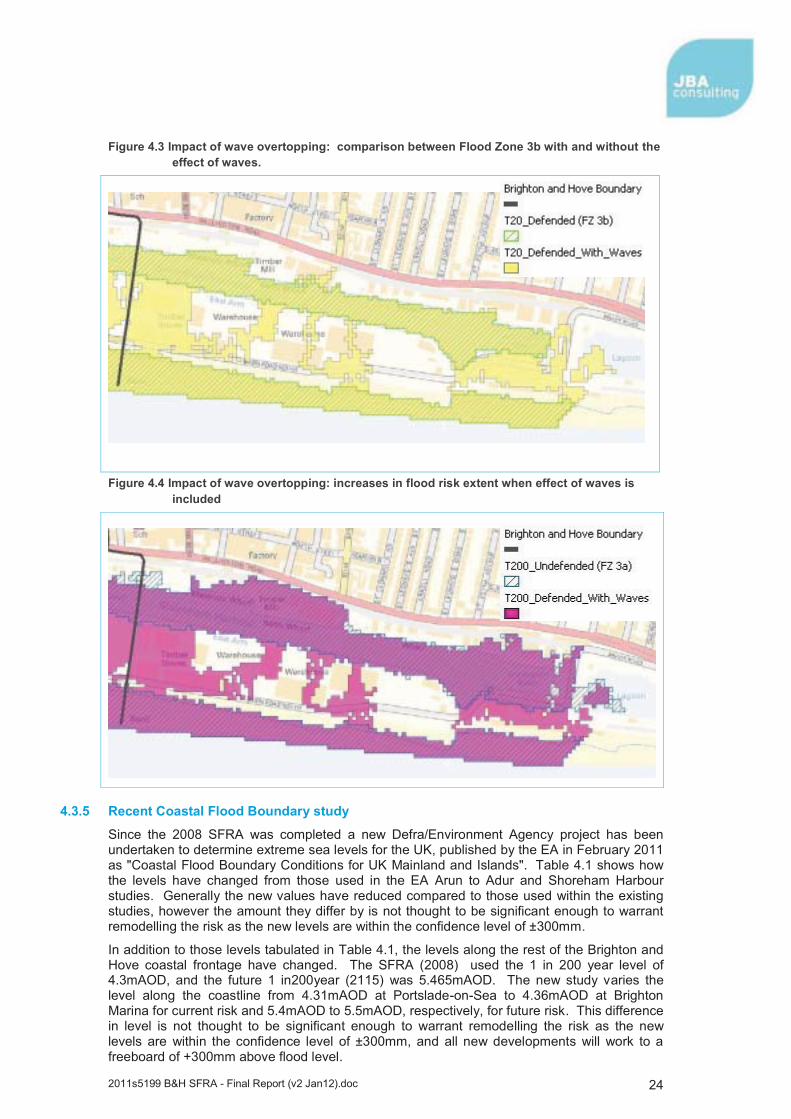
2011s5199 B&H SFRA - Final Report (v2 Jan12).doc 24
Figure 4.3 Impact of wave overtopping: comparison between Flood Zone 3b with and without the effect of waves.
Figure 4.4 Impact of wave overtopping: increases in flood risk extent when effect of waves is included
4.3.5 Recent Coastal Flood Boundary study
Since the 2008 SFRA was completed a new Defra/Environment Agency project has been undertaken to determine extreme sea levels for the UK, published by the EA in February 2011 as "Coastal Flood Boundary Conditions for UK Mainland and Islands". Table 4.1 shows how the levels have changed from those used in the EA Arun to Adur and Shoreham Harbour studies. Generally the new values have reduced compared to those used within the existing studies, however the amount they differ by is not thought to be significant enough to warrant remodelling the risk as the new levels are within the confidence level of ±300mm.
In addition to those levels tabulated in Table 4.1, the levels along the rest of the Brighton and Hove coastal frontage have changed. The SFRA (2008) used the 1 in 200 year level of 4.3mAOD, and the future 1 in200year (2115) was 5.465mAOD. The new study varies the level along the coastline from 4.31mAOD at Portslade-on-Sea to 4.36mAOD at Brighton Marina for current risk and 5.4mAOD to 5.5mAOD, respectively, for future risk. This difference in level is not thought to be significant enough to warrant remodelling the risk as the new levels are within the confidence level of ±300mm, and all new developments will work to a freeboard of +300mm above flood level.

2011s5199 B&H SFRA - Final Report (v2 Jan12).doc 25
Table 4.1 Difference in Extreme Sea Level (mAOD) 20119 (new) minus 201010 (previous)
Return Period Littlehampton Worthing Shoreham 20 -0.15 -0.14 -0.10 75 -0.21 -0.10 -0.06 200 -0.19 -0.08 -0.04 1000 -0.19 -0.08 0.05
4.3.6 Effects of climate change on tidal flood risk
The Arun to Adur Flood Modelling and the Shoreham Harbour Regeneration: Design and Flood Risk Study (2011) provided more detailed model extents for the effect of climate change in the Portslade-on-Sea/Shoreham Harbour area of Brighton and Hove. These results were used to assess climate change in this area.
For the rest of the Brighton and Hove study area the climate change outlines from the SFRA (2008) were used. The SFRA (2008) climate change outlines were created by mapping the predicted extreme still water sea-level for 2115 (the 200 year extreme sea level rise was calculated to rise by 1165 mm for 2115 to 5.465mAOD) using LIDAR data supplied by the Environment Agency.
Details of the climate change effect on tidal flood risk within the Brighton and Hove are shown in Map 6. There are three areas along the Brighton and Hove coastline which suffer notable increases in flood extent as a consequence of climate change: Portslade-by-Sea/Shoreham Harbour, Brighton Beach at Palace Pier and Brighton Marina.
The effect of climate change on wave overtopping has not been looked at as part of the existing studies, given that the region is highly susceptible to wave overtopping, it should be noted that the true risk of future climate change is only partially presented.
New climate change guidance
The new climate change advice note "Adapting to Climate Change: Advice for Flood and Coastal Erosion Risk Management Authorities" was issued by the Environment Agency in September 2011. It suggests that adaptation options should plan for the degree of change represented by a 'change factor'.
Potential changes in sea level rise correspond to the various emission scenarios stated in UKCP09. It ranges from the H++ scenario to the low emission scenario. The medium emission scenario corresponded to the ‘change factor’.
The existing estimates of climate change are within the bounds of this new guidance. However, it should be noted that the guidance recommends that "when considering climate change a full appreciation of emission scenario and climate uncertainty is taken into account. The upper and lower end estimates are designed to achieve this within flood and coastal erosion risk management applications." It would be appropriate to consider the upper H++ scenario when reviewing some planning applications, for example critical infrastructure which could not readily be moved or protected in the event of climate change occurring at a rate beyond what is expected.
4.3.7 Flood warning systems
The Environment Agency operates a flood warning service covering tidal flooding for Brighton and Hove using its Flood Warnings Direct system. These areas are currently under revision by the Environment Agency to bring them up to date with guidance released in the last few years by making them more community orientated.
There is currently one flood warning area covering tidal flood risk in Brighton and Hove:
073FWC11A - Coastline at Portslade, Shoreham by-Sea, Hove and Brighton, including Shoreham Port and Brighton Marina.
9 Coastal Flood Boundary Conditions for UK Mainland and Islands, Project: SC060064/TR2: Design sea levels,
February 2011 10 Extreme Sea-levels: Kent, Sussex, Hampshire and the Isle of Wight, Updated Summary Report, July 2003

2011s5199 B&H SFRA - Final Report (v2 Jan12).doc 26
4.4 Surface water flood risk Surface water flooding occurs in Brighton and Hove, and is a particular concern in urbanised areas, where floods occur quickly in response to heavy rainfall events. In general, surface water flooding is the most frequent cause of flooding, although floodwaters are typically shallower and persist for shorter durations than other types of flooding. The SFRA (2008) reported the historical surface water flooding events recorded back to the 1960s, which were sometimes referred to as ‘muddy floods’. An indication of those areas which have suffered from this type of flooding was also plotted. It was thought that the increase in muddy floods in this area may be as a result of changes in the farming methods used.
An assessment for the potential for surface water flooding in the Brighton and Hove has been included in Maps 7 - 9. This uses Environment Agency surface water datasets including Areas Susceptible to Surface Water Flooding (AStSWF) and Flood Map for Surface Water (FMfSW).
The locally agreed surface water information for Brighton and Hove will be the FMfSW according to the PFRA report. The general flow paths are consistent across both the AStSWF and the FMfSW, however where they do differ is the spatial extent of flooding and depth of flooding. The extent of flooding shown by the AStSWF is larger than that shown in the FMfSW. This is because the AStSWF was modelled using a longer storm duration and assumed there was no drainage capacity within the sewer network, consequently the flood extent is larger compared to FMfSW. Therefore, the AStSWF should be considered as the 'worse case', with the more realistic FMfSW highlighting those areas where flood risk is more prominent.
There are eight well defined flow routes within Brighton and Hove according to the AStSWF. The largest affected areas are along the A23 and A270 which form a 'y' shaped flow route in the centre of the city. There are significant areas in Hove, which are more susceptible to surface water flooding. The largest area of surface water ponding in Hove lies between the A270 to Kingsway. Site-specific assessments of surface water flood risk within the study area are included in the Level 2 City Plan site summary sheets in Appendix A.
The PFRA (2011) carried out by the City Council has summarised the properties at risk of surface water flooding in Brighton and Hove from the FMfSW, this has been reproduced in Table 4.2.
Table 4.2 Properties at risk of surface water flooding in a 1 in 200 year event (Source Table 5.1 Brighton and Hove PFRA, 2011)*
FMfSW Depth Total number of properties at risk of
surface water flooding
Number of residential properties at risk of
surface water flooding
Number of non - residential
properties at risk of surface water
flooding
Number of people at risk of
surface water flooding.
(Human Health consequence)
‘Surface Water Flooding’ > 0.1m
35,600
31,300 4,300 73,242
‘Deeper Surface Water
Flooding’ > 0.3m
17,400 15,200 2,200 35,568
*These numbers have been derived using broadscale modelling, and have been reproduced from the PFRA (2011)
4.5 Groundwater flood risk Brighton and Hove lies on the south of the Chalk South Downs and has suffered flooding from groundwater in the past. The most notable and largest events in recent years occurred in 2000/01. This resulted in extensive flooding of the A23, which was closed for several days.
The geology within the administrative area of Brighton and Hove is very much dominated by chalk, with isolated pockets of clay, silt and sand lying in the south west of this area (Map 2).
An assessment of groundwater flood risk in Brighton and Hove has been undertaken using the Environment Agency's 'Areas Susceptible to Groundwater Flooding' data. Map 10 shows how the risk varies across Brighton and Hove. Only the east of the A23 within Brighton is shown to be less susceptible to groundwater flooding; however the majority of the area is in the low risk

2011s5199 B&H SFRA - Final Report (v2 Jan12).doc 27
category (< 25%). There are three areas which are more susceptible to groundwater flooding, Whitehawk Hill, North of Ovingdean and South of Anne's Well Garden.
4.6 Sewer flood risk Sewer flooding can occur where sewage is unable to drain away in sewerage pipes, and emerges at the surface usually due to the system being overloaded with floodwater. In Brighton and Hove, storm water is generally drained by the sewer infrastructure, the system is at risk of becoming overloaded in storm conditions. The infrastructure is also at risk of becoming inundated with groundwater when groundwater levels rise.
There have been recorded incidences of sewer flooding in Brighton and Hove. Records of incidents since 1995 were obtained from Southern Water as part of the SFRA (2008), and were summarised in the 2008 SFRA report, Appendix C. These records, which are combined by postcode, have been plotted on Map 3.
The recent PFRA study plotted the sewer flooding incidents within Brighton and Hove since 2001 using the data provided by Southern Water Services ltd. The sewer flooding information from the PFRA is also used to assess each City Plan site.
4.7 Flood risk from artificial sources
4.7.1 Reservoirs
There are no reservoirs storing water above normal ground level in Brighton and Hove.
4.7.2 Other water bodies
GTA Civils ltd were appointed by East Sussex County Council to carry out a flood assessment at The Keep, Falmer in respect of a proposed new archive facility with access road and associated service yard and parking areas. The Woollards Field site is situated between the Brighton to Lewes railway line and the A270 Lewes Road, just south of the junction with the A27. Immediately north of the site is a Highways Agency balancing pond which accepts surface water run-off water from the existing A27/A270 surface water run-off.
This report also referred to a Flood Risk/Drainage report carried out in relation to the highways balancing pond by GTA Civils ltd dated July 2009, which identified that the Highways Agency balancing pond posed little risk of flooding up to the 1 in 200 year storm event.
There are also flood defence structures throughout Brighton and Hove designed to hold back surface water when required, the location of these are:
Bodiam Close Walmer Crescent Ovingdean Close Bulstrode Farm New Barn Valley Kenilworth Close Wheatfield Way Wolseley Road Milcroft Mile Oak Farm
4.7.3 Canals and other artificial sources
There are no known canals or 'other' potential artificial sources of flooding in Brighton and Hove.

2011s5199 B&H SFRA - Final Report (v2 Jan12).doc 28
5 Level 2 Strategic Site Allocations
5.1 Introduction This section provides a series of assessments of flood risk and recommendations to be considered when undertaking future developments within Brighton and Hove. It is for the information of both developers and the council's planning department. This guidance can be applied to new developments and redevelopments.
5.2 Brighton and Hove City Plan sites The City Plan is the first Development Plan Document (DPD) to be produced as part of Brighton and Hove’s Local Development Framework. Its purpose is to provide the overall strategic and spatial vision for the future of Brighton and Hove through to 2030. It will help shape the future of the city and plays an important role in ensuring that other citywide plans and strategies achieve their objectives.
The development areas are proposed to accommodate a significant amount of development because they present opportunities for change and they can deliver development of citywide or regional importance, and/or because they are in need of regeneration. There are only 7 sites in the City Plan:
Brighton Centre and Churchill Square Area Brighton Marina, Gas Works and Black Rock Area Lewes Road Area New England Quarter and London Road Area Eastern Road and Edward Street Area Hove Station Area Shoreham Harbour Area
5.3 Site specific assessment for the City Plan sites A site-specific assessment, which summarises the flood risk from all sources, including the effect of defences and residual flood risk, has been carried out for each City Plan site as part of the Level 2 SFRA. Appendix B contains a summary for each City Plan site of:
Flood risk vulnerability classification of proposed development and whether the Exception Test would be required once the Sequential Test has been passed.
Sources of flooding with detailed maps where appropriate Flood defences Potential residual risk Effect of climate change Requirements for a flood risk assessment – specific to issues at the site Recommendations for managing the flood risk
5.4 Addressing flood risk in site allocations The overarching aim of PPS25 is to guide development away from areas of high flood risk through the use of the Sequential Test. These site specific assessments focus on the level of flood risk and do not consider other planning matters that an LPA must consider in evidencing the sequential approach to land use allocation. Therefore, in itself an SFRA cannot complete the Sequential Test, as consideration of wider development issues, drivers and criteria is required.
The assessments in Appendix A have highlighted the different sources and degree of flood risk to each of the allocated sites. In summary, only two of the sites were shown to be within Flood Zones 2 and 3: the Shoreham Harbour Area; and Brighton Marina, Gas Works and

2011s5199 B&H SFRA - Final Report (v2 Jan12).doc 29
Black Rock Area. Consequently these sites will require specific consideration and detailed FRA will be required to ensure all the risks, including the residual risk of defence failure and wave overtopping, are considered in the development proposals suggested for the areas. In Shoreham Harbour the degree of flood risk varies across the entire site (which spans the Brighton and Hove City Council and the Adur District Council boundaries) therefore sequential planning of the site needs to be considered to place vulnerable developments in the areas at lower risk. In some instances, the Exception Test will need to be passed, proving the development will be safe and not increase flood risk elsewhere.
The rest of the allocated sites reside in Flood Zone 1. Although these sites are at low risk of flooding and according to PPS25 development of any vulnerability is allowable, consideration needs to be given to the other sources of flood risk affecting the sites. Many of the sites are at risk from both groundwater and surface water flooding and consequently a flood risk assessment should be undertaken for any future development in these areas to show the degree of risk and how it will be mitigated.

2011s5199 B&H SFRA - Final Report (v2 Jan12).doc 30
6 Recommendations and Guidance
6.1 Using SFRA risk information The SFRA contains information that can be used at strategic, operational and tactical levels as shown in Figure 6.1. The flood risk data contained within this SFRA should be updated following flood events.
Figure 6.1: Use of SFRA information
Avoid or reduce risk
Assess risk
Control or mitigate risk
Tactical response to flood event
Post event recovery support
Before a flood During a flood After a flood
6.2 For Brighton and Hove City Council One of the key objectives of the SFRA is to provide an evidence base, which will inform the preparation of the Local Development Framework for Brighton and Hove with respect to local flood risk issues and the location of future development.
The council will have regard to PPS25 Development and Flood Risk and to the most recent Strategic Flood Risk Assessment in assessing the suitability of land for development at all levels of the planning process. It will apply the Sequential Test and Exception Test set out in Annex D of PPS25 in master planning, allocating sites for development and assessing individual planning applications by ensuring that there are no other suitable sites in areas with a lower risk of flooding.
The local planning authority can play an important role in strategic flood risk management. The overall aim should be to direct development to areas of lower flood risk wherever possible and resist development in areas of flood risk unless the type of development is commensurate with the type of flood risk.
The Council should also seek flood risk reduction in every new development and redevelopment through design, changes in land use and drainage requirements.
6.2.1 Requirements for flood risk assessment
The council should require that all development, including changes of use, have at least an initial assessment of flood risk using this SFRA. There should be a requirement for a detailed site specific flood risk assessment to be submitted with planning applications for:
Major developments located in Flood Zone 1 (>1ha); All development in Flood Zones 2 and 3 (i.e. Shoreham Harbour and Brighton
Marina); All development or change of use, regardless of flood zone or size, where flood risk
from other sources (surface water, sewer, groundwater) is identified by the SFRA. Flood risk assessments should identify and assess the risks of all forms of flooding to and from the development and demonstrate how these flood risks will be managed, taking climate change into account.
An FRA should demonstrate:
whether any proposed development is likely to be affected by current or future flooding from any source;

2011s5199 B&H SFRA - Final Report (v2 Jan12).doc 31
that the development is safe and where possible reduces flood risk overall to the LPAs satisfaction;
whether it will increase flood risk elsewhere; and the measures proposed to deal with these effects and risks. Any necessary flood risk
management measures should be sufficiently funded to ensure that the site can be developed and occupied safely throughout its proposed lifetime.
6.2.2 Surface water runoff
It is recommended that the council require that surface water runoff from a development should be controlled as close to the source as possible. In addition, where the development site is 'greenfield', runoff must be controlled to maintain the 'greenfield' runoff rates. If the site is 'brownfield' developers should strive to achieve 'greenfield' runoff rates but as a minimum reduce existing runoff by 50%.
The use of Sustainable Drainage Systems (SUDS) should be required on all new developments. If SUDS are not used, the developer must provide a valid reason why they are not suitable.
Under the F&WMA, LLFAs are designated the SUDS Approving Body (SAB) for any new drainage system, and therefore must approve, adopt and maintain any new sustainable drainage systems (SUDs) within their area. Although this aspect of the F&WMA is yet to be formally enacted it is recommended that where SUDS are installed, the council should maintain an accurate record of installations, those adopted and maintenance required.
6.2.3 Surface water flooding
There is a history and recognised risk of surface water flooding in Brighton and Hove (section 4.4).
It is recommended that the council require a flood risk assessment for all development or change of use, regardless of flood zone or size, where flood risk from surface water is identified by the SFRA. The FRA should clearly state the degree of risk and how the risk to the development will be mitigated.
Given the level of surface water flood risk in the study area developments may seek to reduce surface water flood risk downstream by capturing the rainwater. Once captured this water may either be:
Re-used for a range of purposes, such as toilet flushing and garden watering: or Infiltrated back to the ground. The permeable nature of the underlying chalk means
infiltration is possible however consideration of the EAs groundwater protection zones (Figure C 2, Appendix C) will be needed as restrictions on infiltration may apply.
The forthcoming SWMP for Brighton and Hove should also inform surface water management in the area.
6.2.4 Groundwater flooding
Situated on the South Downs the underlying geology of Brighton and Hove is predominantly chalk. Consequently, there is a history and recognised risk of groundwater flooding (section 4.5).
It is recommended that the council require a flood risk assessment for all development or change of use, regardless of flood zone or size, where flood risk from groundwater is identified by the SFRA. The FRA should clearly state the degree of risk and how the risk to the development will be mitigated.
The Council should ensure that any subterranean development proposals prove there is no risk from groundwater or other sources of flooding, and should prove that groundwater flow paths are preserved so as not to increase the flood risk elsewhere. The design of any new subterranean development should ensure that flood risk is not increased for existing adjacent subterranean developments by changes to groundwater flow paths.

2011s5199 B&H SFRA - Final Report (v2 Jan12).doc 32
6.2.5 Failure of defences
The Brighton and Hove seafront is heavily protected by a series of coastal defences. Although their standard of protection is high, there remains a residual risk in the incidence of failure (section 4.3.4).
Where flood risk exists from failure of defences, all development proposals should be required to demonstrate that:
The Council's emergency planners have been consulted on the proposals. The emergency services have been consulted on the proposals. A robust emergency/evacuation plan has been developed and communicated. The development would be structurally safe against the effects of breach flood waters. 'Safe' access including the ability to escape to higher levels without having to pass
through flood waters has been appropriately allowed for.
6.2.6 Wave overtopping
Wave overtopping is a significant risk along the south coast. Wave overtopping is one of the principal mechanisms of flooding for the coastal frontage (section 4.3.4). In line with the approach agreed for the recent Arun to Adur Flood Risk Mapping Study wave overtopping will be considered in this SFRA update within the assessment of actual risk or residual risk, not within the flood zone delineation. This approach balances the predominance of redevelopment and regeneration in the coastal frontage of the study area with the need to consider flood risk from all sources. Allowing for wave-overtopping increases the extent of flooding. In some instances, this can mean the defended 1 in 200 year outline with the effect of wave overtopping would be larger than Flood Zone 3a. Therefore, any future development proposal along the coastal frontage should be required to thoroughly consider the effects of wave overtopping through detailed hydraulic modelling.
Where flood risk exists from wave overtopping, all development proposals should be required to demonstrate that:
The Council's emergency planners have been consulted on the proposals. The emergency services have been consulted on the proposals. A robust emergency/evacuation plan has been developed and communicated. The residual risk can be appropriately mitigated. The development would be structurally safe. 'Safe' access including the ability to escape to higher levels without having to pass
through flood waters has been appropriately allowed for.
6.2.7 Functional Floodplain
For the purposes of this SFRA the Functional Floodplain throughout Brighton and Hove has been defined using that outlined in the previous SFRA (predominantly Flood Zone 3 but taking account of defences) across the area except around Shoreham Harbour where the defended 1 in 20 year outline from the recent modelling study was used (section 4.3.2).
This definition should be used when considering whether future development proposals are commensurate with the type of flood risk. If the question of functionality arises then it will be the responsibility of the developer to challenge this designation through detailed hydraulic modelling.
6.3 For Developers Developers should consider flood risk at an early stage in deciding the layout and design of a site to provide an opportunity to reduce flood risk within the development. Recommendations of how to reduce flood risk through design and site layout are detailed in Appendix C.1.
In general all future developments should demonstrate:
That the probability and consequences of flooding will be reduced.
2011s5199 B&H SFRA - Final Report (v2 Jan12).doc 33
How actual and residual flood risk to the development and flood risk to others from all sources will be managed over the lifetime of the development, taking into account climate change.
That development will be safe through the layout, form and floor levels of the development and mitigation measures.
That surface water runoff is being managed. A development will have certain requirements to fulfil, dependent upon which flood zone it is located within. The minimum requirements for future development are summarised Appendix D.
The following subsections contain information to assist developers where flood risk to and from a development is identified.
6.3.1 Managing surface water runoff
Standard SUDS techniques should be used on all new developments to control the surface water runoff from the site. Any surface water runoff from a development should be controlled as close to the source as possible. Details of application of SUDS techniques can be found in Appendix C.3.
Where the development site is 'greenfield', runoff must be controlled to maintain the 'greenfield' runoff rates. If the site is 'brownfield' developers should strive to achieve 'greenfield' runoff rates but as a minimum reduce existing runoff by 50%.
6.3.2 Managing flood risk from foul sewer flooding
There should not be the presumption that the existing sewer drainage network has enough capacity to accommodate the flows from all new developments. Consultation with Southern Water Services Ltd should be undertaken prior to development commencing. (See also Appendix C.2)
Where there is an evidenced history of foul sewer flooding in an area resilience measures e.g. non return valves should be considered in development design.
6.3.3 Managing flood risk from surface water flooding
Where a site is shown at risk of surface water flooding the design and layout of the property should be such that the risk is reduced.
Where risk remains, the likely flow routes and depths across the site should be modelled. The site should be designed so that these flow routes are maintained, and building design should provide resilience against the risk of surface water flooding. (Appendix C.1 details potential resilience measures).
Developments should seek to reduce surface water flood risk downstream by capturing the rainwater. Once captured this water should either be:
Re-used for a range of purposes, such as toilet flushing and garden watering; or Infiltrated back to the ground. The permeable nature of the underlying chalk means
infiltration is possible however consideration will need to be given to the EAs groundwater protection zones (Figure C 2, Appendix C) as restrictions on infiltration may apply.
Managing this flood risk should be informed by the Brighton and Hove SWMP (ongoing), and consultation should be had with the Council to ensure any management options are in line with the SWMP Action Plan.
6.3.4 Managing flood risk from groundwater flooding
Groundwater flooding has a very different flood mechanism to any other. As it rises up from below ground level, many conventional flood defence and mitigation methods are not suitable. The only way to fully reduce flood risk would be through building design, ensuring that floor levels are raised above the water levels caused by a 1% annual probability plus climate change event. Site design would also need to preserve any flow routes followed by the groundwater overland and make sure flood risk is not increased downstream. The design of
2011s5199 B&H SFRA - Final Report (v2 Jan12).doc 34
any new basements should ensure that flood risk is not increased for existing adjacent basements or properties by changes to groundwater flow patterns.
Where subterranean development is proposed the developer will need to ensure there is no risk from groundwater (or other sources of flooding). The development will also need to ensure no underground groundwater flow paths are impeded, so as not to increase the flood risk elsewhere. The design of any new subterranean development should ensure that flood risk is not increased for existing adjacent subterranean developments by changes to groundwater flow.
When redeveloping existing buildings it may be acceptable to install pumps in basements as a resilience measure. However for new development this is unlikely to be considered an acceptable solution.

2011s5199 B&H SFRA - Final Report (v2 Jan12).doc I
Appendices
2011s5199 B&H SFRA - Final Report (v2 Jan12).doc II
A Maps Map 1 Study Area
Map 2 Geology
Map 3 Historic Flooding
Map 4 Tidal flood risk - Floodplain Delineation (Undefended)
Map 5 Actual Tidal Flood Risk (With defences)
Map 6 Future Tidal Flood Risk (With defences)
Map 7 Surface Water Flooding - Flood Map for Surface Water - 1 in 30 year
Map 8 Surface Water Flooding - Flood Map for Surface Water - 1 in 200 year
Map 9 Surface Water Flood Risk- Areas Susceptible to Surface Water Flooding
Map 10 Indicative Groundwater Flood Risk - Areas Susceptible to Groundwater Flooding

Map 1Study Area
LEGEND
Contains Ordance Survey data ©Crown copyright and databaseright [2011]
© Crown copyright 2011. All rights reserved. Licence number100020999
Scale1:55,000
North
Brighton and Hove boundary
Brighton & Hove City Plan Sites
ID, Site Name
DA1, Brighton Centre and Churchill Square
DA2, Brighton Marina and Black Rock
DA3, Lewes Road
DA4, New England Quarter and London Road
DA5, Eastern Road and Edward Street
DA6, Hove Station
DA7, Shoreham Harbour and Portslade South

Map 2Geology
LEGEND
Contains Ordance Survey data ©Crown copyright anddatabase right [2011]© Crown copyright 2011. All rights reserved. Licencenumber 100020999
Scale1:55,000
North
Brighton and Hove Boundary
City Plan Sites
Bedrock
Greensand
Chalk
Clay
Sandstone
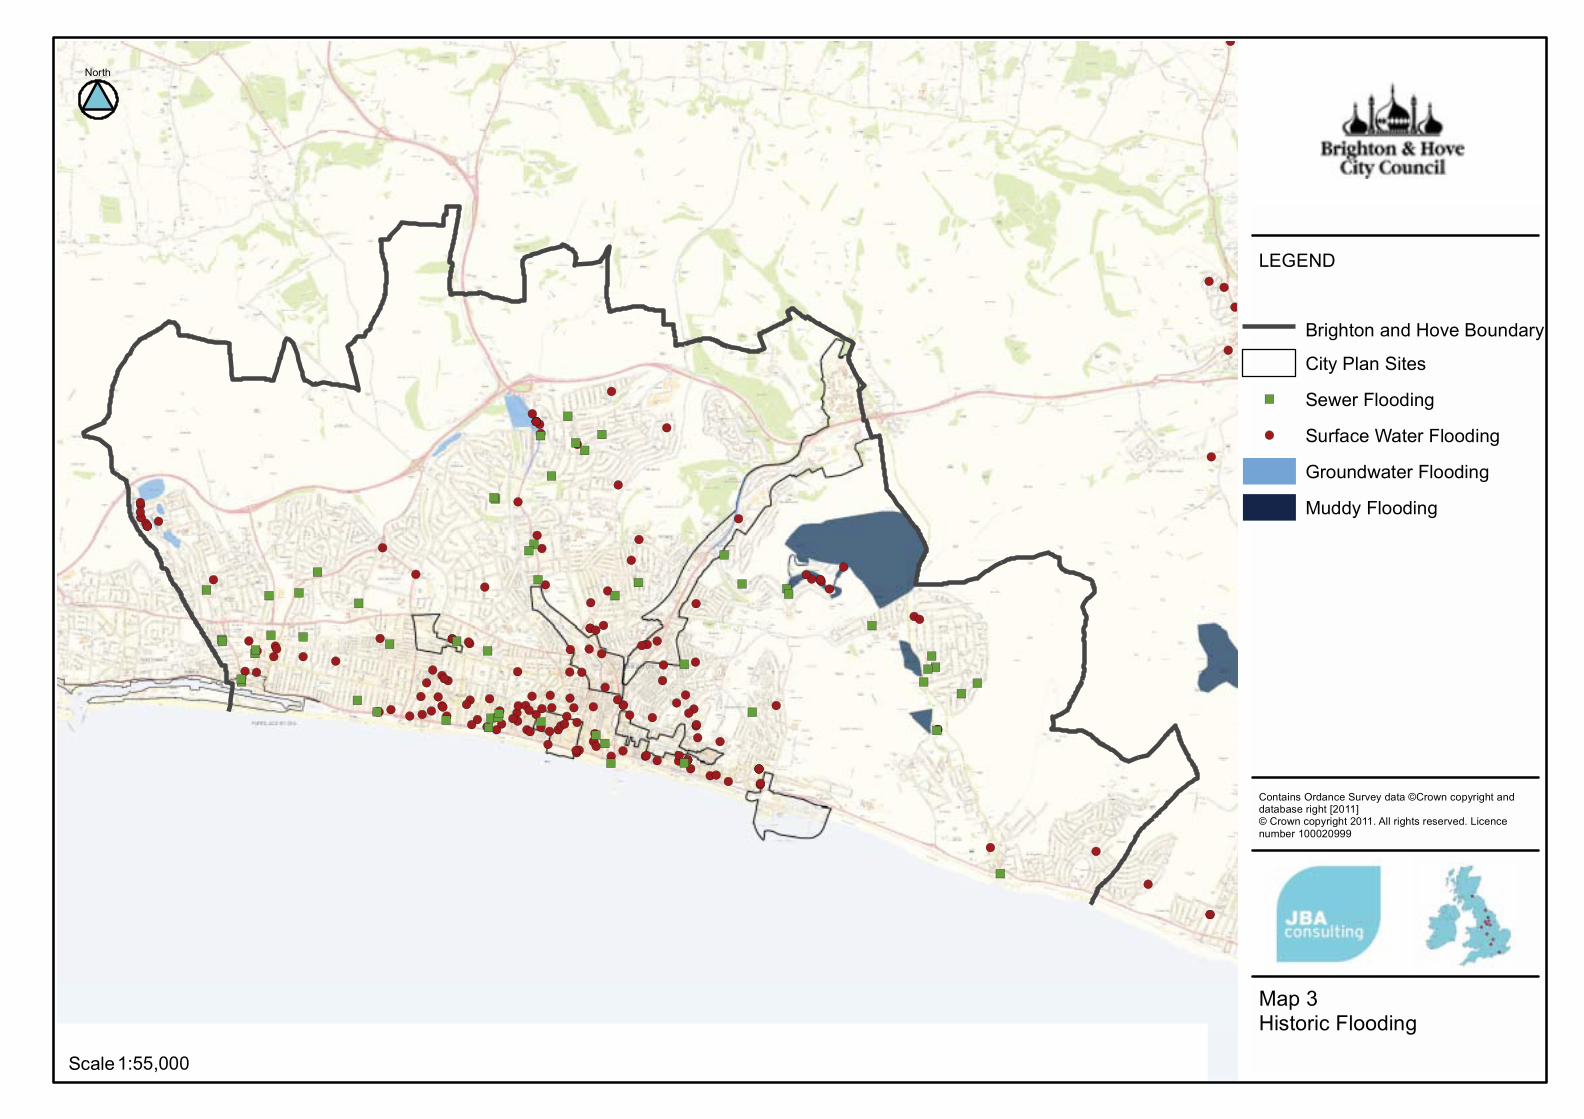
!(
!(
!(
!(
!(!(
!(
!(!(!(
!(
!(
!(
!(
!(
!(
!(
!(!( !(
!(
!(
!(
!(
!(
!(
!(
!(
!(
!(!(!(!(!(!(
!(
!(!(
!(
!(
!(
!(
!(
!(
!(
!(
!(
!(
!(
!(
!(
!(!(!(
!(
!(
!( !(
!(!(
!(
!(
!(!(
!(
!(
!(!(
!(!(
!(
!(
!(
!(
!(
!(
!(!(!(
!(
!(!(
!(
!(
!(!(
!(
!(
!(
!(!(
!(
!(
!(!(!(
!(!(
!(
!(
!(!(!(!(!(!(!(
!(
!(
!(
!(!(
!(
!(
!(
!(
!(
!(
!(
!(
!(
!(
!(!(
!(
!(
!(
!(
!(
!(
!(
!(
!(
!(
!(!(
!(
!(!(
!(
!(
!(
!(
!(
!(!(
!(
!( !(
!(
!(
!(
!(
!(!(
!(!(
!(
!(
!(
!(
!(
!(
!(
!( !(!(
!(
!(!(!(
!(
!(
!(
!(
!(
")
")
")
")
")
")
")
")
")
")
")
")
")
")
")
")
")
")
")
")
")
")
")
")")
")
")
") ")")
")
")
")")
")
")
")
")
")
")")
")
")
")
")
")
")")")
")
")
")
")
")
")")
Map 3Historic Flooding
LEGEND
Contains Ordance Survey data ©Crown copyright anddatabase right [2011]© Crown copyright 2011. All rights reserved. Licencenumber 100020999
Scale1:55,000
North
Brighton and Hove Boundary
City Plan Sites
") Sewer Flooding
!( Surface Water Flooding
Groundwater Flooding
Muddy Flooding

Map 4Tidal Flood Risk - FloodplainDelineation (Undefended)
LEGEND
Contains Ordance Survey data ©Crown copyright anddatabase right [2011]© Crown copyright 2011. All rights reserved. Licencenumber 100020999
Scale1:55,000
North
Brighton and Hove Boundary
City Plan Sites
Flood Zone 3b
Flood Zone 3a
Flood Zone 2
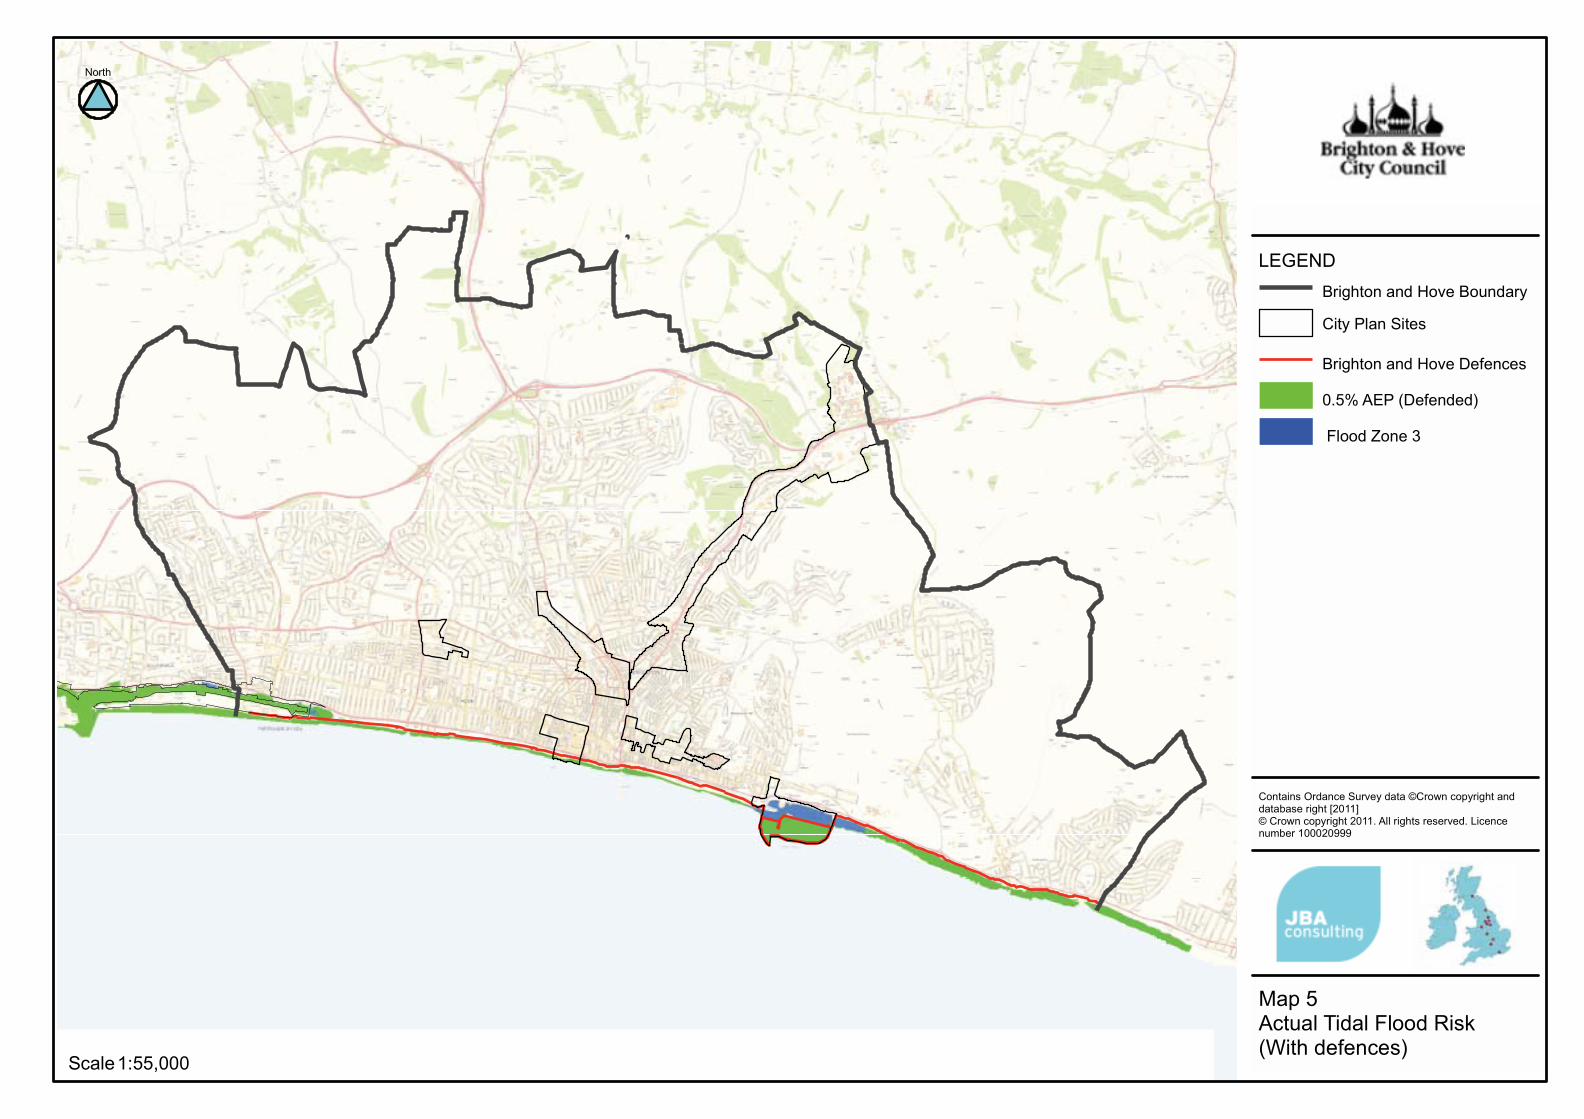
Map 5Actual Tidal Flood Risk(With defences)
LEGEND
Contains Ordance Survey data ©Crown copyright anddatabase right [2011]© Crown copyright 2011. All rights reserved. Licencenumber 100020999
Scale1:55,000
North
Brighton and Hove Boundary
City Plan Sites
Brighton and Hove Defences
0.5% AEP (Defended)
Flood Zone 3

Map 6Future Tidal Flood Risk (Withdefences)
LEGEND
Contains Ordance Survey data ©Crown copyright anddatabase right [2011]© Crown copyright 2011. All rights reserved. Licencenumber 100020999
North
Brighton and Hove Boundary
Brighton and Hove Defences
City Plan Sites
Present Day
Climate Change (2115)
Scale 1:55,000

Map 7Surface Water Flooding(Flood Map for Surface Water1 in 30 year)
LEGEND
Contains Ordance Survey data ©Crown copyright and databaseright [2011]
© Crown copyright 2011. All rights reserved. Licence number100020999
Scale1:55,000
North
Brighton and Hove boundary
City Plan Sites
Depth
> 0.3m
> 0.1m

Map 8Surface Water Flooding(Flood Map for Surface Water1 in 200 year)
LEGEND
Contains Ordance Survey data ©Crown copyright anddatabase right [2011]
© Crown copyright 2011. All rights reserved. Licence number100020999
Scale1:55,000
North
Brighton and Hove boundary
City Plan Sites
Depth
> 0.3m
> 0.1m

Map 9Surface Water Flood Risk(Areas Susceptible toSurface Water Flooding)
LEGEND
Contains Ordance Survey data ©Crown copyright anddatabase right [2011]
© Crown copyright 2011. All rights reserved. Licence number100020999
Scale1:55,000
North
Brighton and Hove boundary
City Plan Sites
AStSWF
More
Intermediate
Less
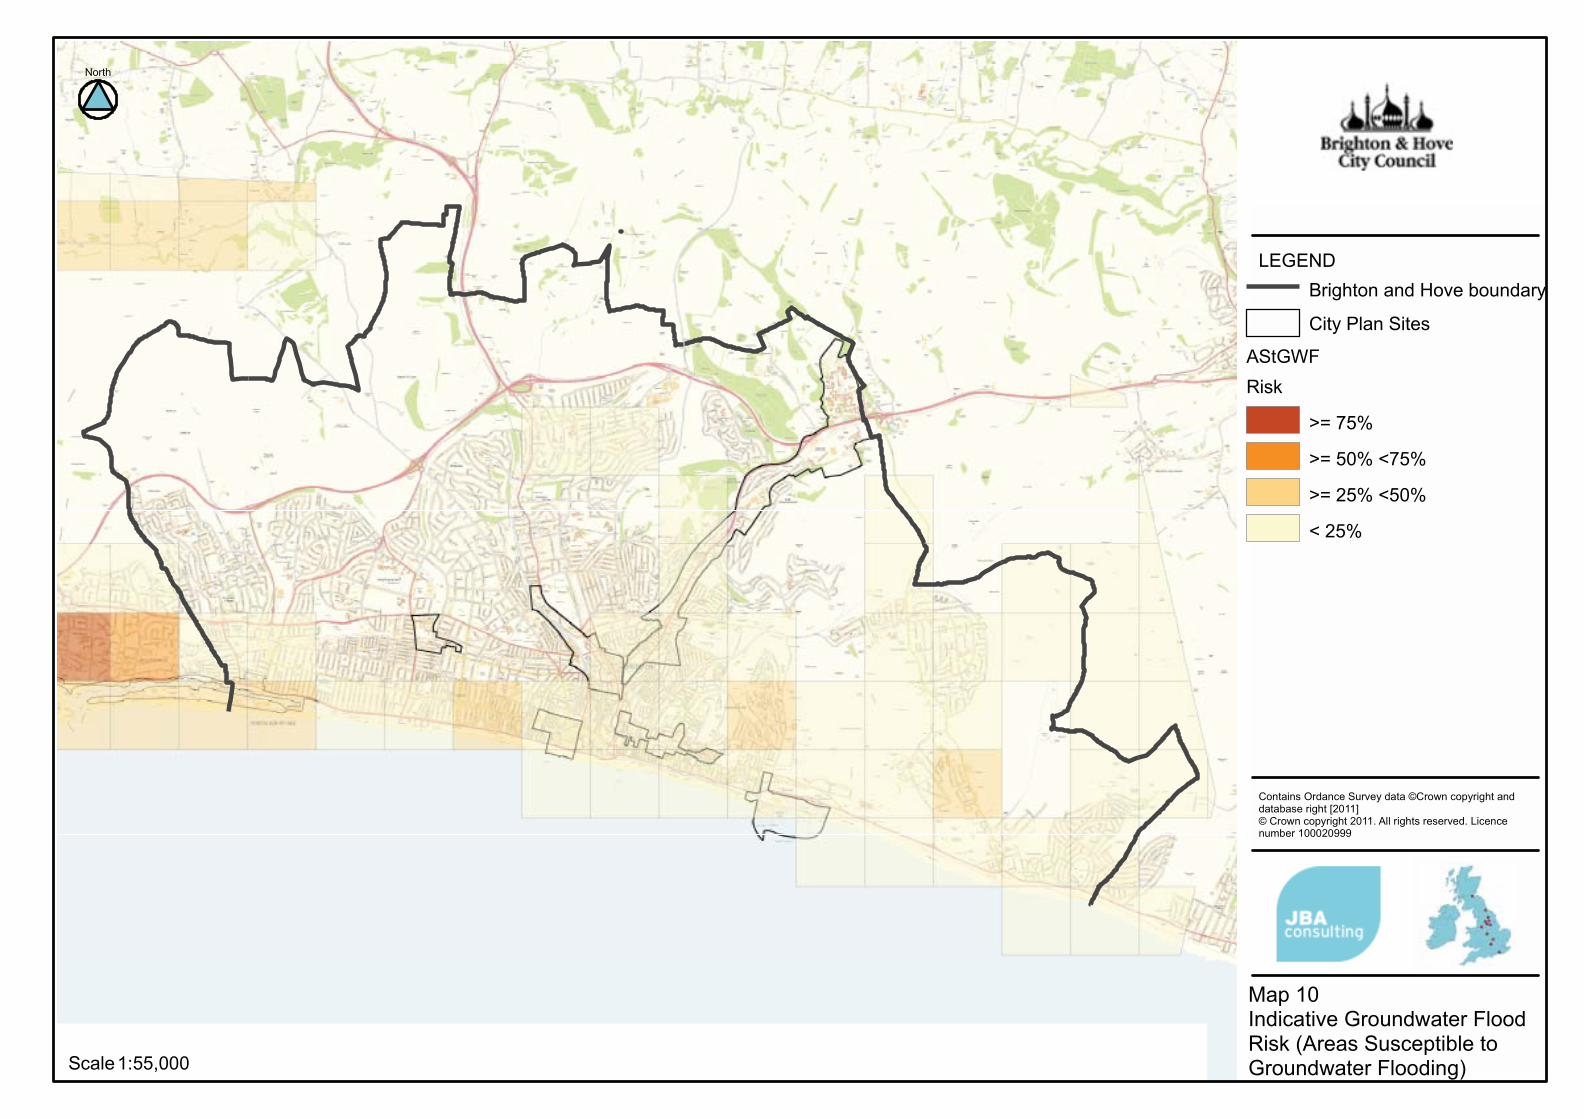
Map 10Indicative Groundwater FloodRisk (Areas Susceptible toGroundwater Flooding)
LEGEND
Contains Ordance Survey data ©Crown copyright anddatabase right [2011]© Crown copyright 2011. All rights reserved. Licencenumber 100020999
Scale1:55,000
North
Brighton and Hove boundary
City Plan Sites
AStGWFRisk
>= 75%
>= 50% <75%
>= 25% <50%
< 25%

2011s5199 B&H SFRA - Final Report (v2 Jan12).doc XIII
B City Plan site summary sheets

City Plan Site Flood Risk Assessment: summary and recommendationsSite Details
Site Name
Site Location (OS NGR) TQ305042
Site Area (ha) 30.6
Proposed use
Flood risk vulnerability classification (PPS25 Table D2):
Brown/Greenfield Brownfield
Flood Risk Flood Zones Comments
Flood Zone Type N/A No Tidal or Fluvial flood risk
Percentage of site in Flood Zone 3b 0%
Percentage of site in Flood Zone 3a 0%
Percentage of site in Flood Zone 2 0%
Percentage of site in Flood Zone 1 100%
Maintainer: Local Authority
Standard of Protection: Unknown
Surface water flooding
Susceptibility to surface water flooding
Flood map for surface water
Other sources of flood risk
Groundwater Flood Risk
Sewer Flood Risk
Residual risk:
Tidal Residual Risk
Effect of climate change:
Is a site specific Flood Risk Assessment required?
FRA required? YesAs the site is greater than 1 hectare proposed development would need an FRA to look at all sources of flooding and ensure flood risk is not increased elsewhere.
Exception test required for proposed use?
DA1 Brighton Centre and Churchill Square
Flood Defences
Sea Defences - managed shingle ridge and raised road/promenade
The SFRA (2008) mapped the extent of flooding for the 1 in 200 year event in 2115, by projecting the 2115 extreme sea level (5.465m) across the coastline. The mapped outputs produced showed the existing defences would not be overtopped in this area in the future. Climate change has not been assessed for surface water or groundwater as part of this SFRA. The future SWMP (due to be completed in 2115) will provide more information of future risks associated with surface water.
Retail, Hotel, Leisure
The site is shown to be less susceptible to surface water flooding for the 1 in 200 year (shallow depths). However for the 1 in 200 year event (deeper water) Regency Square is shown to be more susceptible to surface water flooding.
The site appears to be at low risk from surface water flooding, there are only a few small areas shown to be at risk during the 1 in 200 year event according to the FMfSW.
The site is underlain by the Newhaven Chalk Formation, and is within the EA's major aquifer high vulnerability zone. Consequently the area may be susceptible to groundwater emergence. However according to the EA groundwater susceptibility map, the site resides in a 1km square where the proportion of each 1 km square that is susceptible to groundwater flood emergence is less than a 25%. There are no reported incidents of groundwater flooding in the area.
From the PFRA (2011), Figure 4.1, sewer flooding is recorded in the Churchill Square area sometime after 2001 (according to Southern Water SIRF flooding records).
The site is located behind managed major sea defences. However the EA Flood Zones do not show the site being inundated. Flood zones represent the undefended situation and therefore highlight whether there would be a residual risk. A potential risk which has not been considered is wave overtopping, this is a significant source of flood risk along the south coastal frontage and any future development should investigate this potential risk.
As the site is located within Flood Zone 1 - the Exception Test will not be required.
More & Less Vulnerable

Recommendations for Development
Future development in the area is likely to be redevelopment. There is no fluvial or tidal risk associated with the site. However the area appears to be at risk from surface water flooding. Any future development should ensure that it would not increase the surface water flood risk elsewhere, to achieve this any existing flow paths would need to maintained. Surface water drainage techniques should be built into any new design to ensure the runoff rate does not increase and where possible steps should be taken (such as rainwater harvesting for water reuse or infiltration) to reduce the risk. If redevelopment is located in areas highlighted as being at risk of surface water flooding; steps should be taken to reduce the consequence of flooding, i.e. sequentially plan a development so resilient uses are placed on the ground floor, and the building is built with surface water flood risk in mind. The area is in a region of potential groundwater emergence, any subterranean development should ensure it would be resilient to groundwater flooding, and would not disrupt groundwater flow paths. There is also a potential risk from wave-overtopping, due to the positioning of the site on the coastal frontage. An assessment should be carried out on the impact of wave overtopping so that any future development can be designed with this in mind.

Brighton Centre and Churchill Square
!!!!!!!!!!!!!!!
!!!!!!!!!!!!!!!
!!!!!!!!!!!!!!!!!!!!!!!!!!!!!!!
!!
!!!!!!!!!!!!!!!!!!!!!!!!!!!!!!!!
!!!!!!!!!!!!!!!!!!!!!!!!!!!!!!!!!!!!!!!!!!!!!!!!!!!!!!!!!!!!!!!!!!!!!
!!!!!!!!!
!!!!
!!!!!!!!!!!!!!!!!!!!
!!!!!!!!!!!!!!!!!!!!!!!!!!!!!!!!!!!!!!!!!!!!!!!!!!!!!!!!!!!!!!!!!!!!!!!!!!!!!!!!!!!!!!
!!!!!!!!!!!!!!!!!!!
!!!!!!
!!!!!!!!!!!!!!!!!!!!!!!!!!!!!!!!!!!!!!
!!!!!!!!!!!!!!
City Plan SitesDA1, Brighton Centre and Churchill Square
! ! ! ! ! ! DefencesFlood Zone 3b Flood Zone 3 Flood Zone 2
Brighton and Hove SFRA update
Tidal Flood Risk (Floodplain Delineation - Undefended)
0 1,100550Metres
© Crown copyright 2011. All rights reserved. Licence number 100020999Contains Ordance Survey data ©Crown copyright and database right [2011]
City Plan Site Flood Risk Summary Map
North
Legend

Brighton Centre and Churchill Square City Plan Sites
DA1, Brighton Centre and Churchill SquareDepth
> 0.3m> 0.1m
Brighton and Hove SFRA update
Surface Water Flood Risk (Flood Map for Surface Water
1 in 30 year)
0 1,100550Metres
© Crown copyright 2011. All rights reserved. Licence number 100020999Contains Ordance Survey data ©Crown copyright and database right [2011]
City Plan Site Flood Risk Summary Map
North
Legend

Brighton Centre and Churchill Square City Plan Sites
DA1, Brighton Centre and Churchill SquareDepth
> 0.3m> 0.1m
Brighton and Hove SFRA update
Surface Water Flood Risk (Flood Map for Surface Water
1 in 200 year)
0 1,100550Metres
© Crown copyright 2011. All rights reserved. Licence number 100020999Contains Ordance Survey data ©Crown copyright and database right [2011]
City Plan Site Flood Risk Summary Map
North
Legend

Brighton Centre and Churchill Square City Plan Sites
DA1, Brighton Centre and Churchill SquareAreas Susceptible to Groundwater Flooding
>= 75%>= 50% <75%>= 25% <50%< 25%
Brighton and Hove SFRA update
Groundwater Flood Risk (Areas Susceptible to Groundwater Flooding)
0 1,100550Metres
© Crown copyright 2011. All rights reserved. Licence number 100020999Contains Ordance Survey data ©Crown copyright and database right [2011]
City Plan Site Flood Risk Summary Map
North
Legend

Brighton Centre and Churchill Square
!(
!(
!(
!(
!(
!(
!(
!(
!(
!(
!(
!(
!(
!(
!(
!(
!(
!(
!(
!(
!(
!(
!(
!(
!(
!(
!(
!(
!(
!(
!(
!(!(
!(
!(
!(
!(
!(
!(!(
")
")
")
")
")
")
City Plan SitesDA1, Brighton Centre and Churchill Square
") Sewer Flooding!( Surface Water Flooding
Groundwater FloodingMuddy Flooding
Brighton and Hove SFRA update
Historic Flooding
0 1,100550Metres
© Crown copyright 2011. All rights reserved. Licence number 100020999Contains Ordance Survey data ©Crown copyright and database right [2011]
City Plan Site Flood Risk Summary Map
North
Legend
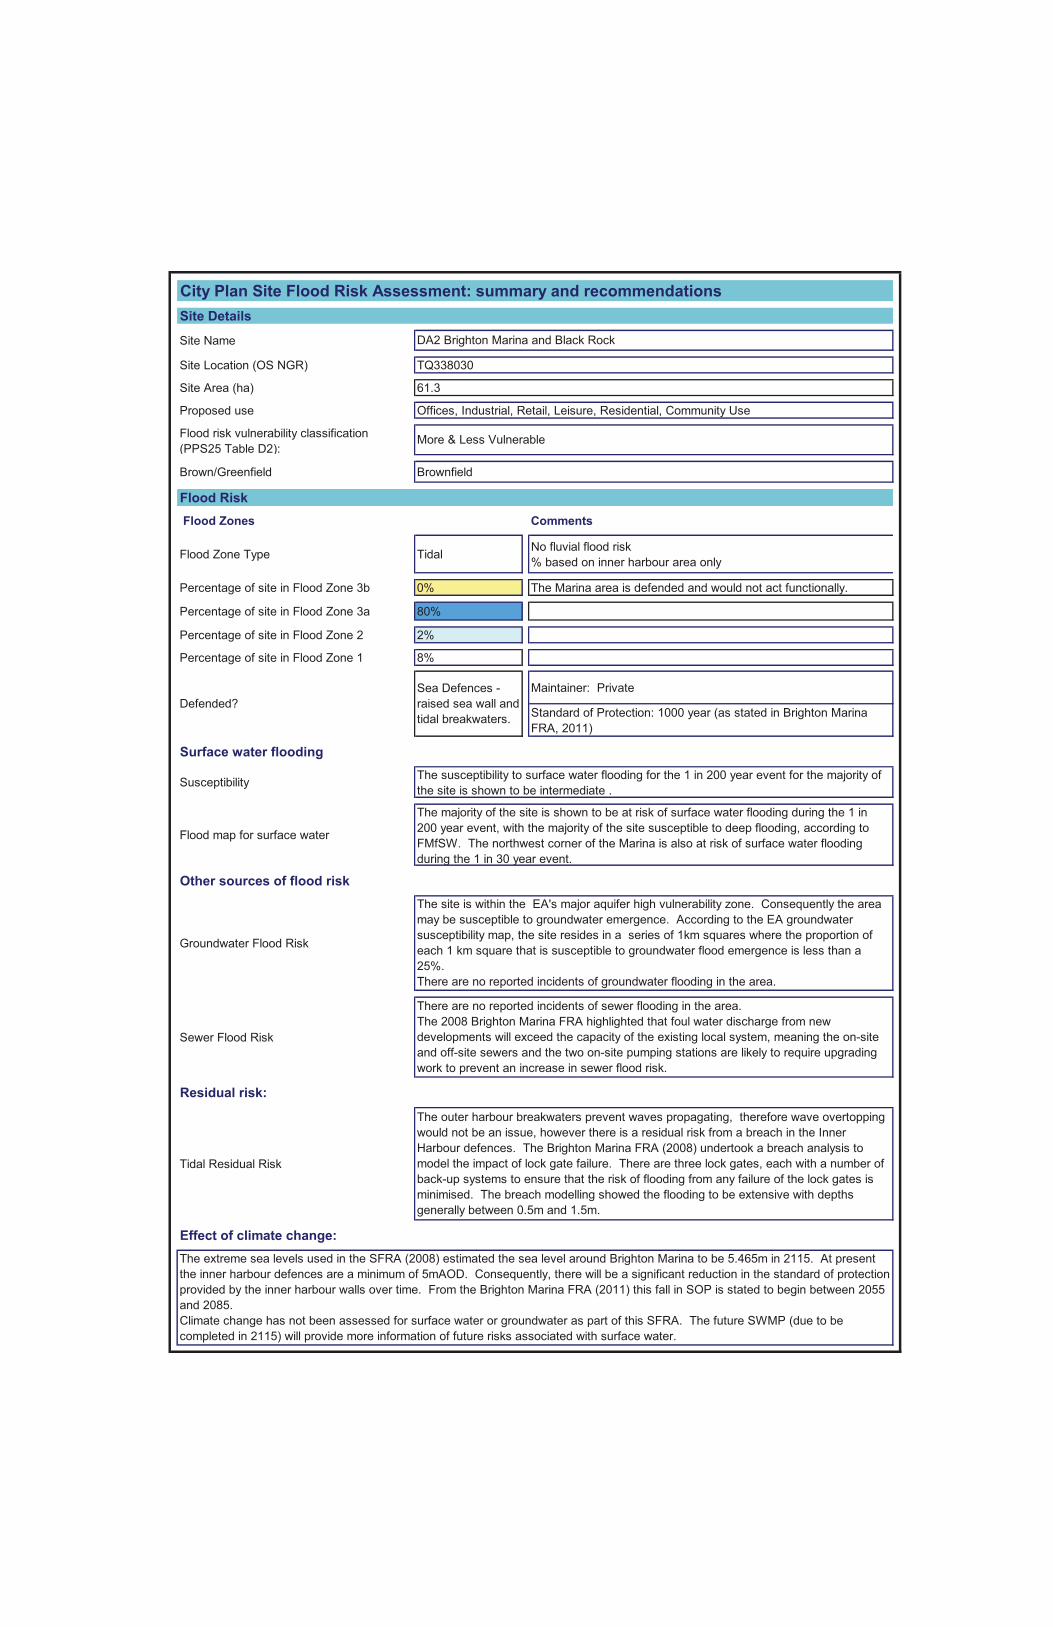
City Plan Site Flood Risk Assessment: summary and recommendationsSite Details
Site Name
Site Location (OS NGR) TQ338030
Site Area (ha) 61.3
Proposed use
Flood risk vulnerability classification (PPS25 Table D2):
Brown/Greenfield Brownfield
Flood Risk Flood Zones Comments
Flood Zone Type Tidal No fluvial flood risk% based on inner harbour area only
Percentage of site in Flood Zone 3b 0% The Marina area is defended and would not act functionally.
Percentage of site in Flood Zone 3a 80%
Percentage of site in Flood Zone 2 2%
Percentage of site in Flood Zone 1 8%
Maintainer: Private
Standard of Protection: 1000 year (as stated in Brighton Marina FRA, 2011)
Surface water flooding
Susceptibility
Flood map for surface water
Other sources of flood risk
Groundwater Flood Risk
Sewer Flood Risk
Residual risk:
Tidal Residual Risk
Effect of climate change:
Offices, Industrial, Retail, Leisure, Residential, Community Use
More & Less Vulnerable
DA2 Brighton Marina and Black Rock
Defended?Sea Defences - raised sea wall and tidal breakwaters.
The susceptibility to surface water flooding for the 1 in 200 year event for the majority of the site is shown to be intermediate .
The majority of the site is shown to be at risk of surface water flooding during the 1 in 200 year event, with the majority of the site susceptible to deep flooding, according to FMfSW. The northwest corner of the Marina is also at risk of surface water flooding during the 1 in 30 year event.
The site is within the EA's major aquifer high vulnerability zone. Consequently the area may be susceptible to groundwater emergence. According to the EA groundwater susceptibility map, the site resides in a series of 1km squares where the proportion of each 1 km square that is susceptible to groundwater flood emergence is less than a 25%. There are no reported incidents of groundwater flooding in the area.
There are no reported incidents of sewer flooding in the area.The 2008 Brighton Marina FRA highlighted that foul water discharge from new developments will exceed the capacity of the existing local system, meaning the on-site and off-site sewers and the two on-site pumping stations are likely to require upgrading work to prevent an increase in sewer flood risk.
The outer harbour breakwaters prevent waves propagating, therefore wave overtopping would not be an issue, however there is a residual risk from a breach in the Inner Harbour defences. The Brighton Marina FRA (2008) undertook a breach analysis to model the impact of lock gate failure. There are three lock gates, each with a number of back-up systems to ensure that the risk of flooding from any failure of the lock gates is minimised. The breach modelling showed the flooding to be extensive with depths generally between 0.5m and 1.5m.
The extreme sea levels used in the SFRA (2008) estimated the sea level around Brighton Marina to be 5.465m in 2115. At present the inner harbour defences are a minimum of 5mAOD. Consequently, there will be a significant reduction in the standard of protection provided by the inner harbour walls over time. From the Brighton Marina FRA (2011) this fall in SOP is stated to begin between 2055 and 2085.Climate change has not been assessed for surface water or groundwater as part of this SFRA. The future SWMP (due to be completed in 2115) will provide more information of future risks associated with surface water.

Is a site specific Flood Risk Assessment required?
FRA required? YesAs the site is within Flood Zone 3a, proposed development would need an FRA to look at all sources of flooding and ensure flood risk is not increased elsewhere.
Exception test required for proposed use? YesThe majority of the site is within Flood Zone 3a. The Exception Test would need to be met for more vulnerable development within the site. Notably demonstrate that the development is 'safe'.
Recommendations for Development
Future development of Brighton Marina should be mindful of the various sources of flood risk, and where possible implement sequential design throughout the site to try to reduce flood risk within the development. Reference should also be made to the two existing detailed FRAs produced for Brighton Marina (2008,2011)In the future the existing defence SOP will reduce, therefore defences should be maintained and improved where necessary to ensure the SOP is sufficient for the lifetime of the development.To reduce the risk of inundation within the any proposed development, finished floor levels should be raised 300mm above the 1 in 200 year event plus climate change (up to year to be decided - generally lifetime of development) breach level. It should be established whether the breach analysis in the existing Brighton Marina FRA is the worst case position for proposed development.There are known capacity issues within the sewer network, and an upgrade to the infrastructure will be required to allow new development to be built without increasing the sewer flood risk.The site is at risk of surface water flooding, therefore steps should be taken to reduce the consequence of flooding, i.e. sequentially plan a development so resilient uses are placed on the ground flood. Any future development should ensure that it would not increase the surface water flood risk elsewhere, to achieve this any existing flow paths would need to maintained. Surface water drainage techniques should be built into any new design to ensure the runoff rate does not increase and where possible steps should be taken (such as rainwater harvesting for water reuse or infiltration) to reduce the risk.

Brighton Marina and Black Rock
!!
!!!
!!!
!!
!!!
!!
!!!
!!
!!!
!!
!!!
!!
!
!!
!!
!!
!!
!!
!!
!!
!!
!!
!!
!!
!!
!!
!!
!
!!
!!
!!
!!
!!
!!
!!
!!
!!
!!
!!
!!
!!
!!
!!
!!
!!
!!!!!!
!!
!!
!!
!!
!
!!
!
!!!!!!!!!!!!!!!!!!!!!!!!!!!
!!
!!
!!
!!
!!
!!
!!
!!
!!
!
!!!!!!!!!!!!!!!!!!!!!!!!!!!!!!!!!!!!
!!!!!!
!!!!!!
!!
!!
!!
!!
!!
!!
!!
!!
!!
!!
!!
!!
!!
!!
!!
!!
!!
!!
!!
!!
!!
!!
!!
!!
!!
!!
!!
!!
!!
!!
!!
!!
!!
!!
!!
!!
!!
!!
!!
!!
!!
!!
!!
!!
!!
!!
!!
!!
!!
!!
!!
!!
!!
!!
!!
!!
!!
!!
!!
!!
!!
!!
!!
!!
!!
!!
!!
!!
!!
!!
!!
!!
!!!
!!!!
!!!!
!!
!!
!!
!!
!!
!!
!!
!!
!!
!!
!!
!!
!!
!!
!!
!!
!!
!!
!!
!!
!!
!!
!!
!!
!!
!!
!!
!!
!!
!!
!!
!!
!!
!!
!!
!!
!!
!!
!!
!!
!!
!!
!!
!!
!!
!!
!!
!!
!!
!!
!!
!!
!!
!!
!!
!!
!!
!!
!!
!!
!!
!!
!!
!!
!!
!!!
!!
!!
!!
!!
!!
!!
!!
!!!!!!
!!!!!!!!!!!!!!!!!!!!!!!!!!!!!!!!!!!!!!!!!!!!!!!!!!!!!!!!!!!!!!!!!!!!!!
!!
!!
!!
!!
!!
!!
!!
!!
!!!!!!!!!!!!!!!!!!
! ! ! ! ! ! ! ! ! ! ! ! ! ! ! ! !!
!!
!!
!!
!!
!!
!!
!!
! ! ! ! ! ! ! ! ! ! ! ! ! ! ! ! ! ! ! ! ! ! ! ! ! ! ! ! ! ! ! ! ! ! ! ! ! ! ! ! ! ! ! ! ! ! ! ! ! ! ! ! ! ! ! ! ! ! ! ! ! ! ! ! ! ! ! ! ! !!
!!
!!
!!
!!
!!
!!
!!
!!
!
!!
!!
!!
!!
!!
!!
!!
!!
!!
!!
!!
!!
!!
!!
!!
!!
!!
!!
!!
!!!
!!
!!!!!
!!
!!
!!
!!
!!
!!!!!
!!
!!
!!!!!
!!
!!!!
!
!!!!!!!!!!!!!!!!!!!!!!!!!!!!!!!!!!!!!!!!!!!!!!!!!!!!!!!!!!!!!!!!!!!!!!!!!!!!!!!!!!!!!!!!!!!!!!!!!
!!!
!
!!
!!
!!!
!!
!!
!!
!!
!!
!!
!!
!!
!!
!!
!!!
!!
!!
!!
!!
!!
!
!!
!!
!!
!!
!!
!!
!!
!!
!!
!!
!!
!!
!
City Plan SitesDA2, Brighton Marina and Black Rock
! ! ! ! ! ! ! ! ! DefencesFlood Zone 3b Flood Zone 3a Flood Zone 2
Brighton and Hove SFRA update
Tidal Flood Risk (Floodplain Delineation - Undefended)
0 1,100550Metres
© Crown copyright 2011. All rights reserved. Licence number 100020999Contains Ordance Survey data ©Crown copyright and database right [2011]
City Plan Site Flood Risk Summary Map
North
Legend

Brighton Marina and Black Rock
City Plan SitesDA2, Brighton Marina and Black Rock
Depth> 0.3m> 0.1m
Brighton and Hove SFRA update
Surface Water Flood Risk (Flood Map for Surface Water
1 in 30 year)
0 1,100550Metres
© Crown copyright 2011. All rights reserved. Licence number 100020999Contains Ordance Survey data ©Crown copyright and database right [2011]
City Plan Site Flood Risk Summary Map
North
Legend

Brighton Marina and Black Rock
City Plan SitesDA2, Brighton Marina and Black Rock
Depth> 0.3m> 0.1m
Brighton and Hove SFRA update
Surface Water Flood Risk (Flood Map for Surface Water
1 in 200 year)
0 1,100550Metres
© Crown copyright 2011. All rights reserved. Licence number 100020999Contains Ordance Survey data ©Crown copyright and database right [2011]
City Plan Site Flood Risk Summary Map
North
Legend

Brighton Marina and Black RockCity Plan Sites
DA2, Brighton Marina and Black RockAreas Susceptible to Groundwater Flooding
>= 75%>= 50% <75%>= 25% <50%< 25%
Brighton and Hove SFRA update
Groundwater Flood Risk (Areas Susceptible to
Groundwater Flooding)
0 1,100550Metres
© Crown copyright 2011. All rights reserved. Licence number 100020999Contains Ordance Survey data ©Crown copyright and database right [2011]
City Plan Site Flood Risk Summary Map
North
Legend

City Plan Site Flood Risk Assessment: summary and recommendationsSite Details
Site Name
Site Location (OS NGR) TQ335076
Site Area (ha) 248.8
Proposed use
Flood risk vulnerability classification (PPS25 Table D2):
Brown/Greenfield Brownfield
Flood Risk Flood Zones Comments
Flood Zone Type N/A No Tidal or Fluvial flood risk
Percentage of site in Flood Zone 3b 0%
Percentage of site in Flood Zone 3a 0%
Percentage of site in Flood Zone 2 0%
Percentage of site in Flood Zone 1 100%
Maintainer: N/AStandard of Protection: N/A
Surface water flooding
Susceptibility
Flood map for surface water
Other sources of flood risk
Groundwater Flood Risk
Sewer Flood Risk
Effect of climate change:
Is a site specific Flood Risk Assessment required?
FRA required? YesAs the site is greater than 1 hectare proposed development would need an FRA to look at all sources of flooding and ensure flood risk is not increased elsewhere.
Exception test required for proposed use?
Recommendations for Development
Offices, Leisure, Residential, Community Use, University Expansion
More & Less Vulnerable
DA3 Lewes Road
Defended? N/A
Future development in the area is likely to be redevelopment. There is no fluvial or tidal risk associated with the site. However the area appears to be at risk from surface water flooding. Any future development should ensure that it would not increase the surface water flood risk elsewhere, to achieve this any existing flow paths would need to maintained. Surface water drainage techniques should be built into any new design to ensure the runoff rate does not increase and where possible steps should be taken (such as rainwater harvesting for water reuse or infiltration) to reduce the risk. If redevelopment is in areas highlighted as being at risk of surface water flooding steps should be taken to reduce the consequence of flooding, i.e. sequentially plan a development so resilient uses are placed on the ground flood, and the building is built with surface water flood risk in mind. The area is in a region of potential groundwater emergence, any subterranean development should ensure it would be resilient to groundwater flooding, and would not disrupt groundwater flow paths.
The site is shown to be more susceptible to surface water flooding for the 1 in 200 year event (deeper water) especially along the Lewes Road.
The site is at risk of surface water flooding in both 1 in 30 year and 1 in 200 year events according to FMfSW.There is a major surface water flow path present, this mostly coincides with the A270 Lewes Road. The majority of small local streets adjacent to Lewes Road are shown to be at risk, and there appears to be a significant area of ponding to the north of 'The Level' around Trinity Street, Brewer Street and Park Crescent Place.
The site is underlain by various Chalk Formations, and is within the EA's major aquifer high vulnerability zone. Consequently the area may be susceptible to groundwater emergence. However according to the EA groundwater susceptibility map, only half of the site resides in a 1km square where the proportion of each 1 km square that is susceptible to groundwater flood emergence is less than a 25%. There are no reported incidents of groundwater flooding in the area.
As the site is located within Flood Zone 1 - the Exception Test will not need be required.
From the PFRA (2011), Figure 4.1, sewer flooding is shown to have been experienced in the Lewes Road area around Moulsecoomb, however there were no recorded incidents in the area in the Southern Water SIRF Flooding Records.
Climate change has not been assessed for surface water or groundwater as part of this SFRA. The future SWMP (due to be completed in 2115) will provide more information of future risks associated with surface water.

Lewes RoadCity Plan Sites
DA3, Lewes RoadDepth
> 0.3m> 0.1m
Brighton and Hove SFRA update
Surface Water Flood Risk(Flood Map for Surface Water
1 in 30 year)
0 2,5001,250Metres
© Crown copyright 2011. All rights reserved. Licence number 100020999Contains Ordance Survey data ©Crown copyright and database right [2011]
City Plan Site Flood Risk Summary Map
North
Legend

Lewes RoadCity Plan Sites
DA3, Lewes RoadDepth
> 0.3m> 0.1m
Brighton and Hove SFRA update
Surface Water Flood Risk(Flood Map for Surface Water
1 in 200 year)
0 2,5001,250Metres
© Crown copyright 2011. All rights reserved. Licence number 100020999Contains Ordance Survey data ©Crown copyright and database right [2011]
City Plan Site Flood Risk Summary Map
North
Legend

Lewes RoadCity Plan SitesDA3, Lewes Road
Areas Susceptible to Groundwater Flooding>= 75%>= 50% <75%>= 25% <50%< 25%
Brighton and Hove SFRA update
Groundwater Flood Risk(Areas Susceptible to Groundwater Flooding)
0 2,5001,250Metres
© Crown copyright 2011. All rights reserved. Licence number 100020999Contains Ordance Survey data ©Crown copyright and database right [2011]
City Plan Site Flood Risk Summary Map
North
Legend
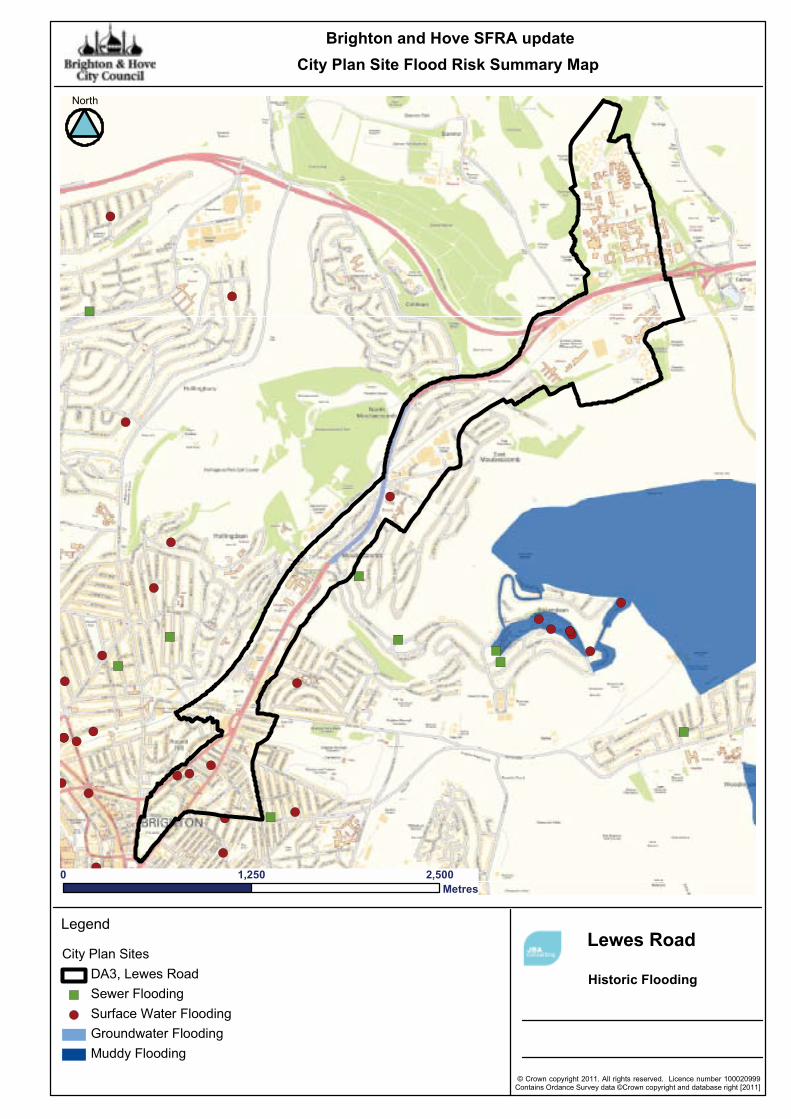
Lewes Road
!(
!(
!(
!(
!(
!(
!(
!(
!(
!(
!(
!(!(
!(
!(!(
!(
!(!(
!(
!(
!(
!(
!(
!(
!(
!(
!(
!(
!(
!(
")
")
")
")
")
")
")
")
")
City Plan SitesDA3, Lewes Road
") Sewer Flooding!( Surface Water Flooding
Groundwater FloodingMuddy Flooding
Brighton and Hove SFRA update
Historic Flooding
0 2,5001,250Metres
© Crown copyright 2011. All rights reserved. Licence number 100020999Contains Ordance Survey data ©Crown copyright and database right [2011]
City Plan Site Flood Risk Summary Map
North
Legend

City Plan Site Flood Risk Assessment: summary and recommendationsSite Details
Site Name
Site Location (OS NGR) TQ308054
Site Area (ha) 64.9
Proposed use
Flood risk vulnerability classification (PPS25 Table D2):
Brown/Greenfield Brownfield
Flood Risk Flood Zones Comments
Flood Zone Type N/A No Tidal or Fluvial flood risk
Percentage of site in Flood Zone 3b 0%
Percentage of site in Flood Zone 3a 0%
Percentage of site in Flood Zone 2 0%
Percentage of site in Flood Zone 1 100%
Maintainer: N/AStandard of Protection: N/A
Surface water flooding
Susceptibility
Flood map for surface water
Other sources of flood risk
Groundwater Flood Risk
Sewer Flood Risk
Effect of climate change:
Is a site specific Flood Risk Assessment required?
FRA required? YesAs the site is greater than 1 hectare proposed development would need an FRA to look at all sources of flooding and ensure flood risk is not increased elsewhere.
Exception test required for proposed use?
Recommendations for Development
DA4 New England Quarter and London Road
Defended? N/A
Climate change has not been assessed for surface water or groundwater as part of this SFRA. The future SWMP (due to be completed in 2115) will provide more information of future risks associated with surface water.
Future development in the area is likely to be redevelopment. There is no fluvial or tidal risk associated with the site. However, the area appears to be at risk from surface water flooding. Any future development should ensure that it would not increase the surface water flood risk elsewhere, to achieve this any existing flow paths would need to maintained. Surface water drainage techniques should be built into any new design to ensure the runoff rate does not increase and where possible steps should be taken (such as rainwater harvesting for water reuse or infiltration) to reduce the risk. If redevelopment is located in areas highlighted as being at risk of surface water flooding, steps should be taken to reduce the consequence of flooding, i.e. sequentially plan a development so resilient uses are placed on the ground flood, and the building is built with surface water flood risk in mind. The area is in a region of potential groundwater emergence, any subterranean development should ensure it would be resilient to groundwater flooding, and would not disrupt groundwater flow paths.
The eastern edge of the site, along the A23 London Road and adjacent local streets (including Elder Road, Campbell Road, Oxford Place, Francis Street) are shown to be more susceptible to surface water flooding during the 1 in 200 year event (deeper water). The station, depot and railway track area is in the category of the less susceptible (shallow water). The rest of the site is not susceptible to surface water flooding.
Parts of the site are at risk of surface water flooding in both the 1 in 30 year and the 1 in 200 year events according to FMfSW.The major surface water flow path mostly coincides with the A23 London Road. The majority of small local streets adjacent to London Road are also shown to be at risk, with deep flooding during the 1 in 200 year event shown to be affecting some streets including Oxford Street, Oxford Place, Francis Street, Baker Street and part of Rose Hill Terrace.
Offices, Residential, Community Use, Other
The site is underlain by the Newhaven Chalk Formation, and is within the EA's major aquifer high vulnerability zone. Consequently the area may be susceptible to groundwater emergence. However according to the EA groundwater susceptibility map, half the site resides in a 1km square where the proportion of each 1 km square that is susceptible to groundwater flood emergence is less than a 25%. There are no reported incidents of groundwater flooding in the area.
There are no reported incidents of sewer flooding in the area.
As the site is located within Flood Zone 1 - the Exception Test will not need be required.
More & Less Vulnerable

New England Quarter and London RoadCity Plan Sites
DA4, New England Quarter and London RoadDepth
> 0.3m> 0.1m
Brighton and Hove SFRA update
Surface Water Flood Risk(Flood Map for Surface Water
1 in 30 year)
0 1,100550Metres
© Crown copyright 2011. All rights reserved. Licence number 100020999Contains Ordance Survey data ©Crown copyright and database right [2011]
City Plan Site Flood Risk Summary Map
North
Legend
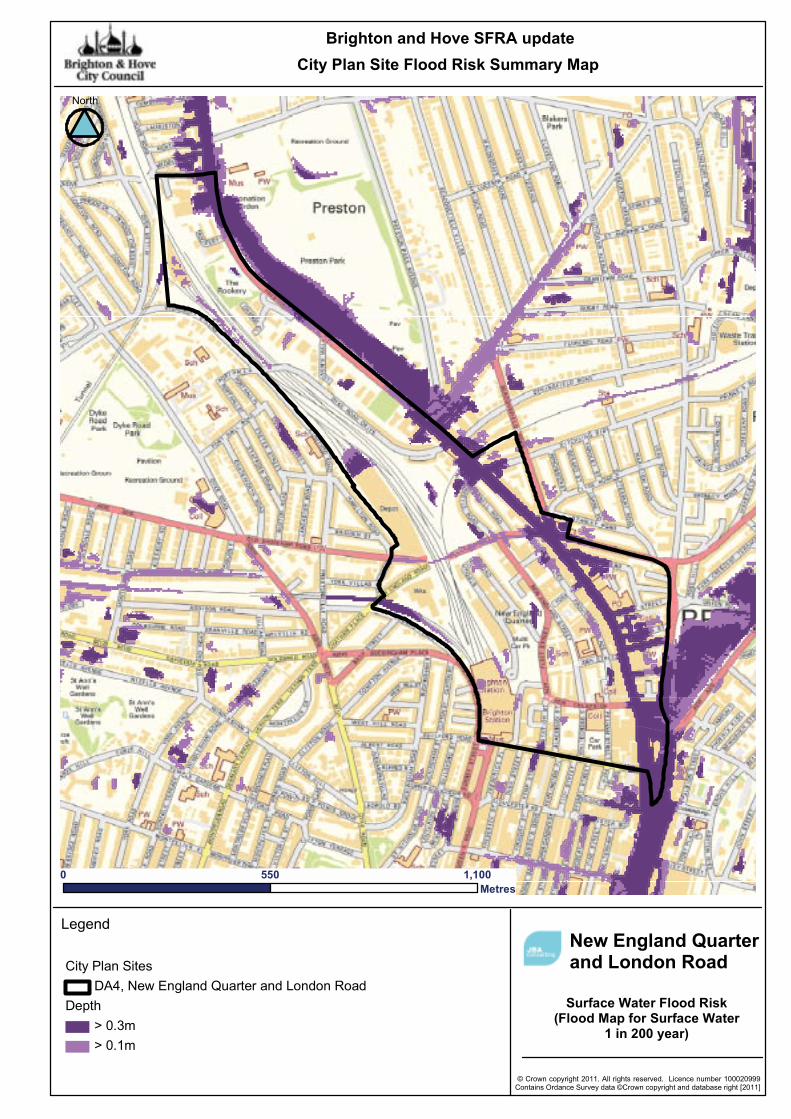
New England Quarter and London RoadCity Plan Sites
DA4, New England Quarter and London RoadDepth
> 0.3m> 0.1m
Brighton and Hove SFRA update
Surface Water Flood Risk(Flood Map for Surface Water
1 in 200 year)
0 1,100550Metres
© Crown copyright 2011. All rights reserved. Licence number 100020999Contains Ordance Survey data ©Crown copyright and database right [2011]
City Plan Site Flood Risk Summary Map
North
Legend

New England Quarter and London RoadCity Plan Sites
DA4, New England Quarter and London RoadAreas Susceptible to Groundwater Flooding
>= 75%>= 50% <75%>= 25% <50%< 25%
Brighton and Hove SFRA update
Groundwater Flood Risk(Areas Susceptible to Groundwater Flooding)
0 1,100550Metres
© Crown copyright 2011. All rights reserved. Licence number 100020999Contains Ordance Survey data ©Crown copyright and database right [2011]
City Plan Site Flood Risk Summary Map
North
Legend

New England Quarter and London Road
!(
!( !(
!(
!(
!(
!(
!(
!(!(!(
!(
!(
!(
!(
!(
!(
!(
!(
!(
!(
!(
!(
!(
!(
!(
!(
!(
!(
!(
!(
")
")
")
City Plan SitesDA4, New England Quarter and London Road
") Sewer Flooding!( Surface Water Flooding
Groundwater FloodingMuddy Flooding
Brighton and Hove SFRA update
Historic Flooding
0 1,100550Metres
© Crown copyright 2011. All rights reserved. Licence number 100020999Contains Ordance Survey data ©Crown copyright and database right [2011]
City Plan Site Flood Risk Summary Map
North
Legend
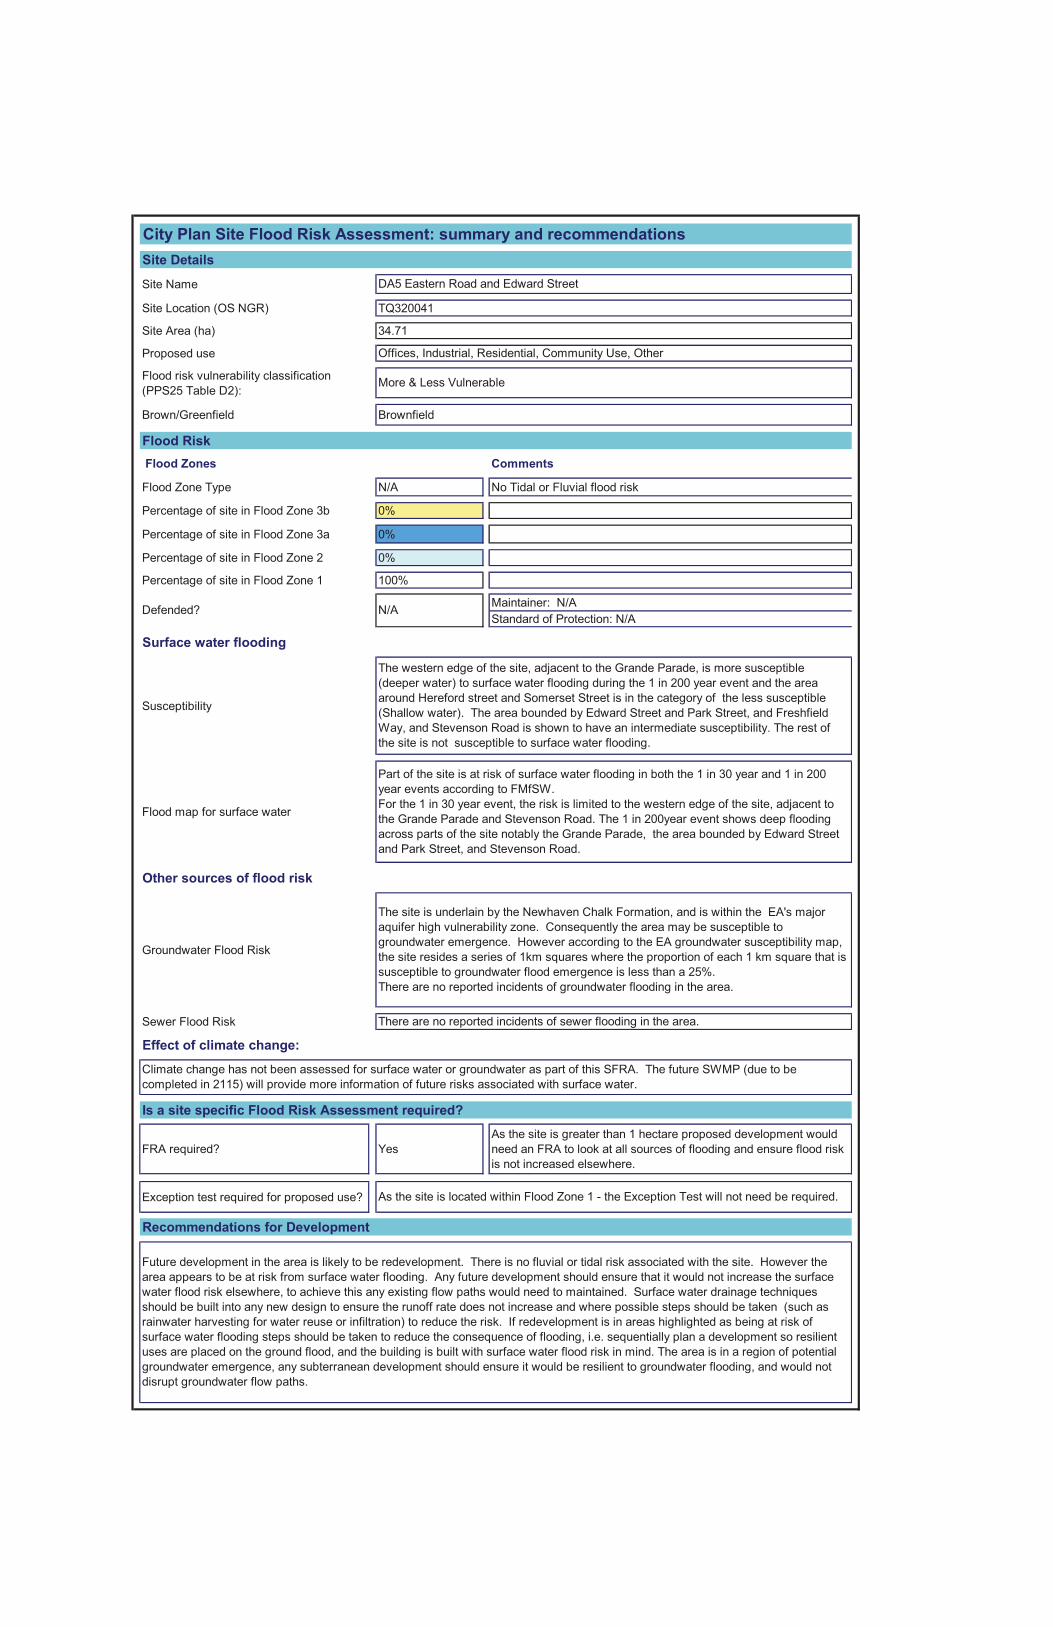
City Plan Site Flood Risk Assessment: summary and recommendationsSite Details
Site Name
Site Location (OS NGR) TQ320041
Site Area (ha) 34.71
Proposed use
Flood risk vulnerability classification (PPS25 Table D2):
Brown/Greenfield Brownfield
Flood Risk Flood Zones Comments
Flood Zone Type N/A No Tidal or Fluvial flood risk
Percentage of site in Flood Zone 3b 0%
Percentage of site in Flood Zone 3a 0%
Percentage of site in Flood Zone 2 0%
Percentage of site in Flood Zone 1 100%
Maintainer: N/AStandard of Protection: N/A
Surface water flooding
Susceptibility
Flood map for surface water
Other sources of flood risk
Groundwater Flood Risk
Sewer Flood Risk
Effect of climate change:
Is a site specific Flood Risk Assessment required?
FRA required? YesAs the site is greater than 1 hectare proposed development would need an FRA to look at all sources of flooding and ensure flood risk is not increased elsewhere.
Exception test required for proposed use?
Recommendations for Development
Offices, Industrial, Residential, Community Use, Other
More & Less Vulnerable
DA5 Eastern Road and Edward Street
Defended? N/A
Future development in the area is likely to be redevelopment. There is no fluvial or tidal risk associated with the site. However the area appears to be at risk from surface water flooding. Any future development should ensure that it would not increase the surface water flood risk elsewhere, to achieve this any existing flow paths would need to maintained. Surface water drainage techniques should be built into any new design to ensure the runoff rate does not increase and where possible steps should be taken (such as rainwater harvesting for water reuse or infiltration) to reduce the risk. If redevelopment is in areas highlighted as being at risk of surface water flooding steps should be taken to reduce the consequence of flooding, i.e. sequentially plan a development so resilient uses are placed on the ground flood, and the building is built with surface water flood risk in mind. The area is in a region of potential groundwater emergence, any subterranean development should ensure it would be resilient to groundwater flooding, and would not disrupt groundwater flow paths.
The western edge of the site, adjacent to the Grande Parade, is more susceptible (deeper water) to surface water flooding during the 1 in 200 year event and the area around Hereford street and Somerset Street is in the category of the less susceptible (Shallow water). The area bounded by Edward Street and Park Street, and Freshfield Way, and Stevenson Road is shown to have an intermediate susceptibility. The rest of the site is not susceptible to surface water flooding.
Part of the site is at risk of surface water flooding in both the 1 in 30 year and 1 in 200 year events according to FMfSW.For the 1 in 30 year event, the risk is limited to the western edge of the site, adjacent to the Grande Parade and Stevenson Road. The 1 in 200year event shows deep flooding across parts of the site notably the Grande Parade, the area bounded by Edward Street and Park Street, and Stevenson Road.
As the site is located within Flood Zone 1 - the Exception Test will not need be required.
The site is underlain by the Newhaven Chalk Formation, and is within the EA's major aquifer high vulnerability zone. Consequently the area may be susceptible to groundwater emergence. However according to the EA groundwater susceptibility map, the site resides a series of 1km squares where the proportion of each 1 km square that is susceptible to groundwater flood emergence is less than a 25%. There are no reported incidents of groundwater flooding in the area.
There are no reported incidents of sewer flooding in the area.
Climate change has not been assessed for surface water or groundwater as part of this SFRA. The future SWMP (due to be completed in 2115) will provide more information of future risks associated with surface water.

Eastern Road and Edward StreetCity Plan Sites
DA5, Eastern Road and Edward StreetFlood Zone 3b Flood Zone 3b Flood Zone 2
Brighton and Hove SFRA update
Tidal Flood Risk (Floodplain Delineation - Undefended)
0 1,100550Metres
© Crown copyright 2011. All rights reserved. Licence number 100020999Contains Ordance Survey data ©Crown copyright and database right [2011]
City Plan Site Flood Risk Summary Map
North
Legend
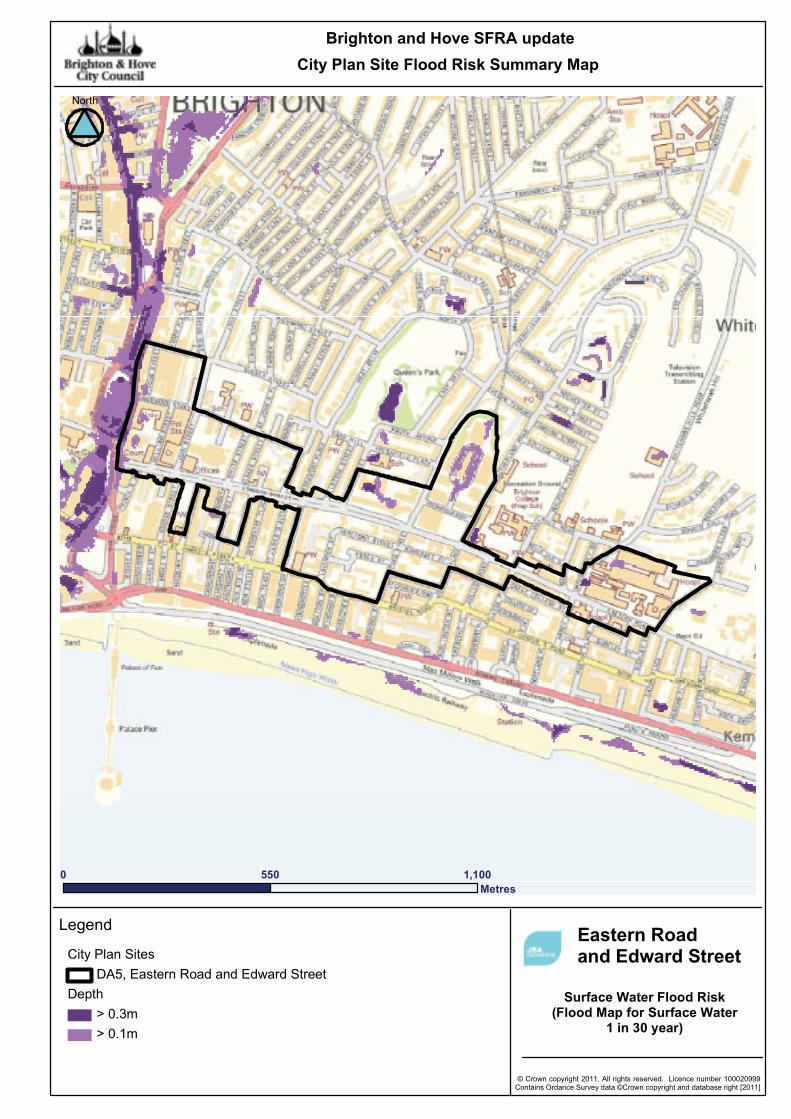
Eastern Road and Edward StreetCity Plan Sites
DA5, Eastern Road and Edward StreetDepth
> 0.3m> 0.1m
Brighton and Hove SFRA update
Surface Water Flood Risk(Flood Map for Surface Water
1 in 30 year)
0 1,100550Metres
© Crown copyright 2011. All rights reserved. Licence number 100020999Contains Ordance Survey data ©Crown copyright and database right [2011]
City Plan Site Flood Risk Summary Map
North
Legend

Eastern Road and Edward StreetCity Plan Sites
DA5, Eastern Road and Edward StreetDepth
> 0.3m> 0.1m
Brighton and Hove SFRA update
Surface Water Flood Risk(Flood Map for Surface Water
1 in 200 year)
0 1,100550Metres
© Crown copyright 2011. All rights reserved. Licence number 100020999Contains Ordance Survey data ©Crown copyright and database right [2011]
City Plan Site Flood Risk Summary Map
North
Legend

Eastern Road and Edward StreetCity Plan Sites
DA5, Eastern Road and Edward StreetAreas Susceptible to Groundwater Flooding
>= 75%>= 50% <75%>= 25% <50%< 25%
Brighton and Hove SFRA update
Groundwater Flood Risk(Areas Susceptible to Groundwater Flooding)
0 1,100550Metres
© Crown copyright 2011. All rights reserved. Licence number 100020999Contains Ordance Survey data ©Crown copyright and database right [2011]
City Plan Site Flood Risk Summary Map
North
Legend
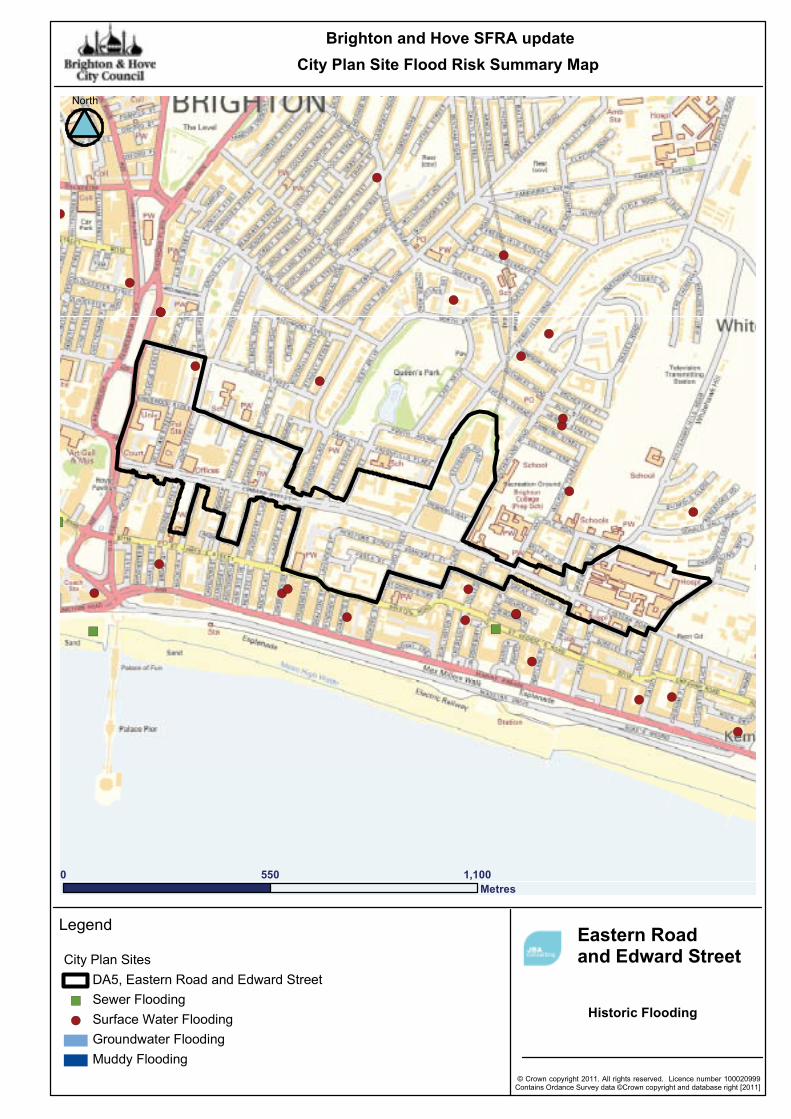
Eastern Road and Edward Street
(
!(!(
!(
!(
!(
!(
!(
!(
!(
!(
!(
!(
!(
!(
!(
!(
!(
!(
!( !(
!(
!(
!(
!(!(
!(
!(
!(
")
") ")
City Plan SitesDA5, Eastern Road and Edward Street
") Sewer Flooding!( Surface Water Flooding
Groundwater FloodingMuddy Flooding
Brighton and Hove SFRA update
Historic Flooding
0 1,100550Metres
© Crown copyright 2011. All rights reserved. Licence number 100020999Contains Ordance Survey data ©Crown copyright and database right [2011]
City Plan Site Flood Risk Summary Map
North
Legend
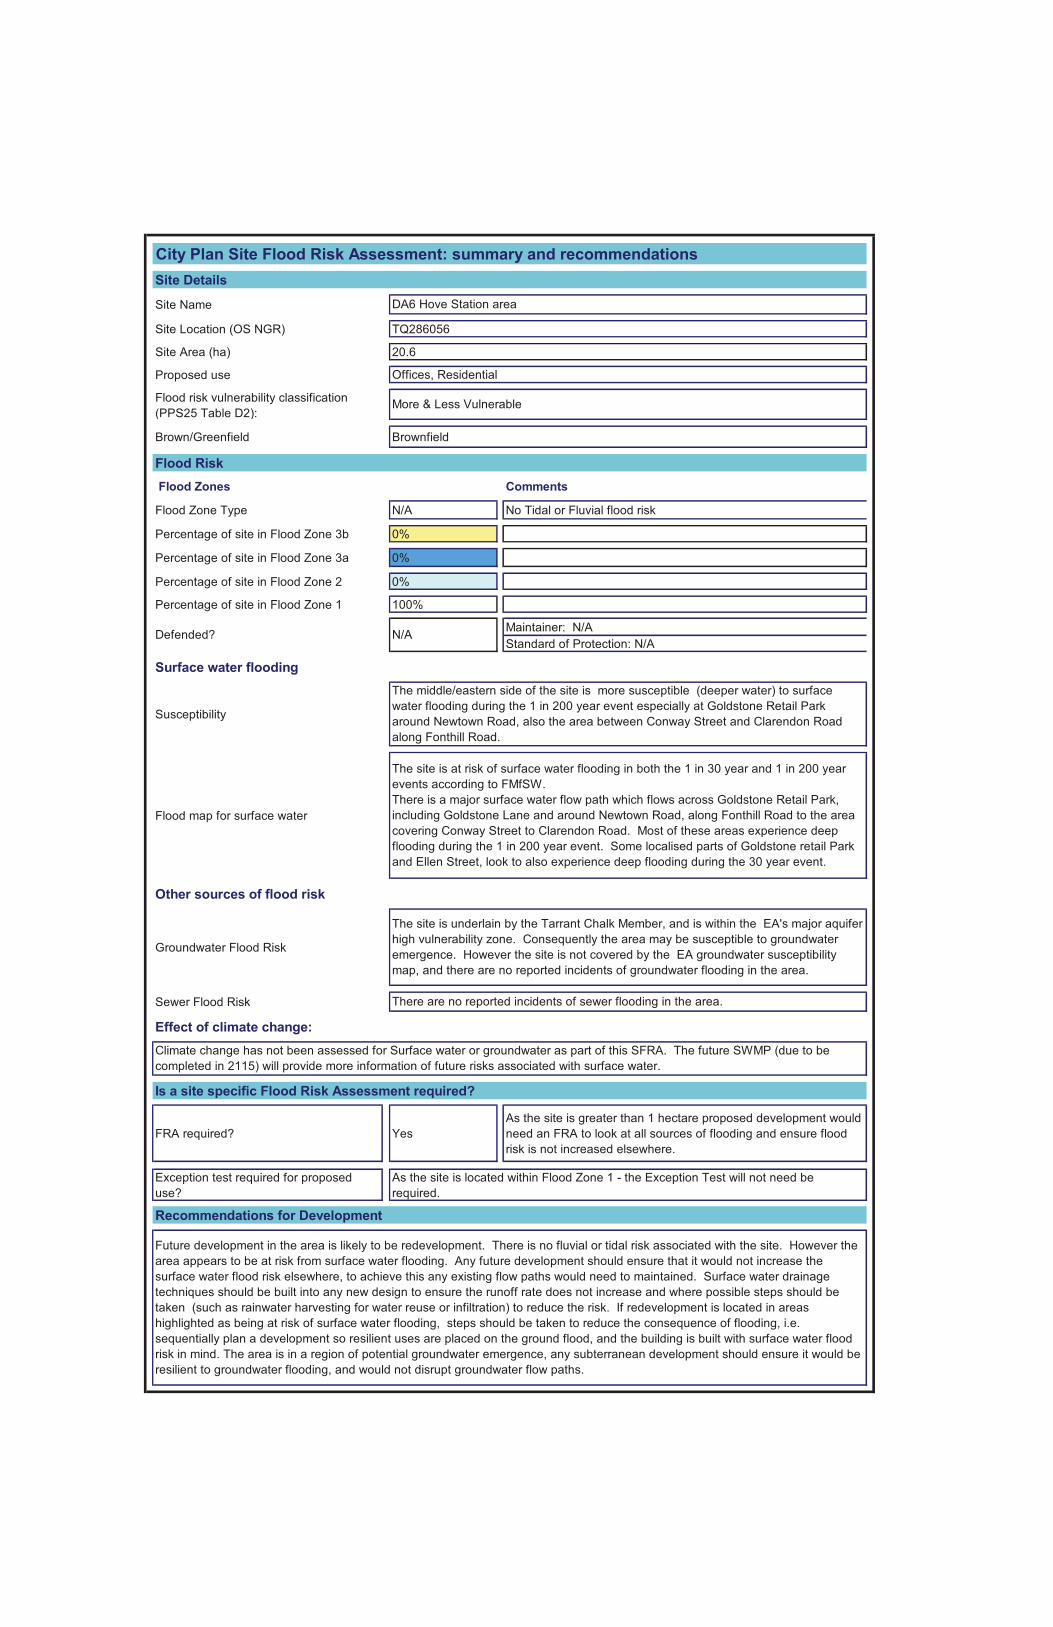
City Plan Site Flood Risk Assessment: summary and recommendationsSite Details
Site Name
Site Location (OS NGR) TQ286056
Site Area (ha) 20.6
Proposed use
Flood risk vulnerability classification (PPS25 Table D2):
Brown/Greenfield Brownfield
Flood Risk Flood Zones Comments
Flood Zone Type N/A No Tidal or Fluvial flood risk
Percentage of site in Flood Zone 3b 0%
Percentage of site in Flood Zone 3a 0%
Percentage of site in Flood Zone 2 0%
Percentage of site in Flood Zone 1 100%
Maintainer: N/AStandard of Protection: N/A
Surface water flooding
Susceptibility
Flood map for surface water
Other sources of flood risk
Groundwater Flood Risk
Sewer Flood Risk
Effect of climate change:
Is a site specific Flood Risk Assessment required?
FRA required? YesAs the site is greater than 1 hectare proposed development would need an FRA to look at all sources of flooding and ensure flood risk is not increased elsewhere.
Exception test required for proposed use?
Recommendations for Development
Offices, Residential
More & Less Vulnerable
DA6 Hove Station area
Defended? N/A
Future development in the area is likely to be redevelopment. There is no fluvial or tidal risk associated with the site. However the area appears to be at risk from surface water flooding. Any future development should ensure that it would not increase the surface water flood risk elsewhere, to achieve this any existing flow paths would need to maintained. Surface water drainage techniques should be built into any new design to ensure the runoff rate does not increase and where possible steps should be taken (such as rainwater harvesting for water reuse or infiltration) to reduce the risk. If redevelopment is located in areas highlighted as being at risk of surface water flooding, steps should be taken to reduce the consequence of flooding, i.e. sequentially plan a development so resilient uses are placed on the ground flood, and the building is built with surface water flood risk in mind. The area is in a region of potential groundwater emergence, any subterranean development should ensure it would be resilient to groundwater flooding, and would not disrupt groundwater flow paths.
The middle/eastern side of the site is more susceptible (deeper water) to surface water flooding during the 1 in 200 year event especially at Goldstone Retail Park around Newtown Road, also the area between Conway Street and Clarendon Road along Fonthill Road.
The site is at risk of surface water flooding in both the 1 in 30 year and 1 in 200 year events according to FMfSW.There is a major surface water flow path which flows across Goldstone Retail Park, including Goldstone Lane and around Newtown Road, along Fonthill Road to the area covering Conway Street to Clarendon Road. Most of these areas experience deep flooding during the 1 in 200 year event. Some localised parts of Goldstone retail Park and Ellen Street, look to also experience deep flooding during the 30 year event.
The site is underlain by the Tarrant Chalk Member, and is within the EA's major aquifer high vulnerability zone. Consequently the area may be susceptible to groundwater emergence. However the site is not covered by the EA groundwater susceptibility map, and there are no reported incidents of groundwater flooding in the area.
There are no reported incidents of sewer flooding in the area.
As the site is located within Flood Zone 1 - the Exception Test will not need be required.
Climate change has not been assessed for Surface water or groundwater as part of this SFRA. The future SWMP (due to be completed in 2115) will provide more information of future risks associated with surface water.

Hove StationCity Plan Sites
DA6, Hove StationDepth
> 0.3m> 0.1m
Brighton and Hove SFRA update
Surface Water Flood Risk (Flood Map for Surface Water
1 in 30 year)
0 1,000500Metres
© Crown copyright 2011. All rights reserved. Licence number 100020999Contains Ordance Survey data ©Crown copyright and database right [2011]
City Plan Site Flood Risk Summary Map
North
Legend

Hove StationCity Plan Sites
DA6, Hove StationDepth
> 0.3m> 0.1m
Brighton and Hove SFRA update
Surface Water Flood Risk (Flood Map for Surface Water
1 in 200 year)
0 1,000500Metres
© Crown copyright 2011. All rights reserved. Licence number 100020999Contains Ordance Survey data ©Crown copyright and database right [2011]
City Plan Site Flood Risk Summary Map
North
Legend

City Plan Site Flood Risk Assessment: summary and recommendationsSite Details
Site Name
Site Location (OS NGR) TQ250049
Site Area (ha) 88.5
Proposed use
Flood risk vulnerability classification (PPS25 Table D2):
Brown/Greenfield Brownfield
Flood Risk Flood Zones Comments
Flood Zone Type Tidal Tidal estuary and coastline
Percentage of site in Flood Zone 3b 0% 'Functional Floodplain'
Percentage of site in Flood Zone 3a 25%
Note: a proportion of this zone is at risk of flooding in a 1 in 20 year event but has been shown to be 'non-functional'. On the accompanying map this portion is shown as yellow and 'cross-hatched'.
Percentage of site in Flood Zone 2 9% This excludes any area contained within Flood Zone 3
Percentage of site in Flood Zone 1 66% Flood Zone 1 indicates the area lying outside of Flood Zones 2 and 3
Maintainer: Local Authority, private and EA
Standard of Protection: Range up to 1 in 100 year
Surface water flooding
Susceptibility
Flood map for surface water
Other sources of flood risk
Groundwater Flood Risk
Sewer Flood Risk
DA7 Shoreham Harbour and South Portslade.
Defended?Formal defences along the River Adur and the
The site is shown to be more susceptible (deep water) to surface water flooding during the 1 in 200 year event.
There are pockets of flooding, some deep, associated with the 1 in 30 year event across the site according to the FMfSW. There also appears to be a significant flow path parallel to Trafalgar Road in the west. The flooding is slightly more extensive and deeper in the 1in 200 year event. This is particularly noticeable in the north east of the site to the east of Trafalgar Road.
Residential
More Vulnerable
The site is mostly underlain by the Tarrant Member and Lambeth Group chalk. It is also within the EA's major aquifer high vulnerability zone. Consequently, the area may be susceptible to groundwater emergence. According to the EA groundwater susceptibility map, the southern part of the site resides in a series of 1km squares where the proportion of each 1 km square that is susceptible to groundwater flood emergence is between 25% and 50%. The north east of the site is in a 1km square where the proportion of each 1 km square that is susceptible to groundwater flood emergence is less than a 25%. Whereas, the northwest of the site sits within a series of 1km squares where the proportion of each 1 km square that is susceptible to groundwater flood emergence is more than a 75%.There are no reported incidents of groundwater flooding in the area.
From the PFRA (2011), Figure 4.1, sewer flooding is recorded in a number of locations within the Shoreham Harbour Area (these include a number on Southern Water SIRF flooding record). These are notably clustered north of the A259.
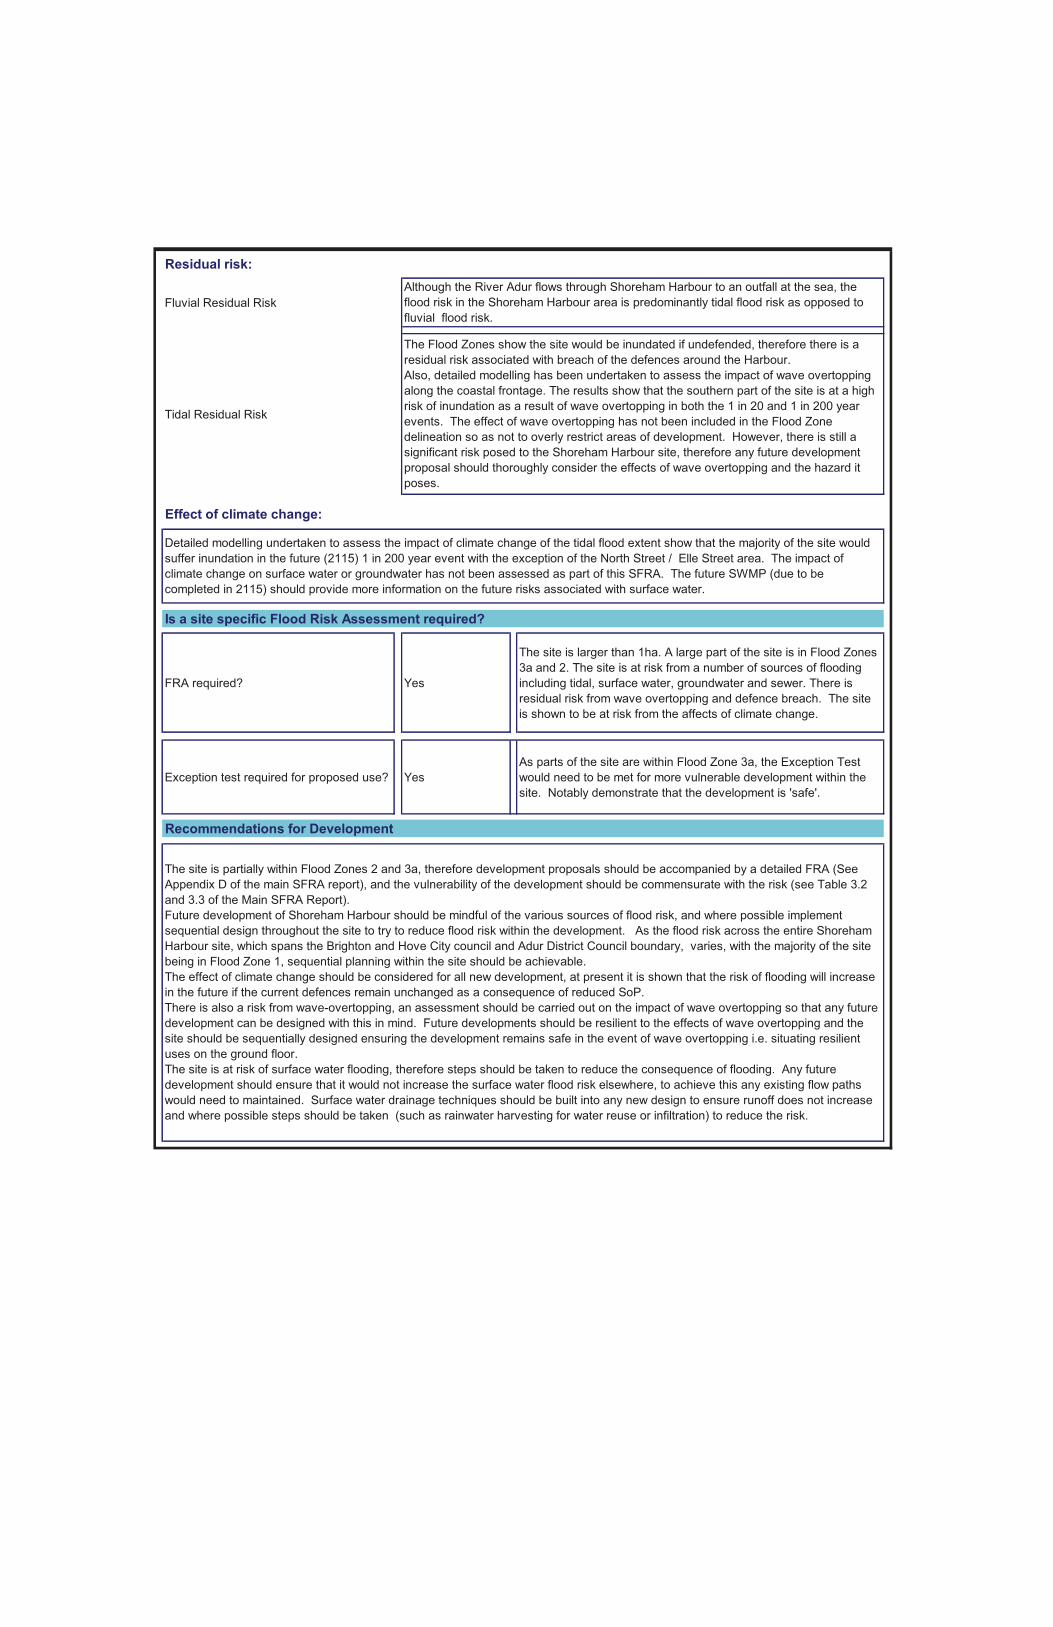
Residual risk:
Fluvial Residual Risk
Tidal Residual Risk
Effect of climate change:
Is a site specific Flood Risk Assessment required?
FRA required? Yes
The site is larger than 1ha. A large part of the site is in Flood Zones 3a and 2. The site is at risk from a number of sources of flooding including tidal, surface water, groundwater and sewer. There is residual risk from wave overtopping and defence breach. The site is shown to be at risk from the affects of climate change.
Exception test required for proposed use? YesAs parts of the site are within Flood Zone 3a, the Exception Test would need to be met for more vulnerable development within the site. Notably demonstrate that the development is 'safe'.
Recommendations for Development
Detailed modelling undertaken to assess the impact of climate change of the tidal flood extent show that the majority of the site would suffer inundation in the future (2115) 1 in 200 year event with the exception of the North Street / Elle Street area. The impact of climate change on surface water or groundwater has not been assessed as part of this SFRA. The future SWMP (due to be completed in 2115) should provide more information on the future risks associated with surface water.
The site is partially within Flood Zones 2 and 3a, therefore development proposals should be accompanied by a detailed FRA (See Appendix D of the main SFRA report), and the vulnerability of the development should be commensurate with the risk (see Table 3.2 and 3.3 of the Main SFRA Report). Future development of Shoreham Harbour should be mindful of the various sources of flood risk, and where possible implement sequential design throughout the site to try to reduce flood risk within the development. As the flood risk across the entire Shoreham Harbour site, which spans the Brighton and Hove City council and Adur District Council boundary, varies, with the majority of the site being in Flood Zone 1, sequential planning within the site should be achievable.The effect of climate change should be considered for all new development, at present it is shown that the risk of flooding will increase in the future if the current defences remain unchanged as a consequence of reduced SoP. There is also a risk from wave-overtopping, an assessment should be carried out on the impact of wave overtopping so that any future development can be designed with this in mind. Future developments should be resilient to the effects of wave overtopping and the site should be sequentially designed ensuring the development remains safe in the event of wave overtopping i.e. situating resilient uses on the ground floor.The site is at risk of surface water flooding, therefore steps should be taken to reduce the consequence of flooding. Any future development should ensure that it would not increase the surface water flood risk elsewhere, to achieve this any existing flow paths would need to maintained. Surface water drainage techniques should be built into any new design to ensure runoff does not increase and where possible steps should be taken (such as rainwater harvesting for water reuse or infiltration) to reduce the risk.
Although the River Adur flows through Shoreham Harbour to an outfall at the sea, the flood risk in the Shoreham Harbour area is predominantly tidal flood risk as opposed to fluvial flood risk.
The Flood Zones show the site would be inundated if undefended, therefore there is a residual risk associated with breach of the defences around the Harbour. Also, detailed modelling has been undertaken to assess the impact of wave overtopping along the coastal frontage. The results show that the southern part of the site is at a high risk of inundation as a result of wave overtopping in both the 1 in 20 and 1 in 200 year events. The effect of wave overtopping has not been included in the Flood Zone delineation so as not to overly restrict areas of development. However, there is still a significant risk posed to the Shoreham Harbour site, therefore any future development proposal should thoroughly consider the effects of wave overtopping and the hazard it poses.

!!!
! !
!!
!! !!
!
! ! !! !
!! !
!! !
! ! ! ! !! ! !
! !
!!
!!
!!
!
!
!
!
!! !
!! !!!
!
! !
!! ! !
!!
!!!
! ! ! !!
! !
!!
!!
!
! !! !
! ! ! ! ! ! ! !
!!
! !!
! ! ! ! ! !!
!!
!
!
! ! ! ! !
!
! ! ! ! ! ! ! ! ! ! ! ! ! ! ! ! ! ! ! ! ! ! !
!!
!! ! ! ! ! ! ! ! ! ! ! ! ! ! ! ! ! ! ! ! ! ! ! !
! ! ! ! !! ! ! ! !! ! ! ! ! !
! ! ! ! ! ! ! ! ! ! ! ! ! ! ! ! ! ! ! !!!
!!
! ! !
! ! ! ! ! ! ! ! ! ! ! !! ! ! ! ! ! ! ! ! ! !
! ! !
! ! ! ! ! ! !
! ! ! ! ! ! ! ! ! !
! !! ! !
! ! ! !!
!!
!
!!
!!
!
!!
!!
!
!!
!!!
!!!
!!
!!!
!!!
!
!
!!
!!
!!
!!
!!
!! ! ! ! ! !
! ! ! ! ! ! !!
!
!
!!
!!
! ! ! ! ! ! ! ! ! ! ! ! ! ! ! ! ! ! ! ! ! ! !
! ! ! ! !
!
!
!!!!!!!
!!!!!!!!
!!!!! ! ! ! !!
!!
!
!
!!
!!!
!
!!!
!
!!!!
!!
!!
!!
!!!!!!!!!!!!
!!!!!!!!!
!!!!!!!!!!!!!!!!!!!!!!!!!!!!!
!!
!
!!!!!!!!!!!!!!!!!!!!!!!!!!!
!!!!!!!!!!!!!!!!!!!!!!!!
!!!!!!!!!!!!!!!!!!!!!!!
!!!!!!!!!!!!!!!!!!!!!!!!!!!!
!!
!!
!!
!!
!!
!!
!!
!!
!!
!!!
!!
!!
!!
!!
!!
!!
!!
!!
!
!!
!!
!!
!!
!!
!!
!
! ! !
!!
!!
!!
!!
!
!!
!!
!!
!!
!!
!!
!!
!!
!!
!
! ! ! ! !
!
!!
!!
!!
!!
! ! ! ! ! ! ! ! ! ! ! ! ! ! ! ! ! ! ! ! ! ! !
!!!!!!!!!!!!!!!!!!!!!!
!!!!!!!!!!!!!!!!!!!!!!!!!!!!!!!!!!!!!!!!!!!!!!!!!!!!!!!!!!!!!!!!!
!
!!!!!!!!!!!!!!!
!!!!!!!!!!!!!!!!!!!!!!!!!!!!!!!!!!!!!!!!!!!!!!!!!
!!
!
!
!!
!!
!!!!!!!!!!!!!!!!!!!!!!!!!!!!!!!!!!!!!
!!!!!!!!!!!!!!!!!!!!!!!!!!!!!!!!!!!!!!!!!!!!!!!!!!!!!!!!!!!!
!
!!!!!!!!!!!
!!!!!!!
!
!!!!!!!
!!!!!!!!!!!
!!!!
!!!!!!!!!!!!!!!!!!!!!!!!!!!!!
!!!!!!!!!!!!!!!!!!!!!!!
!!!!!!!
Brighton and Hove SFRA update
City Plan Site Flood Risk Summary Map
North
Shoreham Harbour and South Portslade
City Plan SitesDA7, Shoreham Harbour and South PortsladeNon Functional Flood Zone 3b
! ! ! ! ! ! ! ! DefencesFlood Zone 3b Flood Zone 3a Flood Zone 2
Tidal Flood Risk(Floodplain Delineation - Undefended)
0 1,000500Metres
© Crown copyright 2011. All rights reserved. Licence number 100020999Contains Ordance Survey data ©Crown copyright and database right [2011]
Legend

!!
!
!!
!!
!! !
!!
! ! !!
!!
!!
!!
!! !
! ! !! ! !
! !
!!
!!
!!
!
!
!
!
!! !
!! !!!
!
! !
!! !
!
!!
!!!
! ! ! !!
! !
!!
!!
!
!!
!!
!! ! ! ! ! ! !
!!
! !!
! ! ! ! ! !!
!!
!
!
! ! ! !
!
!
! ! ! ! ! ! ! ! ! ! ! ! ! ! ! ! ! ! ! ! ! ! !
!!
! ! ! ! ! ! ! ! ! ! ! ! ! ! ! ! ! ! ! ! ! ! ! ! !
! ! ! ! !! ! ! ! !! ! ! ! ! !
! ! ! ! ! ! ! ! ! ! ! ! ! ! ! ! ! ! ! !!!
!!
! ! !
! ! ! ! ! ! ! ! ! ! ! !! ! ! ! ! ! ! ! ! ! !
! ! !
! ! ! ! ! ! !
! ! ! ! ! ! ! ! ! !
! !! ! !
! ! !!!
!!
!
!!
!!
!
!!
!!
!
!!
!! !
!!!
!!
!
!!!
!!
!
!
!!
!!
!!
!!
!!
!! ! ! ! ! !
! ! ! ! ! ! !!
!
!
!!
!!
!! ! ! ! ! ! ! ! ! ! ! ! ! ! ! ! ! ! ! ! ! !
! ! ! ! !
!
!
!!!!!!!
!!!!!!!!
!!!!! ! ! ! !!
!!
!
!
!!
!!! !
!!
!!
!!!!
!!
!!
!!
!!!!!!!!!!!!
!!!!!!!!!
!!!!!!!!!!!!!!!!!!!!!!!!!!!!!
!!
!
!!!!!!!!!!!!!!!!!!!!!!!!!!
!
!!!!!!!!!!!!!!!!!!!!!!!!
!!!!!!!!!!!!!!!!!!!!!!!
!!!!!!!!!!!!!!!!!!!!!!!!!!!!
!!
!!
!!
!!
!!
!!
!!
!!
!!
!!!
!!
!!
!!
!!
!!
!!
!!
!!
!
!!
!!
!!
!!
!!
!!
!
! ! !
!!!
!!
!!
!!
!!
!!
!!
!!
!!
!!
!!
!!
!!
!
! ! ! ! !
!
!!
!!
!!
!!
! ! ! ! ! ! ! ! ! ! ! ! ! ! ! ! ! ! ! ! ! ! !
!!!!!!!!!!!!!!!!!!!!!!
!!!!!!!!!!!!!!!!!!!!!!!!!!!!!!!!!!!!!!!!!!!!!!!!!!!!!!!!!!!!!!!!!
!
!!!!!!!!!!!!!!!!!!!!!!!!!!!!!!!!!!!!!!!!!!!!!!!!!!!!!!!!!!!!!!!!
!!
!
!
!!
!!
!!!!!!!!!!!!!!!!!!!!!!!!!!!!!!!!!!!!!
!!!!!!!!!!!!!!!!!!!!!!!!!!!!!!!!!!!!!!!!!!!!!!!!!!!!!!!!!!!!
!
!!!!!!!!!!!
!!!!!!!
!
!!!!!!!
!!!!!!!!!!!
!!!!
!!!!!!!!!!!!!!!!!!!!!!!!!!!!!
!!!!!!!!!!!!!!!!!!!!!!!
!!!!!!!
Brighton and Hove SFRA update
City Plan Site Flood Risk Summary Map
North
Shoreham Harbour and South Portslade
City Plan SitesDA7, Shoreham Harbour and South Portslade
! ! ! ! ! ! ! ! ! Defences1 in 20 year (Defended)1 in 200 year (Defended)1 in 1000 year (Defended)
Actual Tidal Flood Risk(with defences)
0 1,000500Metres
© Crown copyright 2011. All rights reserved. Licence number 100020999Contains Ordance Survey data ©Crown copyright and database right [2011]
Legend

!!
!
!!
!!
!! !
!!
! ! !!
!!
!!
!!
!! !
! ! !! ! !
! !
!!
!!
!!
!
!
!
!
!! !
!! !!!
!
! !
!! !
!
!!
!!!
! ! ! !!
! !
!!
!!
!
!!
!!
!! ! ! ! ! ! !
!!
! !!
! ! ! ! ! !!
!!
!
!
! ! ! !
!
!
! ! ! ! ! ! ! ! ! ! ! ! ! ! ! ! ! ! ! ! ! ! !
!!
! ! ! ! ! ! ! ! ! ! ! ! ! ! ! ! ! ! ! ! ! ! ! ! !
! ! ! ! !! ! ! ! !! ! ! ! ! !
! ! ! ! ! ! ! ! ! ! ! ! ! ! ! ! ! ! ! !!!
!!
! ! !
! ! ! ! ! ! ! ! ! ! ! !! ! ! ! ! ! ! ! ! ! !
! ! !
! ! ! ! ! ! !
! ! ! ! ! ! ! ! ! !
! !! ! !
! ! !!!
!!
!
!!
!!
!
!!
!!
!
!!
!! !
!!!
!!
!
!!!
!!
!
!
!!
!!
!!
!!
!!
!! ! ! ! ! !
! ! ! ! ! ! !!
!
!
!!
!!
!! ! ! ! ! ! ! ! ! ! ! ! ! ! ! ! ! ! ! ! ! !
! ! ! ! !
!
!
!!!!!!!
!!!!!!!!
!!!!! ! ! ! !!
!!
!
!
!!
!!! !
!!
!!
!!!!
!!
!!
!!
!!!!!!!!!!!!
!!!!!!!!!
!!!!!!!!!!!!!!!!!!!!!!!!!!!!!
!!
!
!!!!!!!!!!!!!!!!!!!!!!!!!!
!
!!!!!!!!!!!!!!!!!!!!!!!!
!!!!!!!!!!!!!!!!!!!!!!!
!!!!!!!!!!!!!!!!!!!!!!!!!!!!
!!
!!
!!
!!
!!
!!
!!
!!
!!
!!!
!!
!!
!!
!!
!!
!!
!!
!!
!
!!
!!
!!
!!
!!
!!
!
! ! !
!!!
!!
!!
!!
!!
!!
!!
!!
!!
!!
!!
!!
!!
!
! ! ! ! !
!
!!
!!
!!
!!
! ! ! ! ! ! ! ! ! ! ! ! ! ! ! ! ! ! ! ! ! ! !
!!!!!!!!!!!!!!!!!!!!!!
!!!!!!!!!!!!!!!!!!!!!!!!!!!!!!!!!!!!!!!!!!!!!!!!!!!!!!!!!!!!!!!!!
!
!!!!!!!!!!!!!!!!!!!!!!!!!!!!!!!!!!!!!!!!!!!!!!!!!!!!!!!!!!!!!!!!
!!
!
!
!!
!!
!!!!!!!!!!!!!!!!!!!!!!!!!!!!!!!!!!!!!
!!!!!!!!!!!!!!!!!!!!!!!!!!!!!!!!!!!!!!!!!!!!!!!!!!!!!!!!!!!!
!
!!!!!!!!!!!
!!!!!!!
!
!!!!!!!
!!!!!!!!!!!
!!!!
!!!!!!!!!!!!!!!!!!!!!!!!!!!!!
!!!!!!!!!!!!!!!!!!!!!!!
!!!!!!!
Brighton and Hove SFRA update
City Plan Site Flood Risk Summary Map
North
Shoreham Harbour and South Portslade
City Plan SitesDA7, Shoreham Harbour and South Portslade
! ! ! ! ! ! ! ! ! Defences1 in 200 year (Defended)1 in 200 year - 2115 (Defended)
Future Tidal Flood Risk(with defences)
0 1,000500Metres
© Crown copyright 2011. All rights reserved. Licence number 100020999Contains Ordance Survey data ©Crown copyright and database right [2011]
Legend
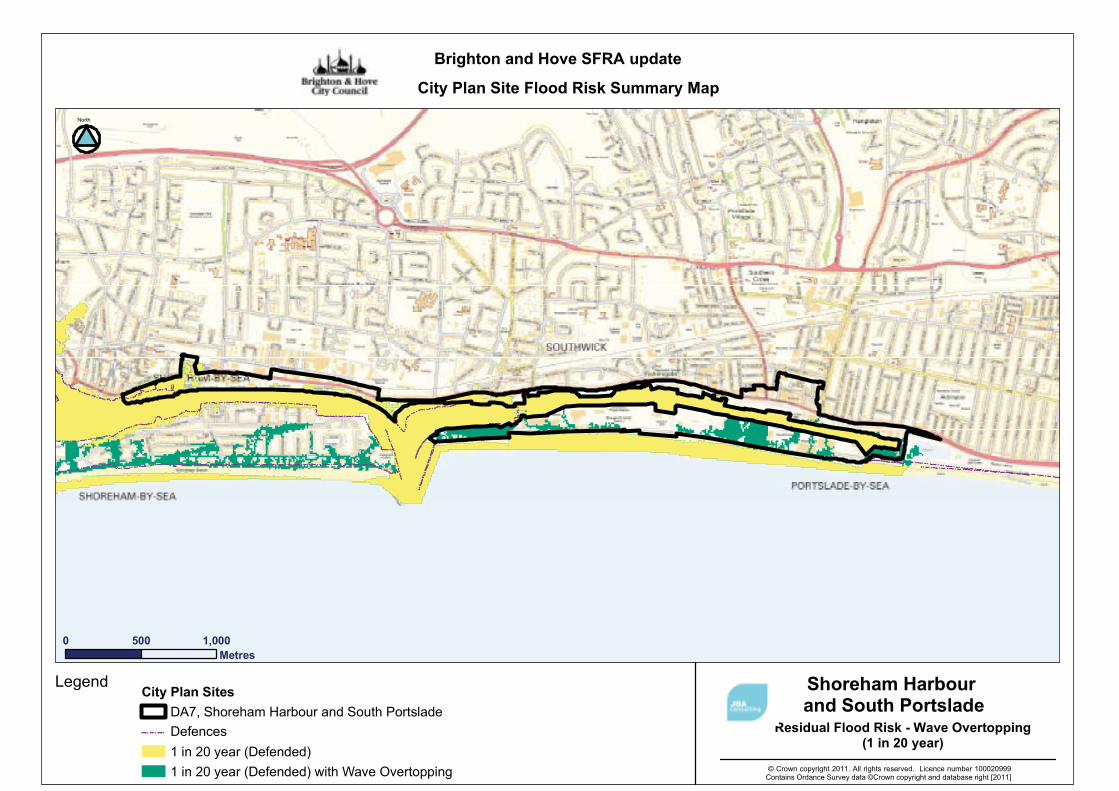
!!
!
!!
!!
!! !
!!
! ! !!
!!
!!
!!
!! !
! ! !! ! !
! !
!!
!!
!!
!
!
!
!
!! !
!! !!!
!
! !
!! !
!
!!
!!!
! ! ! !!
! !
!!
!!
!
!!
!!
!! ! ! ! ! ! !
!!
! !!
! ! ! ! ! !!
!!
!
!
! ! ! !
!
!
! ! ! ! ! ! ! ! ! ! ! ! ! ! ! ! ! ! ! ! ! ! !
!!
! ! ! ! ! ! ! ! ! ! ! ! ! ! ! ! ! ! ! ! ! ! ! ! !
! ! ! ! !! ! ! ! !! ! ! ! ! !
! ! ! ! ! ! ! ! ! ! ! ! ! ! ! ! ! ! ! !!!
!!
! ! !
! ! ! ! ! ! ! ! ! ! ! !! ! ! ! ! ! ! ! ! ! !
! ! !
! ! ! ! ! ! !
! ! ! ! ! ! ! ! ! !
! !! ! !
! ! !!!
!!
!
!!
!!
!
!!
!!
!
!!
!! !
!!!
!!
!
!!!
!!
!
!
!!
!!
!!
!!
!!
!! ! ! ! ! !
! ! ! ! ! ! !!
!
!
!!
!!
!! ! ! ! ! ! ! ! ! ! ! ! ! ! ! ! ! ! ! ! ! !
! ! ! ! !
!
!
!!!!!!!
!!!!!!!!
!!!!! ! ! ! !!
!!
!
!
!!
!!! !
!!
!!
!!!!
!!
!!
!!
!!!!!!!!!!!!
!!!!!!!!!
!!!!!!!!!!!!!!!!!!!!!!!!!!!!!
!!
!
!!!!!!!!!!!!!!!!!!!!!!!!!!
!
!!!!!!!!!!!!!!!!!!!!!!!!
!!!!!!!!!!!!!!!!!!!!!!!
!!!!!!!!!!!!!!!!!!!!!!!!!!!!
!!
!!
!!
!!
!!
!!
!!
!!
!!
!!!
!!
!!
!!
!!
!!
!!
!!
!!
!
!!
!!
!!
!!
!!
!!
!
! ! !
!!!
!!
!!
!!
!!
!!
!!
!!
!!
!!
!!
!!
!!
!
! ! ! ! !
!
!!
!!
!!
!!
! ! ! ! ! ! ! ! ! ! ! ! ! ! ! ! ! ! ! ! ! ! !
!!!!!!!!!!!!!!!!!!!!!!
!!!!!!!!!!!!!!!!!!!!!!!!!!!!!!!!!!!!!!!!!!!!!!!!!!!!!!!!!!!!!!!!!
!
!!!!!!!!!!!!!!!!!!!!!!!!!!!!!!!!!!!!!!!!!!!!!!!!!!!!!!!!!!!!!!!!
!!
!
!
!!
!!
!!!!!!!!!!!!!!!!!!!!!!!!!!!!!!!!!!!!!
!!!!!!!!!!!!!!!!!!!!!!!!!!!!!!!!!!!!!!!!!!!!!!!!!!!!!!!!!!!!
!
!!!!!!!!!!!
!!!!!!!
!
!!!!!!!
!!!!!!!!!!!
!!!!
!!!!!!!!!!!!!!!!!!!!!!!!!!!!!
!!!!!!!!!!!!!!!!!!!!!!!
!!!!!!!
Brighton and Hove SFRA update
City Plan Site Flood Risk Summary Map
North
Shoreham Harbour and South Portslade
City Plan SitesDA7, Shoreham Harbour and South Portslade
! ! ! ! ! ! ! ! ! Defences1 in 20 year (Defended)1 in 20 year (Defended) with Wave Overtopping
Residual Flood Risk - Wave Overtopping(1 in 20 year)
0 1,000500Metres
© Crown copyright 2011. All rights reserved. Licence number 100020999Contains Ordance Survey data ©Crown copyright and database right [2011]
Legend

!!
!
!!
!!
!! !
!!
! ! !!
!!
!!
!!
!! !
! ! !! ! !
! !
!!
!!
!!
!
!
!
!
!! !
!! !!!
!
! !
!! !
!
!!
!!!
! ! ! !!
! !
!!
!!
!
!!
!!
!! ! ! ! ! ! !
!!
! !!
! ! ! ! ! !!
!!
!
!
! ! ! !
!
!
! ! ! ! ! ! ! ! ! ! ! ! ! ! ! ! ! ! ! ! ! ! !
!!
! ! ! ! ! ! ! ! ! ! ! ! ! ! ! ! ! ! ! ! ! ! ! ! !
! ! ! ! !! ! ! ! !! ! ! ! ! !
! ! ! ! ! ! ! ! ! ! ! ! ! ! ! ! ! ! ! !!!
!!
! ! !
! ! ! ! ! ! ! ! ! ! ! !! ! ! ! ! ! ! ! ! ! !
! ! !
! ! ! ! ! ! !
! ! ! ! ! ! ! ! ! !
! !! ! !
! ! !!!
!!
!
!!
!!
!
!!
!!
!
!!
!! !
!!!
!!
!
!!!
!!
!
!
!!
!!
!!
!!
!!
!! ! ! ! ! !
! ! ! ! ! ! !!
!
!
!!
!!
!! ! ! ! ! ! ! ! ! ! ! ! ! ! ! ! ! ! ! ! ! !
! ! ! ! !
!
!
!!!!!!!
!!!!!!!!
!!!!! ! ! ! !!
!!
!
!
!!
!!! !
!!
!!
!!!!
!!
!!
!!
!!!!!!!!!!!!
!!!!!!!!!
!!!!!!!!!!!!!!!!!!!!!!!!!!!!!
!!
!
!!!!!!!!!!!!!!!!!!!!!!!!!!
!
!!!!!!!!!!!!!!!!!!!!!!!!
!!!!!!!!!!!!!!!!!!!!!!!
!!!!!!!!!!!!!!!!!!!!!!!!!!!!
!!
!!
!!
!!
!!
!!
!!
!!
!!
!!!
!!
!!
!!
!!
!!
!!
!!
!!
!
!!
!!
!!
!!
!!
!!
!
! ! !
!!!
!!
!!
!!
!!
!!
!!
!!
!!
!!
!!
!!
!!
!
! ! ! ! !
!
!!
!!
!!
!!
! ! ! ! ! ! ! ! ! ! ! ! ! ! ! ! ! ! ! ! ! ! !
!!!!!!!!!!!!!!!!!!!!!!
!!!!!!!!!!!!!!!!!!!!!!!!!!!!!!!!!!!!!!!!!!!!!!!!!!!!!!!!!!!!!!!!!
!
!!!!!!!!!!!!!!!!!!!!!!!!!!!!!!!!!!!!!!!!!!!!!!!!!!!!!!!!!!!!!!!!
!!
!
!
!!
!!
!!!!!!!!!!!!!!!!!!!!!!!!!!!!!!!!!!!!!
!!!!!!!!!!!!!!!!!!!!!!!!!!!!!!!!!!!!!!!!!!!!!!!!!!!!!!!!!!!!
!
!!!!!!!!!!!
!!!!!!!
!
!!!!!!!
!!!!!!!!!!!
!!!!
!!!!!!!!!!!!!!!!!!!!!!!!!!!!!
!!!!!!!!!!!!!!!!!!!!!!!
!!!!!!!
Brighton and Hove SFRA update
City Plan Site Flood Risk Summary Map
North
Shoreham Harbour and South Portslade
City Plan SitesDA7, Shoreham Harbour and South Portslade
! ! ! ! ! ! ! ! ! Defences1 in 200 year (Defended)1 in 200 year (Defended) with Wave Overtopping
Residual Flood Risk - Wave Overtopping(1 in 200 year)
0 1,000500Metres
© Crown copyright 2011. All rights reserved. Licence number 100020999Contains Ordance Survey data ©Crown copyright and database right [2011]
Legend

Brighton and Hove SFRA update
City Plan Site Flood Risk Summary Map
North
Shoreham Harbour and South Portslade
City Plan SitesDA7, Shoreham Harbour and South Portslade
Depth> 0.3m> 0.1m
Surface Water Flood Risk(Flood Map for Surface Water 1 in 30 year)
0 1,000500Metres
© Crown copyright 2011. All rights reserved. Licence number 100020999Contains Ordance Survey data ©Crown copyright and database right [2011]
Legend
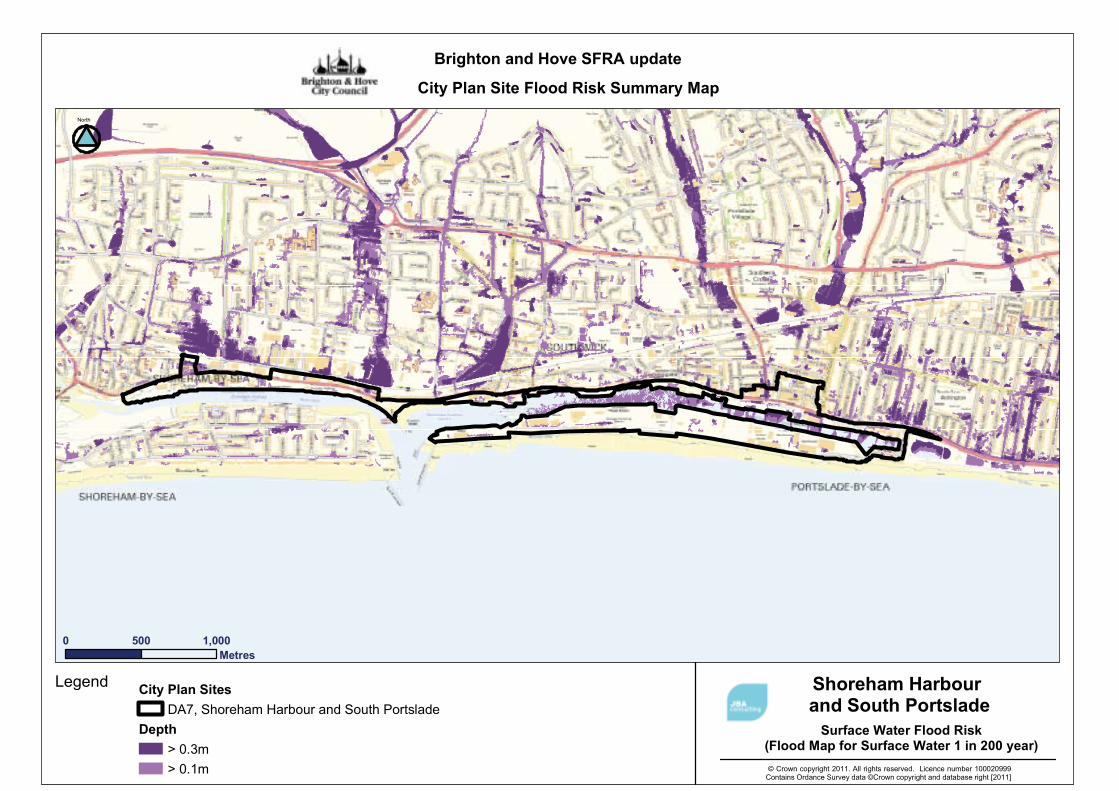
Brighton and Hove SFRA update
City Plan Site Flood Risk Summary Map
North
Shoreham Harbour and South Portslade
City Plan SitesDA7, Shoreham Harbour and South Portslade
Depth> 0.3m> 0.1m
Surface Water Flood Risk(Flood Map for Surface Water 1 in 200 year)
0 1,000500Metres
© Crown copyright 2011. All rights reserved. Licence number 100020999Contains Ordance Survey data ©Crown copyright and database right [2011]
Legend

Brighton and Hove SFRA update
City Plan Site Flood Risk Summary Map
North
Shoreham Harbour and South Portslade
City Plan SitesDA7, Shoreham Harbour and South Portslade
Areas Susceptible to Groundwater Flooding>= 75%>= 50% <75%>= 25% <50%< 25%
Groundwater Flood Risk(Areas Susceptible to Groundwater Flooding)
0 1,000500Metres
© Crown copyright 2011. All rights reserved. Licence number 100020999Contains Ordance Survey data ©Crown copyright and database right [2011]
Legend

Brighton and Hove SFRA update
City Plan Site Flood Risk Summary Map
North
Shoreham Harbour and South Portslade
City Plan SitesDA7, Shoreham Harbour and South Portslade
") Sewer Flooding") Failure!( Groundwater Flooding!( Surface Water Flooding
Surface Water FloodingCoastal Flooding
Historic Flooding
0 1,000500Metres
© Crown copyright 2011. All rights reserved. Licence number 100020999Contains Ordance Survey data ©Crown copyright and database right [2011]
Legend
2011s5199 B&H SFRA - Final Report (v2 Jan12).doc XIV
C Recommendations for Future Developments
C.1 Reducing flood risk through site layout and design Flood risk should be considered at an early stage in deciding the layout and design of a site to provide an opportunity to reduce flood risk within the development. Most large development proposals include a variety of land uses of varying vulnerability to flooding.
The Practice Guide to PPS25 states that a sequential, risk-based approach should be applied to try to locate more vulnerable land use to higher ground, while more flood-compatible development (e.g. parking, recreational space) can be located in more high risk areas.
Areas along known surface water flow routes can be used for recreation, amenity and environmental purposes, allowing the preservation of flow routes and flood storage, and at the same time providing valuable social and environmental benefits contributing to other sustainability objectives.
Landscaping should ensure safe access to higher ground from these areas, and avoid the creation of isolated islands as water levels rise.
C.1.1 Modification of ground levels
Modifying ground levels to raise the land above the required flood level is a very effective way of reducing flood risk to the site in question, particularly where the land does not act as conveyance for flood waters.
However, in most areas conveyance or flood storage would be reduced by raising land above the floodplain, adversely impacting on flood risk downstream. Consequently, compensatory flood storage would be required. Storage should equate to level for level compensatory volume. Where the site is entirely within the floodplain it is not possible to provide compensatory storage at the maximum flood level and this will not be a viable mitigation option. Compensation schemes should be environmentally sound.
C.1.2 Building design
The raising of floor levels within a development avoids damage occurring to the interior, furnishings and electrics in time of flood.
In areas at risk of a breach in the tidal defences, such as Brighton Marina, floor levels should be raised 300mm above the maximum water level caused by a defence breach during a 0.5% annual probability event plus climate change event. This additional height that the floor level is raised is referred to as the ‘freeboard’.
In areas at risk of surface water flooding this approach could also be adopted to limit the consequence of flooding. The level above which the freeboard is applied should be informed by a flood risk assessment in conjunction with discussion with Brighton and Hove council.
Making the ground floor use of a building water-compatible is also an effective way of raising living space above flood levels.
Putting a building on stilts is not considered an acceptable means of flood mitigation for new development. However, it may be allowed in special circumstances if it replaces an existing solid building, as it can improve flood flow routes. In these cases, attention should always be paid to safe access and egress, and legal protection should be given to ensure the ground floor use is not changed.
Single storey developments are not acceptable in flood risk areas.
Overall the development should be made structurally safe against the effects of flood waters.
C.1.3 Resistance and resilience
There may be instances where flood risk remains to a development. In these cases (and for existing development in the floodplain), additional resistance and resilience measures can be

2011s5199 B&H SFRA - Final Report (v2 Jan12).doc XV
put in place to reduce damage in a flood and increase the speed of recovery. Resilience measures will be specific to the nature of flood risk, and as such will be informed and determined by the FRA. However, these measures should not be relied on as the only mitigation method.
Temporary barriers
Temporary barriers consist of moveable flood defences which can be fitted into doorways and/or windows. The permanent fixings required to install these temporary defences should be discrete and keep architectural impact to a minimum. On a smaller scale temporary snap on covers for airbricks and air vents can also be fitted to prevent the entrance of flood water. The Environment Agency provides a list of manufacturers, with the Kitemark, of temporary defences on their website (www.environment-agency.gov.uk).
Temporary or demountable defences are not acceptable flood protection for a new development; however they are useful for protecting existing against flood risk.
Temporary defences or demountable defences should only be installed where there is a flood warning with an adequate lead-time to provide enough time for the defences to be put in place.
Permanent barriers
Permanent barriers can include built up doorsteps, rendered brick walls and toughened glass barriers (Figure C 1).
Figure C 1: Permanent flood barriers
Wet-proofing
Interior design to reduce damage caused by flooding, for example:
Electrical circuitry installed higher level with power cables being carried down from the ceiling not up from the floor level.
Water-resistant materials for floors, walls and fixtures. If redeveloping existing basements new electrical circuitry installed higher level with power cables being carried down from the ceiling not up from the floor level to minimise damage if the basement floods.
Non Return Valves
Non-return valves prevent water entering the property from drains and sewers. Non-return valves can be installed within gravity sewers or drains, within the property’s private sewer
2011s5199 B&H SFRA - Final Report (v2 Jan12).doc XVI
upstream of the public sewerage system. These need to be carefully installed and should be regularly maintained. The CIRIA publication, ‘Low cost options for prevention of flooding from sewers’, provides further information. Additionally, manhole covers within the property’s grounds could be sealed to prevent surcharging.
Pumps
When redeveloping existing buildings it may be acceptable to install pumps in basements as a resilience measure against surface water or groundwater flooding. However for new development this is unlikely to be considered an acceptable solution.
C.2 Drainage capacity The capacity of drainage infrastructure is often limited and is at or near capacity under existing conditions. Development that leads to increased peak runoff within the drainage catchments may lead to infrastructure capacity being exceeded, with the potential for increased sewer (foul and surface) flood risk. Development locations should be assessed to ensure capacity exists within the foul sewer network, and where possible SUDS should be implemented before considering connection to the surface water sewer.
C.3 Application of Sustainable Drainage Systems (SUDS) Sustainable Drainage Systems (SUDS) are management practices which aim to mimic the natural processes of infiltration, attenuation and removal of sediments and pollutants, enabling surface water to be drained in a more sustainable manner. Once the Flood and Water Management Bill (2010) is enacted the Council will have to give approval for all proposals’ to construct SUDs in the Brighton and Hove area. In addition, they will have the power to inspect construction and monitor the operation of the system to ensure it is in line with the proposal. The Council will also be responsible for maintaining the SUDS in compliance with national standards.
The effectiveness of a flow management scheme within a single site is heavily limited by site constraints including (but not limited to) topography, geology (soil permeability), and available area. The design, construction and ongoing maintenance regime of such a scheme should be carefully defined, and a clear and comprehensive understanding of the catchment hydrological processes (i.e. nature and capacity of the existing drainage system) is essential. Additionally, for infiltration SUDS it is imperative that the water table is low enough and a site specific infiltration test is undertaken. Where sites lie within or close to groundwater source protection zones (which are extensive across the northern half of Brighton and Hove, Figure C 2) further restrictions may be applicable, and guidance should be sought from the Environment Agency.
There are many different SUDS techniques which can be implemented, some examples are listed below. Advice on best practice is available from the Environment Agency and the Construction Industry Research and Information Association (CIRIA) SUDS Manual. In order to obtain the maximum benefits from SUDs systems, the design should consider flood risk management alongside the water quality, bio-diversity and amenity benefits that well designed SUDS can offer a development.

2011s5199 B&H SFRA - Final Report (v2 Jan12).doc XVII
Figure C 2: Groundwater source protection zones across Brighton and Hove11
C.3.1 Living (green) roofs and walls
Living Roofs and walls can vary in type from Roof Gardens, Roof Terraces, Green Roofs and Green Walls. This approach utilises plants and their substrate provide temporary storage of rainfall. The water retained by the substrate and lost through evaporation and evapotranspiration minimises runoff from the roof.
Green Roofs have been successfully implemented within urban environments. An award winning example of a green roof is Beaufort Court, Lillie Road, Fulham (Figure C 3). This is a social housing development created in 2003 with sedum roofs to reduce surface water run-off and provide a visual amenity. Other examples of successful green roof projects can be found in the Mayor of London’s ‘Living Roofs: Case Studies’ document.
11 EA (2011) http://maps.environment- agency.gov.uk/wiyby/wiybyController?value=Brighton%2C+City+of+Brighton+and+Hove&lang=_e&ep=map&topic=dri
nkingwater&layerGroups=default&scale=7&textonly=off&submit.x=24&submit.y=11 (accessed September 2011)

2011s5199 B&H SFRA - Final Report (v2 Jan12).doc XVIII
Figure C 3: Example of a green roof in Fulham
7 Beaufort Court, Lillie Road, Fulham © Peabody Trust
C.3.2 Basins and ponds
Basins and ponds enhance flood storage capacity by providing temporary storage for storm water through the creation of landscape features within a site (which can also provide scope for the creation of wildlife habitats). Basins, ponds and wetlands can be fed by swales, filter drains or piped systems.
C.3.3 Filter strips
Filter strips are vegetated areas that are intended to treat sheet flow from adjacent impervious areas. Filter strips function by slowing runoff velocities and filtering out sediment and other pollutants, and providing some infiltration into underlying soils. This approach to SUDS also provides scope for the creation of wildlife habitats and biodiversity gain.
C.3.4 Infiltration devices
Infiltration devices drain water directly into the ground. They may be used at source or the runoff can be conveyed in a pipe or swale to the infiltration area. They include soakaways, infiltration trenches and infiltration basins as well as swales, filter drains and ponds. Infiltration devices can be integrated into and form part of the landscaped areas.
C.3.5 Permeable surfaces and filter drains
Pervious pavements such as permeable concrete blocks, crushed stone and asphalt will allow water to infiltrate directly into the subsoil before soaking into the ground. Filter drains are gravel filled trenches which trap sediments from run-off and provide attenuation. Flow is directed to a perforated pipe which conveys run-off back into the sewerage network or into a water body. Filter drains are used mainly to drain road and car park surfaces.
C.3.6 Rainwater harvesting
Rainwater harvesting techniques, such as the installation of water butts, can aid in increasing the attenuation of rainfall and contribute to the on-site recycling of water.

2011s5199 B&H SFRA - Final Report (v2 Jan12).doc XIX
D Requirements for Future Development D.1 Requirements for future developments in Flood Zone 1
All development (essential infrastructure, highly vulnerable, more vulnerable, less vulnerable and water-compatible development) is allowed in Flood Zone 1. Opportunities should be sought to reduce the overall levels of flood risk in the area and beyond through the layout and form of the development, and the appropriate application of sustainable drainage techniques.
D.1.1 Developments >1ha
A detailed site-specific FRA, including drainage impact assessment, should be undertaken in accordance with PPS25 and the Council’s policies assessing risk from other sources of flooding (Surface Water, Sewer and Groundwater) which are not considered by the Flood Zone maps.
The effects of any flood risk identified should be mitigated by suitable methods without increasing flood risk elsewhere.
The development should meet the following drainage requirements to reduce flood risk elsewhere:
Greenfield discharge rates Use of SUDS
D.1.2 Developments <1ha
The developer should identify whether the site is at risk from ‘other sources’ of flooding, which in the case of Brighton and Hove includes Surface Water, Sewer and Groundwater. If so, then the same requirements should be met as described above for a site >1ha, including a detailed Flood Risk Assessment. For those proposed developments where there is not a known drainage issue then a detailed FRA is not required. Nevertheless, the proposed development should include the appropriate application of SUDS techniques so as to maintain, or preferably reduce the existing runoff and flood risk in the area.
D.1.3 Flood risk assessments for sites in Flood Zone 1
If the site is greater than 1ha in size, or less than 1ha with an identified flood risk then a detailed site-specific FRA will need to be undertaken.
The FRA should:
Identify and detail the level of risk to a development from all sources. Detail how this risk will be managed and the consequences mitigated.
Where possible show how overall flood risk will be reduced. Undertake a drainage impact assessment to identify the impact of the proposed
development on surface water drainage, including the potential impact upon neighbouring areas, and recommend the approach to controlling runoff to the required discharge rates.
Show that safe access can be provided to an appropriate level for the type of development.
If a detailed FRA is required, it should be undertaken by a suitably qualified professional. Assessments should be on a site by site basis making use of local knowledge, but an initial assessment of potential sources of flooding can be made by consulting the maps in this SFRA.
D.2 Requirements for future developments in Flood Zone 2 (Medium Probability) Flood Zone 2 is considered suitable for water-compatible, less vulnerable, more vulnerable and essential infrastructure. Highly vulnerable development is only allowed where the Exception Test is passed.

2011s5199 B&H SFRA - Final Report (v2 Jan12).doc XX
Opportunities should be sought to reduce the overall levels of flood risk in the area and beyond through the layout and form of the development, and the appropriate application of sustainable drainage techniques, through the consideration of the following:
A detailed site-specific FRA must be undertaken in accordance with PPS25 and the Council’s Local Development Framework policies, assessing risk from tidal flooding, risk from all ‘other sources’ of flooding, and the effect of climate change on flood risk over the lifetime of the development .
The effects of the flood risk identified should be mitigated by suitable methods without increasing flood risk elsewhere.
Safe access should be provided to an appropriate level for the type of development. The development should meet the following drainage requirements to reduce flood
risk elsewhere: o Greenfield discharge rates o Use of SUDS
In addition, any proposed development should be required to provide evidence that the Sequential Test, and if required the Exception Test, have been passed.
D.2.4 Flood risk assessments for Flood Zone 2
A detailed site specific FRA should be undertaken for any development in Flood Zone 2. It is strongly recommended that the Sequential Test, and, depending on the vulnerability of the development (see Table D.2 of PPS25), the first two parts of the Exception Test, be satisfied before the FRA is commenced.
The FRA should meet the following criteria:
Where necessary demonstrate whether the site is at residual risk from tidal flooding. Identify and detail the level of risk to a development from all sources. Detail how all sources of flood risk will be managed and the consequences mitigated.. Where possible show how overall flood risk will be reduced. Undertake a drainage impact assessment to identify the impact of the proposed
development on surface water drainage, including the potential impact upon neighbouring areas, and recommend the approach to controlling runoff to the required discharge rates.
Show that safe access can be provided to an appropriate level for the type of development.
Detailed FRAs should be undertaken by a suitably qualified professional. Assessments should be on a site by site basis making use of local knowledge, but an initial assessment of potential sources of flooding can be made by consulting the maps in this SFRA.
D.3 Requirements for future developments in Flood Zone 3a (High Probability) Water-compatible uses and less vulnerable development are allowed in this Flood Zone, following testing within the sequential process. Highly vulnerable development is not permitted, and essential infrastructure and more vulnerable development need to pass the Exception Test. Essential infrastructure should be designed and constructed to remain operational and safe for users in times of flood.
Developers should aim to reduce the overall level of flood risk in the area through the layout and form of the development and the appropriate application of sustainable drainage techniques; relocate existing development to land in zones with a lower probability of flooding; and create space for flooding to occur by restoring surface water flood flow pathways and by identifying, allocating and safeguarding open space for flood storage. The following should be considered:
A detailed site-specific FRA must be undertaken in accordance with PPS25 and the Council’s Local Development Framework policies, assessing residual risk from tidal

2011s5199 B&H SFRA - Final Report (v2 Jan12).doc XXI
flooding, risk from all ‘other sources’ of flooding, and the effect of climate change on flood risk over the lifetime of the development .
The effects of the flood risk identified should be mitigated by suitable methods without increasing flood risk elsewhere.
Safe access should be provided to an appropriate level for the type of development. The development should meet the following drainage requirements to reduce flood
risk elsewhere: o Greenfield discharge rates o Use of SUDS
Flood flow routes are preserved, and floodplain storage capacity is not reduced, but where necessary is compensated for on a level for level basis outside of the floodplain.
Consultation with emergency planners and emergency services with regards emergency/evacuation plans.
In addition, any proposed development should be required to provide evidence that the Sequential Test, and if required the Exception Test, have been passed.
D.3.5 Flood risk assessments for Flood Zone 3a
A detailed site specific FRA should be undertaken. It is strongly recommended that the Sequential Test, and, depending on the vulnerability of the development (see Table D.2 of PPS25), the first two parts of the Exception Test be satisfied before the FRA is commenced.
The FRA should meet the following criteria:
If the development is within tidal Flood Zone 3a, assess the flood risk from a breach in, or overtopping of, the tidal defences, and the risk from wave overtopping.
Where necessary demonstrate whether the site is at residual risk from tidal flooding. Identify and detail the level of risk to a development from all sources. Detail how all sources of flood risk will be managed and the consequences mitigated. Where possible show how overall flood risk will be reduced. Undertake a drainage impact assessment to identify the impact of the proposed
development on surface water drainage, including the potential impact upon neighbouring areas, and recommend the approach to controlling runoff to the required discharge rates.
Show that safe access can be provided to an appropriate level for the type of development. Show that flood flow routes are preserved and floodplain storage capacity is not reduced.
Detailed FRAs should be undertaken by a suitably qualified professional. Assessments should be on a site by site basis making use of local knowledge, but an initial assessment of potential sources of flooding can be made by consulting the maps in this SFRA.
D.4 Requirements for future developments in Flood Zone 3b (Functional Floodplain) Currently undeveloped functional floodplain should be protected from development. Therefore development should not be permitted if it would result in the net loss of functional floodplain as defined in PPS25.
Water compatible development, essential infrastructure and redevelopment may be allowed in Flood Zone 3b.
On brownfield sites, buildings, unless permeable to floodwaters, are not considered to be part of the functional floodplain. Land/infrastructure around these buildings is considered to be functional.
If proposed, brownfield floodplain redevelopment must not exceed the existing footprint of the site as the land around these sites is considered to be functional. In addition, where brownfield

2011s5199 B&H SFRA - Final Report (v2 Jan12).doc XXII
redevelopment is proposed the Council should request a detailed site-specific FRA, seek opportunities to apply the policy aims of PPS25, and consider the following:
Removal of buildings and restoration of the natural floodplain. Changing the land use to a less vulnerable classification. Changing the layout and form of the development (e.g. reducing the building
footprint). Preserving and improving flow routes. Improving conveyance/storage, e.g. replacing solid building with building on stilts. Sequential approach to design of site
Brownfield redevelopments within the functional floodplain should also be fully flood resilient to minimise damage and enable quick recovery from flooding.
It should be noted that this only applies to regeneration in functional floodplain areas. In Zone 3a, whilst the same policy aims are included in PPS25, there is a greater presumption that redevelopment can occur, applying the Exception Test where necessary, except where the residual risks are significant.
Essential development which should locate in a functional floodplain will be designed to remain operational at times of flood or incorporate means of mitigation.
D.4.6 Flood risk assessments for Flood Zone 3b
Only planning applications for essential infrastructure, water compatible development or redevelopment will be considered in Flood Zone 3b. It is strongly recommended that the Sequential Test, and (if the development is essential infrastructure), the first two parts of the Exception Test, be satisfied before the FRA is commenced.
A detailed FRA should be produced covering all the requirements for Flood Zone 3a. In addition development should at a minimum:
Not increase the building footprint on the site, and if possible reduce it. Preserve and where possible improve flow routes. Improving conveyance/storage, e.g. replacing solid building with building on stilts. Be fully flood resilient Undertake a sequential approach to design of site
A detailed FRA should also show that the following have been considered and if not suitable provide justification as to why:
Removal of buildings and restoration of the natural floodplain. Changing the land use to a less vulnerable classification. Changing the layout and form of the development (e.g. reducing the building
footprint). Essential infrastructure built within the functional floodplain should:
Remain operational and safe for users in times of flood; Result in no net loss of floodplain storage; Not impede water flows; and Not increase flood risk elsewhere.
D.5 Sites within more than one Flood Zone Where sites cross more than one Flood Zone the sequential approach is applied within development sites to design the site layout to reduce flood risk as much as possible, in accordance with PPS25. Most large developments involve a range of land uses, providing the opportunity to locate more vulnerable land uses in areas of lower risk. High risk areas closer to the river in Flood Zone 3b should be used for recreation and amenity. Further advice is given in the Practice Guide to PPS25.

2011s5199 B&H SFRA - Final Report (v2 Jan12).doc XXIII
It should be noted that the sequential approach is not limited to sites with areas within more than one Flood Zone and should be applied throughout the process.

Offices at
Atherstone DoncasterEdinburgh Haywards Heath Limerick Newcastle upon Tyne Newport Northallerton Saltaire Skipton Tadcaster Wallingford Warrington
Registered Office South Barn Broughton Hall SKIPTON North Yorkshire BD23 3AE
t:+44(0)1756 799919 e:[email protected]
Jeremy Benn Associates Ltd Registered in England 3246693
Visit our website www.jbaconsulting.co.uk