strategy - ambitreports.ambitcapital.com/reports/ambit_strategy_thematic_debunking... · strategy...
TRANSCRIPT
STRATEGY
August 2015
Nitin [email protected]: +91 22 3043 3241
Analysts:
Debunking the MNC premium
Gaurav Mehta, [email protected]: +91 22 3043 3255
Karan [email protected]: +91 22 3043 3251
Saurabh Mukherjea, [email protected]: +91 22 3043 3174
Consultant: Anupam [email protected]
Strategy
August 07, 2015 Ambit Capital Pvt. Ltd. Page 2
CONTENTS
Debunking the MNC premium……………………………………………………… 3
Section 1: Rise of the MNC premium……………………………………………….4
Section 2: Ranking the MNC universe…………………………………………… 11
Section 3: Is the MNC premium sustainable?.............................................. 13
Appendix 1: Case studies from our ‘Listed MNCs - …………………………… 18 The good, the bad and the ugly’ report

Ambit Capital and / or its affiliates do and seek to do business including investment banking with companies covered in its research reports. As a result, investors should be aware that Ambit Capital may have a conflict of interest that could affect the objectivity of this report. Investors should not consider this report as the only factor in making their investment decision.
Debunking the MNC premium
Over the past five years, the valuation premium associated with India’s top-25 MNC stocks has doubled without any major change in their fundamentals. We believe a 2.5x premium relative to the Sensex for these stocks is unsustainable. An improvement in India’s economic growth trajectory will raise competitive intensity and reduce RoEs, even for MNCs. Sustained hostility towards minority shareholders will also limit the premium that these MNCs command. Our proprietary filter for India’s top-25 MNC stocks raises RED flags for ABB India, 3M India, P&G Hygiene, Ambuja Cement, Maruti Suzuki, Alstom T&D and Siemens India. Out of these, we believe ABB India, Alstom T&D and Siemens appear to be particularly exposed, as their valuations are not connected to their earnings growth.
The rise of the MNC premium
Over the past five years (FY10-15), the premium, in P/E terms, of India’s top-25 MNC stocks to the Sensex has doubled to 2.5x. In terms of evolution of market-cap of these stocks, 63% is attributable to P/E multiple expansion whilst only 27% is attributable to earnings growth. Subjective factors driving P/E multiple expansion include the scarcity premium, the delisting theme and – more recently – the ‘safety trade’. We do not see these factors playing a major role in the future. Ranking the MNC universe
Investing in MNC stocks remains a rewarding theme in India. Using our proprietary filters, our analysts back six stocks in which we have a high-level of confidence with regards to the safeguarding of minority interests: Kansai Nerolac, CRISIL, Oracle Financials, GSK Pharma, GSK Consumer and Gujarat Pipavav. Out of the remaining 19, we have RED flags for ABB India, 3M India, P&G Hygiene, Ambuja Cement, Maruti Suzuki, Alstom T&D and Siemens India. Among these RED-flagged companies, we believe ABB India, Alstom T&D and Siemens seem particularly exposed, as their valuations are apparently disconnected to their earnings growth. Is the MNC premium sustainable?
Over the next couple of years, the Indian economy should gain momentum. Whilst MNCs will benefit from this, given the historical trends, this growth could be captured within unlisted subsidiaries at the cost of minority shareholders. Further, cross-country data suggests that as countries become richer, RoEs decline in the face of rising competitive intensity. With risks on growth and corporate governance, a sustained rise of the ‘MNC premium’ is unlikely.
THEMATIC August 07, 2015
Strategy
Top-25 MNCs – overall results Company name Final verdict
Kansai Nerolac GREEN
CRISIL GREEN
Oracle Fin Serv GREEN
GlaxoSmith Pharma GREEN
GlaxoSmith C H L GREEN
Gujarat Pipavav GREEN
Nestle India AMBER
Castrol India AMBER
Blue Dart Express AMBER
WABCO India AMBER
Hind Unilever AMBER
Bosch AMBER
ACC AMBER
Colgate-Palmolive India AMBER
Cummins India AMBER
Gillette India AMBER
Pfizer India AMBER
Whirlpool of India AMBER
Siemens RED
Alstom T&D India RED
Maruti Suzuki* RED
Ambuja Cement RED
P&G Hygiene RED
3M India RED
ABB India RED
Source: Company filings, Ambit Capital research. Note: *Ambit has a Bottom-up BUY on Maruti Suzuki. We arrive at these rankings using seven qualitative and quantitative filters that grade these MNCs on minority friendliness. Flags are in order of importance; a RED flag signals a significant concern, an AMBER flag signals a mild concern, whilst a GREEN flag signals no major concern. THIS NOTE CANNOT BE USED BY THE MEDIA IN ANY SHAPE OR FORM WITHOUT PRIOR CONSENT FROM AMBIT CAPITAL.
Analyst Details
Saurabh Mukherjea, CFA +91 22 3043 3174
Gaurav Mehta, CFA
+91 22 3043 3255
Karan Khanna
+91 22 3043 3251 [email protected]
Consultant: Anupam Gupta
The MNC premium has doubled in the past five years
Source: Bloomberg, Ambit Capital research. Note: MNC P/E is the median P/E for the Top-25 MNCs on current market capitalisation. This chart has been plotted on a monthly basis using trailing P/Es with earnings being 1-year trailing, consolidated, diluted earnings from continuing operations.
1.00
1.50
2.00
2.50
3.00
Jan-10 Jan-11 Jan-12 Jan-13 Jan-14 Jan-15
MNC P/E v/s Sensex P/E
Strategy
August 07, 2015 Ambit Capital Pvt. Ltd. Page 4
Section 1: Rise of the MNC premium “In a bull market, one must avoid the error of the preening duck that quacks boastfully after a torrential rainstorm, thinking that its paddling skills have caused it to rise in the world.” – Warren Buffett, letter to shareholders, 1997. Investors’ preference for MNC stocks has been led by factors like superior capital allocation, better R&D and professional management. However, over the past five years, the ‘MNC premium’ has doubled, with most of the rise attributed to P/E multiple expansion. Thus, investors are willing to pay even more today for the ‘MNC’ tag. We track the evolution of the ‘MNC premium’ and analyse factors leading to its dizzying ascent.
MNCs – A background ‘Multinational Companies’ (MNCs) have a long history in India, with some of them – like Hindustan Unilever – incorporated as far back as 1933. The Foreign Exchange Regulation Act (FERA) in 1974 restricted foreign equity participation to 40%, forcing MNCs to raise the rest from Indian shareholders. This resulted in famous MNC exits from India like Coca Cola, IBM and Mobil. Since then, India’s corporate laws have become friendlier, and currently, there are about 100 listed MNCs in India. In addition, global parent companies have now been listed in India through acquisitions, such as Maruti Suzuki, Ambuja Cement (a part of Holcim) and CRISIL (now majority owned by Standard & Poor’s, USA). For the purpose of this report, we define ‘MNCs’ as companies listed in India where the promoter is an MNC. We then choose the 25 largest MNCs (by market capitalisation) from the BSE500 Index and exclude United Breweries (UBL) given that its association with Heineken is recent (Heineken became the largest shareholder in UBL only in 2013). The final list of the ‘Top-25 MNCs’ (as we will refer to them in this report) is shown in Exhibit 1 below. Exhibit 1: India's top-25 MNC stocks
Company Incorporated In
Promoter Holding (%)
Market Cap (Rsbn)
Hindustan Unilever Ltd 1933 67 1,964
Maruti Suzuki India Ltd 1981 56 1,345
Bosch Ltd 1951 71 829
Nestle India Ltd 1959 63 625
Siemens Ltd 1957 75 543
Ambuja Cements Ltd 1981 50 357
Oracle Financial Services Software Ltd 1989 75 356
Cummins India Ltd 1962 51 320
GlaxoSmithKline Pharmaceuticals Ltd 1924 75 316
ABB India Ltd 1949 75 292
Colgate-Palmolive India Ltd 1937 51 276
GlaxoSmithKline Consumer Healthcare Ltd 1958 72 265
ACC Ltd 1936 50 264
Castrol India Ltd 1979 71 242
Procter & Gamble Hygiene & Health Care L 1964 71 210
Gillette India Ltd 1984 75 178
Blue Dart Express Ltd 1991 75 173
CRISIL Ltd 1987 67 143
Kansai Nerolac Paints Ltd 1920 69 138
Alstom T&D India Ltd 1957 75 137
WABCO India Ltd 2004 75 126
3M India Ltd 1987 75 118
Pfizer Ltd/India 1950 64 111
Gujarat Pipavav Port Ltd 1992 43 104
Whirlpool of India Ltd 1960 75 96
Source: Bloomberg, Ambit Capital research; Note: Market-cap as on August 06, 2015
MNCs have a long history in India
From the 100-odd listed MNCs listed in India….
…we choose the top 25 by market-cap
Strategy
August 07, 2015 Ambit Capital Pvt. Ltd. Page 5
Investing in MNCs has paid off
Note that the price performance of MNC stocks from the BSE500 universe has been impressive over multiple time-frames, as shown in the exhibit below.
Exhibit 2: MNCs in general have beaten benchmarks by a large margin
CAGR 1yr 3yr 5yr 10yr
BSE500 Index 16% 23% 12% 16%
MNC universe 49% 30% 22% 21%
Source: Bloomberg, Ambit Capital research. Note: Prices have been taken as of 21st July 2015. Hence, 1yr performance compares price performances of BSE500 Index and MNC stocks from the BSE500 index for the period 21st July 2014 to 21st July 2015 and so on for 3yr (2012-2015), 5yr (2010-2015) and 10yr (2005-2015) periods.
Amongst the key reasons behind these firms’ superior share price performance has been the way MNCs manage cash, as highlighted in our July 31, 2013 thematic report, ‘The cash flow conundrum for India Inc’, and in the way they bring world-class technology and professional management methods to India. As a result, across a set of fundamental metrics like accounting quality (as per Ambit’s accounting quality framework), RoCEs and RoEs, MNCs perform better than an average BSE500 firm.
Exhibit 3: Fundamentals - MNCs vs BSE500 universe
Fundamentals Median Accounting Score
Median RoCE
Median RoE
Median Fixed Asset turnover
BSE500 Index 192 15% 13% 1.9
MNC universe 213 21% 15% 3.5
Source: Bloomberg, Company, Ambit Capital research; Note: Accounting score is median accounting score for the MNC universe and the BSE500 index constituents using our proprietary ‘forensic accounting’ framework (click here for more details).
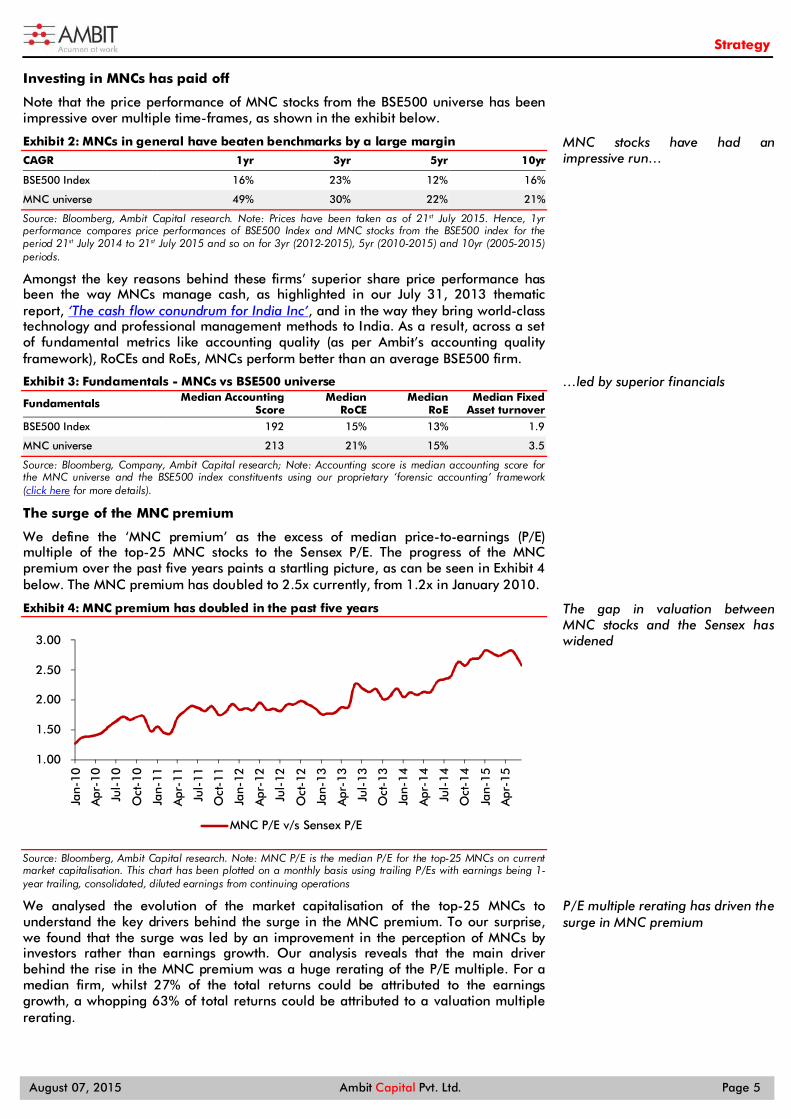
The surge of the MNC premium
We define the ‘MNC premium’ as the excess of median price-to-earnings (P/E) multiple of the top-25 MNC stocks to the Sensex P/E. The progress of the MNC premium over the past five years paints a startling picture, as can be seen in Exhibit 4 below. The MNC premium has doubled to 2.5x currently, from 1.2x in January 2010.
Exhibit 4: MNC premium has doubled in the past five years
Source: Bloomberg, Ambit Capital research. Note: MNC P/E is the median P/E for the top-25 MNCs on current market capitalisation. This chart has been plotted on a monthly basis using trailing P/Es with earnings being 1-year trailing, consolidated, diluted earnings from continuing operations
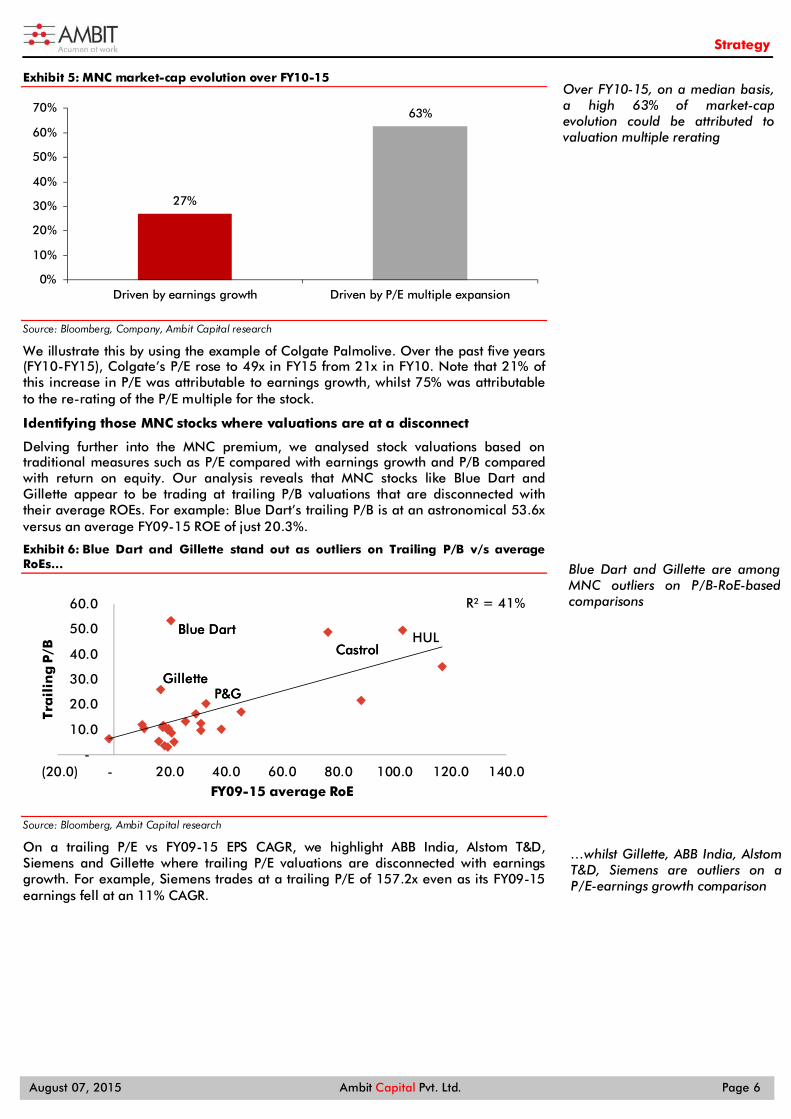
We analysed the evolution of the market capitalisation of the top-25 MNCs to understand the key drivers behind the surge in the MNC premium. To our surprise, we found that the surge was led by an improvement in the perception of MNCs by investors rather than earnings growth. Our analysis reveals that the main driver behind the rise in the MNC premium was a huge rerating of the P/E multiple. For a median firm, whilst 27% of the total returns could be attributed to the earnings growth, a whopping 63% of total returns could be attributed to a valuation multiple rerating.
1.00
1.50
2.00
2.50
3.00
Jan-
10
Apr
-10
Jul-
10
Oct
-10
Jan-
11
Apr
-11
Jul-
11
Oct
-11
Jan-
12
Apr
-12
Jul-
12
Oct
-12
Jan-
13
Apr
-13
Jul-
13
Oct
-13
Jan-
14
Apr
-14
Jul-
14
Oct
-14
Jan-
15
Apr
-15
MNC P/E v/s Sensex P/E
MNC stocks have had an impressive run…
…led by superior financials
The gap in valuation between MNC stocks and the Sensex has widened
P/E multiple rerating has driven the surge in MNC premium
Strategy
August 07, 2015 Ambit Capital Pvt. Ltd. Page 6
Exhibit 5: MNC market-cap evolution over FY10-15
Source: Bloomberg, Company, Ambit Capital research
We illustrate this by using the example of Colgate Palmolive. Over the past five years (FY10-FY15), Colgate’s P/E rose to 49x in FY15 from 21x in FY10. Note that 21% of this increase in P/E was attributable to earnings growth, whilst 75% was attributable to the re-rating of the P/E multiple for the stock.
Identifying those MNC stocks where valuations are at a disconnect
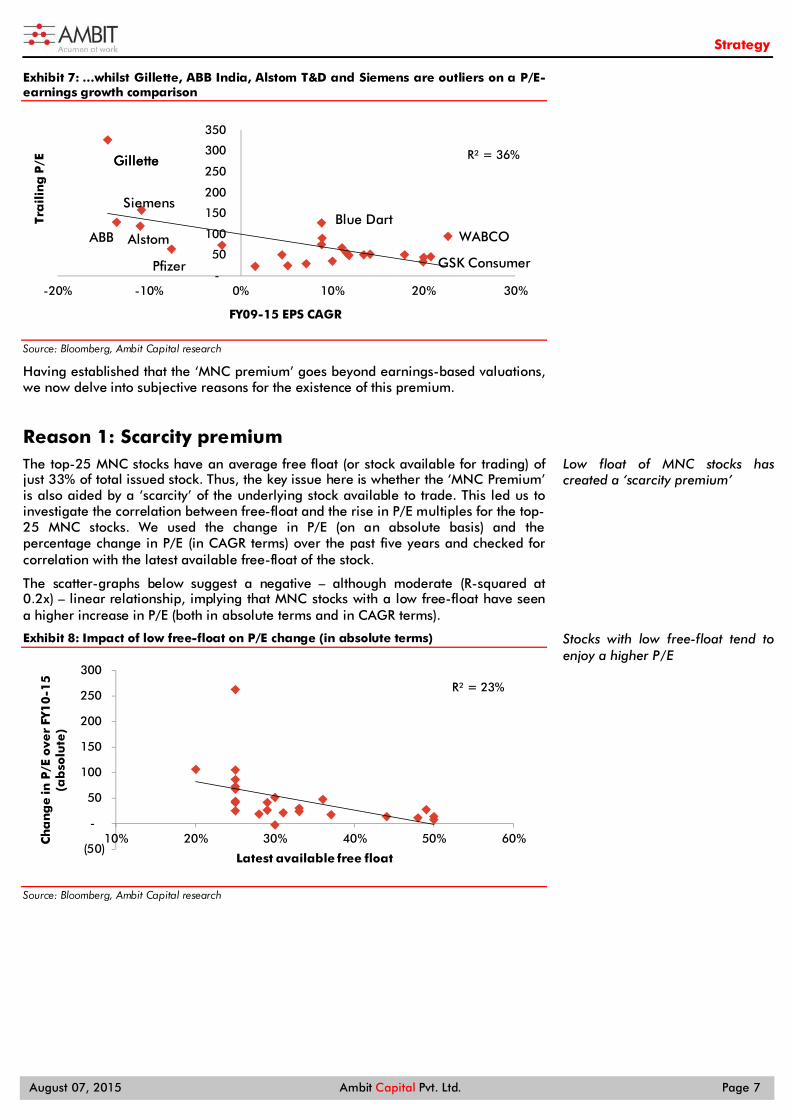
Delving further into the MNC premium, we analysed stock valuations based on traditional measures such as P/E compared with earnings growth and P/B compared with return on equity. Our analysis reveals that MNC stocks like Blue Dart and Gillette appear to be trading at trailing P/B valuations that are disconnected with their average ROEs. For example: Blue Dart’s trailing P/B is at an astronomical 53.6x versus an average FY09-15 ROE of just 20.3%.
Exhibit 6: Blue Dart and Gillette stand out as outliers on Trailing P/B v/s average RoEs…
Source: Bloomberg, Ambit Capital research
On a trailing P/E vs FY09-15 EPS CAGR, we highlight ABB India, Alstom T&D, Siemens and Gillette where trailing P/E valuations are disconnected with earnings growth. For example, Siemens trades at a trailing P/E of 157.2x even as its FY09-15 earnings fell at an 11% CAGR.
27%
63%
0%
10%
20%
30%
40%
50%
60%
70%
Driven by earnings growth Driven by P/E multiple expansion
R² = 41%
-
10.0
20.0
30.0
40.0
50.0
60.0
(20.0) - 20.0 40.0 60.0 80.0 100.0 120.0 140.0
Tra
ilin
g P
/B
FY09-15 average RoE
Castrol
Blue Dart
GilletteP&G
Castrol
Blue Dart
GilletteP&G
HUL
Over FY10-15, on a median basis, a high 63% of market-cap evolution could be attributed to valuation multiple rerating
Blue Dart and Gillette are among MNC outliers on P/B-RoE-based comparisons
…whilst Gillette, ABB India, Alstom T&D, Siemens are outliers on a P/E-earnings growth comparison
Strategy
August 07, 2015 Ambit Capital Pvt. Ltd. Page 7
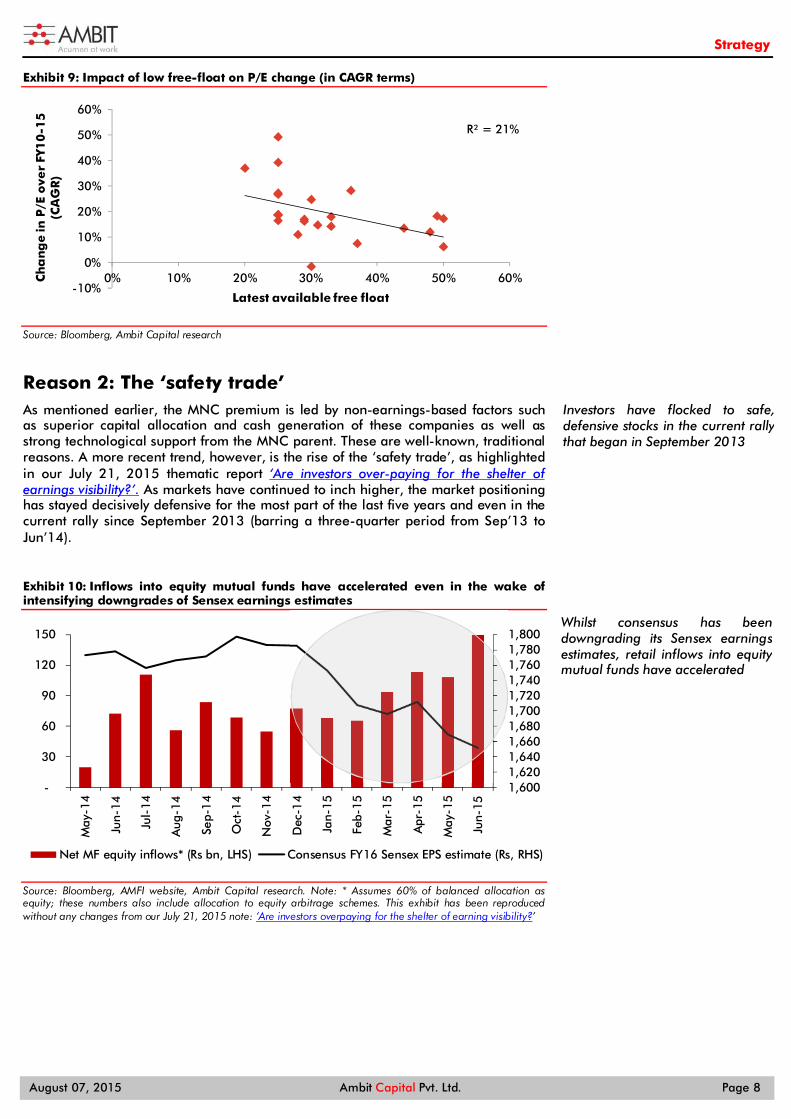
Exhibit 7: …whilst Gillette, ABB India, Alstom T&D and Siemens are outliers on a P/E-earnings growth comparison
Source: Bloomberg, Ambit Capital research
Having established that the ‘MNC premium’ goes beyond earnings-based valuations, we now delve into subjective reasons for the existence of this premium.
Reason 1: Scarcity premium The top-25 MNC stocks have an average free float (or stock available for trading) of just 33% of total issued stock. Thus, the key issue here is whether the ‘MNC Premium’ is also aided by a ‘scarcity’ of the underlying stock available to trade. This led us to investigate the correlation between free-float and the rise in P/E multiples for the top-25 MNC stocks. We used the change in P/E (on an absolute basis) and the percentage change in P/E (in CAGR terms) over the past five years and checked for correlation with the latest available free-float of the stock.
The scatter-graphs below suggest a negative – although moderate (R-squared at 0.2x) – linear relationship, implying that MNC stocks with a low free-float have seen a higher increase in P/E (both in absolute terms and in CAGR terms).
Exhibit 8: Impact of low free-float on P/E change (in absolute terms)
Source: Bloomberg, Ambit Capital research
R² = 36%
-
50
100
150
200
250
300
350
-20% -10% 0% 10% 20% 30%
Tra
ilin
g P
/E
FY09-15 EPS CAGR
Gillette
ABB
Siemens
Alstom
Gillette
Pfizer
Blue DartWABCO
GSK Consumer
R² = 23%
(50)
-
50
100
150
200
250
300
10% 20% 30% 40% 50% 60%Ch
an
ge
in P
/E o
ver
FY1
0-1
5
(ab
solu
te)
Latest available free float
Low float of MNC stocks has created a ‘scarcity premium’
Stocks with low free-float tend to enjoy a higher P/E
Strategy
August 07, 2015 Ambit Capital Pvt. Ltd. Page 8
Exhibit 9: Impact of low free-float on P/E change (in CAGR terms)
Source: Bloomberg, Ambit Capital research
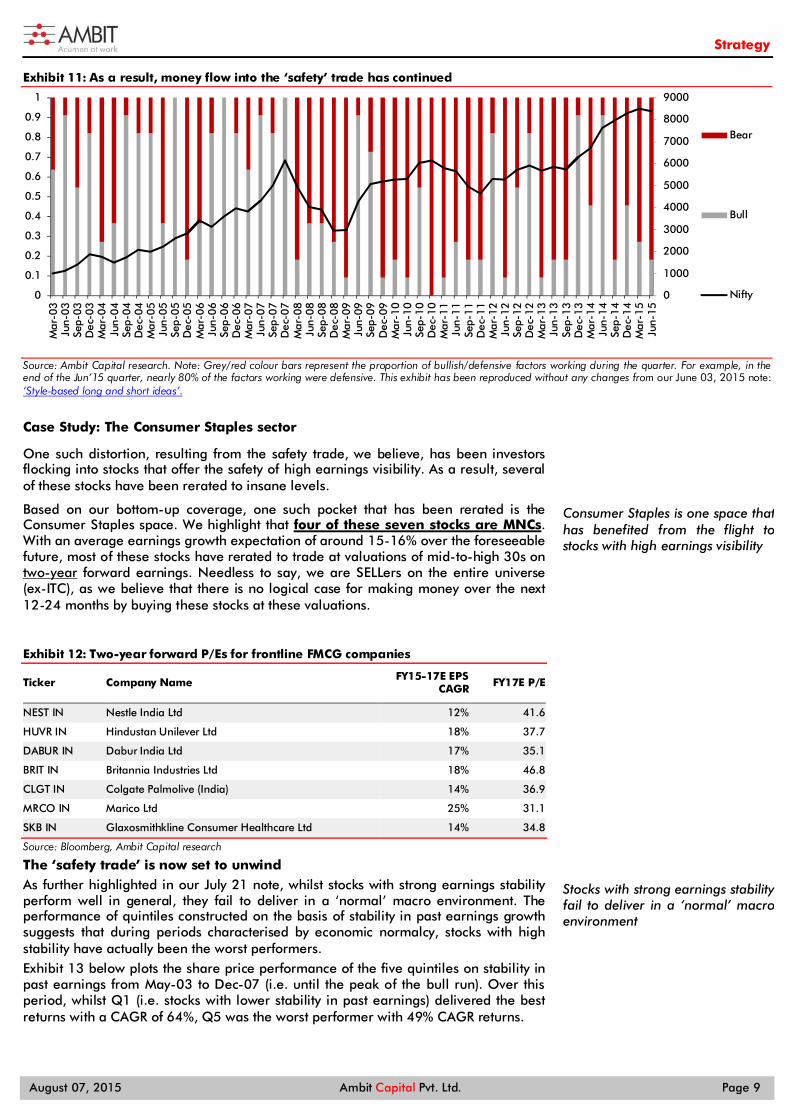
Reason 2: The ‘safety trade’ As mentioned earlier, the MNC premium is led by non-earnings-based factors such as superior capital allocation and cash generation of these companies as well as strong technological support from the MNC parent. These are well-known, traditional reasons. A more recent trend, however, is the rise of the ‘safety trade’, as highlighted in our July 21, 2015 thematic report ‘Are investors over-paying for the shelter of earnings visibility?’. As markets have continued to inch higher, the market positioning has stayed decisively defensive for the most part of the last five years and even in the current rally since September 2013 (barring a three-quarter period from Sep’13 to Jun’14).
Exhibit 10: Inflows into equity mutual funds have accelerated even in the wake of intensifying downgrades of Sensex earnings estimates
Source: Bloomberg, AMFI website, Ambit Capital research. Note: * Assumes 60% of balanced allocation as equity; these numbers also include allocation to equity arbitrage schemes. This exhibit has been reproduced without any changes from our July 21, 2015 note: ‘Are investors overpaying for the shelter of earning visibility?’
R² = 21%
-10%
0%
10%
20%
30%
40%
50%
60%
0% 10% 20% 30% 40% 50% 60%Ch
an
ge
in P
/E o
ver
FY1
0-1
5
(CA
GR
)
Latest available free float
1,600 1,620 1,640 1,660 1,680 1,700 1,720 1,740 1,760 1,780 1,800
-
30
60
90
120
150
May
-14
Jun-
14
Jul-
14
Aug
-14
Sep-
14
Oct
-14
Nov
-14
Dec
-14
Jan-
15
Feb-
15
Mar
-15
Apr
-15
May
-15
Jun-
15
Net MF equity inflows* (Rs bn, LHS) Consensus FY16 Sensex EPS estimate (Rs, RHS)
Investors have flocked to safe, defensive stocks in the current rally that began in September 2013
Whilst consensus has been downgrading its Sensex earnings estimates, retail inflows into equity mutual funds have accelerated
Strategy
August 07, 2015 Ambit Capital Pvt. Ltd. Page 9
Exhibit 11: As a result, money flow into the ‘safety’ trade has continued
Source: Ambit Capital research. Note: Grey/red colour bars represent the proportion of bullish/defensive factors working during the quarter. For example, in the end of the Jun’15 quarter, nearly 80% of the factors working were defensive. This exhibit has been reproduced without any changes from our June 03, 2015 note: ‘Style-based long and short ideas’.
Case Study: The Consumer Staples sector
One such distortion, resulting from the safety trade, we believe, has been investors flocking into stocks that offer the safety of high earnings visibility. As a result, several of these stocks have been rerated to insane levels.
Based on our bottom-up coverage, one such pocket that has been rerated is the Consumer Staples space. We highlight that four of these seven stocks are MNCs. With an average earnings growth expectation of around 15-16% over the foreseeable future, most of these stocks have rerated to trade at valuations of mid-to-high 30s on two-year forward earnings. Needless to say, we are SELLers on the entire universe (ex-ITC), as we believe that there is no logical case for making money over the next 12-24 months by buying these stocks at these valuations.
Exhibit 12: Two-year forward P/Es for frontline FMCG companies
Ticker Company Name FY15-17E EPS CAGR FY17E P/E
NEST IN Nestle India Ltd 12% 41.6
HUVR IN Hindustan Unilever Ltd 18% 37.7
DABUR IN Dabur India Ltd 17% 35.1
BRIT IN Britannia Industries Ltd 18% 46.8
CLGT IN Colgate Palmolive (India) 14% 36.9
MRCO IN Marico Ltd 25% 31.1
SKB IN Glaxosmithkline Consumer Healthcare Ltd 14% 34.8
Source: Bloomberg, Ambit Capital research
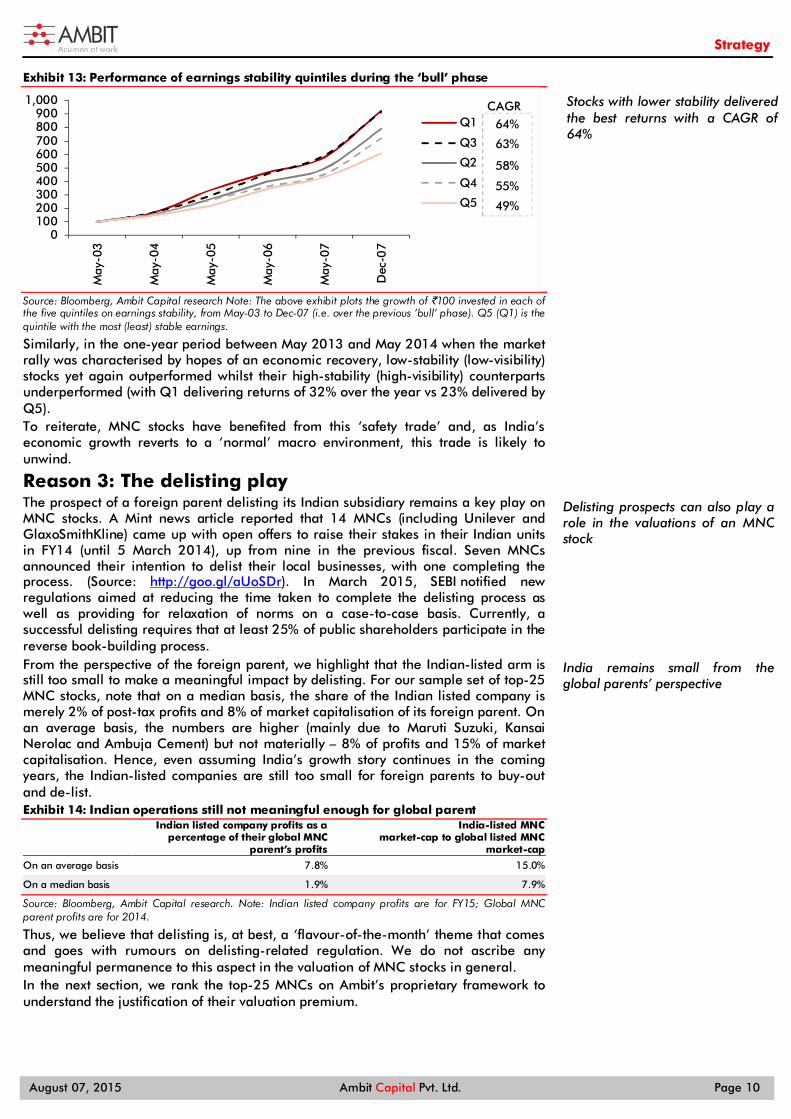
The ‘safety trade’ is now set to unwind As further highlighted in our July 21 note, whilst stocks with strong earnings stability perform well in general, they fail to deliver in a ‘normal’ macro environment. The performance of quintiles constructed on the basis of stability in past earnings growth suggests that during periods characterised by economic normalcy, stocks with high stability have actually been the worst performers. Exhibit 13 below plots the share price performance of the five quintiles on stability in past earnings from May-03 to Dec-07 (i.e. until the peak of the bull run). Over this period, whilst Q1 (i.e. stocks with lower stability in past earnings) delivered the best returns with a CAGR of 64%, Q5 was the worst performer with 49% CAGR returns.
0
1000
2000
3000
4000
5000
6000
7000
8000
9000
0
0.1
0.2
0.3
0.4
0.5
0.6
0.7
0.8
0.9
1
Mar
-03
Jun-
03Se
p-03
Dec
-03
Mar
-04
Jun-
04Se
p-04
Dec
-04
Mar
-05
Jun-
05Se
p-05
Dec
-05
Mar
-06
Jun-
06Se
p-06
Dec
-06
Mar
-07
Jun-
07Se
p-07
Dec
-07
Mar
-08
Jun-
08Se
p-08
Dec
-08
Mar
-09
Jun-
09Se
p-09
Dec
-09
Mar
-10
Jun-
10Se
p-10
Dec
-10
Mar
-11
Jun-
11Se
p-11
Dec
-11
Mar
-12
Jun-
12Se
p-12
Dec
-12
Mar
-13
Jun-
13Se
p-13
Dec
-13
Mar
-14
Jun-
14Se
p-14
Dec
-14
Mar
-15
Jun-
15
Bear
Bull
Nifty
Consumer Staples is one space that has benefited from the flight to stocks with high earnings visibility
Stocks with strong earnings stabilityfail to deliver in a ‘normal’ macro environment
Strategy
August 07, 2015 Ambit Capital Pvt. Ltd. Page 10
Exhibit 13: Performance of earnings stability quintiles during the ‘bull’ phase
Source: Bloomberg, Ambit Capital research Note: The above exhibit plots the growth of `100 invested in each of the five quintiles on earnings stability, from May-03 to Dec-07 (i.e. over the previous ‘bull’ phase). Q5 (Q1) is the quintile with the most (least) stable earnings.
Similarly, in the one-year period between May 2013 and May 2014 when the market rally was characterised by hopes of an economic recovery, low-stability (low-visibility) stocks yet again outperformed whilst their high-stability (high-visibility) counterparts underperformed (with Q1 delivering returns of 32% over the year vs 23% delivered by Q5). To reiterate, MNC stocks have benefited from this ‘safety trade’ and, as India’s economic growth reverts to a ‘normal’ macro environment, this trade is likely to unwind.
Reason 3: The delisting play The prospect of a foreign parent delisting its Indian subsidiary remains a key play on MNC stocks. A Mint news article reported that 14 MNCs (including Unilever and GlaxoSmithKline) came up with open offers to raise their stakes in their Indian units in FY14 (until 5 March 2014), up from nine in the previous fiscal. Seven MNCs announced their intention to delist their local businesses, with one completing the process. (Source: http://goo.gl/aUoSDr). In March 2015, SEBI notified new regulations aimed at reducing the time taken to complete the delisting process as well as providing for relaxation of norms on a case-to-case basis. Currently, a successful delisting requires that at least 25% of public shareholders participate in the reverse book-building process. From the perspective of the foreign parent, we highlight that the Indian-listed arm is still too small to make a meaningful impact by delisting. For our sample set of top-25 MNC stocks, note that on a median basis, the share of the Indian listed company is merely 2% of post-tax profits and 8% of market capitalisation of its foreign parent. On an average basis, the numbers are higher (mainly due to Maruti Suzuki, Kansai Nerolac and Ambuja Cement) but not materially – 8% of profits and 15% of market capitalisation. Hence, even assuming India’s growth story continues in the coming years, the Indian-listed companies are still too small for foreign parents to buy-out and de-list. Exhibit 14: Indian operations still not meaningful enough for global parent
Indian listed company profits as a percentage of their global MNC
parent’s profits
India-listed MNC market-cap to global listed MNC
market-cap
On an average basis 7.8% 15.0%
On a median basis 1.9% 7.9%
Source: Bloomberg, Ambit Capital research. Note: Indian listed company profits are for FY15; Global MNC parent profits are for 2014.
Thus, we believe that delisting is, at best, a ‘flavour-of-the-month’ theme that comes and goes with rumours on delisting-related regulation. We do not ascribe any meaningful permanence to this aspect in the valuation of MNC stocks in general. In the next section, we rank the top-25 MNCs on Ambit’s proprietary framework to understand the justification of their valuation premium.
0100200300400500600700800900
1,000M
ay-0
3
May
-04
May
-05
May
-06
May
-07
Dec
-07
Q1
Q3
Q2
Q4
Q5
CAGR64%
63%
58%
55%
49%
Stocks with lower stability delivered the best returns with a CAGR of 64%
Delisting prospects can also play a role in the valuations of an MNC stock
India remains small from the global parents’ perspective

Strategy
August 07, 2015 Ambit Capital Pvt. Ltd. Page 11
Section 2: Ranking the MNC universe "We made too many wrong mistakes."
- Yogi Berra on why the Yankees lost the 1960 baseball series (2003)
Rather than paint all the MNC stocks with a single brush, we screen our sample set for their minority friendliness. Only six of India’s top-25 largest MNC stocks – Oracle Fin, GSK Pharma, GSK Consumer, CRISIL, Kansai Nerolac and Gujarat Pipavav – make it through our proprietary framework. Investors should therefore question the premiums commanded by the seven stocks that score a “Red” flag on our screen.
A framework for sifting through MNC stocks
Given their advantages of superior technology and management quality, as well as proven track record on capital allocation, we believe MNCs will continue to differentiate themselves over domestic companies. Moreover, investing in MNC stocks has been a rewarding experience, as highlighted in Exhibits 3 and 4, in Section 1.
We believe that minority-friendliness is a key factor on which MNCs can distinguish themselves. Past experience, however, is less than inspiring. We dealt with this issue in depth in our March 07, 2014 thematic report, ‘Listed MNCs - The good, the bad & the ugly’. In this report, we created a framework for investors to rank MNCs on minority-friendliness. We now repeat this framework to rank our universe of India’s top-25 MNC stocks.
These rankings should help investors address the non-earnings-based factors in general and minority-friendliness in particular, which add to the ‘MNC premium’.
Our MNC screener consists of the following parameters:
Royalty and related payments as a percentage of sales
We rank the various MNCs based on their five-year median royalty and related payments as a percentage of net sales over FY10-14. The rationale is to penalise firms which have made the highest royalty payments to their foreign parent. MNCs with royalty & related payments more than 4% of sales get a RED flag, those with royalty & related payments between 0.7% and 4% of sales get an AMBER flag, and those with royalty & related payments less than 0.7% of sales get a GREEN flag.
CAGR in royalty and related payments vs CAGR in net sales
Here we rank the various MNCs based on CAGR in royalty and related payments vs CAGR in net sales over the last five years (FY09-14). We choose to look at the FY09-14 period because the Government had relaxed its norms pertaining to royalty payments in FY10. The rationale is to penalise firms which have shown higher growth in royalty & related payments in comparison to their sales growth. MNCs where the ratio of CAGR in royalty & related payments to CAGR in net sales is more than 2x get a RED flag, those between 1x-2x get an AMBER flag while those with <1x get a GREEN flag.
Dividend payout history
We rank the various MNCs based on their five-year median dividend payout ratios over FY10-14. The rationale is to penalise firms that have had a relatively stingy dividend payout history whilst rewarding firms which have been generous in rewarding their shareholders. Those MNCs where dividend payout is less than 10% of post-tax profits get a RED flag, those with dividend payout of between 10-40% of post-tax profits get an AMBER flag while those with dividend payout greater than 40% get a GREEN flag.
Only six of India’s top-25 largest MNCs make it through our filter
Painting all MNC stocks with the same brush would be unfair
Minority-friendliness is a key factor for ascribing an MNC premium
Strategy
August 07, 2015 Ambit Capital Pvt. Ltd. Page 12
M&A transactions with group companies
With the intention of penalising firms that have indulged repeatedly in M&A transactions with group companies (as this raises suspicion regarding the intent and consequently the appropriateness of valuations at which these deals are struck), we look at the last ten years of M&A activities for these firms. Hence, those MNCs with multiple M&A transactions get a RED flag, those MNCs where M&A transactions are not that frequent get an AMBER flag and those with no M&A transactions or M&A transactions that are not that material get a GREEN flag.
Competing unlisted subsidiaries
Whilst the rationale of setting up another subsidiary in addition to the listed subsidiary is often not clear, on the face of it this also implies a loss of an opportunity for the local listed subsidiary. We look at operations of other unlisted subsidiaries of these foreign parents in India. The rationale is to penalise firms where the foreign parent has operations outside the listed entity in competing lines of business. MNCs are given RED, AMBER or GREEN flag depending upon the size and nature of business of the unlisted subsidiaries.
Depressed share prices around open offers
We look at the last ten years of open offer history for these MNCs to identify instances where share prices may have been suppressed before the announcement of these open offers. We penalise firms whose share prices declined by 10% or more over the previous three months or six months before the open offer announcement. Hence, MNCs where the stock price has declined by 10% or more in either the preceding three month period or the preceding six month period get a RED flag, otherwise they get a GREEN flag.
CEO incentivisation
We rank the various MNCs based on incentives received by the CEO. An incentive structure that aligns local management deliverables with the local shareholders is superior to one based on share of profits of the parent or share plans linked to the global parent. If remuneration is linked to earnings of the global parent, the CEO would be more interested in boosting profits of the global parent than the Indian subsidiary. Thus, MNCs where the local senior management get stock options that are linked to the global parent but not the local MNC get a RED flag. In case of MNCs where the local senior management get stock options in both the global parent as well as the local MNC, we give an AMBER flag. Finally, we assign a GREEN flag if the local senior management gets stock options in the local MNC but not the global parent, or the local senior management does not get any ESOPs.
Methodology: We allot RED, AMBER and GREEN flags to the response on each of the seven issues. Flags are in order of importance; a RED flag signals a noticeable concern, an AMBER flag signals a mild concern, whilst a GREEN flag signals no major concern. RED flags get a score of zero, AMBER flags get a score of one and GREEN flags get the highest score of two. Thus, for the seven parameters in our framework, scores are between 0 and 14.
Strategy
August 07, 2015 Ambit Capital Pvt. Ltd. Page 13
Tying it all together
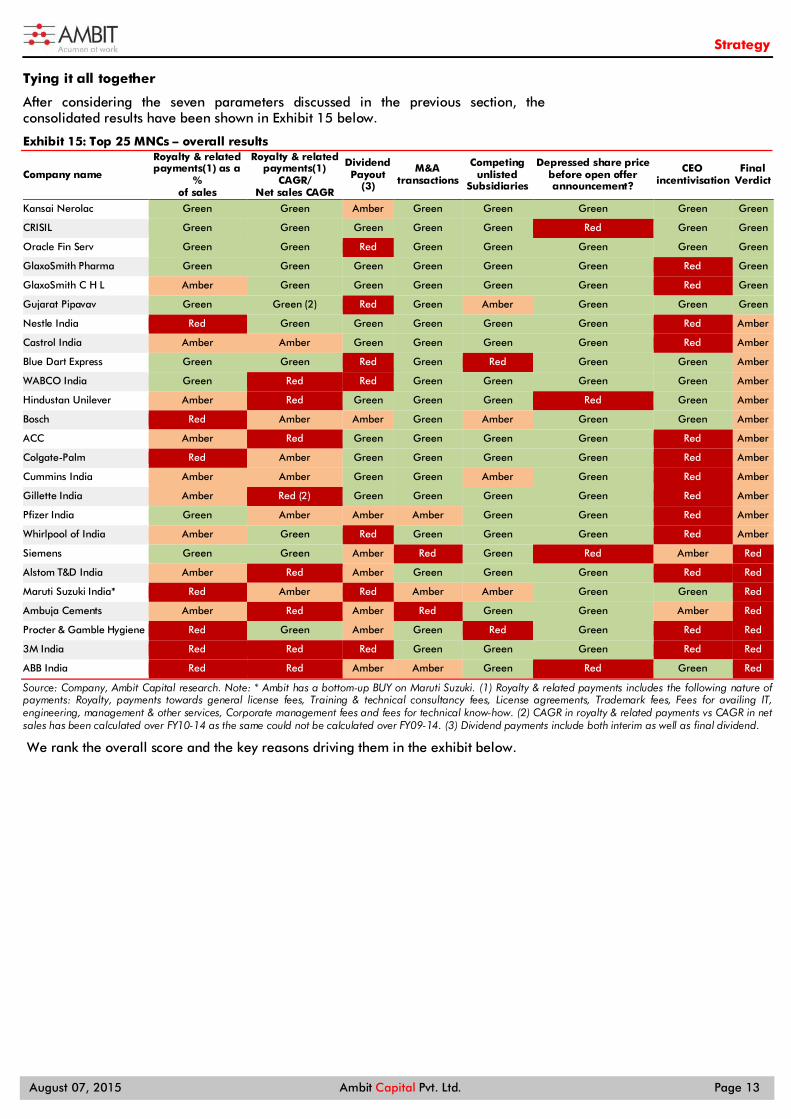
After considering the seven parameters discussed in the previous section, the consolidated results have been shown in Exhibit 15 below.
Exhibit 15: Top 25 MNCs – overall results
Company name
Royalty & related payments(1) as a
% of sales
Royalty & related payments(1)
CAGR/ Net sales CAGR
Dividend Payout
(3)
M&A transactions
Competing unlisted
Subsidiaries
Depressed share price before open offer announcement?
CEO incentivisation
Final Verdict
Kansai Nerolac Green Green Amber Green Green Green Green Green
CRISIL Green Green Green Green Green Red Green Green
Oracle Fin Serv Green Green Red Green Green Green Green Green
GlaxoSmith Pharma Green Green Green Green Green Green Red Green
GlaxoSmith C H L Amber Green Green Green Green Green Red Green
Gujarat Pipavav Green Green (2) Red Green Amber Green Green Green
Nestle India Red Green Green Green Green Green Red Amber
Castrol India Amber Amber Green Green Green Green Red Amber
Blue Dart Express Green Green Red Green Red Green Green Amber
WABCO India Green Red Red Green Green Green Green Amber
Hindustan Unilever Amber Red Green Green Green Red Green Amber
Bosch Red Amber Amber Green Amber Green Green Amber
ACC Amber Red Green Green Green Green Red Amber
Colgate-Palm Red Amber Green Green Green Green Red Amber
Cummins India Amber Amber Green Green Amber Green Red Amber
Gillette India Amber Red (2) Green Green Green Green Red Amber
Pfizer India Green Amber Amber Amber Green Green Red Amber
Whirlpool of India Amber Green Red Green Green Green Red Amber
Siemens Green Green Amber Red Green Red Amber Red
Alstom T&D India Amber Red Amber Green Green Green Red Red
Maruti Suzuki India* Red Amber Red Amber Amber Green Green Red
Ambuja Cements Amber Red Amber Red Green Green Amber Red
Procter & Gamble Hygiene Red Green Amber Green Red Green Red Red
3M India Red Red Red Green Green Green Red Red
ABB India Red Red Amber Amber Green Red Green Red
Source: Company, Ambit Capital research. Note: * Ambit has a bottom-up BUY on Maruti Suzuki. (1) Royalty & related payments includes the following nature of payments: Royalty, payments towards general license fees, Training & technical consultancy fees, License agreements, Trademark fees, Fees for availing IT, engineering, management & other services, Corporate management fees and fees for technical know-how. (2) CAGR in royalty & related payments vs CAGR in net sales has been calculated over FY10-14 as the same could not be calculated over FY09-14. (3) Dividend payments include both interim as well as final dividend.
We rank the overall score and the key reasons driving them in the exhibit below.

Strategy
August 07, 2015 Ambit Capital Pvt. Ltd. Page 14
Exhibit 16: Ranking and rationale behind MNC scores Company name Score Flag level Key reasons FY16 P/E FY16 P/B
Kansai Nerolac 13 GREEN Scores well across most of the parameters, room for improvement on dividend payout 37.1 7.3
CRISIL 12 GREEN Scores well across all the parameters; but misses on share price performance pre-open offer 48.2 15.1
Oracle Fin Serv 12 GREEN Among best capital allocators but loses on low dividend payout 25.5 8.3
GlaxoSmith Pharma 12 GREEN Generous dividend payout, no royalty payment, but misses on CEO incentivisation 52.0 16.3
GlaxoSmith C H L 11 GREEN Strong track record on capital allocation but misses on CEO incentivisation 37.6 10.6
Gujarat Pipavav 11 GREEN Promoter has proven track record but Indian arm slips on dividend payout 24.4 4.7
Nestle India 10 AMBER High royalty and royalty related payments; also misses on CEO incentivisation 55.4 20.9
Castrol India 10 AMBER Misses on CEO incentivisation; AMBER flags on royalty and royalty related payments 37.1 42.6
Blue Dart Express 10 AMBER Misses on dividend payout and significant revenues in unlisted subsidiaries in similar line of business 80.6 23.1
WABCO India 10 AMBER Growth in royalty and related payments has outpaced sales growth; low dividend payout 60.8 12.0
Hind Unilever 9 AMBER Growth in royalty and related payments has outpaced sales growth; depressed share price pre-open offer 43.0 42.8
Bosch 9 AMBER High royalty and royalty related payments as a percentage of sales; AMBER flags on growth in royalty and royalty related payments v/s growth in net sales and dividend payout
56.9 9.7
ACC 9 AMBER Growth in royalty and related payments has outpaced sales growth; also misses on CEO incentivisation 27.9 3.1
Colgate-Palm 9 AMBER High royalty and royalty-related payments; also misses on CEO incentivisation 43.6 30.4
Cummins India 9 AMBER Misses on CEO incentivisation; AMBER flags on royalty and royalty-related payments as well as on competing unlisted subsidiaries
36.6 10.1
Gillette India 9 AMBER Growth in royalty and related payments has outpaced sales growth; also misses on CEO incentivisation 343.2# 27.4#
Pfizer India 9 AMBER Misses on CEO incentivisation; AMBER flags on high growth in royalty payments and low dividend payout 37.8 6.3
Whirlpool of India 9 AMBER Low dividend payout; also misses on CEO incentivisation 37.4 8.5
Siemens 8 RED RED flags on M&A transactions and depressed share price before open offer 72.0 9.7
Alstom T&D India 8 RED RED flags on growth in royalty and related payments outpacing sales growth and CEO incentivisation 61.9 9.4
Maruti Suzuki* 7 RED RED flags on royalty and related payment and AMBER flags on growth in royalty payment, M&A transactions and unlisted subsidiaries
26.0 4.8
Ambuja Cem 7 RED RED flags on growth in royalty and related payments outpacing sales growth and M&A transactions 25.1 2.9
P&G Hygiene 7 RED RED flags on royalty and related payment, competing unlisted subsidiaries and CEO incentivisation 65.4 17.8
3M India 6 RED RED flags on royalty and related payments (including high growth in these payments), low dividend payout and CEO incentivisation 107.5# 14.4#
ABB India 6 RED RED flags on royalty and related payments (including high growth in these payments) and depressed share price pre-open offer 94.5 9.7
Source: Company, Bloomberg, Ambit Capital research. Note: * Ambit has a bottom-up BUY on Maruti Suzuki. # indicates this is on a trailing basis since FY16 estimates are no available.
Strategy
August 07, 2015 Ambit Capital Pvt. Ltd. Page 15
Section 3: Is the MNC premium sustainable? “But it remains the case that you know what is wrong with a lot more confidence than you know what is right.”
- Nassim Nicholas Taleb in “The Black Swan: The Impact of the Highly Improbable” (2007)
India’s upcoming phase of reform-led growth will not materially expand the MNC premium. MNCs have shown ways to capture this growth outside the listed Indian arm. Moreover, the experience of other countries tells us that as countries become richer, competitive intensity rises and RoEs gradually decline. Both these factors will restrict – if not reduce – the MNC premium in the future.
India – The beginning of a new economic growth path
In our March 11, 2014 thematic report, ‘Investing into India’s Fourth Wave’, we made a case for the beginning of a new era of economic growth for India, led by the change in the ruling Government. In our March 23, 2015 thematic report, ‘Modi hits the reset button’, we posited that this new phase of structural reform will be led by three key resets: (1) Shifting India’s savings landscape away from gold and land towards the formal financial system; (2) Disrupting crony capitalism in India; (3) Re-defining India’s subsidy mechanisms.
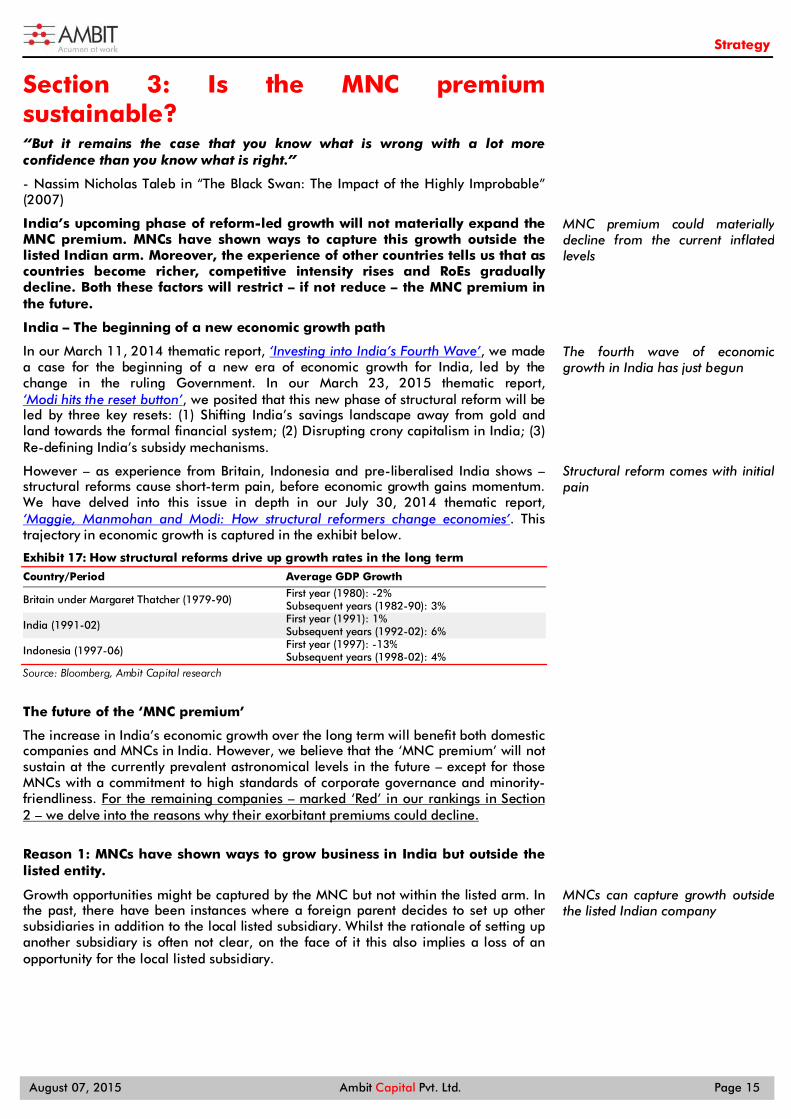
However – as experience from Britain, Indonesia and pre-liberalised India shows –structural reforms cause short-term pain, before economic growth gains momentum. We have delved into this issue in depth in our July 30, 2014 thematic report, ‘Maggie, Manmohan and Modi: How structural reformers change economies’. This trajectory in economic growth is captured in the exhibit below.
Exhibit 17: How structural reforms drive up growth rates in the long term
Country/Period Average GDP Growth
Britain under Margaret Thatcher (1979-90) First year (1980): -2% Subsequent years (1982-90): 3%
India (1991-02) First year (1991): 1% Subsequent years (1992-02): 6%
Indonesia (1997-06) First year (1997): -13% Subsequent years (1998-02): 4%
Source: Bloomberg, Ambit Capital research
The future of the ‘MNC premium’
The increase in India’s economic growth over the long term will benefit both domestic companies and MNCs in India. However, we believe that the ‘MNC premium’ will not sustain at the currently prevalent astronomical levels in the future – except for those MNCs with a commitment to high standards of corporate governance and minority-friendliness. For the remaining companies – marked ‘Red’ in our rankings in Section 2 – we delve into the reasons why their exorbitant premiums could decline.
Reason 1: MNCs have shown ways to grow business in India but outside the listed entity.
Growth opportunities might be captured by the MNC but not within the listed arm. In the past, there have been instances where a foreign parent decides to set up other subsidiaries in addition to the local listed subsidiary. Whilst the rationale of setting up another subsidiary is often not clear, on the face of it this also implies a loss of an opportunity for the local listed subsidiary.
MNC premium could materially decline from the current inflated levels
The fourth wave of economic growth in India has just begun
Structural reform comes with initial pain
MNCs can capture growth outside the listed Indian company
Strategy
August 07, 2015 Ambit Capital Pvt. Ltd. Page 16
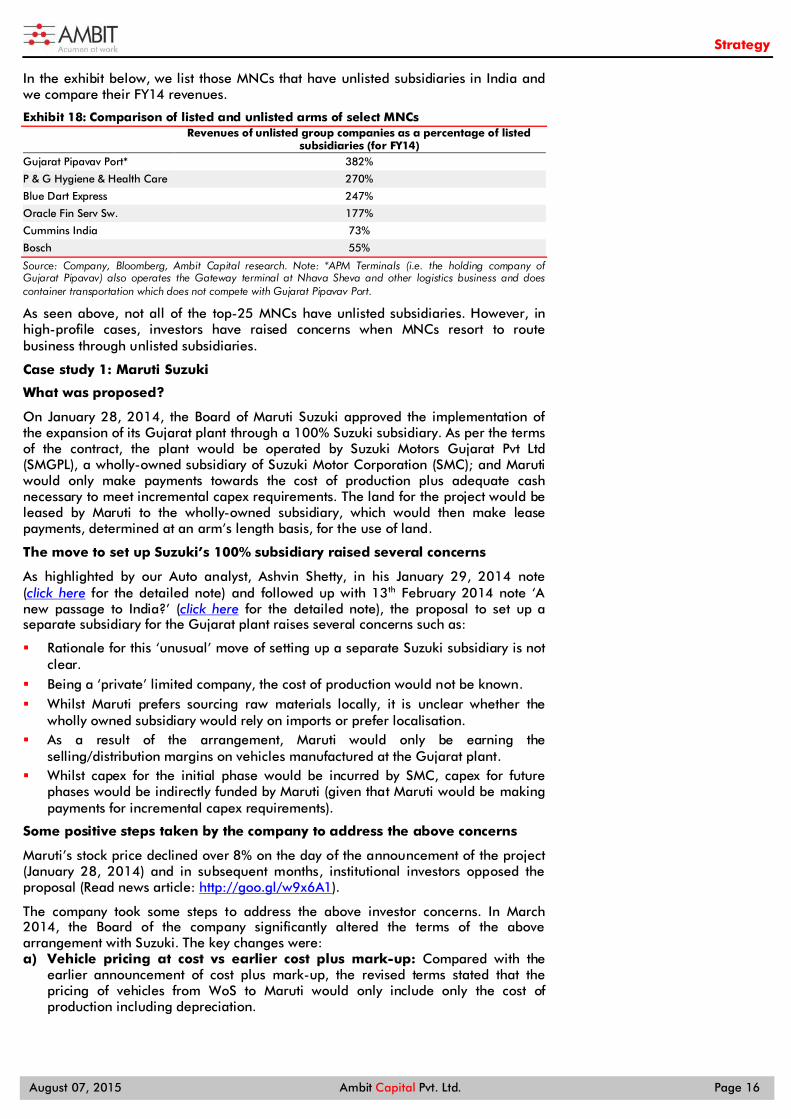
In the exhibit below, we list those MNCs that have unlisted subsidiaries in India and we compare their FY14 revenues.
Exhibit 18: Comparison of listed and unlisted arms of select MNCs
Revenues of unlisted group companies as a percentage of listed
subsidiaries (for FY14) Gujarat Pipavav Port* 382%
P & G Hygiene & Health Care 270%
Blue Dart Express 247%
Oracle Fin Serv Sw. 177%
Cummins India 73%
Bosch 55%
Source: Company, Bloomberg, Ambit Capital research. Note: *APM Terminals (i.e. the holding company of Gujarat Pipavav) also operates the Gateway terminal at Nhava Sheva and other logistics business and does container transportation which does not compete with Gujarat Pipavav Port.
As seen above, not all of the top-25 MNCs have unlisted subsidiaries. However, in high-profile cases, investors have raised concerns when MNCs resort to route business through unlisted subsidiaries.
Case study 1: Maruti Suzuki
What was proposed?
On January 28, 2014, the Board of Maruti Suzuki approved the implementation of the expansion of its Gujarat plant through a 100% Suzuki subsidiary. As per the terms of the contract, the plant would be operated by Suzuki Motors Gujarat Pvt Ltd (SMGPL), a wholly-owned subsidiary of Suzuki Motor Corporation (SMC); and Maruti would only make payments towards the cost of production plus adequate cash necessary to meet incremental capex requirements. The land for the project would be leased by Maruti to the wholly-owned subsidiary, which would then make lease payments, determined at an arm’s length basis, for the use of land.
The move to set up Suzuki’s 100% subsidiary raised several concerns
As highlighted by our Auto analyst, Ashvin Shetty, in his January 29, 2014 note (click here for the detailed note) and followed up with 13th February 2014 note ‘A new passage to India?’ (click here for the detailed note), the proposal to set up a separate subsidiary for the Gujarat plant raises several concerns such as:
Rationale for this ‘unusual’ move of setting up a separate Suzuki subsidiary is not clear.
Being a ‘private’ limited company, the cost of production would not be known. Whilst Maruti prefers sourcing raw materials locally, it is unclear whether the
wholly owned subsidiary would rely on imports or prefer localisation. As a result of the arrangement, Maruti would only be earning the
selling/distribution margins on vehicles manufactured at the Gujarat plant. Whilst capex for the initial phase would be incurred by SMC, capex for future
phases would be indirectly funded by Maruti (given that Maruti would be making payments for incremental capex requirements).
Some positive steps taken by the company to address the above concerns
Maruti’s stock price declined over 8% on the day of the announcement of the project (January 28, 2014) and in subsequent months, institutional investors opposed the proposal (Read news article: http://goo.gl/w9x6A1).
The company took some steps to address the above investor concerns. In March 2014, the Board of the company significantly altered the terms of the above arrangement with Suzuki. The key changes were: a) Vehicle pricing at cost vs earlier cost plus mark-up: Compared with the
earlier announcement of cost plus mark-up, the revised terms stated that the pricing of vehicles from WoS to Maruti would only include only the cost of production including depreciation.
Strategy
August 07, 2015 Ambit Capital Pvt. Ltd. Page 17
b) Transfer of assets at “book value”: Compared with the earlier announcement, which stated that the assets of WoS (if the agreement is terminated) would be transferred to MSIL at 'fair value', the new clarification given by the management indicated that it would be transferred at 'book value'.
c) The board also decided to seek the approval of minority shareholders on the proposal.
Current Status Whilst the company sought to allay investor concern with various clarifications, as discussed above, it remains firm on setting up the plant. In July 2015, Chairman, RC Bhargava said “We were hoping to do it by September but there has been some delay in Gujarat…it got delayed by a couple of months. They are yet to give the formal approval for the SSA (state support agreement) getting transferred from Maruti to Suzuki. We are hoping it will happen this month. And the moment that happens, we will work out a schedule…It will happen within this calendar year certainly.” (Source: http://goo.gl/Np9iki) We also note that in apparent recognition of its low dividend payout, the company’s Board in Oct 2014, along with its 2QFY15 results, adopted a guideline to raise dividend payout to 18-30% of net profits, up from the average dividend pay-out of 11.5% over FY11-14. Our primary concerns at this point on this likely arrangement are: (i) how would the fairness of the related party transactions would be ensured – would the minority shareholders of Maruti get an opportunity to vote on transactions between Suzuki and its 100% owned Indian subsidiary; (ii) Impact on Maruti’s margin due to any change in the level of localisation at the Gujarat plant under Suzuki’s 100% subsidiary and had the plant been under Maruti?
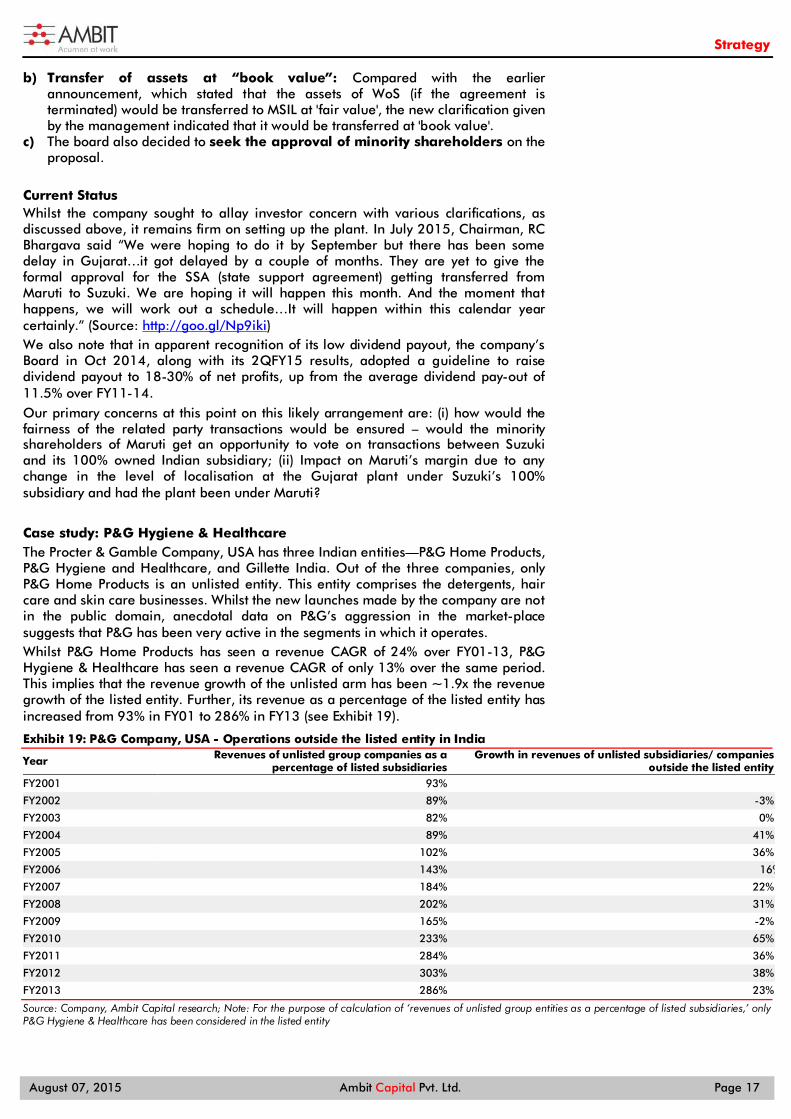
Case study: P&G Hygiene & Healthcare The Procter & Gamble Company, USA has three Indian entities—P&G Home Products, P&G Hygiene and Healthcare, and Gillette India. Out of the three companies, only P&G Home Products is an unlisted entity. This entity comprises the detergents, hair care and skin care businesses. Whilst the new launches made by the company are not in the public domain, anecdotal data on P&G’s aggression in the market-place suggests that P&G has been very active in the segments in which it operates. Whilst P&G Home Products has seen a revenue CAGR of 24% over FY01-13, P&G Hygiene & Healthcare has seen a revenue CAGR of only 13% over the same period. This implies that the revenue growth of the unlisted arm has been ~1.9x the revenue growth of the listed entity. Further, its revenue as a percentage of the listed entity has increased from 93% in FY01 to 286% in FY13 (see Exhibit 19).
Exhibit 19: P&G Company, USA - Operations outside the listed entity in India
Year Revenues of unlisted group companies as a percentage of listed subsidiaries
Growth in revenues of unlisted subsidiaries/ companies outside the listed entity
FY2001 93% FY2002 89% -3%
FY2003 82% 0%
FY2004 89% 41%
FY2005 102% 36%
FY2006 143% 16%
FY2007 184% 22%
FY2008 202% 31%
FY2009 165% -2%
FY2010 233% 65%
FY2011 284% 36%
FY2012 303% 38%
FY2013 286% 23%
Source: Company, Ambit Capital research; Note: For the purpose of calculation of ‘revenues of unlisted group entities as a percentage of listed subsidiaries,’ only P&G Hygiene & Healthcare has been considered in the listed entity

Strategy
August 07, 2015 Ambit Capital Pvt. Ltd. Page 18
Reason 2: Rising competitive intensity will hit premium valuations In our May 14, 2014 thematic report, ‘Can India turn back the clock?’, we argued that better governance in India should be positive for the country, as corruption and inflation eases and India’s competitiveness improves. However, this process will produce not just winners but also losers i.e. companies that have benefited from the muted competitive environment in India over the past decade. As a result, the valuation premium that the market has been willing to pay for better-run companies – including MNCs – will ERODE. On the other hand, companies which were held back due to the high cost of capital and due to regulatory distortions stand to perform well. Cross-country data shows that as countries become richer, RoEs decline. We expect this impact to play out in India as well. An uptick in economic growth will raise competitive intensity and drive operating/PAT margins lower. This, in turn, will drive high RoEs – one of the key drivers for MNC premium – lower. We tracked the rise in per capita income of Brazil, India, Indonesia, Thailand and Turkey and compared this rise with the RoE of each country’s benchmark equity index. The results – in the exhibits below - show a trend of declining RoEs, as countries become richer.
Exhibit 20: RoE of Equity Benchmark Indices of countries
Source: Bloomberg, Ambit Capital research
Exhibit 21: Per capita income (USD) trends since 2001 for select countries
Source: World Bank, Ambit Capital research
Reason 3: MNCs will use creative methods to remove money from the listed entity Finally, we repeat our core thesis from our March 07, 2014 thematic report, ‘Listed MNCs - The good, the bad & the ugly’. MNCs can use a variety of creative methods to short-change minority shareholders to remove money from the listed entity. We summarise these methods below:
(1) High royalty payments Royalty payment is perhaps the most common (and also the easiest) way in which foreign promoters can pull out cash from their Indian subsidiaries. Higher royalty payment (after the Indian Government removed the cap on royalty payments in 2010) has two adverse impacts. Firstly, as more and more royalty payments are made to the foreign parent, minority shareholders have to bear the brunt in the form of
-10.0
0.0
10.0
20.0
30.0
40.0
CY
-01
CY
-02
CY
-03
CY
-04
CY
-05
CY
-06
CY
-07
CY
-08
CY
-09
CY
-10
CY
-11
CY
-12
CY
-13
CY
-14
Ro
E (%
)
India
Turkey
Indonesia
Thailand
Brazil
-
2,000
4,000
6,000
8,000
10,000
12,000
14,000
CY
-01
CY
-02
CY
-03
CY
-04
CY
-05
CY
-06
CY
-07
CY
-08
CY
-09
CY
-10
CY
-11
CY
-12
CY
-13
CY
-14Pe
r ca
pit
a in
com
e (U
S$) Brazil
Turkey
Thailand
Indonesia
India
Valuation premium that the market has been willing to pay for better-run companies – including MNCs –will erode
The RoEs of indices tend to decline as…
…countries get richer

Strategy
August 07, 2015 Ambit Capital Pvt. Ltd. Page 19
lower profits and lower dividend payouts. Secondly, royalty hikes have an adverse impact for the Indian tax authorities as well. This is because whilst royalty payments are taxed at 10%, corporate income in India is taxed at 30%.
(2) Merging unlisted entities at high valuations In order to milk cash from their listed subsidiaries, we often find MNC parents resorting to merging their unlisted subsidiary with the listed Indian subsidiary at stratospheric valuations, that too without visible synergies.
(3) Transfer of profitable divisions at low valuations In direct contrast to the point on mergers above, it is also possible that a profitable division of the listed entity could be spun-off/transferred to the global parent at relatively low valuations.
(4) Cash repatriation from subsidiary to parent Ideally, cash held by the subsidiary belongs as much to the minority shareholders as it does to the controlling shareholder. However, in recent times, we have seen how the parent can abuse its position as the dominant shareholder to pull out cash from the subsidiary, as the minority shareholders are not in a position to say much about it.
(5) Competing unlisted subsidiaries There have been instances in the past where a foreign parent decides to set up other subsidiaries in addition to the local listed subsidiary. Whilst the rationale of setting up another subsidiary is often not clear, on the face of it this implies opportunity loss for the local listed subsidiary’s business.
(6) Business transactions with the Indian subsidiary at unfavorable terms Another manner in which MNCs have historically short-changed minorities is by conducting business with its local arm on favourable terms for the parent.
(7) Incentivisation of local management An incentive structure that seeks to reward the local management by aligning their deliverables with the shareholders of the parent and not with that of the Indian entity’s shareholders leaves room for suspicion on corporate governance. For a summary of the case studies on how MNCs have used the above methods, please refer Appendix 1. Flagging off MNCs at risk
For the seven companies marked RED on our framework in Section 2, we highlight ABB India, Siemens and Alstom T&D India as outliers on P/E vs EPS CAGR, highlighted in Exhibit 7 above and reproduced below. With valuations clearly disconnected with the underlying earnings, we believe these stocks are particularly exposed, given their track record of minority-unfriendliness.
Exhibit 22: ABB India, Siemens and Alstom T&D are outliers on P/E vs earnings growth
Source: Bloomberg, Ambit Capital research
R² = 36%
- 50
100
150 200
250 300 350
-20% -10% 0% 10% 20% 30%
Tra
ilin
g P
/E
FY09-15 EPS CAGR
Gillette
ABB
Siemens
Alstom
Gillette
Pfizer
Blue DartWABCO
GSK Consumer
ABB, Siemens and Alstom T&D are RED flagged as outliers that are appear vulnerable

Strategy
August 07, 2015 Ambit Capital Pvt. Ltd. Page 20
Appendix 1: Case studies from our ‘Listed MNCs - The good, the bad and the ugly’ report The case studies in our thematic report, ‘Listed MNCs – The good, the bad and the ugly’, dated March 7, 2014 are summarised below. These case studies show how MNCs have shortchanged minority shareholders in the past and it also throws light on the common tricks that investors need to be aware of when it comes to investing in MNCs in India.
1. Excessive royalty payments Case Study: HUL
What was proposed?
In December 2012, Unilever Indonesia announced its plans to hike the royalty payments made to Unilever from 3.5% to 5% (as a percentage of sales). This was followed by HUL’s Board announcement in January 2013 to hike the royalty payments in a phased manner from 1.4% to 3.15% by March 2018.
Issues with the proposal
HUL’s decision to hike the royalty payment raises several concerns such as:
Even though the company’s volume growth had been declining over the past several quarters, it had increased the royalty payments. Whilst peers such as Godrej Consumers, ITC, Marico and Nestle had recorded an average three-year and five-year CAGR in sales of 26% and 24% respectively, HUL’s sales growth was much lower at 15% and 14% respectively. Given the declining market share, the royalty hikes did not seem justified.
Growth in royalty and related payments had exceeded sales growth in three of the last four years (see Exhibit 23). Also, whilst sales and PAT had recorded a CAGR of 12% and 17% respectively over FY09-13, royalty payments made to Unilever (and fellow subsidiaries) had recorded a CAGR of 31% over the same period (see Exhibit 24). Thus, growth in royalty payments was ~2.5x and ~1.8x the growth in net sales and PAT respectively. Such a vast difference between the two raises concerns regarding whether the royalty/technical collaboration from Unilever was indeed meant to help HUL or was it merely a means of siphoning off cash by the controlling shareholder at the expense of minority shareholders.
Exhibit 23: HUL - Royalty growth has exceeded sales growth in three of the last four years
Source: Company, Ambit Capital Research; Note: standalone figures
0%
10%
20%
30%
40%
50%
60%
FY10 FY11 FY12 FY13
YoY growth in royalty YoY growth in net sales
Strategy
August 07, 2015 Ambit Capital Pvt. Ltd. Page 21
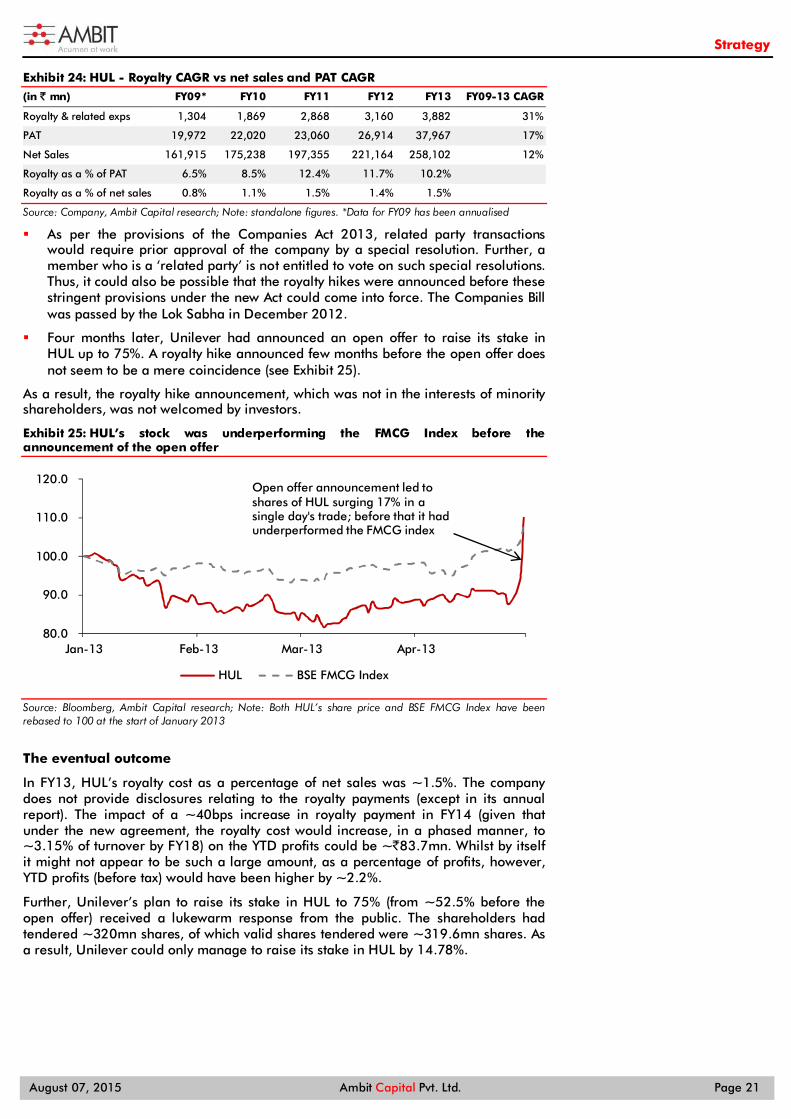
Exhibit 24: HUL - Royalty CAGR vs net sales and PAT CAGR
(in ` mn) FY09* FY10 FY11 FY12 FY13 FY09-13 CAGR
Royalty & related exps 1,304 1,869 2,868 3,160 3,882 31%
PAT 19,972 22,020 23,060 26,914 37,967 17%
Net Sales 161,915 175,238 197,355 221,164 258,102 12%
Royalty as a % of PAT 6.5% 8.5% 12.4% 11.7% 10.2% Royalty as a % of net sales 0.8% 1.1% 1.5% 1.4% 1.5% Source: Company, Ambit Capital research; Note: standalone figures. *Data for FY09 has been annualised
As per the provisions of the Companies Act 2013, related party transactions would require prior approval of the company by a special resolution. Further, a member who is a ‘related party’ is not entitled to vote on such special resolutions. Thus, it could also be possible that the royalty hikes were announced before these stringent provisions under the new Act could come into force. The Companies Bill was passed by the Lok Sabha in December 2012.
Four months later, Unilever had announced an open offer to raise its stake in HUL up to 75%. A royalty hike announced few months before the open offer does not seem to be a mere coincidence (see Exhibit 25).
As a result, the royalty hike announcement, which was not in the interests of minority shareholders, was not welcomed by investors.
Exhibit 25: HUL’s stock was underperforming the FMCG Index before the announcement of the open offer
Source: Bloomberg, Ambit Capital research; Note: Both HUL’s share price and BSE FMCG Index have been rebased to 100 at the start of January 2013
The eventual outcome
In FY13, HUL’s royalty cost as a percentage of net sales was ~1.5%. The company does not provide disclosures relating to the royalty payments (except in its annual report). The impact of a ~40bps increase in royalty payment in FY14 (given that under the new agreement, the royalty cost would increase, in a phased manner, to ~3.15% of turnover by FY18) on the YTD profits could be ~`83.7mn. Whilst by itself it might not appear to be such a large amount, as a percentage of profits, however, YTD profits (before tax) would have been higher by ~2.2%.
Further, Unilever’s plan to raise its stake in HUL to 75% (from ~52.5% before the open offer) received a lukewarm response from the public. The shareholders had tendered ~320mn shares, of which valid shares tendered were ~319.6mn shares. As a result, Unilever could only manage to raise its stake in HUL by 14.78%.
80.0
90.0
100.0
110.0
120.0
Jan-13 Feb-13 Mar-13 Apr-13
HUL BSE FMCG Index
Open offer announcement led to shares of HUL surging 17% in a single day's trade; before that it had underperformed the FMCG index
Strategy
August 07, 2015 Ambit Capital Pvt. Ltd. Page 22
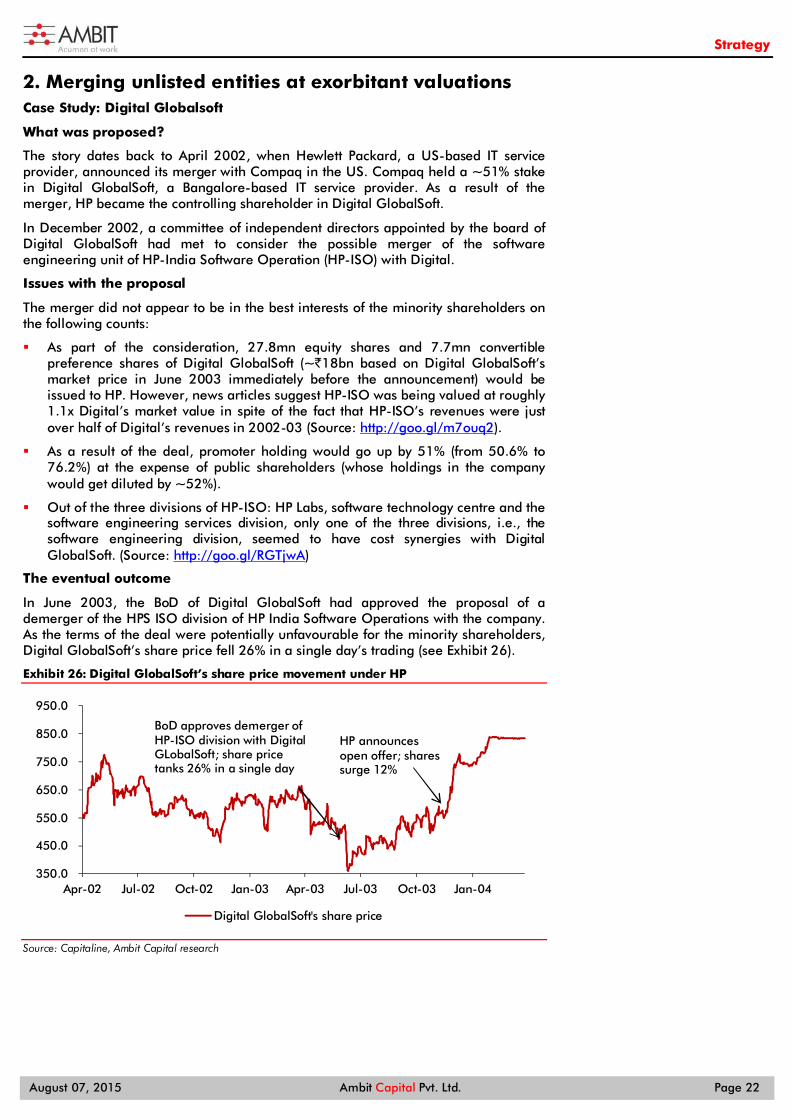
2. Merging unlisted entities at exorbitant valuations Case Study: Digital Globalsoft
What was proposed?
The story dates back to April 2002, when Hewlett Packard, a US-based IT service provider, announced its merger with Compaq in the US. Compaq held a ~51% stake in Digital GlobalSoft, a Bangalore-based IT service provider. As a result of the merger, HP became the controlling shareholder in Digital GlobalSoft.
In December 2002, a committee of independent directors appointed by the board of Digital GlobalSoft had met to consider the possible merger of the software engineering unit of HP-India Software Operation (HP-ISO) with Digital.
Issues with the proposal
The merger did not appear to be in the best interests of the minority shareholders on the following counts:
As part of the consideration, 27.8mn equity shares and 7.7mn convertible preference shares of Digital GlobalSoft (~`18bn based on Digital GlobalSoft’s market price in June 2003 immediately before the announcement) would be issued to HP. However, news articles suggest HP-ISO was being valued at roughly 1.1x Digital’s market value in spite of the fact that HP-ISO’s revenues were just over half of Digital’s revenues in 2002-03 (Source: http://goo.gl/m7ouq2).
As a result of the deal, promoter holding would go up by 51% (from 50.6% to 76.2%) at the expense of public shareholders (whose holdings in the company would get diluted by ~52%).
Out of the three divisions of HP-ISO: HP Labs, software technology centre and the software engineering services division, only one of the three divisions, i.e., the software engineering division, seemed to have cost synergies with Digital GlobalSoft. (Source: http://goo.gl/RGTjwA)
The eventual outcome
In June 2003, the BoD of Digital GlobalSoft had approved the proposal of a demerger of the HPS ISO division of HP India Software Operations with the company. As the terms of the deal were potentially unfavourable for the minority shareholders, Digital GlobalSoft’s share price fell 26% in a single day’s trading (see Exhibit 26).
Exhibit 26: Digital GlobalSoft’s share price movement under HP
Source: Capitaline, Ambit Capital research
350.0
450.0
550.0
650.0
750.0
850.0
950.0
Apr-02 Jul-02 Oct-02 Jan-03 Apr-03 Jul-03 Oct-03 Jan-04
Digital GlobalSoft's share price
BoD approves demerger of HP-ISO division with Digital GLobalSoft; share price tanks 26% in a single day
HP announces open offer; shares surge 12%
Strategy
August 07, 2015 Ambit Capital Pvt. Ltd. Page 23
However, even before the demerger proposal could sail through, top executives from HP had quit the company (Source: http://goo.gl/bbTqfl).
Further, in November 2003, HP announced an open offer to buy out the minority shareholders in Digital GlobalSoft at `750/share in order to delist its equity shares from all the stock exchanges. At this price, HP would have had to shell out ~`12.5bn to buy out the minority shareholders. As a result, Digital GlobalSoft’s shares surged 12% the next day.
The delisting proposal, however, required the approval of the shareholders by a special resolution, to sail through. Whilst the minority shareholders raised concerns on the delisting price, the proposal could eventually receive the shareholders nod in the EGM held in January 2004, as 20.3mn votes were cast in favour of it whilst less than 0.1mn votes were cast against it. (Note: As the company filings are not available on the BSE as well as NSE given that it is now delisted, this information is based on press articles (Source: http://goo.gl/sP0DOY)). As a result, the shares were delisted in April 2004. The price for acquisition was, however, raised to `850/share under the reverse book-building process.
A merger announcement few months before the delisting announcement, which resulted in a depressed share price, shows poor corporate governance on the part of HP. The floor price under SEBI norms was `566/share. Had Digital GlobalSoft’s share price not been hammered post the BoD’s approval of the merger, the floor price (and consequently the final exit price) would have been much higher.
3. Transfer of profitable divisions at cheap valuations Case Study: Siemens India
What was proposed?
In January 2009, the Board of Siemens India had approved the divestment of its 100% stake (~6.8mn equity shares of `10 each) in its subsidiary, Siemens Informations Systems Ltd (SISL), to Siemens Corporate Finance Pvt Ltd (SCFPL), a 100% subsidiary of Siemens AG. SISL had been valued at ~`4,490mn for the purpose of this transfer. Earlier in November 2008 as well, the BoD had approved the divestment of a 51% stake (~2.1mn equity shares of `10 each) in its subsidiary, Siemens Information Processing Services Pvt Ltd (SIPS), to SCFPL.
Issues with the proposal
Whilst the valuation had been determined by an independent third-party, the transfer of SISL reflects sub-par corporate governance on the part of Siemens AG, as only ~`4.5bn was being paid for more than `9.9bn in revenues. Further, SISL’s book value in 2008 was `3.6bn.
As per Siemens’ BSE filings and according to its FY02 and FY03 annual reports, Siemens had acquired a 25.2% stake in SISL in May 2003 for `0.8 bn, thus valuing the company at ~`3.2bn (even though SISL’s net worth as of September 2003 was `1.2bn). This implies Siemens had assigned a multiple of ~2.7x to SISL at the time of acquiring the 25.2% stake, while valuing SISL at only ~1.25x at the time of divestment of the entire 100% stake in SISL to Siemens AG.
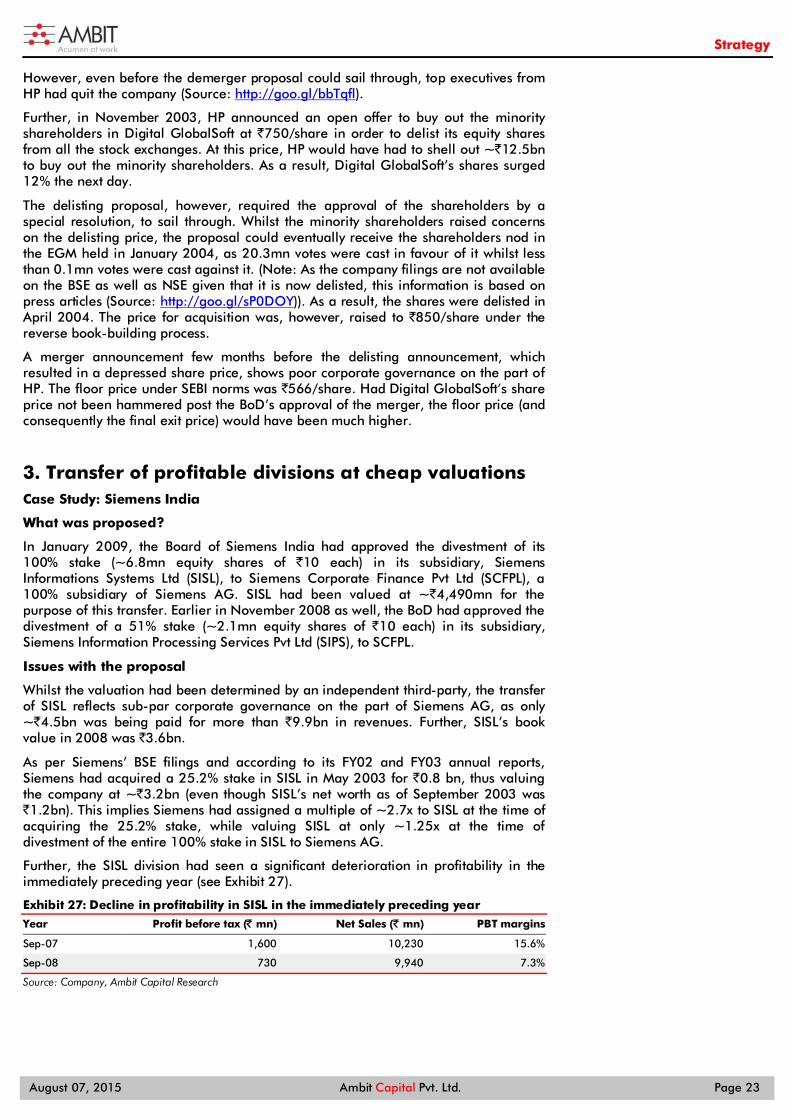
Further, the SISL division had seen a significant deterioration in profitability in the immediately preceding year (see Exhibit 27).
Exhibit 27: Decline in profitability in SISL in the immediately preceding year
Year Profit before tax (̀ mn) Net Sales (` mn) PBT margins
Sep-07 1,600 10,230 15.6%
Sep-08 730 9,940 7.3%
Source: Company, Ambit Capital Research
Strategy
August 07, 2015 Ambit Capital Pvt. Ltd. Page 24
This was not the first time where a division had seen a decline in profitability immediately before the transfer to Siemens AG. There had been multiple instances in the past wherein the Board had approved the divestment of a particular segment in favour of Siemens AG as part of the global alignment process. For example, in February 2007, the Board had approved the proposal for the sale and transfer of the ‘Siemens Communications Enterprise Networks (COM EN) Division’ to Siemens Enterprise Communications Pvt Ltd (SECPL), a 100% subsidiary of Siemens AG. The COM EN division had been transferred on a slump sale basis, as a going concern for a total consideration of ~`609mn w.e.f. August 01, 2007.
Likewise, in April 2007, the company had sold its entire 100% stake (12.43mn equity shares of `10 each) in Siemens Public Communication Networks Pvt Ltd (SPCNL) to Nokia Siemens Networks Pvt Ltd, a Nokia Siemens 50:50 joint venture company. SPCNL was valued at `1,898mn for the purpose of this transfer.
Whilst both these proposals could get all the required clearances, both these divisions had seen a significant deterioration in profitability before the transfer (see Exhibits 11 and 12).
Exhibit 28: The COM EN division had seen a significant decline in profitability…
(in ` mn) FY06 FY07*
Turnover 1,358 1,389
PBT 132 106
PAT 88 70
PBT margins 9.7% 7.6%
PAT margins 6.5% 5.0%
Source: Company, Ambit Capital research; Note: * Discontinued w.e.f. Aug-07
Exhibit 29: …as did SPCNL immediately before the transfer
(in `mn) FY06 FY07*
Turnover 6,190 4,669
PBT 368 234
PAT 207 113
PBT margins 6.0% 5.0%
PAT margins 3.3% 2.4%
Source: Company, Ambit Capital research; Note: * Sold on Apr 27, 2007
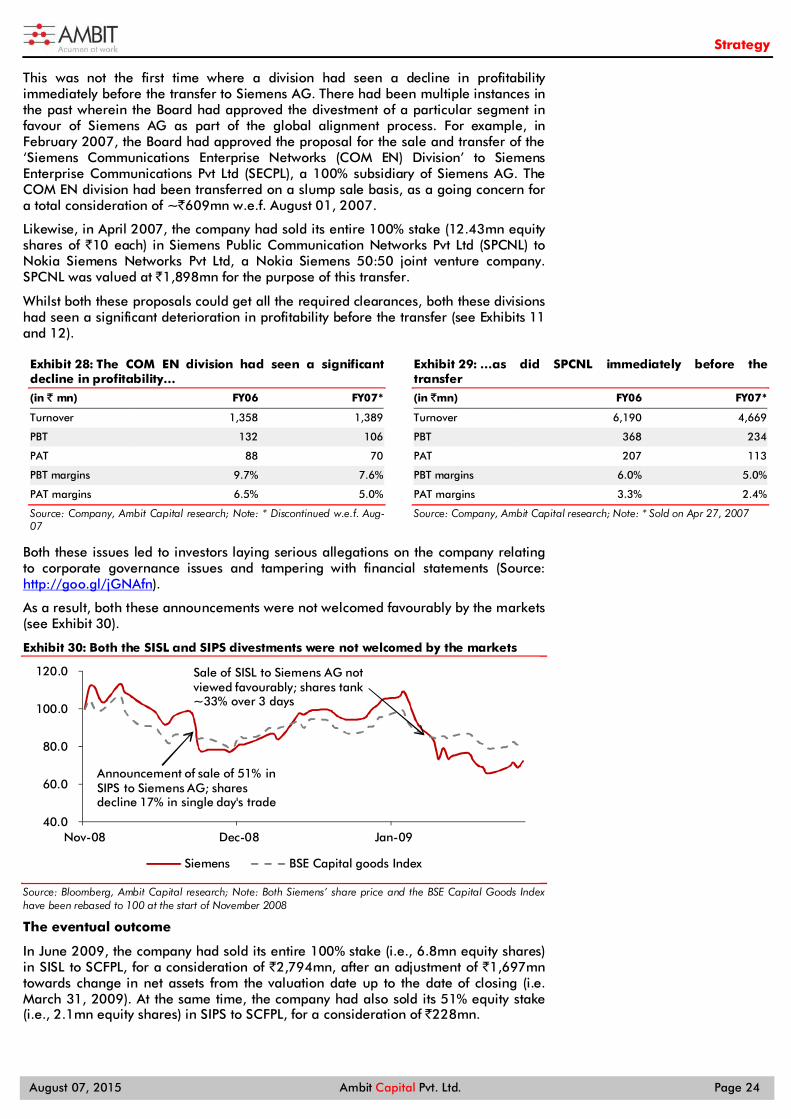
Both these issues led to investors laying serious allegations on the company relating to corporate governance issues and tampering with financial statements (Source: http://goo.gl/jGNAfn).
As a result, both these announcements were not welcomed favourably by the markets (see Exhibit 30).
Exhibit 30: Both the SISL and SIPS divestments were not welcomed by the markets
Source: Bloomberg, Ambit Capital research; Note: Both Siemens’ share price and the BSE Capital Goods Index have been rebased to 100 at the start of November 2008
The eventual outcome
In June 2009, the company had sold its entire 100% stake (i.e., 6.8mn equity shares) in SISL to SCFPL, for a consideration of `2,794mn, after an adjustment of `1,697mn towards change in net assets from the valuation date up to the date of closing (i.e. March 31, 2009). At the same time, the company had also sold its 51% equity stake (i.e., 2.1mn equity shares) in SIPS to SCFPL, for a consideration of `228mn.
40.0
60.0
80.0
100.0
120.0
Nov-08 Dec-08 Jan-09
Siemens BSE Capital goods Index
Sale of SISL to Siemens AG not viewed favourably; shares tank ~33% over 3 days
Announcement of sale of 51% in SIPS to Siemens AG; shares decline 17% in single day's trade
Strategy
August 07, 2015 Ambit Capital Pvt. Ltd. Page 25
4. Cash repatriation from subsidiary to parent Case study: Ambuja Cement
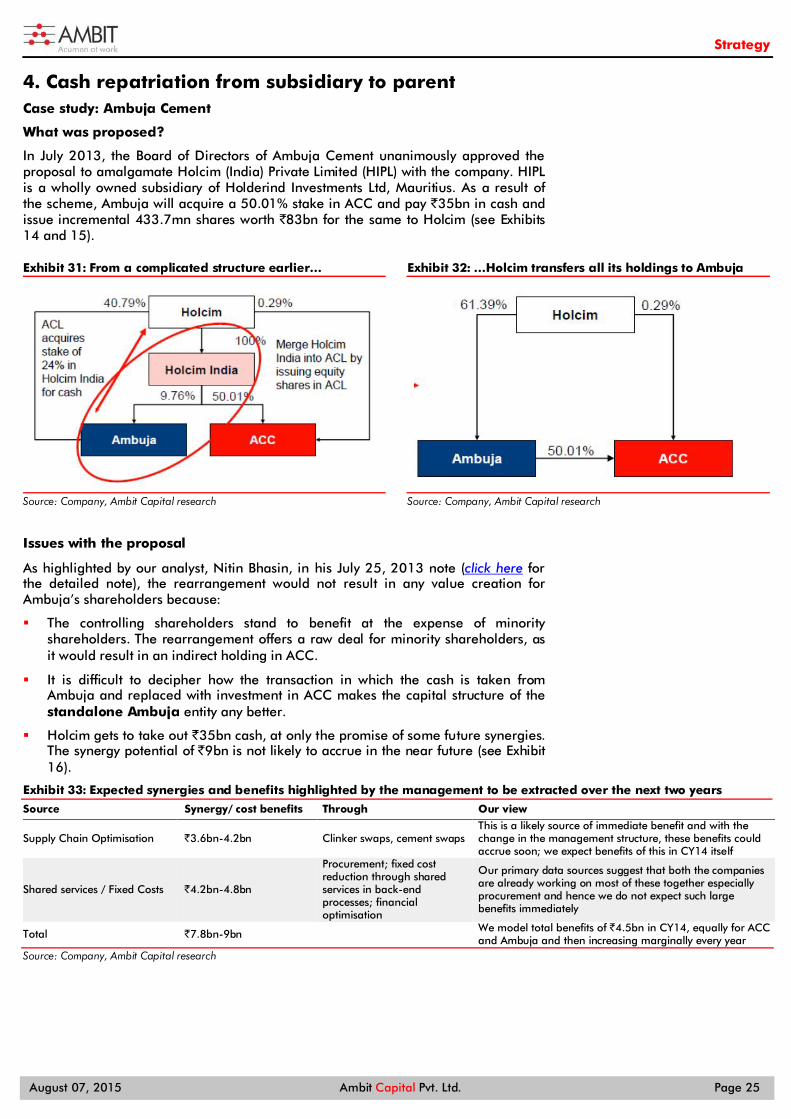
What was proposed?
In July 2013, the Board of Directors of Ambuja Cement unanimously approved the proposal to amalgamate Holcim (India) Private Limited (HIPL) with the company. HIPL is a wholly owned subsidiary of Holderind Investments Ltd, Mauritius. As a result of the scheme, Ambuja will acquire a 50.01% stake in ACC and pay `35bn in cash and issue incremental 433.7mn shares worth `83bn for the same to Holcim (see Exhibits 14 and 15).
Exhibit 31: From a complicated structure earlier…
Source: Company, Ambit Capital research
Exhibit 32: …Holcim transfers all its holdings to Ambuja
Source: Company, Ambit Capital research
Issues with the proposal
As highlighted by our analyst, Nitin Bhasin, in his July 25, 2013 note (click here for the detailed note), the rearrangement would not result in any value creation for Ambuja’s shareholders because:
The controlling shareholders stand to benefit at the expense of minority shareholders. The rearrangement offers a raw deal for minority shareholders, as it would result in an indirect holding in ACC.
It is difficult to decipher how the transaction in which the cash is taken from Ambuja and replaced with investment in ACC makes the capital structure of the standalone Ambuja entity any better.
Holcim gets to take out `35bn cash, at only the promise of some future synergies. The synergy potential of `9bn is not likely to accrue in the near future (see Exhibit 16).
Exhibit 33: Expected synergies and benefits highlighted by the management to be extracted over the next two years
Source Synergy/ cost benefits Through Our view
Supply Chain Optimisation `3.6bn-4.2bn Clinker swaps, cement swaps This is a likely source of immediate benefit and with the change in the management structure, these benefits could accrue soon; we expect benefits of this in CY14 itself
Shared services / Fixed Costs `4.2bn-4.8bn
Procurement; fixed cost reduction through shared services in back-end processes; financial optimisation
Our primary data sources suggest that both the companies are already working on most of these together especially procurement and hence we do not expect such large benefits immediately
Total `7.8bn-9bn We model total benefits of `4.5bn in CY14, equally for ACC and Ambuja and then increasing marginally every year
Source: Company, Ambit Capital research
Strategy
August 07, 2015 Ambit Capital Pvt. Ltd. Page 26
The eventual outcome
As discussed earlier, under the new norms proposed by SEBI, issuance of new shares to the promoter or promoter group in deals involving acquisitions, mergers and demergers would require a simple majority (i.e. 51%) of non-promoter shareholding for passing such a resolution.
The results of the postal ballot conducted were as under:
~87% of the institutional shareholders had voted, of which ~68% had voted in favour of the resolution whilst just over 32% had voted against the resolution.
Only ~10% of the remaining public shareholders had voted, of which ~88% had voted in favour of the resolution whilst less than 12% had voted against the resolution.
Thus, in spite of widespread criticism of the deal and opposition from minority shareholders, Ambuja could get 68.5% of public shareholder votes in favour of the deal. Post that, Ambuja had also received the EGM approval for a reduction in its share capital. As a result of this scheme, Holcim’s stake in Ambuja will go up by 10% whilst the minority shareholders’ stake will be diluted by over 20%.
5. Competing unlisted subsidiaries Case study: Cummins India
What was proposed?
Cummins Inc had proposed that new technology products (i.e. products for which Cummins India does not have the technology) would be increasingly manufactured/exported through Cummins Technology India Ltd (CTIL), with Cummins India retaining the India marketing rights. As a result, the stock price had corrected by 10% (intra-day) on May 17, 2012 (i.e. the day following the day of the analyst meeting).
Issues with the proposal
On the face of it, the statement implied an opportunity loss for Cummins India in total for the export market, and in part for the domestic market, for the products based on this new technology.
The eventual outcome
The management made the following clarifications on the ‘lost’ export opportunity:
a) No risk to current exports of Cummins India: Cummins India manufactures and exports (to Cummins Inc) diesel engines in the range of 28, 38 and 50 litres. Cummins Inc had decided to manufacture the 60-litre diesel engine (model QSK 60) at CTIL, which is 50% owned by Cummins Inc and 50% by Cummins Turbo Technologies, UK, for its captive procurement. Thus, for buying diesel engines from India up to 50 litres, it will continue to depend on Cummins India.
b) No domestic opportunity loss to Cummins India: The market size of QSK 60 diesel engine in India was ½ engine per day as compared to 25 engines per day for engines of 38-50 litres. Further, the management had clarified that in the future if an opportunity arises in the domestic market for this engine on the back of the mining sector opening up (where this engine is primarily used), Cummins India will be open to setting up a manufacturing facility to cater to this market, provided there is a sizeable market opportunity.
c) Company’s investment in Phaltan reinforces Cummins Inc’s commitment to Cummins India: At that time, Cummins India was investing capex of `1.3bn and `2.1bn in Phaltan to cater to Cummins Inc and Cummins India’s domestic requirement for low HP diesel gensets. Had Cummins Inc’s rationale been to shift the business to CTIL, it would never have solicited Cummins India to incur such a capex. Hence, for engines up to 50 litres, Cummins was the sole sourcing partner for Cummins Inc as far as sourcing from India is concerned.
Strategy
August 07, 2015 Ambit Capital Pvt. Ltd. Page 27
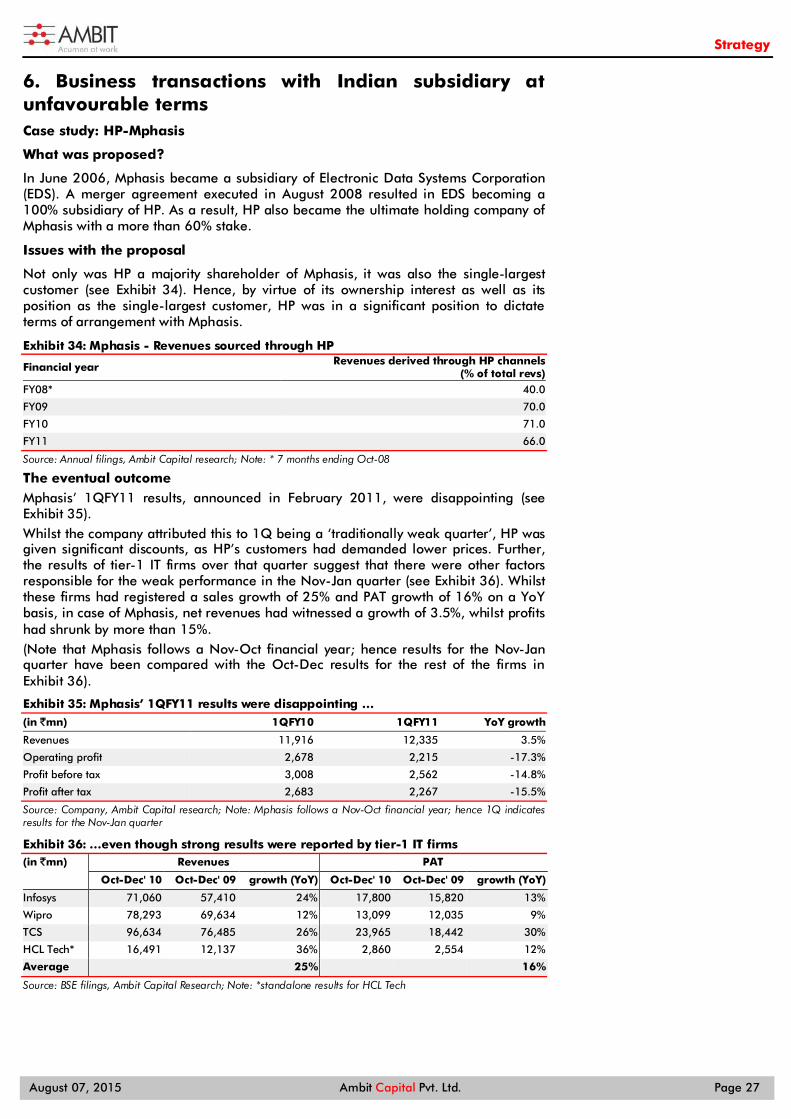
6. Business transactions with Indian subsidiary at unfavourable terms Case study: HP-Mphasis
What was proposed?
In June 2006, Mphasis became a subsidiary of Electronic Data Systems Corporation (EDS). A merger agreement executed in August 2008 resulted in EDS becoming a 100% subsidiary of HP. As a result, HP also became the ultimate holding company of Mphasis with a more than 60% stake.
Issues with the proposal
Not only was HP a majority shareholder of Mphasis, it was also the single-largest customer (see Exhibit 34). Hence, by virtue of its ownership interest as well as its position as the single-largest customer, HP was in a significant position to dictate terms of arrangement with Mphasis.
Exhibit 34: Mphasis - Revenues sourced through HP
Financial year Revenues derived through HP channels (% of total revs)
FY08* 40.0
FY09 70.0
FY10 71.0
FY11 66.0
Source: Annual filings, Ambit Capital research; Note: * 7 months ending Oct-08
The eventual outcome Mphasis’ 1QFY11 results, announced in February 2011, were disappointing (see Exhibit 35). Whilst the company attributed this to 1Q being a ‘traditionally weak quarter’, HP was given significant discounts, as HP’s customers had demanded lower prices. Further, the results of tier-1 IT firms over that quarter suggest that there were other factors responsible for the weak performance in the Nov-Jan quarter (see Exhibit 36). Whilst these firms had registered a sales growth of 25% and PAT growth of 16% on a YoY basis, in case of Mphasis, net revenues had witnessed a growth of 3.5%, whilst profits had shrunk by more than 15%. (Note that Mphasis follows a Nov-Oct financial year; hence results for the Nov-Jan quarter have been compared with the Oct-Dec results for the rest of the firms in Exhibit 36).
Exhibit 35: Mphasis’ 1QFY11 results were disappointing … (in `mn) 1QFY10 1QFY11 YoY growth
Revenues 11,916 12,335 3.5%
Operating profit 2,678 2,215 -17.3%
Profit before tax 3,008 2,562 -14.8%
Profit after tax 2,683 2,267 -15.5%
Source: Company, Ambit Capital research; Note: Mphasis follows a Nov-Oct financial year; hence 1Q indicates results for the Nov-Jan quarter
Exhibit 36: …even though strong results were reported by tier-1 IT firms (in `mn) Revenues PAT
Oct-Dec' 10 Oct-Dec' 09 growth (YoY) Oct-Dec' 10 Oct-Dec' 09 growth (YoY)
Infosys 71,060 57,410 24% 17,800 15,820 13%
Wipro 78,293 69,634 12% 13,099 12,035 9%
TCS 96,634 76,485 26% 23,965 18,442 30%
HCL Tech* 16,491 12,137 36% 2,860 2,554 12%
Average 25% 16%
Source: BSE filings, Ambit Capital Research; Note: *standalone results for HCL Tech
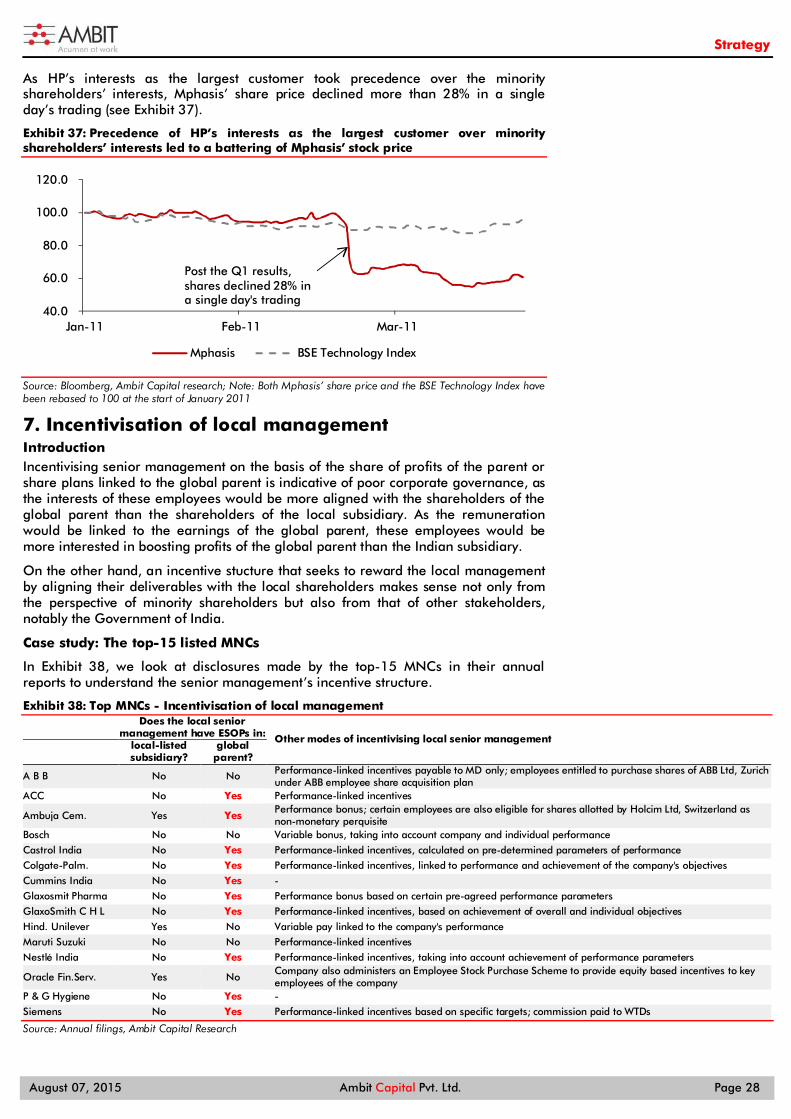
Strategy
August 07, 2015 Ambit Capital Pvt. Ltd. Page 28
As HP’s interests as the largest customer took precedence over the minority shareholders’ interests, Mphasis’ share price declined more than 28% in a single day’s trading (see Exhibit 37).
Exhibit 37: Precedence of HP’s interests as the largest customer over minority shareholders’ interests led to a battering of Mphasis’ stock price
Source: Bloomberg, Ambit Capital research; Note: Both Mphasis’ share price and the BSE Technology Index have been rebased to 100 at the start of January 2011
7. Incentivisation of local management Introduction Incentivising senior management on the basis of the share of profits of the parent or share plans linked to the global parent is indicative of poor corporate governance, as the interests of these employees would be more aligned with the shareholders of the global parent than the shareholders of the local subsidiary. As the remuneration would be linked to the earnings of the global parent, these employees would be more interested in boosting profits of the global parent than the Indian subsidiary.
On the other hand, an incentive stucture that seeks to reward the local management by aligning their deliverables with the local shareholders makes sense not only from the perspective of minority shareholders but also from that of other stakeholders, notably the Government of India.
Case study: The top-15 listed MNCs
In Exhibit 38, we look at disclosures made by the top-15 MNCs in their annual reports to understand the senior management’s incentive structure.
Exhibit 38: Top MNCs - Incentivisation of local management
Does the local senior
management have ESOPs in: Other modes of incentivising local senior management
local-listed subsidiary?
global parent?
A B B No No Performance-linked incentives payable to MD only; employees entitled to purchase shares of ABB Ltd, Zurich under ABB employee share acquisition plan
ACC No Yes Performance-linked incentives
Ambuja Cem. Yes Yes Performance bonus; certain employees are also eligible for shares allotted by Holcim Ltd, Switzerland as non-monetary perquisite
Bosch No No Variable bonus, taking into account company and individual performance
Castrol India No Yes Performance-linked incentives, calculated on pre-determined parameters of performance
Colgate-Palm. No Yes Performance-linked incentives, linked to performance and achievement of the company's objectives
Cummins India No Yes -
Glaxosmit Pharma No Yes Performance bonus based on certain pre-agreed performance parameters
GlaxoSmith C H L No Yes Performance-linked incentives, based on achievement of overall and individual objectives
Hind. Unilever Yes No Variable pay linked to the company's performance
Maruti Suzuki No No Performance-linked incentives
Nestlé India No Yes Performance-linked incentives, taking into account achievement of performance parameters
Oracle Fin.Serv. Yes No Company also administers an Employee Stock Purchase Scheme to provide equity based incentives to key employees of the company
P & G Hygiene No Yes -
Siemens No Yes Performance-linked incentives based on specific targets; commission paid to WTDs
Source: Annual filings, Ambit Capital Research
40.0
60.0
80.0
100.0
120.0
Jan-11 Feb-11 Mar-11
Mphasis BSE Technology Index
Post the Q1 results, shares declined 28% in a single day's trading
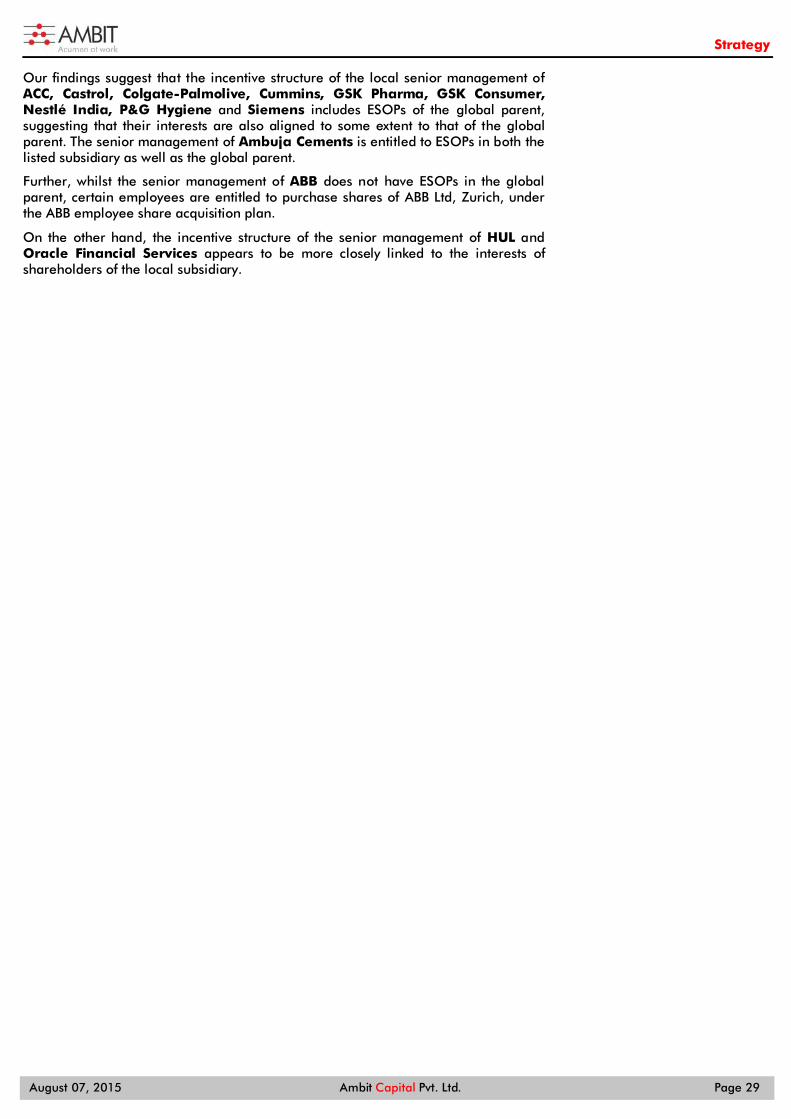
Strategy
August 07, 2015 Ambit Capital Pvt. Ltd. Page 29
Our findings suggest that the incentive structure of the local senior management of ACC, Castrol, Colgate-Palmolive, Cummins, GSK Pharma, GSK Consumer, Nestlé India, P&G Hygiene and Siemens includes ESOPs of the global parent, suggesting that their interests are also aligned to some extent to that of the global parent. The senior management of Ambuja Cements is entitled to ESOPs in both the listed subsidiary as well as the global parent.
Further, whilst the senior management of ABB does not have ESOPs in the global parent, certain employees are entitled to purchase shares of ABB Ltd, Zurich, under the ABB employee share acquisition plan.
On the other hand, the incentive structure of the senior management of HUL and Oracle Financial Services appears to be more closely linked to the interests of shareholders of the local subsidiary.
Strategy
August 07, 2015 Ambit Capital Pvt. Ltd. Page 30
Institutional Equities Team Saurabh Mukherjea, CFA CEO, Institutional Equities (022) 30433174 [email protected]
Research
Analysts Industry Sectors Desk-Phone E-mail
Nitin Bhasin - Head of Research E&C / Infra / Cement / Industrials (022) 30433241 [email protected]
Aadesh Mehta, CFA Banking / Financial Services (022) 30433239 [email protected]
Abhishek Ranganathan, CFA Midcaps (022) 30433085 [email protected]
Achint Bhagat, CFA Cement / Infrastructure (022) 30433178 [email protected]
Aditya Bagul Consumer (022) 30433264 [email protected]
Aditya Khemka Healthcare (022) 30433272 [email protected]
Ashvin Shetty, CFA Automobile (022) 30433285 [email protected]
Bhargav Buddhadev Power Utilities / Capital Goods (022) 30433252 [email protected]
Deepesh Agarwal Power Utilities / Capital Goods (022) 30433275 [email protected] Gaurav Mehta, CFA Strategy / Derivatives Research (022) 30433255 [email protected]
Karan Khanna Strategy (022) 30433251 [email protected]
Pankaj Agarwal, CFA Banking / Financial Services (022) 30433206 [email protected]
Paresh Dave, CFA Healthcare (022) 30433212 [email protected]
Parita Ashar, CFA Metals & Mining / Oil & Gas (022) 30433223 [email protected]
Prashant Mittal, CFA Derivatives (022) 30433218 [email protected]
Rakshit Ranjan, CFA Consumer / Retail (022) 30433201 [email protected]
Ravi Singh Banking / Financial Services (022) 30433181 [email protected]
Ritesh Gupta, CFA Midcaps – Chemical / Retail (022) 30433242 [email protected]
Ritesh Vaidya, CFA Consumer (022) 30433246 [email protected] Ritika Mankar Mukherjee, CFA Economy / Strategy (022) 30433175 [email protected]
Ritu Modi Automobile (022) 30433292 [email protected]
Sagar Rastogi Technology (022) 30433291 [email protected]
Sumit Shekhar Economy / Strategy (022) 30433229 [email protected]
Utsav Mehta, CFA Technology (022) 30433209 [email protected]
Vaibhav Saboo E&C / Infra / Cement / Industrials (022) 30433261 [email protected]
Sales
Name Regions Desk-Phone E-mail
Sarojini Ramachandran - Head of Sales UK +44 (0) 20 7614 8374 [email protected]
Dharmen Shah India / Asia (022) 30433289 [email protected]
Dipti Mehta India / USA (022) 30433053 [email protected]
Hitakshi Mehra India (022) 30433204 [email protected]
Krishnan V India / Asia (022) 30433295 [email protected]
Nityam Shah, CFA USA / Europe (022) 30433259 [email protected]
Parees Purohit, CFA UK / USA (022) 30433169 [email protected]
Praveena Pattabiraman India / Asia (022) 30433268 [email protected]
Shaleen Silori India (022) 30433256 [email protected]
Singapore
Pramod Gubbi, CFA – Director Singapore +65 8606 6476 [email protected]
Shashank Abhisheik Singapore +65 6536 1935 [email protected]
USA / Canada
Ravilochan Pola - CEO Americas +1(646) 361 3107 [email protected]
Production
Sajid Merchant Production (022) 30433247 [email protected]
Sharoz G Hussain Production (022) 30433183 [email protected]
Joel Pereira Editor (022) 30433284 [email protected]
Nikhil Pillai Database (022) 30433265 [email protected]
E&C = Engineering & Construction
Strategy
August 07, 2015 Ambit Capital Pvt. Ltd. Page 31
Explanation of Investment Rating
Investment Rating Expected return (over 12-month)
BUY >10%
SELL <10%
NO STANCE We have forward looking estimates for the stock but we refrain from assigning valuation and recommendation
UNDER REVIEW We will revisit our recommendation, valuation and estimates on the stock following recent events
NOT RATED We do not have any forward looking estimates, valuation or recommendation for the stock
Disclaimer This report or any portion hereof may not be reprinted, sold or redistributed without the written consent of Ambit Capital. AMBIT Capital Research is disseminated and available primarily electronically, and, in some cases, in printed form.
Additional information on recommended securities is available on request.
Disclaimer
1. AMBIT Capital Private Limited (“AMBIT Capital”) and its affiliates are a full service, integrated investment banking, investment advisory and brokerage group. AMBIT Capital is a Stock Broker, Portfolio Manager and Depository Participant registered with Securities and Exchange Board of India Limited (SEBI) and is regulated by SEBI
2. AMBIT Capital makes best endeavours to ensure that the research analyst(s) use current, reliable, comprehensive information and obtain such information from sources which the analyst(s) believes to be reliable. However, such information has not been independently verified by AMBIT Capital and/or the analyst(s) and no representation or warranty, express or implied, is made as to the accuracy or completeness of any information obtained from third parties. The information, opinions, views expressed in this Research Report are those of the research analyst as at the date of this Research Report which are subject to change and do not represent to be an authority on the subject. AMBIT Capital may or may not subscribe to any and/ or all the views expressed herein.
3. This Research Report should be read and relied upon at the sole discretion and risk of the recipient. If you are dissatisfied with the contents of this complimentary Research Report or with the terms of this Disclaimer, your sole and exclusive remedy is to stop using this Research Report and AMBIT Capital or its affiliates shall not be responsible and/ or liable for any direct/consequential loss howsoever directly or indirectly, from any use of this Research Report.
4. If this Research Report is received by any client of AMBIT Capital or its affiliate, the relationship of AMBIT Capital/its affiliate with such client will continue to be governed by the terms and conditions in place between AMBIT Capital/ such affiliate and the client.
5. This Research Report is issued for information only and the 'Buy', 'Sell', or ‘Other Recommendation’ made in this Research Report such should not be construed as an investment advice to any recipient to acquire, subscribe, purchase, sell, dispose of, retain any securities and should not be intended or treated as a substitute for necessary review or validation or any professional advice. Recipients should consider this Research Report as only a single factor in making any investment decisions. This Research Report is not an offer to sell or the solicitation of an offer to purchase or subscribe for any investment or as an official endorsement of any investment.
6. This Research Report is being supplied to you solely for your information and may not be reproduced, redistributed or passed on, directly or indirectly, to any other person or published, copied in whole or in part, for any purpose. Neither this Research Report nor any copy of it may be taken or transmitted or distributed, directly or indirectly within India or into any other country including United States (to US Persons), Canada or Japan or to any resident thereof. The distribution of this Research Report in other jurisdictions may be strictly restricted and/ or prohibited by law or contract, and persons into whose possession this Research Report comes should inform themselves about such restriction and/ or prohibition, and observe any such restrictions and/ or prohibition.
7. Ambit Capital Private Limited is registered as a Research Entity under the SEBI (Research Analysts) Regulations, 2014. Conflict of Interests
8. In the normal course of AMBIT Capital’s business circumstances may arise that could result in the interests of AMBIT Capital conflicting with the interests of clients or one client’s interests conflicting with the interest of another client. AMBIT Capital makes best efforts to ensure that conflicts are identified and managed and that clients’ interests are protected. AMBIT Capital has policies and procedures in place to control the flow and use of non-public, price sensitive information and employees’ personal account trading. Where appropriate and reasonably achievable, AMBIT Capital segregates the activities of staff working in areas where conflicts of interest may arise. However, clients/potential clients of AMBIT Capital should be aware of these possible conflicts of interests and should make informed decisions in relation to AMBIT Capital’s services.
9. AMBIT Capital and/or its affiliates may from time to time have or solicit investment banking, investment advisory and other business relationships with companies covered in this Research Report and may receive compensation for the same.
Additional Disclaimer for U.S. Persons
10. The research report is solely a product of AMBIT Capital 11. AMBIT Capital is the employer of the research analyst(s) who has prepared the research report 12. Any subsequent transactions in securities discussed in the research reports should be effected through Enclave Capital LLC. (“Enclave”). 13. Enclave does not accept or receive any compensation of any kind for the dissemination of the AMBIT Capital research reports. 14. The research analyst(s) preparing the email / Research Report/ attachment is resident outside the United States and is/are not associated persons of any U.S. regulated broker-dealer and that
therefore the analyst(s) is/are not subject to supervision by a U.S. broker-dealer, and is/are not required to satisfy the regulatory licensing requirements of FINRA or required to otherwise comply with U.S. rules or regulations regarding, among other things, communications with a subject company, public appearances and trading securities held by a research analyst account.
15. This report is prepared, approved, published and distributed by the Ambit Capital located outside of the United States (a non-US Group Company”). This report is distributed in the U.S.by Enclave Capital LLC, a U.S. registered broker dealer, on behalf of Ambit Capital only to major U.S. institutional investors (as defined in Rule 15a-6 under the U.S. Securities Exchange Act of 1934 (the “Exchange Act”)) pursuant to the exemption in Rule 15a-6 and any transaction effected by a U.S. customer in the securities described in this report must be effected through Enclave Capital LLC (19 West 44th Street, suite 1700, New York, NY 10036).
16. As of the publication of this report Enclave Capital LLC, does not make a market in the subject securities. 17. This document does not constitute an offer of, or an invitation by or on behalf of Ambit Capital or its affiliates or any other company to any person, to buy or sell any security. The information
contained herein has been obtained from published information and other sources, which Ambit Capital or its Affiliates consider to be reliable. None of Ambit Capital accepts any liability or responsibility whatsoever for the accuracy or completeness of any such information. All estimates, expressions of opinion and other subjective judgments contained herein are made as of the date of this document. Emerging securities markets may be subject to risks significantly higher than more established markets. In particular, the political and economic environment, company practices and market prices and volumes may be subject to significant variations. The ability to assess such risks may also be limited due to significantly lower information quantity and quality. By accepting this document, you agree to be bound by all the foregoing provisions.
Additional Disclaimer for Canadian Persons
18. AMBIT Capital is not registered in the Province of Ontario and /or Province of Québec to trade in securities and/or to provide advice with respect to securities. 19. AMBIT Capital's head office or principal place of business is located in India. 20. All or substantially all of AMBIT Capital's assets may be situated outside of Canada. 21. It may be difficult for enforcing legal rights against AMBIT Capital because of the above. 22. Name and address of AMBIT Capital's agent for service of process in the Province of Ontario is: Torys LLP, 79 Wellington St. W., 30th Floor, Box 270, TD South Tower, Toronto, Ontario M5K 1N2
Canada. 23. Name and address of AMBIT Capital's agent for service of process in the Province of Montréal is Torys Law Firm LLP, 1 Place Ville Marie, Suite 1919 Montréal, Québec H3B 2C3 Canada. Disclosure 24. Ambit and/or its associates have financial interest in Castrol India, Colgate Palmolive, Cummins India, HUL, Maruti, Wabco India and Alstom T&D. 25. Anupam Gupta and/or his relatives have financial interest in Nestle. Analyst Certification Each of the analysts identified in this report certifies, with respect to the companies or securities that the individual analyses, that (1) the views expressed in this report reflect his or her personal views about all of the subject companies and securities and (2) no part of his or her compensation was, is or will be directly or indirectly dependent on the specific recommendations or views expressed in this report. © Copyright 2015 AMBIT Capital Private Limited. All rights reserved.
Ambit Capital Pvt. Ltd. Ambit House, 3rd Floor. 449, Senapati Bapat Marg, Lower Parel, Mumbai 400 013, India. Phone: +91-22-3043 3000 | Fax: +91-22-3043 3100 CIN: U74140MH1997PTC107598 www.ambitcapital.com