stratigraphic sequence and ages of volcanic units in the ... · stratigraphic sequence and ages of...
TRANSCRIPT

Stratigraphic sequence and ages of volcanic units in the Gruithuisen
region of the Moon
R. Wagner,1 J. W. Head III,2 U. Wolf,1 and G. Neukum3
Received 16 January 2002; revised 14 May 2002; accepted 22 May 2002; published 13 November 2002.
[1] Several domes indicative of non-mare volcanism, morphologically as well asspectrally distinct from surrounding mare and highland units, are located in theGruithuisen region in northern Oceanus Procellarum. The determination of the nature andage of non-mare volcanism helps to put constraints on lunar crustal evolution. The ages ofthe domes were previously thought to be mid-Imbrian or possibly even Eratosthenian.In order to assess more closely the stratigraphic relationships in this region, we carried outgeologic mapping and crater size-frequency measurements (1) on the Gruithuisen volcanicdomes, (2) on the adjacent mare units, and (3) in the highland areas. (4) The nearbyIridum impact event was also dated by means of crater counts. A recently updated andimproved version of the lunar production function polynomial was used to fit measuredcrater size-frequency distributions of geologic units, and a cratering chronology modelwas applied in order to assign these units to the periods and epochs of the lunarchronology system. Oceanus Procellarum mare materials in the study area were found torange in age from Late Imbrian to Eratosthenian and show peak cratering model ages at3.55 Gyr (1 Gyr = 1 billion years), 3.2–3.3 Gyr, and about 2.4 Gyr. Some mare unitsshow evidence for at least two events in their crater size-frequency distributions; these aremost likely due to the superposition of later thin lava flows. Mare volcanism, hence, haslasted over a period of several hundred million years in the Gruithuisen region. TheGruithuisen domes show a much more restricted age range; they were found to range inage from 3.85 to 3.72 Gyr and thus were formed in the early part of the Late Imbrian, anolder age than previously thought. Iridum crater, stratigraphically older than theGruithuisen domes, was formed about 3.7–3.8 Gyr ago. The Iridum impact event and theformation of the two Gruithuisen domes cannot be well separated by means of cratercounts. A few stratigraphically older highland units and some mare areas show ages of lessthan 2.0 Gyr, but these are less reliable due to (1) the crater distributions being close tosaturation, (2) less effective crater retention on slopes, and (3) erosional removal ofcraters. INDEX TERMS: 5420 Planetology: Solid Surface Planets: Impact phenomena (includes cratering);
5480 Planetology: Solid Surface Planets: Volcanism (8450); 6250 Planetology: Solar System Objects:
Moon (1221); 8414 Volcanology: Eruption mechanisms; KEYWORDS: Stratigraphy, lunar volcanism, volcanic
dome, crater size-frequency distribution, impact cratering chronology
Citation: Wagner, R., J. W. Head III, U. Wolf, and G. Neukum, Stratigraphic sequence and ages of volcanic units in the Gruithuisen
region of the Moon, J. Geophys. Res., 107(E11), 5104, doi:10.1029/2002JE001844, 2002.
1. Introduction
[2] The Gruithuisen region in northern Oceanus Procel-larum (Figure 1) on the lunar nearside exhibits severaldistinctive steep-sided domes, associated with highlandand mare materials, interpreted to be of volcanic origin
[e.g., Scott and Eggleton, 1973]. These features differ fromthe flatter and generally smaller shield volcanoes seen inmany areas within the mare [Head and Gifford, 1980]. Incontrast to the majority of the spatially extensive and moreor less flat volcanic units in the mare regions [e.g., Head,1976], non-mare volcanism recorded on the lunar surface isrestricted to smaller areas but, as inferred from embaymentrelationships with younger materials, and from spectralstudies, could have covered larger areas in the past [Malin,1974; Chevrel et al., 1999]. Non-mare volcanism is repre-sented by spectral features known as red spots which arecharacterized by (1) a high albedo, (2) a strong absorption inthe ultraviolet, and (3) by a wide range of morphologies,including volcanic constructs such as the Gruithuisen domes[Wood and Head, 1975; Head et al., 1978; Chevrel et al.,
JOURNAL OF GEOPHYSICAL RESEARCH, VOL. 107, NO. E11, 5104, doi:10.1029/2002JE001844, 2002
1DLR, Institute of Space Sensor Technology and Planetary Exploration,Berlin, Germany.
2Department of Geological Sciences, Brown University, Providence,Rhode Island, USA.
3Institut fur Geowissenschaften, Fachrichtung Geoinformatik, FreieUniversitat Berlin, Berlin, Germany.
Copyright 2002 by the American Geophysical Union.0148-0227/02/2002JE001844$09.00
14 - 1

1999]. Based on stratigraphic relationships, the time-strati-graphic position of these domes was interpreted to be eitherImbrian (most likely between 3.3 and 3.6 Gyr [Head andMcCord, 1978]), considering embayment of the domes bymare lavas formed in this time period [Wilhelms, 1987;Head and Wilson, 1992], or, considering brightness andfreshness, was interpreted to be much younger, possiblyEratosthenian [Scott and Eggleton, 1973].[3] In order to constrain the time-line of volcanic events
in this region, the purpose of this study is to present resultsfrom (1) photogeologic mapping of units in the Gruithuisenregion on high-resolution Lunar Orbiter images (section 4)and (2) measurements of the size-frequency distribution ofsuperimposed craters, which so far have not been carriedout in this region (section 5). These two techniques arecombined (3) to derive an age sequence of geologic events(section 6). In addition to their post-Imbrium and pre-marestratigraphic position, the Gruithuisen domes are also super-posed on ejecta from Iridum crater which superposesImbrium basin rings [Scott and Eggleton, 1973]. Since theage of the Iridum impact event has not yet been determinedby crater counts also, we included measurements of thecrater distribution on its ejecta blanket in this study.
2. Geographic and Geologic Setting
[4] The Gruithuisen region discussed in this study issituated on the lunar nearside, confined between latitudes38� and 33�N, and longitudes 37� and 45�W, and covers anarea of about 200 km (width) by 120 km (height). Itslocation is shown in a telescopic view in Figure 1, and a
subarea of the Gruithuisen region is shown in Figure 2 athigher resolution. A relatively steep scarp separates thegently sloped or rugged highland materials, covered bysecondaries from the Imbrium and Iridum events, fromthe relatively smooth mare materials of the Oceanus Pro-cellarum. ‘‘Islands’’ of presumably highland material [Scottand Eggleton, 1973] occur within the maria. The largestcraters in this area are Gruithuisen (13 km) and GruithuisenB (8.6 km). Secondary crater clusters also are abundant inthe mare areas.[5] Three volcanic constructs, two large domes and a
smaller one, can be distinguished in the Gruithuisen region(Figure 2). The western dome, termed g, is located at36�300N and 40�350W. It is approximately circular in out-line, with an average base diameter of 20 km, and a heightof about 1200 m [Head and McCord, 1978; Chevrel et al.,1999]. The eastern dome, termed d, is located at 36�100Nand 39�200W. It has an approximately rectangular outline(33 � 13.5 km) and a height up to 1600 m [Head andMcCord, 1978; Chevrel et al., 1999]. The summit region ofboth domes appears to be flat and is covered by smallimpact craters. The larger dome d may be composed of threecoalescing smaller domes [Head and McCord, 1978]. Asmaller, cone-shaped feature northwest of dome g wasinformally termed ‘‘northwestern’’ dome (‘‘NW’’ in Figure2). This dome has a size of about 8 km and a height ofapproximately 1100 m [Head and McCord, 1978; Head etal., 1978]. Globally, the Gruithuisen domes form a volcanicchain approximately oriented NW-SE. The elongated butstill cone-shaped feature protruding from the southeastern
Figure 1. Location of the Gruithuisen region in thenorthwestern part of the Imbrium basin. Also shown is thearea in the Iridum ejecta blanket used for crater counts.Telescopic view of the Moon’s nearside.
Figure 2. Detailed view of the Gruithuisen area indicatingthe Gruithuisen volcanic domes g, d, and ‘‘NW,’’ and someof the larger craters. Part of Lunar Orbiter frame LO IV 145H2. North is pointing toward the top. Area shown is locatedapproximately at lat. 32�–37.5�N, and long. 37.5�–43�W.
14 - 2 WAGNER ET AL.: STRATIGRAPHIC SEQUENCE AND AGES OF VOLCANIC UNITS IN THE MOON

margin of dome g was mapped and interpreted as part ofdome g by Scott and Eggleton [1973]. However, its spectralsignature suggesting a volcanic origin is very weak [Chevrelet al., 1999], therefore the feature more likely representshighland material affected by volcanic eruptions from thedomes, rather than a smaller volcanic dome in itself.[6] The similarity of the Gruithuisen steep-sided domes to
certain volcanic features on Earth suggests that they repre-sent the eruption of highly viscous lava [Head et al., 1978].Thus, the eruption style was essentially different from marelava emplacement. Also, explosive eruptions may haveplayed a major role [Head et al., 1978].
3. Image Database and Image Processing
[7] Photogeologic mapping and measurements of cratersize-frequency distributions on the Gruithuisen domes and
the surrounding terrains were carried out using LunarOrbiter V images (both medium and high resolution),and Lunar Orbiter IV (high-res) images (for the Iridumejecta blanket). The frame numbers of these images aregiven in Table 1. The Lunar Orbiter images, black andwhite hardcopies were scanned and digitized at the highestpossible image resolution in order to preserve their orig-inal high quality. The ‘‘stripes’’ which are characteristicfeatures of the Lunar Orbiter images were not removedsince the algorithm by which these artifacts can becosmetically corrected tends to reduce the original spatialresolution.[8] The Gruithuisen region including the two larger
domes, highlands and mare materials is entirely coveredby medium-resolution frame LO V 182 M. An area withinthis frame, encompassing the summit region of dome g, iscovered by six LO V high-resolution images. The locationof these frames in the context of a part of medium-resolution frame LO V 182 M is depicted in Figure 3(white lines).
4. Geologic Units
[9] The Gruithuisen domes and adjacent units weremapped in detail by Head et al. [1978]. A geologic sketchmap from their work is shown in Figure 4. The geologiccontext of the Gruithuisen region is covered in maps byScott and Eggleton [1973] and Wilhelms [1987]. Thedesignation of the geologic units in these maps were used
Table 1. Lunar Orbiter Images Used for Crater Counts in the
Gruithuisen Region and on the Iridum Ejecta Blanket
Area Resolution Frame Number
Gruithuisen Medium LO V 182 MHigh LO V 183 H2
LO V 184 H1LO V 184 H1LO V 184 H2LO V 185 H1LO V 185 H2
Iridum LO IV 139 H3LO IV 145 H3LO IV 151 H3
Figure 3. Part of medium-resolution frame LO V 182 M. The area covered by high-resolution LO Vframes is outlined with thick lines. The smaller rectangles within this area represent the geologic typeareas. These are shown in greater detail in Figure 5.
WAGNER ET AL.: STRATIGRAPHIC SEQUENCE AND AGES OF VOLCANIC UNITS IN THE MOON 14 - 3

in this study to define and outline areas for crater size-frequency measurements (section 6).[10] A geologic unit is identified according to its albedo
and morphology on a planetary image and is considered as athree-dimensional material unit, rather than a specific ‘‘ter-rain,’’ even in that case where its thickness is not known[Wilhelms, 1990]. For each geologic unit, a ‘‘type area’’ isdefined which most typically represents the characteristicsof this unit, and which can be used to identify the same unitin other locations of a mapping area [Wilhelms, 1990].[11] The following geologic units were mapped in the
Gruithuisen region: (1) highland materials, (2) mare materi-als, (3) dome materials, and (4) Iridum ejecta materials.[12] The location of the type area of each one of these
units, identified in the Lunar Orbiter high-resolutionframes, is shown in Figure 3. Detailed views of these typeareas are given in Figure 5. Irregular craters and craterclusters identified as secondaries were outlined andexcluded from crater size-frequency measurements. Thesame procedure was carried out (1) for those parts inimages which contain artifacts, produced by the photo-graphic development onboard the Lunar Orbiter spacecraft,
(2) for areas in shadow, and (3) for overexposed areas insome frames.
4.1. Highland Materials
[13] Highland materials at high resolution, as seen in twotype areas in Figures 5a and 5b are bright compared to themare areas and are characterized by a gently sloping,undulating surface which in some parts can appear morerugged. They were mapped as one undivided unit by Headet al. [1978] (see Figure 4). The higher surface roughnessin some areas is caused by clusters of secondary craters(arrows in Figure 5a) with diameters of several kilometersup to about 10 km, most likely from the impact eventwhich created the 260-km diameter Iridum crater [Scottand Eggleton, 1973]. Crater rims are either sharp or partlyto almost completely degraded. In some cases, only moreor less shallow pits have remained (arrows in Figure 5b). Itis likely that these highland units in the mapped area areejecta materials from Iridum crater, as interpreted by Scottand Eggleton [1973], and may also contain reworkedmaterial of the older Imbrium ejecta. Crater counts onthese units were carried out on the LO V high-resolution
Figure 4. Geologic units mapped in the Gruithuisen region (from Head et al. [1978]). Domes fromupper left to lower right are ‘‘NW,’’ g and d.
14 - 4 WAGNER ET AL.: STRATIGRAPHIC SEQUENCE AND AGES OF VOLCANIC UNITS IN THE MOON

frames only. On the LO V medium-resolution frame, thehighlands are dominated almost exclusively by largersecondaries and clusters of secondaries from the Iridumimpact event.
4.2. Mare Materials
[14] Mare materials, as seen in Figure 5c, are dark,smooth, and densely cratered. The main difference invisible crater frequency between mare and highland unitsis due to the fact that (1) mare units appear more denselycratered because of a much better crater retention in thesmooth mare plains, compared to the hilly or rugged high-lands, and (2) the highland regions contain more largecraters (sizes around 10 km) than the adjacent mare units,presumably Iridum and/or Imbrium secondary crater clus-ters, which destroyed preexisting smaller craters. Craters inseveral states of preservation, either with fresh rims, orheavily degraded, pit-like forms (arrows in Figure 5c),covered by younger units, are abundant. Mare materialsalso show secondary crater clusters (labeled cs in Figure 5c),
however, with smaller crater diameters than those found inthe highlands. Local impact events such as the craterGruithuisen could be the source of these clusters. All largersecondaries resulting from the Iridum (and Imbrium) impactevent, which are still visible in the highlands, were coveredby younger mare material. Wrinkle ridges and a chain ofpits about 40 km in total length can be discerned in themedium-resolution frame. Within mare units, areas areobserved that contain slightly higher or lower crater abun-dances, but these areas are not sufficiently distinctive to bemapped according to photogeologic criteria such as albedoor morphology.
4.3. Dome Materials
[15] Dome materials were subdivided into two differentunits by Head et al. [1978] (Figure 4) which were inter-preted to be of volcanic origin: (1) dome summit materialsand (2) slope materials. The summit regions were furthersubdivided into smooth and rough materials, a smallerdome, and scarps [Head et al., 1978]. The summit regionof dome g is shown in Figure 5d at high resolution. In thiswork, smooth and rough summit materials were combinedinto one single unit for crater counts because the individualareas are too small for reliable crater statistics. Featuresindicative of volcanic vents could not be discerned in thehigh-resolution frames.[16] Head et al. [1978] subdivided the slopes on the
domes into two different kinds of material units, (1) anundivided unit and (2) lava flows, the latter unit beingespecially well viewed on dome g in the high-resolutionframes. Alternatively, these flows could also represent land-slides. The type area of the flow or landslide units is shownin Figure 5e. The surface appears hummocky but morerugged than the highlands. Some pit-like forms have a moreor less circular outline and seem to represent crater rimssuperimposed on the surface beneath the flow (large arrowsin Figure 5e), and then having been covered almost entirelyby the deposits of this event. One lobe of this unit extendsfrom the dome into the highlands, and another lobe extendsto the south and is embayed by younger mare materials at itsbase (short arrows in Figure 5e).
4.4. Iridum Ejecta Materials
[17] The Iridum event created a crater 260 km in diametersuperimposed on the Imbrium ring structure at its north-western side. Between about one half and two thirds of theIridum crater rim and its adjacent continuous and discon-tinuous ejecta are preserved at its north-western side,whereas the south-eastern part of rim, crater interior andejecta were entirely covered by younger mare materials(Mare Imbrium units; see Figure 1). At the resolution of theLO IV frames (Table 1), which is about a factor of eightlower than the LO V high-resolution frames, materials ofIridum (continuous and discontinuous) ejecta are character-ized by a rough or even rugged topography. Many areas, asthe type area shown in Figure 5f (located approximately atlat. 51�N, long. 33�W), lie in shadow, or are overexposed,making measurements of crater size-frequencies difficult.Iridum secondaries several kilometers in diameter are foundin the highlands just to the east of the Gruithuisen domes(see Figure 2).
Figure 5. Type areas of geologic units (locations, except(f ), given in Figure 3); (a, b) bright highland materials; (c)mare material; (d) volcanic dome material; (e) volcanic flowmaterial; (f ) material of Iridum ejecta blanket; frames in (a–e) cover an area of about 5.5 � 5.5 km2 each, (f ) about 45� 45 km2 (located approximately at lat. 51�N, long. 33�W).Further explanations given in text.
WAGNER ET AL.: STRATIGRAPHIC SEQUENCE AND AGES OF VOLCANIC UNITS IN THE MOON 14 - 5

5. Crater Size-Frequency Distributions andSurface Ages
5.1. Introduction
[18] Analyses of size-frequency distributions of impactcraters superimposed on various geologic units on thesurface of a planet or satellite provide a valuable tool (1)to verify stratigraphic relationships by comparing craterfrequencies, and to determine age relations between unitswhich do not overlap and hence have no common geologiccontact, (2) to establish a time-stratigraphic column for agiven area, and (3) to provide time-scales for the geologicevolution of a planet (see discussions by, e.g., Neukum etal., 1975; Hartmann et al., 1981].[19] A crater population which accumulates on a planetary
surface such that no equilibrium is reached between preex-isting craters and newly formed ones is said to be inproduction [Neukum, 1983; Neukum and Ivanov, 1994].Production distributions represent the image of the crater-generating projectile mass-velocity distribution, and only forthis case, age relationships between geologic units can beextracted from measuring crater size-frequency distributions.[20] Crater frequencies reflect relative ages between
various geologic units: The higher the crater frequency,the longer a given geologic unit was exposed to theprojectile flux, and the greater is its age [Opik, 1960;Baldwin, 1964]. Absolute ages can be extracted from craterfrequencies only if (1) the cratering rate and its timedependence is known for a given target body or (2) if rocksamples brought back from its surface can be dated radio-metrically. In this latter method, which up to now can onlybe applied to the Moon, absolutely dated rock ages arecorrelated with crater frequencies measured at the locationwhere the rock samples were collected, and an impactchronology model can be derived [see, e.g., Hartmann etal., 1981; Neukum, 1983; Neukum and Ivanov, 1994;Wilhelms, 1987].
5.2. Measurement Technique
[21] Crater size-frequency distributions were measured ontransparencies of the Lunar Orbiter frames under a ZeissPS2K stereocomparator [Greeley et al., 1993]. Crater diam-eters are measured in microns (mm). The maximum error inlocating the stereocomparator cursor on a crater rim is onthe order of 5 mm. For a crater whose diameter is e.g., 200mm on the transparency, the error in diameter therefore isless than 2.5% [Neukum et al., 1975; Greeley et al., 1993].Each measured diameter is converted into kilometers usinga calibration factor (centimeter per kilometer) for eachspecific Lunar Orbiter image. The spatial resolution of eachLunar Orbiter photograph can be derived from navigationaldata [Anderson and Miller, 1971] and then be used toconvert measured distances from micron to kilometer.[22] To measure the crater size-frequency distribution and
to determine the crater retention age of a surface unit, thefollowing two procedures are necessary:1. The area (in km2) of each geologic unit is determined.
This is carried out by positioning the cursor along theboundary of an area of measurement marked on thetransparency.2. The diameter of each crater is measured by locating the
cursor sequentially on two places on the rim connected byone full diameter, generally in left-right mode. In mono-
scopic images, the inner shadow margin to the outer marginrepresents the crater rim diameter [Greeley et al., 1993].
5.3. Graphical Representation of CraterSize-Frequency Distributions
[23] The procedure of measuring crater size-frequencydistributions and the presentation of results in graphical and/or tabular form are exhaustively discussed in several papersand are therefore described here only briefly. For details thereader is referred, for example, to Arvidson et al. [1979],Strom and Neukum [1988], Greeley et al. [1993], Neukumand Ivanov [1994], and Neukum et al. [2001].[24] The measured crater diameters are partitioned into 18
bins in each size range (. . ., 0.1–1 km, 1–10 km, . . .)[Greeley et al., 1993; Neukum and Ivanov, 1994]. Uncer-tainties are determined by a 1-s-confidence interval for eachdata point. For a specific area of measurement A, and anumber ni of craters in a given diameter bin, the confidenceinterval is determined by s = log [(ni ±
pni)/A] [Arvidson et
al., 1979]. The smaller the area measured, the higher theuncertainty in frequency for each diameter bin.[25] Several modes of graphical representation for meas-
ured crater size-frequency distributions are discussed byArvidson et al. [1979]. In this paper we use the cumulativecrater size-frequency diagram (plotted in log-log). Thecumulative crater frequency Ncum is the number of cratersgreater than, or equal to, a crater diameter Dref per unit area(1 km2). For a given number ni of craters greater than, orequal to, Dref measured in a geologic unit of area A (inkm2), the cumulative frequency is calculated as Ncum (D �Dref) = ni/A. A fixed value is taken for Dref (generally 1, 4,10, 20, or 30 km; see, e.g., Strom and Neukum [1988];Neukum and Ivanov [1994]) to compare frequencies ofdifferent geologic units. Generally, a reference diameterwhich is closest to the measured diameter ranges is chosen.Since craters measured in the Gruithuisen region are on theorder of 1–2 km (frame LO V 182 M) and less, we use areference diameter of 1 km, and relative ages of geologicunits are given as cumulative frequencies Ncum (D � 1 km).
5.4. The Lunar Production Function
[26] It was shown by Neukum et al. [1975], Neukum[1983], and Neukum and Ivanov [1994] that cumulativecrater distributions on the Moon, measured on geologicalunits of various ages and in overlapping diameter ranges,could be aligned along a contiguous complex curve by avertical shift, i.e., in the log-Ncum-direction. This curve canbe described by a polynomial of 11th degree which repre-sents the time-invariant lunar production function (Ncum:cumulative crater frequency; D: crater diameter):
log Ncumð Þ ¼ ao þ � ak log Dð Þ k ¼ 1; . . . ; 11 ð1Þ
The term ao in equation (1) represents the time during whicha geologic unit was exposed to the meteorite flux (moreexactly, it is the term a0 + F(t), with F(t) the integralexposition time [Neukum and Ivanov, 1994]).[27] To fit the polynomial to a measured crater distribu-
tion of a given geologic unit, the curve is shifted in log Ncum
by applying the method of least squares (changing coeffi-cient a0 to account for the exposition time). The cumulativefrequency greater/equal to the reference diameter D = 1 km
14 - 6 WAGNER ET AL.: STRATIGRAPHIC SEQUENCE AND AGES OF VOLCANIC UNITS IN THE MOON

representing the crater retention age of the geologic unit isthen calculated directly from the fitted curve.[28] For any two given geologic units with exposure
times ta and tb, their respective cumulative crater frequen-cies Ca and Cb, taken at the reference crater diameter, aredirectly proportional to their exposure times (Ca/Cb = k)[Neukum, 1983; Neukum and Ivanov, 1994]. These craterfrequencies Ca and Cb represent the relative ages or craterretention ages of these two units. By fitting the time-invariant lunar production function to measured craterdistributions it is easily possible to compare two sizedistributions which were actually measured at differentcrater diameter ranges (e.g., because these measurementswere carried out on images of different spatial resolutions),simply by comparing the cumulative frequencies at thereference diameter. Errors in crater retention age generallyare on the order of 20–30% but can amount up to 50% forsmall areas, and/or areas with a small number of craters(e.g., less than 10 craters).[29] The lunar production function polynomial was
refined recently [Ivanov et al., 1999, 2001; Neukum et al.,2001]. Measured frequencies at smaller and larger cratersizes were known to deviate by a factor of about 1.5–2 from
the previous theoretical production function polynomial[Neukum, 1983; Neukum and Ivanov, 1994]. This deviationwas due to the fact that the Moon has a complex geologichistory, with many areas having been resurfaced one orseveral times. Hence it is difficult to find a large area affectedby only one event and to measure a crater distribution at bothsmall and large crater sizes which characterizes this specificevent. In order to eliminate this difference and to improve thepolynomial fit, new counts on the extensive Orientale ejectablanket were carried out on Lunar Orbiter as well asClementine images. The Orientale impact provides a singleevent which has affected a large part of the lunar surface.Using these data at different spatial resolutions, and at cratersizes ranging from smaller to larger craters, an updated lunarproduction function polynomial of 11th degree could bederived [Ivanov et al., 1999, 2001; Neukum et al., 2001]. Forsimplicity, we use the term LPF83 for the previous lunarproduction function, and LPF01 for the improved one.[30] As depicted in Figure 6, both polynomials practically
coincide at smaller crater sizes, but are different by a factorof 2 in crater frequency at diameters larger than about 2 kmwhere the improved polynomial LPF01 is flatter. Coeffi-cients of both polynomials are given in Table 2. The shapeof the lunar production size-frequency distribution (andproduction distributions from terrestrial planets and aste-roids in general) agrees very well with the shape of theasteroidal size-frequency distribution. Main Belt asteroidsprovide the primary source of projectiles in the inner solarsystem, while the contribution of cometary objects to thisprojectile population is assumed to be less than 10%compared to asteroidal objects and hence is within the errorbars of the crater counts [Neukum and Ivanov, 1994; Ivanovet al., 1999, 2001]. The shape of crater size-frequencydistributions for geologic units of various ages was alsoshown to be remarkably stable throughout the geologicallyrecorded lunar history (i.e., since about 4.3 billion years),inferring that the underlying asteroidal projectile size-fre-quency distribution was stable with time [Ivanov et al.,1999, 2001; Neukum et al., 2001]. The polynomial repre-senting the lunar production function can therefore be
Figure 6. Cumulative plot of previous and improved lunarproduction function polynomials; dashed: previous poly-nomial [Neukum, 1983; Neukum and Ivanov, 1994];contiguous line: improved polynomial [Neukum et al.,2001]. Further explanation given in text.
Table 2. Polynomial Coefficients of the Previous (LPF83) and
Improved (LPF01) Lunar Production Function Polynomialsa
PolynomialCoefficient
PreviousPolynomial
ImprovedPolynomial
a0 2.5340 3.087600a1 3.6269 3.557528a2 +0.4366 +0.781027a3 +0.7935 +1.021521a4 +0.0865 0.156012a5 0.2649 0.444058a6 0.0664 +0.019977a7 +0.0379 +0.086850a8 +0.0106 0.005874a9 0.0022 0.006809a10 5.18 � 104 8.25 � 104
a11 +3.97 � 105 5.54 � 105
aLPF83 coefficients by Neukum [1983] and Neukum and Ivanov [1994];LPF01 coefficients by Ivanov et al. [1999, 2001] and Neukum et al. [2001].The improved polynomial is valid for the diameter range 0.01 km < D <300 km. Polynomial coefficients of the crater-generating projectile sizedistribution (not included here) are given by Ivanov et al. [2001] andNeukum et al. [2001].
WAGNER ET AL.: STRATIGRAPHIC SEQUENCE AND AGES OF VOLCANIC UNITS IN THE MOON 14 - 7

applied to fit crater distributions measured on geologic unitsof various ages.[31] In this work, we exclusively apply the improved
lunar production function polynomial (LPF01) to fit cumu-lative frequencies and to obtain relative crater retentionages. These new retention ages differ slightly from craterretention ages from the Gruithuisen region published earlierwhere the previous polynomial LPF83 was used [Wagner etal., 1997], but the average deviations are on the order of2–4% in cumulative frequency. More important, althoughthese numbers have slightly changed, the relative agesequence already determined for all geologic units in theGruithuisen region remains unaffected.
5.5. Specific Effects in Crater Size-FrequencyDistributions: Geologic Resurfacing and EquilibriumDistributions
[32] Two specific effects in crater size-frequency distri-butions must be accounted for in a number of cases in ourstudy: (1) geologic resurfacing and (2) equilibrium distri-butions. The effects of geologic resurfacing on the shape ofcrater size-frequency distributions were discussed by Neu-kum and Horn [1976]. An example for the case of succes-sive lava flows, within Oceanus Procellarum mare unitssouth of the Gruithuisen domes is shown in Figure 7a. First,an older unit, represented by the larger craters, was
emplaced at time t1. A subsequent lava flow at time t2affected the craters of the first unit below a critical diameterDc of about 0.8 km. A younger (t < t2), postflooding craterpopulation could build up on the solidified mare lava flow.This younger population achieved the same steep slope fordiameters D < Dc and continued parallel to the originalpopulation at larger crater sizes (which would have per-tained if no flow had occurred at t2), but with a lowerfrequency compared to the t1 population. Consequentlycrater distributions measured in this study are characterizedby at least one resurfacing event.[33] When a surface is exposed long enough to the
projectile flux, an equilibrium is eventually establishedbetween the destruction of preexisting craters and the for-mation of new ones, and the crater population is no longer inproduction but reaches a state of ‘‘saturation’’ instead. Forthe Moon, the equilibrium distribution can be described bythe following equation [Neukum and Dietzel, 1971]:
Neq ¼ 101:1 D2 ð2Þ
[34] Equilibrium distributions exhibit a characteristiccumulative slope of 2, as shown in Figure 7b. Further-more, equilibrium distributions are diameter-dependent: anequilibrium is first reached at smaller craters below athreshold diameter DE which are much more numerous than
Figure 7. Examples of geologic resurfacing and equilibrium distributions. (a) Cumulative distributionshowing geologic resurfacing by a subsequent lava extrusion (example from mare material unit in theGruithuisen region), affecting craters smaller than about 800 m. A new steep production function buildsup on the younger flow, but with a lower crater frequency. (b) Equilibrium distribution: the cumulativedistribution shown here is characterized by a 2-slope below a threshold crater diameter of about 100 m(example from highland unit in the Gruithuisen region). Curve shown is the improved lunar productionfunction (LPF01). Explanation is given in text.
14 - 8 WAGNER ET AL.: STRATIGRAPHIC SEQUENCE AND AGES OF VOLCANIC UNITS IN THE MOON

the larger sizes, which still are in production. With longerexposure time, the threshold crater diameter DE increases[Neukum, 1983]. For some mare areas, an equilibrium isreached for diameters D < DE = 100 m, whereas forhighland regions with ages higher than 4 Gyr, craterssmaller than about 1 km generally exhibit an equilibriumdistribution (see discussions by Neukum and Dietzel [1971]and Neukum et al. [2001]).
5.6. The Lunar Impact Cratering Chronology Modeland the Derivation of Absolute Ages
[35] By correlating radiometric age data of lunar rocksamples with crater counts carried out in the sites wherethese rocks were collected, a cratering chronology model forthe Moon can be derived which allows one to deriveabsolute ages even for those units which can be investigatedby photogeological methods only. It has been shown byNeukum [1983], Neukum and Ivanov [1994], and Neukum etal. [2001], that the relation between the cumulative craterfrequency for craters equal to, and larger than, 1 km, and theexposure time t can be described by the following crateringchronology model function:
Ncum D � 1 kmð Þ ¼ 5:44 1014 e6:93 t 1� �
þ 8:38 104 tð3Þ
[36] Relative crater retention ages obtained by applicationof equation (1) can be translated into absolute crateringmodel ages, given in billion years or gigayears [Gyr] (1 Gyr= 109 years), by numerically solving equation (3) for time t.The graph of this cratering chronology function is shown inFigure 8. Cumulative frequencies drop exponentially in thefirst billion years of lunar history during the early heavybombardment period. The end of this period is characterizedby the so-called marker horizon, i.e., the formation of theyoungest large multiring structures about 3.7 to 3.8 Gyr ago,which in the case of the Moon is represented by the Orientalebasin [Wetherill, 1975]. Since about 3.3 Gyr, the crateringrate has been more or less constant until the present.[37] The two terms, an exponential and a linear one, in
the chronology function (equation (3)) strongly affect thecratering model age uncertainties, derived from cratercounts and their respective measurement uncertainties. Forgeologic units which formed prior to about 3.3 Gyr, anuncertainty in cumulative frequency of e.g., ±30% translatesinto an absolute model age uncertainty of about ±30 millionyears (Myr). For ages younger than 3.3 Gyr, comparableuncertainties in cumulative frequency of about 30% cancause uncertainties in cratering model age rising up to 0.5Gyr (see discussion by Hiesinger et al. [2000]).[38] Since in this work we apply the improved production
function polynomial (LPF01) in connection with the chro-nology model in equation (3), which is based on cumulativefrequencies obtained with the previous polynomial (LPF83)[Neukum, 1983; Neukum and Ivanov, 1994], one has to takeinto account the fact that we introduce an additionaluncertainty in determining the cratering model age. Strictlyspeaking, three new coefficients in the chronology functionequation (3) must be derived by correlating cumulativefrequencies, using the LPF01 polynomial fitted to measuredcrater distributions, with absolute radiometric ages. Apreliminary derivation yielded the following values for
these three coefficients: 9.9317 � 1012, 5.517, and 7.0� 104, replacing the ones given in equation (3). If onecompares cratering model ages obtained by applying theprevious production function polynomial LPF83, in con-nection with equation (3), with those obtained by applyingpolynomial LPF01 and these three preliminary coefficients,the errors in cratering model age come out to be on the orderof only 2–3% (around 10–30 Myr) for the heavy bombard-ment period, but can rise up to 10–20% (ca. 300–500 Myr)for the constant cratering rate period because the chronol-ogy function per se has a high uncertainty due to the smallincrease in crater frequency with time.[39] Updating the lunar chronology model, based on the
improved production function (LPF01), is a major task inongoing studies concerning lunar impact chronology. To dothis, geologic units on the Apollo landing sites must beidentified and mapped using spectral image data (e.g.,Clementine), and their crater size-frequency distributionmust be measured. This data set will be then used to deriveupdated coefficients for the chronology function in equation(3). For the results presented in this paper, produced by‘‘mixing’’ LPF01 and the chronology model from equation(3), the following conclusions can be drawn: (1) No changein the relative age sequence results from application ofeither one of these two models. (2) The average deviationsin cumulative frequency between LPF83 and LPF01 are onthe order of <2–4%, as discussed in section 5.4. (3) Theuncertainties in cratering model age, introduced by applyingLPF01 and the previous chronology function polynomialcoefficients in equation (3) are on the order of 10–30 Myrfor ages >3.3 Gyr, but can rise up to 500 Myr in units withages less than about 3.3–3.0 Gyr.[40] Rock samples dated radiometrically generally
exhibit a range of ages, rather than reflecting a singleage. Due to this, a further uncertainty in absolute age datingis introduced. The problem is which one of these ages in aradiometrically dated rock sample must be chosen torepresent a specific geologic event. This issue is of major
Figure 8. The lunar cratering chronology model (equation(3)) and boundaries of the lunar time-stratigraphic systemsand series by Neukum [1983], and Neukum and Ivanov[1994], which are used in this paper (see also Table 3). For adetailed introduction to the lunar time-stratigraphic systemsee, for example, Wilhelms [1987] and Stoffler and Ryder[2001].
WAGNER ET AL.: STRATIGRAPHIC SEQUENCE AND AGES OF VOLCANIC UNITS IN THE MOON 14 - 9
importance since the geologic history of the Moon issubdivided into five time-stratigraphic systems, with thebase of each one being defined by one key stratigraphichorizon based on a major (basin-creating) impact eventwhich can be identified in rock samples collected at theApollo and Luna landing sites [see Wilhelms, 1987, andreferences therein].[41] Currently, several models of age assignment are
used. In one model, the lowest (youngest) age occurrencefound in a rock sample is chosen to represent the majorgeologic event, such as the formation of a large impactbasin [e.g., Jessberger et al., 1977; Basaltic VolcanismStudy Project, 1981; Wilhelms, 1987, and referencestherein]. The principal argument of these investigators isthat the youngest age can be derived from components in agiven rock sample which were completely molten duringthe impact, and hence represent a major geologic event likethe formation of a basin. This model has been recentlydiscussed by Stoffler and Ryder [2001], and Stoffler [2002]conducting to younger radiometric ages for the major lunarbasins, e.g., a possible age of 3.77 Gyr for the Imbriumevent, and 3.72 Gyr for Orientale. In a second model of ageassignment, the peak occurrence in an age range measuredin a specific rock sample is chosen to represent the geologicevent which has reset the radiometric clock, while theyounger ages are interpreted to reflect local events subse-quent to the major event [Neukum, 1983; Neukum andIvanov, 1994].[42] The bases of the five major periods of lunar geologic
history derived from these chronology models are given inTable 3. Age deviations between the two models are on theorder of 40 to 70 Myr for the geologic units from the Earlyand Late Imbrian epochs, but can rise up to about 200 Myrfor units from the Nectarian period.[43] The cratering model ages for the major lunar impact
basins fall within the range of radiometric ages published byseveral groups of investigators [see, e.g., Neukum, 1983;Neukum and Ivanov, 1994; Hiesinger et al., 2000]. There-fore we adopt the chronology and stratigraphy model byNeukum [1983] and Neukum and Ivanov [1994] in ourstudy. We have to keep in mind, however, that terms likeLate Imbrian in our paper refer to the model age range given
by Neukum [1983] and Neukum and Ivanov [1994]. Thecumulative frequencies Ncum (D � 1 km) measured at thebase of each of the major periods and epochs, plotted versuscratering model ages by application of equation (3) accord-ing to the model by Neukum [1983] and Neukum and Ivanov[1994] are shown in Figure 8.[44] Relative crater retention ages and absolute cratering
model ages of subareas within each geologic unit mapped inthe study area have a certain range of ages, mostly withinmeasurement uncertainties, but in total these ages clusteraround specific ages. These average ages were used todefine time-stratigraphic units whose areal distributionsare shown in the maps in Figures 10 and 11. The unitsare described and discussed in section 6, also in the contextof geologic units previously mapped [e.g., Scott and Eggle-ton, 1973; Head et al., 1978]. A time-stratigraphic correla-tion diagram of the units is given in Figure 12.
6. Description of Map Units and Discussion
6.1. Iridum Ejecta
[45] Crater counts on the Iridum ejecta blanket (areas ofmeasurement combined into unit termed Iie) could only becarried out using LO IV images with a factor of about eightlower in resolution compared to the LO V high-resolutionimage data for the Gruithuisen region. These images havealso a much lower quality, due to strong contrast differencesand overexposures in certain areas. Thus, only small areascould be selected for dating the Iridum event. These aresubareas of the exterior crater material unit mapped byWilhelms [1987] for Iridum crater.[46] Cratering model ages for the Iridum impact event
range from about 3.84 Gyr to 3.7 Gyr. The higher age wasmeasured at larger crater sizes. Some of these craters,however, were stratigraphically dated as pre-Iridum [Wil-helms, 1987]. The value of 3.84 Gyr therefore represents anupper limit for the Iridum event which is post-Imbrium. Theyounger age was measured for smaller crater sizes. However,these areas could also have undergone resurfacing by theimpacts which created the larger post-Iridum craters. Hencethis value is a lower limit for the Iridum impact event. Iridumcrater was thus formed near the beginning of the LateImbrian epoch.[47] Figure 9a shows cumulative diagrams of distribu-
tions measured on the Iridum ejecta unit Iie (lower curve),compared to distributions from other Imbrian-period basins(upper curve), and from Orientale (middle curve). Thediagram clearly shows the age sequence from the olderImbrian basins (including Imbrium itself) to Orientale at theend of the basin-forming period around 3.8–3.85 Gyr toIridum (3.84–3.7 Gyr). Unit Iie is not shown in the twomaps in Figures 10 and 11 (since this area lies outside) butwas included in the correlation diagram (Figure 12).
6.2. Highlands
[48] Cratering model ages in the highland areas, measuredin LO V high-resolution frames, cluster around two values:about 3.8 and 3.55 Gyr. The unit represented by the higherone of these two values was formed subsequent to theOrientale impact in the Late Imbrian epoch and is termedIh1 (Figure 10). This unit occurs to the west of the westernGruithuisen dome (high-resolution data), and to the south of
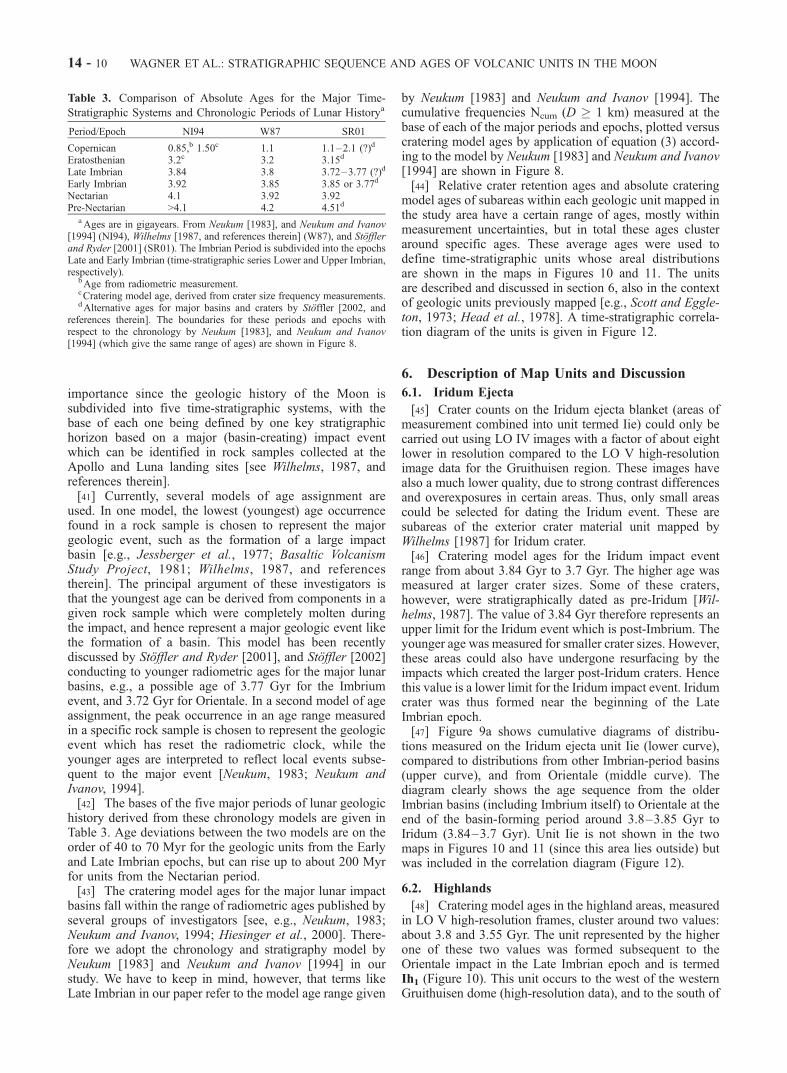
Table 3. Comparison of Absolute Ages for the Major Time-
Stratigraphic Systems and Chronologic Periods of Lunar Historya
Period/Epoch NI94 W87 SR01
Copernican 0.85,b 1.50c 1.1 1.1–2.1 (?)d
Eratosthenian 3.2c 3.2 3.15d
Late Imbrian 3.84 3.8 3.72–3.77 (?)d
Early Imbrian 3.92 3.85 3.85 or 3.77d
Nectarian 4.1 3.92 3.92Pre-Nectarian >4.1 4.2 4.51d
aAges are in gigayears. From Neukum [1983], and Neukum and Ivanov[1994] (NI94), Wilhelms [1987, and references therein] (W87), and Stofflerand Ryder [2001] (SR01). The Imbrian Period is subdivided into the epochsLate and Early Imbrian (time-stratigraphic series Lower and Upper Imbrian,respectively).
bAge from radiometric measurement.cCratering model age, derived from crater size frequency measurements.dAlternative ages for major basins and craters by Stoffler [2002, and
references therein]. The boundaries for these periods and epochs withrespect to the chronology by Neukum [1983], and Neukum and Ivanov[1994] (which give the same range of ages) are shown in Figure 8.
14 - 10 WAGNER ET AL.: STRATIGRAPHIC SEQUENCE AND AGES OF VOLCANIC UNITS IN THE MOON

the eastern dome (medium-resolution). In the high-resolutiondata, we note that clusters of large secondary craters arecharacteristic for this unit. Since such secondaries originatingmost likely from Iridum crater are abundant in all highlandareas to the north and west of the Gruithuisen domes, it canbe concluded that these highland materials contain largeamounts of ejecta materials from Iridum crater, as discussedby Scott and Eggleton [1973] and Wilhelms [1987]. Thecratering model ages also lie within the age range given forthe Iridum impact event above.[49] A second highland unit, termed Ih2 with a Late
Imbrian cratering model age of 3.55 Gyr is found in thelongitudinal, cone-shaped feature adjacent to the westernGruithuisen dome, and also in a small area north of craterGruithuisen in the medium-resolution frame (Figures 10 and11). The reason for this relatively young age is unclear sincethe longitudinally shaped feature is stratigraphically olderthan the dome itself, and no genetic connection to the eventscreating lava flows in the mare units with comparable modelages of 3.55 Gyr can be recognized. A possible explanation
is that this feature is also of volcanic origin, representinganother dome or an extension of the dome g. We considerthis unlikely because the feature shows a clear highlandspectral signature with a minimal amount of the ‘‘red spot’’type material [Chevrel et al., 1999] typical of the Grui-thuisen domes [e.g., Malin, 1974; Head and McCord, 1978;Chevrel et al., 1999].[50] In some of the highland units, no reliable crater
statistics and therefore no cratering model age could bederived. This may result from saturation effects, the craterdistributions being close to equilibrium, as shown in Figure7b, due to erosional effects, or insufficient retention of smallcraters in the hilly highland terrain. Also, some of the mareareas could not be dated, mostly due to crater saturation.Both these ‘‘non dated’’ highland and mare units are termedhmu (highland and mare materials, undivided).
6.3. Gruithuisen Volcanic Domes and RelatedMaterials
[51] The reliability of crater statistics measured in thesummit regions of the two Gruithuisen domes (on the LO V
}
Figure 9. Cumulative distributions of several geologic units in the study areas of Gruithuisen andIridum. (a) Stratigraphic and chronologic sequence from Imbrian basins (3.8–3.9 Gyr) to Orientale(youngest large lunar basin, about 3.8–3.85 Gyr) to Iridum crater (about 3.7 Gyr). (b) Cumulativedistributions measured on Iridum ejecta, compared to distributions measured on the two Gruithuisendomes. Curve shown is LPF01 (Table 2), fitted to each one of the three distributions. See text forexplanation.
WAGNER ET AL.: STRATIGRAPHIC SEQUENCE AND AGES OF VOLCANIC UNITS IN THE MOON 14 - 11

Figure 10. Geologic map of the Gruithuisen region, based on medium-resolution image LO V 182 M.
Figure 11. Geologic map of the Gruithuisen region, based on high-resolution images (see Table 1).
14 - 12 WAGNER ET AL.: STRATIGRAPHIC SEQUENCE AND AGES OF VOLCANIC UNITS IN THE MOON

medium-resolution frame) suffers somewhat from theirsmall size and therefore high uncertainties in crater fre-quencies (see section 5.3). The range in cratering modelages for the unit termed Igd (volcanic material of Grui-thuisen domes d and g) (Figures 10 and 11) is 3.85–3.7Gyr. A cumulative diagram representing the distributionsmeasured on these two domes, compared to the distributionrepresenting the lower limit for Iridum is shown in Figure9b. Stratigraphically the two domes postdate Iridumbecause they are superposed on Iridum ejecta and secon-daries. This is not fully confirmed in the cumulativedistribution. However, the ages of the Iridum event rangefrom 3.84 to 3.7 Gyr coincide very well with the age rangeof the Gruithuisen domes and this implies that the Iridumevent and the formation of the domes took place within ageologically short timescale, with Iridum predating theGruithuisen domes by stratigraphic relationships [Head etal., 1978].[52] There is no available high-resolution frames of the
summit regions of the domes, except for a small portion onthe western dome, where materials on its slopes can bediscerned. Two such units were mapped by Head et al.[1978], here termed Igf (material of Gruithuisen lava flows)(Figure 11), and were interpreted as lava flows. One ofthese flows is embayed by younger mare materials inOceanus Procellarum. An alternative explanation for thesefeatures is that they possibly represent landslides. Crateringmodel ages for the units Igf are 3.72–3.69 Gyr, derivedfrom larger crater sizes in the measurement areas. Thecrater distribution shows a 2-slope at smaller sizes, mostlikely due to insufficient crater retention on the slopes.These ages for Igd and Igf infer that the domes were
volcanically active at the beginning of the Late Imbrianepoch.
6.4. Mare Materials
[53] Crater counts in areas within the Oceanus Procella-rum mare units adjacent to the Gruithuisen domes show thelargest scatter of cratering model ages. The mare unit whichis closest to the highlands and which embays the domes attheir southern slopes is termed EIm. It is characterized by atwo-stage development, with a higher cratering model age atabout 3.5–3.55 Gyr, and at least one resurfacing event by asubsequent flow, with a model age of about 2–2.4 Gyr. Marevolcanism hence was active from Late Imbrian into mid-Eratosthenian. The 3.55 Gyr age was also found in isolatedsmooth (small mare?) patches in the Iridum region (Wagneret al., unpublished data, 1997). Hiesinger et al. [2000] alsoreport an average model age of 3.5 Gyr in Mare Imbrium,suggesting that there was widespread magmatic activity inImbrium, Iridum and Oceanus Procellarum creating largedeposits of mare materials around that time.[54] Some mare units, either in Oceanus Procellarum
located south and north of the domes, and in small, topo-graphically low-lying patches in the highlands, displaycratering model ages of 3.2–3.3 Gyr. These areas arecombined into unit Im in the medium-resolution map andthe correlation diagram. They represent mare volcanismevents in Late-Imbrian. The same model age is given forImbrium mare materials by Hiesinger et al. [2000], suggest-ing there was extended mare basalt deposits eastward fromImbrium into Oceanus Procellarum around that time.[55] The youngest mare unit Em in the area under study
covers a large portion of the Oceanus Procellarum, in dis-
Figure 12. Correlation diagram of geologic units in the Gruithuisen and Iridum regions.
WAGNER ET AL.: STRATIGRAPHIC SEQUENCE AND AGES OF VOLCANIC UNITS IN THE MOON 14 - 13

agreement with an Imbrian age by Scott and Eggleton [1973],but in consistence with an Eratosthenian age by Wilhelms[1987] for this unit. Cratering model ages in subareas of thisunit cluster at about 2.4 Gyr but have ranges from about 2.8 to2.0 Gyr, with uncertainties of several 100 Myr in this part ofthe chronology model function (see paragraph 5.6). Theseyounger ages are also found in the two-stage unit EImwhichis closer to thehighlands.The lackof the greater age inunitEmcould be caused by a greater thickness of the mare materialswhich covered the older crater population in this area. Bycrater counts on spectrally mapped image data, Hiesinger etal. [2000] could also confirm Imbriummarematerials rangingin model ages from 3.4 Gyr to 2.5 Gyr in the western part ofMare Imbrium, to the east of the Gruithuisen study area, inagreement with the model ages found here.[56] Mare volcanism activity extended into mid-Eratos-
thenian in the Gruithuisen region, ranging from 3.55 toabout 2.4 Gyr, over a period of at least 1 Gyr. In contrast tothe more spatially restricted, viscous volcanism associatedwith the Gruithuisen domes was only active during a geo-logically short time period at the beginning of Late Imbrian.
7. Summary
[57] Geologic mapping and measurements of crater size-frequency distributions were carried out on medium- andhigh-resolution Lunar Orbiter images from the Gruithuisenand adjacent Iridum regions on the Moon. A recentlyupdated and improved lunar production function polyno-mial and a lunar impact cratering chronology model [Neu-kum, 1983; Neukum and Ivanov, 1994; Neukum et al., 2001]was used to derive relative and absolute ages for geologicunits in the study area. The following sequence of geologicevents was confirmed by crater statistics:1. Subsequent to the large impact events which created
the multiring structures Imbrium and Orientale, the 260-km crater Iridum was formed. Cratering model ages forthis event range from 3.84 (upper limit) to 3.7 Gyr (lowerlimit). Highland areas around the Gruithuisen domes,interpreted as Iridum ejecta by, for example, Scott andEggleton [1973], also show comparable model ages.2. On a geologically short timescale after the Iridum
event, the three Gruithuisen domes were created byextrusion of viscous lavas. Cratering model ages of thetwo domes d and g are 3.85–3.7 Gyr, close of ages forIridum crater. Lava flows on the western dome also arecharacterized by model ages of 3.7 Gyr.3. Extensive, more fluid eruptions representing mare
volcanism started in the study area about 150 Myr after theformation of the Gruithuisen domes and were active over aperiod of about 1 Gyr into the mid-Eratosthenian, withcratering model ages peaking at 3.55, 3.2–3.3, and about2.4 Gyr. The older peak age in the Gruithuisen region isconnected to emplacement of mare materials in MareImbrium and Sinus Iridum, featuring a similar peak modelage of 3.5 Gyr [Hiesinger et al., 2000].[58] We are planning to carry out further studies of other
red spot areas on the Moon in the near future, e.g., in theHansteen region, in order to constrain the time-line oflunar non-mare volcanism, using available Lunar Orbiter(or Apollo) photography. Since most of these regions areimaged mostly at fairly low spatial resolutions in Lunar
Orbiter images, it is also planned to carry out furtherinvestigations with image data from upcoming lunar mis-sions in order to update geologic maps and to improvecrater size-frequency measurements.
[59] Acknowledgments. We would like to thank S. Chevrel and B.R. Hawke for their detailed review and for helpful suggestions. Thanksare extended to Harald Hiesinger for productive discussions about marestratigraphy and chronology. J. W. H. gratefully acknowledges supportfrom the NASA Planetary Geology and Geophysics Program.
ReferencesAnderson, A. T., and E. R. Miller, Lunar Orbiter Photographic SupportingData. NSSDC 71-13, NASA, Goddard Space Flight Center, Greenbelt,Md., 1971.
Arvidson, R., et al., Standard techniques for presentation and analysis ofcrater size-frequency data, Icarus, 37, 467–474, 1979.
Baldwin, R. B., Lunar crater counts, Astron. J., 69, 377–392, 1964.Basaltic Volcanism Study Project, Basaltic Volcanism on the TerrestrialPlanets, 1286 pp., Pergamon, New York, 1981.
Chevrel, S. D., P. C. Pinet, and J. W. Head, Gruithuisen domes region: Acandidate for an extended nonmare volcanism unit on the Moon,J. Geophys. Res., 104(E7), 16,515–16,529, 1999.
Greeley, R., et al., Galileo imaging observations of lunar maria and relateddeposits, J. Geophys. Res., 98(E9), 17,183–17,205, 1993.
Hartmann, W. K., et al., Chronology of planetary volcanism by comparativestudies of planetary cratering, in Basaltic Volcanism on the Terrestrial,pp. 1049–1127, Pergamon, New York, 1981.
Head, J. W., Lunar volcanism in space and time, Rev. Geophys. SpacePhys., 14, 265–300, 1976.
Head, J. W., and T. B. McCord, Imbrian-age highland volcanism on theMoon: The Gruithuisen and Mairan domes, Science, 199, 1433–1436,1978.
Head, J. W., and A. Gifford, Lunar mare domes: Classification and modesof origin, Moon Planets, 22, 235–258, 1980.
Head, J. W., and L. Wilson, Lunar mare volcanism: Stratigraphy, eruptionconditions, and the evolution of secondary crusts, Geochim. Cosmochim.Acta, 56, 2155–2175, 1992.
Head, J. W., P. C. Hess, and T. B. McCord, Geologic characteristics of lunarhighland volcanic (Gruithuisen and Mairan region) and possible eruptionconditions (abstract), Proc. Lunar Planet. Sci. Conf. 9th, 9, 488–490,1978.
Hiesinger, H., R. Jaumann, G. Neukum, and J. W. Head, Ages of marebasalts on the lunar nearside, J. Geophys. Res., 105(E12), 29,239–29,275, 2000.
Ivanov, B. A., G. Neukum, and R. Wagner, Impact craters, NEA, and mainbelt asteroids: size-frequency distribution [CD-Rom], Proc. Lunar PlanetSci. Conf., 30th, abstract 1583, 1999.
Ivanov, B. A., G. Neukum, and R. Wagner, Size-frequency distributions ofplanetary impact craters and asteroids, in Collisional Processes in theSolar System, edited by M. Y. Morov and H. Rickmann, pp. 1–34,Kluwer Acad., Norwell, Mass., 2001.
Jessberger, E. K., T. Kirsten, and T. Staudacher, One rock and many ages—further K-Ar data on consortium breccia 73215, Proc. Lunar Planet. Sci.Conf., 8th, 2567–2580, 1977.
Malin, M., Lunar red spots: Possible pre-mare materials, Earth Planet. Sci.Lett., 21, 331–341, 1974.
Neukum, G., Meteoritenbombardement und Datierung planetarer Oberfla-chen, Habilitationsschrift, 186 pp., Ludwig-Maximilians-Univ. Munch-en, Germany, 1983.
Neukum, G., and H. Dietzel, On the development of the crater populationon the Moon with time under meteoroid and solar wind bombardment,Earth Planet. Sci. Lett., 12, 59–66, 1971.
Neukum, G., and P. Horn, Effects of lava flows on lunar crater population,Moon, 15, 205–222, 1976.
Neukum, G., and B. A. Ivanov, Crater size distributions and impactprobabilities on Earth from lunar, terrestrial-planet, and asteroidcratering data, in Hazards Due to Comets and Asteroids, editedby T. Gehrels, pp. 359–416, Univ. of Arizona Press, Tucson, Ariz.,1994.
Neukum, G., B. Koenig, and J. Arkani-Hamed, A study of lunar impactcrater size-frequency distributions, Moon, 12, 201–229, 1975.
Neukum, G., B. A. Ivanov, and W. K. Hartmann, Cratering records in theinner solar system in relation to the lunar reference system, in Chronol-ogy and Evolution of Mars, edited by W. K. Hartmann, J. Geiss, and R.Kallenbach, pp. 53–86, Kluwer Acad., Norwell, Mass., 2001.
14 - 14 WAGNER ET AL.: STRATIGRAPHIC SEQUENCE AND AGES OF VOLCANIC UNITS IN THE MOON
Opik, E., The lunar surface as an impact counter, Mon. Not. R. Astron. Soc.,120, 404–411, 1960.
Scott, D.H., andR. E. Eggleton,Geologicmap of theRuemkerQuadrangle oftheMoon,Map I-805 (LAC23),U.S.Geol. Surv.,Washington,D.C., 1973.
Stoffler, D., Absolute ages of the geological epochs of the Moon: A review(abstract), in New Views of the Moon, Europe: Future Lunar Exploration,Science Objectives, and Integration of Datasets, edited by D. J. Heather,ESTEC RSSD, Noordwijk, 2002.
Stoffler, D., and G. Ryder, Stratigraphy and isotope ages of lunar geologicunits: Chronological standard for the inner solar system, in Chronologyand Evolution of Mars, edited by W. K. Hartmann, J. Geiss, and R.Kallenbach, pp. 9–54, Kluwer Acad., Norwell, Mass., 2001.
Strom, R. G., and G. Neukum, The cratering record on Mercury and theorigin of impacting objects, in Mercury, edited by F. Vilas, C. R. Chap-man, and M. S. Matthews, pp. 336–373, Univ. of Arizona Press, Tucson,Ariz., 1988.
Wagner, R., U. Wolf, G. Neukum, and J. Head III, Geologic history of theGruithuisen region on the moon, based on crater size-frequency measure-ments, Ann. Geophys., 15(suppl. III), C794, 1997.
Wetherill, G. W., Late heavy bombardment of the Moon and terrestrialplanets, Proc. Lunar Planet. Sci. Conf., 6th, 1539–1561, 1975.
Wilhelms, D. E., The Geologic History of the Moon, U.S. Geol. Surv. Prof.Pap. 1348, 302 pp., 1987.
Wilhelms, D. E., Geologic mapping, in Planetary Mapping, edited by R.Greeley and R. Batson, pp. 208–260, Cambridge Univ. Press, New York,1990.
Wood, C. A., and J. W. Head, Geologic setting and provenance of spectrallydistinct pre-mare material of possible volcanic origin, paper presented atConference on Origin of Mare Basalts, Lunar Sci. Inst., Houston, Tex.,1975.
J. W. Head III, Department of Geological Sciences, Brown University,
Providence, RI 02912, USA.G. Neukum, R. Wagner, and U. Wolf, DLR, Institute of Space Sensor
Technology and Planetary Exploration, Rutherfordstrasse 2, D-12489,Berlin, Germany. ([email protected])
WAGNER ET AL.: STRATIGRAPHIC SEQUENCE AND AGES OF VOLCANIC UNITS IN THE MOON 14 - 15