structural transformation and growth in china: 1978-2004 loren brandt (u. of toronto) chang-tai...
Post on 21-Dec-2015
216 views
TRANSCRIPT

Structural Transformation and Growth in China: 1978-2004
Loren Brandt (U. of Toronto)
Chang-Tai Hsieh (Berkeley)
Xiaodong Zhu (U. of Toronto)
Preliminary and incompleteFor seminar at CCER, Beijing University
October 11, 2006

Growth Rates of Output per Worker

Observations
• Labor productivity grew faster in agriculture than in non-agriculture
– Alwyn Young (2003) made similar observation and concludes: “To the degree that the reforms have improved efficiency, these gains may lie principally in agriculture”

Observations
• Labor productivity grew faster in agriculture than in non-agriculture
– Alwyn Young (2003) made similar observation and concluded: “To the degree that the reforms have improved efficiency, these gains may lie principally in agriculture”
• But, aggregate labor productivity grew faster than that in both sectors

Observations
• Labor productivity grew faster in agriculture than in non-agriculture
– Alwyn Young (2003) made similar observation and concludes: “To the degree that the reforms have improved efficiency, these gains may lie principally in agriculture”
• But, aggregate labor productivity grew faster than that in both sectors
positive contribution of labor reallocation

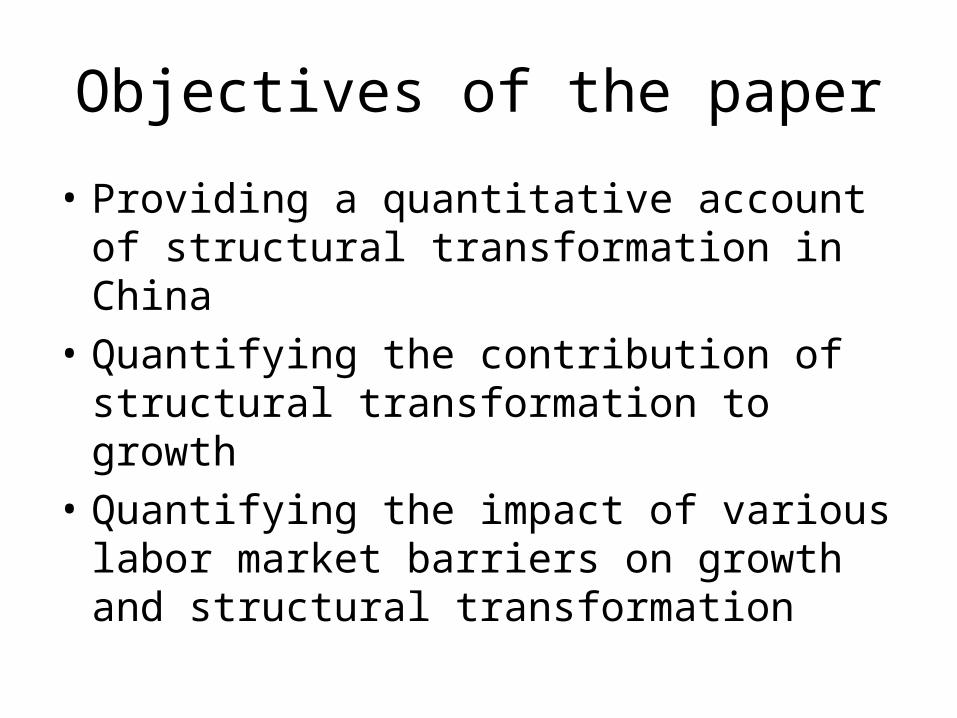
Objectives of the paper
• Providing a quantitative account of structural transformation in China

Objectives of the paper
• Providing a quantitative account of structural transformation in China
• Quantifying the contribution of structural transformation to growth
Objectives of the paper
• Providing a quantitative account of structural transformation in China
• Quantifying the contribution of structural transformation to growth
• Quantifying the impact of various labor market barriers on growth and structural transformation

Data
• Significant revisions of official data• We use separate deflators for each of the three
sectors in calculating real GDP– Similar to Alwyn Young’s method, but we construct
our own service sector deflator instead of using the service component of CPI
• We construct our own series of employment in the primary sector. Official series significantly underestimate labor reallocation.


Decomposing aggregate labor productivity growth:simple accounting


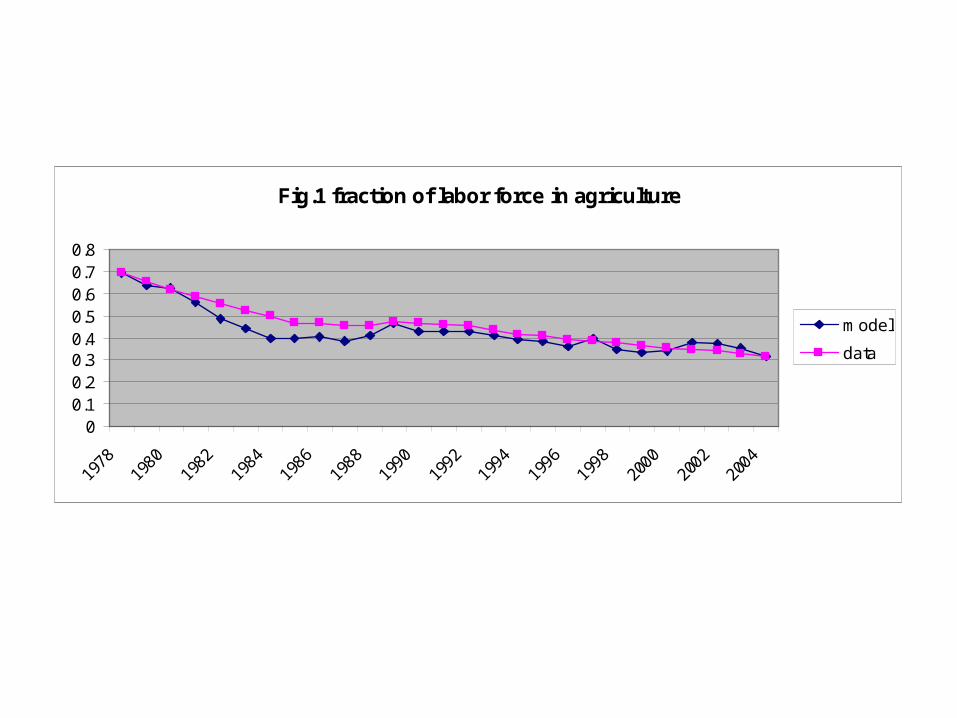
Fig.1 fraction of labor force in agriculture
00.10.20.30.40.50.60.70.8
1978
1980
1982
1984
1986
1988
1990
1992
1994
1996
1998
2000
2002
2004
model
data

Fig.2 Labor productivity in agriculture
0
0.5
1
1.5
2
2.5
3
1978
1980
1982
1984
1986
1988
1990
1992
1994
1996
1998
2000
2002
2004

Fig.3 Reallocation barriers
0.40.45
0.50.55
0.60.65
0.70.75
0.80.85
1978
1980
1982
1984
1986
1988
1990
1992
1994
1996
1998
2000
2002
2004

Fig.4 fraction of labor force in agriculture (no ag TFP growth)
00.10.20.30.40.50.60.70.8
1978
1980
1982
1984
1986
1988
1990
1992
1994
1996
1998
2000
2002
2004
model
data

Fig.5 fraction of labor force in agriculture (no reduction in barriers)
00.10.20.30.40.50.60.70.8
1978
1980
1982
1984
1986
1988
1990
1992
1994
1996
1998
2000
2002
2004
model
data

Two driving forces of labor reallocation
Productivity growth in agriculture:
• Without the growth, fraction of labor force in agriculture in 2004 would be 54% instead of 32%
Reduction in barriers:
• Without the reduction, fraction of labor force in agriculture in 2004 would be 41% instead of 32%


Fig.6 Wage premium of SOEs over NSOEs
0
0.1
0.2
0.3
0.4
0.5
0.6
0.7
1978
1980
1982
1984
1986
1988
1990
1992
1994
1996
1998
2000
2002
2004

Fig.7 SOEs' share of employment in non-agriculture sector
0
0.1
0.2
0.3
0.4
0.5
0.6
0.7
1978
1980
1982
1984
1986
1988
1990
1992
1994
1996
1998
2000
2002
2004

Fig.8 Wage wedge between agriculture and NSOE secotr
0.40.45
0.50.55
0.60.65
0.70.75
0.8
1978
1980
1982
1984
1986
1988
1990
1992
1994
1996
1998
2000
2002
2004


Fig.9 TFPs of SOEs and NSOEs
0
12
3
45
6
1978
1980
1982
1984
1986
1988
1990
1992
1994
1996
1998
2000
2002
2004
NSOEs' TFP SOEs' TFP
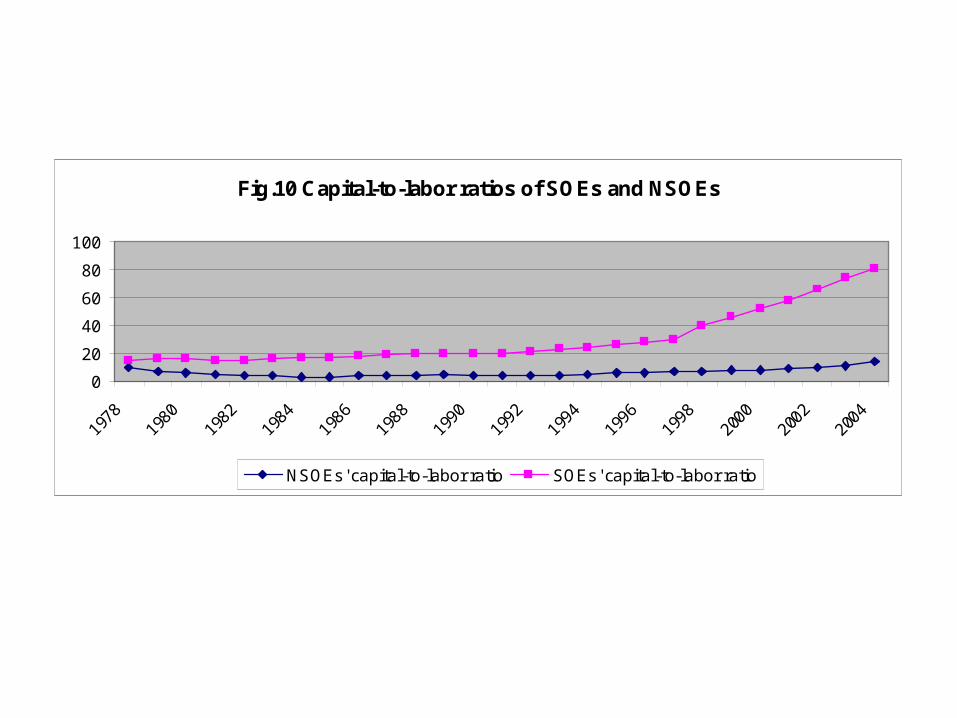
Fig.10 Capital-to-labor ratios of SOEs and NSOEs
0
20
40
60
80
100
1978
1980
1982
1984
1986
1988
1990
1992
1994
1996
1998
2000
2002
2004
NSOEs' capital-to-labor ratio SOEs' capital-to-labor ratio

Counterfactual exercises

Conclusions
• TFP growth in agriculture the main factor for labor reallocation. However, modest contribution to overall growth (about 1%).

Conclusions
• TFP growth in agriculture the main factor for labor reallocation. However, modest contribution to overall growth (about 1%).
• Reduction in labor market barriers another factor for labor reallocation. More important, it contributed significantly to overall growth (more than 2%) by allowing for more efficient allocation of resources---especially capital.
• The single most important factor for China’s growth over the last two and half decades is the TFP growth of the non-state sector (more than 4.5%).
• There are still significant barriers, which prevent more efficient allocation of capital.