structure and thermoelectric properties of te-ag-ge-sb ... · structure and thermoelectric...
TRANSCRIPT
Structure and Thermoelectric Properties of Te-Ag-Ge-Sb(TAGS) Materials Obtained by Reduction of Melted OxideSubstrates
B. KUSZ,1 T. MIRUSZEWSKI,1 B. BOCHENTYN,1,2 M. ŁAPINSKI,1
and J. KARCZEWSKI1
1.—Faculty of Applied Physics and Mathematics, Gdansk University of Technology, ul. Naru-towicza 11/12, 80-233 Gdansk, Poland. 2.—e-mail: [email protected]
Ge0.77Ag0.1Sb0.13Te1 alloy was fabricated by a novel two-step route. Firstly,oxide reagents were melted at high temperature and quenched into pellets.The pellets were milled to powder and then reduced in hydrogen at varioustemperatures for various periods of time. Energy-dispersive x-ray analysisindicated the possibility of successful fabrication of stoichiometric thermo-electric materials from the Te-Ag-Ge-Sb system. The electrical conductivityand Seebeck coefficient have been determined over the temperature rangefrom 20�C to 340�C in argon atmosphere. It was also shown that, for most ofthe fabricated samples, the crystallite size as well as electrical parameterssuch as the electrical conductivity, Seebeck coefficient, and figure of merit (ZT)increased with increasing reduction time. The highest value of ZT (�1.0 at340�C) was obtained for samples reduced in hydrogen atmosphere at 400�C for20 h and 40 h.
Key words: Reduction in hydrogen, TAGS, alloy, thermoelectric, ZT
INTRODUCTION
In recent years, thermoelectric (TE) materialshave been widely studied for use with alternativeenergy sources and in novel energy conversionapplications. The thermoelectric performance of amaterial is quantified by a dimensionless parametercalled the figure of merit (ZT):
ZT ¼ ra2T
j; ð1Þ
where a is the Seebeck coefficient, r is the electricalconductivity, and j is the thermal conductivity. It isclear from Eq. 1 that there are two ways to increasethe value of ZT and thereby improve the thermo-electric performance: One is enhancement of theelectrical conductivity and Seebeck coefficient,while the second is decrease of the thermal conduc-tivity. Slack defined that, theoretically, the bestthermoelectric material would be a narrow-bandgap
semiconductor with high-mobility carriers.1 Thiskind of material should achieve a compromisebetween the mobility of charge carriers and theeffective mass. These parameters influence theelectrical conductivity and Seebeck coefficient,respectively. On the other hand, the thermal con-ductivity should be minimized for thermoelectricapplications. The total thermal conductivity of amaterial is the sum of an electronic componentrelated to transport of heat by electrons/holes (je)and a lattice component (jl) related to phononstraveling through the lattice. As the electronicthermal conductivity is related to the electricalconductivity by the Wiedemann–Franz relationship,
je ¼ L0Tr; ð2Þ
where L0 denotes the Lorenz constant (reportedequal to 2.0 9 10�8 W X K�2 for TAGS materialswith vacancies),2–4 T is temperature, and r is thetotal electrical conductivity, the only way to improvethe thermoelectric properties of a material viathermal conductivity modification is to decrease
(Received August 25, 2015; accepted November 11, 2015;published online December 28, 2015)
Journal of ELECTRONIC MATERIALS, Vol. 45, No. 2, 2016
DOI: 10.1007/s11664-015-4251-1� 2015 The Author(s). This article is published with open access at Springerlink.com
1085
the lattice component of this parameter (jl). Thiscan be achieved by control of the chemical compo-sition or by modifications of the material structureto provide efficient scattering of phonons.
In the development of TE materials, manysemiconducting chalcogenides have attractedmuch attention. Various materials such asAgInxSb1�xTe2,5,6 AgSbTe2,7 Ge-Sb-Te,8 Ge-Pb-Sn-Te,9,10 AgPbmSbnTe2+m (known as LAST materi-als),11 and (GeTe)x(AgSbTe2)100�x with x = 80 or 85(known as TAGS materials) reach bulk ZT values ofaround 1. Thermoelectric properties can be con-trolled by suitable structural modifications. Toreduce the lattice component of the thermal con-ductivity, modifications such as nanostructuring,thin films, or multilayer systems can be performed.Nanostructuration of LAST materials, which leadsto reduction of jl, can increase ZT up to 1.712,13 andeven 2.1.11 TAGS80 and TAGS85 compounds havelong been used in radioisotope thermoelectric gen-erators. At 477�C, a thermoelectric generator oper-ating with optimized TAGS gives ZT values of about1.5.14 In 2014, Schroder et al.2 reported that, inTAGS nanostructured through phase transitionsassociated with vacancy ordering, the ZT valuereached 1.6 at 360�C.
In previous literature reports, many differentmethods for fabrication of thermoelectric alloyshave been reported. The most commonly used aremelting of high-purity elements in evacuated quartzampoules and keeping at about 1000�C,3,8,15,16 or amechanical milling process using pure metals asraw materials.17 To produce nanostructured mate-rials, a wet precipitation process18 and vapor con-densation19 are often adopted. Lee and Hareported20 that, through mechanical milling of oxidereagents, calcination, and reduction in hydrogen,they were able to control the thermoelectric prop-erties of the final Bi0.5Sb1.5Te3 alloy depending onthe duration of the reduction process. Melted oxidesin amorphous or polycrystalline form usually exhi-bit low thermal and electrical conductivity. One ofthe ways to increase the electrical conductivity ofoxide materials is reduction of the metal ions. Kuszand his group examined the formation of both puremetal grains or a composite of metal alloy andamorphous oxide during heat treatment at 340�C to400�C in hydrogen atmosphere for various oxideglasses, e.g., Bi-Si-K-O,21 Bi-Ge-K-O,21 Bi-Si-O,22,23
Bi-Ge-O,24–28 Pb-Ge-O,29 and Ge-Sb-O.30 They haveshown that the structure and physical properties ofthe reduced oxides depend strongly on temperatureand the duration of reduction. The reduction processof Bi3+ and Ge4+ ions in hydrogen atmosphere in thetemperature range of 320�C to 400�C leads to theformation of neutral Bi0 and Ge0 atoms. Afteragglomeration into granules, a uniform metal orsemiconductor structure can be formed. Theseresults provided the idea for a new technology forTE materials production. Melting of oxide powdersat high temperature in air, quenching, milling once
again into powder, and then reducing in hydrogenshould lead to the formation of complex structure.Depending on the initial composition of reagentsand the temperature and duration of reduction,various products can be obtained. In our previouspapers,31,32 it was shown that, using this method, itis possible to fabricate bismuth telluride and bis-muth antimony telluride alloys with different struc-tures and charge carriers, and good thermoelectricproperties.
There are certain oxides and polycrystallinematerials which can be fully reduced under heatingin hydrogen atmosphere. The rate of this processstrongly depends on the energy of the chemicalbonds between the cation and oxygen atoms. Dim-itrow et al.33 reported values for the element bind-ing energies for many pure oxide systems. Lowbinding energy (Eb< 32 eV) was noticed for Bi, Sb,Te, Ge, Ag, Pb, Sn, Na, In, and Co elements. It isimportant to notice that most thermoelectric mate-rials working at 600�C to 700�C are prepared withthese chemical elements.
In this study, the result of reduction in hydrogen ofmelted 38.2GeO2-51.7TeO2-6.72AgNO3-3.38Sb2O3
oxides [denoted as (GeTe)0.85(AgSbTe2)0.15 orTAGS85] was deeply investigated. As a result of thereduction, the expected Ge0.73Ag0.135Sb0.115Te1 com-position was obtained, the same as TAGS85 reportedin literature.34
EXPERIMENTAL PROCEDURES
The investigated oxide precursors were producedfrom appropriate reagent-grade oxides (TeO2, AgO,GeO2, and Sb2O3). First, the reagents were mixedfor 30 min using an agate mortar and melted in aceramic crucible at 1000�C in air for 2 h. Next,samples were poured onto cold stainless-steel plate.This process caused quenching of the melt, resultingin bulk samples. In the next step, the samples weremilled to small-particle form (around 4 lm to 5 lm).Then, the obtained powder was reduced at 280�C,300�C, 320�C, 340�C or 400�C in H2 for 10 h(denoted as TAGS-R280h10 to TAGS-R400h10).After that, the samples were uniaxially pressed ina cylindrical matrix (�60 MPa) at elevated temper-ature (340�C) in argon atmosphere, yielding bulkcylindrical pellets (h � 5 mm; Ø5 mm) of metalliccolor.
To investigate the influence of the reducing time, aseries of samples was reduced at 400�C for 2.5 h,10 h, and 20 h. Then, after pressing in the same wayas for TAGS-R280h10 to TAGS-R400h10, the sam-ples were reduced in hydrogen atmosphere at 400�Cfor the next 2.5 h, 10 h, and 20 h at 400�C, respec-tively (denoted as TAGS-R400h2.5 + 2.5, TAGS-R400h10 + 10, and TAGS-R400h20 + 20). Only theTAGS-R400h10bis sample was pressed under differ-ent conditions (�500 MPa at 180�C in hydrogenatmosphere). The compositions of the samples andcorresponding abbreviations depending on the
Kusz, Miruszewski, Bochentyn, Łapinski, and Karczewski1086
reduction temperature are listed in Table I, whichalso presents the density of the samples as measuredby the Archimedes method and the calculatedporosities.
X-ray diffraction (XRD) analysis was used todetermine the phase composition and structure ofas-melted and reduced samples, using an X’Pert ProMPD Philips diffractometer with Cu Ka (1.542 A)radiation at room temperature. The size of crystal-lites (presented in Table I) was calculated using theScherrer formula. The morphology of the sampleswas recorded using an FEI Quanta FEG 250scanning electron microscope (SEM) with a sec-ondary-electron detector operating in high-vacuummode at accelerating voltage of 10 kV. Maps ofelement distribution were collected using energy-dispersive x-ray spectroscopy (EDX) using an EDAXGenesis APEX 2i with an ApolloX SDD spectrome-ter at accelerating voltage of 20 kV.
The electrical conductivity (r) using the four-terminal direct-current (DC) method and Seebeckcoefficient (a) of the cylindrical samples were mea-sured over the temperature range from 20�C to340�C in argon atmosphere. The values of theSeebeck coefficient were calculated in reference toPt. The total thermal conductivity was determinedat 35�C on the basis of analysis of the heat transferbetween two copper blocks in vacuum conditions.The electronic part of the thermal conductivity (je)was calculated from the Wiedemann–Franz rela-tionship (Eq. 2). The lattice part of the thermalconductivity (jl) was determined at 35�C as thedifference between the measured total (j) andelectronic (je) thermal conductivities.
RESULTS AND DISCUSSION
Structural Properties
The x-ray diffraction patterns of the as-preparedTAGS85 sample and those reduced at different
temperatures of 280�C, 300�C, 320�C, 340�C, and400�C in H2 for 10 h are presented in Fig. 1. Thehalo pattern of the as-prepared sample is charac-teristic of amorphous or highly disordered struc-tures, with one wide peak (at 2h � 28�) showingthat the obtained material could be partially crys-tallized. For the sample reduced at 280�C, somecrystalline peaks can be observed, but the very lowintensity does not allow unambiguous identificationof the phases formed. Starting from the reductiontemperature of 300�C, rhombohedral GeTe struc-ture in space group R3m (reference pattern PDF 01-072-1835) characteristic of TAGS materials can beobserved. The peak broadening and calculationsusing Scherrer’s equation indicated that the nanos-tructured crystalline phase was obtained. Moreover,no additional phases could be identified in theanalyzed XRD plots. In contrast to the other sam-ples, the TAGS-R400h10bis sample exhibited arocksalt-type cubic structure. According to previousliterature reports of Yang et al.,3 it can be concludedthat the different fabrication method for TAGS-R400h10bis could decrease the Ag/Sb ratio, result-ing in the formation of a sample with cubicstructure.
To investigate the influence of the reduction timeon the structural and electrical properties of theTAGS samples, different processing times at con-stant temperature of 400�C were applied. A com-parison between the XRD patterns of the samplesreduced in H2 for 2.5 h + 2.5 h, 10 h + 10 h, and20 h + 20 h is shown in Fig. 2. In the plot for theTAGS-R400h2.5 + 2.5 sample, the presence of GeTenanogranular cubic structure in space group R3m isnoticed. Moreover, some peaks which can beattributed to Ge2Sb2Te5 hexagonal phase in spacegroup P-3m1 were found. In samples reduced at400�C for 10 h + 10 h or 20 h + 20 h, only thepresence of GeTe rhombohedral R3m phase wasnoticed. The narrower peak width related to
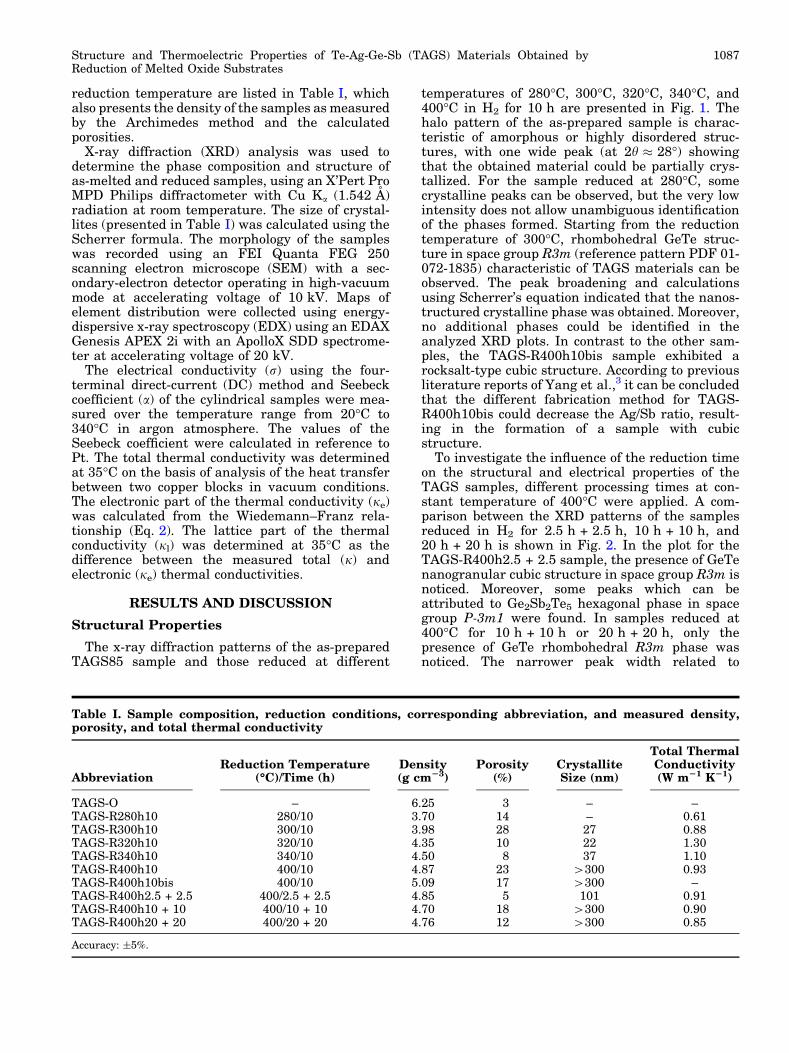
Table I. Sample composition, reduction conditions, corresponding abbreviation, and measured density,porosity, and total thermal conductivity
AbbreviationReduction Temperature
(�C)/Time (h)Density(g cm23)
Porosity(%)
CrystalliteSize (nm)
Total ThermalConductivity(W m21 K21)
TAGS-O – 6.25 3 – –TAGS-R280h10 280/10 3.70 14 – 0.61TAGS-R300h10 300/10 3.98 28 27 0.88TAGS-R320h10 320/10 4.35 10 22 1.30TAGS-R340h10 340/10 4.50 8 37 1.10TAGS-R400h10 400/10 4.87 23 >300 0.93TAGS-R400h10bis 400/10 5.09 17 >300 –TAGS-R400h2.5 + 2.5 400/2.5 + 2.5 4.85 5 101 0.91TAGS-R400h10 + 10 400/10 + 10 4.70 18 >300 0.90TAGS-R400h20 + 20 400/20 + 20 4.76 12 >300 0.85
Accuracy: ±5%.
Structure and Thermoelectric Properties of Te-Ag-Ge-Sb (TAGS) Materials Obtained byReduction of Melted Oxide Substrates
1087
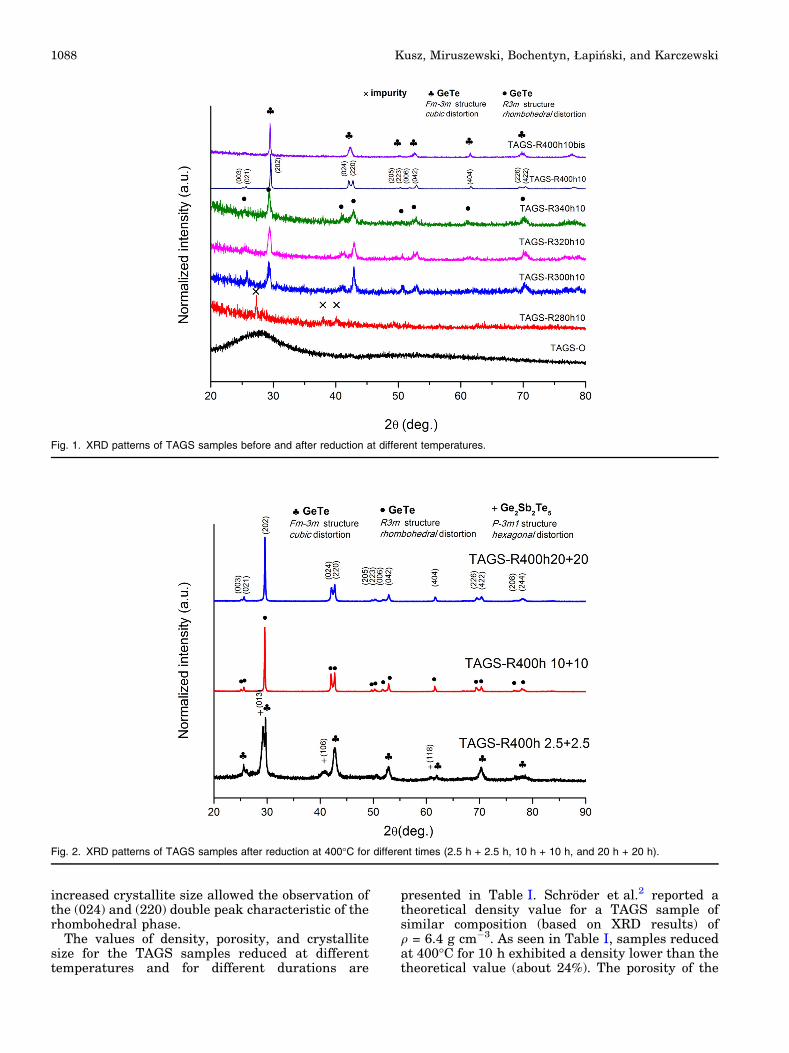
increased crystallite size allowed the observation ofthe (024) and (220) double peak characteristic of therhombohedral phase.
The values of density, porosity, and crystallitesize for the TAGS samples reduced at differenttemperatures and for different durations are
presented in Table I. Schroder et al.2 reported atheoretical density value for a TAGS sample ofsimilar composition (based on XRD results) ofq = 6.4 g cm�3. As seen in Table I, samples reducedat 400�C for 10 h exhibited a density lower than thetheoretical value (about 24%). The porosity of the
Fig. 1. XRD patterns of TAGS samples before and after reduction at different temperatures.
Fig. 2. XRD patterns of TAGS samples after reduction at 400�C for different times (2.5 h + 2.5 h, 10 h + 10 h, and 20 h + 20 h).
Kusz, Miruszewski, Bochentyn, Łapinski, and Karczewski1088
composition was obtained in the range of 5% to 23%.The average crystallite sizes were estimated usingScherrer’s equation. The results for the samplesreduced at 300�C, 320�C, and 340�C were 27 nm,22 nm, and 37 nm, respectively. In the case of allcompositions reduced at 400�C, the crystallite sizewas greater than 300 nm, except for the TAGS-R400h2.5 + 2.5 sample, where the size was esti-mated as 100 nm.
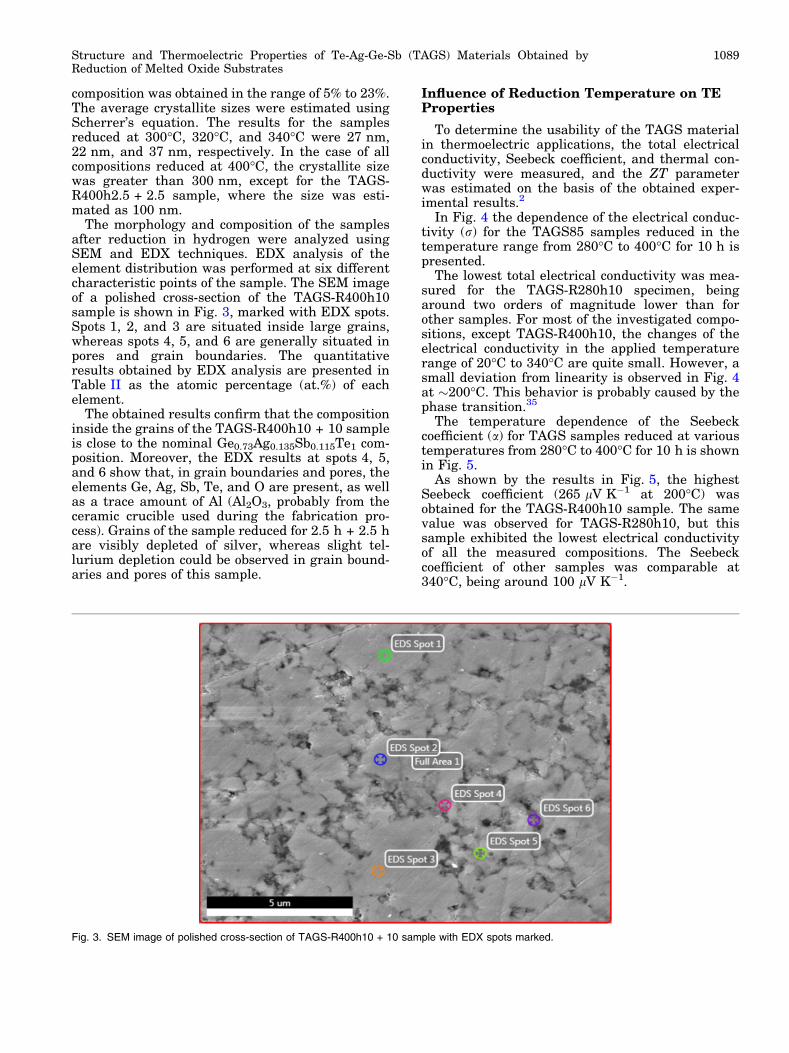
The morphology and composition of the samplesafter reduction in hydrogen were analyzed usingSEM and EDX techniques. EDX analysis of theelement distribution was performed at six differentcharacteristic points of the sample. The SEM imageof a polished cross-section of the TAGS-R400h10sample is shown in Fig. 3, marked with EDX spots.Spots 1, 2, and 3 are situated inside large grains,whereas spots 4, 5, and 6 are generally situated inpores and grain boundaries. The quantitativeresults obtained by EDX analysis are presented inTable II as the atomic percentage (at.%) of eachelement.
The obtained results confirm that the compositioninside the grains of the TAGS-R400h10 + 10 sampleis close to the nominal Ge0.73Ag0.135Sb0.115Te1 com-position. Moreover, the EDX results at spots 4, 5,and 6 show that, in grain boundaries and pores, theelements Ge, Ag, Sb, Te, and O are present, as wellas a trace amount of Al (Al2O3, probably from theceramic crucible used during the fabrication pro-cess). Grains of the sample reduced for 2.5 h + 2.5 hare visibly depleted of silver, whereas slight tel-lurium depletion could be observed in grain bound-aries and pores of this sample.
Influence of Reduction Temperature on TEProperties
To determine the usability of the TAGS materialin thermoelectric applications, the total electricalconductivity, Seebeck coefficient, and thermal con-ductivity were measured, and the ZT parameterwas estimated on the basis of the obtained exper-imental results.2
In Fig. 4 the dependence of the electrical conduc-tivity (r) for the TAGS85 samples reduced in thetemperature range from 280�C to 400�C for 10 h ispresented.
The lowest total electrical conductivity was mea-sured for the TAGS-R280h10 specimen, beingaround two orders of magnitude lower than forother samples. For most of the investigated compo-sitions, except TAGS-R400h10, the changes of theelectrical conductivity in the applied temperaturerange of 20�C to 340�C are quite small. However, asmall deviation from linearity is observed in Fig. 4at �200�C. This behavior is probably caused by thephase transition.35
The temperature dependence of the Seebeckcoefficient (a) for TAGS samples reduced at varioustemperatures from 280�C to 400�C for 10 h is shownin Fig. 5.
As shown by the results in Fig. 5, the highestSeebeck coefficient (265 lV K�1 at 200�C) wasobtained for the TAGS-R400h10 sample. The samevalue was observed for TAGS-R280h10, but thissample exhibited the lowest electrical conductivityof all the measured compositions. The Seebeckcoefficient of other samples was comparable at340�C, being around 100 lV K�1.
Fig. 3. SEM image of polished cross-section of TAGS-R400h10 + 10 sample with EDX spots marked.
Structure and Thermoelectric Properties of Te-Ag-Ge-Sb (TAGS) Materials Obtained byReduction of Melted Oxide Substrates
1089
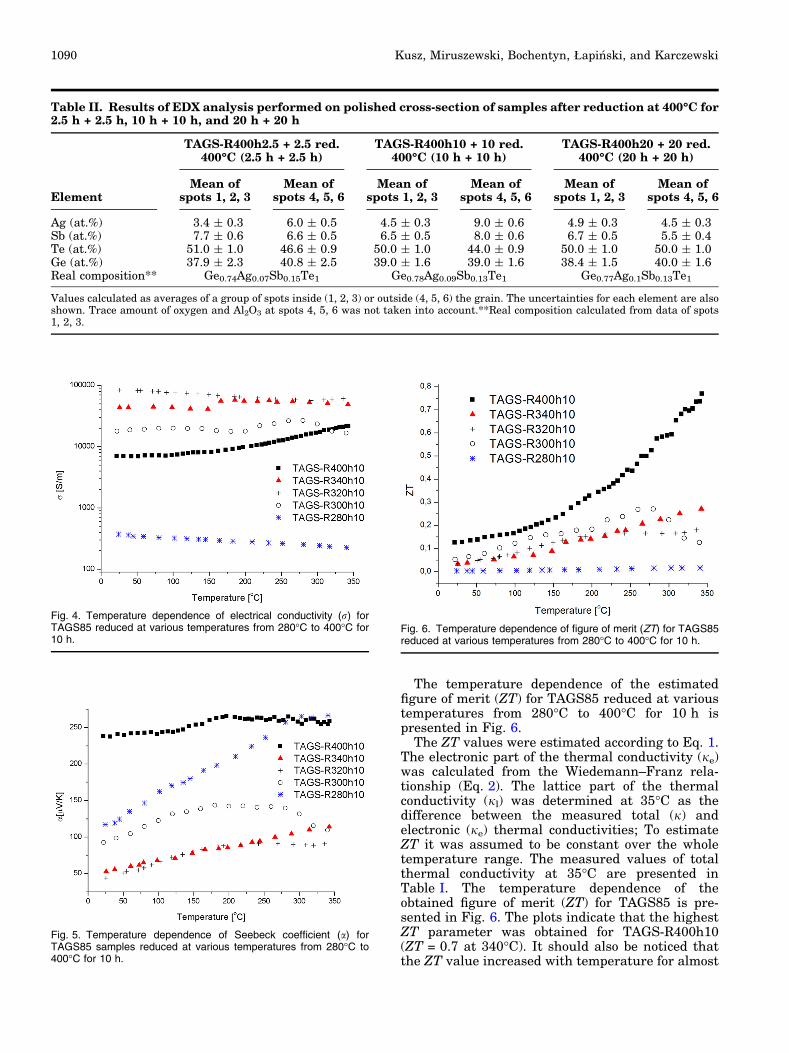
The temperature dependence of the estimatedfigure of merit (ZT) for TAGS85 reduced at varioustemperatures from 280�C to 400�C for 10 h ispresented in Fig. 6.
The ZT values were estimated according to Eq. 1.The electronic part of the thermal conductivity (je)was calculated from the Wiedemann–Franz rela-tionship (Eq. 2). The lattice part of the thermalconductivity (jl) was determined at 35�C as thedifference between the measured total (j) andelectronic (je) thermal conductivities; To estimateZT it was assumed to be constant over the wholetemperature range. The measured values of totalthermal conductivity at 35�C are presented inTable I. The temperature dependence of theobtained figure of merit (ZT) for TAGS85 is pre-sented in Fig. 6. The plots indicate that the highestZT parameter was obtained for TAGS-R400h10(ZT = 0.7 at 340�C). It should also be noticed thatthe ZT value increased with temperature for almost
Table II. Results of EDX analysis performed on polished cross-section of samples after reduction at 400�C for2.5 h + 2.5 h, 10 h + 10 h, and 20 h + 20 h
Element
TAGS-R400h2.5 + 2.5 red.400�C (2.5 h + 2.5 h)
TAGS-R400h10 + 10 red.400�C (10 h + 10 h)
TAGS-R400h20 + 20 red.400�C (20 h + 20 h)
Mean ofspots 1, 2, 3
Mean ofspots 4, 5, 6
Mean ofspots 1, 2, 3
Mean ofspots 4, 5, 6
Mean ofspots 1, 2, 3
Mean ofspots 4, 5, 6
Ag (at.%) 3.4 ± 0.3 6.0 ± 0.5 4.5 ± 0.3 9.0 ± 0.6 4.9 ± 0.3 4.5 ± 0.3Sb (at.%) 7.7 ± 0.6 6.6 ± 0.5 6.5 ± 0.5 8.0 ± 0.6 6.7 ± 0.5 5.5 ± 0.4Te (at.%) 51.0 ± 1.0 46.6 ± 0.9 50.0 ± 1.0 44.0 ± 0.9 50.0 ± 1.0 50.0 ± 1.0Ge (at.%) 37.9 ± 2.3 40.8 ± 2.5 39.0 ± 1.6 39.0 ± 1.6 38.4 ± 1.5 40.0 ± 1.6Real composition** Ge0.74Ag0.07Sb0.15Te1 Ge0.78Ag0.09Sb0.13Te1 Ge0.77Ag0.1Sb0.13Te1
Values calculated as averages of a group of spots inside (1, 2, 3) or outside (4, 5, 6) the grain. The uncertainties for each element are alsoshown. Trace amount of oxygen and Al2O3 at spots 4, 5, 6 was not taken into account.**Real composition calculated from data of spots1, 2, 3.
Fig. 4. Temperature dependence of electrical conductivity (r) forTAGS85 reduced at various temperatures from 280�C to 400�C for10 h.
Fig. 5. Temperature dependence of Seebeck coefficient (a) forTAGS85 samples reduced at various temperatures from 280�C to400�C for 10 h.
Fig. 6. Temperature dependence of figure of merit (ZT) for TAGS85reduced at various temperatures from 280�C to 400�C for 10 h.
Kusz, Miruszewski, Bochentyn, Łapinski, and Karczewski1090
all the investigated samples and did not reach amaximum in the analyzed temperature range. Onlyfor TAGS-R300h10 was a maximum value ofZT = 0.2 found.
Influence of Reduction Time on TE Properties
The influence of the reduction time on the struc-tural and electrical properties of the fabricatedTAGS material was also investigated.
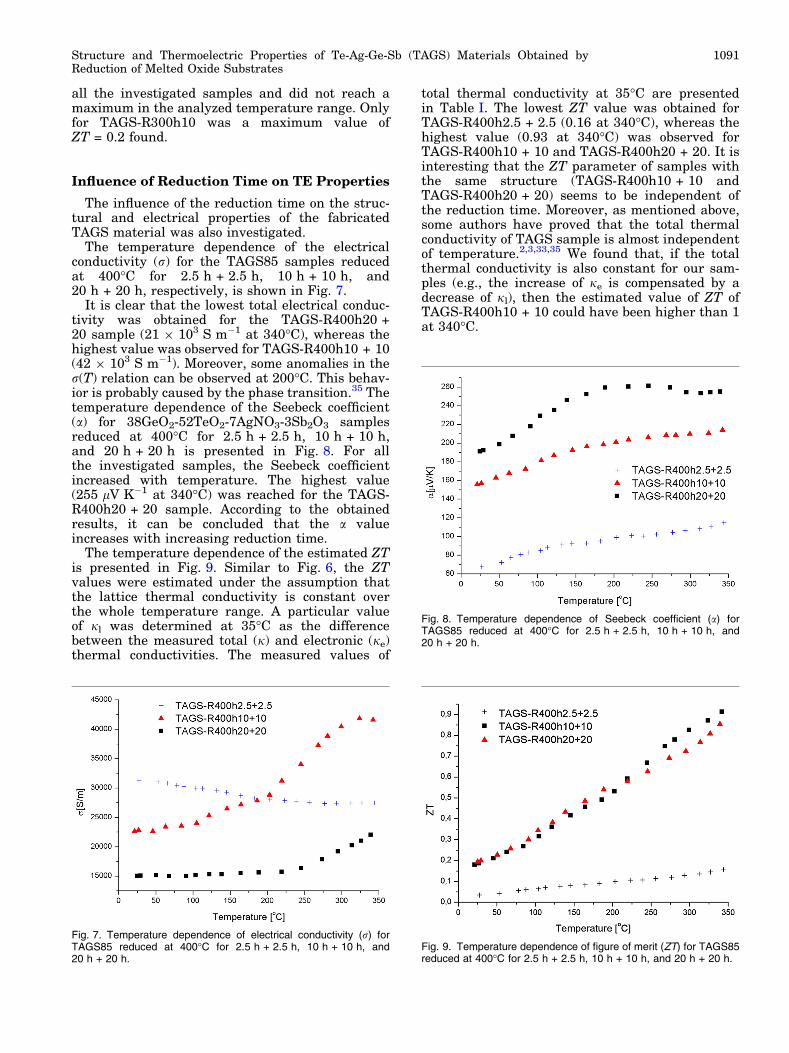
The temperature dependence of the electricalconductivity (r) for the TAGS85 samples reducedat 400�C for 2.5 h + 2.5 h, 10 h + 10 h, and20 h + 20 h, respectively, is shown in Fig. 7.
It is clear that the lowest total electrical conduc-tivity was obtained for the TAGS-R400h20 +20 sample (21 9 103 S m�1 at 340�C), whereas thehighest value was observed for TAGS-R400h10 + 10(42 9 103 S m�1). Moreover, some anomalies in ther(T) relation can be observed at 200�C. This behav-ior is probably caused by the phase transition.35 Thetemperature dependence of the Seebeck coefficient(a) for 38GeO2-52TeO2-7AgNO3-3Sb2O3 samplesreduced at 400�C for 2.5 h + 2.5 h, 10 h + 10 h,and 20 h + 20 h is presented in Fig. 8. For allthe investigated samples, the Seebeck coefficientincreased with temperature. The highest value(255 lV K�1 at 340�C) was reached for the TAGS-R400h20 + 20 sample. According to the obtainedresults, it can be concluded that the a valueincreases with increasing reduction time.
The temperature dependence of the estimated ZTis presented in Fig. 9. Similar to Fig. 6, the ZTvalues were estimated under the assumption thatthe lattice thermal conductivity is constant overthe whole temperature range. A particular valueof jl was determined at 35�C as the differencebetween the measured total (j) and electronic (je)thermal conductivities. The measured values of
total thermal conductivity at 35�C are presentedin Table I. The lowest ZT value was obtained forTAGS-R400h2.5 + 2.5 (0.16 at 340�C), whereas thehighest value (0.93 at 340�C) was observed forTAGS-R400h10 + 10 and TAGS-R400h20 + 20. It isinteresting that the ZT parameter of samples withthe same structure (TAGS-R400h10 + 10 andTAGS-R400h20 + 20) seems to be independent ofthe reduction time. Moreover, as mentioned above,some authors have proved that the total thermalconductivity of TAGS sample is almost independentof temperature.2,3,33,35 We found that, if the totalthermal conductivity is also constant for our sam-ples (e.g., the increase of je is compensated by adecrease of jl), then the estimated value of ZT ofTAGS-R400h10 + 10 could have been higher than 1at 340�C.
Fig. 7. Temperature dependence of electrical conductivity (r) forTAGS85 reduced at 400�C for 2.5 h + 2.5 h, 10 h + 10 h, and20 h + 20 h.
Fig. 8. Temperature dependence of Seebeck coefficient (a) forTAGS85 reduced at 400�C for 2.5 h + 2.5 h, 10 h + 10 h, and20 h + 20 h.
Fig. 9. Temperature dependence of figure of merit (ZT) for TAGS85reduced at 400�C for 2.5 h + 2.5 h, 10 h + 10 h, and 20 h + 20 h.
Structure and Thermoelectric Properties of Te-Ag-Ge-Sb (TAGS) Materials Obtained byReduction of Melted Oxide Substrates
1091
CONCLUSIONS
A novel fabrication method for TAGS thermoelec-tric materials is presented. The oxide mixture38.2GeO2-51.7TeO2-6.72AgNO3-3.38Sb2O3 was meltedat high temperature, quenched to form pellets,milled, and then reduced in hydrogen using varioustemperatures and times. The Ge0.77Ag0.1Sb0.13Te1
material could be successfully sintered in both crys-tallographic forms of germanium telluride (GeTe),viz. rhombohedral R3m and cubic Fm-3m. It wasfound that the single-phase GeTe nanogranularform could be fabricated above reduction tempera-ture of 280�C. It is worth underlining that the sizeof the nanocrystallites increased with the reductiontemperature. Furthermore, the duration of thereduction process had a great influence on thefinal structure and properties of the material. Atlower temperatures, TAGS with nanometer-sizegrains could be fabricated. It was also shown thatthe size of the crystallites as well as electricalparameters such as the electrical conductivity,Seebeck coefficient, and ZT increased with thereduction duration. Our investigations alsoshowed that this fabrication method based onreduction of oxides results in very promisingmaterials for thermoelectric applications. The ZTvalue of Ge0.77Ag0.1Sb0.13Te1 (samples TAGS-R400h10 + 10 and TAGS-R400h20 + 20), underthe assumption that the total thermal conductivityis independent of temperature (j = const.), reacheda value of 1.3 and 1.0, respectively, at 340�C.
We strongly believe that a well-designed fabrica-tion technique is necessary to obtain a single-phaseGeTe structure with promising thermoelectric prop-erties. Based on our experience, we conclude thatthe use of pure substrates, melting in a platinumcrucible, ball-milling, and reduction under optimalconditions will allow bulk TAGS samples with highpotential for application in TE devices to beobtained. Thus, a wide group of TE materialsworking at less than 700�C can be prepared usingour novel method. In addition, by varying thecomposition, and temperature and duration ofreduction, it may be possible to obtain nanostruc-tured TE material with one of the highest ZTvalues.
ACKNOWLEDGEMENTS
The authors would like to acknowledge WitoldLizak for help with sample fabrication and Prof.Maria Gazda for support with XRD measurements.This work was funded by the National ScienceCenter under Grant No. NCN 2012/05/B/ST3/02816.
OPEN ACCESS
This article is distributed under the terms of theCreative Commons Attribution 4.0 InternationalLicense (http://creativecommons.org/licenses/by/4.0/),which permits unrestricted use, distribution, and re-production in any medium, provided you give appro-priate credit to the original author(s) and the source,
provide a link to the Creative Commons license, andindicate if changes were made.
REFERENCES
1. G.A. Slack, CRC Handbook of Thermoelectrics (Boca Raton:CRC Press, 1995), p. 407.
2. T. Schroder, T. Rosenthal, N. Giesbrecht, M. Nentwig, andS. Maier, Inorg. Chem. 53, 7722 (2014).
3. S.H. Yang, T.J. Zhu, S.N. Zhang, J.J. Shen, and X.B. Zhao,J. Electron. Mater. 39, 2127 (2010).
4. T. Zhu, H. Gao, Y. Chen, and X.B. Zhao, J. Mater. Chem. A2, 3251 (2014).
5. R. Mohanraman, R. Sankar, K.M. Boopathi, F.C. Chou,C.W. Chu, C.H. Lee, and Y.Y. Chen, J. Mater. Chem. A 2,2839 (2014).
6. T. Schroder, T. Rosenthal, D. Souchay, C. Petermayer, S.Grott, E.W. Scheidt, C. Gold, W. Scherer, and O.J. Oeckler,J. Solid State Chem. 206, 20 (2013).
7. D.T. Morelli, V. Jovovic, and J.P. Heremans, Phys. Rev. Lett.101, 035901 (2008).
8. F. Yan, T.J. Zhu, X.B. Zhao, and S.R. Dong, Appl. Phys. A88, 425 (2007).
9. Y. Gelbstein, Y. Rosenberg, Y. Sadia, and M.P. Dariel, J.Phys. Chem. C 114, 13126 (2010).
10. D. Wu, L.D. Zhao, Q.H. Wu, H. Chi, Y. Gelbstein, C. Uher,C. Wolverton, M.I. Kanatzidis, and L. He, J. Am. Chem. Soc.136, 11412 (2014).
11. K.F. Hsu, S. Loo, F. Guo, W. Chen, J.S. Dyck, C. Uher, T.Hogan, E.K. Polychroniadis, and M.G. Kanatzidis, Science303, 818 (2004).
12. K.F. Cai, C. Yan, Z.M. He, J.L. Cui, C. Stiewe, and E.Muller, J. Alloy. Compd. 469, 499 (2009).
13. N. Chen, F. Gascoin, G.J. Snyder, E. Muller, G. Karpinski,and C. Stiewe, Appl. Phys. Lett. 87, 171903 (2005).
14. E. Skrabek and D. Trimmer, U.S. patent specification 3 945855 (1976).
15. W. Xie, X. Tang, Y. Yan, Q. Zhang, and T.M. Tritt, Appl.Phys. Lett. 94, 102111 (2009).
16. S. Zhang, G. Jiang, T. Zhu, X. Zhao, and S. Yang, Int. J.Min. Met. Mater. 18, 352 (2011).
17. B. Poudel, Q. Hao, Y. Ma, Y. Lan, A. Minnich, B. Yu, X. Yan,D. Wang, A. Muto, D. Vashaee, X. Chen, J. Liu, M.S.Dresselhaus, G. Chen, and Z. Ren, Science 320, 634 (2008).doi:10.1126/science.1156446.
18. J.J. Ritter and P. Maruthamuthu, Inorg. Chem. 34, 4278(1995).
19. G.G. Lee, D.Y. Lee, and G.H. Ha, Met. Mater. Int. 17, 245(2011).
20. G. Lee and G.H. Ha, J. Electron. Mater. 43, 1697 (2014).21. J. Gackowska, M. Gazda, K. Trzebiatowski, and B. Kusz, J.
Non Cryst. Solids 354, 4319 (2008). doi:10.1016/j.jnoncrysol.2008.06.043.
22. B. Kusz, K. Trzebiatowski, and R.J. Barczynski, Solid StateIon. 159, 293 (2003). doi:10.1016/S0167-2738(02)00911-6.
23. A. Witkowska, J. Rybicki, and A. Di Cicco, J. Alloy. Compd.401, 135 (2005). doi:10.1016/j.jallcom.2005.01.104.
24. B. Kusz and K. Trzebiatowski, J. Non Cryst. Solids 319, 257(2003). doi:10.1016/S0022-3093(02)01969-5.
25. B. Kusz, K. Trzebiatowski, M. Gazda, and L. Murawski, J.Non Cryst. Solids 328, 137 (2003). doi:10.1016/S0022-3093(03)00466-6.
26. B. Kusz, J. Non Cryst. Solids 356, 278 (2010). doi:10.1016/j.jnoncrysol.2003.12.048.
27. B. Kusz, Solid State Commun. 125, 623 (2003). doi:10.1016/S0038-1098(03)00008-5.
28. B. Bochentyn, J. Karczewski, M. Gazda, and B. Kusz, Pro-cedia Eng. 98, 46 (2014).
29. J. Gackowska, M. Gazda, K. Trzebiatowski, and B. Kusz, J.Non Cryst. Solids 352, 4242 (2006). doi:10.1016/j.jnoncrysol.2006.07.016.
30. B. Bochentyn, J. Karczewski, M. Gazda, and B. Kusz, Pro-cedia Eng. 98, 51 (2014).
Kusz, Miruszewski, Bochentyn, Łapinski, and Karczewski1092

31. B. Bochentyn, J. Karczewski, T. Miruszewski, and B. Kusz,J. Alloy. Compd. 646, 1124 (2015).
32. B. Bochentyn, J. Karczewski, T. Miruszewski, and B. Kusz,Mater. Res. Bull. (2015).
33. J.DawidowandT.Komatsu,J.SolidStateChem.163,100(2002).
34. E.A. Skrabek and D.S. Trimmer, CRC Handbook of Ther-moelectrics, ed. D.M. Rove (Boca Raton: CRC Press, 1994), p.267.
35. J. Davidow, Y. Gelbstein, and A. Comparison, J. Electron.Mater. 42, 1542 (2013).
Structure and Thermoelectric Properties of Te-Ag-Ge-Sb (TAGS) Materials Obtained byReduction of Melted Oxide Substrates
1093