structured problem solving - ascendantconsulting.net - structured... · structured problem solving...
TRANSCRIPT

ProblemSolving
ProblemSolving
ControlControlProcess
I
n
p
u
t
s
O
u
t
p
u
t
s
Copyright 2015. All Rights Reserved.
Structured
Problem Solving
Structured Structured
Problem SolvingProblem Solving
Today’s problems are often
born from yesterday’s solutions.
Presenter:
Ken Myers, CQE, CSSBB, CMBB, PBSL
President, Ascendant Consulting Service, Inc.
Overview:

ProblemSolving
ProblemSolving
ControlControlProcess
I
n
p
u
t
s
O
u
t
p
u
t
s
Copyright 2015. All Rights Reserved.
Presentation Coverage
Presentation Coverage
� Introduction
� The Basics
� Problem Solving Roadmap
� Case Study

Structured Problem Solving 3
About Me
� Ken has 25+ years industrial experience in problem solving, root-cause analysis, CAPA methodology, and problem prevention.
� Within this period he has 17 years combined experience in the medical device, biotech, vaccines and biopharmaceutical industries.
� His remainder experience is in the microelectronics, materials science applications, and military electronics manufacturing areas.
� Ken’s client companies include Bayer Healthcare, Genentech, BP Americas, Novartis, and Sanofi-Pasteur.
� His lifetime supported multi-company benefits are ~US$450M.
� He holds degrees in both Physics and General Engineering.
Structured Problem Solving 4
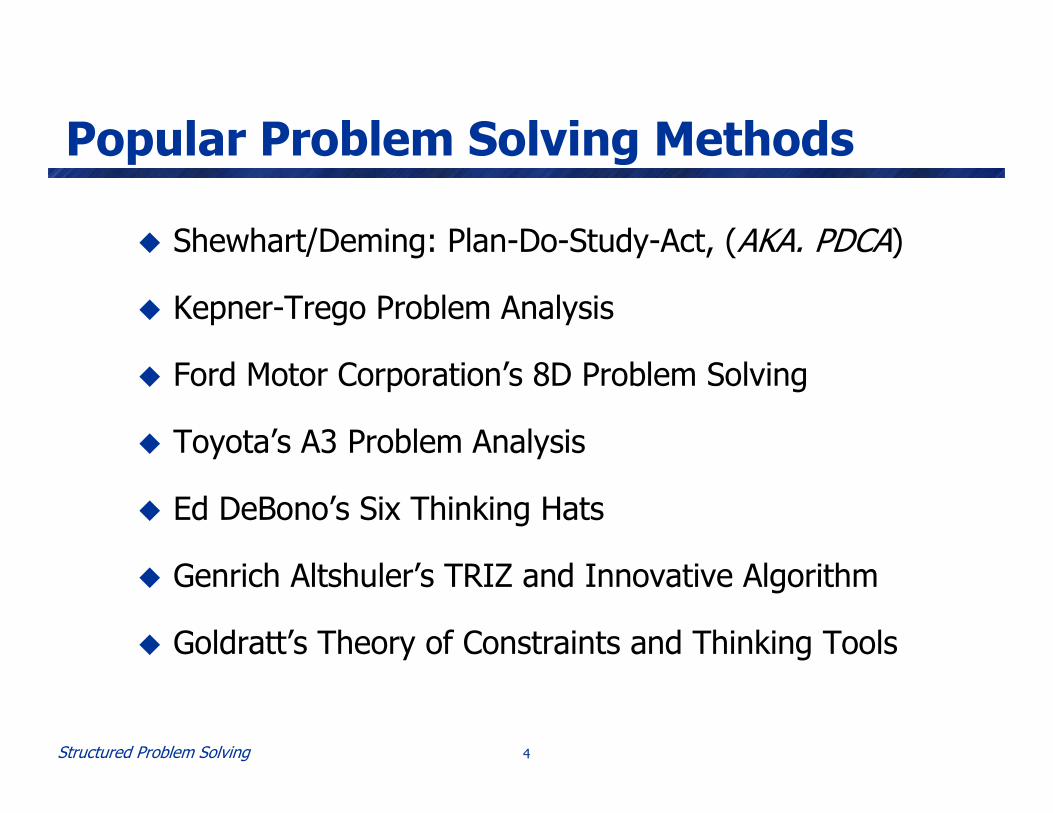
Popular Problem Solving Methods
� Shewhart/Deming: Plan-Do-Study-Act, (AKA. PDCA)
� Kepner-Trego Problem Analysis
� Ford Motor Corporation’s 8D Problem Solving
� Toyota’s A3 Problem Analysis
� Ed DeBono’s Six Thinking Hats
� Genrich Altshuler’s TRIZ and Innovative Algorithm
� Goldratt’s Theory of Constraints and Thinking Tools

Structured Problem Solving 5
� MIL-STD-1520 is the basis of most problem solving systems used in industry.
� In the automotive industry, the 8D system is a composite of MIL-STD 1520 and PDCA.
� In the medical device, pharma, and vaccines industries CAPA (Corrective and Preventive
Action) is based on MIL-STD 1520.
Basis of Many P-S Systems

Structured Problem Solving 6
Causal Analysis Guidance?
P-Sol’vg Derived from MIL-STD 1520

ProblemSolving
ProblemSolving
ControlControlProcess
I
n
p
u
t
s
O
u
t
p
u
t
s
Copyright 2015. All Rights Reserved.
The Basics

Structured Problem Solving 8
Within Industrial Settings:
How do You Define a Problem?
A change in the performance of a process…
Time

Structured Problem Solving 9
Reference:
Classes of Industrial Problems
~50%
� Analytical Problem Solving
� DOE Methodology
� Process Control
� Change in Process Yield
� Change in Production Quality
� Change in Market Needs
Performance Problems
~20%
� Cause & Effect Analysis
� Conflict Resolution Diagrams
� System Dynamics
� Quality vs. Production Cost
� Labor Cost vs. Revenue
� Change in Component Safety or Quality
Conflict or Contradiction Problems
~30%
� Operations Research
� Factory Physics
� Lean Methods
� Lack of/Too Much Inventory
� Lack of Production Throughput
� Lack of raw materials
Sufficiency Problems
Frequency of Occurrence
Typical Tools & Methods
Example(s)Class ofProblem
Focus of work in Quality…

Structured Problem Solving 10
IPO Framework:
Anatomy of a Performance Problem
Problem Process:Problem Process:
Producing undesirable Producing undesirable
results through a results through a
combination of inputscombination of inputs
Material
Inputs Outputs
Equipment
Policies
Procedures
Environment
People
Methods
Problem SymptomsObserved Testing
Problem Symptoms Observed in Product Use
Problem SymptomsObserved in Manufacturing
Process
Language can get in the way of understanding!

Structured Problem Solving 11
Problem Solving Challenge:
Solving Symptoms Instead of Problems
“Symptomatic”Solution
ProblemSymptom
“Fundamental”Solution
DelayDelay
SideSide
EffectsEffects
Balancing
Balancing
Reinforcing
Symptomatic
Intervention
(Quick Fixes)
Systems-Based
Solution
Side effects due to symptomatic
interventions inhibiting fundamental solution
Causal Loop Diagram
Archetype: “Shifting the Burden”
Dr. J. Forrester, MIT, 1960

Structured Problem Solving 12
A Paradigm Change:
All Problems are Systems Based…
Problem Process:Problem Process:
Producing undesirable Producing undesirable
results through a results through a
combination of inputscombination of inputs
Material
KeyInputs
Outputs
Policies
Procedures
Problem SymptomsObserved in Test
Problem Symptoms Observed in Use
Problem SymptomsObserved in Manufacturing
Process
Everything in this box is considered the “Problem”

Structured Problem Solving 13
People are the primary cause!
Problem Solving Challenge:
Focus of Many Problem Investigations
Structured Problem Solving 14
A Common Mistake in Problem Solving
Allocate the blame!

Structured Problem Solving 15
What Sherlock Holmes Says…
� “Always approach a case with an absolutely blank mind—form no theories before one has the data.”
� “In solving a problem, the grand thing is to be able to reason backwards. “
� “It is of the highest importance in the art of detection to be able to recognize out of a number of facts which are incidental and which are vital.”
� “Once you eliminate the impossible, whatever remains, no matter how improbable, must be the truth…”

ProblemSolving
ProblemSolving
ControlControlProcess
I
n
p
u
t
s
O
u
t
p
u
t
s
Copyright 2015. All Rights Reserved.
Problem Solving Roadmap

Structured Problem Solving Process
6. Validate, Implement, and
Standardize Solution:
Implementation Plan
TASK SCHEDULE
4
123
5
2a. Identify Potential Causes:
3. Compare Causes to the Facts
1. Describe the Problem
5. Determine Corrective Actions:4. Collect Additional Data to Identify Root Cause(s):
2b. Collect, Organize, an Analyze Existing Data:
Man
(People)
Mot
her
Nat
ure
Mea
sure
s
EFFECTEFFECT
Materials
Machine
Met
hods
Cause & Effect Diagram (6M)
Distinctions Changes
Color of product
More impurity
Timing of loss
Occurring shift
Problem location
Reagent supplier
1st shift process
1st shift process
1st shift line
Reagent supplier
Distinctions & Changes
Problem Definition
Final yield of processchanged from 96% to83% during the periodfrom March 1999 toApril 1999.
Definition
SamplingPlan
O-C CurvePa
% Defectives
ScatterDiagram
Time Line
p=
0.1
%
Pro
cess
Adju
ste
d
p=
8.6
%
Equip
ment
Change
2/96 7/98 8/98 4/99
Component Swapping Study
UDL
LDL
LDL
UDLError
Proofing
- Elimination
- Facilitation
- Mitigation
- Flagging
E
V
A
L
U
A
T
E
C
O
N
T
R
O
L
Is/Is Not Diagram
WHAT
WHEN
WHERE
EXTENT
ISIS
NOT
Analysis of Means
UDL
LDL
CapabilityStudy
USLLSL
Multi-VariChart
CapabilityStudy
USLLSL
S
O
L
V
E
Box Plots
- ANOVA
- Contingency
Tables
- ComparisonTests
StatisticalComparisons
D
E
S
C
R
IB
E
I
D
E
N
T
I
F
Y
CorrectiveAction Plan
Contradiction Matrix
Cau
se
s f
rom
Ste
p 2
Facts From Step 1
Failure Modes &Effects Analysis
Failure Modes & Effects Analysis
Item Function Failure Mode Causes Effects O S D RPN
Response Surfaces
Va
ria
ble
x2
Variable x1
Change Point Analysis
CUSUM Chart of Defect Rate18
8.5
-1
CU
SU
M
3 6 9 12 15 18 21 24
Row
Process Control Chart
UCL
LCL
Input/OutputDiagram
OutputsInputs
Pro
ce
ss
Process Control Chart
UCL
LCL
Thigh
TLow
Low High
Output Performance
Variable x1
CharacterizationExperiments
Process orUsage Flow
END
START
Y
N
Pareto Analysis
Cu
m P
erc
en
t
Fre
qu
en
cy
0%
100%
Defect Type Checksheet
M T W Th F
XX X X
X XX X
AB
CD

Structured Problem Solving 18
Structured Problem Solving Process
� Implementation Plan/Gantt Chart
� Process Control Charts
� Process Control Plan
Implement controls, verify solution, standardize controls
Control
� Variation Transmission Analysis
� Solution Selection MatrixImplement corrective actionsSolve
� Contradiction Matrix
� Analysis of Means
� Design of Experiments
� Component Swapping Analysis
Evaluate the causes against the facts to eliminate unlikely causes
Evaluate
� Change Point Analysis
� Process Control Charts
� Pareto Analysis
� Check sheets & Concentration Diagrams
Use existing data to characterize the extent and timing of the problem
Identify(P2)
� Cause and Effect Diagram
� Distinction & Changes Matrix
� Current Reality Tree
Identify the potential causes of the problem
Identify(P1)
� IS/IS NOT Matrix
� Timeline of Changes
� Process or Usage FlowDescribe the problemDescribe
Key Activity FocusDetailsStep

Structured Problem Solving 19
P-S Activity Classification
� Implementation Plan/Gantt Chart
� Process Control Charts
� Process Control Plan
Implement controls, verify solution, standardize controls
Control
� Variation Transmission Analysis
� Solution Selection MatrixImplement corrective actionsSolve
� Contradiction Matrix
� Analysis of Means
� Design of Experiments
� Component Swapping Analysis
Evaluate the causes against the facts to eliminate unlikely causes
Evaluate
� Change Point Analysis
� Process Control Charts
� Pareto Analysis
� Check sheets & Concentration Diagrams
Use existing data to characterize the extent and timing of the problem
Identify(P2)
� Cause and Effect Diagram
� Distinction & Changes Matrix
� Current Reality Tree
Identify the potential causes of the problem
Identify(P1)
� IS/IS NOT Matrix
� Timeline of Changes
� Process or Usage FlowDescribe the problemDescribe
Key Activity FocusDetailsStep
CorrectiveAction Steps
Cause Determination
Steps

Structured Problem Solving 20
A Good Problem Solving Process …
Uses facts to narrow the search
Show me the data!
CAUSESCAUSES
CAUSESCAUSES
CAUSESCAUSES

Structured Problem Solving Process
6. Validate, Implement, and
Standardize Solution:
Implementation Plan
TASK SCHEDULE
4
123
5
2a. Identify Potential Causes:
3. Compare Causes to the Facts
1. Describe the Problem
5. Determine Corrective Actions:4. Collect Additional Data to Identify Root Cause(s):
2b. Collect, Organize, an Analyze Existing Data:
Man
(People)
Mot
her
Nat
ure
Mea
sure
s
EFFECTEFFECT
Materials
Machine
Met
hods
Cause & Effect Diagram (6M)
Distinctions Changes
Color of product
More impurity
Timing of loss
Occurring shift
Problem location
Reagent supplier
1st shift process
1st shift process
1st shift line
Reagent supplier
Distinctions & Changes
Problem Definition
Final yield of processchanged from 96% to83% during the periodfrom March 1999 toApril 1999.
Definition
SamplingPlan
O-C CurvePa
% Defectives
ScatterDiagram
Time Line
p=
0.1
%
Pro
cess
Adju
ste
d
p=
8.6
%
Equip
ment
Change
2/96 7/98 8/98 4/99
Component Swapping Study
UDL
LDL
LDL
UDLError
Proofing
- Elimination
- Facilitation
- Mitigation
- Flagging
E
V
A
L
U
A
T
E
C
O
N
T
R
O
L
Is/Is Not Diagram
WHAT
WHEN
WHERE
EXTENT
ISIS
NOT
Analysis of Means
UDL
LDL
CapabilityStudy
USLLSL
Multi-VariChart
CapabilityStudy
USLLSL
S
O
L
V
E
Box Plots
- ANOVA
- Contingency
Tables
- ComparisonTests
StatisticalComparisons
D
E
S
C
R
IB
E
I
D
E
N
T
I
F
Y
CorrectiveAction Plan
Contradiction Matrix
Cau
se
s f
rom
Ste
p 2
Facts From Step 1
Failure Modes &Effects Analysis
Failure Modes & Effects Analysis
Item Function Failure Mode Causes Effects O S D RPN
Response Surfaces
Va
ria
ble
x2
Variable x1
Change Point Analysis
CUSUM Chart of Defect Rate18
8.5
-1
CU
SU
M
3 6 9 12 15 18 21 24
Row
Process Control Chart
UCL
LCL
Input/OutputDiagram
OutputsInputs
Pro
ce
ss
Process Control Chart
UCL
LCL
Thigh
TLow
Low High
Output Performance
Variable x1
CharacterizationExperiments
Process orUsage Flow
END
START
Y
N
Pareto Analysis
Cu
m P
erc
en
t
Fre
qu
en
cy
0%
100%
Defect Type Checksheet
M T W Th F
XX X X
X XX X
AB
CD

Structured Problem Solving 22
The Contradiction Matrix, (or C-Matrix):
Core Tool in Problem Solving
Cause #5
Cause #4
Cause #3
Cause #2
Cause #1
Causes
Facts
Fact
#1
Fact
#2
Fact
#3
Fact
#4
Fact
#5
Fact
#6
Fact
#7
X - FACT contradicts CAUSE A - Assumptions made; need data to verify
O - FACT supports CAUSE BLANK- Need more data

Structured Problem Solving 23
Reference:
Classifying Contradictions
� Is there a location fact that contradicts the suggested cause, e.g., two locations should be affected equally, but are not?
� Is there a timing fact that contradicts the suggested cause, e.g., the symptoms occurred long before you observed the proposed cause?
� Is there a scientific fact that contradicts the suggested cause, e.g., you would have to violate known physical or chemical principles for the cause to occur?
AnalyzeAnalyzeAnalyze

Structured Problem Solving 24
Illustration:
Using the Contradiction Matrix
XOOCause #5
OOAOOACause #4
XAOOOCause #3
XCause #2
OOOAOOCause #1
Causes
Facts
Fact
#1
Fact
#2
Fact
#3
Fact
#4
Fact
#5
Fact
#6
Fact
#7
X - FACT contradicts CAUSE A - Assumptions made; need data to verify
O - FACT supports CAUSE BLANK- Need more data

Structured Problem Solving 25
C-Matrix Example:
Reducing Causal Complexity

Structured Problem Solving 26
Roadmap for Problem Resolution
� Describe the problem dimension with IS/IS Not Matrix.
� Develop an extensive list of potential causes.
� Organize and analyze the existing data.
� Use the Contradiction Matrix to rule out unlikely causes.
� Identify unknowns and assumptions – follow-up.
� Construct an interim action plan based on unknowns and assumptions from the C-Matrix.
� Determine the causal mechanism for the problem.
� Prepare an action plan to eliminate the problem.

ProblemSolving
ProblemSolving
ControlControlProcess
I
n
p
u
t
s
O
u
t
p
u
t
s
Copyright 2015. All Rights Reserved.
Case StudyCase Study
� Description of the Process
� Problem Definition
� Root Cause Identification
� Solution Development
� Corrective Action Implementation
“Causes and effects are often not
closely related in time and space.”

Structured Problem Solving 28
The Manufacturing Process:
Human Blood Plasma Fractionation
SeparationProcess
Blood Plasma
Sealer Proteins
Coagulation Proteins
Inhibitors, etc
Immunoglobulins
Albumin
Illustration of the Plasma Fractionation Process
Problem Area
No red blood cells

Structured Problem Solving 29
The Observed Problem
Albumin
QC TestSample
Heat Stability Testing @ QC
57deg-C / 50hrs
Particulates in Solution
After QC Testing
Reqm’t: No Observable Particulates are Allowed in Solution

Structured Problem Solving 30
Describe the Problem

Structured Problem Solving 31
Problem Statement
In the last month, 3 consecutive batches of
Human Albumin show excessive levels of an
unknown precipitate after heat stability testing
in QC causing them to be placed into a
quarantined state. Loss of all three batches is
expected based on past experience.

Structured Problem Solving 32
Business Case
The total production cost of these 3
batches is $185,000, and the expected
sales value is $350,000. This problem has
occurred three times in the past without
adequate solution rendering a total
business loss to date of $1.4M
Structured Problem Solving 33
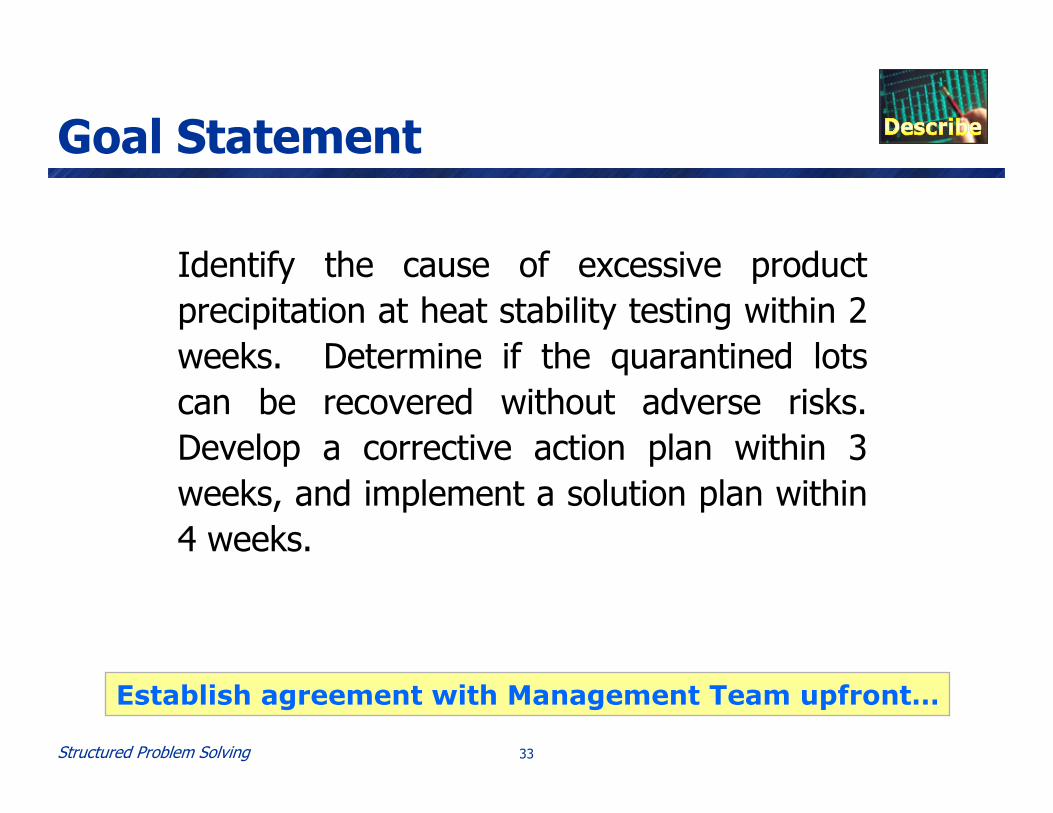
Goal Statement
Identify the cause of excessive product
precipitation at heat stability testing within 2
weeks. Determine if the quarantined lots
can be recovered without adverse risks.
Develop a corrective action plan within 3
weeks, and implement a solution plan within
4 weeks.
Establish agreement with Management Team upfront…

Structured Problem Solving 34
Is vs. Is Not Matrix: (a required tool)
Specifying the Problem Dimensions
HOW MANY OBJECTS COULD HAVE THE
DEFECT, BUT DO NOT?
WHAT OTHER SIZE COULD IT BE, BUT IS NOT?
HOW MANY OBJECTS HAVE THE
DEFECT?
WHAT IS THE SIZE OF THE DEFECT?EXTENT
WHEN ELSE COULD THE DEFECTIVE OBJECT
BEEN OBSERVED, BUT WAS NOT?
WHAT OTHER TIMES COULD IT HAVE BEEN OBSERVED, BUT WAS NOT?
WHEN ELSE COULD IT HAVE BEEN SEEN IN ITS LIFECYCLE, BUT WAS NOT?
WHEN WAS THE DEFECTIVE OBJECT
FIRST OBSERVED?
WHEN SINCE THAT TIME HAS IT BEEN OBSERVED? TIME PATTERN?
WHEN IN THE OBJECTS LIFE CYCLE WAS IT FIRST OBSERVED?
WHEN
WHERE ELSE COULD IT BE OBSERVED, BUT IS NOT?
WHERE ELSE COULD IT BE SEEN ON THE
OBJECT, BUT IS NOT?
WHERE IS THE DEFECTIVE OBJECT OR ISSUE FOUND?
WHERE IS THE DEFECT LOCATED ON
THE OBJECT?
WHERE
WHAT SIMILAR OBJECT COULD HAVE THE
DEFECT, BUT DOES NOT?
WHAT OTHER DEFECTS COULD BE OBSERVED, BUT ARE NOT?
WHAT SPECIFIC ITEM OR OBJECT HAS
THE PROBLEM?
WHAT IS THE SPECFIC DEFECT? WHAT
IS NOTIS
Structured Problem Solving 35
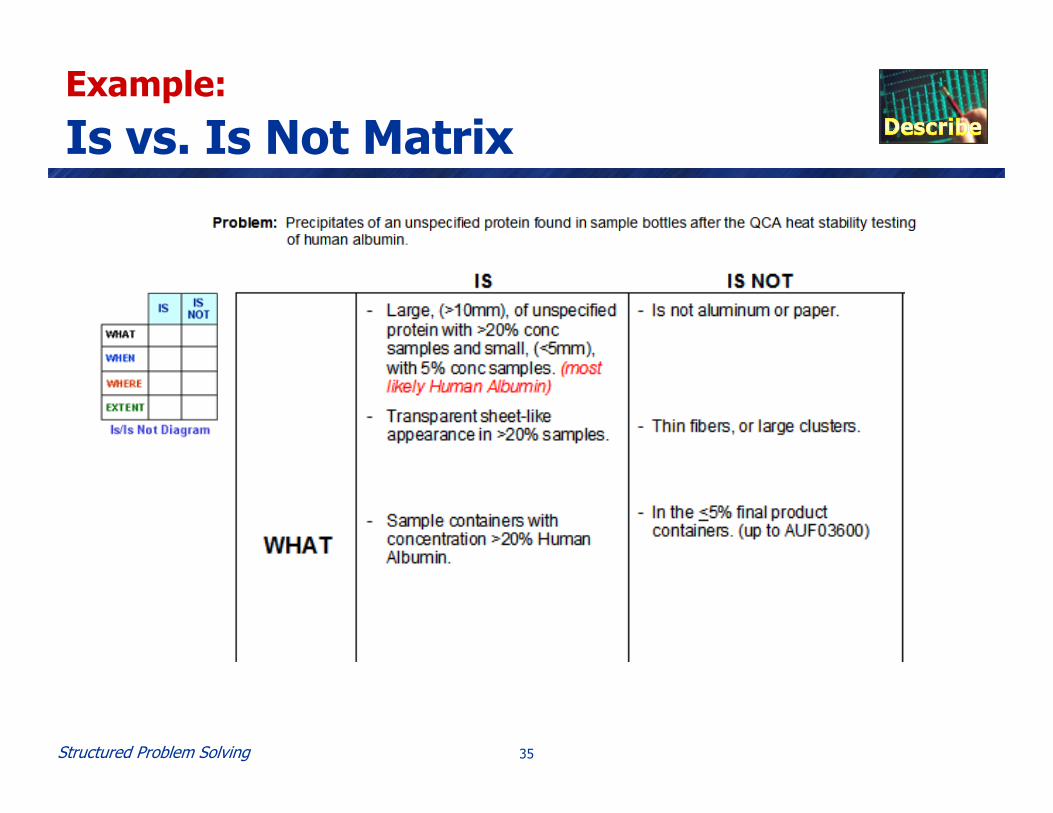
Example:
Is vs. Is Not Matrix

Structured Problem Solving 36
Step 2a. Indentify:
Identify Potential Causes

Structured Problem Solving 37
Example:
The Possible Causes
Man (Personnel)
MaterialsMachines
Environment
Methods
Measurements
pH Measuring
Equipment
Sample Transfer Tubing
Stir
rer
Stoppers
Silicone
Emulsi
on
Quality of
Albumin Bulk
Change in
transp
ort pers
onnel
Change in personnel in
production area
Bulk storage
Sample collection
Tra
nsp
ort
Fill volume
of samples
Dilu
tion
Sample preparation Dilutio
n
FiltrationPro
tein
conc
ent
ratio
n
Sam
ple
stab
iliza
tion
pH
adju
stm
ent
Transport
Zeichnung4/17.05.00/C. Gelich
Weather conditionsStorage of
intermediates
Quality of stabilizersPrecipitates ofAlbumin in the
QC SampleContainers
Wat
er b
ath
Glass bottle washing machine
inner wall
coating
Supplier
Glass bottles
Stability
Change in la
boratory
personnel
Quality o
f bottle
rinsin
g wate
r
People
Temperature
water bath
Test area
Box
Cooling blocks
Sample storage
Bottle
pre
-treatm
ent
fixed pH in Fr. IV-1,4Testprocedure

Structured Problem Solving 38
Example:
Distinction and Changes
A siliconized container has a thin film of silicone deposited on the
inner walls of the glass bottle to keep the contents from contacting the glass walls. Why is this needed? And, why are some sample bottles siliconized while others are not?

Structured Problem Solving 39
Step 2b. Indentify:
Analyze Existing Data

Structured Problem Solving 40
Plot of Number OoS Test Samples7
3.5
0
Nu
m O
oS
Jan 1998 Jun 1998 Nov 1998 Apr 1999 Sep 1999 Feb 2000 Jul 2000 Dec 2000 May 2001
Period
Analyze Existing Data:
Limited Understanding from Data
• This industry focuses on measuring what is “Out of Spec.”
• Which may or may not be of interest to us in identifying Cause(s).
UCL
USL

Structured Problem Solving 41
Illustration:
Optical Density Measurement
� A sample free of coagulated particulates has a transmitted light ~100%.
� With coagulated particulates, scattering reduces transmitted light to <100%.
� OD test method is highly variable, but can be use as a rough guide.
Detector
Source
SourceLight
TransmittedLight
Sample

Structured Problem Solving 42
Plot of %Optical Density100
95
90
85
80
%O
D
Jan 1998 Jun 1998 Jan 1999 Jun 1999 Dec 1999 Jun 2000 Nov 2000 May 2001
Date Period
• Evaluated base %Optical Density measures for clues.
• Plotted data on an Individuals SPC chart—a pattern emerged!
Analyze Existing Data:
Working with Base Measures
UCL
%Relative OD
LCL

Structured Problem Solving 43
• Using a method called Change Point Analysis we were able to
determine the confidence bounds for the timing changes…
Analyze Existing Data:
Evaluating Base Measures
Plot of %Optical Density100
95
90
85
80
%O
D
Jan 1998 Jun 1998 Jan 1999 Jun 1999 Dec 1999 Jun 2000 Nov 2000 May 2001
Date Period
USL%Relative OD
UCL
LCL

Structured Problem Solving 44
What did Sherlock Say?
� “Always approach a case with an absolutely blank mind—form no theories before one has data.”
� “In solving a problem of this sort, the grand thing is to be able to reason backwards. “
� “It is of the highest importance in the art of detection to be able to recognize out of a number of facts which are incidental and which are vital.”
� “Once you eliminate the impossible, whatever remains, no matter how improbable, must be the truth.”

Structured Problem Solving 45
Analyze Existing Data:
The Pattern of Changes
Very Strong
Strong
Strong
Strong
Somewhat Strong
Somewhat Weak
Somewhat Weak
Weak

Structured Problem Solving 46
Step 3. Evaluate the Data:
Comparing Causes to the Facts

Structured Problem Solving 47
C-Matrix Example:
Narrowing the Causal Possibilities

Structured Problem Solving 48
Step 3. Evaluate the Data:
Limiting the Possibilities
X
X
X
X
X
F A C T S
Sam
ple
s t
ran
sp
ort
ed
at
7am
daily
Sample preparationSample preparationSample preparationSample preparation
Quality of bottle from supplierQuality of bottle from supplierQuality of bottle from supplierQuality of bottle from supplier
Albumin stabilizersAlbumin stabilizersAlbumin stabilizersAlbumin stabilizers
Quality of bulk materialQuality of bulk materialQuality of bulk materialQuality of bulk material
Bottle pretreatment processBottle pretreatment processBottle pretreatment processBottle pretreatment process
Sample transport to QC LabSample transport to QC LabSample transport to QC LabSample transport to QC Lab
QC test procedureQC test procedureQC test procedureQC test procedure
Pre
cip
itate
s in
sam
ple
co
nta
iners
Co
ncen
trati
on
>20
%
Alb
um
in
Co
mp
lyin
g c
on
secu
tiv
e b
atc
hes
Larg
e p
recip
itate
s n
ot
in p
rod
uct
Old
sam
ple
bo
ttle
s w
ere
cle
ar
Sam
ple
& p
rod
uct
bo
ttle
s s
am
e
Sm
all p
recip
itate
s in
lo
t 3000
No
n-c
om
ply
ing
sam
ple
s in
QC
lab
Re-t
esti
ng
in
PIA
Lab
was g
oo
d
Pre
cip
itati
on
on
2n
d h
eat
treat
C A
U S
E S
X - FACT contradicts CAUSE
O - FACT supports CAUSE
Blank - Need more data
NR - Fact NOT Connected to Cause
A - Assumptions made, need data
O
O O O
O O O A O
O O
O O O O O O O O O A
O O O O O O O O O
O O O
O O
O O O O O
Fa
cts
fro
m I
s/Is
No
t M
atr
ix
Causes from Step 2
O
O
O

Structured Problem Solving 49
Step 3. Evaluate the Data:
Initial Conclusions
� The Contradiction Matrix identified two areas that could effect particle generation at heat QC stability testing:
• Bottle Pre-treatment process
• Quality of the Bottle from Supplier
� Six other areas, which contained 50-60 possibilities, were excluded as possible causes of the observed problem.

Structured Problem Solving 50
Step 4. Evaluate the Data:
Collect Additional Data

Structured Problem Solving 51
Step 4. Collect New Data:
Verifying the Potential Causes
What factors within the bottle pre-treatment process could contribute to the problem?
Particle CountAlbumin Concentration
Bottle Cleaning Quality
Silicone Application
Sterilization Temperature
Particle Size
Bottle InnerSurface Color
INPUT OUTPUT
Bottle
Pre-Treatment
?
?
?
?
Experiment #1
Cleaning Process
Albumin in Solution (Y/N)
Pasteurization
Particle Size
Bottle InnerSurface Color
INPUT OUTPUT
Bottle
Pre-Treatment
?
?
?
Particle Count
Experiment #2

Structured Problem Solving 52
Evaluate New Data:
Achieving Understanding
HC=23 deg-C/10hrs
HC=60 deg-C/10hrs
PS - Avg1.67
1.335
1
PS
0 percent 20 percent
AS
PS - CV0.691
0.350
0.01
PS
0 percent 20 percentAS
Effects Plots for Particle Count
Term Log[Average]
0.22204 **-0.045081
0.1995
0.24458 *0.1995
-0.24458 *
CV
0.26245 ***0.047859
0.27638 ***
0.22852 **0.27638 ***-0.22852 **
* = Significant (* = 0.1, ** = 0.05, *** = 0.01)
Average, AS^2, HC^2, AS*HCCPAS
HCCP*AS, AS*HCCP*HC, AS*HC
Effects Table for Particle Count, Categorical (ea)

Structured Problem Solving 53
Observations and Results
� Initial experiments identified the likely inputs affecting particle generation during heat stability testing to be:
• Protein Concentration (trivial factor)
• Bottle Siliconization Process (a key factor)
• Foam and Bubbles in Test Sample (observation)
• Environmental controls in filling and test areas (a key factor)

Structured Problem Solving 54
Albumin
Causal Mechanism:
Evaluating Container Passivation
SiliconizedLayer
ContainerWall
NucleationSite
AgglomeratedAlbumin
Open areas in silicone passivation can cause Albumin to nucleate
Entire process was pushed forward by changes in area temp and humidity…

Structured Problem Solving 55
Determine Corrective Actions

Structured Problem Solving 56
Step 5. Corrective Actions:
Required Action Items
� Observed the bottle siliconization process.
� Reviewed the process validation.
� Significant areas in the process validation were incomplete.
� Increased coating thickness, key cause.
� Reworked siliconization process validation.
� Improved process consistency.

Structured Problem Solving 57
Establish New Controls ControlControlProcess
I
n
p
u
t
s
O
u
t
p
u
t
s

Structured Problem Solving 58
Step 6. Control:
Establish Process Controls
� Developed a test for passivating coating viscosity.
� Included viscosity test into process control and monitoring schema.
� Established requirements for viscosity, bake temperature, and time.
� Encoded requirements into automated equipment operation.
� Particle generation at heat stability testing no longer exists.
ControlControlProcess
I
n
p
u
t
s
O
u
t
p
u
t
s

Structured Problem Solving 59
What was the Process?
Roadmap for Problem Resolution
� Describe the problem dimension with IS/IS Not Matrix.
� Develop an extensive list of potential causes.
� Organize and analyze the existing data.
� Use the Contradiction Matrix to rule out unlikely causes.
� Identify unknowns and assumptions – follow-up.
� Construct an interim action plan based on unknowns and assumptions from the C-Matrix.
� Determine causal mechanism for the problem.
� Prepare an action plan to eliminate the problem.

Structured Problem Solving 60
Some Closing Comments:
Learning from Structured Methods
� Focuses on Facts and data instead of
Perceptions.
� Managed by eliminating the unlikely causes
first—what remains is likely…
� Allows everyone to participate.
� Uses time and limited resources efficiently.
� Method is a Natural Team Building Activity.

Visit our site at: www.ascendantconsulting.net
To Obtain a Presentation Copy…
Select the Articles link in upper
right corner

ProblemSolving
ProblemSolving
ControlControlProcess
I
n
p
u
t
s
O
u
t
p
u
t
s
Copyright 2015. All Rights Reserved.
Thank You!