structured problem solving - training package
TRANSCRIPT

R E S P O N S I V E N E S S A N D C O M P E T E N C E I N
H A N D L I N G C U S T O M E R C O M P L A I N T S O R
I N Q U I R I E S
June 2016Craig A Zedwick
Structured Problem Solving
2
Craig A Zedwick June 2016
• Structured
o Methodical
o Consistent
o Competent
• Problem Solving
o Specifically with respect to customer problems
o Often technical problems, but can be expanded to logistics, service, etc.
• Final Product
o A concise response to a customer concern
o Quick & consistent way to respond to a customer’s problem
What is Structured Problem Solving?

3
Craig A Zedwick June 2016
• Problems create stress, especially if they stem from an important customer
• We often dive into the solution phase without truly understanding the problem’s root cause
• Pressure to respond quickly with a solution can lead to bad decisions that make our business environment more difficult in the future
• Rushing to conclusion causes us to miss key information and insights
• The final result is often specifically tailored to that problem without addressing broader issues that caused the problem in the first place
• This training package proposes a methodology to avoid the traps listed above
Why Structured Problem Solving?
?

4
Craig A Zedwick June 2016
High-Level Action Flow
3. Confirm that the problem is under our
control and that we have power to fix the issue
4. Clearly define success criteria with customer and how we will prove success
The ULTIMATE Goal is to show our customer that we are a responsive & competent partner,
and that we are committed to finding the solution(s) if the root cause is related to our
product or service
1. Define the problem or issue (project scope)
2. Get customer agreement on the problem statement and plan to address issue
5. Build initial data package to show urgency and indicate the
direction of our first-phase investigation
Problems can arise with internal customers or external customers.
When we reference customer complaints, both types of complaints should be kept in
mind

5
Craig A Zedwick June 2016
• What the initial response package should not do:
What We Do When Customers Complain?
• Don’t leave the customer to make their own conclusions:
o The spokesman to the internal or external customer needs to manage their expectations and get alignment on how the investigation will progress
o Every slide/piece of information should be clear & communicate one message
o Customers are often not experts in our product/service, so are not qualified to properly interpret our data
• Don’t show data over which we have no control:
o If we determine that such data is the true root cause, then we will need to decide how to communicate this to the customer
o Be prepared to answer the next round of likely questions
o Publishing data too early often results in customer demands for strict limits around parameters over which we have limited or no control
• Don’t identify a root cause: It’s too early to do anything but show initial suspicions and our investigative direction
• Don’t publish all data available: It is our job to investigate, not to show the customer everything and then wait for them to give us actions

6
Craig A Zedwick June 2016
The majority of problem investigations struggle to either,
(a) reach a satisfactory conclusion (meet Customer expectations), or
(b) reach agreement with the customer to close the complaint
This is often due to the lack of a clear, well-defined problem statement that is agreed upon with the customer
This will help define the objectives and know when they have been achieved - it is OK to close the complaint
Step 1: Define the Problem Statement
Take the time required, from the outset, to suitably define and align on the Problem Statement

7
Craig A Zedwick June 2016
Dig Deeper:
The complaint receiver should do more than simply pass along the complaint as given
Get Customer Buy-In:
Know how we can succeed
Step 1: Define the Problem Statement

8
Craig A Zedwick June 2016
Dig Deeper: The complaint receiver should
do more than simply pass along the complaint as given
Get Customer Buy-In:
Know how we can succeed
Step 1: Define the Problem Statement, continued
Get as much information & data as the customer is willing to share
Examples of important information:– Failure mode (e.g. change in color, late delivery,
product performance, etc.)
– Description of the actions that the customer has taken to demonstrate that our product is related to defect mode
– Description of what containment the customer put in place and how we can demonstrate recovery
– Defect onset information – specific date or product lot is best, but could be group of lots trending toward failure
– Lot usage history – Customer may use our product in a different order than we produced it
– Correlation data – for us to find root cause, we need customer data, whether discrete (good vs. bad) or continuous (preferred)

9
Craig A Zedwick June 2016
Customer should sign off on problem statement (as accurate & complete)
– If they don’t agree, then what should be changed?
– Even if they are not sensitive about sharing proprietary information, getting the customer to indicate the ways in which our problem statement is incorrect is still helpful
Customer should define success criteria– How do we succeed in closing this complaint?
– How can we prove our case if we truly believe that our product or service is not the root cause of the problem?
– If we do believe that there is something about our product/service that links to the customer’s issue, then how do we prove or disprove the hypothesis?
• Correlation data only?
• Customer validation?
• Other?
Step 1: Define the Problem Statement, continued
Dig Deeper: The complaint receiver should
do more than simply pass along the complaint as given
Get Customer Buy-In: Know how we can succeed
10
Craig A Zedwick June 2016
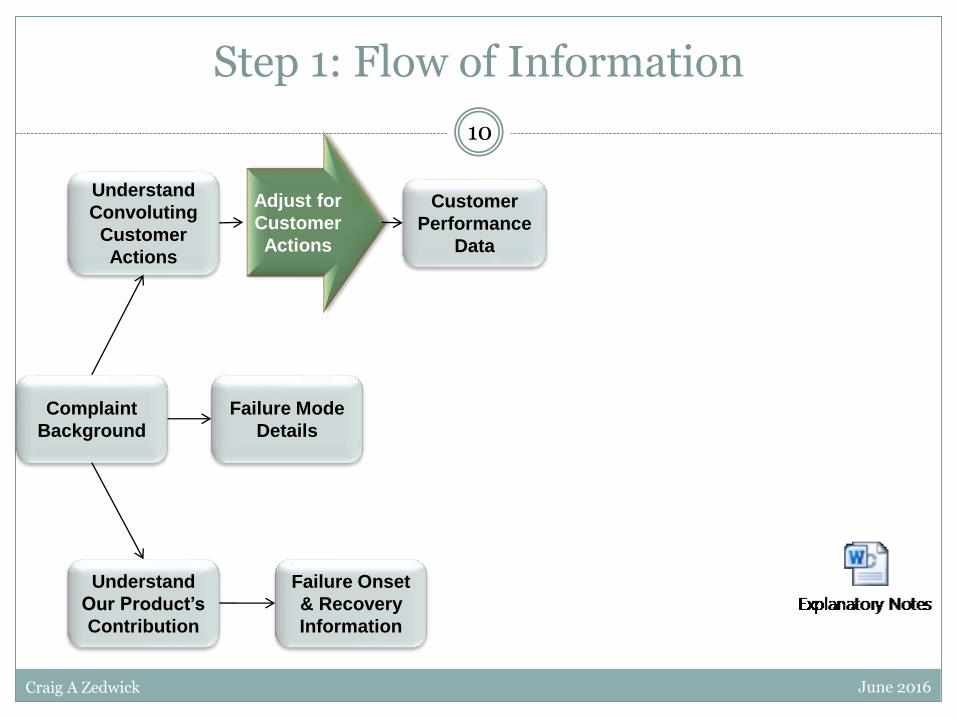
Step 1: Flow of Information
Failure Mode
Details
Complaint
Background
Understand
Our Product’s
Contribution
Understand
Convoluting
Customer
Actions
Failure Onset
& Recovery
Information
Customer
Performance
Data
Adjust for
Customer
Actions
11
Craig A Zedwick June 2016
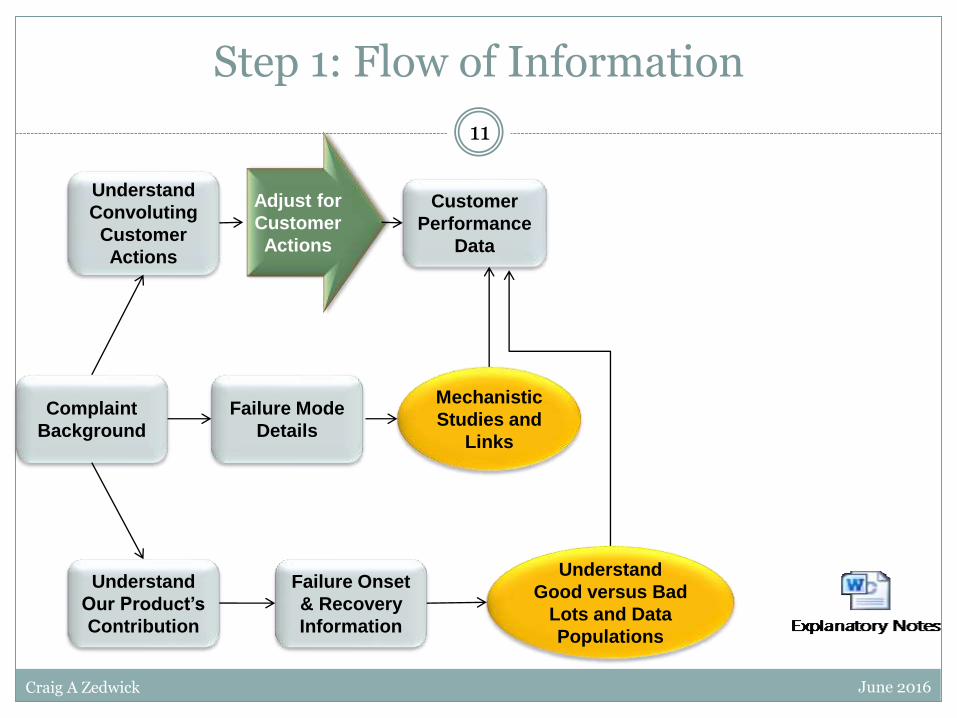
Step 1: Flow of Information
Failure Mode
Details
Complaint
Background
Understand
Our Product’s
Contribution
Understand
Convoluting
Customer
Actions
Failure Onset
& Recovery
Information
Customer
Performance
Data
Adjust for
Customer
Actions
Mechanistic
Studies and
Links
Understand
Good versus Bad
Lots and Data
Populations

12
Craig A Zedwick June 2016
Step 1: Flow of Information
Failure Mode
Details
Complaint
Background
Understand
Our Product’s
Contribution
Understand
Convoluting
Customer
Actions
Failure Onset
& Recovery
Information
Customer
Performance
Data
Adjust for
Customer
Actions
Mechanistic
Studies and
Links
Understand
Good versus Bad
Lots and Data
Populations
Discrete
Customer Data:
Means Comp.
(t-test or ANOVA)
Continuous
Customer Data:
Correlations
and Transfer
Functions

13
Craig A Zedwick June 2016
Step 1: Flow of Information
Failure Mode
Details
Complaint
Background
Understand
Our Product’s
Contribution
Understand
Convoluting
Customer
Actions
Failure Onset
& Recovery
Information
Customer
Performance
Data
Adjust for
Customer
Actions
Mechanistic
Studies and
Links
Understand
Good versus Bad
Lots and Data
Populations
Discrete
Customer Data:
Means Comp.
(t-test or ANOVA)
Continuous
Customer Data:
Correlations
and Transfer
Functions
Root
Cause
= Event
Root
Cause =
Variable
14
Craig A Zedwick June 2016
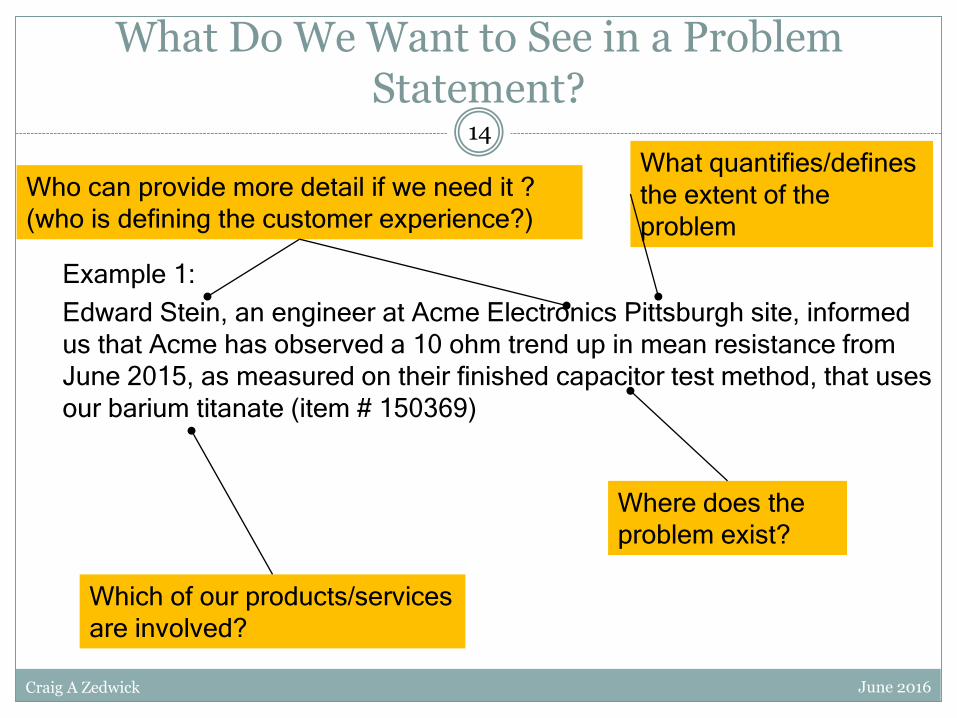
Example 1:
Edward Stein, an engineer at Acme Electronics Pittsburgh site, informed
us that Acme has observed a 10 ohm trend up in mean resistance from
June 2015, as measured on their finished capacitor test method, that uses
our barium titanate (item # 150369)
What Do We Want to See in a Problem Statement?
Where does the
problem exist?
Which of our products/services
are involved?
Who can provide more detail if we need it ?
(who is defining the customer experience?)
What quantifies/defines
the extent of the
problem
15
Craig A Zedwick June 2016
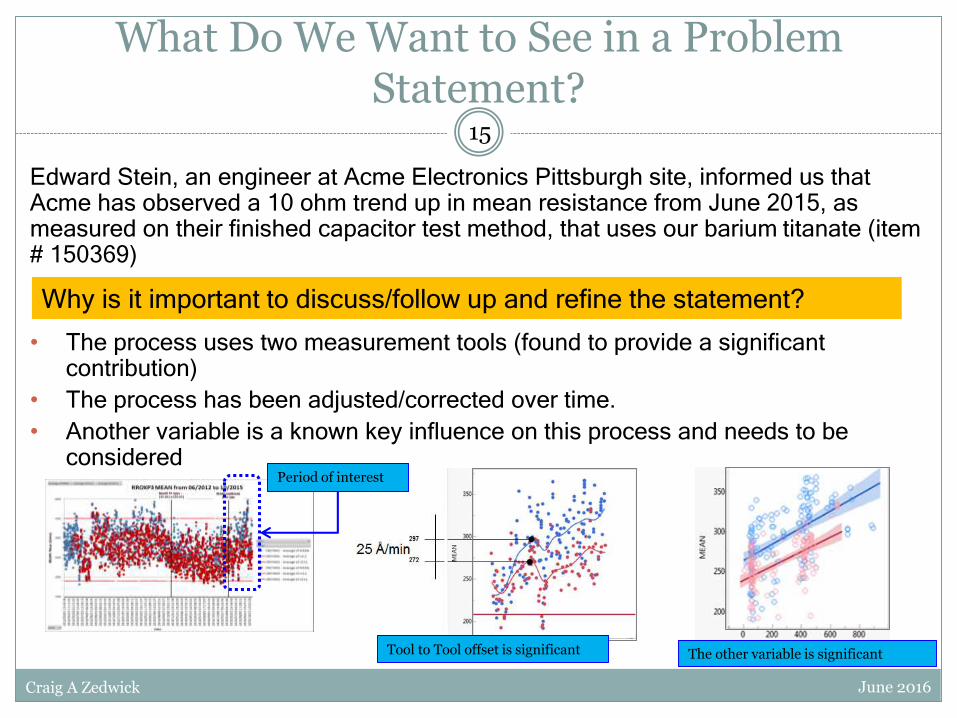
Edward Stein, an engineer at Acme Electronics Pittsburgh site, informed us that Acme has observed a 10 ohm trend up in mean resistance from June 2015, as measured on their finished capacitor test method, that uses our barium titanate (item # 150369)
• The process uses two measurement tools (found to provide a significant contribution)
• The process has been adjusted/corrected over time.
• Another variable is a known key influence on this process and needs to be considered
Why is it important to discuss/follow up and refine the statement?
Period of interest
Tool to Tool offset is significant The other variable is significant
What Do We Want to See in a Problem Statement?

16
Craig A Zedwick June 2016
• Elevated defects in a polishing application
o Average defects given by customer first (left chart), but data didn’t show a clear problem (points above line are bad and below red line are good)
o By aligning with the customer, we realized that the average number of defects was not the true concern
o The real problem was the higher frequency of defects per batch of polish (right chart)
o Now had a clear time window to investigate
o Timing clearly pointed to a supplier equipment failure as root cause
Step 2: Align with Customer

17
Craig A Zedwick June 2016
• Divides relevant information from distractions and false signals
• Prevents mixing one problem with another and getting confused
• Clarifies the investigation path
Importance of the Problem Statement

18
Craig A Zedwick June 2016
Step 3: Is It Our Problem?
• Every customer problem is our problem
o But not every customer problem is due to our product or service
o Understanding the difference is critical to delighting our customers
• The problem statement should be our first clue about whether the issue is linked to our product
o Timing and failure mode need to line up with something in our system, or this isn’t related to our product
o Example: We supply sandpaper rolls to a commercial wood shop
A failure involving smoothness of wood after sanding is likely related to our product.
A failure mode involving uneven staining after sanding could be our problem or it could be related to the stain supplier, or some combination.
But a failure related to wood splitting when drilled would have nothing to do with us.
• We want to help our customers identify the root cause and solve it
o This may mean proving that our product is not the root cause so they can investigate elsewhere

19
Craig A Zedwick June 2016
Step 4: What is Success?
• Just as we aligned with the customer on the problem statement, it is equally critical to align with the customer on the success criteria
• Some customers are happy if everything returns to normal and they don’t need to understand why
• Other customers can have their performance returned to normal, but insist on understanding the root cause to avoid a recurrence
• The type of work done in the investigation depends on what the customer needs to be happy with our response and our product/service
• If a root cause must be shown, then what level of proof does the customer require to show that we have found the true root cause?o Some customers are satisfied with historical data analysis showing a correlation
o Demanding customers may expect us to perform experiments to validate that the root cause we have identified can be controlled and used to turn the failure mode on and off
20
Craig A Zedwick June 2016
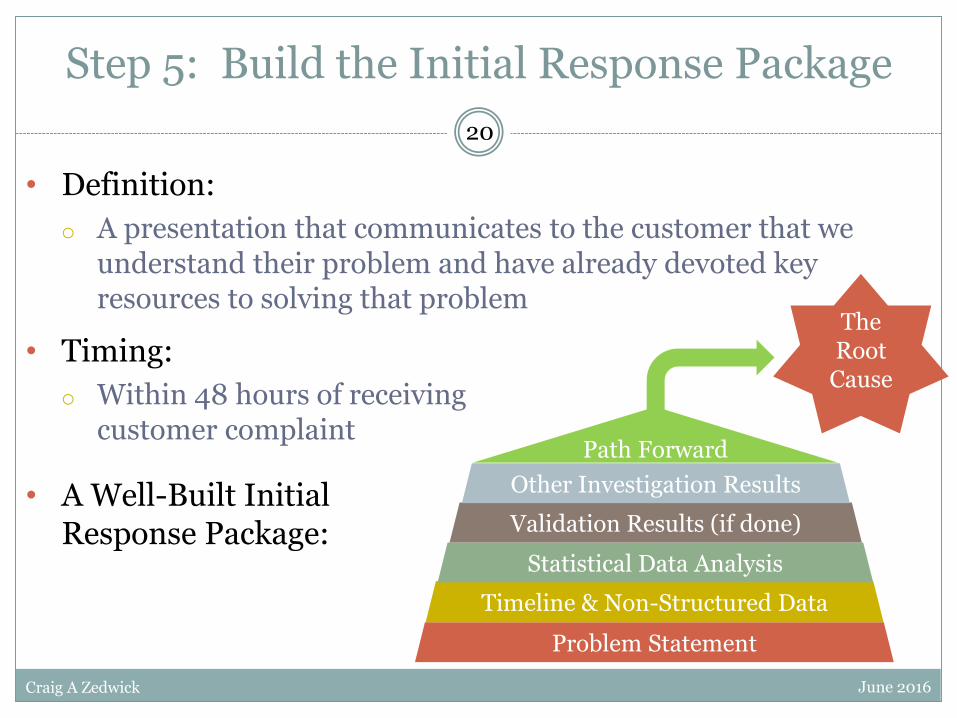
• Definition:
o A presentation that communicates to the customer that we understand their problem and have already devoted key resources to solving that problem
Step 5: Build the Initial Response Package
Problem Statement
Timeline & Non-Structured Data
Statistical Data Analysis
Validation Results (if done)
Other Investigation Results
Path Forward
• Timing:
o Within 48 hours of receiving customer complaint
• A Well-Built Initial Response Package:
The Root
Cause

21
Craig A Zedwick June 2016
• A Master Data Spreadsheet is the starting point for the entire investigationo Should include all information and data related to the customer complainto If the customer buys some type of material or tangible product, then the
spreadsheet will list data according to batch number, lot number, or some other key identifier
o If the customer buys a service (or is an internal customer of some sort), then the table will list data according to date, project name, invoice/incident number, etc.
• Include both data and informationo Data – all numerical parameterso Information – various forms, such as text comments, color, technician
name, etc.
• Be exhaustiveo At this point, we may have ideas, but don’t know for sure what the problem
is or what is causing ito Listing every available piece of data and information ensures that we don’t
miss anything
Step 5A: Build Master Data Spreadsheet

22
Craig A Zedwick June 2016
• Trend charts are simply chronological charts of a given variableo If the master data sheet is created in Excel, then:
Each row is defined in Column A by a lot number, technician, invoice number, etc., as described in previous slide
Each column represents a different parameter Highlight Column A as the x-axis label and highlight the column of data to plot in a chart
o Only works with data, not other information types like text
• One method to understand the trend chart is to create “control limits”o There is an entire discipline called Statistical Process Control (SPC) that merits its own
training package (under development) Good overview can be found at: http://www.statit.com/services/SPCOverview_mfg.pdf
o Control limits are +/- 3 standard deviations around the mean value and can be calculated in Excel Mean formula: “=average(B1:B100)” will return the average or mean of the values found in cells B1 to
B100 Standard Deviation: “=stdev(B1:B100)” will return the standard deviation of the values found in cells B1
to B100 Upper Control Limit is the mean value + 3 times the standard deviation Lower Control Limit is the mean value - 3 times the standard deviation Excel allows you to fill formulas from one set of cells to a range of cells, so you can create these
calculations at the bottom of your first column of data and then fill to the right in order to copy these formulas to every column
o Place lines on each trend chart to represent the Upper & Lower Control Limitso Any data point outside of these limits is considered abnormal and should be investigated
Step 5B: Build Trend Charts

23
Craig A Zedwick June 2016
• Trends are reviewed by the leader of the complaint resolution team
• Should schedule a meeting with the team to decide immediate actions to build the initial customer response presentation
• Pointers for the team leader:o Review data and trend charts before this first meeting
Be ready to discuss every trend that has a point of interest
Summarize your findings to make the review efficient
o Key questions while doing data review: Are the control limits set properly?
Improper limits might arise if the data set chosen as baseline performance is too small or does not include all sources of normal variation
Is the data from the problem time period in control and within historical range? Statistical limits are one indicator, but if the customer has never seen a material with a certain parameter as high as
the recent problem batch, that could also be worth investigating
Are there unexplained data shifts? Mean shifts or variation shifts?
Do they correspond to the customer performance issue?
o Trend charts cannot show correlations to customer data or performance. They only show whether the parameter is in statistical control Trends are time-based and may give insight, but should not be used to show customers since there are
better tools for communication of data
Step 5C: Review Trend Charts

24
Craig A Zedwick June 2016
• Why trend charts should not be included in the initial packageo Trend charts only show whether a parameter is showing random variation
or special-cause variation Trend charts should be used to identify parameters to be investigated
furthero Other charts are better able to represent our data and our conclusionso The customer will jump to their own conclusions and then may not listen
to our informed explanation Especially if good vs. bad points are highlighted
Trend Charts & Customer Communication
Wait!
I see a
trend!!!

25
Craig A Zedwick June 2016
• This chart shows particle size on left axis and batch temperature on right axiso Interpreted as showing a correlation between blend tank temperature and final product particle size
o Coincidental pattern similarities can trick our minds into assuming a correlation
Correlation is a statistical term with a specific definition and requires a body of comparable data to calculate
Correlations are sometimes very obvious even on trend charts
More often, trend chart patterns that mimic correlation are only present for a small subset of the entire data set
Trend Chart Example
Aha! Correlation!
Hmm – Maybe Not…

26
Craig A Zedwick June 2016
• Building a time-line to show when a problem first appears and when/if it is resolved is a critical part of the problem statement and investigation
• Trend charts show how numerical (or structured) data fits with the time-line and whether any abnormal data exists
• Non-structured data is information that is non-numericalo Example: Contaminated lettuce in grocery stores
Structured data might include parameters like storage temperature, days since harvested, etc. Un-structured data would be things like which farm grew the lettuce, which store sold it, and so
on
• Build inputs table o This shows the various inputs into the product or service for each line item in the master
spreadsheeto Switching from one batch of incoming material in your process to a new batch might coincide
with the problem start and give valuable insighto Showing all inputs like people involved (manufacturing operators, technical service, etc.) can
also point out a systematic, but non-numerical pattern
• Remember: Just because something coincides with the problem onset does not automatically make it the root cause of your problem
Step 5D: Timelines & Non-Structured Data
Coincidence Root Cause

27
Craig A Zedwick June 2016
• Identify abnormal points or trends in numerical data
• Find patterns in non-structured data that coincide with customer feedback and the problem time-line
• List these items as high priority for further investigation
Step 5E: Analyze Trend Charts and Non-Structured Data
Abnormal
Patterns
Things to
Investigate
Work with
Experts to
Explain
Possible
Root
Causes
This critical step should be done ASAP before the first
investigation team meeting
28
Craig A Zedwick June 2016
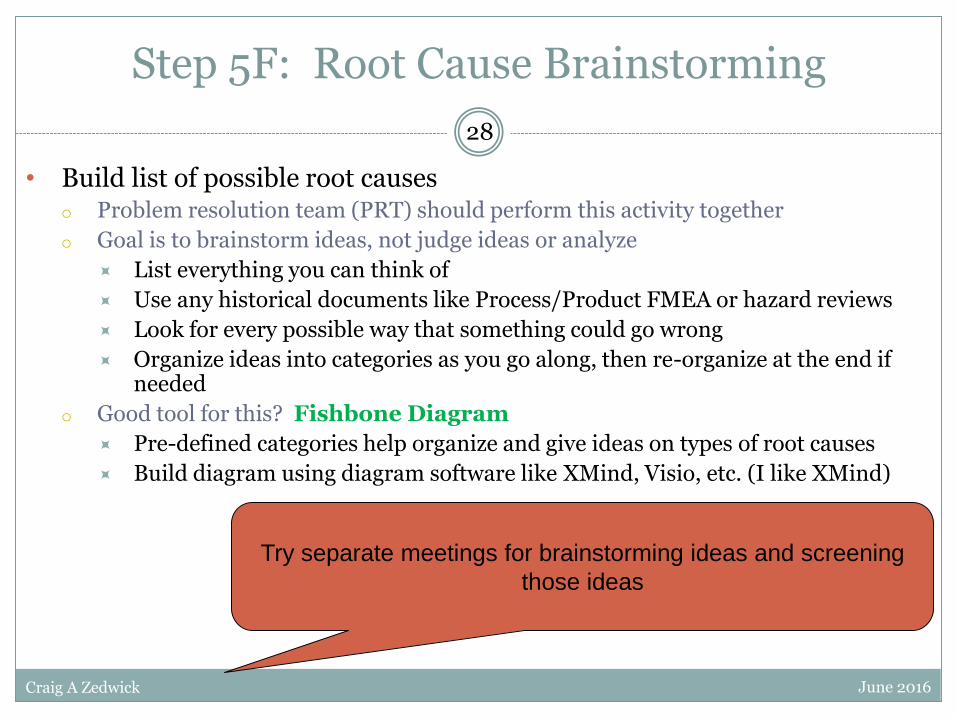
• Build list of possible root causeso Problem resolution team (PRT) should perform this activity together
o Goal is to brainstorm ideas, not judge ideas or analyze
List everything you can think of
Use any historical documents like Process/Product FMEA or hazard reviews
Look for every possible way that something could go wrong
Organize ideas into categories as you go along, then re-organize at the end if needed
o Good tool for this? Fishbone Diagram
Pre-defined categories help organize and give ideas on types of root causes
Build diagram using diagram software like XMind, Visio, etc. (I like XMind)
Step 5F: Root Cause Brainstorming
Try separate meetings for brainstorming ideas and screening
those ideas

29
Craig A Zedwick June 2016
• Common Main Categorieso Manpower
o Machines
o Methods
o Materials
o Measurements
o Environment
• Problem listed in circle label at the head of the fishbone
• May need multiple diagrams if there are multiple problems
Fishbone Diagram Example

30
Craig A Zedwick June 2016
• The High Priority list will form your action plan• Fishbone diagram and idea list should usually be kept as internal documents
o Too much detail and (maybe) proprietary information to share with customerso Can share action plans built from the idea list
Step 5G: Root Cause Idea Screening
Ideas that:
• Have no data
to check
• Can be
immediately
disproven
• Cannot be
reasonably
investigated
• Most likely
root causes
• Easiest to test
• Fit known
mechanisms
• Can be
controlled
1. Prioritize high
priority ideas
2. Assign
owners to
each action
3. Assign target
completion
dates

31
Craig A Zedwick June 2016
Step 5H: The Investigation
• Review paper batch cards• Confirm metrology is operating
correctly• Perform extra testing• Many others based on idea list
Investigative actions are
coordinated by PRT Lead
– Different ideas require different investigation activities
– Statistical analyses to find links to performance data (done by CQE & MQE)
• This can be done for all continuous variables that CMC collects
• More details in upcoming slides
• Try to correlate to any continuous customer data
– Validation testing (done by many functions, depending on nature of test)
• This is used to prove or disprove a hypothesis
• Example hypothesis: The dosing control valve is not functioning correctly
• Possible validation: Perform dosing test using bucket to collect and weigh material
Other Possible Actions:

32
Craig A Zedwick June 2016
• Statistical Analysis
1. Compile all data gathered to this point into the master spreadsheet
2. Add customer feedback data column(s) to master spreadsheet Continuous (i.e. slurry lot-based) data can be input directly
Discrete data should indicate good vs. bad using numbers
Example: 1=good, 5=bad
Tip: Color coding good and bad rows of data may help
3. See next slides for how to analyze based on customer data type
Step 5H: The Investigation
4. Perform correlation and regression analyses as detailed on the following slides
NOTE: A correlation alone does not prove cause-effect relationship and cannot be used to predict behavior

33
Craig A Zedwick June 2016
• Discrete Data from a customer is usually in the form of good vs. bado Either a product works or not
o If a product or service is given a subjective rating (e.g. from 1 to 5), then that can be analyzed as continuous data or you can combine the best and worst rating numbers to create a good vs. bad set of data
This is often used in marketing analysis to combine ratings like “satisfied” and “very satisfied” in order to find patterns
o Numerical data being analyzed can then be associated with the good products or the bad products
o There is a statistical test that can be run to see if the entire set of “good” data is truly different than the entire set of “bad” data
o This is called a t-test and the output of this test is called a P-value
• See the embedded video for an example of how to use Excel to quickly generate t-test P-Values for good vs. bad data sets
• Investigate any data columns with a P-Value < 0.05 furthero P-Value indicates the probability of the two populations NOT being different
o So a very low P-Value means that you are confident that these two data populations are actually different
o Because you have divided one parameter into two data sets to represent good and bad customer feedback, if they are statistically different, then this parameter should be investigated further
Analyzing Discrete Data
34
Craig A Zedwick June 2016
• Continuous data is something like temperature or a person’s height
o Any data that can be measured directly
o Also includes things like survey or census data given as percentages
o Continuous data can be summarized by taking the average and calculating the standard deviation
• The most common analysis tool for continuous data is a linear correlation
o This determines if two different parameters are related to one another by a straight line relationship
o In Excel, this would be shown using a x-y scatter plot with a linear trendline
o The correlation coefficient is called R and can be either positive or negative
A positive R means that when one variable increases, so does the other (direct correlation)
A negative R means that when one variable increase, the other variable decreases (inverse correlation)
Analyzing Continuous Data
o Excel can easily calculated the R value and the R2 value
The R2 value multiples R by itself to give a value that is always positive
See the embedded video for an example of how to perform this analysis
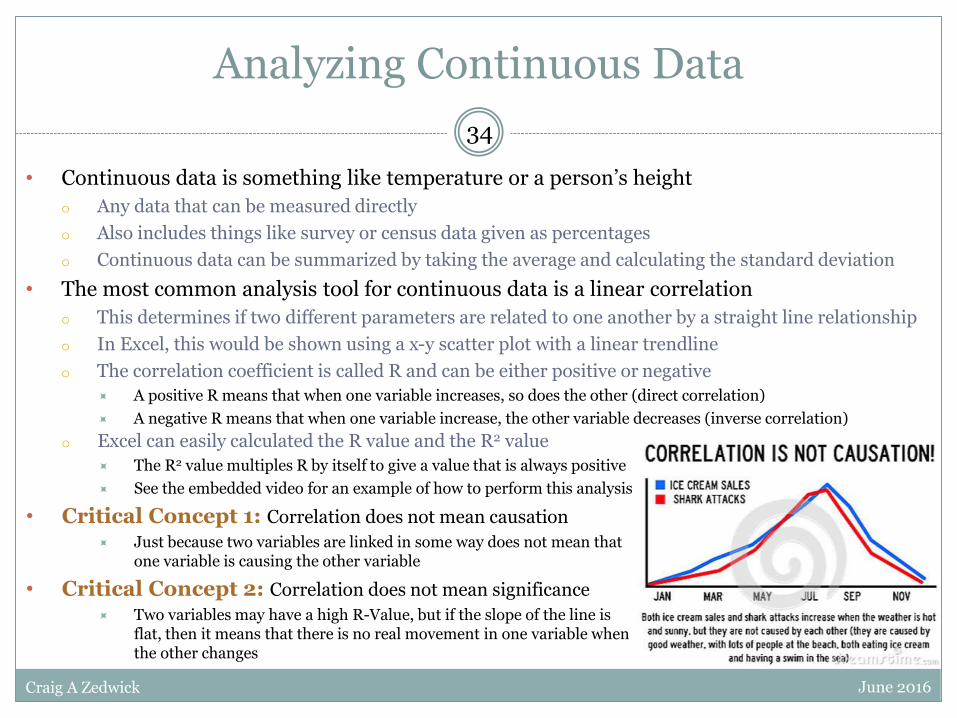
• Critical Concept 1: Correlation does not mean causation
Just because two variables are linked in some way does not mean that one variable is causing the other variable
• Critical Concept 2: Correlation does not mean significance
Two variables may have a high R-Value, but if the slope of the line is flat, then it means that there is no real movement in one variable when the other changes
35
Craig A Zedwick June 2016
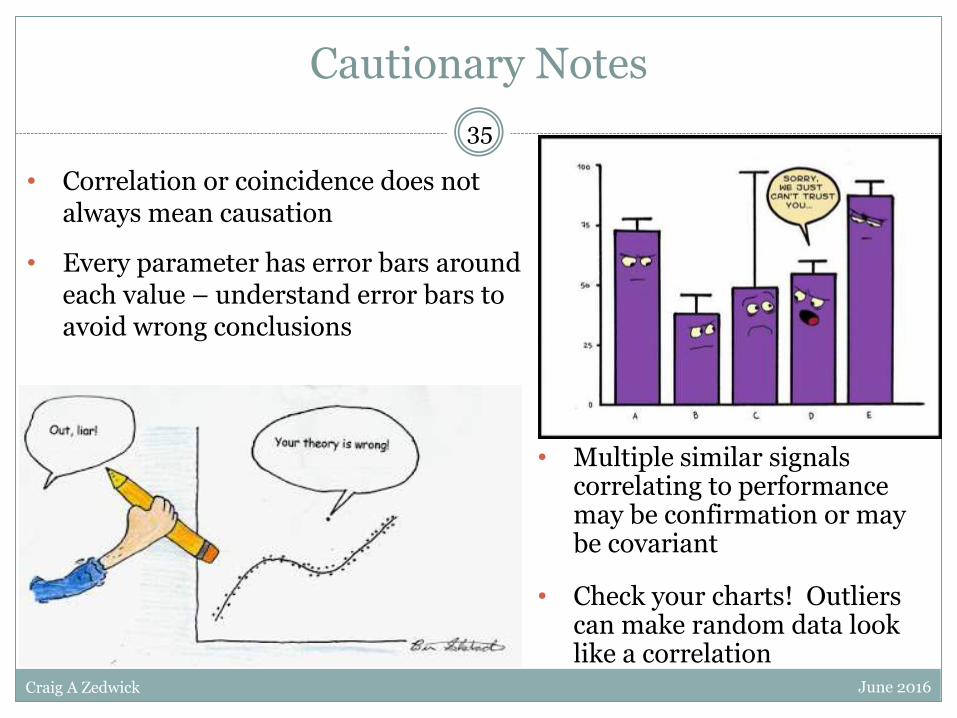
• Correlation or coincidence does not always mean causation
• Every parameter has error bars around each value – understand error bars to avoid wrong conclusions
Cautionary Notes
• Multiple similar signals correlating to performance may be confirmation or may be covariant
• Check your charts! Outliers can make random data look like a correlation
36
Craig A Zedwick June 2016
• Backgroundo Pam and Sue’s is a department store with 250 locations
o Their current method of choosing new locations is by categorizing the stores into one of seven categories based on a variety of factors
o Their predicted sales for new stores is becoming less and less accurate over the past few years
o Now want to know if there is a better way to predict the sales for potential store locations to do a better job of choosing new locations
• Data seto Variety of demographic data collected by governmental agencies for the area within 15
km of each of the existing stores (continuous data)
o Also lists the Store Type category which is a value from 1-7 (discrete data)
• Can this data set be used to build a predictive model for store sales?o What demographic data actually correlates to sales?
o Can the correlated parameters be used to build a model?
Working Example

37
Craig A Zedwick June 2016
• The goal of the first 48 hours is to develop an investigation plan
o The investigation plan should list the prioritized actions
o Four possible issues that should lead to further investigation:
1. Abnormalities in the parameter’s trend chart
2. Some Non-Structured Parameter coincides with the defect onset
3. There is a high likelihood parameter identified in the fishbone diagram
4. There is some correlation or mean shift associated with a parameter when compared to the customer’s performance data
o The more of the above issues are linked to a parameter, the higher its priority should be
The actions associated with investigating each parameter will differ, so a fixed process cannot be used for the investigation after this point
By using this process in the first 48 hours, we will deliver value to the customer and provide a good plan for our further investigation to follow
Step 5I: The Investigation Plan
Statistical
Analysis
Investigation
Plan
Root
Cause
Idea List

38
Craig A Zedwick June 2016
• Remember:o The initial data package is just the first response to the customer
o Future data packages and presentations will vary, depending on the path of the investigation
• Data Package Outline1. Problem Statement
Should match what was agreed with the customer
Show tables or charts that clearly define the onset and recovery (if there is recovery)
2. Time Line & Non-Structure Data
Clearly highlight onset and recovery points
Avoid too many colors or fonts, except around the onset and recovery points – don’t confuse customer
Don’t show too many data points before the onset point unless there is a specific reason
3. Statistical Analysis Results (selected charts, not full data set)
Include only those parameters that show a reasonable correlation or link to customer performance
Be careful about which parameters are shared to protect any intellectual property
May need to normalize the numbers so real values are not shown
Should not be trend charts since that often leads to incorrect interpretations by the customer
Should be x-y plots or interval plots with statistical values like P-Value and/or R2 factor clearly shown
4. Validation test results (include if any have been done)
5. Other investigation action results that have been completed
6. Path forward
A detailed investigation plan with prioritized actions that have target completion dates shown
Step 6 & Onward: Publish Initial Customer Data Package

39
Craig A Zedwick June 2016
• Root cause investigations are usually complex and require focus and time from many people
• Every customer issue will be different, so every investigation will differo But the actions listed in this training should be done every time an
issue arises where our customer requires supporto This format can also be used for internal root cause analysiso After initial data package is complete, the rest of the investigation will
be unique to each customer issue, so no fixed activity list can be used
• Our customers need to see that we can control our own process/product and quickly solve problems when they ariseo If we don’t show them that we are skilled, they will impose their own
controls or go to other supplierso We need to build trust with our customers that we are the experts
when it comes to our product or service
Summary