study of a unidirectional flax reinforcement for biobased
TRANSCRIPT

HAL Id: tel-01663572https://tel.archives-ouvertes.fr/tel-01663572
Submitted on 14 Dec 2017
HAL is a multi-disciplinary open accessarchive for the deposit and dissemination of sci-entific research documents, whether they are pub-lished or not. The documents may come fromteaching and research institutions in France orabroad, or from public or private research centers.
L’archive ouverte pluridisciplinaire HAL, estdestinée au dépôt et à la diffusion de documentsscientifiques de niveau recherche, publiés ou non,émanant des établissements d’enseignement et derecherche français ou étrangers, des laboratoirespublics ou privés.
Study of a unidirectional flax reinforcement for biobasedcompositeHaomiao Yang
To cite this version:Haomiao Yang. Study of a unidirectional flax reinforcement for biobased composite. Solid mechanics[physics.class-ph]. Normandie Université, 2017. English. �NNT : 2017NORMC226�. �tel-01663572�

THESE
Pour obtenir le diplôme de doctorat
Spécialité Mécanique des solides, génie mécanique, productique, transport et génie civil
Préparée au sein de l’ENSICAEN et de l’UNICAEN
Study of a unidirectional flax reinforcement for biocomposite
Présentée et soutenue par
Haomiao YANG
Thèse dirigée par Christophe POILÂNE, laboratoire CIMAP
ED PSIME
Thèse soutenue publiquement le 12/07/2017 devant le jury composé de
M. Pierre OUAGNE Professeur des Universités
Ecole Nationale d’Ingénieurs de Tarbes Rapporteur
Mme Évelyne TOUSSAINT Professeur des Universités
Université Clermont Auvergne Rapporteur
M. Stéphane FONTAINE Professeur des Universités
Université de Bourgogne Examinateur
M. Jun CHEN Professeur des Universités
Université de Caen Normandie Examinateur
M. Florian GEHRING Maitre de conférences
Université de Caen Normandie Examinateur
M. Christophe POILÂNE Maitre de conférences HDR
Université de Caen Normandie Directeur de thèse

2
TABLE OF CONTENT
TABLE OF CONTENT ............................................................................................................ 2
PRÉAMBULE/PREAMBLE ................................................................................................... 5
INTRODUCTION .................................................................................................................. 11
1 Chapter 1 STATE OF THE ART .................................................................................... 15
1.1 Characteristic of plant fiber composite .................................................................... 15
1.2 Characteristic of plant fiber as a reinforcement ....................................................... 16
1.3 Flax fiber as reinforcement ...................................................................................... 17
1.3.1 Structure and composition ................................................................................ 17
1.3.2 Physical properties ........................................................................................... 21
1.3.3 Manufacture processes of flax .......................................................................... 25
1.4 Mechanical properties of flax fiber composites ...................................................... 26
1.5 Unidirectional plant fiber composite ....................................................................... 27
1.6 Conclusion ............................................................................................................... 28
2 Chapter 2 MATERIALS AND METHODS ................................................................... 30
2.1 Material .................................................................................................................... 30
2.1.1 Matrix ............................................................................................................... 30
2.1.2 Reinforcement .................................................................................................. 30
2.1.3 Composite ......................................................................................................... 32
2.2 Specimen preparation and experiments ................................................................... 34
2.2.1 Samples for microstructure observation ........................................................... 34
2.2.2 Methods for observations ................................................................................. 35
2.2.3 Specimen for tensile tests ................................................................................. 37
2.2.4 Methods for tensile tests ................................................................................... 40
2.2.5 Specimens for sorption tests ............................................................................. 42
2.3 Preliminary analysis ................................................................................................ 42
2.3.1 Curing of flax/epoxy composite ....................................................................... 42
2.3.2 Microstructure observation .............................................................................. 46
2.3.3 Ratio of different composite components ........................................................ 47
2.4 Conclusion ............................................................................................................... 50

3
3 Chapter 3 EFFECTIVE MECHANICAL PROPERTIES OF REINFORCEMENT ...... 51
3.1 Analyses of the orientation using structure tensor ................................................... 51
3.1.1 Structure tensor theory ..................................................................................... 51
3.1.2 Analyses of orientation of dry flax ply ............................................................. 53
3.2 Composite theory ..................................................................................................... 57
3.2.1 Classical model for mechanical properties of composite ................................. 57
3.2.2 Taking into account a statistical distribution of fiber orientation ..................... 60
3.2.3 Model sensitivity to input parameters .............................................................. 65
3.3 Performance of UD flax composites ....................................................................... 68
3.3.1 Experimental test on UD laminate ................................................................... 68
3.3.2 Flax fiber properties using statistical distribution function .............................. 70
3.4 Conclusion ............................................................................................................... 72
4 Chapter 4 PHENOMENOLOGICAL ANALYSIS ........................................................ 73
4.1 Effect of thermodynamic and kinetic factors ........................................................... 73
4.1.1 Global view of UD flax composite at tension condition .................................. 73
4.1.2 Apparent effect of temperature ......................................................................... 75
4.1.3 Apparent effect of strain rate ............................................................................ 76
4.1.4 Evolution of apparent rigidity .......................................................................... 77
4.1.5 Evidence of permanent strain in second and third regions ............................... 79
4.2 Previous phenomenological model .......................................................................... 81
4.3 Toward a more global model ................................................................................... 85
4.4 Conclusion ............................................................................................................... 88
5 Chapter 5 WATER SORPTION OF UNIDIRECTIONAL FLAX FIBER COMPOSITE89
5.1 Mechanism of water sorption in flax fiber reinforcement ....................................... 90
5.2 Mechanism of water sorption in polymer ................................................................ 91
5.3 Fickian diffusion model ........................................................................................... 92
5.3.1 Fick‘s laws ........................................................................................................ 92
5.3.2 Common sorption types ................................................................................... 93
5.3.3 Diffusion, sorption, and permeability coefficients ........................................... 95
5.4 Model for two-stage sorption type ........................................................................... 97
5.4.1 Two-phase model ............................................................................................. 97
5.4.2 Langmuir‘s model ............................................................................................ 98
5.5 Factors that affect sorption performance in composite material ............................. 99
5.5.1 Influence of environmental conditions ............................................................. 99

4
5.5.2 Effect of composite structure and treatment of fiber ...................................... 100
5.5.3 Effect of sorption on composite mechanical properties ................................. 100
5.6 Water sorption of UD flax composite .................................................................... 101
5.6.1 Description and procedure.............................................................................. 101
5.6.2 Diffusion mechanism ..................................................................................... 102
5.6.3 Diffusion, sorption, and permeability coefficients ......................................... 104
5.6.4 Water uptake by composite components ........................................................ 104
5.6.5 Discussion ...................................................................................................... 105
5.7 Conclusion ............................................................................................................. 107
CONCLUSION .................................................................................................................... 109
REFERENCE ....................................................................................................................... 114
APPENDIX .......................................................................................................................... 125

5
PRÉAMBULE/PREAMBLE
L'autorisation de rédaction d'une thèse de
doctorat en langue anglaise à l'Université de
Caen Normandie est conditionnée à
l'incorporation au document d'une « synthèse
rédigée en français, mettant en évidence les
enjeux et les apports de la thèse ». Dans le
présent document, cette synthèse est constituée
d'un préambule, d'une introduction générale,
d'une conclusion générale et d'un résumé. Les
enjeux du travail demandé sont synthétisés par la
feuille de route reproduite ci-dessous.
Feuille de route proposée initialement au
candidat :
Un « matériau composite » est le mariage d'un
renfort, doté de propriétés recherchées, et d'une
matrice, qui joue le rôle de liant. Partout dans le
monde, les fibres végétales sont amenées à
pénétrer le secteur des matériaux composites, et
même à se substituer aux fibres de verre pour
bien des applications. En France, la fibre de lin
est le meilleur candidat pour cela. Certain secteur
industriels stratégiques sont directement
concernés, comme les secteurs du Sport & loisir,
de la Construction, du Nautisme, de
l'Automobile, de l'Aéronautique, et du Transport
ferroviaire. L'incorporation de fibres végétales
dans les structures à « hautes performances »
n'est qu'une question de temps. Ces structures
comportent essentiellement des renforts
The University of Caen Normandy
authorizes the PhD thesis in English with
the following condition: ―The manuscript
should contain a synthesis to explain the
challenges and the main results of the
work‖. In this paper, the choice has been
done to write preamble, general
introduction, general conclusion, and
abstract in both languages. Challenges of
the PhD work are explained by the
following proposal roadmap.
Roadmap as it was proposed to the PhD
student:
A ―composite material‖ is a coupling
between a reinforcement from which some
specific properties are interesting and a
matrix which acts as a binder. All over the
world, vegetable fibers are expected to more
and more penetrate the composite material
sector, and to replace glass fibers for
numerous applications. In France, flax fiber
is the best candidate. Some strategic
industries are directly concerned, such as
Sports & Recreation, Buildings, Boating,
Automobile, Aeronautics, and Railway.
Incorporating vegetable fiber in ―high
performance‖ structures is only a matter of
time. High performance structures basically
comprise a unidirectional reinforcement

6
unidirectionnels (sans torsion et sans embuvage).
De nos jours, des solutions industrielles existent
pour élaborer des composites renforcés par du lin
unidirectionnel. Le projet décrit ici concerne
l'analyse d'un nouveau type de renfort lin qui est
totalement unidirectionnel. L'utilisation de ce
renfort ouvre la voie à une nouvelle classe de
matériau composite : les polymères renforcés par
des fibres de lin unidirectionnelles (PRFL-UD).
Dans l'équipe d'Alençon du CIMAP, et ce depuis
2007, des travaux ont été conduits[45][46][47][48][49]
sur du lin/époxyde haute performance dans
lequel le renfort est un fil torsadés provenant de
la « filature au mouillé ». L'équipe possède de ce
fait une grande expérience sur ce matériau.
Cependant, sa connaissance concernant le renfort
totalement unidirectionnel est limitée à quelques
expertises. Ce matériau est très récent en in-
dustrie ; il a fait l'objet, à ce jour, de très peu de
recherches scientifiques. La principale difficulté
dans l'utilisation de la fibre de lin comme renfort
pour les polymères organiques est connue :
« comment élaborer un matériau possédant une
interface renfort/matrice performante ? ». Cette
question constitue le fil rouge du présent projet
de thèse.
A. Recherche bibliographique
Le travail de recherche débutera par la mise en
œuvre d'une solide base bibliographique concer-
nant les composites unidirectionnels renforcés
par des fibres végétales. Cette étude
(without twisted yarn and without crimp).
Industrial solutions now exist for making
such unidirectional flax reinforcement. The
work described below concerns the study of
a new industrial flax reinforcement which is
purely unidirectional. The use of such
reinforcement will offer a new material for
composite sector: a unidirectional flax fiber
reinforced polymer (UD-FFRP).
Previous works[45][46][47][48][49]
have been
done in our laboratory since 2007 on high
performance flax/epoxy for which the
reinforcement was a twisted yarn coming
from ―flax wet spinning‖. Therefore, we
have a long experiment on this material.
Nevertheless, our knowledge about purely
unidirectional reinforcement of flax is
actually limited. This material is very new
in industry and very few research studies
have been done about it.
The main difficulty in using unidirectional
flax fiber as reinforcement for polymer is
known: ―how to make a composite with a
good fiber/matrix interface?‖. This question
guides the proposed PhD research work.
A. Bibliographic research
In order to make a solid state of the art, the
research work will begin by a bibliographic
study of purely unidirectional

7
bibliographique sera mise à jour tout au long du
travail de thèse.
B. Caractérisation du renfort
Le PRFL-UD a fait l'objet d'un brevet. Un point
de départ important consiste à analyser le produit
à son été initial (avant imprégnation). Les
principales propriétés intéressantes sont le
rapport pectines/cellulose, le degré de
polymérisation, les propriétés thermiques. Il est
par ailleurs essentiel de quantifier le degré de
désorientation des fibres.
C. Élaboration à l'échelle mésoscopique
La matrice qui sera utilisée n'a pas fait l'objet
d'un choix préalable. Elle doit cependant être
adaptée à l'élaboration d'échantillon transparent à
l'échelle mésoscopique. Les deux possibilités
permettant d'obtenir ce type d'échantillon sont
d'une part l'utilisation d'un mono-pli fibre/résine
et, d'autre part, l'imprégnation d'un faisceau de
fibres. L'échelle mésoscopique facilitera
l'optimisation du protocole d'élaboration et
formera potentiellement une base pour la
caractérisation des propriétés physiques.
D. Élaboration et Optimisation à L'échelle
Macroscopique
Dans le but d'expertiser les performances du
PRFL-UD à l'aide des standards internationaux,
et de l'optimiser à l'échelle de la structure, il
convient d'élaborer des échantillons à l'échelle
macroscopique. Le protocole d'élaboration n'est
reinforcements of polymer by long
vegetable fibers. Nevertheless, the literature
study will occur all over the PhD work.
B. Characterization of the initial product
The UD-FFRP is patented. One important
subject is to characterize this reinforcement
of flax at the initial state (i.e. before
impregnation). The main interesting
properties are the pectin/cellulose ratio, the
degree of cross-linking, and the thermal
properties. It is also essential to quantify the
fiber disorientation.
C. Elaboration of mesoscale specimens
We have not actually decided what matrix
will be used. It should be adapted to make a
composite specimen which will be
transparent at a mesoscopic scale. The two
possibilities are one ply flax/matrix and one
bundle flax/matrix. Mesoscale specimens
will facilitate the optimization of composite
elaboration. Then, mesoscale specimens
will possibly be the base of unidirectional
physical characterization.
D. Elaboration and optimization of
macroscale specimens
In order firstly to test the UD-FFRP with
international standards, and secondly to
optimize the UD-FFRP at the scale of the
structure, the elaboration of macroscale
specimens is very important. The choice of

8
pas imposé mais les paramètres d'entrée seront
rigoureusement contrôlés. Ces paramètres sont :
la durée et la température de ramollissement, la
température et la durée de réticulation, les pro-
portions relatives des constituants, le type de
renfort de lin, et tout autre paramètre qui entre en
jeu dans l'optimisation de l'interface fibre/résine.
Il sera particulièrement intéressant de
fonctionnaliser le renfort par une approche
scientifique. L'utilisation de la technique des
plans d'expériences est nécessaire pour cette
partie ; les résultats expérimentaux pertinents
sont a priori la température de transition vitreuse
et le taux de porosités.
E. Caractérisation de l'interface
Il est connu que l'efficacité de l'interface
fibre/matrice gouverne les propriétés globales
des composites à renfort végétal. Il est en
l'occurrence très difficile d'élaborer un polymère
renforcé par des fibres longues de lin exempt de
porosités. Les méthodes de caractérisation in-situ
de l'interface sont nombreuses. Les principales
techniques utilisées au laboratoire jusqu'à
maintenant sont la microscopie électronique à
balayage (MEB) et les tests de sorption, mais
d'autres possibilités existent localement comme
les essais de fragmentation ou la microscopie
électronique en transmission (MET). Par ailleurs,
un modèle développé au laboratoire pour mieux
comprendre les propriétés de sorption du
lin/époxyde sera implémenté dans le cas du
composite unidirectionnel.
elaboration process is not imposed but the
input parameters of the process have to
seriously be controlled. These parameters
could be cure duration, cure temperature,
softening duration, softening temperature,
mix ratio, type of reinforcement of flax, and
all the needed parameters to increase the
fiber/matrix interface quality. It will be
particularly interesting to functionalize the
reinforcement with a scientific approach.
The use of one or more experimental design
is a necessity in this part. The cross-linking
temperature and the ratio of porosity have to
be quantified as output parameters.
E. Characterization of interfaces
The properties of fiber/matrix interface are a
key point for global properties of UD-FFRP.
For example, it is currently very difficult to
make a long flax fiber reinforced polymer
without porosity. Existing methods to
characterize the in-situ interface are
numerous. The main methods we are using
in our team are Scanning Electron
Microscopy and Sorption Tests but other
possibility exists in our laboratory like
Fragmentation Tests or Transmission
Electron Microscopy. Furthermore, a model
was developed in our laboratory in order to
better understand the sorption properties of
flax/epoxy. This model should be tested
with the UD-FFRP.

9
F. Analyse des Propriétés Mécaniques
In fine, les caractéristiques les plus intéressantes
pour les applications structurales sont les pro-
priétés mécaniques. Un modèle a été développé
au laboratoire pour prédire le comportement
mécanique des composites lin/époxyde. Cette
stratégie sera implémentée dans le cas du
composite unidirectionnel. Les facteurs qui
entrent en jeu dans les performances mécaniques
sont la vitesse de déformation, la température
d'essai et le taux d'humidité des échantillons. Le
taux de désorientation des fibres sera un para-
mètre d'entrée privilégiée. L'analyse de la santé
matière par émission acoustique sera une l'une
des techniques d'analyse privilégiée.
F. Study of properties according to input
parameters
Finally, the mechanical properties are the
more important properties for structural
applications. A model was also developed in
our laboratory in order to better predict the
mechanical properties of twisted flax/epoxy.
This model should be tested with the UD-
FFRP. The testing parameters for
mechanical tests are the strain rate, the
temperature and the moisture content of
specimens. One of the interesting input
parameters to be tested is the fiber
disorientation. One of the measurement
methods we use is the acoustical emission.
Apport de la thèse en terme de production/ Contribution of the thesis
C. Poilâne, F. Gehring, H. Yang and F. Richard, "About nonlinear behavior of unidirectional
plant fibre composite ", in Advances in Natural Fibre Composites: Raw Materials, Processing
and Analysis, Editors: Pr. R. Fangueiro and Dr. S. Rana, Springer 2017 [chapitre de livre/book
chapter]
H. Yang, F. Richard, F. Gehring and C. Poilâne, "Non linear behavior of flax/epoxy
unidirectional composite", International Workshop "Dynamic behaviour of green composites",
ISAE-ENSMA, Poitiers (France), 27-29 September 2016 [présentationorale/oral]
F. Gehring, H. Yang, F. Richard and C. Poilâne, « Aspect inélastique du lin/époxy », JNC 20 –
École des Ponts ParisTech, 28 - 30 juin 2017 [poster]
H. Yang, F. Richard, F. Gehring and C. Poilâne, "Non linear behavior of flax/epoxy
unidirectional composite", 3RD
Int. Conference on Natural Fibers,Braga, Portugal, 21 to 23 rd

10
of June 2017 [présentationorale/oral]
H. Yang, F. Gehring, and C. Poilâne, "Structural design and behavior analysis of
unidirectional flax fiber composite", soumis à J. Mater. Composite [article]

11
INTRODUCTION
L‘objectif de la thèse est de caractériser les
composites à renfort lin du point de vue des
propriétés mécaniques, du comportement
mécanique et de la sorption. Des composites
à renfort lin totalement unidirectionnels ont
été élaborés suivant un protocole de presse à
chaud. Deux approches mécaniques ont été
explorées pour analyser les propriétés
mécaniques de composites à renfort végétal.
Il est bien connu que le comportement
mécanique des polymères renforcés par des
fibres végétales est non linéaire – les courbes
de traction comportant habituellement deux
domaines distincts – et que ce comportement
dépend de plusieurs conditions
expérimentales (vitesse de traction,
température, humidité…). Une étude
expérimentale de l‘influence de la vitesse de
traction et de la température a mis en
évidence un comportement plus général en
trois domaines distincts. Le premier modèle
mécanique que nous étudions suit de ce fait
une approche phénoménologique visant à
décrire le comportement mécanique observé
via l‘identification de huit paramètres
matériaux. Cette approche fait l‘objet du
quatrième chapitre.
Le second modèle mécanique consiste à
exprimer les propriétés mécaniques effectives
du renfort unidirectionnel de lin à l‘aide
In this PhD work, the objective is to
characterize the behavior of flax fiber
composite at the aspects of mechanical
properties and water sorption. Purely
unidirectional (UD) flax fiber composite
has been designed and manufactured
based on the hot platen process. Two
mechanical approaches were developed
to analyze the mechanical behavior of
UD plant fiber composites.
As it is well known, mechanical behavior
of plant fiber composite is not linear and
depends on experimental condition
(strain rate, temperature and
humidity…): plant fiber composites
normally exhibit two typical regions in
the tensile test. More generally, by
experimental design considering the test
conditions such as strain rate and
temperature effect, three regions have
been identified in this work. The first
studied model is a phenomenological
model developed to describe the three-
region tensile mechanical behavior of
plant fiber composite in which more
eight parameters were identified. The
phenomenological model is discussed in
the fourth chapter.
The second model is the development of
effective mechanical properties of UD

12
d‘une approche inverse basée sur la loi des
mélanges, la prise en compte du taux de
porosité, et la prise en compte de l‘orientation
des fibres. Pour cela j‘ai introduit un
paramètre d‘orientation dans la loi des
mélanges, la distribution statistique de
l‘orientation des fibres étant calculée par
analyse d‘image et utilisation du concept de
tenseur de structure. Ce modèle de mécanique
des composites est développé dans le
troisième chapitre.
Les deux modèles mécaniques étudiés
fournissent des prévisions pertinentes du
comportement mécanique du renfort
unidirectionnel lin UD et des composites
associés.
Outre les résultats précédents, le
comportement de sorption du composite
unidirectionnel a également été analysé. Au
laboratoire, de précédents résultats ont
montré que dans le cas d‘un polymère
renforcé par du textile de lin, un modèle à
deux cinétiques (Fick à deux phases ou
Langmuïr) donne de meilleurs résultats que le
modèle de Fick simple. Notre étude montre
au contraire que la sorption du composite
unidirectionnel est conforme à la théorie de
Fick classique. Le résultat montre donc que la
sorption d'humidité est fortement affectée par
la conformation unidirectionnelle des fibres
de lin et des porosités existant dans le
flax fiber reinforcement identification
theory by taking orientation into account
based on the rule of mixture model, and
the fraction of porosity. For the latter, I
introduced the orientation parameter into
the rule of mixture model, statistical
distribution of flax fiber orientation was
obtained by using image analysis of local
orientation of fiber combining structure
tensor method. This composite science
based model is developed in the third
chapter.
Both two models provide effective
forecast of the mechanical behavior of
UD flax reinforcement and its composite.
Besides the previous results, sorption
behavior of UD flax composite has been
analyzed also. For flax textile composite
in our lab, two-kinetic model (two-phase
Fick‘s model or Langmuïr model) has
given better results than simple Fickian
model. Oppositely, the sorption behavior
is in line with typical Fickian model in
case of unidirectional flax composite.
Therefore, result shows that the moisture
uptake was strongly affected by the
unidirectional conformation of flax fibers
and porosities existing in the composite.
The sorption of UD flax composite is
studied in the fifth chapter.
13
composite. Les propriétés de sorption sont
étudiées au cinquième chapitre.
Dans le présent travail de thèse :
J‘ai étudié la littérature sur les composites
unidirectionnels à fibre végétale.
[Chapitre 1]
J‘ai élaboré et analysé un matériau
composite à renfort unidirectionnel de lin
par pressage à chaud. [Chapitre 2]
J‘ai effectué des chargements en traction
(essais monotones, tractions répétées
progressives, essais de fluage) du
composite unidirectionnel sous différentes
conditions (température entre 20°𝐶 et
80°𝐶, vitesse de traction entre 10−3𝑠−1 et
10−8𝑠−1 ). Un modèle
viscoélastoplastique à huit paramètres,
développé précédemment dans notre
équipe, a été testé avec le composite
unidirectionnel. Nous montrons qu‘une
rigidification apparente cyclique en
traction n‘est pas possible à identifier
avec le modèle viscoélastoplastique
précédent. Nous proposons comme
hypothèse que l‘ajout de paramètres de
durcissement au précédent modèle est une
solution pertinente pour améliorer la
simulation. [Chapitre 4]
J‘ai mesuré les orientations locales du
renfort. Nous avons ajouté un nouveau
paramètre (orientation) dans la loi des
mélanges permettant d‘analyser
Generally, in this PhD work:
I studied the literature on
unidirectional plan fiber composite.
[Chapter 1]
I designed, manufactured and
analyzed one purely unidirectional
flax fiber composite based on the hot
platen. [Chapter 2]
I have done tests under tensile
loading (repetitive progressive load,
creep tests, and monotonic tensile
tests) of UD composite at varies
conditions (temperature from 20°𝐶 to
80°𝐶 , and strain rate from 10−3𝑠−1
to 10−8𝑠−1 ). Eight parameters
viscoelastoplastic model previously
developed in the team has been tested
with the UD composite. I showed an
apparent cyclic strengthening in
tensile which is not possible to
simulate with the previous
viscoelastoplastic model. We propose
a strong assumption that the addition
of strengthening parameters to the
initial model offers a good solution to
improve simulation. [Chapter 4]
I measured the local orientations of
reinforcement. I introduced new
parameter (orientation) into rule of
mixture model for UD reinforcement
effective mechanical properties
analysis. UD flax fiber shows high
mechanical properties (Young‘s

14
l‘efficacité du renfort dans le composite
lin unidirectionnel. La fibre de lin UD
présente des propriétés mécaniques
élevées (supérieures à 80 𝐺𝑃𝑎 ) à
température ambiante (20° 𝐶 ) et vitesse
de traction standard ( 10−4𝑠−1 ).
[Chapitre 3]
J‘ai mis en œuvre des essais de sorption
en immersion du composite
unidirectionnel. Ce composite montre une
capacité de prise d‘eau rapide et élevée
(environ 22% d‘eau en masse à
saturation), le mécanisme de diffusion est
conforme à une loi de Fick. [Chapitre 5]
modulus higher than 80 𝐺𝑃𝑎 ) in
room temperature ( 20°𝐶 ) and
standard strain rate conditions
(10−4𝑠−1). [Chapter 3]
I designed and performed sorption
experiment for UD composite. This
composite has a high moisture uptake
(about 22% by mass percentage).
Diffusion mechanism is finally
conform to Fickian model.
[Chapter 5]

15
1 Chapter 1 STATE OF THE ART
1.1 Characteristic of plant fiber composite
Plant Fiber Composites (PFC) – also known as Plant Fiber Reinforced Polymer (PFRC) – are
low environmental impact and low cost and renewable source fiber with
lightweight reinforced polymers compared to artificial fiber reinforced polymers. One of their
potentials is to replace artificial fiber composites such as glass fiber composites at lower cost
with improved sustainability[1]
. The use of plant fiber reinforced polymers is main in the
aspects of construction and infrastructure (such as beams, roof panels and bridges), sports and
leisure (for boat hulls, canoes, bicycle frames and tennis rackets), furniture and consumer
goods (such as packaging, cases, urns, chairs, tables, helmets and ironing boards) etc.[2]
.
Although plant fiber reinforced polymers exhibit good prospects, the artificial fibers,
specifically E-glass, dominate today fiber reinforced polymer (FRP) market[3]
. In many of
plant fiber composite applications, they are being employed primarily as little or no structural
role but environmentally friendly materials because of reinforcement characteristics
summarized below that will transfer into the final product performance. Plant fiber advantages
and disadvantages are shown in Table 1.1.
Table 1.1 Main advantages and disadvantages of plant fibers[4]
Advantages Disadvantages
Low cost High moisture absorption
Renewable resource Poor dimensional stability (swelling)
Low density Poor microbial resistance
High specific property Low thermal resistance
High Young‘s modulus Discontinuous fiber
Good tensile strength Anisotropic fiber properties
Nonabrasive to tooling and molds Low transverse strength
No skin irritations Low compressive strength
Low energy consumption Local and seasonal quality variations
CO2 neutral Demand and supply cycles
No residues when cremated
Biodegredable (±)

16
1.2 Characteristic of plant fiber as a reinforcement
Plant fibers primarily consist of: cellulose, hemicelluloses, lignin, and pectin for some of
them. The individual percentage of these components varies with the different types of fibers.
Generally, higher performance is achieved with varieties having higher cellulose content and
with cellulose microfibrils (see Fig. 1.1) aligned more in the fiber direction, which tends to
occur in bast fibers (e.g. flax, hemp, kenaf, jute and ramie) that have higher structural
requirements in providing support for the stalk of the plant[5]
. Numerous studies on the
characterization of plant fibers were conducted. Table 1.2 gives properties of plant fibers
compared with those of the main types of artificial fibers.
Table 1.2 Mechanical properties of plant fibers as compared to conventional fibers[5][6][7][8]
Fiber
Density
(𝑔 𝑐𝑚−3)
Length
(𝑚𝑚)
Elongation
(%)
Tensile strength
(𝑀𝑃𝑎)
Young‘s modulus
(𝐺𝑃𝑎)
Cotton 1.5 − 1.6 10 − 60 7 − 8 287 − 597 5.5 − 12.6
Jute 1.3 1.5 − 120 1.5 − 1.8 393 − 773 10 − 55
Flax 1.5 5 − 900 2.7 − 3.2 345 − 1830 27.6 − 80
Hemp 1.5 5 − 55 1.6 550 − 1110 58 − 70
Ramie 1.5 900 − 1200 3.6 − 3.8 400 − 938 61.4 − 128
Sisal 1.5 900 2 − 2.5 511 − 635 9.4 − 28
Alfa 1.4 350 1.5 − 2.4 188 − 308 18 − 28
Coir 1.25 − 1.5 20 − 150 17 − 47 105 − 175 4 − 6
Bamboo 0.9 − 1.4 − 1.73 341 − 503 19.7 − 35.9
Wood 1.3 38 − 152 6.9 50 − 315 2.3 − 5
E-glass 2.5 continuous 2.5 2000 − 3500 70
S-glass 2.5 continuous 2.8 4570 86
Aramid 1.4 continuous 3.3 − 3.7 3000 − 3150 63 − 67
Carbon 1.4 continuous 1.4 − 1.8 4000 230 − 240
The density of the plant fibers is much smaller than that of glass fibers. This is a major asset
for the use of them as reinforcement combining the ecological protection advantages. The
Young‘s modulus of plant fiber such as flax is comparable to that of glass fiber if one is
interest in the best results regarding the ecological cycle and carbon emission. However, in
terms of failure stress, the artificial fibers are well above the plant fibers. Furthermore such

17
comparison from bibliographic results could be not meticulous, because for most of articles
the authors do not make any difference between elementary fiber and bundle of fibers (see
next section). For example, it is the case for flax fiber in Table 1.2, for which the length varies
from 5 𝑚𝑚 (elementary fiber) to 900 𝑚𝑚 (bundle of fibers)!
1.3 Flax fiber as reinforcement
1.3.1 Structure and composition
Flax fibers which originate from renewable resources are a possible alternative to artificial
fibers. They have many advantages such as low density, high specific stiffness, recyclability
and especially have a 𝐶𝑂2 neutral life cycle fitting well into ecological environment in
contrast to the artificial fibers (glass, carbon, etc.), and these constitute the major incentives
for their use in composites. The flax fiber has a complicate structure consisting of cellulose,
hemicellulose, pectin, lignin, water soluble and others[7]
. Fig. 1.1 presents the general
structure of a flax fiber. The flax fibers which are grouped in bundle forms exist in the phloem
parenchyma between the wood part and the bark of the stem of the plant (Fig. 1.1(a) &
Fig. 1.1(b)). The fiber bundles are composed of several tens of elementary fibers. Flax fiber is
a hollow fiber where the chemical components (cellulose, hemicellulose, lignin and pectin)
are organized into cell walls in a multilayer structure. Each fiber has a complex, layered
structure consisting of a primary cell wall (PCW), a secondary cell wall (SCW) and a lumen
(L) (Fig. 1.1(c) & Fig. 1.1(d)). The primary wall which is the first layer contains randomly
oriented microfibrils in a matrix consisted mainly by pectin and deposited during cell growth
encircling a secondary wall. The secondary wall representing 80% of the fiber section is
made up of three layers: S1 (0.5 − 2 µ𝑚), S2 (5 − 10 µ𝑚) and S3 (0.5 − 1 µ𝑚). S1 is the
external layer, S2 is the thick middle layer determining the mechanical properties of the fiber,
and S3 is the thin internal layer that surrounds the fiber lumen. A lumen which is somehow
porosity in the center of the fiber can be as small as 1.5% of the cross section. S1 and S3 are
arranged in parallel layers in different orientations. In addition, the cellulose microfibrils are
highly oriented in the S2 layer with a low angle (microfibril angle between 8° and 11°)
relative to the axis of the fiber Fig. 1.1(d)). The elementary fibrous cells with lengths mainly
between 2 and 5 𝑐𝑚, and average diameters mainly between 10 and 30 µ𝑚 are glued together
by means of the middle lamella interphase which mainly consisting of pectin and
hemicellulose, that is a mixture of different lower molecular weight branched

18
polysaccharides. The various layers can be differentiated according to their chemical
composition, thickness and organization in microfibril structure, but each layer consists of
cellulose microfibrils in a matrix of hemicellulose, pectin and optionally lignin. This confers
tensile strength in cell walls, where cellulose microfibrils are meshed into a polysaccharide
matrix[9][9][11][7][12]
.
(a) flax stem (b) bundle of fibers
(c) elementary fiber (d) elementary fiber (S1–S3 reversed)
Fig. 1.1 Structure of a flax fiber from the stem to the microfibrils[11][9]
Flax fibers are mainly made up of cellulose ―fibers‖, consisting of helically wound cellulose
microfibrils bound together by an amorphous matrix. Plant fibers, in particular flax fibers,
comprise four main components: cellulose, hemicellulose, lignin, and pectin, but also waxes
and water. Main component proportions are summarized and determined in several studies as
in Table 1.3.

19
A large variation of the values has been found in the literature. That is mainly because a set of
parameters such as the variety, quality of the soil, the climatic conditions, the quality of the
retting process, the degree of maturity or measurement conditions.
Table 1.3 Chemical composition of flax fiber (mass fraction)
Cellulose Hemi-cellulose Pectin Lignin Wax Water soluble Water References
65.2 − 72.2 10.1 − 17.1 2.8 − 5.6 2.3 − 7.7 2.2 − 3.0 − − [13]
61.5 − 86.5 − 2.4 − 3.8 2.1 − 2.6 − − − [14]
77 8.7 − 2.8 − − 4.5 [15]
71 19.6 2.3 2.2 1.7 − 10 [16]
60 − 80 10 − 15 − 0.4 − 4 − − − [17]
65 16 3.0 2.5 1.5 4 8 [18]
64.1 16.7 1.8 2.0 1.5 3.9 10 [7]
62 − 72 18.6 − 20.6 2.3 2 − 5 1.5 − 1.7 8 − 12 [19]
a. Cellulose
Cellulose consists of crystalline and amorphous regions and is an organic compound with the
formula (𝐶6𝐻10𝑂5)𝑛, a polysaccharide consisting of a linear chain of several hundred to many
thousands of 𝛽(1 → 4) linked D-glucose units (Fig. 1.2). In the cellulose chain, the glucose
units are in 6-membered rings, called pyranoses[20]
. The multiple hydroxyl groups on the
glucose from one chain form hydrogen bonds with oxygen atoms on the same or on a
neighbor chain, holding the chains firmly together side-by-side and forming microfibrils with
high tensile strength. Meanwhile, a large numbers of hydroxyl groups could leads to a strong
hydrophilic property of cellulose.
Fig. 1.2 Cellulose molecular structure

20
b. Hemicellulose
Hemicelluloses are wall polysaccharides, and branched whereas cellulose is unbranched. In
contrast to cellulose, hemicellulose is derived from several sugars in addition to glucose,
especially xylose but also including mannose, galactose, rhamnose, and arabinose[21]
. These
are amorphous polysaccharides with a lower molecular weight than that of cellulose, which
explains their low chemical resistance. Hemicellulose which can be extracted with alkaline
treatment consists of shorter chains, between 500 and 3000 sugar units as opposed to
7000 − 15000 glucose molecules per polymer seen in cellulose[22]
. The main role of
hemicelluloses is to tether cellulose microfibrils, thereby strengthening the cell wall.
Hemicelluloses are very hydrophilic, they are primarily responsible for the water absorption
in plant fibers. They also have links with lignin and constitute the interphase between
cellulose microfibrils and pectin cements[23]
.
c. Pectin
Pectin consists of a complex set of polysaccharides such as galacturonic acid and neutral
sugars of various compositions (rhamnose, galactosexylose and arabinose) with galacturonic
acid residues constituting up to 70% of its overall structure. It consists of four pectin
domains: homogalacturonan (HGA), rham-nogalacturonan I (RGI), rhamnogalacturonan II
(RGII) and xylogalacturonan (XGA)[24]
. Pectins are contained in the primary cell wall of the
plant fiber and particularly abundant in the non-woody parts, and ensure the cohesion of the
cellulose or other non-cellulosic polysaccharides, similar to tethered liquids. A direct relation
can be observed between the humidity and the hemicellulose/pectin percentages. There is a
linear increase of the moisture index with the hemicellulose/pectin percentage in natural plant
fibers[25]
.
d. Lignin
Lignin is a three-dimensional complex molecule composed of phenyl groups. Lignins are
particularly important in the formation of cell walls, especially in wood and bark, because
they lend rigidity and do not rot easily. Chemically, lignins are cross-linked phenol
polymers[26]
. Lignin is after cellulose the second most abundant natural polymer on the
earth[27]
, however it is present in small quantities in flax fiber (Table 1.3). Microfibrils are
cross-linked together by hemicellulose homopolymers. Lignins assist and strengthen the
attachment of hemicelluloses to microfibrils. The non-polysaccharide components of

21
plant cell walls are highly hydrophilic and thus permeable to water, whereas lignin is the
more hydrophobic.
e. Waxes
By the way, waxes are a diverse class of organic compounds that are hydrophobic with a
low melting point above about 40°𝐶. Plants secrete waxes into and on the surface of their
cuticles as a way to control evaporation, wettability and hydration. No significant effect of
wax on the mechanical properties of the flax fiber composite was found.
1.3.2 Physical properties
a. Density and defect
The values of the mass density of a flax fiber reported in the literature are widely scattered,
ranging from 1380 to 1550 𝑘𝑔 𝑚−3 [28][29][7][5][30]
. This difference may be explained in part by
the growth conditions of the plants, the position of the fiber in the rod and of the species in
question, and secondly, by the measurement method. Particularly, taking in account the
volume of the lumen on one hand and the humidity inside fiber on the other hand has an
important effect on the measured density. One retains the value 1540 𝑘𝑔 𝑚−3 for fiber
percentage computation of FFRP[31][47]
. Elementary flax fibers contain cell-wall defects
known as various organizational forms called dislocations, kink bands, nodes, or slip planes,
etc.[32]
. Defective secondary walls also exist in the growth of plant cell wall[33][34]
.
Ultrastructural studies reveal a common set of cell wall defects in dividing embryonic and
root cells. These defects are linked to a specific reduction in cellulose coupled with ectopic
callose and lignin deposits and by which cell-wall gaps are resulted in. The most obvious
defect observed was the appearance of incomplete cell walls[34]
. The rupture properties of the
flax fiber are affected by the defects of those weakest links of a chain (kink bands zone)
causing initiate failure under load[32]
. A non-homogeneous distribution of defects exist in the
fibers may be one reason for the large variations in mechanical properties of the flax fibers.
Many defects are also induced through the standard mechanical preparation of the flax –
typically scutching, hackling, spinning and weaving (see Fig. 1.6) – in addition to the
discontinuity and possible misalignment of the fibers. These defects lead to weakening of the
fibers and result in a decrease of composite mechanical properties[35]
.

22
b. Thermal stability
The thermal degradation of cellulose-based fibers is greatly influenced by their structure and
chemical composition. Thermal stability seems to be one drawback limiting the application of
flax fiber. Several-condition thermogravimetric analysis carried on between room temperature
and 800°𝐶 with 10°𝐶 𝑚𝑖𝑛−1 [36]
is shown in Fig. 1.3 where the mass of the fibers remain
stable until 160°𝐶 and weight loss of the previous portion (below 100°𝐶) is mainly due to
evaporation of water. After that the fibers gradually begin to decompose. Derivative
thermogravimetry displayed in blue dotted curve shows that the maximum weight loss rate is
around 334°𝐶 . FlaxtapeTM
which is comprised of unidirectional flax fibers is found to be
more thermally stable in argon than air. It should be the same with other flax product because
oxidation reaction takes place at around 440°C in the air atmospheres. The first
decomposition of the fiber components are the wax (above 120°𝐶) and pectin (above 180°𝐶)
then cellulose and hemicelluloses[37]
followed by the lignin[38]
.
Fig. 1.3 Thermogravimetric analysis of flax fiber
[36]

23
According to the literature, the first loss of mass at around 60°𝐶 on Fig. 1.3 is due to
the release of water, the third loss of mass at around 334°𝐶 is due to cellulosic substance
degradation, and the fourth loss of mass at around 440°𝐶 is due to oxidation of some woody
matter (lignin). The second loss of mass at around 264°𝐶 is mainly due to pectin
degradation[39]
. This loss of mass is usually not noticed[37]
but particularly visible with
FlaxtapeTM
(Fig. 1.3(a) & Fig. 1.3(b)). That is due to the use of pectin as a binding agent in
case of FlaxtapeTM
, these pectins being mainly eliminated in case of traditional textile
processes (Fig. 1.3(c) & Fig. 1.3(d)). Beyond this simple analysis, it is well known that when
cellulose-based materials are heated in the range of 100°𝐶 to 250°𝐶, some of the changes in
physical properties of the fibers can be explained in terms of alteration in either physical or
chemical structure such as depolymerization, hydrolysis, oxidation, dehydration,
decarboxylation and recrystallization.
The thermal stability is a key factor for the flax fiber used as reinforcement during composite
production and temperature has a greater effect on the resistance mechanical properties.
Normally, for exposure temperatures up to 170°𝐶 , both the recrystallization and the
differences in thermal expansion coefficient seem not to be significant enough to have a
remarkable influence on the tenacity of untreated flax fibers[40]
. Van de Velde et al.[37]
reported
that after exposure to 120°𝐶 up to two hours, no significant decrease of the tensile strength is
observed in hackled long flax. However, after two hours exposure to 180°𝐶, stress retentions
of 64 to 68% and retained strains of 44 to 60% are observed, respectively. Strain properties
are more influenced than stress properties.
c. Tensile mechanical properties
Tensile mechanical properties of flax fibers are a basic performance considering that as
reinforcement in the composite. The tensile deformation is influenced by various factors such
as external conditions of strain rate, humidity, temperature etc. and internal conditions of fiber
variety such as chemical composition (e.g. cellulose rate) and the structure (e.g., size of the
lumen, microfibril angle), fiber diameter, fiber length considering the defect, etc. Generally,
the mechanical properties (Young‘s modulus and failure stress and strain) of flax fibers
exhibit significant dispersions. In addition, the extraction process of the fibers operations can
be varied resulting in a variation in mechanical properties. Charlet et al.[41]
performed a tensile
test with displacement rate of 1 𝑚𝑚 𝑚𝑖𝑛−1 and gauge length 10 𝑚𝑚 in room condition.
Results show a mean strength 1200 𝑀𝑃𝑎 and Young‘s modulus 56 𝐺𝑃𝑎, respectively. The

24
stress-strain curve of a tensile test of a flax fiber is shown as in Fig. 1.4 with three regions
considering: first linear region (strain from 0% to 0.3% ); second non-linear region
(0.3– 1.5%) and the final linear region (1.5% to rupture). Bos et al.[12]
evaluated the hand
decorticated elementary fiber can give a strength as high as 1800 𝑀𝑃𝑎 at a clamping length
3 𝑚𝑚 and strain rate 0.005 𝑠−1 . The clamping length has an influence on the tensile
mechanical properties, especially when it is small.
Fig. 1.4 Stress-strain curve of an elementary flax fiber[41]
Pillin et al.[42]
investigated different flax fiber varieties from the same cultivation
environment. The test parameters are the same such as gauge length and speed as Charlet et
al.[41]
. The ultimate stress of different kinds of flax fibers varies from 733 to 1111 𝑀𝑃𝑎 and
for modulus, it is from 45.6 to 71.7 𝐺𝑃𝑎 using the second region to calculate. Both Pillin et
al. and Charlet et al. show a typical stress-strain curve with linear and nonlinear regions in
small deformation (0– 0.3 & 0.5%) or higher deformation about the flax fibers (actually, they
hold different views on the linear region), see Fig. 1.4 and Fig. 1.5. The nonlinear tensile
mechanical behavior could be explained by the structure parameters described in
Section 1.3.1. A widely accepted view is due to the deformation of each cell wall caused by
the reorganization and alignment of the cellulose microfibrils along the tensile axis direction
of the flax fiber. Worth to point out, there is a decrease tendency of mechanical properties
(tensile rigidity and strength) of flax fiber accompanied by an increase in fiber diameter. One
reason could be the size change of lumen, another reason could due that defective secondary
walls do not have as many defects as when it is fine.

25
Fig. 1.5 Tensile stress-strain curves of different varieties of flax fiber[42]
1.3.3 Manufacture processes of flax
Plant fibers can be categorized according to the region of the plant they are extracted from,
which are leaf fibers, seed fibers, stem fibers, and other fibers (including grasses, reeds, roots,
and wood fibers, etc.). Flax fiber comes from the stem of the plant undergoing further
processing to make reinforcement. This means retting, scutching, hacking, folding, etc.
determined by the final reinforcement product we want to get. Fig. 1.6 gives a schematic
overview of the processing of flax fibers. In the normal way, flax fiber bundles have been
obtained by a retting process firstly, which consists in the biological action of bacteria in an
aqueous medium where some waxes and pectins are removed[43]
.
Then the mechanical processes are implemented including scutching and hackling, etc.
Scutching is the process consisting of extracting fiber bundles contained in the stems.
Hacking process makes phloem fiber bundles into the technical fibers which contain several
dozens of elementary flax fibers in an increasing fine status. Folding/drawing of the flax
reinforcement allows coalescing fibers into greater length so as to obtain ribbons or tapes with
several meters long. At the same time, the variability of reinforcement decreases and the flax
color homogenizes itself. In the spinning process by flax spinning mills, the ribbons undergo
successive torsions and stretches by which the flax ribbons are transformed and the desired
yarn titration or woven reinforcement can be obtained[44]
. Experienced more or less process
steps, flax fiber reinforcements with different forms (mat, sew, UD) can be acquired
(Fig. 1.6).

26
Fig. 1.6 Production processes of technical flax fibers as reinforcement
1.4 Mechanical properties of flax fiber composites
Resins used for composite matrices are cataloged into thermoplastic and thermosetting
polymer. Commonly used matrices of thermosetting polymers for flax fiber studying as the
reinforcement are epoxy[45][46][47][48][49]
, unsaturated polyester (UP)[50]
, phenol formaldehyde
(PF)[51]
polyurethane (PU)[52]
, bio-based thermoset soybean oil[53]
and furan[54]
etc.
Thermoplastics are those of polyamide (PA)[55]
, polypropylene (PP)[56]
, poly lactic acid
(PLA)[57][58]
, polystyrene (PS)[59]
, aliphatic polyester[60]
and polyvinyl chloride &
polyethylene[61]
etc. Although a wide variety of polymers are used to manufacture composite
as basic matrices, the influence of the polymer type apparently is of secondary importance at
the finally mechanical properties. However the polymer type plays a more important role in
the forming process and non-mechanical properties of products such as chemical degradation.
Mechanical behavior of flax fiber composites are determined by many factors that are not
only matrix system but also reinforcement form (such as mat, unidirectional, sew, yarn and
woven, etc.); methods and materials used in the forming process (e.g. hot platen method, resin
transfer molding, vacuum infusion method, etc.); previous flax surface treatments (silane
treatment, esterification, acetylation, anhydride treatment, mercerization/alkali treatment, etc.).
It means that mechanical performances cannot be directly compared, mainly because

27
processes result in variation of component form and fraction in the final products. Tensile
mechanical properties of flax fiber composite are summarized in Table 1.4. Note that
compared to ultimate stress of flax fiber composite, calculation of Young‘s modulus has more
variations and non-repeatability due to the chosen regions for measurement in tensile curve.
In the cited studies, porosity effects are not considered always, however, it is an important
factor affecting on the mechanical properties of composite and inevitably exists in flax fiber
reinforced polymer.
Table 1.4 Tensile mechanical properties of flax fiber composite
Flax Resin Fiber
fraction
(%)
Porosity
fraction
(%)
Forming process Tensile
strength
(𝑀𝑃𝑎)
Tensile
stiffness
(𝐺𝑃𝑎)
Ref.
Arctic flax Epoxy 47 (vol.) - RTM 279 39 [62]
Woven fabric Epoxy 55 (vol.) - Vacuum bagging tech. 120 9.2 [63]
Woven UD yarn
(warp knit)
UP 31 (vol.) - RTM 143 14 [64]
Natural cellulose
of flax
Biodegradable
polyester
25 (vol.) - Compression molding 19.4 − 25.5 4.3 − 16.2 [65]
Unidirectional
fiber (UD)
PU 32 (vol.) 16.3 Vacuum assisted resin
transfer molding
230 12.5 [66]
Retted (roving) PLA 30 40 (wt.) - Compression molding 44 − 53 7.3 − 8.3 [67]
Retted (roving) PP 30 40 (wt.) - Compression molding 29 5 − 7.6 [67]
Interwoven fabric PP 40 (vol.) - Hot pressing 71.2 5.8 [68]
Woven fabric Bio-based thermoset
soybean oil
60 (wt.) - Hot press molding 137 − 146 14 − 18 [69]
Extremely short
fiber
PE 30 (wt.) - extrusion molding 17 − [70]
1.5 Unidirectional plant fiber composite
Flax fiber as described in Section 1.3.3 or plant fiber has varies kinds of forms as
reinforcement for the utilization in the composite products. Amongst them, purely
unidirectional fiber gain many attentions by some research teams. Bourmaud et al.[71][72]
studied influence of processing temperature on mechanical performance of unidirectional flax
fiber/polyamide 11 composites. They discern two regions, the mean values of flax fiber
stiffness show results 𝐸1 = 39.0 ± 13.3 𝐺𝑃𝑎 in region one and 𝐸2 = 35.8 ± 12.8 𝐺𝑃𝑎 in
region two, respectively, and regardless of the used matrix unidirectional composites exhibit a
good correlation between the fiber volume fraction and their Young's modulus or tensile
strength. By analysis of evolution of rheological properties, they found a drop of viscosity of

28
flax/PA11 mainly attributed to morphological changes of the fibers. Pucci et al.[73]
investigated purely quasi unidirectional flax reinforcements after a thermal treatment at
220°𝐶 for 2 and without treatment. They found that treated flax fibers show a better
dimensional stability and less hydrophilic/sensitive to liquid sorption, in addition the
composite reinforced by treated purely flax fibers has a lower porosity content through the
same liquid composite molding (LCM) process. By inducing laccase catalyzed cross-linking
of feruloylated polysaccharides and/or by generating covalent bonds during lignin
polymerization, Liu et al.[74]
investigated mechanical properties of purely unidirectional hemp
fiber reinforced composites and found a stiffness increase from 33.8 𝐺𝑃𝑎 (without treatment)
to 42.5 𝐺𝑃𝑎 (with treatment). Mahjoub et al.[75]
investigated the tensile properties of
continuous unidirectional kenaf fiber reinforced epoxy polymer composites, which showed a
tensile mechanical properties of strength and modulus of 731.6 𝑀𝑃𝑎 and 40 𝐺𝑃𝑎 ,
respectively, with a maximum elongation 1.8%. Liu et al.[76]
investigate the epoxy composites
reinforced with unidirectional abaca fiber or bamboo fiber fabricated by using RTM. They
found the transverse thermal conductivity of composites with plant fiber show a great
dependence on the lumen structure but a little on crystal structure and chemical compounds.
Ntenga et al.[77]
studied elastic properties of purely unidirectional sisal fiber by making sisal
epoxy composite with the vacuum infusion method and given out sisal fiber elastic constants
of modulus. An obvious decrease of modulus with an increase in the loading angle was
observed about unidirectional sisal fiber composite, where modulus is from 6.92 𝐺𝑃𝑎 to
3.56 𝐺𝑃𝑎 versus loading direction 0 𝑑𝑒𝑔 to 30 𝑑𝑒𝑔 , respectively. Brahim et al.[78]
found
average Young‘s modulus and ultimate stress of 21.5 𝐺𝑃𝑎 and 247 𝑀𝑃𝑎, respectively, with
an ultimate strain 1.96% , by analyzing purely unidirectional alfa unsaturated polyester
composite fabricated by wet layup method.
1.6 Conclusion
In this chapter, characteristics of plant fiber composite – in particular flax fiber and their
composites – were reviewed. Plant fiber has a lot of advantages considering the utilization in
composites, e.g. they have relatively high specific ultimate stress and specific stiffness and
come from renewable resource, and they are environmental protection compared with the
artificial fibers such as carbon and glass fiber in the same application area. However plant
fibers also have some disadvantages such as sensitivity to moisture. Flax fiber whose ultimate

29
stress of element fiber could be more than 1000 𝑀𝑃𝑎 as a member of plant fiber family
shows superiorly stronger mechanical properties than others, even better than magnesium
alloy or aluminum alloy, and could be compared to conventional fiber in parts of specific
tensile ultimate stress and specific Young‘s modulus and has been used in many aspects of
consumer products with a prospective field of view. Flax fiber as reinforcement composes
many resin systems. In this work, unidirectional flax fiber (FlaxtapeTM
) will be used to make
biocomposite with epoxy. Unidirectional flax fiber composite – which performs better tensile
properties in the loading direction along fiber orientation than textile flax fiber composite –
has been deeply studied in this work, mainly on the behavior of mechanical properties and
sorption.

30
2 Chapter 2 MATERIALS AND METHODS
2.1 Material
2.1.1 Matrix
Epoxy resins belong to the class of thermosetting. The resin used in this study is a standard
Huntsman industrial resin for laminating system with low viscosity and high flexibility. This
warm-curing epoxy system is based on Araldite LY1564SP associated with a polyamine
accelerator Hardener XB3486/XB3487. The reactivity may be easily adjusted to demands
through the combination with one of both hardeners. The ―long‖ pot life of XB3486/XB3487
facilitates the production of very large industrial parts. The optimal mix ratio recommended
by the manufacturer is 100 parts by weight of Araldite LY1564SP and 34 parts by weight of
accelerator hardener XB3486 or XB3487. In our unidirectional flax fiber reinforcement, we
selected the Araldite LY1564SP and XB3486 forming system because of the longer gel time
for matrix infiltrating fibers than the other system.
2.1.2 Reinforcement
The flax fiber reinforcement is originated from plant of flax stem, after harvesting, the fibers
are treated according to the usual steps: retting, scutching, hackling and combing
folding/drawing (see Fig. 1.6, Chapter 1). After all these usual steps (from retting to
folding/drawing) flax ribbon is obtained. We can obtain flax fibers for unidirectional
reinforcement. Indeed, with n times folding/drawing process (Fig. 2.1), the flax fibers are then
subjected to a refining which involves stretching the technical fibers to form ribbons like in
Fig. 2.3(a).
Fig. 2.1 Manufacturing process of unidirectional flax ribbon

31
Fig. 2.2 Manufacturing process of unidirectional flax ply
After this stage, the product is ready for spinning for flax yarn reinforcement (Fig. 1.6,
Chapter 1). The flax ribbons is usually processed in spinning stage in three types which are
wet spinning, semi-wet spinning or dry spinning. However, the products of unidirectional flax
plies are manufactured by one more step just after folding/drawing: a widing/flattening
process (Fig. 2.2). In that step, several strands are connected in parallel, with the help of
pulverized water, in order to make the natural pectins softer and to use them as glue between
fibers. The output of this step is a purely unidirectional ply of flax, the FlaxtapeTM
(Fig. 2.3(b)). We consider this product of unidirectional flax fibers as non-pretreated
reinforcement which not undergoes any particular flax selection by the manufacturer. The
reinforcement used in this work weighs 70 𝑔 𝑚−2, 110 𝑔 𝑚−2 or 200 𝑔 𝑚−2 (values from
manufacturer).
(a) Ribbon of flax (courtesy from Lineo) (b) Ply of unidirectional flax
Fig. 2.3 Unidirectional flax fiber reinforcement
Actually, the properties of plant fibers are affected by many factors such as variety, climate,
harvest, maturity, retting degree, decortication, mechanical disintegration, fiber modification,
textile and technical processes[79]
. However, if the flax stems were obtained from a same
source, as the technical flax fibers were obtained from the same manufacturer, it may be
assumed that the fibers were grown under ―similar environmental conditions‖. In this way,
growth environmental effect may be thought to be reduced, meanwhile with same technical
processes.

32
2.1.3 Composite
Usually, number of the plies is selected according to the desired architecture. Ten plies at
0 𝑑𝑒𝑔 are used to manufacture composite laminates required in that study. The process of the
development of the composite plates is carried out by liquid composite mold with a hand
layup method using contact forming consisting of a male mold and a female mold (also
named hot platen press method) according to the detailed stages as follow (see also Fig. 2.4):
1. Cleaning and waxing the mold three times, ten minutes interval for each waxing.
2. Cutting selected plies with the same orientation and optimizing the size.
3. Preparing matrix according the required partition for composites, and leave them in
the air with a short time for bubbles disappearing.
4. Putting adjusted metal block in the mold sideway which allows us to guide the upper
and lower molds in the correct position and prevent resin leakage at these two sides.
5. Stacking the plies in the mold meanwhile utilizing prepared matrix by a brush which
can make the matrix penetrates the reinforcement everywhere from the upper left to
the bottom right to fabricate the composite ply by ply.
6. Placing and tightening the mold by preset method (preload by screws or metal) and
preset pressure, and then leaving it at ambient temperature to promote the liquid
matrix dispersion for two hours.
7. Curing in enclosure equipped with a thermostat in a certain temperature at
atmospheric pressure for a certain period recommended by the manufacturer to allow
the crosslinking of the resin.
8. Cooling to surroundings means that releasing the composite plate from the mold when
the temperature returns to room temperature.
9. Polishing the edges of plate each time after releasing composite from the mold with
abrasive paper 200#.

33
(a) Curing mold with (step 5) (b) Schematic diagram of stacking (step 7)
Fig. 2.4 Curing mold used in flax fiber composite
The curing process is in conformity with one of the manufacturer‘s instructions (8 hours at
80°𝐶). We chose 80°𝐶 as curing temperature to reduce both the thermal impact on fiber
mechanical properties[80]
and the effect of expansion coefficient of aluminum mold on surface
conditions of composite. With the specific process development above, flax composite
laminates with a length and width size of 200 𝑚𝑚 × 110 𝑚𝑚 or 330 𝑚𝑚 × 250 𝑚𝑚 have
been manufactured (about ten laminates for each mold for the present work). Our UD flax
composite has been manufactured with an excellent surface condition. An evaluation of the
dimensional stability is summarized in Fig. 2.5 for six small laminates of textile composite
(that I made for a study which is not presented in this document). Note that the size
fluctuation is very low.
Fig. 2.5 Repeatability of laminates thickness with hot platen process (S300)

34
2.2 Specimen preparation and experiments
2.2.1 Samples for microstructure observation
Table 2.1 Polish process parameters for microscope samples
Polish parameter Fine grinding
Abrasive paper #220 #1200 #2400 #4000 MD-Nap (velvet)
Force (kN) 20 20 15 15 18
Speed (rev min−1) 200 200 200 200 200
Time (min) 0.8 1 2 2 5
Lubricant DP-Blue DP-Blue DP-Blue DP-Blue DP-Brown
Observations of specimen microstructure carry on specimens cut in the initial blank plates.
They are made for optical microscopy (OM) or scanning electron microscopy (SEM). To do
this, samples are optionally polished for OM and polished and coated with a thin layer of gold
when used in the SEM observation. The sample making process for optical microscopy is that
after fine cutting, the samples are cut into small piece of 20 𝑚𝑚 in length with their thickness
and then embedded in the resin, consisting of acrylic shaped in a cylindrical mold (sample
holder). Once the resin are cured in the sample holder, the whole can be promoted into the
next stage which is polished on grinding sheets (Struers MD-System) for decreasing particle
size and gaining good surface status.
The apparatus used in this operation is a polishing machine Struers (Fig. 2.6(a)). Several steps
are carried out on the initial sample with a special lubricant developed by the same company.
Finishing is carried out with a sheet coated with a disk paste up to soft velvet and lubricated
with alcohol. Detailed polish guidance exploited is given in Table 2.1.

35
(a) Polishing machine (b) Coating machine
Fig. 2.6 Systems used for the observation specimen preparation
After the polish stages, OM observation can be done. SEM sample can be prepared based on
the same making process. But surface metallization is required in our laboratory since the
non-conductive nature of the composite makes it necessary to perform a gold deposit on the
samples for observation. For this, the sample is placed in a vacuum chamber (Cressington
Coater 208, see Fig. 2.6(b)) to receive the gold atoms. Then the gas metal (gold) is projected
onto the substrate. A thin and very pure layer is thus deposited on the sample. The
metallization of time and amperage are set at 120 𝑠𝑒𝑐 and 40 𝑚𝐴 respectively to obtain a
layer of approximately 20 𝑛𝑚.
2.2.2 Methods for observations
Direct observation of flax ply gives the possibility to analyze the fiber organization (Fig. 2.7).
For this observation, a USB CCD camera was used (Fig. 2.8(a)) with an installed software
system named UEye. The UD flax ply reinforcements must be placed on an illuminating work
plat. The acquisition of image of the reinforcement is done with a Melles Griot telecentric
imaging optics connected to the camera and placed at a fixed distance – which means in the
field of view of the object – with appropriate light illumination. The output numeric images
(Fig. 2.7) made with the software system UEye consist of 1280 𝑝𝑖𝑥𝑒𝑙𝑠 × 1024 𝑝𝑖𝑥𝑒𝑙𝑠
corresponding to 25𝑚𝑚 × 20𝑚𝑚 in the object plane.

36
Fig. 2.7 Typical unidirectional ply of flax (without matrix). Some of the fibers (elementary
fibers or bundle of fibers) are not aligned in the longitudinal direction (UD70).
For the optical microscopy observations of cross sections, a Nikon ECLIPSE E600
(Fig. 2.8(b)) optical microscope were utilized, in which lens magnification can be selected as
5 × , 10 × , 20 × , 50 × and 100 × . This device is equipped with a CCD camera and
homemade software is used in the microscopy system to process the images of optical
microscopy samples. On the other hand, scanning electron microscopy has been done on
Princeton Gamma-Tech Cambridge electron microscope (Fig. 2.8(c)). For the observation by
scanning electron microscopy, samples are placed in specimen holder. Vacuum pressure was
about 10−5𝑃𝑎, magnification from 50 × to 800 × were used.
(a) CCD Camera (b) Optical microscope (c) Scanning electron microscope
Fig. 2.8 Observation tools

37
2.2.3 Specimen for tensile tests
The cuttings of test pieces are made by different processes determined by destination
convenience and size and shape of laminated plates. For the rectangle shape cut by diamond
cutting system (Fig. 2.9(a)), cutting steps include the following main contents:
• Using a diamond disk or mini diamond disk cooled with water.
• The high-speed machining center (HSC) is air-cooled.
• The size correction instrument with calibration line is fixed on the cutting platform.
The specimens are dried after cutting and then we remove all dust from these surfaces and
clean them with acetone. If required, rub with abrasive paper or blast with suitable sand all the
surfaces to which adhesive will not be applied. It is recommended that a film adhesive with a
thin carrier be used. When necessary, tabs polished with shot blasting or sand paper are stuck
on the test piece specimens under press in compliance with the ISO 527-5:2009 standards to
prevent failure of the material in jaws[81].
(a) Diamond cutting system (b) Laser cutting system
Fig. 2.9 Cutting tools
In order to avoid the use of water, and for specimens with different curvature radius in width
size, we use laser machine (available in our laboratory since January 2016) to cut the
composite laminated plates. The machine used to cut specimens is named Trotec Speedy 400
laser machine (Fig. 2.9(b)) with a CO2 laser type. For our UD flax composite, the parameters
are selected in accordance with the principle of reducing the burning range of the specimens
as far as possible. And the cutting sequence should try to avoid stress concentration. Thus, we
utilized the energy with a value of 80 𝑊 and cutting speed of 1.5 𝑚𝑚 𝑠−1 to perform the
operation through practice. The main parameters for tensile tests are given in Table 2.2.

38
Table 2.2 Parameters of unidirectional flax fiber composite plates for tensile tests
Plate Product
type
Flax density
(𝑔 𝑚−2)
Length
(𝑚𝑚)
Width
(𝑚𝑚)
Thickness
(𝑚𝑚)
Density
(𝑘𝑔 𝑚−3)
Nb of
samples
UD70-6 70 78 320.7 235.6 1.13 1235 11
UD200-1 200 181 317.8 245.7 1.46 1204 15
UD110-1 110 125 324.0 249.0 1.70 1191 15
UD110-2 110 125 313.5 239.5 1.57 1225 20
For the aim of simplifying the making process of tensile test specimens, several types of
composite specimens – which are UD flax composites and twill 2 × 2 flax fabric reinforced
composites – have been manufactured with the shapes as showed as below in Fig. 2.10.
Fig. 2.10 Design of different specimen types for tensile tests (basic size 20 𝑚𝑚 × 200 𝑚𝑚)
Therefore, four different shapes of test pieces consisting of textile flax fabric reinforcement
were designed. Four samples for each shape have been tested (four plates, four specimens by
plate), and then the influence of the shape on the tensile mechanical properties was analyzed.
All the shapes on Fig. 2.10 were directly cut by the laser cutting system. After cutting,
aluminum tabs were glued as usual to the end of the shape specimen A. For the monotonic
tensile test, the extensometer is used on the specimens of shape A, B and D. However due to
the shape used for specimen B, there is no region where strain could be considered as
uniform, hence strain gauges have to be used in that case. The experiment procedures are
carried out according the standard ―Plastics: determination of tensile properties process‖, ISO
527-5:2009[81]
which is suitable for composites with either thermoplastic or thermosetting
matrices, including preimpregnated materials. The reinforcements covered include carbon
fibers, glass fibers, aramid fibers and other similar fibers, in which the geometries covered

39
include unidirectional (i.e. completely aligned) fibers and rovings, and unidirectional fabrics
and tapes. Effect of shape with textile composite at strain rate 10−4𝑠−1 and normal conditions
are given in Fig. 2.11. Firstly, the effect of the plate is visible in Fig. 2.11(a). We do not note
any influence of the plate, meaning that the repeatability of the tests is enough for our
analysis. The effect of the different shapes is described in Fig. 2.11(b) and Fig. 2.11(c). We
can see shape A (with aluminum tabs) and shape D (without any tab) are a little better in both
ultimate stress and ultimate strain.
(a) Repeatability (b) Effect on ultimate stress (c) Effect on ultimate strain
Fig. 2.11 Effect of the shape of specimens on tensile mechanical properties (S300)
It is worth to note that the sample preparation for specimen shape A is really less convenient
than the others. Indeed, on the one hand tabs need to be polished with shot blasting or sand
paper before to be glued on each specimen, and on the other hand the use of glue is a
drawback for high temperature tensile test. About the rupture position, it will always more
easily break in the stress concentration position. For the shape A, the rupture happened in the
place where is near the inside edges of metal tabs accounting for a large proportion. For the
shape B, the rupture place is in the center of the sample near the strain gauge. For the shape C,
it happens in the changing dimension of width or near the radium. In the shape D, the rupture
is usually near the middle area of the test pieces near the extensometer. As a conclusion,
combining the specimen making procedures, we determined shape D is a favorable way for us
to making tensile test samples in the following UD reinforcement composite work.
Tensile tests of UD reinforcement composite have been tested using specimen with shape D.
Unfortunately, the rupture is more likely to occur in fillet point due to longitudinal shear
stresses between fibers. At this time, rectangular flax/epoxy tabs laminated with an orientation
of [−45°, 45°] are utilized to protect the end of A-shape specimens for the research work
about mechanical properties of unidirectional composite (Chapter 3). And no tab are used for
the behavior analysis of unidirectional composite (Chapter 4).

40
2.2.4 Methods for tensile tests
Tensile test is the main technique used to study the mechanical properties of our
unidirectional composites. It allows determining the Young‘s modulus, yield stress, the stress
and strain at rupture (Chapter 3), and the global mechanical behavior (Chapter 4) of the
unidirectional flax composite. The mechanical test machine used here is a universal machine
Instron (model 8800 Instron servo-hydraulic) with a cell force of 100 𝑘𝑁 and mechanical
self-tightening jaw, allowing a good test behavior of the specimens (Fig. 2.12).
Fig. 2.12 Instron servo-hydraulic machine
The tests were conducted at selected temperatures and strain rates, depending to the specific
aims. The test specimen is fixed by the two jaws. The experiment is carried out with a moving
target in a certain rate, for instance 2 𝑚𝑚 𝑚𝑖𝑛, or higher or lower speed in accordance with
ASTMD3039/D3039M (Standard Test Method for Tensile Properties of Polymer Matrix
Composite Materials). The force measurement is carried out in real time via a force
transducer. The micro-measurements of deformations are carried out by using Vishay strain
gauges or via an Instron extensometer, as showed in Fig. 2.13.

41
(a) Extensometer (b) Strain gauge on tensile test specimen
Fig. 2.13 Measurement deformation gauges for tensile tests
In the former case, the deformation sampling is synchronized to loading sampling by Vishay
Controller and measured by the gauge resistivity. The output voltage is numerically
transformed into deformation by the user. In the latter case – according to the small strain
theory – the deformation is calculated from the elongation measurements according to the
following relationship:
휀 =𝑙 − 𝑙0𝑙0
(2.1)
where 휀 is the strain, 𝑙is the instantaneous length and 𝑙0 is the initial gauge length (50 𝑚𝑚 or
25 𝑚𝑚, here).
Knowing the tensile force and the cross section of the test specimen, the stress is determined
according to the following equation:
𝜍 =𝐹
𝐴0
(2.2)
where 𝐹 and 𝐴0 are respectively the load and the initial cross section of the test specimen.
Young‘s modulus 𝐸 is measured from the initial slope of the linear elastic portion of the
tensile stress-strain curve. Poisson ratio 𝜈 in our UD flax composite is measured from the
initial slope of the linear part of the transversal strain versus longitudinal strain curve.
Another case where we used the Instron tensile machine was to applied creep test in tensile
configuration. Creep test involves a specimen under a constant load maintained at a constant

42
temperature. The creep test is used to observe the slow non-instantaneous deformation of a
material mechanical properties occurred in the long-term constant temperature and constant
stress. To the aim to understand the creep behavior of UD flax composite and investigate the
mechanical behavior, different constant stresses were performed with a duration time of
30 𝑚𝑖𝑛 (Chapter 4).
2.2.5 Specimens for sorption tests
Sorption tests have been conducted here as a tool to analyze the quality of the composite
(Chapter 5). Taking into account the mass and the dimensions of our laminated plates, the
component ratios of UD composite specimens are listed in the Table 2.3. Silicon has been
used to seal each edge of all the specimens, which designed to limit the effects of edges in the
sorption test. It is thus considered that the distribution of water is one-way through the
thickness of the specimen, and that the diffusion directly through the other two directions
(length & width) is negligible. The choice of specimen size was 160 𝑚𝑚 length and 110 𝑚𝑚
width.
Table 2.3 Parameters of unidirectional flax fiber composite specimens for sorption (UD110-3)
Specimen 1 Specimen 2 Specimen 3 Specimen 4
Length (𝑚𝑚) 159.5 160.5 159.5 159.5
Width (𝑚𝑚) 99 99.5 99 99
Thickness (𝑚𝑚) 1.52 1.50 1.55 1.54
Reinforcement ratio (%) 54 55 54 54
Porosity ratio (%) 11 10 9 10
Matrix ratio (%) 35 35 37 36
2.3 Preliminary analysis
2.3.1 Curing of flax/epoxy composite
Study of manufacturing parameters for characterizing properties of polymeric composite can
be conducted by a number of methods. Among these, the follow up of the glass transition
temperature 𝑇𝑔 – which is defined as the transition between the entropy and the elastic state
energy at its largest difference – can be an effective method of characterization of
physicochemical changes induced by plasticization chain scission, evolution of the free

43
volume, etc. All the polymeric components of plant fiber composites exhibit a glass transition
temperature above which the properties of the material could degrade significantly. The
evolution of the glass transition temperature of the flax composite is an indicator which is
important both as a measure of the degree of reticulation and to establish a maximal
temperature for composite use, which defines the material operational limit. When the glass
transition temperature of the composite is exceeded, certain mechanical properties may be
compromised severely. Normally, it is necessary that the application temperature for a
thermoset composite is below 𝑇𝑔 in order to assure that the mechanical stiffness and creep
resistance of the material is satisfactory. Here, the glass transition temperature was determined
by a commercial dynamic analyzer apparatus called Kinetech on which 𝑇𝑔 is deduced from
torsion stiffness versus temperature curve. The operating of Kinetech is based on the principle
as the automated ‗‗Torsion Pendulum‘‘ instrument shown in Fig. 2.14.
Fig. 2.14 Kinetech apparatus for glass transition measurement
The principle of measurement method involves applying a torsion loading with some time
relaxations and measuring the instantaneous and the relaxed torques.

44
Fig. 2.15 Glass transition measurement of flax fiber composite, the plain curves are the fit of
instantaneous torque, relaxed torque, and difference between them
This apparatus is widely used in laboratories and industries due to its relatively low cost and
handiness. Generalizations on the cure and properties of thermosetting polymers, which have
stemmed from development and application of the torsional braid analysis (TBA) technique,
have been formulated in terms of cure relationships[82][83]
. In our UD flax composite
measurements, relations existing between 𝑇𝑔 and the evolution of global properties of
composites are expressed by the following parameters: temperature were set as 2°𝐶 𝑚𝑖𝑛−1
speed growth until 160°𝐶 from room temperature, meanwhile the required torque is measured
instantaneously and after two seconds of relaxation. 𝑇𝑔 is determined on a sample of
48 𝑚𝑚 × 8 𝑚𝑚 by length and width, respectively, with a small thicknesses (typically 1 𝑚𝑚)
for different samples. The glass transition temperature can be measured at the maximum
difference between the instantaneous and relaxed torques or at the inflection point of the
instantaneous torque curves (Fig. 2.15). Herein, the first method is used as identity
comparison results.

45
Fig. 2.16 Affection of curing process on 𝑇𝑔 of pure resin, EP, and textile composite, CO (S300), three
measurements for each specimen
Through a large number of test analysis, one conclusion is there is no visible difference
amongst the curing process: 8 80°𝐶, 0.5 80°𝐶 + 1 130°𝐶 and 8 90°𝐶, whether it is
epoxy resin only (EP) or flax textile reinforced epoxy composite (CO) with same
reinforcement volume fraction, about 30% (Fig. 2.16). 𝑇𝑔 ranged from 95 °𝐶 to 100°𝐶. But
the evolution of the 𝑇𝑔 value after three successive measurements for each specimen shows
that a post–curing is needed. Finally, the curing process which has been selected for
unidirectional composite was 8 80°𝐶 for first curing then 8 80°𝐶 for post-curing.
The glass transition temperature of our unidirectional flax cured with epoxy resin 1564SP and
hardener XB3486 as composite system is listed in Table 2.4. No visible relations have been
found between the surface density of unidirectional flax plies and glass transition temperature
of their composites. But 𝑇𝑔 seems to be correlated to the ratios of different components of
composite (Fig. 2.17). It is possibly due to the fact that not only the matrix but also flax fibers
contain polymeric maters. Then the glass transition temperature of unidirectional composite
appears as a non–linear response of a complex media.
90°/8H EP 80°/30min_130°/1H EP 90°/8H CO 80°/30min_130°/1H CO 80°/8H CO0
20
40
60
80
100
120
Curing
Tg /
°C
Glasstransition
First test
Second test
Third test

46
Table 2.4 Glass transition temperature of unidirectional flax fiber composite
Plate Flax density
(𝑔 𝑚−2)
Fiber ratio
(%)
Matrix ratio
(%)
Porosity ratio
(%)
𝑇𝑔
(°𝐶)
UD70-1 78 18 79 3 87
UD70-2 78 16 81 3 85
UD70-3 78 18 76 6 82
UD70-4 78 18 80 2 81
UD70-5 78 15 81 4 84
UD110-1 125 48 40 12 88
UD110-2 125 47 44 9 96
UD110-3 125 54 31 15 97
UD200-1 181 49 40 11 89
Fig. 2.17 Effect of composite component ratio and the glass transition temperature
2.3.2 Microstructure observation
Fig. 2.18 shows transverse sections of unidirectional flax composite observed by optical
microscopy and scanning electron microscopy. In Fig. 2.18(a) we distinguish the flax fibers
are mainly organized in bundle form inside composite. It is due to the mechanical process
used to make the plies (see Fig. 2.1 and Fig. 2.2), using mainly technical fibers. Several flax
fiber bundles are coated with resin, but problems of interface (porosities all along some
bundles of fibers) can be identified. In Fig. 2.18(b) elementary fiber structure is more clearly
visible. The transverse section of the flax fiber looks like pentagonal or hexagonal as usually
observed.

47
(a) Optical microscopy (b) Scanning electron microscopy
Fig. 2.18 Microstructure observations of unidirectional flax fiber composite
The transverse dimension of flax fibers could lie in the range of 10 − 30 𝜇𝑚 and hollow
structure called the lumen in the center of fiber is compacted. Some of the elementary fibers
(but not a lot) are separated from initial bundle in the unidirectional composite. We conclude
that the used flax reinforcement is not only constituted by flax bundle but also by a low
certain proportion of elementary flax fibers.
2.3.3 Ratio of different composite components
Porosity, which is defined as air-filled cavities inside an otherwise continuous material, is a
most often unavoidable component in all composite materials, caused by the mixing and
consolidation of two discrete material components. The fiber and matrix components of long
fiber composites are primarily concerned in studies of most composites whether artificial or
biobased. However, existence of the porosity as third component should not be ignored,
especially for plant fiber reinforced polymer. Plant fibers are relatively more difficult to
impregnate by resin than artificial fibers such as glass or carbon fiber[46]
. In addition, the
presence of porosity in the composite is known to dramatically reduce the mechanical and
sorption properties of these materials[31][84][85]
. For this, the porosity ratio 𝑉𝑝 cannot be
neglected and should be taken into account when analyzing the mechanical performances of
the plant fiber composites.
For fraction measurement, input dimension parameters of experiment specimens are usually
gained from the measurements (or the manufacturer data). We conducted a measurement by a
direct method. The obtained data: length, width, thickness, mass of the flax plies, mass of the

48
composite plates, fiber density, matrix density. Reinforcement, matrix and porosity fractions
have been allowed to be calculated combining basic input parameters as the method as
showed below.
Volume ratio of reinforcement:
𝑉𝑓 =𝑣𝑓
𝑣𝑐
(2.3)
=𝑚𝑓 𝜌𝑓
𝑣𝑐
(2.4)
=𝑛𝑙𝜌𝑙
𝑠 𝐿 𝑊 𝜌𝑓
𝐿 𝑊
(2.5)
=𝑛𝑙𝜌𝑙
𝑠
𝜌𝑓.
(2.6)
Volume ratio of matrix:
𝑉𝑚 =𝑣𝑚𝑣𝑐
(2.7)
=𝑚𝑚 𝜌𝑚𝑣𝑐
(2.8)
=(𝑚𝑐 −𝑚𝑓) 𝜌𝑚
𝐿 𝑊
(2.9)
=𝑚𝑐 −𝑚𝑓
𝜌𝑚 𝐿 𝑊 . (2.10)
Volume ratio of porosity:
𝑉𝑝 = 1 − 𝑉𝑓 − 𝑉𝑚 (2.11)
= 1 −𝑚𝑐
𝜌𝑚 𝐿 𝑊 +𝑛𝑙𝜌𝑙
𝑠
(1
𝜌𝑚+1
𝜌𝑓).
(2.12)
In these relations, the basic input parameters are 𝑣 for volume, 𝑚 for mass, 𝐿, 𝑊 and for
length, width and thickness, respectively, 𝜌𝑠 and 𝜌 for surface and volume density,
respectively, and 𝑛 for the ply numbering. The subscripts𝑓, 𝑚, 𝑝, and 𝑙stand for fiber, matrix,
porosity, and layer, respectively.
The propagation of uncertainty method delimits the uncertainty on 𝑉𝑓 , 𝑉𝑚 , and 𝑉𝑝 values,
utilizing the accuracy of apparatuses. The current methods offered here make us suitable and

49
easy to use common technique to analyze the ratios of reinforcement, matrix and porosity. In
this work, special care has been taken in the measurement of the volume 𝑣𝑐 of plates
developed by thermo-compression. For better accuracy, the volume is calculated by a fitting
solution in which the procedure is to recalculate the thickness evolution of the composite
material, upper surface being not absolutely parallel to bottom surface in the one hand, and
slightly curved in both directions in the other hand (see Fig. 2.19). The plate thickness was
reconstructed through polynomial fitting method in two directions of length and width with
two-free degrees. More than twenty fitting points were used at the thickness directions each
time. Finally, the reconstructed composite volume was used for component ratio calculation
based on relations (2.5), (2.9) and (2.11). There is a small difference in component fraction
results between the thickness fitting solution and the measurement of mean thickness.
Fig. 2.19 Typical reconstruction of composite thickness evolution
At last in our unidirectional flax composite, the mean final mass density of composite 𝜌𝑐 is
close to 1.25 and the mean final volume percentage of porosity is close to 10% when the
reinforcement ratio is 55% (see Table 2.3). The fulfillment of component percentage
calculation is consistent with description above by measuring the dimensions and the mass of
composite firstly while knowing the density of matrix and reinforcement. The fiber density
(lumen cut, no humidity) deemed to be 1540 𝑘𝑔 𝑚−3 [47]. The surface density of
reinforcement is measured for each product (see Table 2.2 and Table 2.4). The matrix density
measured in the laboratory is 1140 𝑘𝑔 𝑚−3.

50
2.4 Conclusion
In this chapter, various efforts were carried out to improve the preparation of specimens and
characterize basic properties of flax fiber composite. First of all, considering the stabilities
and features of the UD composite products, flax fiber composite has been made by hot platen
method with detailed steps to prevent non necessary mistakes in the preparation progress. UD
flax composite was made with good surface condition. Specimens for microstructure
observation of OM and SEM were also prepared by optimized polishing process combining
extensive testing offered practical polish process parameters. As a result, microstructure of
UD flax composite was found. What is important to us is the tensile specimens should have a
good test condition. Based on this goal, laser cutting system was introduced into the tensile
specimen preparation and four different shapes taking into account facilitation and practicality
have been developed. For better performing tensile tests, stain gage and extensometer are
often used together. 𝑇𝑔 as an indicator for utilization of our UD flax composite has been
investigated in detail. Due to the porosity is always exist in the composite material, a global
measurement of different component ratios in the composite is developed considering that the
plane in the upper part is not absolutely parallel to the opposite part.

51
3 Chapter 3 EFFECTIVE MECHANICAL PROPERTIES OF
REINFORCEMENT
As said in Chapter 2, the reinforcement used in that study is a purely unidirectional ply of flax
reinforcement. Nevertheless, the fibers cannot be considered as perfectly aligned in one
direction, as shown in Fig. 3.1 an amount of fibers appear as ―disoriented‖. This word
―disorientation‖ used in that study refers to that phenomenon. As it is well known, the
orientation of fiber inside the composite has significant affection on the performance of
mechanical properties[86]
. Effort was made to modify previous composite theory[49]
to take
into account the complex orientation of our reinforcement. The aim was to evaluate the
effective mechanical properties of flax fiber in the composite laminates. Therefore, this
chapter will start by a presentation of a suitable method to analyze the orientation of dry ply,
with a nominal surface density 70 𝑔 𝑚2, 110 𝑔 𝑚2 and 200 𝑔 𝑚2. Then, the mathematical
formulation of our theory is presented. Hence we will discuss the results we get.
Fig. 3.1 Example of fiber disorientation into a flax ply (UD70)
3.1 Analyses of the orientation using structure tensor
3.1.1 Structure tensor theory
Structure tensors are matrix representations of partial derivatives. In the field of image
processing and computer vision, they are typically used to represent gradients, edges or
similar information. Structure tensors also provide a more powerful description of local

52
patterns and allow obtaining local orientation[87][88]
. For instance, Nouar et al. presents a direct
method using computed tomography to determine finite element models based on the real
geometry of the reinforcement[88]
. They used a structure tensors method on X-ray tomography
image analysis to separate warp and weft yarns of a 2 × 2 carbon twill weave according their
orientation. The orientations are computed thanks to the calculation of the structure tensor[87]
.
This tensor is defined for each pixel as a 2 × 2 symmetric positive matrix 𝐽, where 𝑓𝑥 and 𝑓𝑦
are the partial spatial derivatives of the image 𝑓(𝑥, 𝑦), along the principal directions 𝑥 and 𝑦,
respectively. Since the tensor is symmetric we have only three independent components in the
matrix 𝐽, written here as in operator notation:
𝐽 = *⟨𝑓𝑥, 𝑓𝑥⟩𝑤 ⟨𝑓𝑥, 𝑓𝑦⟩𝑤⟨𝑓𝑥, 𝑓𝑦⟩𝑤 ⟨𝑓𝑦, 𝑓𝑦⟩𝑤
+. (3.1)
Otherwise, the weighted inner product between two arbitrary images 𝑔 and is defined as:
⟨𝑔, ⟩𝑤 =∬ 𝑤(𝑥, 𝑦)𝑔(𝑥, 𝑦)(𝑥, 𝑦)𝑑𝑥𝑑𝑦
𝑅2. (3.2)
The window function 𝑤(𝑥, 𝑦) has important influence on the orientation calculation and
determines the spatial resolution of the representation specifying the region of interest
(ROI)[88]
. The local predominant orientation corresponds to the direction of the largest
eigenvector of the structure tensor. In the two-dimensional space, we can readily solve the
eigenvalue problem that every symmetric matrix reduces to a diagonal matrix by a suitable
coordinate transformation. However, the solution is not reached in the standard way by
solving the polynomial characteristic to determine the eigenvalues. It turns out that it is easier
to rotate the inertia tensor to the principal axes coordinate system. Then the rotation angle 𝜃 in
the considered region corresponds to the angle of local orientation:
[𝐽1 00 𝐽2
] = *cos 𝜃 sin 𝜃− sin 𝜃 cos 𝜃
+ *⟨𝑓𝑥 , 𝑓𝑥⟩𝑤 ⟨𝑓𝑥, 𝑓𝑦⟩𝑤⟨𝑓𝑥, 𝑓𝑦⟩𝑤 ⟨𝑓𝑦, 𝑓𝑦⟩𝑤
+ *cos 𝜃 −sin 𝜃− sin 𝜃 cos 𝜃
+. (3.3)
Subtraction of the diagonal elements results in:
𝐽1 − 𝐽2 = (⟨𝑓𝑥, 𝑓𝑥⟩𝑤 + ⟨𝑓𝑦, 𝑓𝑦⟩𝑤) cos 2𝜃 + 2⟨𝑓𝑥 , 𝑓𝑦⟩𝑤 sin 2𝜃 (3.4)

53
while from the off-diagonal element:
1
2(⟨𝑓𝑦, 𝑓𝑦⟩𝑤 − ⟨𝑓𝑥, 𝑓𝑥⟩𝑤) sin 2𝜃 + ⟨𝑓𝑥, 𝑓𝑦⟩𝑤 cos 2𝜃 = 0. (3.5)
The orientation angle is thus given by:
𝜃 =1
2arctan (2
⟨𝑓𝑥, 𝑓𝑦⟩𝑤⟨𝑓𝑥, 𝑓𝑥⟩𝑤 − ⟨𝑓𝑦, 𝑓𝑦⟩𝑤
). (3.6)
These orientation measures are arrays termed angular nearest-neighbor gray-tone spatial-
dependence matrices. For instance, we consider a resolution cell (ROI), to have at least eight
nearest-neighbor resolution pixels, at window size value 3 for each pixel itself standing for an
orientation needed to be calculated with image as in Fig. 3.2.
Fig. 3.2 ―a‖ and ―b‖ are calculated by nearest eight neighbors at window size three
As already said, the windows function is a key parameter to determine the final calculation
results. According Fig. 3.2, the window was set as a square with a length of several pixels.
3.1.2 Analyses of orientation of dry flax ply
First, the method describe in the above section was used to obtain the orientation of an image
created numerically. The picture is composed by horizontal lines. Each line has a one unique
grey-level. The grey-level of each line is obtained with a one-dimensional sine function with a
pulsation of 0.01. Then, the whole image is rotated by a known angle. Fig. 3.3 presents an
image where the rotation angle was 160 𝑑𝑒𝑔. Using a square window of size 21 𝑝𝑖𝑥𝑒𝑙𝑠, an
average orientation value of 159.89 𝑑𝑒𝑔 was obtained. This method is hence suitable to
obtain local orientation of a pattern in an image with correct accuracy.

54
Fig. 3.3 Picture obtained with a rotated sine signal used to determine the calculation accuracy
However, the analysis of UD flax plies is much more complex (see Fig. 3.1) and the effect of
the square window size need to be evaluated. Image of flax reinforcement get using method
described in Section 2.2.2 could be analyzing using structure tensor, and an orientation maps
could be plotted. These maps represent the local orientation of each pixel. Window sizes from
3 to 201 𝑝𝑖𝑥𝑒𝑙𝑠 with two-pixel intervals have been designed to analyze the orientations of
flax reinforcement. As an example, Fig. 3.4 shows two results obtained with the same image
and two different sizes.
(a) ROI of 3 𝑝𝑖𝑥𝑒𝑙𝑠 (b) ROI of 91 𝑝𝑖𝑥𝑒𝑙𝑠
Fig. 3.4 Orientation map obtained with two different sizes of window
Fig. 3.4(a) shows a noisy orientation maps but as the size of the ROI increase, as for
Fig. 3.4(b), the orientation is averaged and all the pixels have an average orientation (here
around 90 𝑑𝑒𝑔). This idea is confirmed by Fig. 3.5, where the maximal and the minimal
angles found in the maps was plotted versus the ROI size. These results confirmed that if the
ROI size is too large, some information about the local orientation of fiber inside flax ply will
be lost.

55
Fig. 3.5 Relationship between the maximal and minimal angle and window size (ROI)
Consequently, the orientation should be described using statistical distribution. Histograms of
the number of pixel with a certain orientation are plotted on Fig. 3.6. As displayed on
Fig. 3.6(c), when the ROI size is large (31 × 31 𝑝𝑖𝑥𝑒𝑙𝑠) the statistical distribution is highly
narrow and mainly the average value (90 𝑑𝑒𝑔) is computed. But when the ROI size is small
(3 × 3 𝑝𝑖𝑥𝑒𝑙𝑠), some artifacts appear on the distribution, see Fig. 3.6(a) where the fiber local
orientation values of 0 𝑑𝑒𝑔 and 90 𝑑𝑒𝑔 are overestimated. This phenomenon could be due to
the fact that the ROI size is small compared the technical fiber size on the image, leading to
some regions with almost uniform grey level. In that case it could be difficult to correctly
compute the gradient and therefore the calculation of the orientation is difficult. Thus as a
conclusion, the ROI has to be large enough to remove artifacts on the distribution of
orientation and small enough to get sufficient information on the distribution. Fig. 3.6(e)
shows the best compromise in term of ROI size, the quantile-quantile plot being neither
biased for low angles nor for high angles. In this work, considering filtering artifacts and not
missing too much information the ROI sizes 11 × 11 𝑝𝑖𝑥𝑒𝑙𝑠 or 13 × 13 𝑝𝑖𝑥𝑒𝑙𝑠 have been
selected (214 µ𝑚 and 253 µ𝑚, respectively), depending to the tested plies.
0 20 40 60 80 100 120 140 160 180 200 2200
20
40
60
80
100
120
140
160
180
Window size
Orie
nta
tio
n /
°
200 g/m²
110 g/m²
70 g/m²
Maximum orientation
Minimum orientation

56
Fig. 3.6 Relationship between orientation distribution and window size, top: histogram, bottom: Q-Q
plot
A smooth distribution from experiment data is considered as suitable in the following
analyzes. For instance, using this guideline, an acceptable orientation distribution function of
UD flax ply with a surface density of 200𝑔 𝑚2⁄ is plotted on Fig. 3.7 where the average
value has been shifted to 0 𝑑𝑒𝑔 for convenience. The width of the orientation distribution
function is narrow indicating that the most probable orientation is coincident with the loading
direction.
Fig. 3.7 Suitable orientation distribution function of UD flax ply with a density of 200 𝑔 𝑚−2

57
3.2 Composite theory
3.2.1 Classical model for mechanical properties of composite
The traditional model for predicting the longitudinal or transversal stiffness and strength of a
composite is based on the application of the classic "rule of mixtures‖. This rule of mixtures
can be illustrated in Fig. 3.8. The variation of the modulus is linear between the values 𝐸𝑚 of
the modulus of the matrix and 𝐸𝑓 of the modulus of the fibers, when the volume fraction 𝑉𝑓 of
the fibers varies from 0 to 1.
Fig. 3.8 Evolution of the Young‘s modulus caused by composition ratio in the composite[86]
Composite stiffness and stress can be predicted using a micro-mechanics approach termed the
rule of mixtures. This model is based on assumptions of uniform and identical deformation in
the longitudinal direction (Fig. 3.9) and the same constraint in the transverse direction in the
fiber and in the matrix.
Fig. 3.9 Representative volume element (RVE) in the composite

58
In the longitudinal direction, the total resultant force on the element equals the sum of the
forces acting on the fiber and matrix shown as below:
𝜍𝐿𝐴𝑐 = 𝜍𝑓𝐴𝑓 + 𝜍𝑚𝐴𝑚
𝜍𝐿 = 𝜍𝑓𝐴𝑓
𝐴𝑐+ 𝜍𝑚
𝐴𝑚𝐴𝑐
(3.7)
where 𝐴𝑐, 𝐴𝑓 and 𝐴𝑚 are composite, fiber and matrix cross sections, respectively and 𝜍𝐿, 𝜍𝑓
and 𝜍𝑚 are the longitudinal stress of composite, the fiber stress and the matrix stress.
Considering unit length and introducing the volume fraction 𝑉 as 𝑉𝑖 = 𝐴𝑖 𝐴𝑐⁄ for
𝑖 = 𝑚 and 𝑓, we can obtain:
𝜍𝐿 = 𝜍𝑓𝑉𝑓 + 𝜍𝑚𝑉𝑚. (3.8)
Using Hooke‘s law and assuming that the average strains in the composite, fiber, and matrix
along the longitudinal direction are equal (strain compatibility), the Young‘s modulus in
longitudinal direction can be computed according (Equation (3.9)):
𝐸𝐿 = 𝐸𝑓𝑉𝑓 + 𝐸𝑚𝑉𝑚 (3.9)
= 𝐸𝑓𝑉𝑓 + 𝐸𝑚(1 − 𝑉𝑓) (3.10)
where 𝐸, 𝜍 and 𝑉 are the modulus, stress and volume fraction, subscript 𝐿, 𝑚 and 𝑓 stand for
longitudinal direction, matrix and fiber.
In the transverse direction, the total composite displacement equals the sum of the
corresponding transverse displacements in the fiber and the matrix according to geometric
compatibility. Using the same approach considering the strain, the transverse properties could
be expressed as following[89][90]
:
𝐸𝑇 =𝐸𝑓𝐸𝑚
𝐸𝑓𝑉𝑚 + 𝐸𝑚𝑉𝑓 (3.11)
𝜍𝑇 =𝜎𝑓𝜎𝑚
𝜎𝑓𝑉𝑚+𝜎𝑚𝑉𝑓. (3.12)

59
Due to the important affection on mechanical properties of porosity existing in our UD flax
composite, porosity volume fraction is also taken into account by introducing a multiplicative
factor (1 − 𝑉𝑝)𝑥 in the rule of mixture. 𝑉𝑝 is the porosity volume ratio and 𝑥 is an efficiency
porosity exponent that quantify how 𝑉𝑝 affect the mechanical properties. The complete and
improved porosity corrected rule of mixtures model is described by following equations[49]
:
𝐸𝐿 = (𝐸𝑓𝑉𝑓 + 𝐸𝑚𝑉𝑚)(1 − Vp)x (3.13)
𝜍𝐿 = (𝜍𝑓𝑉𝑓 + 𝜍𝑚𝑉𝑚)(1 − Vp)x (3.14)
𝐸𝑇 =𝐸𝑓𝐸𝑚
𝐸𝑓𝑉𝑚 + 𝐸𝑚𝑉𝑓(1 − Vp)
x (3.15)
𝜍𝑇 =𝜍𝑓𝜍𝑚
𝜍𝑓𝑉𝑚 + 𝜍𝑚𝑉𝑓(1 − Vp)
x. (3.16)
Considering the porosity effect, some research work proposed 𝑥 = 2 gives a fitting resultfor
the experimental data in expression of composite mechanical behavior[31][91]
. We retain this
value for the unidirectional reinforcement.
In the case of unidirectional composite subjected to axial tension, the deformations of the
fiber and the matrix are assumed to be identical as an isotropic material. If we consider that
the matrix deformation at rupture (8.2% for our matrix according to the manufacture data by
Huntsman) is greater than that of fiber (3.2% maximum according to the literature[92]
. Then
matrix does not reach its breaking strain, and the tensile rupture of fibers will determine the
rupture in the composite. Therefore, 𝜍𝑚 in Equation (3.14) should reflect the constraint of
matrix at the time of rupture of the composite. Hence for correction, 𝜍𝑚𝑟 which is the stress of
matrix at fiber failure strain is used. In the case of a transverse load to the direction of the
fiber, the rule of mixture variables is also based on the isotropy of the tensile properties of the
fibers and the matrix. However, the matrix could be strained non-uniformly within composites
tested in the transverse direction. Moreover, rupture of the composite occurs either by
disruption of the matrix or by debonding the fiber/matrix interface or possibly by transverse
rupture of the reinforcement due that although this isotropy assumption is acceptable for the
matrix, the longitudinal tensile properties of most plant fibers (flax, jute…) and artificial
(carbon, aramid) are widely greater than in the transverse properties. It should be more

60
complicate and also adjusted, for simplicity, the same 𝜍𝑚𝑟 is considered to value the breaking
stress of the matrix at point of composite failure in Equation (3.16). Considering the strain
compatibility, the linear behavior of 𝜍𝑚𝑟 is estimated using the following equation:
𝜍𝑚𝑟 = 𝐸𝑚
𝜍𝑓
𝐸𝑓 (3.17)
The final equations are:
𝐸𝐿 = (𝐸𝑓𝑉𝑓 + 𝐸𝑚𝑉𝑚)(1 − Vp)x (3.18)
𝜍𝐿 = (𝜍𝑓𝑉𝑓 + 𝐸𝑚𝜍𝑓
𝐸𝑓𝑉𝑚)(1 − Vp)
x (3.19)
𝐸𝑇 =𝐸𝑓𝐸𝑚
𝐸𝑓𝑉𝑚 + 𝐸𝑚𝑉𝑓(1 − Vp)
x (3.20)
𝜍𝑇 =𝜍𝑓𝐸𝑚
𝐸𝑓𝑉𝑚 + 𝐸𝑚𝑉𝑓(1 − Vp)
x. (3.21)
A similar approach could be used to compute all the elastic properties of the composite, such
as longitudinal Poisson‘s ratio ( 𝜈𝐿𝑇 ) and the longitudinal shear modulus ( 𝐺𝐿𝑇 ), see
Berthelot[86]
for more details.
𝐺𝐿𝑇 =𝐺𝑓𝐺𝑚
𝐺𝑓𝑉𝑚 + 𝐺𝑚𝑉𝑓(1 − Vp)
x (3.22)
𝜈𝐿𝑇 = 𝜈𝑓𝑉𝑓 + 𝜈𝑚𝑉𝑚 (3.23)
3.2.2 Taking into account a statistical distribution of fiber orientation
Several models could be found in literature to give a probabilistic assessment to the
orientation of fibers in fiber reinforced composites[93]
. These works are usually done for
discontinuous fiber reinforced thermoplastics composites[94][95]
. The model is proposed here to
predict effective elastic properties of continuous fiber composite taking into account a
statistical distribution of orientation. The approach consisted in a modification of the
equations of composite theory (Equation (3.18) to Equation (3.23)) by adding statistical

61
orientation distribution function. It is assumed that all materials that are matrix and flax fiber
are isotropic and elastic materials. All plies in the composite manufactured for this study have
the same orientation (see Section 2.1.3), therefore the elastic behavior of composite materials
could be assumed as orthotropic. The linear elasticity relation can be written in the following
matrix form[86][96]
:
휀 = 𝐒𝜍 (3.24)
where 𝐒 is the compliance matrix and is defined as follow:
𝑺 =
[ 1
𝐸1−𝜈12𝐸1
−𝜈13𝐸1
−𝜈12𝐸1
1
𝐸2−𝜈23𝐸2
−𝜈13𝐸1
−𝜈23𝐸2
1
𝐸3
0 0 0
0 0 0
0 0 0
0 0 0
0 0 0
0 0 0
1
𝐺230 0
01
𝐺130
0 01
𝐺12]
. (3.25)
This compliance matrix 𝐒 in Equation (3.25) is expressed in the principal directions of
material. In other words, the loading direction is parallel (or perpendicular) to the direction of
the fibers. We have shown in Section 3.1.2 that some fibers in one ply are not aligned in the
tensile direction; hence, we need to choose a reference axis system for all the fibers in one ply
and to calculate the elastic behavior of all the fibers in that coordinate system (Fig. 3.10). It
was done by using rotation operator on the compliance matrix.

62
Fig. 3.10 Rotation by angle 𝜃 of the principal direction (𝐿-𝑇)
Adopting the usual Voigt‘s notation for stress and strain, and following the work of
Berthelot[86]
, the compliance matrix 𝐒′ in the coordinate system (1′-2′) can be expressed as
follow:
𝐒′ = 𝐓𝜀𝐒𝐓𝜎−1 (3.26)
where 𝐓𝜀 and 𝐓𝜎 are the rotation operator in Voigt notation for the strain and stress
respectively and are expressed according Berthelot[86]
.
22
22
22
sincos000cossin2cossin2
0cossin000
0sincos000
000100
cossin000cossin
cossin000sincos
T (3.27)
22
22
22
sincos000cossincossin
0cossin000
0sincos000
000100
cossin2000cossin
cossin2000sincos
T
.
(3.28)
θ
1′
2′
𝐿
𝑇

63
Combining the equations (3.25), (3.26), (3.27) and (3.28), the mechanical properties of the
laminate in the new coordinate system can be expressed as a function of the composite
properties in main directions (𝐿-𝑇). For instance the Young‘s modulus in the direction 1′ can
be computed as below:
𝑆1′1′ =1
𝐸1′=1
𝐸𝐿cos4 𝜃 +
1
𝐸𝑇sin4 𝜃 + (
1
𝐺𝐿𝑇−2𝜈𝐿𝑇𝐸𝐿
) sin2 𝜃 ⋅ cos2 𝜃 (3.29)
where 𝐸𝐿, 𝐸𝑇, 𝐺𝐿𝑇 and 𝜈𝐿𝑇 are the elastic properties of the composite compute using rules of
mixture presented in equations (3.18), (3.20), (3.22) and (3.23) respectively.
The idea of the model is to compute elastic properties of composite ply taking into account all
fiber orientations in a ply. Let‘s suppose that 𝑓(𝜃) is the probability to find a continuous fiber
with an orientation of 𝑑𝜃. Moreover we considered that several orientations of fiber could be
found in a ply. Therefore assuming that statistical orientation distribution function𝑓 exists, the
properties of ply could be defined as:
⟨𝑆𝑖𝑗⟩ = ∫ 𝑆𝑖𝑗(𝜃)𝑓(𝜃)𝑑𝜃
𝜋
2
−𝜋
2
(3.30)
Equation (3.30) defines the effective compliance properties as average operation. The
integration range is defined by the interval [− 𝜋 2⁄ , 𝜋 2⁄ ] rather than the usual range [−∞,∞]
due to the 𝜋 -periodicity of the problem. The orientation distribution function𝑓 is then
evaluated by the method described in Section 3.1.2 in a discontinuous form (Fig. 3.11). The
final expression of the effective compliance properties ⟨𝑆𝑖𝑗⟩ is therefore:
⟨𝑆𝑖𝑗⟩ = ∑ 𝑆𝑖𝑗(𝜃) ⋅ 𝐹(𝜃)
𝑁𝑏 𝑏𝑖𝑛𝑠
(3.31)
where 𝐹(𝜃) is the probability to find a fiber with an orientation between 𝜃 − Δ𝜃 and 𝜃 + Δ𝜃.

64
Fig. 3.11 Evaluation of the orientation distribution function 𝑓 by a discontinuous approach
The validation of this model was conducted by analyzing the effect of several orientation
distribution functions 𝑓 on the value of longitudinal modulus of the composite for Young‘s
modulus of fiber ranging from 0 𝐺𝑃𝑎 to 50 𝐺𝑃𝑎. The two limit cases were selected as purely
UD fiber and as totally randomly oriented fiber in a ply. The first was modeled using a Dirac
function (purely UD) and the latter by a uniform distribution. Moreover five Gaussian
distributions were selected with increasing standard deviation (5 𝑑𝑒𝑔 , 10 𝑑𝑒𝑔 , 20 𝑑𝑒𝑔 ,
30 𝑑𝑒𝑔, 100 𝑑𝑒𝑔) as plotted on Fig. 3.12.
Fig. 3.12 Sensibility to orientation distribution of fibers, from the top left to right: purely
unidirectional, normalized at 0 𝑑𝑒𝑔 with standard deviation from 5 𝑑𝑒𝑔 to 100 𝑑𝑒𝑔, and randomly
distributed.

65
As shown on Fig. 3.12, the results obtained for purely UD (black curve) is equivalent to that
obtain with classical rules of mixture (Equation (3.18)). Indeed, the longitudinal modulus of
composite increases linearly as the Young‘s modulus of fiber increases. Furthermore, the
increase of the standard deviation of the Gaussian distribution was used to model the increase
of amount of fiber disoriented in the flax ply. The performance of the composite, evaluated
here only by the longitudinal modulus, decreases as the standard deviation increase. For
example, considering a flax modulus of 40 𝐺𝑃𝑎, the composite modulus is 18.7 𝐺𝑃𝑎 if the
reinforcement is purely UD and if the standard deviation of the Gaussian distribution is set at
10 𝑑𝑒𝑔, the composite modulus drops to 12.2 𝐺𝑃𝑎. The composite modulus is reduced by
almost a third. The trends obtained here confirmed that this model could be used as a first
approximation to take into account the orientation distribution function in composite laminate
theory and will be used to assess the properties of UD flax fiber inside our composite.
3.2.3 Model sensitivity to input parameters
The sensitivity of the model to the input parameters has been assessed. We focus on that
section to the evaluation of the effective modulus of flax fiber inside the composite laminate,
and only the Young‘s modulus of the composite in the loading direction are required. Then,
only the component 𝑆11 has to be evaluated. The properties of the matrix (𝐸𝑚 , 𝜈𝑚 ), the
Poison‘s ratio of the fibers (𝜈𝑓 ) and the volume fractions (𝑉𝑝 ,𝑉𝑚 and 𝑉𝑓 ) are the input
parameters. The nominal value of each parameter is given in Table 3.1. Deviations of the
parameters are applied and of which the effect on the response is evaluated. One orientation
distribution function 𝑓 was selected from one measurement for all the calculations and it is
the one plotted on Fig. 3.7.
Table 3.1 Nominal material parameters required for the model
Matrix modulus Matrix Poisson‘s ratio Fiber Poisson‘s ratio
𝐸𝑚(GPa) 𝜈𝑚 𝜈𝑓
3 0.45 0.38
Assuming that the fiber modulus range from 0 to 80 𝐺𝑃𝑎 , the longitudinal modulus of
composite was computed (Fig. 3.13). First the volume fractions of fiber are supposed to range
from 15% to 55% and the volume fraction of porosity was kept constant at 10%

66
(Fig. 3.13(a)). Another parameter which is very important on the composite behavior is the
porosity, hence, the volume fractions of fiber are supposed to range from 0% to 20% and the
volume fraction of fiber was kept constant at 30% (Fig. 3.13(b)).
(a) Effect on the volume ratio of fiber on the composite longitudinal modulus
(b) Effect on the volume ratio of porosity on the composite longitudinal modulus
Fig. 3.13 Effect of the volume ratio on the computed longitudinal composite modulus
From both results in Fig. 3.13, general conclusions could be drawn. Flax fiber volume fraction
has huge influence on the composite mechanical behavior. The composite modulus increases
with the increase of flax fiber volume fraction. Moreover, as shown in Fig. 3.13(b), porosity
volume fraction has evident influence on the mechanical behavior of composite. For the same
level of composite modulus, flax fiber need to exhibit higher effective mechanical modulus
when the volume fraction of porosity is higher in the composite, and generally, the composite

67
mechanical behavior decreases with the increase of porosity volume fraction. These trends
encourage us to improve the volume ratio measurement as described in Section 2.3.3.
The behavior of the flax fiber inside the composite is still unknown. By the elastic model
developed in this PhD, an estimation of the Young‘s modulus of fiber in composite could be
computed. However, these computations required the use of the Poisson‘s ratio of UD flax
fiber. Here, five different Poisson‘s ratios of flax fiber has been used (0.05, 0.15, 0.25, 0.35
and 0.45) to analyze its influence on the longitudinal modulus of composite with volume
fraction of flax fiber 55% and porosity 10%, the other parameters are set according Table 3.1.
A straight forward result shown in Fig. 3.14 reflect Poisson‘s ratio of flax fiber does not
behave influence on the composite behavior as far as only the longitudinal behavior of
composite is concerned.
Fig. 3.14 Effect of flax fiber Poisson‘s ratio on the computed longitudinal composite modulus
Similar analyses could be done with the elastic properties of the matrix (𝐸𝑚 and 𝜈𝑚). Worth to
point out that the Poisson‘s ratio have less effect on longitudinal modulus of composite than
the matrix Young‘s modulus. Therefore only the effect on the latter is plotted on Fig. 3.15.
Comparing the results of Fig. 3.13 to Fig. 3.15, it appeared that the most important parameter
seems to be the volume ratio of components.

68
Fig. 3.15 Effect of matrix modulus on the computed longitudinal composite modulus
3.3 Performance of UD flax composites
3.3.1 Experimental test on UD laminate
The mechanical properties of composite were acquired from the monotonic tensile tests done
on Instron 8800. Experiment details are described in Section 2.2.4. Seven specimens have
been prepared for monotonic tensile experiments at the same strain rate about 10−4𝑠−1. UD
flax fiber composites have been made according the method detailed in Section 2.1.3. Volume
fractions of composite phases (matrix, fiber and porosity) have been computed as described in
the Section 2.3.3. From Fig. 3.16, we can see the fiber, matrix and porosity volume fraction is
about 48% , 42% and 10% , respectively. For the sake of clarity, details of the plate
parameters are listed in Table 3.2. The UD plates have similar volume fractions taking in
account error bars.
Fig. 3.16 Volume fraction of matrix, fiber, and porosity in UD flax composite plates
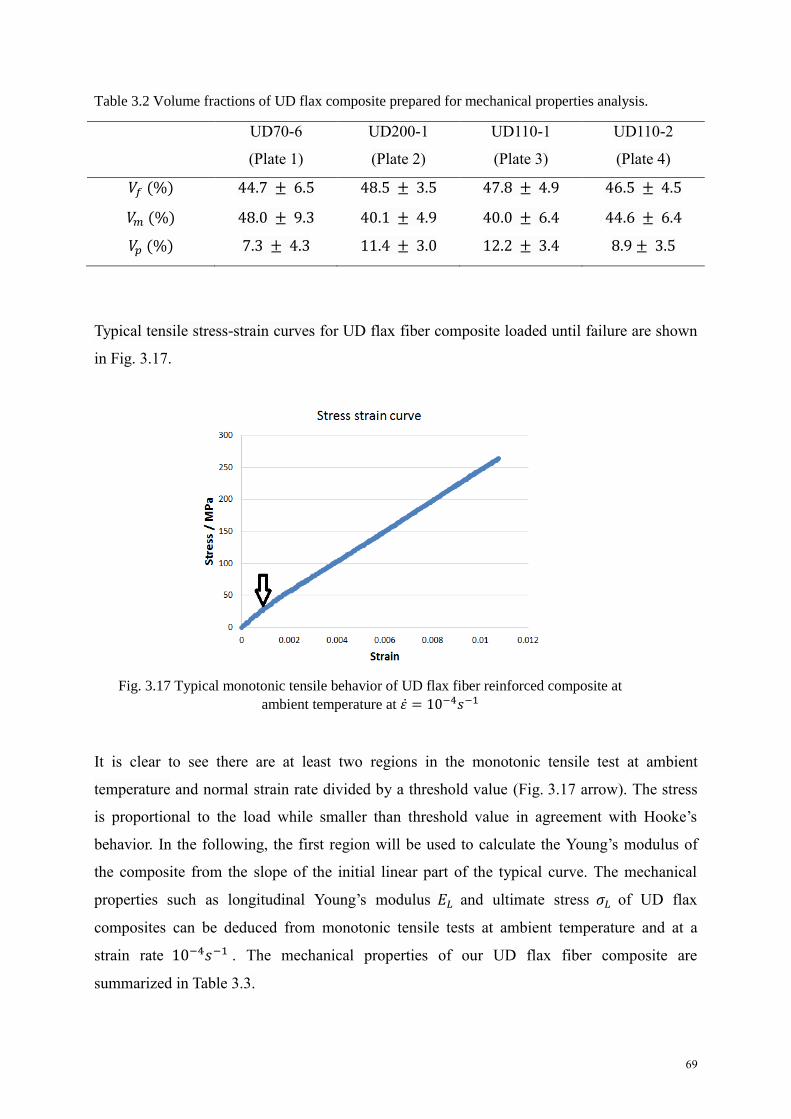
69
Table 3.2 Volume fractions of UD flax composite prepared for mechanical properties analysis.
UD70-6
(Plate 1)
UD200-1
(Plate 2)
UD110-1
(Plate 3)
UD110-2
(Plate 4)
𝑉𝑓 (%) 44.7 ± 6.5 48.5 ± 3.5 47.8 ± 4.9 46.5 ± 4.5
𝑉𝑚 (%) 48.0 ± 9.3 40.1 ± 4.9 40.0 ± 6.4 44.6 ± 6.4
𝑉𝑝 (%) 7.3 ± 4.3 11.4 ± 3.0 12.2 ± 3.4 8.9 ± 3.5
Typical tensile stress-strain curves for UD flax fiber composite loaded until failure are shown
in Fig. 3.17.
Fig. 3.17 Typical monotonic tensile behavior of UD flax fiber reinforced composite at
ambient temperature at 휀 = 10−4𝑠−1
It is clear to see there are at least two regions in the monotonic tensile test at ambient
temperature and normal strain rate divided by a threshold value (Fig. 3.17 arrow). The stress
is proportional to the load while smaller than threshold value in agreement with Hooke‘s
behavior. In the following, the first region will be used to calculate the Young‘s modulus of
the composite from the slope of the initial linear part of the typical curve. The mechanical
properties such as longitudinal Young‘s modulus 𝐸𝐿 and ultimate stress 𝜍𝐿 of UD flax
composites can be deduced from monotonic tensile tests at ambient temperature and at a
strain rate 10−4𝑠−1 . The mechanical properties of our UD flax fiber composite are
summarized in Table 3.3.

70
Table 3.3 Properties of UD composites obtained from tensile test at ε = 10 − 4 s−1.
Parameters UD70-6
(Plate 1)
UD200-1
(Plate 2)
UD110-1
(Plate 3)
UD110-2
(Plate 4)
𝑉𝑓(%) 44.7 ± 6.5 48.5 ± 3.5 47.8 ± 4.9 46.5 ± 4.5
𝐸𝐿(𝐺𝑃𝑎) 27.8 ± 1.7 28.7 ± 2.5 – 28.7 ± 1.2
𝜍𝐿(𝑀𝑃𝑎) 275.6 ± 5.5 255.3 ± 16.3 – 312.0 ± 22.0
These values will be considered as input parameters in the next section in order to compute
the effective properties of flax fiber inside the composite.
3.3.2 Flax fiber properties using statistical distribution function
To apply the model described in Section 3.2.2 to estimate the properties of present UD flax
reinforcement the properties of the matrix need to be evaluated. The properties have been
chosen according manufacturer datasheet given in Table 3.4. The other mechanical properties,
namely the Poisson‘s ratio of fiber and the Poisson ratio of matrix have been chose according
Table 3.1. Furthermore, the volume fraction of fiber and the volume fraction of porosity have
been set at 46.9% and 10.0% corresponding to the average value obtained experimentally.
The volume fraction of matrix is then 43.1%.
According the work described in Section 3.1.2, suitable statistical distribution function to
describe the orientation of fibers in a ply is remembered in Fig. 3.18.
Fig. 3.18 Best orientation distribution function of UD flax ply with a surface density of
78 𝑔 𝑚−2

71
Table 3.4 Key data of the used epoxy matrix (by Huntsman)
𝐸𝑚(𝐺𝑃𝑎) 𝜍𝑢(𝑀𝑃𝑎) 휀𝑢(%)
2.93 ± 0.07 62 ± 2 8.2 ± 0.2
Following the same approach that in Section 3.2.3, taking into account the statistical
distribution function that describes the orientations of flax fiber in flax ply, the effect of the
Young‘s modulus of fiber (ranged from 0 𝐺𝑃𝑎 to 100 𝐺𝑃𝑎) on the composite modulus in the
loading direction can be evaluated and are plotted, see Fig. 3.19. Such diagram allows
computing the effective properties of flax according the Young‘s modulus of composite that
have been measured in Section 3.3.1. The effective Young‘s modulus of the unidirectional
reinforcement was finally measured as 86 𝐺𝑃𝑎.
Fig. 3.19 Effect of the effective flax Young‘s modulus on the longitudinal composite modulus taking
into account the orientation distribution function of UD flax fiber ply
It could be compared to previous flax composite studied in our laboratory (Fig. 3.20). The
abbreviations QUD and S respectively correspond to yarn reinforcement and balanced textile
twill 2 2 reinforcement (see Appendix). The associated number is the basic unit area weight
of fabrics by manufacturer (𝑔 𝑚−2). Worth to point out that the effective modulus of both
kinds of flax reinforcement (balanced or QUD) shows an ultimate value to approximately
72 𝐺𝑃𝑎 . However, the fiber orientation was not considered in the previous study[49]
. As
expected, UD and QUD flax fiber reinforcements have better mechanical efficiency than

72
textile reinforcements under the longitude tension.
Fig. 3.20 Effective mechanical properties of flax reinforcement studied in our team
3.4 Conclusion
In this chapter, unidirectional flax composite has been made by the hot platen press method.
Mechanical properties of the composite have been analyzed. A new model of the theory not
only taking into account porosity efficiency and priority rupture of fibers but also taking flax
fiber orientation into account in standard experiment situations has been established and
applied. UD flax ply exhibits the highest effective mechanical properties compared to the
previous flax reinforcement (balanced or quasi-unidirectional) used in our laboratory.
However, worth to point out those strong assumptions has been done concerning the material
(elastic isotropic for matrix and fibers, elastic orthotropic for composite). Nevertheless, our
new approach paves the way to replace the shrinkage used in Cherif et al.[49]
by the in-situ
fiber orientation as a key parameter to analyze the efficiency of polymer reinforcement by
plant fibers. The elasticity of flax composite will be discussed in the next chapter.

73
4 Chapter 4 PHENOMENOLOGICAL ANALYSIS
Chapter 3 has presented a model to predict the main mechanical parameters of unidirectional
plant fiber composites based on the rule of mixture and the distribution of both the
reinforcement orientation. This approach cannot predict the evolution of the mechanical
response of the material between initial loading (purely elastic) and failure loading. What is
the interest is that one of the major practical problems that we have to face is some changes of
the mechanical behavior for different regions (including the elastic region) depend upon
thermodynamic and kinetic factors. Indeed, plant-based reinforced polymers often present
nonlinear behavior under tensile loading. In order to study this general behavior here, the
mechanical characteristics of UD flax composite are studied in a variety of practical
conditions. Moreover, plant fibers have significant variations in the diameter, defects content,
and maturity which will pass to the finished UD composite product and which makes a study
on the impact on the rigidity and strength a challenge. The aim of Chapter 4 is to analyze the
mechanical behavior with a phenomenological point of view. The analysis is based on a
previous phenomenological model developed in our team.
4.1 Effect of thermodynamic and kinetic factors
4.1.1 Global view of UD flax composite at tension condition
Typical stress-strain tensile test curves for UD flax fiber composite loaded to the point of
breaking are shown in Fig. 4.1 and Fig. 4.2. The later gives a value of aspect ratio in
transverse and longitudinal strain. Here firstly, typically monotonic and repetitive progressive
load (RPL) curves are presented in Fig. 4.1. It is clear to see there are at least two regions in
the monotonic tensile test at high speed and ambient temperature which divided by a
threshold value (arrows in Fig. 4.1(c) and Fig. 4.1(d)). The stress is linearly proportional to
the load while smaller than threshold value in agreement with Hooke‘s behavior. Here in our
UD composite, the first region will be used to calculate the Young‘s modulus of the
composite. Taking into account the cross section dimensions of the specimens, the Young‘s
modulus is calculated from the slope of the initial linear part of the typical curve. In this work,
all the tests have been done several times when possible (generally three) in order keeping the
mean curve for each tested set of parameters. The stress-strain curve is strongly influenced by
any of the following conditions such as temperature, the rate of loading, constituents

74
construction, specimen moisture content and reinforcement morphological characteristics i.e.
orientation and length in the specimen. Thus, a large spread in the mechanical behavior values
can be observed from one to another. Before tensile test, the cross section (width and
thickness) of each specimen is measured with a micrometer.
(a) Monotonic instruction (b) Repetitive progressive load instruction
(c) Monotonic tensile test (d)Repetitive progressive load test (RPL)
Fig. 4.1 Typical tensile experiment curve at normal speed and ambient temperature.
From the Fig. 4.1(d), we can see that not only the Hooke‘s (elastic) behavior but also
nonlinear behavior appears visibly when the load is cycled with a nominal value above the
threshold load. Besides, three regions divided by obvious change in rigidity will be discovered
and analyzed due that the non-elastic deformation appearance determined by the cycle value
we set considering test environment especially when it is above the threshold transition.

75
(a) Stress vs transverse and longitudinal strain (b) Transverse strain vs longitudinal strain
Fig. 4.2 Typical transverse response to tensile loading (UD110)
4.1.2 Apparent effect of temperature
Each composite material has a temperature range suitable for its utilization. The UD flax
composite has an average 𝑇𝑔 value of 92°𝐶 (see Section 2.3.1). We use this value as an
indicator to design different loading conditions, especially in relation to the temperature
factor. Three temperature conditions, 20°𝐶, 50°𝐶, and 80°𝐶 respectively, are designed for UD
composite within tensile test, taking in account the same order of magnitude of strain rate.
Repetitive progressive loading (RPL) tests can represent us viscous information during the
tensile experiments. Viscoelastic effects can be captured during different loading cycles.
Fig. 4.3 – based on RPL test – illustrates the overall impacts caused by temperature on the
mechanical properties of UD composite. There is a large change in the non-elastic
deformation between cycles which is more obvious at high temperature as shown in
Fig. 4.3(a) showing higher strains for the same load at 80°𝐶. In Fig. 4.3(b), it tells us the
composite ultimate stress deceases while the temperature increases. The failure strain which is
determined by the point of the breaking stress is also affected by the temperature effect. In
general, the Young‘s modulus of UD flax composite decreases while the temperature is raised,
as shown in Fig. 4.3(c).

76
(a) RPL tests at different temperature conditions
(b) Evolution of ultimate stress and strain (c) Evolution of Young‘s modulus
Fig. 4.3 Effect of temperature on UD flax composite (UD110)
4.1.3 Apparent effect of strain rate
Effect of strain rate is synthetized on Fig. 4.4. As we can see in Fig. 4.4(b) where strain rate
5 × 10⁻⁴𝑠−1 is corresponding to 10 𝑀𝑃𝑎 𝑠−1 , lower stain rate when the tensile test
performed shows a lower ultimate stress. In Fig. 4.4(c), the ultimate strain has a tendency to
decrease when decrease the stain rate of test sample. However, the Young‘s modulus
decreases comparing order of magnitude 10−4𝑠−1 with 10−5𝑠−1 and for the lower strain rates
10−7𝑠−1 (Fig. 4.4(d)).

77
(a) RPL curves (b) Ultimate stress
(c) Ultimate strain (d) Young‘s modulus
Fig. 4.4 Effect of strain rate on UD flax composite (UD110)
Behavior of UD flax composite are also represented in Fig. 4.5 where we can see that not only
two regions but three emerge when the tensile test performed at high temperature 80°𝐶 or
very low test speed 0.01 𝑀𝑃𝑎 𝑠−1 . These three regions will be conformed in the next
sections.
(a) With high temperature test (b) With low strain rate
Fig. 4.5 Appearance of three-region behavior for unidirectional flax composite (UD110)
4.1.4 Evolution of apparent rigidity
Just as the case of humidity increases, it is shown that as the temperature increases or loading

78
speed decreases, the ultimate stress of UD flax fiber composite decreases. There is a big
decline in ultimate stress of both more than 100 𝑀𝑃𝑎 in the highest temperature 80 °𝐶 or
lowest loading speed 0.01 𝑀𝑃𝑎 𝑠−1 . Meanwhile the global behavior of composite is also
clearly impacted by such factor (loading environment of temperature/strain rate), especially at
high temperature of 80°𝐶 shown in Fig. 4.5(a) and at loading speed of 0.01 𝑀𝑃𝑎𝑠−1 shown
in Fig. 4.5(b). It intended to indicate three regions in the deformation behavior.
(a) Secant modulus in load and reload cycles in all cases
(b) Difference of secant modulus between load
and reload at different temperature
(c) Difference of secant modulus between load
and reload at different strain rate
Fig. 4.6 Evolution of modulus of UD composite during RPL test in different conditions (UD110)
As shown in the Fig. 4.5, it is clear to see the unload curves and reload curves do not overlap.
The evolution of the rigidity is studied on Fig. 4.6. For each loop 𝑙, the secant modulus is

79
calculated for the maximal stress level 𝜍��; for each following loop 𝑙 + 1, the secant modulus
is also calculated for the same stress level 𝜍��. Let us call the first value ―rigidity during load‖
and the second value ―rigidity during reload‖. From Fig. 4.6(a), we can see that the secant
rigidity firstly decreases then increases for all RPL tests, except at the test condition at 80°C.
For that temperature, the experiment condition is close to the glass transition temperature of
UD flax composite (𝑇𝑔: 92°𝐶). This could be the main reason which could account for why
there is no increase in rigidity for 80°𝐶 condition in the initial region at tensile deformation,
in addition, the maximal stress level of first loop, 𝜍1, could exceed the yield stress. Obviously,
the rigidity increases undergo reload for each cycle. The increase of rigidity amongst cycles
after reload is higher in the low temperature interval of 20°𝐶 than that of 50°𝐶 and 80°𝐶, as
shown in Fig. 4.6(b). For loading speed conditions, inversely, the increase rate of rigidity is
higher at high strain rate which is 5 × 10⁻⁴ 𝑠−1(corresponding to 10 𝑀𝑃𝑎 𝑠−1) than at the
other two situations (1 𝑀𝑃𝑎 𝑠−1 and 0.01 𝑀𝑃𝑎 𝑠−1) shown in Fig. 4.6(c). Furthermore, we
can see that there is a clear decrease of secant modulus at loop 3 (Fig. 4.6(b) and Fig. 4.6(c))
for conditions of higher temperatures (50°𝐶and 80°𝐶) and lower loading speeds (1 𝑀𝑃𝑎 𝑠−1
and 0.01 𝑀𝑃𝑎 𝑠−1 ). After reload, rigidity has a visible increase, which shows us three
apparent regions exist for mechanical behavior of UD flax composite in general case.
4.1.5 Evidence of permanent strain in second and third regions
Creep tests are effective measures for slow plastic deformation. Creep behavior at each region
of UD flax composite expected in our work has been investigated. Constant stress 25 𝑀𝑃𝑎,
130 𝑀𝑃𝑎 and 200 𝑀𝑃𝑎 , respectively, following with a 0 𝑀𝑃𝑎 were performed on each
region with a duration time of 30 𝑚𝑖𝑛 at an ambient temperature.

80
(a) 25 𝑀𝑃𝑎 (first region) (b) 130 𝑀𝑃𝑎 (second region) (c) 200 𝑀𝑃𝑎 (third region)
Fig. 4.7 Creep test at three levels of load corresponding to expected regions of UD110
Fig. 4.7 shows the obvious changes of strain at constant stress in the three expected regions in
stress strain curve (see Fig. 4.5). In Fig. 4.7(a), when the constant stress 25 𝑀𝑃𝑎 was loaded
on the specimen, the initial strain of the plateau increased a little fast firstly, and then with a
slow increase until reached about 0.106 % from 0.098 % with an average increase rate
10−8𝑠−1 . In Fig. 4.7(b), the same test with 130 𝑀𝑃𝑎 was carried on the second region,
clearly, a bigger deformation come out which is approximate 0.59 % from the start point,
meanwhile, with an average increase rate 10−7𝑠−1 reached about 0.65 % . The same
observation can be done in the third region Fig. 4.7(c) which is from 1.02 % to 1.11 % with
an average increase rate 10−5𝑠−1. In addition, when we performed unload to 0 𝑀𝑃𝑎 with a
following duration 30 𝑚𝑖𝑛, it is apparent that the UD composite restored to the initial state for
25 𝑀𝑃𝑎 creep test. Oppositely, the creep tests at 130 𝑀𝑃𝑎 and 200 𝑀𝑃𝑎 show irreversible
deformation at about 0.07 % and 0.23 %, respectively. These observations show the evidence
of viscous effects in the supposed elastic region and other viscous effects in the non-elastic
regions.
Finally, it is necessary to note that there is distinctive changes in behavior between the first
and the second or third region. The evolutions between the different regions could be caused
by the microstructural properties where the tilt angles of the microfibrils adjust (reorientation)
when the load is added on the composite and which could have an important influence on the
mechanical properties[97]
. In particular, the tensile deformation beyond the yield point does
not deteriorate the stiffness of either individual cells or foils[98]
. This indicates that there is a
dominant recovery mechanism that reforms the amorphous matrix between the cellulose
microfibrils within the cell wall, maintaining its mechanical properties. This ―stick-slip‖
mechanism provides a plastic response similar to that effected by moving dislocations in

81
metals[98]
. For lots of plant fiber composites, such behavior evolution could also be due to
macroscopic adjustment at the scale of fibers, or other phenomena arising from the different
components. In order to help understand the elastic phenomena that govern the mechanics of
plant fiber composites, a phenomenological study is proposed later.
4.2 Previous phenomenological model
A viscoelastoplastic model about flax fiber composite behavior at 20℃ has been developed in
our team with the help of the specialist Fabrice Richard[47]
. The parameters of this model have
been identified on quasi-UD flax yarn and quasi-UD flax textile reinforcements based on
twisted yarn[47]
. quasi-UD flax yarn are constituted by ―big‖ non-woven yarns (more than
20 𝑡𝑒𝑥) aligned in one direction only. Quasi-UD flax textile is constituted by ―small‖ woven
yarns (24 𝑡𝑒𝑥), aligned in two perpendicular directions: warp and weft. The weft yarns –
which are ten times fewer than warp yarns - are necessary for the ply handiness.
The total strain is partitioned in an elastic part 𝑒 (instantaneous reversible strain) and an
inelastic part in which is the sum of viscoelastic contribution ve (time-dependent
reversiblestrain) and viscoplastic contribution vp(time-dependent irreversiblestrain):
= e+ve+vp. (4.1)
In the context of thermodynamics, physical phenomena can be described with a precision
which depends on the choice of the nature and the number of state variables. The state
variables, also called thermodynamic or independent variables, are the observable variables
and the internal variables. The standardized framework[47]
assumes that mechanical behavior
is obtained when two potentials are defined: a free energy density to define state laws and a
dissipation potential to determine flow direction. Based on experimental results of ultimate
stress, ultimate strain and Young‘s modulus, and that elasticity and inelastic behaviors are
uncoupled, the two potentials are proposed. The state laws can then be written as:
=
e (4.2)
Xi =
αi (4.3)
where αi and 𝑋i variables stand for inelastic phenomena, is the mass density, and is the
Cauchy‘s stress.

82
The evolution of internal variables is expressed as:
in =
= ve + vp (4.4)
αi = −
Xi. (4.5)
The system of ordinary differential equations has been solved with a homemade simulation
software, MIC2M[47]
, using an algorithm based on the Runge-Kutta method. An inverse
approach is used to extract the parameters from the experimental strain measurements. This
approach consists of an optimization problem where the objective is to minimize the gap
between the experimental strain εm ( 𝑚 ―measured‖) and the numerical result εc
(c ―calculated‖), which can be defined as:
Θ∗ = 𝑎𝑟𝑔𝑚𝑖𝑛 f(Θ) (4.6)
f(Θ) =∑(
εc(Θ, ti) − εm(ti)
Nεmax)
2N
i=1
(4.7)
where the vector Θ = [Θ1, … , Θn] collects the unknown parameters to be identified and 𝑓(Θ)
is the cost function. The ith data point corresponds to the acquisition time𝑡i. 𝑁 is the number
of the acquisition times in the experimental test. εmax is a weighting coefficient defined as the
maximum strain values. The minimization problem was solved using an algorithm based on
the Levenberg-Marquardt method coupled with genetic approach implemented in MIC2M
software[47]
.
To determine if the information is suitable for reliable parameter estimation Θ∗, a practical
identifiability analysis was performed on results[47]
. This identifiability analysis is based on
local sensitivity functions. Such functions quantify the relationship between the outputs and
the parameters of the model. Poor identifiability of the model parameters can be due to a
small sensitivity of the model results to a parameter, or by a linear approximation dependence
of sensitivity functions on the results with respect to the parameters. High collinearity index
indicates correlation among the parameters. Parameter subsets with collinearity index smaller
than five are considered as good and experiment values above twenty are critical (see Poilâne
et al.[47]
for detail). This approach led our team to model the mechanical behavior of the flax
fiber composite by a phenomenological model with kinematic hardening taking viscosity into
account. The viscoelastoplastic model was identified in the case of uniaxial test of UD flax

83
yarn/epoxy composite at 20℃ [47]. The particularity of the reinforcement is the disorientation
of constitutive fibers due to the use of twisted yarns.
Based on experimental results, the free energy and dissipation potential are proposed in the
following equations:
(e, αi) =
1
2E(e)2 +
1
2∑Ciαi
2
3
i=1
(4.8)
= ve+vp =1
2n(− X1)
2 +1
2K< 𝑓 >2
(4.9)
f = |− X1−X2−X3| − 𝑌 +3
2C3X3
2
(4.10)
where is the mass density, 𝐸 and Y are the Young‘s modulus and the initial yield stress,
respectively, 𝑛 and 𝐾 are viscosity coefficients corresponding to elastic and plastic
phenomena, respectively. 𝐶1 is the viscoelastic stiffness. 𝐶2 , 𝐶3 and 3
are hardening
coefficients. 𝐶2 characterizes linear kinematic hardening. 𝐶3 and 3
refer to nonlinear
kinematic hardening coupled to a contraction of elastic region in order to imporove the
unloading modeling in RPL tests. The symbols <> denote Macauley‘s brackets such as
< 𝑥 > = 𝑥 if 𝑥 ≥ 0 and < 𝑥 > = 0 in other cases. The state laws for mechanical behavior
become:
= E εe
(4.11)
Xi = Ciαi
(4.12)
and the evolution of internal variables defined becomes:
ve+vp =1
(− X1) +
< 𝑓 >
K𝑠𝑖𝑔𝑛(−X2 − X3)
(4.13)
α1 =1
(− X1)
(4.14)
α2 =< 𝑓 >
K𝑠𝑖𝑔𝑛(−X2 − X3)
(4.15)
α3 =< 𝑓 >
K[𝑠𝑖𝑔𝑛(−X2 − X3) −
3
C3X3].
(4.16)
From a rheological point of view the model proposed in Poilâne et al.[47]
is for elastic
contribution a linear spring E, and for viscoelastic contribution a classical Kelvin-Voigt model
which comprises a linear viscous damper and a linear spring connected in parallel. A more
complex model is required for viscoplastic contribution, it consists in adding two-kinematic

84
hardenings: a linear kinematic hardening and a non-linear kinematic hardening. In addition, a
coupling between translation and contraction of the elastic region during loading is added.
Finally, seven inelastic parameters have to be identified: viscosity coefficient in elastic region
(MPa s), viscoelastic stiffness C1(MPa), initial yield stress σY (MPa), viscosity coefficient
in plastic region K (MPa s), kinematic hardening coefficient C2(MPa), non-linear hardening
C3(MPa), and non-linear hardening 3. The eighth parameter, namely the Young‘s modulus,
was chosen from experimental measurement (E = 26.9 GPa). The inverse method approach
was used to extract constitutive inelastic parameters from the strain measurements on two
tests:
test A: repetitive progressive loading in tension,
test B: creep in tension at 29 MPa.
The RPL was chosen to activate mainly viscoplastic phenomena and the creep test at 29 MPa
(under initial yield stress) was chosen to activate mainly viscoelastic phenomena. Fig. 4.8 –
coming from Poilâne et al.[47]
– shows RPL simulation (left) and creep simulation (right). The
used parameter has been identified by UD flax yarn composite tests at room temperature and
standard speed ( = 1e−6𝑠−1). The total strain (in red) is partitioned by three contributions
(elastic in black, viscoelastic in dotted line, viscoplastic in blue). Elastic contribution is
naturally activated all over the test. Viscoelastic contribution is very low at room temperature
and standard speed. Creep test at 29 MPa mainly shows elastic contribution, as expected, and
viscoplastic contribution is major over 50 MPa.
(a) RPL test (b) Creep test at 29 MPa
Fig. 4.8 Simulation response according to elastic contribution, viscoelastic contribution and
viscoplastic contribution, the tests were conducted on UD flax yarn composite at room condition and
standard speed

85
(a) Creep test at 126 MPa (b) Relaxation test at 0.33%
Fig. 4.9 Experimental data and simulation, the tests were conducted on unidirectional twisted
yarn/epoxy composite at room condition and standard speed
At room temperature, the proposed model allows us to correctly simulate the behavior of flax
yarn reinforced epoxy composite in repetitive progressive loading, creep test and relaxation
test (see Fig. 4.9). In conclusion, for ―unidirectional‖ twisted yarn/epoxy composite at room
condition and standard speed, the first region of monotonic tensile curves is quasi-elastic and
the second region is viscoelastoplastic. This model cannot describe the three-region
mechanical behavior described in Section 4.1 but constitutes a good base to analysis purely
unidirectional flax epoxy composite. This analysis will be treated in the next section.
4.3 Toward a more global model
The phenomenological model presented in previous section did not need ―strengthening
parameter‖ to correctly simulate standard flax fiber composite in normal condition. The idea
of a strengthening phenomenon is due to one of the stronger assumption researchers make in
case of bast fiber reinforced polymer: the possibility for microfibrils to realign themselves
during longitudinal loading (microfibril being the main component of bast fibers as we seen in
Section 1.3), even when fibers are trapped inside the matrix. The re-orientation of microfibrils
has been demonstrated experimentally on elementary fiber and bundle of fibers under tensile
test[97]
. It has been correlated to experimental tensile curve by an inverse approach using finite
element model[99]
. Consequently, the first need to test our model for more complex cases than
previous one was to improve the direction of the fibers inside composite. Indeed, it is clear
that twisted flax yarn as reinforcement is not the best candidate to activate the reorientation of
microfibrils inside a composite. It is known that in case of twisted yarn some of the fibers are
oriented into the main direction, but globally fiber orientation follows a statistical distribution

86
with major part of fibers aligned not in the longitudinal direction. Inside the purely
unidirectional flax ply (FlaxtapeTM
), the fibers are mainly oriented in the longitudinal
direction (see Fig. 2.7 and Fig. 3.1). In this product, there are no any weft yarn and no any
sewing to link the fibers together. The reinforcement inside the final composite products is
constituted by a mix of elementary fibers and technical fibers (bundle forms) as described in
Chapter 2. Consequently, these reinforcements are mainly oriented in the same direction in the
composite, inside we find ―optimal organization‖ in term of mechanical behavior analysis.
We have previously showed that temperature impacts the apparent behavior of flax fiber
reinforced polymers[48]
. Firstly, the rigidity of epoxy matrix decreases with increasing
temperature. Particularly, the mechanical properties of thermosetting media drastically
decrease when temperature nears to the glass transition temperature 𝑇𝑔 of the material.
Secondly, high temperature activates viscoelastic properties of bast fibers[100]
. One
macroscopic consequence of temperature increase is to make possible a description of tensile
curve by three apparent regions as we shown in Section 4.1. Note also that the increase of
specimen moisture itself promotes viscous effects of flax composite and makes also visible a
three-region apparent tensile curve[48]
. Temperature and humidity decrease the material
rigidity. Another way, more simple, is to decrease the strain rate of the tensile test. When the
strain rate is low, viscous effects are more visible[47]
. The mechanisms which are responsible
to viscous effects are easier to activate with ―low strain rate‖, ―high testing temperature‖ or
―high specimen moisture‖. Eventually, to test our model with unidirectional flax composite
we choose repetitive progressive load at four different stress rate ( 10 𝑀𝑃𝑎 𝑠−1 to
0.01 𝑀𝑃𝑎 𝑠−1 ). For the lower speed, experiment curve is constituted by three apparent
regions instead of two, the first region being quasi-elastic and the third region showing
increase tangent rigidity.
Firstly, we have tried to describe the increasing apparent rigidity by the viscous parameters
combining the previous model. Note that the increase of apparent tangent modulus can be
described by the viscous parameters of previous constitutive model. The previous
phenomenological model was possible to fit on experimental data with the same set of
inelastic parameters (but different values).

87
Table 4.1 Elastic and inelastic material parameters for unidirectional flax/epoxy composite (UD110)
Parameter Definition Identified value
𝐸 (𝑀𝑃𝑎) Young‘s modulus 3.15 × 10⁴
𝜂 (𝑀𝑃𝑎 𝑠) Viscosity coefficient in elastic region 1.98 × 10⁶
𝐶1 (𝑀𝑃𝑎) Viscoelastic stiffness 7.72 × 10⁴
𝜍𝑌 (𝑀𝑃𝑎) Initial yield stress 2.38 × 101
𝐾 (𝑀𝑃𝑎 𝑠) Viscosity coefficient in plastic region 1.92 × 10⁷
𝐶2 (𝑀𝑃𝑎) Kinematic hardening coefficient 3.92 × 10⁴
𝐶3 (𝑀𝑃𝑎) Nonlinear hardening 4.26 × 10⁴
𝛾3 Nonlinear hardening (recall) 1.62 × 10³
Fig. 4.10 shows the best fits we obtained for both extreme strain rates. The eight identified
parameters are given in Table 4.1. It is clearly visible that the test simulation at the lowest
stress rate does not correlate very well with the experimental data (Fig. 4.10(b)). In that case,
the increase of apparent tangent modulus – visible on fourth and fifth load – was not possible
to simulate. Moreover, depth look on Fig. 4.10(a) shows that this behavior was neither
possible to simulate on seventh load of the test at 10 𝑀𝑃𝑎 𝑠−1 . Something like a
strengthening effect has not been taken into account with our model for a strain above 1%
(depending on the stress rate). Consequently for this under-estimation of apparent rigidity, the
permanent strains predicted by our model of are lower than the experimental ones, loop after
loop.
Fig. 4.10 RPL experiment and simulation with the phenomenological model

88
Testing the idea of using strengthening parameter seems now a good option to improve the
phenomenological model. Fig. 4.11 shows the first result we have obtained with the same data
as used for Fig. 4.10 when we ―replace‖ the nonlinear hardening 𝐶3 and 𝛾3 with two
strengthening parameters. The fitting of experimental data by simulation is clearly improved
at the lowest stress rate (Fig. 4.11(b)).
Fig. 4.11 RPL experiment and new simulation with two strengthening parameters
Although this new approach is not totally validated at this day – it is necessary now to mix the
two models with both non-linear hardening parameters and strengthening parameters – it
offers an elegant solution because it seems easy to correlate the cyclic strengthening to a
reinforcement reorientation by longitudinal loading in case of unidirectional flax composite.
In a near future, analysis of such upgraded model will help at exploring the origin of the
mechanical behavior of plant-based reinforced organic polymers.
4.4 Conclusion
In conclusion, an apparent cyclic strengthening in tensile is not possible to simulate with our
previous viscoelastoplastic model. For an adapted material and specific tests, the difference
between experimental data and simulation – once the viscoelastoplastic parameters identified
– is noticeable. Low stress rates in tensile were used here, but we make the assumption that
high temperature tests or tensile tests on moisturized specimens should offer good
possibilities also. Finally, we propose as strong assumption that the addition of a
strengthening phenomenon to the initial model[47]
offers a good solution to improve
simulation.

89
5 Chapter 5 WATER SORPTION OF UNIDIRECTIONAL
FLAX FIBER COMPOSITE
Not only flax fibers but also most of plant fibers such as sisal, bamboo and wood, etc. mainly
comprised of cellulose are sensitive to changes in atmospheric conditions, particularly
moisture[101][102]
. There is a limited resistance to moisture sorption because of their
hydrophobicity. Swelling by water uptake can lead to micro cracking and low dimensional
stability of the composite and decrease the mechanical properties[103]
. In addition, plant fibers
are easy to be infiltrated or wetted with polar water, on the contrary, not easy to be accessed
by non-polar resin and which results in an interface which is not as good as artificial fibers
with mature crafts manship. These problems represent a major obstacle for composite
materials reinforced by plant fibers. It is therefore important to characterize the phenomenon
sorption behavior of moisture of the plant fibers. The aim here is to investigate the water
sorption behavior of UD flax fiber composite.
Sorption test is a technique used to study the uptake of moisture of a material. It is intended to
measure the amount of water absorbed by the sample over the time to a potential level of
saturation, the speed of water penetration into the material, and the sorption kinetics.
Experimentally, measuring the water sorption of a material is performed by a gravimetric
analysis. This method consists in measuring the water content absorbed as a function of
exposure time. Sorption test is very useful in plant fiber reinforced polymer, because it offers
the opportunity to analysis quality of composite production (efficiency of fiber treatment,
compatibility between reinforcement and matrix…).
The first step is to remove any traces of moisture within the material. For this, the samples are
placed in an oven for 22 hours at a temperature of 80℃. To ensure unidirectional sorption,
the edges of the samples can be sealed by a high temperature silicone layer with a negligible
water sorption (< 1%). Taking into account the mass of the silicone border, the mass of the
sample in this state is measured and recorded as 𝑊0. After oven-dry step the samples are
submerged in water at a temperature stabilized at 20℃ and humidity 45% according to the
standard test method ASTM D5229/D5229M[104]
. A value of the sample mass is carried out at
regular intervals to determine the rate of water absorbed versus time. The average amount of
absorbed moisture in a material is measured, taken as the ratio of the mass of the moisture in

90
the material to the mass of the oven-dry material and expressed as a percentage. The water
sorption ratio 𝑀 at time 𝑡 can be evaluated by the relative weight uptake as follows:
𝑀 =𝑀𝑡 −𝑀0
𝑀00
(5.1)
where: 𝑀t = current specimen mass, 𝑀00 = oven-dry specimen mass, 𝑀0 = mass of oven-dry
specimen sealed with silicon.
5.1 Mechanism of water sorption in flax fiber reinforcement
As described in the Section 1.3, flax fibers are mainly composed of cellulose (including
crystalline and amorphous cellulose) and hemicelluloses with multiple hydroxyl groups
(OH) on the glucose chain. Cellulose has hydroxyl groups which allow it to form hydrogen
bonds with water. Fig. 5.1 illustrates an example of the water adsorption mechanism by a
glucose molecule (basic molecule of the cellulose). The glucose molecule contains three
hydroxyl groups, and three water molecules are attracted to the hydroxyl groups to form
hydrogen bonds. Hydrophilicity of plant fibers is mainly due to the hydroxyl groups (OH) on
the surface of the molecules. With a ratio of three hydroxyl groups per glucose repeat unit the
amount of water that can be absorbed is substantial[105]
.
Fig. 5.1 Adsorption of water hydrogen bonding to hydroxyl groups in a cellulose molecule
Besides the moisture adsorption of water molecules on the surface of the cellulose fibers,
other two mechanisms also play roles in moisture uptake. One is the capillary action through
the lumen and another is capillary bridges between the fibers[106]
. The interactions between
fiber and water originate from the non-crystalline region and extend to the crystalline
region[107]
. However, lignin mainly comprised of aromatics[108]
has little effect on water

91
sorption. The interaction of cellulose fiber with water is enhanced by tiny cracks formed on
the fibers and, the cracks allow penetration of water inside enable the cellulose molecules-
bonding that make up its walls. The water penetrates the cracks on the fiber, searching new
cellulose chains, which increases the surface area of the fiber resulting in a greater water
contact with the cellulose. During exposure to the water, the cellulose fiber swells, its volume
increases, mainly in the transverse direction.
5.2 Mechanism of water sorption in polymer
Generally speaking, the equilibrium solubility of water in typical polymer is very small and a
limiting form of Flory‘s equation could make estimation as expressed below[109]
:
𝛿 = 𝑒−*1.34+𝑣
𝑅𝑇(𝑘1−𝑘2)
2+
(5.2)
where δ is the volume fraction of liquid absorbed at equilibrium, 𝑣 is the molar volume of
liquid, R is the universal gas constant, T is the absolute temperature, and k1 and k2 are the
solubility parameters of the liquid and polymer respectively. For the commonly used
polymers, the equilibrium solubility of water will range from about 0.02 to 0.2% by wt.
Hence the uptake of water in amounts much greater than these values must be attributed to
other causes. In our lab previous studies, thermoset epoxy system based on Araldite LY5150
associated with an amine hardener Aradur 5021 and an accelerator XB3471 give an
equilibrium solubility of water 3% by weight at a stabilized temperature 20°C[49]. Fedoras
proposed the diffusion rate of liquid depends on the cavity[109]
. Firstly, water diffuses into the
polymer a rate which depends on the geometry of the test specimen and the chemical nature
of the polymer and then after some time the water contacts inclusion which will be dissolved.
When the inclusion first begins to dissolve, the solution is relatively concentrated, and which
make an enhancement in the increase of diffusion rate of water. The increase of porosity
volume is equal to the water exist in the polymer. In our lab previous observation, the water
uptake performance of pure epoxy resin in the sorption process is closed to Fickian behavior
which will be described below.

92
5.3 Fickian diffusion model
5.3.1 Fick’s laws
A simple model to describe the diffusion of a solvent into a solid material is given by Fick‘s
laws (1855)[110]
. They are based on the assumption that the flow of the penetrant (water for
example) in the material is proportional to the concentration gradient. Fick's first law relates
the diffusive flux to the concentration under the assumption of steady state. It postulates that
the flux goes from regions of high concentration to regions of low concentration, with a
magnitude that is proportional to the concentration gradient (spatial derivative), or in
simplistic terms the concept that a solute will move from a region of high concentration to a
region of low concentration across a concentration gradient. The rate of diffusion is
characterized by the diffusion coefficient 𝐷 . Thus, the Fick‘s first law in one (spatial)
dimension is expressed by the following equation.
J = −Ddφ
dx
(5.3)
where 𝐽 is the ―diffusion flux‖, of which the dimension is amount of substance per unit area
per unit time (mol m2s−1); D is the diffusion coefficient or diffusivity, its dimension is area
per unit time (m2s−1); φ (for ideal mixtures) is the concentration, of which the dimension is
amount of substance per unit volume (mol m−3); x is position (m). 𝐷 is proportional to the
squared velocity of the diffusing particles, which depends on the temperature, the viscosity of
the fluid, and the size of the particles. The negative sign in Equation (5.3) indicates that the
flow is directed from high concentration areas to low concentration areas. In two or more
dimensions the gradient operator ∇ can be used which generalizes the first derivative,
obtaining:
J = −D∇φ. (5.4)
The Fick‘s second law involving time predicts how diffusion causes the concentration to
change with time. It is a partial differential equation in one dimension written as below:
div J =dφ
dt
(5.5)
= −D∂2φ
dx2.
(5.6)

93
The diffusion coefficient and equilibrium sorption of penetrant in the materials are key
parameters in the part of considering the behavior in the Fickian diffusion. For the utilization
of the Fick‘s second law, several hypotheses have been implemented:
1. the temperature and moisture distributions inside the material are uniform,
2. the moisture content and the temperature of the environment are constant.
To achieve the points above, rigorous sorption experiments are performed with optimization
of test procedures in order to avoid unnecessary errors. The material is exposed to the
environment on one side or on two sides with both sides being parallel.
5.3.2 Common sorption types
The overall effect can be modeled conveniently considering only the diffusional mechanism
in polymeric media[111][112][113][114]
. According to the diffusion behavior of relative mobility of
the penetrant and of the polymer segments, there are three different categories of diffusion
behavior in polymeric:
Case I or Fickian diffusion, in which the rate of diffusion is much less than that of the
polymer segment mobility. The equilibrium inside the polymer is rapidly reached and
it is maintained with independence of time.
Case II (and Super Case II), in which penetrant mobility is much greater than other
relaxation processes. This diffusion is characterized by the development of a boundary
between the swollen outer part and the inner glassy core of the polymer. The boundary
advances at a constant velocity and the core diminishes in size until an equilibrium
penetrant concentration is reached in the whole polymer[102]
.
Anomalous or Pseudo-Fickian the former diffusion occurs when the penetrant mobility
and the polymer segment relaxation are comparable. It is then, an intermediate
behavior between Case I and Case II diffusion. The latter diffusion curves resemble
true Fickian curves inasmuch as they do not exhibit any inflection in slope. The initial
portion of the curves is linear, but only over a small part of the total concentration
change, the approach to final equilibrium is very slow.

94
These three main cases of diffusion can be distinguished theoretically by the shape of the
sorption curve represented by:
M
M∞= ktn
(5.7)
where 𝑀 is the moisture content at time 𝑡 ,𝑀∞ is its maximum moisture content at the
equilibrium state, and 𝑘 and 𝑛 are the diffusion kinetic parameters. The diffusion exponent 𝑛
indicates the case of diffusion. Diffusion obeys Fickian law, while 𝑛 is equal to 0.5. Other
mechanisms has been established for diffusion phenomenon in polymers and categorized
based on the exponent n, as follow:
n < 0.5 pseudo-Fickian,
n = 0.5 case I,
0.5 < 𝑛 < 1 anomalous,
n = 1 case II,
n > 1 super case II.
The major sorption curves are as shown in Fig. 5.2.
Fig. 5.2 ―Non-Fickian‖ or ―anomalous‖ sorption curves compared with Fickian-type curves[115]

95
Two models able to describe two-stage sorption types – two-phase model and Langmuir‘s
model – have gained important applications and concerns in the composite technology
community[116][117][118][49]
. They will be presented later.
5.3.3 Diffusion, sorption, and permeability coefficients
Using the assumption of Fick‘s laws described previously the percentage moisture content as
a function of time can be calculated from the following equation[119][120][121][122]
:
M−M0
M∞ −M0= 1 −
8
π2∑
1
(2n + 1)2exp *−
(2n + 1)2π2Dt
h2+
∞
n=0
(5.8)
which is obtained by integrating the solution to Equation (5.6)[115][123]
over the thickness of
plate, . Sorption ratio of penetrant in the solid material as a function of square root of time
can be characterized by two zones: an initial linear region followed by a plateau curve versus
the abscissa in the Fickian diffusion. For the initial part (𝑀 𝑀∞⁄ smaller than 0.6) the initial
slope (𝑡 < 𝑡𝑥) is constant, which is illustrated in the following equation and Fig. 5.3:
M −M0
M∞ −M0=4
h√Dt
π
(5.9)
where is the thickness of specimen, 𝑛 is the summation index, 𝑀0 is the initial moisture
content (for the oven-dry specimens, the value 𝑀0 is zero), 𝐷 is the diffusion coefficient
which is a key parameter complies with the equation as below in the initial part of the sorption
curve.

96
Fig. 5.3 Illustration of the relationship between the initial slope part and the moisture content with the
square root of time[121]
In addition, the mass square of absorbed water varies linearly with the immersion time 𝑡 in the
initial part. The diffusion coefficient 𝐷 in Fickian law by Equation (5.9) is transformed as
below:
𝐷 =𝜋
16𝑡((M −M0)
M∞ −M0)
2
(5.10)
= π(𝜃
4𝑀∞)2
(5.11)
where the coefficient 𝜃 is the slope of the linear part in the sorption curve when the abscissa is
the square root of time (as in Fig. 5.3). For the second half-sorption – 𝑀 𝑀∞⁄ upper than 0.6 –
Shen et al.[121]
proposed the following approximation:
M−M0
M∞−M0= 1 − exp [−7.3 (
Dt
h2)0.75
]. (5.12)
In the case of epoxy matrix, due to its hydrophobic nature the amount of water uptake is
negligible. The increasing water sorption is caused, among other factors, by the higher
hydrophilic nature of flax fiber compared to the epoxy matrix, the greater interfacial area
(capillary effect comparing the epoxy matrix only), and the presence of percolated porosities
when occurs[49]
. Solubility as related to chemical nature of penetrant and polymer, is the
capacity of a polymer to uptake a penetrant. Here, the sorption coefficient 𝑆 which defines

97
volume of penetrant exists in per unit volume of polymer with per unit pressure is calculated
using the following equation:
S =Me
M00
(5.13)
where 𝑀𝑒 is the mass of the penetrant at equilibrium swelling and 𝑀00 is the initial mass of
the specimen as described above. The permeability coefficient, 𝑃, is defined as volume of the
penetrant which passes per unit time through unit area of polymer having unit thickness, with
a unit pressure difference across the system. The permeability coefficient which implies the
net effect of sorption and diffusion is given by the relation[124]
:
P = DS. (5.14)
Typical units for 𝑃 are (𝑐𝑚2𝑠−1𝑃𝑎−1), those units × 10−10 are defined as the barrier the
standard unit of 𝑃.
5.4 Model for two-stage sorption type
5.4.1 Two-phase model
The previous sorption results in our laboratory about textile flax yarn composite encouraged
us to analyze the sorption behavior with a two-phase model[116][49]
. In this model, the moisture
transport has also been successfully predicted and interpreted. The two-phase model consists
of two Fickian diffusions in parallel. Both the Fickian diffusion models involve separate
diffusion coefficient ( 𝐷1 and 𝐷2 ) and saturation levels (𝑀1∞ −𝑀1
0) and (𝑀2∞ −𝑀2
0) ,
respectively, which can be represented by the equation as below:
M−M0 = (M1∞ −M1
0) (1 −8
π2∑
1
(2n + 1)2exp *−
(2n + 1)2π2D1t
h2+
∞
n=0
)
+(M2∞ −M2
0) (1 −8
π2∑
1
(2n + 1)2exp *−
(2n + 1)2π2D2t
h2+
∞
n=0
)
(5.15)
with
M∞ = M1∞ +M2
∞ (5.16)
M0 = M10 +M2
0. (5.17)

98
𝑀0, 𝑀10 and 𝑀2
0 are the initial moisture of the test specimen and two Fickian phases. After
oven drying we consider these parameters as null. The sum of the two moisture uptake of
diffusion gives out the total moisture uptake in the tested specimen in which one of the
Fickian diffusion is faster and in dominance in regard to another, as described in Fig. 5.4.
Fig. 5.4 Two-phase model[49]
5.4.2 Langmuir’s model
This model developed by Carter, and Kibler is based on the Langmuir theory of adsorption on
surface with the idea assuming the moisture uptake is dominated by the mobile and bound
water molecules[116][117][118]
. The free mobile molecules diffuse with a concentration and stress
independent diffusion coefficient 𝐷𝛾 and are absorbed (become bound) with a probability per
unit time γ at certain sites (e.g. porosity or hydrogen bonding). Molecules are emitted from the
bound phase, thereby becoming free mobile, with a probability 𝛽 per time unit.
The total moisture uptake in an initially dry one-dimensional specimen satisfies the following
coupled set of equations:
M−M0 = (M∞ −M0) (β
γ + βeγty(t) +
β
γ + β(e−βt − e−γt) + 1 − e−βt)
(5.18)
where
y(t) = 1 −8
π2∑
1
(2n + 1)2exp[−(2n + 1)2kt]
∞
n=0
(5.19)
where
k = 1 −π2Dγ
h2.
(5.20)

99
5.5 Factors that affect sorption performance in composite material
The sorption behavior of water in composite reinforced by plant fiber depends on several
parameters. Besides, the chemical and physical properties of plant fibers and matrix have
fundamental impact on the sorption behavior, both the internal structure of composite such as
fraction of components (matrix, fiber, porosity), fiber orientation, interface quality, etc., and
the external environment e.g. temperature, humidity, etc., have obvious influence on the
sorption performance of water into plant fiber composites. Kreze et al.[125]
reported that, for
cellulose fiber forming polymers, the influence of the crystalline regions (their size and
orientation) on the adsorption character is less important than that of the amorphous regions,
the size and organization of porosities, and the interaction properties of the surface. In long
unidirectional flax fiber/resin composite, the structure is heterogeneous and anisotropic, so the
diffusion coefficient is not the same in all directions. The penetration of water inside
composite material is governed by different mechanisms involving diffusion of water
molecules inside porosities (and micro cavities present between the polymer chains), capillary
transport in porosities and defects at the fiber/matrix interface. The latter is important in case
of poor interfacial adhesion between the fibers and the matrix – derived from a poor
wettability or incomplete impregnation of the fibers by the matrix – and when the detachment
of the matrix/fibers has begun. In order to promote the use of plant fiber composite materials,
vary properties of them should be clearly understood. This is one of the reasons why we study
sorption performance of our UD flax fiber composite.
5.5.1 Influence of environmental conditions
The water sorption is a process of diffusion phenomena that are thermally activated. Sreekala
et al.[126]
investigated oil palm fiber reinforced phenol formaldehyde (PF) composites and oil
palm/glass hybrid fiber reinforced PF composites at different sorption temperature (30°C,
50°C, 70 °C and 90°C) and showed results that upon reinforcing PF resin with oil palm fiber,
a large increase in sorption (10 wt%) takes place and thereafter it decreases. The lowest
sorption was observed for composite having 40 wt% fiber loading. Beyond 40 wt% fiber
loading the sorption again increased. The decreased water sorption could be due to the
increased fiber-matrix adhesion according sorption results. The value globally increases with
increasing temperature. However, the value shows its maximum at 30°C except in the case of
40 wt% fiber loaded composite in which case maximum sorption is observed at 90°C. The

100
lowest sorption in this case is observed at 50°C . In addition, Chen et al.[127]
showed
equilibrium moisture content of bamboo/vinylester composites increase with the increasing
relative humidity.
5.5.2 Effect of composite structure and treatment of fiber
Shanks et al.[128]
reported that flax fiber washed in sodium hydroxide 30°C for 1 h or using
butyl acrylate (BA) as polymerization initiator give a lower sorption of water compared with
other untreated systems of polylactic acid with flax fibers composite. In our team, Cherif et
al.[46]
studied effects of the conventional textile treatments of woven flax on the water sorption
of their composites. Results show that textile treatment with bleach, mercerization and leach
can decrease the moisture uptake for the similar fiber and porosity component textile flax
fiber composites. In the study of Arbelaiz et al.[129]
about short flax fiber reinforced
polypropylene, water uptake increases with the increasing proportion of flax fiber content and
water uptake show a slight decrease by the 5 wt% epolene E43-modified for fiber. In the
structure of hemp fiber reinforced unsaturated polyester composites, Dhakal et al.[130]
give a
clear results of water sorption by unsaturated polyester reinforced by 3, 4 and 5 layers of
hemp fiber reinforced specimens, corresponding to 0 , 0.15 , 0.21 and 0.26 fiber volume
fractions, respectively, immersed at room temperature for 888 h. The saturation has been
measured to be 0.88, 5.63, 8.16 and 11%, respectively. Besides, compared with the room
temperature above, the same original specimens influenced by temperature have a
distinguishable increase in the water sorption at 100°C which reach 1.95 , 7.37 , 9.12 and
13.5%, respectively.
5.5.3 Effect of sorption on composite mechanical properties
Moisture sorption exerts big influence on the tensile mechanical properties, especially for
plant fiber composite such as flax as reinforcement. Assarar et al.[45]
analyzed the influence of
water ageing on tensile mechanical properties of flax composites processed with epoxy resin
prepreg and glass fiber epoxy composites and damage events. Results showed that the
ultimate stress decreases as immersion time for flax fiber composites as for glass fiber
composites – 13% during the first day and 9% during the first ten days, respectively – but the
ultimate strain increases for the flax fiber composite, which is not the case for the glass fiber
composite. As shown in Fig. 5.5, decrease of tensile mechanical property performances is
very obvious for flax fiber composite comparing with glass fiber composite over time.

101
Fig. 5.5 Evolution of the normalized Young‘s modulus according to the normalized immersion
time[45]
The dramatic decline in mechanical properties of bio-based composite is mainly due to the
aged reinforcement and degradation of fiber/matrix interface region rather than the polymer.
According to the report of Baschek et al.[131]
, though pure polymers having different or
opposite mechanical change ways by water aging at low and high temperatures, there is no
such large proportion of the decline in the mechanical properties (Young‘s modulus). For
instance at low moisture content from 0.4 to 1.2 %𝑤𝑡, PES and PA12 show a slight increase
in the changes of Young‘s modulus at temperature 77 K, inversely, a notable decrease appears
at 293 K. In the study of Dhakal et al.[132]
, water sorption proportion does not match a linear
relation with the tensile mechanical property change of hemp/unsaturated polyester
composite. For fiber volume fraction 0 and 0.26 (water uptake 0.88and 11%, respectively)
the ultimate tensile stress increases, on the contrary it decreases for fiber volume fraction 0.15
and 0.21 (water uptake 5.63 and 8.16%, respectively).
5.6 Water sorption of UD flax composite
5.6.1 Description and procedure
Our experiment has been done with common water at standard laboratory atmosphere, an
atmosphere (environment) having a temperature of 23 ± 2℃ and a relative humidity of
50 ± 10%. In our case, the samples are taken out from the water bath and tissue papers are
used to dry the samples surfaces meticulously each time. The samples were re-immersed in
water to permit the continuation of the kinetic of sorption until saturation in excess water was
established. When the weight reaches the saturation point, which means the weight gain are

102
nearly constant. We can obtain the saturation state of moisture gains in the sorption test 𝑀∞.
Fig. 5.6 shows the percentage of water absorbed for four UD samples after immersing water
ageing at 20℃, as a function of square root of immersing time.
Fig. 5.6 Moisture uptake of four UD flax composites.
The moisture uptake seems to increase linearly with the square root of time and gradually
approaches the equilibrium plateau. The curves show that UD flax composite specimens
rapidly gain much more moisture during the beginning part (the first stages: 0 − 2 𝑑𝑎𝑦𝑠) with
a faster rate of moisture uptake comparing the plateau part which could be considered
reaching the equilibrium at a certain value, where no more water was absorbed and the
content of water in the composites remained the same.
5.6.2 Diffusion mechanism
To identify the diffusion mechanism and kinetics in our UD specimens, the analysis was
performed base on the shape of the sorption curve and adjusting experimental data to the
equation as below:
𝑙𝑛 (M
M∞) = 𝑙𝑛 k + n 𝑙𝑛 t
(5.21)
which is derived from Equation (5.7).

103
In Equation (5.21), the constant values 𝑛 and 𝑘 are determined by linear regression analysis.
The exponent value of 𝑛 indicates the type of sorption transport mechanism, while the
parameter, 𝑘, represents the extent of interaction between the water and UD flax composite,
which is showed in Fig. 5.7 and Table 5.1 with specific values.
Fig. 5.7 Plot of sorption case for UD flax/epoxy composite
The values of diffusion coefficient 𝑛 are very similar for all the specimens and they are close
to the value 𝑛 = 0.5 (Table 5.1). The values of 𝑘 exhibit the trends similar to sorption results,
i.e., these results in general according to this descending sequence: Sample 4, Sample 2,
Sample 1, Sample 3. For some other organic solvents and polymer systems reported by
Aminabhavi et al.[133]
, values of 𝑘 could increase systematically with increasing temperature.
Table 5.1 Diffusion constant of UD flax composite (UD110-3)
𝑛 𝑘 × 103
Specimen 1 0.517 1.1
Specimen 2 0.513 1.2
Specimen 3 0.535 0.8
Specimen 4 0.503 1.4

104
From the results listed in the Table 5.1, all the 𝑛 values can be clearly rounded about 0.5.
Consequently, considering small experiment error water sorption behavior of UD flax/epoxy
composite could be known as a Fickian diffusion mechanism. The same behavior that
moisture uptake in plant fiber reinforced polymers follows a Fickian law was reported for
other plant fiber reinforced polymers[126][127]
.
5.6.3 Diffusion, sorption, and permeability coefficients
Table 5.2 shows the values of diffusion, sorption and permeability coefficients of UD flax
composites. It is clear from Table 5.2 that the permeability coefficient is larger than
2.00 × 10⁻⁷ 𝑚𝑚2𝑠−1 𝑃𝑎−1 except for Sample 3. The different penetration may be due to
the development of microcracks in the interface and the bulk of the material. The different
porosities existing in the composite may also play a role. The development of microcracks
makes possible peeling and surface dissolution of the composite in the sorption environment.
Table 5.2 Sorption parameters for UD flax/epoxy composite, Fick‘s model (UD110-3).
Diffusion
𝐷 × 107(𝑚𝑚2𝑠−1)
Sorption
𝑆 (𝑔 𝑔−1)
Permeability
𝑃 × 107(𝑚𝑚2𝑠−1𝑃𝑎−1)
Saturation
𝑀∞ (%)
Specimen 1 9.40 0.225 2.12 22.5
Specimen 2 9.93 0.217 2.15 21.7
Specimen 3 7.75 0.197 1.53 19.7
Specimen 4 10 0.224 2.24 22.4
5.6.4 Water uptake by composite components
As we know, there are three main phases in our UD flax composite: unidirectional flax fibers,
epoxy resin, and porosities. However, the moisture uptake in the saturation equilibrium for
each phase is quite different. We consider it is 3% for our epoxy resin matrices in water
uptake by weight, and assume the porosities in our UD composite are all full filled up by the
water when it is reached equilibrium state meanwhile utilize the density value of water of
1000 𝑘𝑔 𝑚−3. For UD reinforcement, it could be different in water uptake. The proportions
of water uptake by each phase in the composite were calculated here as showed in Fig. 5.8.
where:
M∞ = Mf∞ +Mm
∞ +Mp∞ (5.23)

105
where 𝑛 stand for reinforcement, 𝑚 matrix, and 𝑝 porosities.
Fig. 5.8 Water sorption ratio of each component in UD flax composite specimens.
5.6.5 Discussion
The diffusion constants 𝑛 and 𝑘 (Table 5.1) seem to indicate a Fickian mechanism of sorption.
Now, we compare the experimental diffusion results with theoretical predictions in order to
discuss deviation from the regular Fickian model described by the Equation (5.8). In our
laboratory previous studies, two phases (see Section 5.4) were considered to be used in the
analysis of sorption behavior in flax textile composite[49]
and which give a favorable result
about the water diffusion in the composite. Another famous sorption model is the Langmuir‘s
model (also exposed in Section 5.4). The plain curve on Fig. 5.9(a), calculated by using
Equation (5.8), shows the theoretical water uptake behavior adjusted with Fickian diffusion
model for the specimen 1. Respectively, the plain curve on Fig. 5.9(b) and Fig. 5.9(c) show
the theoretical water uptake behavior adjusted from two phases Fickian model and
Langmuir‘s model. The three curves are very similar, which suggests the Fickian model to be
correct.

106
(a) Standard Fick‘s model fitting (b) Two-phase Fick‘s model fitting
(c) Langmuir‘s model fitting
Fig. 5.9 Typical comparison between three sorption models for UD flax composite (Specimen 1).
For the example of two phases Fick‘s model applied to specimen 1, the theoretical diffusion
coefficient is 𝐷1 = 9.45 10−7 𝑚𝑚2𝑠−1for one phase and 𝐷2 = 0.18 10
−7 𝑚𝑚2𝑠−1 for the
second one (Table 5.3). 𝐷1 is very close to the diffusion coefficient obtained by standard
Fick‘s model, which is 𝐷 = 9.40 10−7 𝑚𝑚2𝑠−1 (Table 5.2). The sorption coefficients are
𝑀1∞ = 22.4% and 𝑀2
∞ = 0.44%, respectively, and 𝑀 = 22.5% when measured by the Fick‘s
model. In fact, for the tested unidirectional composites, one phase of two-phase Fick‘s model
is insignificant (Table 5.3). The two phases Fickian sorption was developed with idea that
there is one slow sorption kinetic and one quick kinetic of sorption, simultaneously. In our
study, the only case for which the slower phase was detected is the sorption kinetic of
specimen 1 (Table 5.3), the diffusion coefficient 𝐷2 being very lower than 𝐷1.

107
Table 5.3 Sorption parameters for UD flax/epoxy composite, two-phase Fick‘s model (UD110-3).
Phase 1 Phase 2
Diffusion
𝐷1 × 10⁷(𝑚𝑚2𝑠−1)
Saturation
𝑀1∞(%)
Diffusion
𝐷2 × 10⁷(𝑚𝑚2𝑠−1)
Saturation
𝑀2∞(%)
Specimen 1 9.45 22.4 0.18 0.44
Specimen 2 9.93 21.7 5.52 0
Specimen 3 7.75 19.7 8.02 0
Specimen 4 10 22.3 9.61 0.05
For the same specimen 1, the sorption parameters measured by Langmuir model are
= 9.66 10−7𝑚𝑚2𝑠−1 , 𝑀 = 22.5% , β = 3.06 ⋅ 10−6𝑠−1 and γ = 1.09 ⋅ 10−6𝑠−1
(Table 5.4). The kinetic is supposed Fickian when γ tends to zero which can be analyzed from
Equation (5.18) and is confirmed in case of UD composite both by Fig. 5.9 and Table 5.4.
Considering now that γ is the probability per unit of time for a molecule to be bond and β is
the probability per unit of time for a molecule to be mobile[117][118]
, both two-phase Fickian
model and Langmuir model explain that the water is very mobile inside the tested composite.
Table 5.4 Sorption parameters for UD flax/epoxy composite, Langmuir‘s model (UD110-3).
Phase 1 Phase 2
Diffusion
𝐷 × 107(𝑚𝑚2𝑠−1)
Saturation
𝑀∞(%)
Beta value
𝛽 × 106(𝑠−1)
Gamma value
𝛾 × 106(𝑠−1)
Specimen 1 9.66 22.5 3.06 1.09
Specimen 2 10.77 21.8 2.74 0.70
Specimen 3 6.25 19.6 3.38 1.26
Specimen 4 11.31 22.5 2.37 0.57
5.7 Conclusion
Finally for the tested unidirectional composite, the penetration of water is very easy and very
rapid. The ratio of porosity and reinforcement is not the only cause, because similar
composite in term of component ratio were tested in our team with lower diffusion and

108
sorption coefficients, as we can see in Fig. 5.10. The main differences between UD composite
and others in Fig. 5.10 are:
reinforcement not twisted for unidirectional composite (Section 2.1.2),
high level of pectin for unidirectional composite (Section 1.3.2),
no mesh in the reinforcement as in textile composite (Section 2.1.2),
reinforcement not treated for unidirectional composite (Section 2.1.2).
In conclusion, we assume that the water penetrates rapidly in the flax and in all linear open
channels (both constituting the first phase), which is enhanced by high level of pectin and low
interface efficiency. The second phase is constituted by the matrix itself and the close
porosities, the latter being very small compared to the total volume.
Fig. 5.10 Typical comparison of sorption curves for several flax/epoxy composites, Langmuir's model
has been applied.

109
CONCLUSION
L'objectif principal de ce travail de doctorat
était de caractériser le comportement d‘un
composite unidirectionnel de fibre de lin du
point de vue de ses propriétés mécaniques.
Le composite de fibre de lin purement
unidirectionnel (le renfort est constitué de
fibres de lin unidirectionnelles, la matrice
est une époxyde) a été fabriqué en
optimisant les paramètres du procédé. Des
méthodes multiples (analyse
thermogravimétrique, microscopie optique
et électronique, et mesure de température de
transition vitreuse, etc.) ont été utilisées
pour caractériser les propriétés de base du
renfort de lin et du composite associé. Pour
le pli unidirectionnel, l‘analyse
thermogravimétrique montrent que les
fibres de lin ont une stabilité thermique
jusqu‘à 160°𝐶 . Le taux de perte de poids
maximal se produit à environ 330°𝐶 . La
microstructure du composite de lin montre
que les fibres sont organisées en faisceaux
ou sous forme de fibres élémentaires
distribuées aléatoirement. La température de
transition vitreuse mesurée se situe entre
80°𝐶 et 100°𝐶 , selon le pourcentages des
différentes constituants. La mesure globale
des fractions volumiques des différents
composants du composite lin
unidirectionnel développée en combinant
les dimensions et la masse des plaques tout
en connaissant la densité de chaque
In this PhD work, the main objective is to
characterize the behavior of unidirectional
(UD) flax fiber composite at the aspects
of mechanical properties. Purely
unidirectional flax fiber composite
(reinforcement is unidirectional flax
fibers, matrix is epoxy) has been
manufactured considering affection of
process parameters. Multiple methods
(thermogravimetric analysis, optical
microscopy, scanning electron
microscopy and glass transition
temperature measurement etc.) have been
used for characterizing basic properties of
flax reinforcement or it‘s composite. For
the unidirectional FlaxtapeTM
,
thermogravimetric analysis shows that
flax fibers have thermal stability when the
temperature is lower than 160 °C.
Maximum weight loss rate occurs at
about 330°C. The microstructures of flax
composite show that flax fibers exist in
buddle forms or in elementary fibers
randomly distributed in the matrix. 𝑇𝑔tests
give results that UD flax fiber composite
herein is approximately between 80°C-
100°C, depending on the constituent
fractions. Global measurement of
different component ratios in UD flax
composite has been developed combining
measuring the dimensions and the mass of
plates while knowing the density of each

110
composant. Un soin particulier a été pris
dans la mesure du volume des plaques
composites élaborées par thermo-
compression. L‘enveloppe surfacique de la
plaque composite a été reconstruite
numériquement, car elle n'est pas plane.
La distribution d‘orientation du renfort joue
un rôle important dans les propriétés
mécaniques du composite. J‘ analyse dans la
thèse la désorientation des plis
unidirectionnels à l‘aide d‘un traitement
d‘image et de la notion des tenseurs de
structure. La distribution statistique
d‘orientation du renfort au sein du pli a été
obtenue en mesurant les orientations locales
des fibres.
Un modèle permettant d‘établir les
propriétés effectives du renfort fibreux a été
développé en prenant en compte le taux de
porosités ainsi que la distribution
d‘orientation des fibres. Après avoir
introduit le paramètre d‘orientation dans la
loi des mélanges, nous montrons que le
renfort de lin unidirectionnel possède des
propriétés effectives dans l‘axe meilleures
que le renfort torsadé d‘un composite textile
quasi-unidirectionnel testé par ailleurs au
laboratoire, pour des fractions volumiques
comparables. Ces propriétés sont par
ailleurs cohérentes avec celle des
composites associés, le composite
component. Special care has been taken
in the measurement of the volume of
composite plates developed by thermo-
compression. Precisely, the composite
plate surface was reconstructed with a
software due to it is not flat.
Orientation distribution of UD flax fiber
play an important role in the mechanical
behavior performance. I analyzed the
disorientation of UD flax ply
reinforcement by optical measurement
combining to structure tensor method.
Statistical distribution of reinforcement
orientation was obtained by using image
analysis of local orientation of fibers.
Effective mechanical properties of fibrous
UD reinforcement identification theory
has been developed by taking not only the
efficiency porosities but also UD flax
fiber orientation distribution into account.
Once I introduced the orientation
parameter into the rule of mixture model,
we shows that unidirectional flax fibers
exhibited a higher effective mechanical
properties in longitudinal tension aspect –
with similar composite phase system –
than previous twisted flax yarn included
in a textile quasi-UD composite
previously made in our laboratory. The
results of effective mechanical properties
of both UD flax fiber and textile flax fiber

111
unidirectionnel possédant des propriétés
meilleures que le composite quasi-
unidirectionnel. Les différentes fractions
volumiques et la distribution d‘orientation
des fibres ont l‘effet attendu sur les
propriétés mécaniques des composites
étudiés. Le coefficient de Poisson par
contre, ne montre pas d‘influence notable
sur les propriétés mécaniques.
Il est connu que le comportement
mécanique des composite à fibres végétales
n'est pas linéaire et dépend des conditions
d‘essai (vitesse de chargement, température,
et taux d‘humidité ...) , deux domaines
typiques sont aisément détectables en
traction. Des essais monotones, des
chargements répétés progressifs (CRP) et
des tests de fluage selon la méthode
standard ont été effectués pour étudier ce
comportement global. Les essais
mécaniques sont de ce fait non seulement
utilisés pour développer la théorie
d'identification des propriétés mécaniques
effectives du renfort, mais aussi pour
l'analyse phénoménologique du matériau.
Un comportement mécanique global en trois
domaines du composite à fibres végétales a
été identifié avec un modèle antérieurs à
huit paramètres. Il est clair que des
phénomènes de déformation élastiques,
viscoplastiques et viscoélastiques sont
activés. Cependant, il existe encore une
are also consistent with their composite
tensile mechanical properties of UD flax
composites showing higher tensile
mechanical properties than that of textile
flax composite. Both components ratio
and orientation distribution have then
regular effect law on the mechanical
behavior of the studied composite.
Poisson ratio, however, as an essential
attributes of flax fiber does not show
affection on composite mechanical
property performance.
As it is well known, mechanical behavior
of plant fiber composites exhibit non-
linear behavior which depends on
experimental conditions (strain rate,
temperature, and humidity…): two
apparent regions are visible under tensile
loading. Monotonic test, repetitive
progressive load (RPL), and creep test
according to standard method were
performed to study this global behavior.
Mechanical tests are then not only for
development of the identification theory
of effective mechanical properties of
reinforcement, but also for
phenomenological analysis of the
material. Global behavior with three
regions in tensile mechanical behavior of
plant fiber composite has been identified
with eight parameters previous model. It
is evident that elastic, viscoplastic and

112
marge d‘amélioration de la prédiction du
comportement mécanique en traction du
composite lin unidirectionnel. Une piste
d‘amélioration intégrant des paramètres de
renforcement est abordée dans la thèse.
Enfin, le comportement en sorption d'eau du
composite unidirectionnel a été étudié. Les
paramètres de sorption du composite ont été
identifiés. Nous en concluons que la
sorption du composite unidirectionnel est
conforme à la loi de Fick. Les résultats
montrent que l'absorption d'humidité est
fortement affectée par la conformation
unidirectionnelle des fibres de lin et des
porosités existant dans le composite, tandis
que le comportement de pénétration de
l'humidité diffère de celui du composite à
renfort torsadé étudié précédemment dans
notre laboratoire. Pour le composite à fil de
lin, les deux phases du modèle Fickian
semblent avoir donné de meilleurs résultats
que le simple modèle de Fick. Cependant,
pour approfondir le comportement en
sorption de notre composite unidirectionnel
à fibre de lin, deux modèles importants –
Langmuir et un modèle de Fick à deux
phases – ont été appliqués sur le composite
unidirectionnel. Compte tenu de la
probabilité qu'une molécule soit liée et de la
probabilité qu'une mobile soit mobile, les
deux modèles Fickian et le modèle de
Langmuir montrent que l'eau est très
viscoelastic phenomena are activated in
the strain. However, there still is a room
for improvement about the precise
prediction of the tensile mechanical
behavior of UD flax composite. In the
thesis, an improvement track integrating
reinforcement parameters is discussed.
Last but not least, water absorption
behavior of UD composite has been
investigated. The sorption parameters of
UD flax fiber composite have been
identified. As a result on UD composite,
the sorption behavior is in line with the
common Fickian theory. Result shows
that the moisture uptake are strongly
affected by the unidirectional
conformation of flax fibers and porosities
existing in the composite, meanwhile the
penetration behavior of moisture differs to
that of twisted reinforcement composite
previously studied in our laboratory. For
flax yarn composite in our laboratory, two
phases Fickian model seem to have given
a better results than simple Fickian
model. However for a deep view to
understand the sorption behavior of our
UD flax fiber composite, two important
models – Langmuir‘s and two-phases
Fickian cases – were applied on the UD
composite. Considering the probability
for a water molecule to be bond and the
probability for a molecule to be mobile,

113
mobile à l'intérieur du composite testé. La
pénétration rapide est favorisée par tous les
canaux linéaires ouverts, un niveau élevé de
pectine dans le renfort et une faible
efficacité d'interface.
both two-phases Fickian model and
Langmuir‘s model explain that the water
is very mobile inside the tested
composite. Rapid penetration can be
enhanced by all linear open channels,
high level of pectin and low interface
efficiency.

114
REFERENCE
[1] Westman M P, Fifield L S, Simmons K L, et al. Natural fiber composites: a review.
Pacific Northwest National Laboratory, 2010.
[2] Shah D U. Developing plant fibre composites for structural applications by
optimising composite parameters: a critical review. Journal of Materials Science,
2013, 48(18): 6083-6107.
[3] Reux F. Worldwide composites market: Main trends of the composites industry. 5th
innovative composites summit-JEC ASIA 2012, 2012: 26-28.
[4] Stamboulis A, Baillie C A, Peijs T. Effects of environmental conditions on
mechanical and physical properties of flax fibers. Composites Part A: Applied
Science and Manufacturing, 2001, 32(8): 1105-1115.
[5] Pickering K L, Efendy M G A, Le T M. A review of recent developments in natural
fibre composites and their mechanical performance. Composites Part A: Applied
Science and Manufacturing, 2016, 83: 98-112.
[6] Rao K M M, Rao K M. Extraction and tensile properties of natural fibers: Vakka,
date and bamboo. Composite structures, 2007, 77(3): 288-295.
[7] Bledzki A K, Gassan J. Composites reinforced with cellulose based fibres. Progress
in polymer science, 1999, 24(2): 221-274.
[8] Nam T H, Ogihara S, Tung N H, et al. Effect of alkali treatment on interfacial and
mechanical properties of coir fiber reinforced poly (butylene succinate)
biodegradable composites. Composites Part B: Engineering, 2011, 42(6): 1648-1656.
[9] Baley C. Analysis of the flax fibres tensile behaviour and analysis of the tensile
stiffness increase. Composites Part A: Applied Science and Manufacturing, 2002,
33(7): 939-948.
[10] Kalia S, Kaith B S, Kaur I. Pretreatments of natural fibers and their application as
reinforcing material in polymer composites—a review. Polymer Engineering &
Science, 2009, 49(7): 1253-1272.
[11] Morvan C, Andème-Onzighi C, Girault R, et al. Building flax fibres: more than one
brick in the walls. Plant Physiology and Biochemistry, 2003, 41(11): 935-944.
[12] Bos H L, Van Den Oever M J A, Peters O C J J. Tensile and compressive properties
of flax fibres for natural fibre reinforced composites. Journal of Materials Science,
2002, 37(8): 1683-1692.
[13] Koksharov S, Aleeva S, Lepilova O. Nanostructural biochemical modification of flax

115
fiber in the processes of its preparation for spinning. Autex Research Journal, 2015,
15(3): 215-225.
[14] Dymińska L, Gągor A, Hanuza J, et al. Spectroscopic characterization of genetically
modified flax fibers. Journal of Molecular Structure, 2014, 1074: 321-329.
[15] Moriana R, Vilaplana F, Karlsson S, et al. Correlation of chemical, structural and
thermal properties of natural fibres for their sustainable exploitation. Carbohydrate
polymers, 2014, 112: 422-431.
[16] Nguong C W, Lee S N B, Sujan D. A review on natural fibre reinforced polymer
composites. Materials and Metallurgical Engineering, 7(1):33—40, 2013.
[17] Duchemin B, Thuault A, Vicente A, et al. Ultrastructure of cellulose crystallites in
flax textile fibres. Cellulose, 2012, 19(6): 1837-1854.
[18] Bismarck A, Aranberri‐Askargorta I, Springer J, et al. Surface characterization of
flax, hemp and cellulose fibers; surface properties and the water uptake behavior.
Polymer composites, 2002, 23(5): 872-894.
[19] Dittenber D B, GangaRao H V S. Critical review of recent publications on use of
natural composites in infrastructure. Composites Part A: Applied Science and
Manufacturing, 2012, 43(8): 1419-1429.
[20] Kalia S, Dufresne A, Cherian B M, et al. Cellulose-based bio-and nanocomposites: a
review. International Journal of Polymer Science, 2011, 2011.
[21] Scheller H V, Ulvskov P. Hemicelluloses. Annual review of plant biology, 2010, 61:
263-289.
[22] Gibson L J. The hierarchical structure and mechanics of plant materials. Journal of
the Royal Society Interface, 2012: rsif20120341.
[23] Célino A, Fréour S, Jacquemin F, et al. The hygroscopic behavior of plant fibers: A
review. Frontiers in chemistry, 2013, 1.
[24] Wojtasik W, Kulma A, Dymińska L, et al. Fibres from flax overproducing β-1, 3-
glucanase show increased accumulation of pectin and phenolics and thus higher
antioxidant capacity. BMC biotechnology, 2013, 13(1): 1-16.
[25] Moriana R, Vilaplana F, Karlsson S, et al. Correlation of chemical, structural and
thermal properties of natural fibres for their sustainable exploitation. Carbohydrate
polymers, 2014, 112: 422-431.
[26] Lebo S E, Gargulak J D, McNally T J. Lignin. Kirk-Othmer encyclopedia of
chemical technology, 2001.
[27] Jouanin L, Lapierre C. Lignins: biosynthesis, biodegradation and bioengineering.

116
Academic Press, 2012.
[28] Batra S K. Other long vegetable fibers. Handbook of Fiber Chemistry, Third Edition.
CRC Press, 2006
[29] Wambua P, Ivens J, Verpoest I. Natural fibres: can they replace glass in fibre
reinforced plastics?. composites science and technology, 2003, 63(9): 1259-1264.
[30] Dittenber D B, GangaRao H V S. Critical review of recent publications on use of
natural composites in infrastructure. Composites Part A: Applied Science and
Manufacturing, 2012, 43(8): 1419-1429.
[31] Madsen B, Lilholt H. Physical and mechanical properties of unidirectional plant fibre
composites—an evaluation of the influence of porosity. Composites Science and
Technology, 2003, 63(9): 1265-1272.
[32] Baley C. Influence of kink bands on the tensile strength of flax fibers. Journal of
materials science, 2004, 39(1): 331-334.
[33] Cosgrove D J. Growth of the plant cell wall. Nature reviews molecular cell biology,
2005, 6(11): 850-861.
[34] Schrick K, Fujioka S, Takatsuto S, et al. A link between sterol biosynthesis, the cell
wall, and cellulose in Arabidopsis. The Plant Journal, 2004, 38(2): 227-243.
[35] Lamy B, Pomel C. Influence of fiber defects on the stiffness properties of flax fibers-
epoxy composite materials. Journal of materials science letters, 2002, 21(15): 1211-
1213.
[36] Mehdi Khennache, « Caractérisation biologique, chimique, physique et mécanique
de différents lots de fibres de lin, transformées ou non, pour une application en
matériaux composites biosourcés », PhD in progress, University of Rouen
Normandy.
[37] Van de Velde K, Baetens E. Thermal and mechanical properties of flax fibres as
potential composite reinforcement. Macromolecular Materials and Engineering,
2001, 286(6): 342-349.
[38] Carrier M, Loppinet-Serani A, Denux D, et al. Thermogravimetric analysis as a new
method to determine the lignocellulosic composition of biomass. Biomass and
Bioenergy, 2011, 35(1): 298-307.
[39] Souto-Maior J F A, Reis A V, Pedreiro L N, et al. Phosphated crosslinked pectin as a
potential excipient for specific drug delivery: preparation and physicochemical
characterization. Polymer International, 2010, 59(1): 127-135.
[40] Gassan J, Bledzki A K. Thermal degradation of flax and jute fibers. Journal of

117
Applied Polymer Science, 2001, 82(6): 1417-1422.
[41] Charlet K, Eve S, Jernot J P, et al. Tensile deformation of a flax fiber. Procedia
Engineering, 2009, 1(1): 233-236.
[42] Pillin I, Kervoelen A, Bourmaud A, et al. Could oleaginous flax fibers be used as
reinforcement for polymers?. Industrial Crops and Products, 2011, 34(3): 1556-1563.
[43] Arbelaiz A, Cantero G, Fernandez B, et al. Flax fiber surface modifications: effects
on fiber physico mechanical and flax/polypropylene interface properties. Polymer
composites, 2005, 26(3): 324-332.
[44] Saville B P. Physical testing of textiles. Elsevier, 1999.
[45] Assarar M, Scida D, El Mahi A, et al. Influence of water ageing on mechanical
properties and damage events of two reinforced composite materials: Flax–fibres and
glass–fibres. Materials & Design, 2011, 32(2): 788-795.
[46] Cherif Z E, Poilâne C, Falher T, et al. Influence of textile treatment on mechanical
and sorption properties of flax/epoxy composites. Polymer composites, 2013, 34(10):
1761-1773.
[47] Poilâne C, Cherif Z E, Richard F, et al. Polymer reinforced by flax fibres as a
viscoelastoplastic material. Composite Structures, 2014, 112: 100-112.
[48] Scida D, Assarar M, Poilâne C, et al. Influence of hygrothermal ageing on the
damage mechanisms of flax-fibre reinforced epoxy composite. Composites Part B:
Engineering, 2013, 48: 51-58.
[49] Cherif Z E, Poilâne C, Vivet A, et al. About optimal architecture of plant fibre textile
composite for mechanical and sorption properties. Composite Structures, 2016, 140:
240-251.
[50] Hughes M, Carpenter J, Hill C. Deformation and fracture behaviour of flax fibre
reinforced thermosetting polymer matrix composites. Journal of Materials Science,
2007, 42(7): 2499-2511.
[51] Chauhan S R, Patnaik A, Kaith B S, et al. Analysis of Mechanical Behavior of
Phenol Formaldehyde Matrix Composites Using Flax-g-Poly (MMA) as Reinforcing
Materials. Journal of Reinforced Plastics and Composites, 2009, 28(16): 1933-1944.
[52] Cuinat-Guerraz N, Dumont M J, Hubert P. Environmental resistance of flax/bio-
based epoxy and flax/polyurethane composites manufactured by resin transfer
moulding. Composites Part A: Applied Science and Manufacturing, 2016, 88: 140-
147.
[53] Adekunle K, Cho S W, Ketzscher R, et al. Mechanical properties of natural fiber

118
hybrid composites based on renewable thermoset resins derived from soybean oil, for
use in technical applications. Journal of Applied Polymer Science, 2012, 124(6):
4530-4541.
[54] Crossley R, Schubel P, Stevenson A. Furan matrix and flax fibre as a sustainable
renewable composite: Mechanical and fire-resistant properties in comparison to
phenol, epoxy and polyester. Journal of Reinforced Plastics and Composites, 2014,
33(1): 58-68.
[55] Le Duigou A, Bourmaud A, Gourier C, et al. Multi-scale shear properties of flax
fibre reinforced polyamide 11 biocomposites. Composites Part A: Applied Science
and Manufacturing, 2016, 85: 123-129.
[56] Arbelaiz A, Fernandez B, Ramos J A, et al. Mechanical properties of short flax fibre
bundle/polypropylene composites: Influence of matrix/fibre modification, fibre
content, water uptake and recycling. Composites Science and Technology, 2005,
65(10): 1582-1592.
[57] Le Duigou A, Bourmaud A, Davies P, et al. Long term immersion in natural seawater
of Flax/PLA biocomposite. Ocean Engineering, 2014, 90: 140-148.
[58] Aydın M, Tozlu H, Kemaloglu S, et al. Effects of alkali treatment on the properties of
short flax fiber–poly (lactic acid) eco-composites. Journal of Polymers and the
Environment, 2011, 19(1): 11-17.
[59] Kaith B S, Singha A S, Kumar S, et al. Mercerization of flax fiber improves the
mechanical properties of fiber-reinforced composites. International Journal of
Polymeric Materials, 2008, 57(1): 54-72.
[60] Baiardo M, Zini E, Scandola M. Flax fibre–polyester composites. Composites Part A:
Applied Science and Manufacturing, 2004, 35(6): 703-710.
[61] Frechette J. Flax-filled composite: U.S. Patent Application 10/045,519. 2001-10-26.
[62] Oksman K. High quality flax fibre composites manufactured by the resin transfer
moulding process. Journal of reinforced plastics and composites, 2001, 20(7): 621-
627.
[63] Yan L, Chouw N, Yuan X. Improving the mechanical properties of natural fibre
fabric reinforced epoxy composites by alkali treatment. Journal of Reinforced
Plastics and Composites, 2012, 31(6): 425-437.
[64] Goutianos S, Peijs T, Nystrom B, et al. Development of flax fibre based textile
reinforcements for composite applications. Applied composite materials, 2006, 13(4):
199-215.

119
[65] Baiardo M, Zini E, Scandola M. Flax fibre–polyester composites. Composites Part A:
Applied Science and Manufacturing, 2004, 35(6): 703-710.
[66] Schuster J, Govignon Q, Bickerton S. Processability of biobased thermoset resins
and flax fibres reinforcements using vacuum Assisted resin transfer moulding. Open
Journal of Composite Materials, 2014, 2014.
[67] Oksman K, Skrifvars M, Selin J F. Natural fibres as reinforcement in polylactic acid
(PLA) composites. Composites science and technology, 2003, 63(9): 1317-1324.
[68] Kannan T G, Wu C M, Cheng K B, et al. Effect of reinforcement on the mechanical
and thermal properties of flax/polypropylene interwoven fabric composites. Journal
of Industrial Textiles, 2013, 42(4): 417-433.
[69] Adekunle K, Cho S W, Ketzscher R, et al. Mechanical properties of natural fiber
hybrid composites based on renewable thermoset resins derived from soybean oil, for
use in technical applications. Journal of Applied Polymer Science, 2012, 124(6):
4530-4541.
[70] Li X, Panigrahi S, Tabil L G. A study on flax fiber-reinforced polyethylene
biocomposites. Applied Engineering in Agriculture, 2009, 25(4): 525.
[71] Bourmaud A, Le Duigou A, Gourier C, et al. Influence of processing temperature on
mechanical performance of unidirectional polyamide 11–flax fibre composites.
Industrial Crops and Products, 2016, 84: 151-165.
[72] Gourier C, Bourmaud A, Le Duigou A, et al. Influence of PA11 and PP thermoplastic
polymers on recycling stability of unidirectional flax fibre reinforced biocomposites.
Polymer Degradation and Stability, 2017, 136: 1-9.
[73] Pucci M F, Liotier P J, Seveno D, et al. Wetting and swelling property modifications
of elementary flax fibres and their effects on the Liquid Composite Moulding
process. Composites Part A: Applied Science and Manufacturing, 2017.
[74] Liu M, Baum A, Odermatt J, et al. Oxidation of lignin in hemp fibres by laccase:
Effects on mechanical properties of hemp fibres and unidirectional fibre/epoxy
composites. Composites Part A: Applied Science and Manufacturing, 2017, 95: 377-
387.
[75] Mahjoub R, Yatim J M, Sam A R M, et al. Characteristics of continuous
unidirectional kenaf fiber reinforced epoxy composites. Materials & Design, 2014,
64: 640-649.
[76] Liu K, Takagi H, Osugi R, et al. Effect of physicochemical structure of natural fiber
on transverse thermal conductivity of unidirectional abaca/bamboo fiber composites.

120
Composites Part A: Applied Science and Manufacturing, 2012, 43(8): 1234-1241.
[77] Ntenga R, Béakou A, Atéba J A, et al. Estimation of the elastic anisotropy of sisal
fibres by an inverse method. Journal of materials science, 2008, 43(18): 6206-6213.
[78] Brahim S B, Cheikh R B. Influence of fibre orientation and volume fraction on the
tensile properties of unidirectional Alfa-polyester composite. Composites Science
and Technology, 2007, 67(1): 140-147.
[79] Kalia S, Kaith B S, Kaur I. Pretreatments of natural fibers and their application as
reinforcing material in polymer composites—a review. Polymer Engineering &
Science, 2009, 49(7): 1253-1272.
[80] Zhang L, Miao M. Commingled natural fibre/polypropylene wrap spun yarns for
structured thermoplastic composites. Composites Science and Technology, 2010,
70(1): 130-135.
[81] ISO E N. 527-5 (2009) Plastics—determination of tensile properties—Part 5: test
conditions for unidirectional fibre-reinforced plastic composites. ISO international
standards, West Conshohocken, 2009.
[82] Gillham J K. The TBA torsion pendulum: a technique for characterizing the cure and
properties of thermosetting systems. Polymer international, 1997, 44(3): 262-276.
[83] Vergnaud J M, Bouzon J. Cure of thermosetting resins: modelling and experiments.
Springer Science & Business Media, 2012.
[84] Varna J, Joffe R, Berglund L A, et al. Effect of voids on failure mechanisms in RTM
laminates. Composites Science and technology, 1995, 53(2): 241-249.
[85] Thomason J L. The interface region in glass fibre-reinforced epoxy resin composites:
2. Water absorption, voids and the interface. Composites, 1995, 26(7): 477-485.
[86] Berthelot J M. Composite materials: mechanical behavior and structural analysis.
Springer Science & Business Media, 2012.
[87] Jähne B. Spatio-temporal image processing: theory and scientific applications.
Springer Science & Business Media, 1993.
[88] Naouar N, Vidal-Sallé E, Schneider J, et al. Meso-scale FE analyses of textile
composite reinforcement deformation based on X-ray computed tomography.
Composite Structures, 2014, 116: 165-176.
[89] Harris B. The mechanical behaviour of composite materials. Symposia of the Society
for Experimental Biology. Cambridge University Press, p. 37-73, 1980.
[90] Hull D, Clyne T W. An introduction to composite materials. Cambridge university
press, 1996.

121
[91] Madsen B. Properties of plant fibre yarn polymer composites – an experimental
study. PhD Thesis, Technical University of Denmark, Department of Civil
Engineering; 2004. 206 p.
[92] Karine Charlet, ―Contribution à l‘étude de composites unidirectionnels renforcés par
des fibres de lin : relation entre la microstructure de la fibre et ses propriétés
mécaniques‖, PhD Thesis, University of Caen Basse-Normandie, 2008
[93] Eik M, Puttonen J, Herrmann H. The effect of approximation accuracy of the
orientation distribution function on the elastic properties of short fibre reinforced
composites. Composite Structures, 2016, 148: 12-18.
[94] Altendorf H, Jeulin D, Willot F. Influence of the fiber geometry on the macroscopic
elastic and thermal properties. International Journal of Solids and Structures, 2014,
51(23): 3807-3822.
[95] Hine P, Parveen B, Brands D, et al. Validation of the modified rule of mixtures using
a combination of fibre orientation and fibre length measurements. Composites Part
A: Applied Science and Manufacturing, 2014, 64: 70-78.
[96] Hohe J, Beckmann C, Paul H. Modeling of uncertainties in long fiber reinforced
thermoplastics. Materials & Design, 2015, 66: 390-399.
[97] Bourmaud A, Morvan C, Bouali A, et al. Relationships between micro-fibrillar angle,
mechanical properties and biochemical composition of flax fibers. Industrial Crops
and Products, 2013, 44: 343-351.
[98] Keckes J, Burgert I, Frühmann K, et al. Cell-wall recovery after irreversible
deformation of wood. Nature materials, 2003, 2(12): 810-813.
[99] Del Masto A, Trivaudey F, Guicheret-Retel V, et al. Nonlinear tensile behaviour of
elementary hemp fibres: a numerical investigation of the relationships between 3D
geometry and tensile behaviour. Journal of Materials Science, 2017, 52(11): 6591-
6610.
[100] Placet V. Characterization of the thermo-mechanical behaviour of Hemp fibres
intended for the manufacturing of high performance composites. Composites Part A:
Applied Science and Manufacturing, 2009, 40(8): 1111-1118.
[101] Sanjay M R, Arpitha G R, Naik L L, et al. Applications of Natural Fibers and Its
Composites: An Overview. Natural Resources, 2016, 7(03): 108.
[102] Espert A, Vilaplana F, Karlsson S. Comparison of water absorption in natural
cellulosic fibres from wood and one-year crops in polypropylene composites and its
influence on their mechanical properties. Composites Part A: Applied science and

122
manufacturing, 2004, 35(11): 1267-1276.
[103] Alomayri T, Assaedi H, Shaikh F U A, et al. Effect of water absorption on the
mechanical properties of cotton fabric-reinforced geopolymer composites. Journal of
Asian ceramic societies, 2014, 2(3): 223-230.
[104] Standard A. D5229/D5229M-12 ―Standard Test Method for Moisture Absorption
Properties and Equilibrium Conditioning of Polymer Matrix Composite Materials."
ASTM International, West Conshohocken, PA, 2012, DOI:
10.1520/D5229_D5229M-12.
[105] Westman M P, Fifield L S, Simmons K L, et al. Natural fiber composites: a review.
Pacific Northwest National Laboratory, 2010.
[106] Hearle J W S, Morton W E. Physical properties of textile fibres. Elsevier, 2008.
[107] Bledzki A K, Mamun A A, Lucka-Gabor M, et al. The effects of acetylation on
properties of flax fibre and its polypropylene composites. Express Polymer Letters,
2008, 2(6): 413-422.
[108] Palmer N A, Sattler S E, Saathoff A J, et al. Genetic background impacts soluble and
cell wall-bound aromatics in brown midrib mutants of sorghum. Planta, 2008,
229(1): 115-127.
[109] Fedors R F. Osmotic effects in water absorption by polymers. Polymer, 1980, 21(2):
207-212.
[110] Fick A. Ueberdiffusion. Annalen der Physik, 1855, 170(1): 59-86.
[111] Masaro L, Zhu X X. Physical models of diffusion for polymer solutions, gels and
solids. Progress in polymer science, 1999, 24(5): 731-775.
[112] Comyn J. Polymer permeability. Barking England: Elsevier Applied science
publishers.1985.
[113] Sperling L H. Introduction to Physical Polymer Science (Fourth Edition), Wiley-
Interscience.2006.
[114] Kishimoto A, Matsumoto K. Effect of film thickness upon the sorption of organic
vapors in polymers slightly above their glass transition temperatures. Journal of
Polymer Science Part A: General Papers, 1964, 2(2): 679-687.
[115] Crank J. The Mathematics of Diffusion: 2d Ed. Clarendon Press, 1975.
[116] Célino A, Fréour S, Jacquemin F, et al. Characterization and modeling of the
moisture diffusion behavior of natural fibers. Journal of Applied Polymer Science,
2013, 130(1): 297-306.
[117] Carter H G, Kibler K G. Langmuir-type model for anomalous moisture diffusion in

123
composite resins. Journal of Composite Materials, 1978, 12(2): 118-131.
[118] Startsev V O, Panin S V, Startsev O V. Sorption and diffusion of moisture in polymer
composite materials with drop-weight impact damage. Mechanics of Composite
Materials, 2016, 51(6): 761-770.
[119] Dhakal H N, Zhang Z Y, Richardson M O W. Effect of water absorption on the
mechanical properties of hemp fibre reinforced unsaturated polyester composites.
Composites Science and Technology, 2007, 67(7): 1674-1683.
[120] Joliff Y, Rekik W, Belec L, et al. Study of the moisture/stress effects on glass
fibre/epoxy composite and the impact of the interphase area. Composite Structures,
2014, 108: 876-885.
[121] Shen C H, Springer G S. Moisture absorption and desorption of composite materials.
Journal of Composite Materials, 1976, 10(1): 2-20.
[122] Crank J, Park G S. Methods of Measurement, in Diffusion in Polymers. Academic
Press, London, 1968, Chap. 1.
[123] Shewmon P & Janßen M. (Eds.)Diffusion in solids. Springer, 2016.
[124] Ashley R J. Permeability and plastics packaging, In: Polymer permeability. Springer
Netherlands, 1985: 269-308.
[125] Kreze T, Stana-Kleinschek K, Ribitsch V. The sorption behaviour of cellulose fibres.
Lenzinger Berichte, 2001, 80: 28-33.
[126] Sreekala M S, Kumaran M G, Thomas S. Water sorption in oil palm fiber reinforced
phenol formaldehyde composites. Composites Part A: Applied science and
manufacturing, 2002, 33(6): 763-777.
[127] Chen H, Miao M, Ding X. Influence of moisture absorption on the interfacial
strength of bamboo/vinylester composites. Composites Part A: Applied Science and
Manufacturing, 2009, 40(12): 2013-2019.
[128] Shanks R A, Hodzic A, Ridderhof D. Composites of poly (lactic acid) with flax fibers
modified by interstitial polymerization. Journal of applied polymer science, 2006,
99(5): 2305-2313.
[129] Arbelaiz A, Fernandez B, Ramos J A, et al. Mechanical properties of short flax fibre
bundle/polypropylene composites: Influence of matrix/fibre modification, fibre
content, water uptake and recycling. Composites Science and Technology, 2005,
65(10): 1582-1592.
[130] Dhakal H N, Zhang Z Y, Richardson M O W. Effect of water absorption on the
mechanical properties of hemp fibre reinforced unsaturated polyester composites.

124
Composites Science and Technology, 2007, 67(7): 1674-1683.
[131] Baschek G, Hartwig G, Zahradnik F. Effect of water absorption in polymers at low
and high temperatures. Polymer, 1999, 40(12): 3433-3441.
[132] Dhakal H N, Zhang Z Y, Richardson M O W. Effect of water absorption on the
mechanical properties of hemp fibre reinforced unsaturated polyester composites.
Composites Science and Technology, 2007, 67(7): 1674-1683.
[133] Aminabhavi T M, Naik H G. Sorption/desorption, diffusion, and swelling
characteristics of geomembranes in the presence of halo-organic liquids. Journal of
applied polymer science, 1999, 72(3): 349-359.

125
APPENDIX
All types of products tested in the laboratory.
UD70
UD110
UD200
QUD150
QUD180
QUD200
S150
S200
S300
S550

126
Haomiao Yang
Abstract
In this Ph.D work, unidirectional flax fiber composite (UD biobased composite) has been designed and
manufactured based on the hot platen press process. Plant fiber composites usually exhibit two regions under
tensile load, but three regions have been identified in this work. A phenomenological model, previously
developed to describe the tensile mechanical behavior of twisted plant yarn composites, has been tested with the
UD biobased composite. We show that the addition of a strengthening phenomenon to the previous model is
necessary to simulate correctly the third region. A second mechanical model has also been developed for
experimental identification of the effective mechanical properties of flax reinforcement when embeded in matrix.
A statistical distribution of local orientation of UD reinforcement was obtained allowing taking the fiber
orientation into account. To that end, structure tensor method was applied to optical images of flax ply.
Furthermore, this model allows the effect of porosity on mechanical properties to be studied. Both models
provide effective forecast of the mechanical behavior of unidirectional flax fiber composite. Besides the
mechanic models, sorption behavior of UD flax composite also has been analyzed. Langmuir's model and Fick's
model were applied on our UD composite. The results show that the unidirectional configuration of the flax
reinforcement promotes the water sorption from the associated composites.
Keywords: Plant fiber; UD composite; Mechanical properties; Fiber orientation; Sorption behavior
Résumé
Dans cette thèse, un composite unidirectionnel à renfort lin (composite UD biosourcé) a été développé et élaboré
par la technique de presse à chaud. Le comportement en traction des composites à renfort végétal montre en
général deux domaines, mais un troisième domaine est identifié dans ce travail. Un modèle phénoménologique
développé précédemment pour décrire le comportement en traction d'un composite à renfort en fils torsadés a été
testé avec le composite UD biosourcé. Nous montrons que l'ajout d'un phénomène de consolidation au modèle
précédent est nécessaire pour simuler correctement le troisième domaine. Un second modèle mécanique a été par
ailleurs développé pour identifier expérimentalement les propriétés mécaniques effectives du renfort en lin
lorsqu'il est piégé dans la matrice. La distribution statistique de l'orientation locale du renfort a été mesurée pour
pouvoir prendre en compte l'orientation des fibres. Pour cela, la technique du tenseur de structure a été appliquée
sur des images optiques du pli de lin. Par ailleurs, ce modèle permet d'étudier l'influence des porosités sur les
propriétés mécaniques. Les deux modèles permettent d'effectuer des prévisions efficaces du comportement
mécanique du composite de fibre de lin unidirectionnel. En complément des modèles de mécanique, le
comportement en sorption du composite de lin UD a également été analysé. Le modèle de Langmuir et le modèle
de Fick ont été appliqués sur nos composites UD. Les résultats montrent que la configuration unidirectionnelle
du renfort de lin favorise la sorption d'eau des composites associés.
Mots clés : Fibre végétale ; Composites UD ; Propriétés mécaniques ; Orientation des fibres ; Sorption