study of arterial gas emboli behavior · study of arterial gas emboli behavior bjs-ge10 . ......
TRANSCRIPT

1
Study of Arterial Gas Emboli Behavior
BJS-GE10
A Major Qualifying Project Report
Submitted to the Faculty of
Worcester Polytechnic Institute
in partial fulfillment of the requirements for the
Degree of Bachelor of Science
By
Nikolas Albergaria
Nandakumar Iyer
Richard Tremblay
Date: March 10, 2010
Advisor:
Professor Brian J. Savilonis
2
Abstract
Arterial gas emboli are potentially fatal vasculature blockages caused by
bubbles. To analyze arterial bubble behavior, a bench top vasculature model was filled
with a gravity-fed, 60% glycerol-water solution which closely simulates the flow
characteristics of human blood. By injecting air into the model through three different
sizes of tubing, three distinct bubble sizes were generated and analyzed. It was
determined that low Reynolds numbers accompanied by increasing bubble radius,
reduced bubble velocity and low Bond numbers increased bubble buoyancy.

3
Table of Contents
Title Page ………………………………………………..……………………………. 1
Abstract ……………………………….………………………………………………. 2
Introduction …………………………………………………………………………....4
Methodology …………………………………………………………………………..10
Setup …………………………………………………………………………………...21
Procedure ……………………………………………………………………………....22
Results …………………………………………………………………………………24
Observations …………………………………………………………………………...35
Conclusions…………………………………………………………………………….36
Bibliography …………………………………………………………………………. 38

4
Introduction:
An air embolism is a physiological condition that occurs when air enters the
vascular system in the form of small bubbles, resulting in reduced or completely
constricted blood flow. The result of this phenomenon is poor or completely restricted
oxygen delivery to vital tissues and organs. When an air embolism develops in the human
bloodstream, the lack of sufficient oxygenation can result in permanent damage to tissues
and in severe cases, heart failure, stroke, or even death. Arterial gas emboli are generally
the most dangerous form of embolism, occurring when a large bubble becomes lodged in
the heart resulting in restricted or nonexistent blood flow to virtually any and every
region of the body. There are many instances where a bubble can form in the
bloodstream, including: rapid ascension during deep sea diving, during the course of
cardiac or brain surgery, industrial accidents involving compressed air, and improper
ventilator use (Beckman 491-494). Gas emboli can also develop during improper syringe
use; however, the injected volume of air is so minuscule that harmful side effects rarely
occur. Recent studies have also shown the possibility of using gas emboli as a way of
treating patients with tumors or other medical conditions. Because of an emboli’s
effectiveness at blocking blood flow, scientists believe that intentionally creating gas
bubbles in the bloodstream can be used to stop blood flow to a tumor in order to prevent
the tumor from spreading (Weissman, Kol, & Peretz). Our study will focus on the
behavior of gas emboli in the blood stream. This will include an examination on how
bubble geometry, flow rates and gravity affect the formation and movement of emboli in
the microvasculature. Background research will include medical research on the causes of
emboli formation, bubble dynamics in the bloodstream and any possible medical benefits
from intentionally injected bubbles.

5
Air embolisms occur when one or more blood vessels are open to the atmosphere
in the presence of a pressure gradient (with the atmospheric pressure being higher). The
average blood pressure in the human body is greater than atmospheric pressure; however,
blood vessels located above the heart have a lower blood pressure. Hence, any injury
above the heart where a blood vessel is exposed to the atmosphere can cause an air
embolism (Beckman). Arterial gas embolisms are most often caused through two
specific scenarios: the victim has a patent foramen ovale condition (see below for
description) or ascends from a deep dive at too high a rate. The first scenario occurs
when air enters the veins through some means and enters the right side of the heart. From
the right side of the heart, it is pumped to the lungs, where the blood vessels in the lungs
constrict (tighten reducing the inner diameter). When this occurs, the blood pressure on
the right side of the heart increases to the point where the air bubble is forced to the left
side of the heart. Patent foramen ovale is a condition where the foramen ovale, a
passageway for blood to enter the left atrium from the right atrium during fetal
development, does not seal as it is supposed to (Undersea and Hyperbaric Medical
Society). Hence, when the blood pressure in the right side of the heart increases due to
the air bubbles entering the lungs, the foramen ovale is “pushed” open allowing the air
bubbles to flow to the left side of the heart. From this point, the air bubbles are in the
arterial system where they can potentially become lodged in the aorta, coronary artery, or
any number of critical arteries that supply oxygen to various vital organs and tissues. The
consequences of blockage are severe and many times deadly.
The second scenario for an arterial gas embolism occurs when a diver breathes
compressed air (through the tank carried on his/her back), holds his/her breath, and
6
ascends to the surface rapidly. As the diver ascends, the pressure reduces rapidly. This
rapid pressure decrease causes the compressed air to expand very quickly and results in
the blood vessels of the alveoli bursting. This condition is known as Pulmonary
Barotrauma1
The symptoms of an arterial gas embolism include bloody discharge from nose
and/or mouth, disorientation, chest pain, paralysis, weakness, dizziness, blurred vision,
convulsions, hemoptysis (bloody sputum), unconsciousness, and death (Chan & Yang
299). Treatment of a confirmed case of arterial gas embolism involves placement of the
victim in a recompression chamber. The recompression chamber increases the
atmospheric pressure and thereby increases solubility of the air bubbles trapped within
the vasculature. The goal is to force all trapped air bubbles to dissolve and prevent
blockages. The air within the recompression chamber is generally 100% oxygen because
it encourages bubble diffusion and also serves as a means of rapid oxygenation of regions
that were deprived of oxygen due to the arterial gas embolism (Longphre, DeNoble,
Moon, Vann, & Freiberger).
or “Burst Lung Syndrome.” (Davis 82). Now that the blood vessels are
exposed to the atmosphere (due to bursting), air bubbles can directly enter the circulatory
system and travel through the arteries, causing one or more arterial gas embolisms.
Although there are few studies that deal specifically with bubble formation in the
human bloodstream there are various other studies and experiments that provide valuable
information. Because the most common situation where a bubble forms in the human
bloodstream is during rapid ascension in diving, many experiments study marine
1 Note that Pulmonary Barotrauma is not the same as Decompression Sickness, which occurs under similar conditions.
7
mammals because of the similarities in their microvasculature structure. Houser’s study
of whales and dolphins (Houser, Howard, & Ridgeway) shows that large amounts of gas
are dissolved in the bloodstream in reaction to changes in pressure. Houser also
theorized that pressure changes affect the nucleation sites where the bubbles actually
form. Initial bubble formation at the nucleation site varies due to geometry of the site
and the interaction between the surface and the fluid. Because nucleation sites are a
rather complex topic and extremely hard to model due to the need for very precise
pressure modification, our study will focus on the dynamics of the bubble once it has
formed and is travelling through the bloodstream.
As the bubbles form in nucleation sites they inevitably become too large, detach
from the nucleation site and move into the bloodstream (Bull 299). Various studies have
been performed, attempting to model the detachment process in order to assess ways of
reducing the size and amount of bubbles produced. Chappel and his colleagues
(Chappell, Uzel, & Payne 7) derived a model to evaluate the seriousness of the bubble
formation in divers. As the bubble grows, a more significant portion of the bubble will
protrude from the crevice (or any imperfection in the blood vessels that has the potential
to harbor bubbles). As the drag force from the blood flow increases, it forces the bubble
up and out of the crevice. Detachment occurs when the drag force is greater than the
capillary force that is holding the bubble in place. Although the capillary force can alter
its position relative to the drag force depending on various factors, including nucleation
site geometry and body position, it is assumed to be a force parallel to the drag force.
Once detachment occurs the bubble travels through the vessel along the wall at the same
velocity as the blood flow.

8
The adhesion forces acting between the vessel wall and the surface of the bubble
as it travels through the bloodstream are important factors in the behavior of the bubble.
Suzuki (10) used rat arteries and an elaborate microscopic video system to study the most
dangerous instances in which the bubble becomes lodged in the bloodstream, cutting off
circulation to a vital organ. Their experiment included increasing the flow pressure in the
model bloodstream until the bubbles dislodged itself from the wall. Using the recorded
pressure drop across the bubble at the time of detachment and the bubble geometry also
gathered from video analysis, Suzuki was able to calculate the adhesion force between
the bubble and the wall per unit surface area.
Many scientists believe there is a possibility of using gas emboli as a way of
preventing blood from reaching the tumor, thereby depriving the cancer cells of oxygen.
Without the necessary oxygen, the tumor cannot easily spread to other regions of the
body and will die in many instances. The following diagram is a crude illustration of the
technique that scientists would like to employ using gas emboli:
Figure 1: Illustration of promising cancer treatment technique
The yellow mass represents a generic carcinogenic growth in an arbitrary part of the
body. The clear spherical obstruction represents an infused gas embolism that is stuck to
the microvasculature. The halting of blood flow prevents oxygen from reaching the

9
tumor mass, which results in the slow death of the affected cells. Although this technique
is not currently being employed, research is ongoing and the hope is that this technique
will at least partially eliminate the need for chemotherapy.

10
Methodology:
In considering designs for a device capable of producing bubbles of a specified,
consistent diameter, several concepts were developed. Some of these methods had the
potential to produce a bubble of a specified size, while others did not. The methods for
producing bubbles in a liquid that were conceived were:
An air cylinder with a piston
An air compressor with a two-way valve
Top-side injection similar to fuel injection in a car
A revolving-door type mechanism
Pressurized air
Cutting a crevice into the existing tubes
A leak in the system
Raising the surface tension
Lowering the outside pressure
Taking the fluid from a high pressure environment to a low pressure one
Heating the fluid
Electric current
Syringe with a servo/stepper motor
Diffusion across a thin membrane
A three way air/liquid valve
A reversed pressure sensor
A fan to produce bubbles similar to how they are produced behind a submarine
Creation of a nucleation site in the system
A catalyst to remove gasses from the fluid
A straw attached to an air pump
11
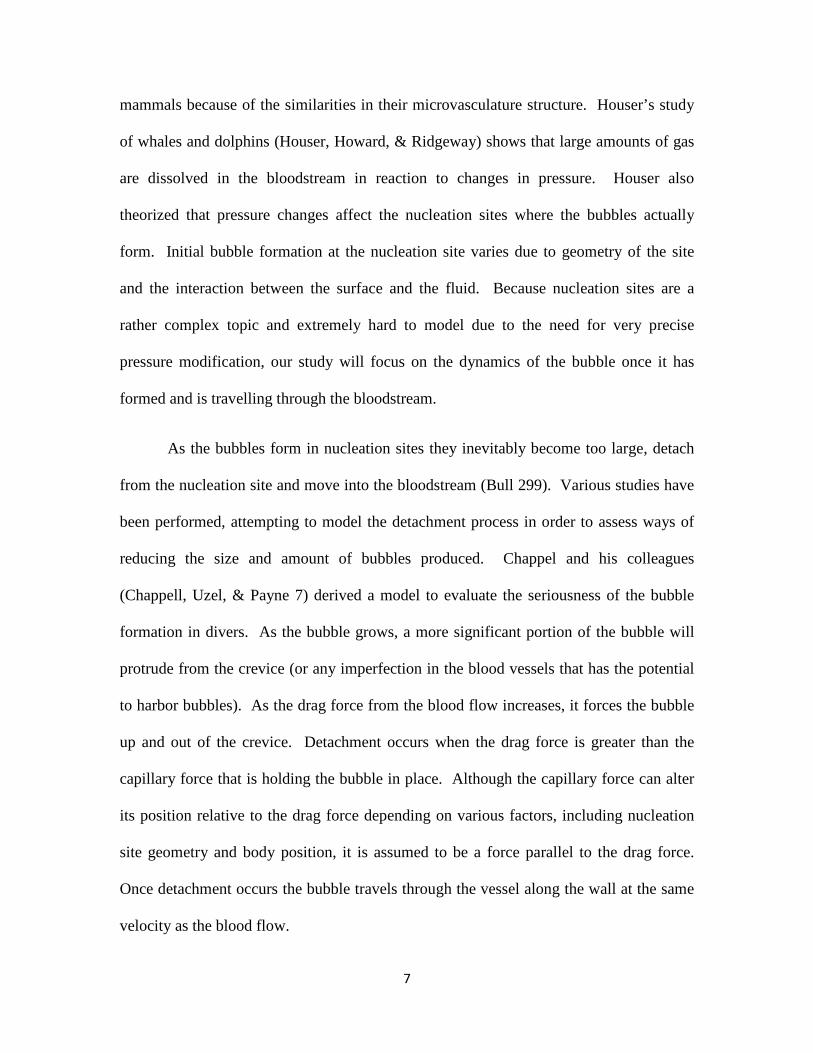
Figure 2: Varying angle of injection tube to change bubble size concept
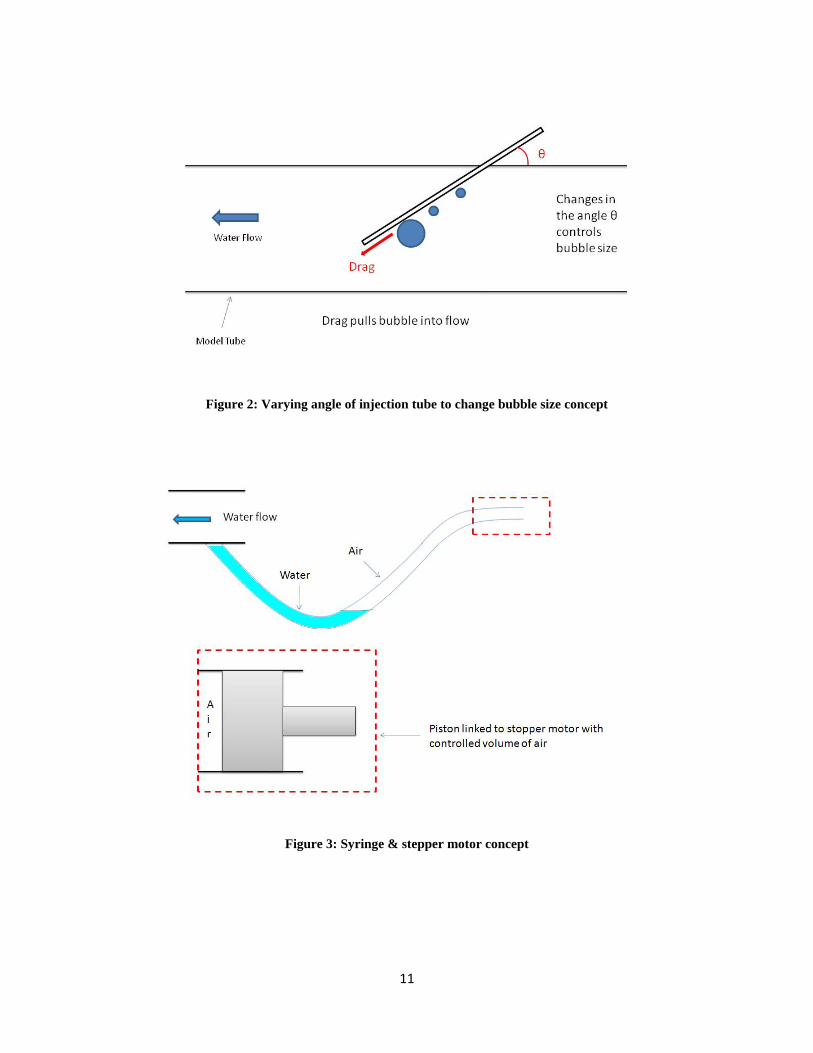
Figure 3: Syringe & stepper motor concept

12
Figure 4: Controlled injection of compressed air using a solenoid valve
The more feasible and controllable methods for producing single bubbles of
controlled diameter were then selected for rough sketches. These sketches were drawn
by hand and used to help aid in the visualization of selecting an acceptable final design.
The gas filter, reverse pressure sensor, three-way valve, electric current, compressor with
a two-way valve, and air cylinder with piston ideas were selected for rough sketching. Of
these, we pursued the last two methods and examined the feasibility of using them in the
final design. In continuing our research into the production of single bubbles of a
specified size, we also found two existing methods that could be used for our final
design. One was a Venturi mechanism, and the other was based upon an established
mathematical relationship at which a bubble will detach from the tip of a syringe.
The first concept that was developed was to use a Venturi device in order to
generate a single bubble. A Venturi device operates under the principle of the Venturi
effect (hence its name), which is a vacuum generated as a result of a pressure gradient.
The following schematic shows our initial design of the Venturi device:

13
Figure 5: Venturi concept for producing bubbles
The constriction in the tubing results in a drop in velocity and an increase in pressure at
the region marked by the red chevron. Subsequently, there is an increase in velocity and
a drop in pressure at the region marked by green chevron. These events satisfy the
continuity (velocity) and conservation of energy (pressure) principles. The key effect
that occurs is a vacuum that is generated due to the low pressure at the region marked by
the green chevron. As the schematic above shows, it was conceived that the vacuum
would draw air through the vertical section of tubing and the air would be deposited into
the water flow in the form of air bubbles. In order to limit the amount of bubbles
deposited into the fluid flow, it was decided to plug the hole at the end of the vertical
section of tubing with a very fine grain air stone.
However, after some calculation as shown below, it was determined that the
Venturi concept was unfeasible because the low water flow velocity (to simulate actual
blood flow velocity) would not generate enough suction to draw air into the water flow:

14
Bernoulli’s Equation: P1ρ
+ V22
2+ gz1 = P2
ρ+ V2
2
2+ gz2
Inlet diameter (nozzle): .003175 m
Outlet diameter (diffuser): .0015875 m
V1 = 4𝑄𝑄𝜋𝜋𝐷𝐷2, Q = 1.979 x 10⁻⁶ m3/s (calculated using V2 & D2 using same equation), V1 =
.250 m/s
V2 = 1 m/s (assumed)
Since both ends of the Venturi are at the same height, there is no potential energy term
required in the equation (z1 = z2). We now know all necessary values in order to
calculate the pressure difference between the nozzle and diffuser, P1 – P2.
𝑃𝑃1 − 𝑃𝑃2
. 998=
12 −. 2502
2= .4678125
𝑘𝑘𝑘𝑘𝑚𝑚 ∗ 𝑠𝑠2 = .4678125 𝑃𝑃𝑃𝑃 = .00006785 𝑝𝑝𝑠𝑠𝑝𝑝
As the above calculation shows, the pressure difference is six ten-thousands of a psi,
which is clearly too small to generate enough suction. Therefore, the Venturi concept
was scrapped.
15
In order to generate bubbles of a specific size, we will utilize the methods
described in Bubble Image Barometry (BIB). Essentially, the device will be a capillary
tube that will have air flowing through it. The capillary tube will be immersed in a 60%
glycerol-water solution (to simulate Reynolds and Capillary numbers of human blood)
and bubbles of the desired size (diameter ranging from 1.6mm to 3.2mm to simulate
diameter of microvasculature) will propagate and release into the water flow. The
following schematic illustrates the proposed design:
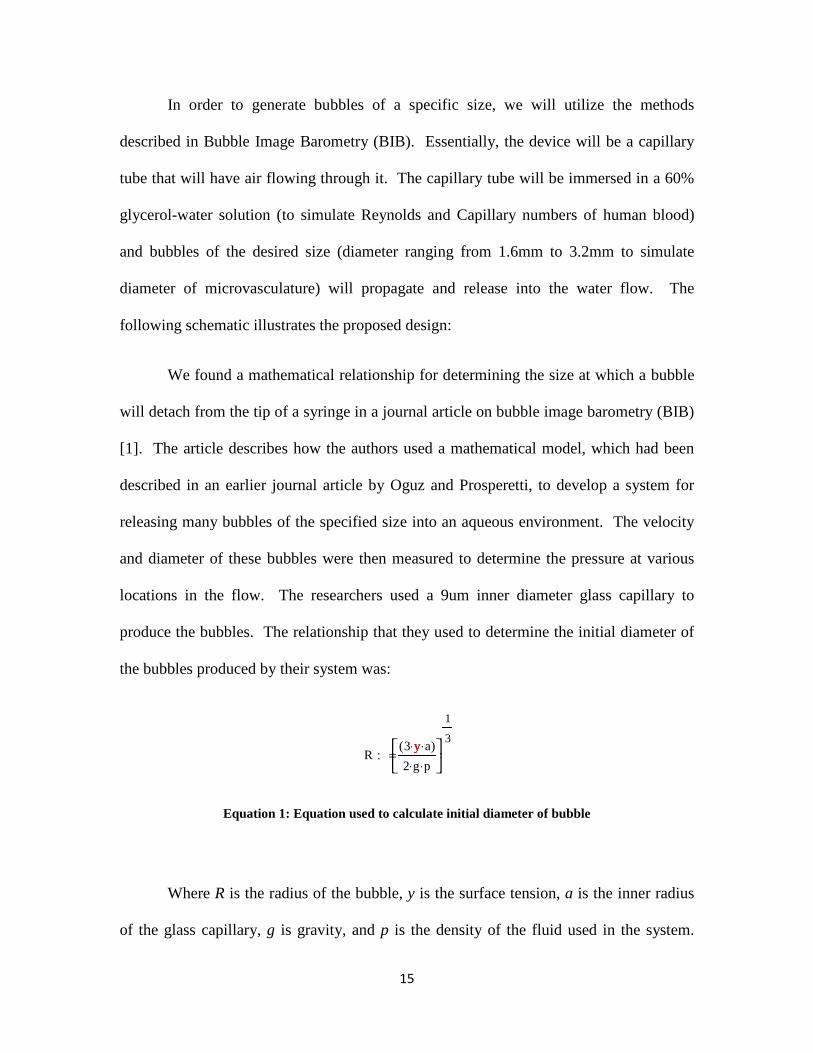
We found a mathematical relationship for determining the size at which a bubble
will detach from the tip of a syringe in a journal article on bubble image barometry (BIB)
[1]. The article describes how the authors used a mathematical model, which had been
described in an earlier journal article by Oguz and Prosperetti, to develop a system for
releasing many bubbles of the specified size into an aqueous environment. The velocity
and diameter of these bubbles were then measured to determine the pressure at various
locations in the flow. The researchers used a 9um inner diameter glass capillary to
produce the bubbles. The relationship that they used to determine the initial diameter of
the bubbles produced by their system was:
Equation 1: Equation used to calculate initial diameter of bubble
Where R is the radius of the bubble, y is the surface tension, a is the inner radius
of the glass capillary, g is gravity, and p is the density of the fluid used in the system.
R3 y⋅ a⋅( )2 g⋅ p⋅
1
3: =
y

16
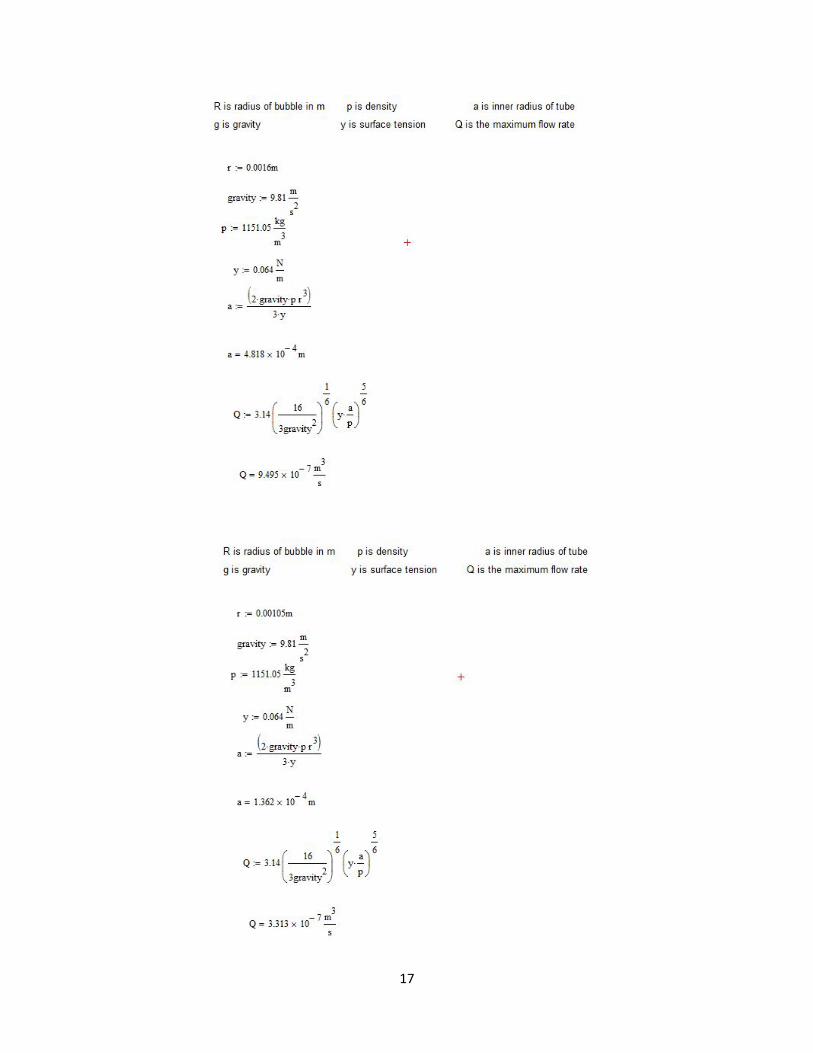
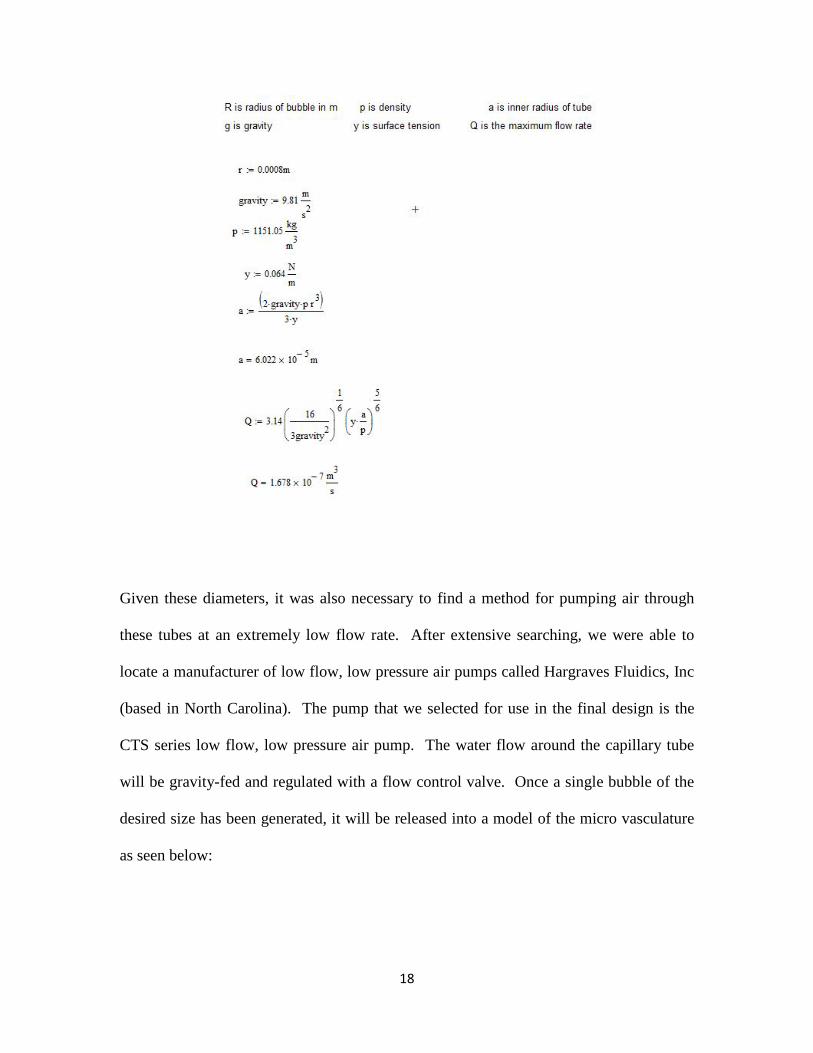
This relationship can be used to determine the radius at which the bubble will detach
from the tube. This relationship remains true until the flow of air through the capillary
becomes greater than a certain value Qcr, given by the relationship:
Equation 2: Equation used to calculate Qcr
Where g is gravity, y is the surface tension of the liquid, a is the inner diameter of
the capillary, and p is the density of the liquid. Our final design utilizes these
mathematical relationships to produce bubbles of a desired diameter for use in testing
with the previous MQP’s model. Using these mathematical relationships, it was found
that tubes with inner diameters of 0.96mm, 0.27mm, and 0.12mm were needed to
produce bubbles of the same diameters of the three different tubes in the existing model.
These bubbles will detach from the tubes upon reaching the required diameters, allowing
us to see how their effects on the flow through the existing model. The calculations used
to determine the appropriate inner diameters of these tubes follow this paragraph.
Q 3.1416
3g2
1
6y
ap
⋅
5
6: = y
17
18
Given these diameters, it was also necessary to find a method for pumping air through
these tubes at an extremely low flow rate. After extensive searching, we were able to
locate a manufacturer of low flow, low pressure air pumps called Hargraves Fluidics, Inc
(based in North Carolina). The pump that we selected for use in the final design is the
CTS series low flow, low pressure air pump. The water flow around the capillary tube
will be gravity-fed and regulated with a flow control valve. Once a single bubble of the
desired size has been generated, it will be released into a model of the micro vasculature
as seen below:

19
Figure 6: Model of micro vasculature, © Devin Lavore, Scott McNee
This model will be mounted on a test bench using a pin setup so that the model will be
able to pivot about the pin as shown in the next figure. This will allow us to view the
effects of roll angle on bubble dynamics and bubble splitting.
Figure 7: Model of micro vasculature as mounted to test block, © Devin Lavore, Scott McNee

20
Required Parts
1. Low flow air pump from Hargraves Fluidics, Inc.:
E179-11-030 CTS Low Flow, Low Pressure Pump, $52.00
Total: $52.00
2. Tubing from Cole-Parmer Catalog:
EW-95609-10 Masterflex Tygon tubing with .19mm inner diameter, $63.00
EW-95609-12 Masterflex Tygon tubing with .25mm inner diameter, $63.00
Total: $126.00
3. 1/8 inch inner diameter tubing (already available from previous group’s MQP work)
Masterflex Tygon tubing with 1/8 inch inner diameter

21
Setup
When setting up the test block with the new materials, it was necessary to make
some improvements and changes to the existing system. The main problems that we
faced in setting up the model properly were in the form of air leaks and control of the
flow rate of air through the system. In order to power the air pump, we initially tried
using batteries (2, 1.5V batteries wired in series), however, it was discovered that using
an analog power supply afforded greater control over the pump flow rate. By limiting the
voltage provided by the power supply, we were able to control the flow rate of air
through the model, which eliminated the need for an air flow control valve.
There were also issues with air leaking into the system. Initially, we simply cut a
hole in the inlet tube for the glycerol and fed the air tubes through this hole to the inlet of
the model, but this resulted in a leak at the hole. As a result, it became impossible to
regulate the flow of bubbles and air into the system. To remedy the issue, plumber’s
putty was added around the hole.
We also had difficulties in controlling the flow of the glycerol solution through
the model. A flow control valve was added to the glycerol solution inlet, which provided
better control over the flow rate of the glycerol solution through the model and allowed
us to limit its velocity. Together with the analog power supply, we were able to control
the velocity of the system much more precisely. This allowed us to create a flow with the
Reynolds numbers desired for the experiment. These modifications to the original setup
allowed us to greatly improve the precision of the original experiment in terms of bubble
diameter and flow rates.

22
Procedure
For each test run at the various angles, a camcorder was used to record live
footage for further analysis. A video editing program was used to slow and/or stop the
video in order to facilitate certain calculations including bubble volume, flow rates and
splitting ratios. Flow rates were calculated by recording the amount of time it took for a
bubble to travel through a certain section of the tubing. These times were recorded using
a digital stopwatch. The process of taking these measurements was repeated five times
for each Reynolds number at 0, 15, 30, and 45 degrees. Splitting ratios were calculated
from the video footage taken for each roll angle. Splitting ratios refers to the volume of
the lower bifurcation against the upper bifurcation. These measurements of splitting
ratios were calculated from ten bubbles of different sizes at each roll angle. The resulting
data was then entered into Microsoft Excel in order to create graphs of the data.
Reynolds Numbers
The Reynolds number is a dimensionless parameter that tells us if the fluid flow is
laminar or turbulent. In general, laminar flows have a Reynolds number of 2300 or lower
while turbulent flows have a Reynolds number greater than 2300. The simulated blood
flows in this experiment had low Reynolds numbers and hence were classified as laminar
flows (just like actual blood flow in the human body). In computing the Reynolds
number, the following equation is employed:
Re =ρVD
μ

23
In the equation, ρ is the density of the fluid (1.1566 g/cm3 for glycerol-water solution), V
is the fluid velocity, D is the diameter of the parent tube, and μ is the dynamic viscosity
(0.0108 N-s/m2 for glycerol-water solution) of the fluid. Knowing these values, the
Reynolds number for the average velocities of each bubble size are as follows:
Bubble Tubing Size ID (mm)
Average Velocity (m/s)
Model Tubing Diameter (m)
Reynolds Number (Re)
Flow Class
.79 .02 .0032 6.85 Laminar
.19 .04 .0021 9.00 Laminar
.25 .07 .0016 12.00 Laminar

24
Results
Video analysis concluded that a variety of bubble sizes were produced. Although
the bubble volume could be controlled through minute adjustments to the voltage
supplied to the pump, it proved to be extremely difficult to inject a stream a consistently
sized bubbles into the model. This was largely due to the fact that the inlet tube was not
perfectly flush with the inlet of the model, which created a space where air bubbles could
stick outside the model. To facilitate analysis, bubbles were classified into three groups
based on whether or not they split at the first bifurcation. Bubbles with a volume less than
around 17 mm3 never split and were classified as small bubbles. Small bubbles are
visibly much different than the larger bubbles, as they are near perfect spheres while the
larger bubbles are elongated. Because there were a wider range of bubble volumes that
split, two groups were created: medium bubbles (17-30 mm3) and large bubbles (over 30
mm3).
Although the small bubbles never split it was observed that there was near perfect
distribution between the upper and lower bifurcations at a roll angle of 0°. As the roll
angle increased the proportion of bubbles entering the upper bifurcation also increased
due to buoyancy. The large bubbles split at the first bifurcation 100% of the time, except
in extreme cases such as a blockage. Medium bubbles split a large percentage of the time,
but the percentage decreased as the roll angle increased. Figure 8 shows a medium sized
bubble approaching the split and entering the upper bifurcation at the last second instead
of splitting. This is due to both surface tension and buoyancy.

25
Figure 8 - Medium bubble about to split before entering the upper bifurcation intact
Figure 9 is a still frame from a test run at 0°. It shows a medium-sized bubble
approaching the first bifurcation and another medium-sized bubble which has already
reached the bifurcation and split.
Figure 9 - Medium-sized bubbles at 0°

26
Analysis confirms that the splitting ratio for the medium and large-sized bubbles between
the upper and lower bifurcation is essentially one at 0°. As the roll angle is increased, the
buoyancy force becomes more prominent, forcing the smaller bubbles through the upper
bifurcation and the splitting ratios for the medium and large bubbles to drop considerably,
as shown in figure 10.
Figure 10 - Splitting Ratios for Medium and Large Bubbles
Figure 11 - Percentage of small bubbles entering upper bifurcation
0
0.2
0.4
0.6
0.8
1
1.2
0 10 20 30 40 50
Split
ting
Rat
io
Roll Angle in Degrees
Splitting Ratios for Medium and Large Bubbles
Large Bubbles
Medium Bubbles
Poly. (Large Bubbles)
Poly. (Medium Bubbles)
40%
50%
60%
70%
80%
90%
100%
0 10 20 30 40 50
Roll Angle in Degrees
Percentage of Small Bubbles Entering Upper Bifurcation
Small Bubbles
Poly. (Small Bubbles)

27
Further tests were performed for extreme angles greater than 45° for observation of
possible phenomena. At an angle of nearly 90° blockages were observed in both the injection site
and in the upper bifurcation.
Figure 12 - Blockage at bubble injection site
Figure 12 shows small sized bubbles sticking to the inside of tube causing a
blockage near the bubble injection site. Another blockage was observed at the upper
bifurcation as shown in figures 13 and 14.
Figure 13: Blockage at upper bifurcation Figure 14: Bubble accumulation at blockage site

28
A situation like this could prove to be fatal if it ever occurred inside an actual human
vasculature system. Further analysis into bubble behavior at extreme angles could possibly
lead to valuable medical breakthroughs.
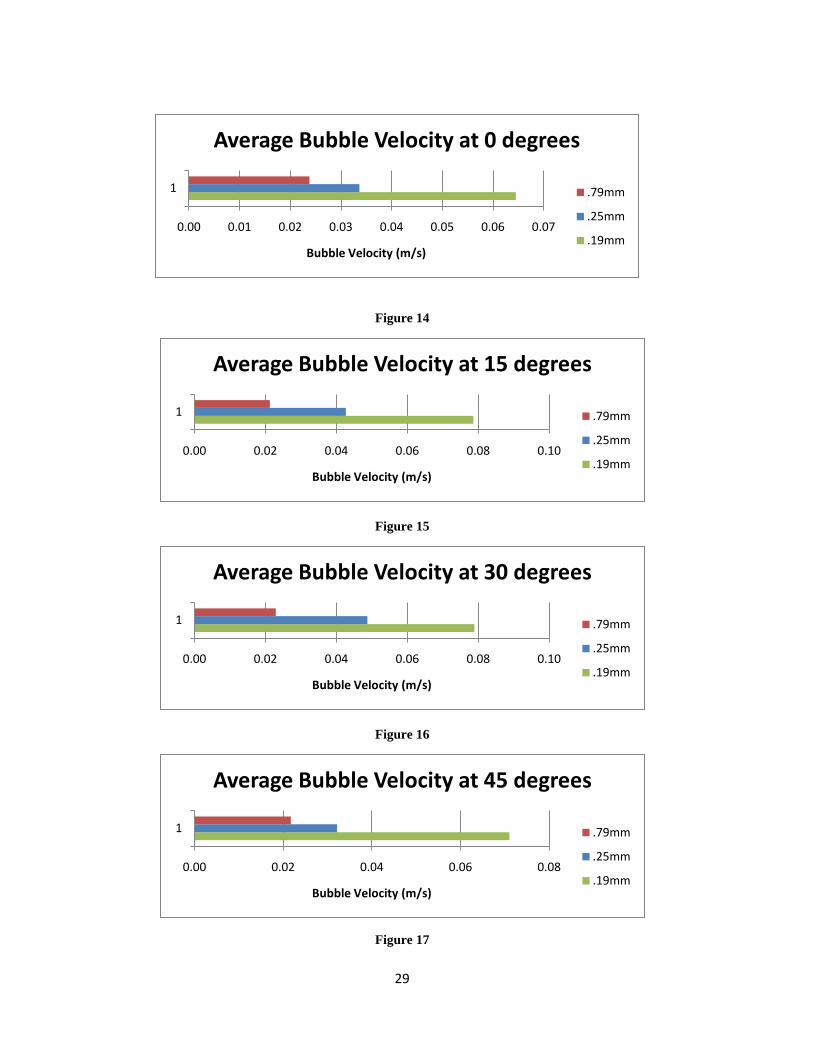
Bubble Velocity
In general, it was noted that bubble velocity for each tubing size was consistent
throughout the range of roll angles. As the following figures (1-4) show, the .79mm inner
diameter tubing yielded the lowest average bubble velocity. The .25mm inner diameter
tubing generated bubbles having an average velocity higher than the .79mm inner diameter
tubing. Finally, the .19mm inner diameter tubing yielded bubbles having the highest
average velocity. The bubble velocities were measured based on bubble size in relation to
the tubing size. For example, the travel of the large bubbles generated by the .79mm inner
diameter tubing was timed from the entrance of the model to the first bifurcation (distance of
.059 m). This was done because the bubbles would split (due to reduction in tubing
diameter at the branch) at the first branch and hence the velocity would no longer be
accurate. Similarly, the medium sized bubbles generated by the .25mm inner diameter
tubing were timed as they travelled from the entrance of the first bifurcation to the exit of
the first bifurcation (distance of .024 m) since they would split after that point. Finally, the
small bubbles generated by the .19mm inner diameter tubing were timed as they travelled
starting at the exit of the first bifurcation until they left the model (distance of .078 m).
29
Figure 14
Figure 15
Figure 16
Figure 17
0.00 0.01 0.02 0.03 0.04 0.05 0.06 0.07
1
Bubble Velocity (m/s)
Average Bubble Velocity at 0 degrees
.79mm
.25mm
.19mm
0.00 0.02 0.04 0.06 0.08 0.10
1
Bubble Velocity (m/s)
Average Bubble Velocity at 15 degrees
.79mm
.25mm
.19mm
0.00 0.02 0.04 0.06 0.08 0.10
1
Bubble Velocity (m/s)
Average Bubble Velocity at 30 degrees
.79mm
.25mm
.19mm
0.00 0.02 0.04 0.06 0.08
1
Bubble Velocity (m/s)
Average Bubble Velocity at 45 degrees
.79mm
.25mm
.19mm

30
Although the glycerol–water solution flow rate was carefully maintained, there were
differences in the bubble velocities depending upon size. At first glance, we thought that
our flow control was not as precise as we initially thought. However, upon further analysis
we realized that the bubble velocity varied because of Stoke’s Law. Stoke’s Law relates the
drag force experienced by bubbles in fluid flows having small Reynold’s numbers. Stoke’s
Law states:
Fd = 6πμRV
Equation 3: Equation used to calculate drag force on the bubble (Stoke’s Law)
Where μ is the dynamic viscosity of the fluid, R is the radius, and V is the velocity of the
bubble. Hence it is clear from observing this equation that the larger the radius of the
bubble (and therefore the larger the bubble), the lower the velocity due to a greater drag
force. In addition, the bubbles produced by the smallest diameter tubing (.19mm) were still
slightly larger than the diameter of the tubing in the model. Hence, there was additional
drag present in the form of friction between the bubble and the tubing wall. Since the
difference in velocity between the bubble sizes is quite low, we can conclude that a good
portion of error is also due to the low resolution of the stopwatch used to time the bubbles’
travel.
Bond Numbers
In fluid mechanics involving bubbles or droplets, the Bond number and Morton
number are often used to characterize the shape of the bubbles. They are dimensionless
parameters like the Reynolds number, but pertain to the bubbles in this application. A high

31
bond number will typically indicate that the effects of surface tension are negligible,
whereas a low bond number, typically less than 1, indicates that the effects of surface
tension dominate. The bond number is calculated as:
Equation 4: Equation used to calculate Bond number
where the characteristic length is the radius of the bubble.
In our given application, the Bond numbers for the 0.79, 0.25, and 0.19mm inner
diameter tubing used to make the bubbles are 0.454, 0.195, and 0.133 respectively. This
indicates that in our experiment the effects of surface tension are dominant on the bubble.
That would suggest that the introduction of a surfactant into the system, which would reduce
the surface tension of the glycerol solution, could be used to significantly reduce the
diameter of the bubbles. This suggests that a surfactant could possibly be used to alleviate a
blockage caused by an air bubble in the bloodstream, reducing the bubble diameter and
allowing it to pass into a larger vein. A plot of Reynolds number vs. Bond number is
included below. It seems to suggest that in this case, the Reynolds number varies inversely
with the Bond number.
Bond Density g⋅Lcharacteristic
2
surfacetension⋅: =

32
Figure 18: Plot of relationship between Reynolds number and Bond number
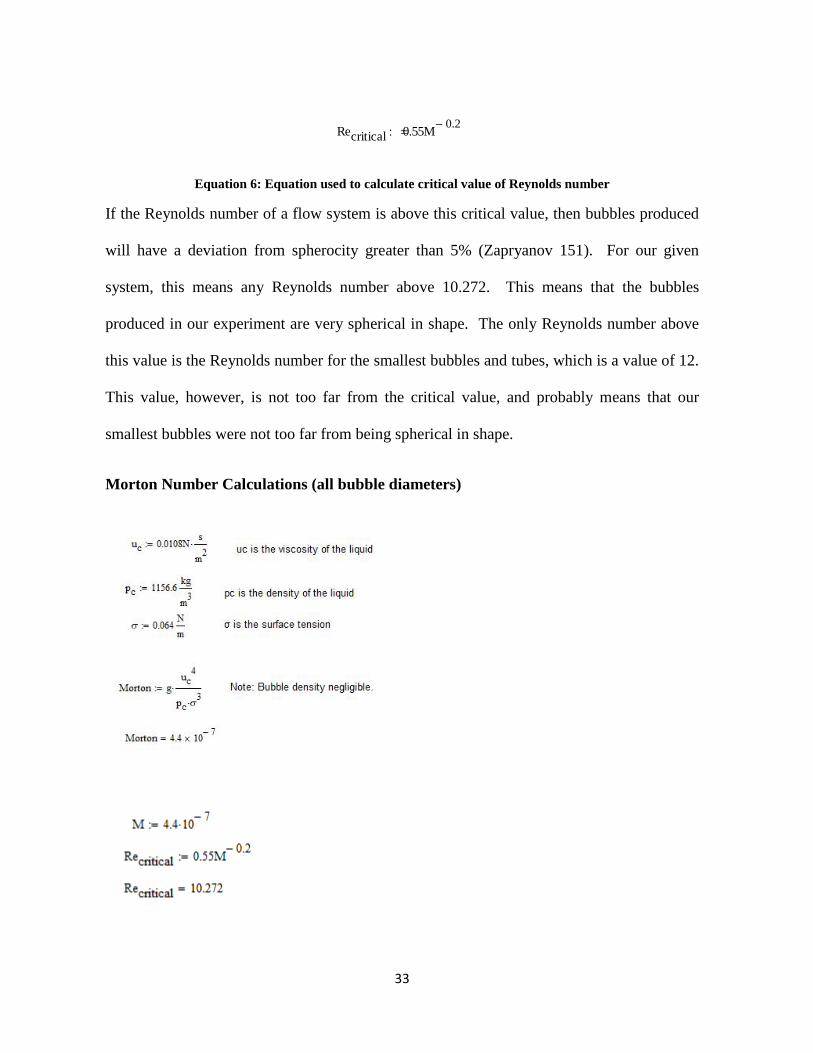
Morton Number
The Morton number is another dimensionless parameter used to describe the shape
of a bubble. The Morton number is independent of the radius of the bubble and is the same
for all bubble radii in this experiment. It is calculated as:
Morton guc
4
pc σ3⋅⋅: =
Equation 5: Equation used to calculate Morton number
Here, uc is the dynamic viscosity of the liquid, pc is the density of the liquid, and σ is the
surface tension. For our experiment, a Morton number of 4.4*10 -7 was obtained. The
Morton number can describe the spherocity of a bubble or droplet by the equation:
0.1
0.15
0.2
0.25
0.3
0.35
0.4
0.45
0.5
6 7 8 9 10 11 12 13
Bond
Num
ber
Reynolds Number
Reynolds Number vs. Bond Number
33
Recritical 0.55M 0.2−: =
Equation 6: Equation used to calculate critical value of Reynolds number
If the Reynolds number of a flow system is above this critical value, then bubbles produced
will have a deviation from spherocity greater than 5% (Zapryanov 151). For our given
system, this means any Reynolds number above 10.272. This means that the bubbles
produced in our experiment are very spherical in shape. The only Reynolds number above
this value is the Reynolds number for the smallest bubbles and tubes, which is a value of 12.
This value, however, is not too far from the critical value, and probably means that our
smallest bubbles were not too far from being spherical in shape.
Morton Number Calculations (all bubble diameters)

34
Bond Number Calculations
3.2mm Diameter Bubbles
2.1mm Diameter Bubbles
1.6mm Diameter Bubbles

35
Observations
During the course of experimentation, we decided to see how larger angles affected
bubble travel path and sticking behavior. Using the .19mm inner diameter tubing and a
model angle of 75 degrees, it was observed that several bubbles travelled upwards
(unexpectedly) and became lodged just after the first branch. This blockage halted flow to
the upper tubing completely. Essentially, we were witnessing a blockage similar to what
occurs during a stroke or heart attack. More and more bubbles continued to accumulate and
become part of the blockage. After approximately 20 seconds, the blockage broke free and
proceeded further down the tubing until it exited from the model. This presents a multitude
of ideas and techniques. Namely, the phenomenon can be explored further as a possible
treatment for blocked blood vessels in the human body. Of course, this would likely require
more bubbles in order to generate enough pressure to dislodge plaque buildup. Additionally,
care would have to be taken to prevent blood vessels from bursting as result of this higher
pressure. It is unlikely that the technique would be highly effective or safe for
reducing/eliminating large blockages, however, smaller blockages as well as gas embolisms
might respond favorably to such a treatment.
In attempting to explain the bubbles’ upward travel during the blockage, it was
discovered that buoyancy and its relationship to the Bond number was the key. If the Bond
number, which is a ratio of buoyancy force to the surface tension, is less than .842, the
bubble will rise (Zapryanov, 277). Since the small bubbles which created the blockage have
a Bond number of .113, this principle holds true and explains their motion.

36
Conclusions
Using a previously built, bench-top model designed to simulate the human
microvasculature, bubbles were introduced into a gravity-fed 60% glycerol-water solution
flowing through the model. The bubbles were generated with a low flow, low pressure air
pump in conjunction with three distinct tubing sizes fed into the entrance of the model.
Each size of tubing generated a different sized bubble with the smallest being 1.6mm in
diameter, followed by bubbles having 2.1mm diameter, and with the largest bubbles having
3.2mm diameter. The variance in bubble size resulted in three distinct Reynolds numbers
for the flow that closely mimicked Reynolds numbers of blood flow in the human body.
Bubble velocity, path, and their general behavior was measured and observed.
It was concluded that Stoke’s Law played a large role in determining the velocity of
the bubble based on bubble radius (the larger the bubble, the slower it travelled). In
addition, bubbles having a Bond number less than .842 tended to rise in the model (even at
extreme angles) due to the dominating effects of buoyancy. Finally, it was determined that
the majority of the bubbles produced during the course of experimentation were spherical
due to the fact that the critical Reynolds number for two out of the three bubble sizes was
less than 10.272 (calculated using Morton number).
An interesting observation that was noted during the course of experimentation was a
blockage that occurred when the model was at an angle of 75 degrees. The small (1.6mm
diameter) bubbles began accumulating just after the first branch towards the upper tube (see
figure 13). Since the model was at an extreme angle, the rise of the bubbles could not be

37
explained until the Bond number relation was explored further. It was then that we realized
that since the Bond number was less than .842 for our system, the bubbles would rise. Even
more interesting was the fact that after a sufficient number of bubbles had accumulated, the
blockage broke free as one or two large clumps and proceeded to exit the model.
The latter observations indicate a promising avenue of future research into ways to
dislodge blockages within the human vasculature. By slowly bombarding a blockage with
bubbles of controlled size, one might be able to gently dislodge or break down the blockage
whether it’s comprised of bubbles (gas embolism) or arterial plaque, etc. In addition,
blockages could be intentionally introduced into the vasculature to prevent blood from
reaching malignant tumors (which would cut off the supply of oxygen and cause the death of
the affected cells). By further analyzing the behavior of bubbles, the possibilities exist to
harness their small size and surface tension characteristics in order to treat a multitude of
human illnesses without the need for hundreds of different drugs and alternative therapies.
38
Bibliography
1. "Air or Gas Embolism." Undersea & Hyperbaric Medical Society. Web. 19 Oct.
2009.
<http://www.uhms.org/ResourceLibrary/Indications/AirorGasEmbolism/tabid/271/D
efault.aspx>.
2. Akonur, A., and A. K. Prasad. "Methodology and Implementation of Bubble-Image
Barometry." Measurement Science and Technology 11.4 (2000): 398. Print.
3. "Alab, LLC - Fine Bubble Diffusers by Alab." Alab, LLC - Micro-Fine Diffusers.
Web. 10 Jan. 2010. <http://www.alabdiffusers.com/DiffuserDiscovery.htm>.
4. "Aspirator." Wikipedia, the Free Encyclopedia. Web. 10 Jan. 2010.
<http://en.wikipedia.org/wiki/Water_aspirators>.
5. Beckman, Thomas J. "A Review of Decompression Sickness and Arterial Gas
Embolism." Archive of Family Medicine 6.5 (1997): 491-94. Web.
6. Bull, Joseph F. "Cardiovascular Bubble Dynamics." Critical Reviews in Biomedical
Engineering 33.4 (2005): 299-346. Print.
7. Chan, K. S., and Wen-Jei Yang. "Study of Literature Related to the Problems of Gas
Embolism in Human Body." Journal of Biomechanics 2.3 (1969): 299-312. Print.
8. Chappell, M. A., S. Uzel, and S. J. Payne. "Modeling the Detachment and Transport
of Bubbles from Nucleation Sites in Small Vessels." IEEE Transactions on
Biomedical Engineering (2006): 1-7. Print.

39
9. Davis, JC. "Treatment of Serious Decompression Sickness and Arterial Gas
Embolism." Undersea and Hyperbaric Medical Society Workshop (1979): 1-82.
Print.
10. "Fine Bubble Diffusers." Advanced, Technical and Engineered Ceramics -
Refractron Technologies. Web. 18 Oct. 2009.
<http://www.refractron.com/technical_library/html/Porous/Fine_Bubble_Diffusers.a
sp>.
11. Houser, D. S., R. Howard, and S. Ridgeway. "Can Diving-induced Tissue Nitrogen
Supersaturation Increase the Chance of Acoustically Driven Bubble Growth in
Marine Mammals?" Journal of Theoretical Biology 213.2 (2001): 183-95. Print.
12. Longphre, J. M., P. J. DeNoble, R. E. Moon, R. D. Vann, and J. J. Freiberger. "First
Aid Normobaric Oxygen for the Treatment of Recreational Diving Injuries."
Undersea and Hyperbaric Medical Society 34.1 (2007): 43-49. Web.
13. Suzuki, A., and D. M. Eckmann. "Embolism Bubble Adhesion Force in Excised
Perfused Microvessels." Anesthesiology 99.2 (2003): 400-08. Print.
14. Weissman, Amir, Shahar Kol, and Bezalel A. Peretz. "Gas Embolism in Obstetrics
and Gynecology." Journal of Reproductive Medicine (1996). Web.
15. Zapryanov, Z., and S. Tabakova. Dynamics of Bubbles, Drops, and Rigid Particles.
Dordrecht: Kluwer Academic, 1999. Print.