study on proactive air-quality control by coupling … on proactive air-quality control by coupling...
TRANSCRIPT
Study on Proactive Air-quality Control by
Coupling Emission Source Reduction and
Air Quality Modeling
Dr. Qiang Xu
Dan F. Smith Department of Chemical Engineering Lamar University, Beaumont, TX 77710
2014 TARC Meeting/SETRPC Air Quality Symposium Lamar University, Beaumont, TX
August 8, 2014

Project Background
• “Strategic research in EI development should be focused on those emission categories that have the greatest uncertainties (industrial flaring) and that are likely to have the greatest impacts on ozone formation.”
• “provide necessary technical details to support legislative changes that will result in implementing quantified, cost-effective control strategies.”
• “improvements in the scientific understanding of emissions, atmospheric chemistry, and meteorology, and improvements to air quality modeling tools must be integrated into air quality management systems.”
Problems
Priority Research Needs
• The HGA/BPA experience highly localized and transient high ozone concentration events that violate NAAQS.
• Air emission from chemical plants’ turnarounds (start-up, shutdown, and process upsets) is one of the root causes.

Motivation and Study Scope
<1%
Ethylene Propylene 1,3-Butadiene Isobutylene Hydrogen
Methane Acetylene Ethane Methyl-Acetylene Propane N-Butane
Legend:
t = 0
Start-up time
t = 14 hr
t = 3 hr
<1%
33%
3%
20%
9%<1%
6%
9%
17%
1%
43%
37%
1%
17% 1% Others 1%
667.1 klb/hr
72.3 klb/hr
5%0.6%5%
36%
6%
9%
36%
NO NO2 OLE PAR TOL XYL FORM ALD2
ETH MEOH ETOH ISOP IOLE ALDX TERP NR CO
t = 14 hr
Legend:
t = 0
Start-up time
<0.01%
0.11%
0.13%
0.13%
0.02%0.30%
0.10%0.56%
0.09%
0.35%
238.5 kmol/hr
t = 3 hr
27.2 kmol/hr
Emission
Source
Accounting
Flare Emissions
Air Quality
Modeling
Emission Source
Minimization
Air-quality Conscious
& Cost-effective
Emission Control

Project Objectives
• Explore various in-plant control strategies for emission source
reduction and obtain dynamic emission data;
• Employ CAMx modeling to precisely study impacts on regional
ozone concentrations under different plant operation scenarios
(e.g., start-ups, shutdowns, upsets, and etc.);
• Optimize out-plant control strategies for air-quality impact
minimization via CAMx based simulation/optimization, such as
smart selection of date/starting time of turnarounds, scheduling
multi-plant turnarounds, and new plant site determination;
• Study cost-effective and air-quality conscious control strategies
for all stake holders, including TCEQ, chemical industry, and
residential communities.
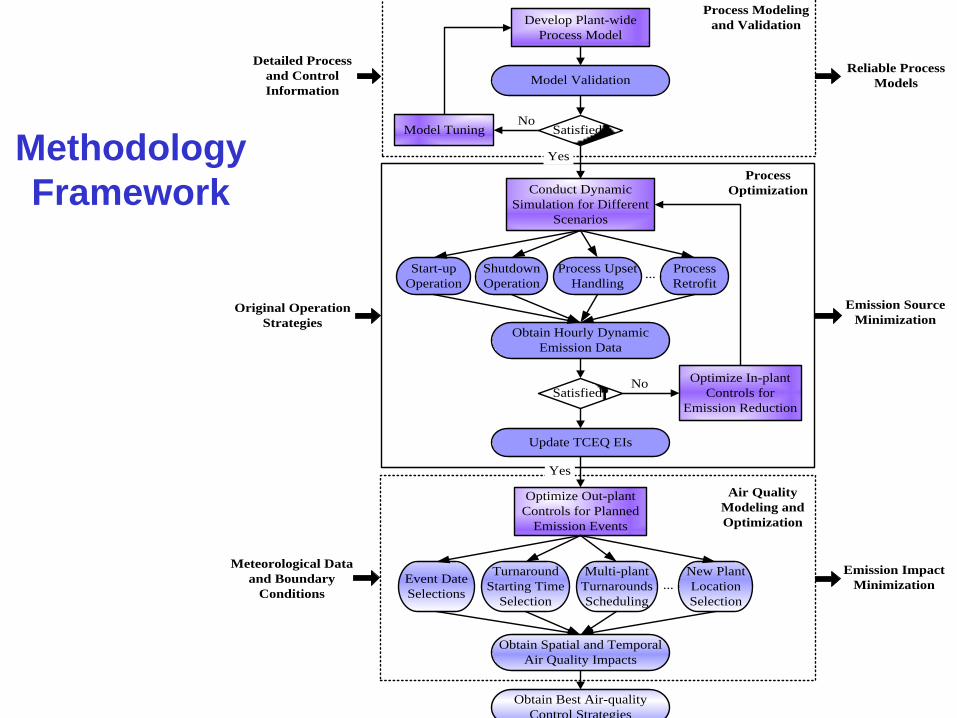
Methodology
Framework
Process Modeling
and Validation
Detailed Process
and Control
Information
Reliable Process
Models
Meteorological Data
and Boundary
Conditions
Emission Impact
Minimization
Develop Plant-wide
Process Model
Model Validation
Satisfied?Model TuningNo
Conduct Dynamic
Simulation for Different
Scenarios
Start-up
Operation
Shutdown
Operation
Process Upset
Handling
Process
Retrofit...
Optimize In-plant
Controls for
Emission Reduction
Obtain Hourly Dynamic
Emission Data
Satisfied?No
Optimize Out-plant
Controls for Planned
Emission Events
Air Quality
Modeling and
Optimization
Update TCEQ EIs
Event Date
Selections
Turnaround
Starting Time
Selection
Multi-plant
Turnarounds
Scheduling
New Plant
Location
Selection
...
Emission Source
MinimizationOriginal Operation
Strategies
Yes
Process
Optimization
Yes
Obtain Spatial and Temporal
Air Quality Impacts
Obtain Best Air-quality
Control Strategies

2. Safety-Considered Dynamic Simulation
for Flare Emission Reduction
CGC HP and LP DeC3 DeC4 & DeC5
Cold Box
DeC1 DeC2 C2 Splitter &C2
Refrigeration C3 Splitter

Example: Modeling of C2 Splitter & C2
Refrigeration Subsystem

1. Faring Minimization during Plant Start-ups
(Different Startup Designs)
Furnance
Quench
DeC1 DeC2
Chilling
Train
DeC3 DeC4
C2+
CGC
Feed
Recycle
Heater
C3+ C4+ C5+
H2/C1 C2 C3 C4H2/C1
Furnance
Quench
DeC1 DeC2
Chilling
Train
DeC3 DeC4
C2+
CGC
Feed
Recycle
Heater
C3+ C4+ C5+
H2/C1 C2 C3 C4
Flare
Streams
Recycle
Streams
DeC4 Recycle
Streams
Ordinary Process
Streams
Legend:
H2/C1
Furnance
Quench
DeC1 DeC2
Chilling
Train
DeC3 DeC4
C2+
CGC
Feed
C3+ C4+ C5+
Base Design:
Optimal Design 1:
Optimal Design 2:

Different Start-up Operational Procedures
Operational Procedure 1:
Operational Procedure 2:
Operational Procedure 3:
Rec
ycle
Flo
w R
ate
(Klb
/hr)
0
50
100
150
200
250
0 1 2 3 4 5 6 7 8 9 10 11 12 13 14 15
H2/C1 Recycle
C2 Recycle
C3 Recycle
C4 Recycle
3rd – 7th Furnace
Start-up
0
150
300
450
600
750
Light Naphtha Feed
Heavy Naphtha Feed
Cra
cked
Gas
Fee
d Fl
ow R
ate
(Klb
/hr)
Time (Hr)
1st
Furnace
2nd
Furnace Waiting Waiting
Rec
ycle
Flo
w R
ate
(Klb
/hr)
0
50
100
150
200
250
0 1 2 3 4 5 6 7 8 9 10 11 12
H2/C1 Recycle
C2 Recycle
C3 Recycle
C4 Recycle
1st
Furnace
2nd
Furnace
3rd – 7th Furnace
Start-up
0
150
300
450
600
750
Heavy Naphtha Feed
Light Naphtha Feed
Time (Hr)
Cra
cked
Gas
Fee
d F
low
Rat
e (K
lb/h
r)
Waiting
13
Rec
ycle
Flo
w R
ate
(Klb
/hr)
0
50
100
150
200
250
0 1 2 3 4 5 6 7 8 9 10 11 12
H2/C1 Recycle
C2 Recycle
C3 Recycle
C4 Recycle
1st
Furnace
2nd
Furnace
3rd – 7th Furnace
Start-up
0
150
300
450
600
750
Heavy Naphtha Feed
Time (Hr)
Cra
cked
Gas
Fee
d F
low
Rat
e (K
lb/h
r)Light Naphtha Feed

Emission Source Reductions under
Different Start-up Strategies
Case Studies Procedure 1 Procedure 2 Procedure 3
Design 1 Case 1 Case 3 Case 5
Design 2 Case 2 Case 4 Case 6
Start-up
time(hrs)
Flared raw materials (kg) Emissions (kg)
Case Design Procedure H2 C1 C2 C3 C4+ CO2 CO NOx HRVOCs
1 1 1 14 26.7 410.2 1016.3 484.0 493.1 7188.2 19.6 3.6 34.0
2 2 1 14 26.7 410.6 1016.0 481.9 380.9 6837.1 18.7 3.4 32.1
3 1 2 14 25.1 386.0 966.1 451.5 458.3 6763.5 18.4 3.4 31.9
4 2 2 14 25.1 386.3 965.8 453.0 355.6 6451.7 17.6 3.2 30.2
5 1 3 11 24.6 380.0 953.8 443.7 449.8 6658.6 18.1 3.3 31.4
6 2 3 11 24.6 380.3 953.5 446.1 349.6 6357.8 17.4 3.2 29.7
historical best start-up 25 60.8 981.1 2526.1 1368.5 1261.9 22208.7 49.0 9.0 83.3
Reduction achieved compared with historical start-up (%)
Case 1 44.0 56.0 58.2 59.8 64.6 60.9 67.6 60.1 60.1 59.1
Case 2 44.0 56.0 58.2 59.8 64.8 69.8 69.2 61.8 61.8 61.4
Case 3 44.0 58.8 60.7 61.8 67.0 63.7 69.5 62.4 62.4 61.7
Case 4 44.0 58.8 60.6 61.8 66.9 71.8 70.9 64.0 64.0 63.7
Case 5 56.0 59.5 61.3 62.2 67.6 64.4 70.0 63.0 63.0 62.3
Case 6 56.0 59.5 61.2 62.3 67.4 72.3 71.4 64.5 64.5 64.3

Air Quality Modeling
● Scenario 1: Effect of Start-up Starting Time
- 9 Cases: 0, 1, 2, 3, 4, 5, 6, 7, 8 am
● Scenario 2: Effect of Plant Location
- 2 Cases: Deer Park (D.P.); Texas City (T.C.)
● Scenario 3: Effect of Start-up Date
- 2 Cases: August 17 and August 19, 2006

Comparison of Ozone Results
Ozone Concentration
without the Start-up
Ozone Concentration
with the Start-up
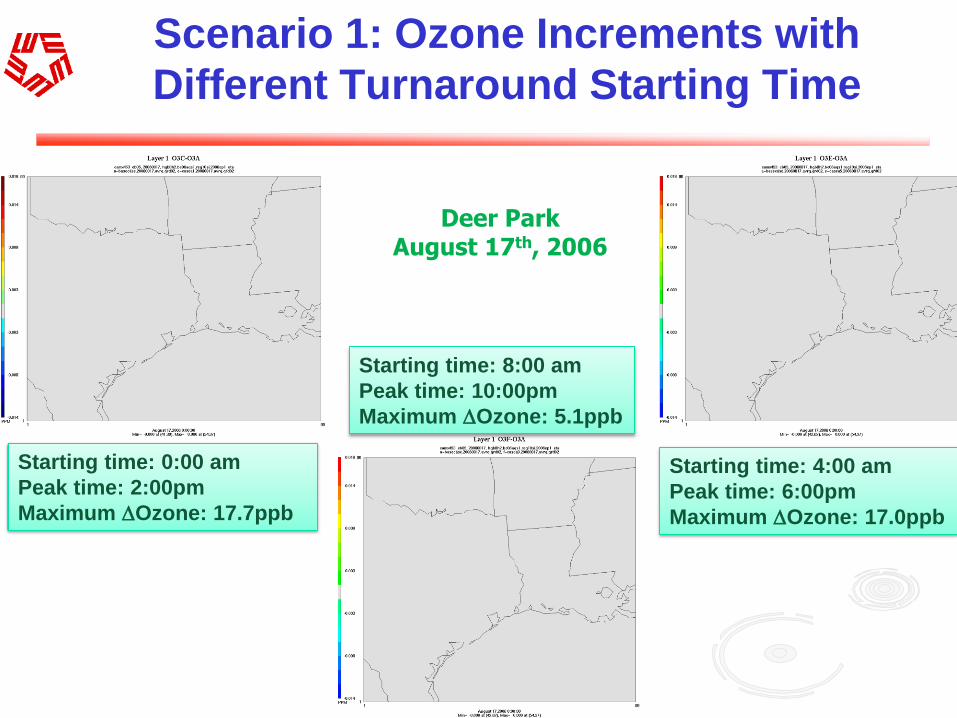
Scenario 1: Ozone Increments with
Different Turnaround Starting Time
Starting time: 0:00 am
Peak time: 2:00pm
Maximum Ozone: 17.7ppb
Starting time: 8:00 am
Peak time: 10:00pm
Maximum Ozone: 5.1ppb
Starting time: 4:00 am
Peak time: 6:00pm
Maximum Ozone: 17.0ppb
Deer Park August 17th, 2006

Domain Maximum 8-Hour-Ozone
Increments under Different Scenarios
Scenario 1
(August 17; D.P)
(ppb)
Scenario 2
(August 17; T.C.)
(ppb)
Scenario 3
(August 19; D.P.)
(ppb)
Case 1 5.5 13.6 5.2
Case 2 5.3 16.2 4.9
Case 3 4.7 16.8 4.3
Case 4 4.0 15.6 3.6
Case 5 3.3 13.6 2.9
Case 6 2.7 11.5 2.3
Case 7 2.1 9.2 1.9
Case 8 1.7 7.0 1.5
Case 9 1.3 5.4 1.2

2. Flare Minimization during Plant Shutdowns
i. Preparation of shutdown: reduce feed rate, cut off
unnecessary units, and reduce liquid/gas inventories;
ii. Shutting down the process: e.g., for olefin plants,
shutting down Charge Gas Compressor (CGC), then
cutting off furnace feed, and then other units;
iii. Decommissioning: liquid discharge, vapor discharge,
and N2 purge.
General Shutdown Procedure
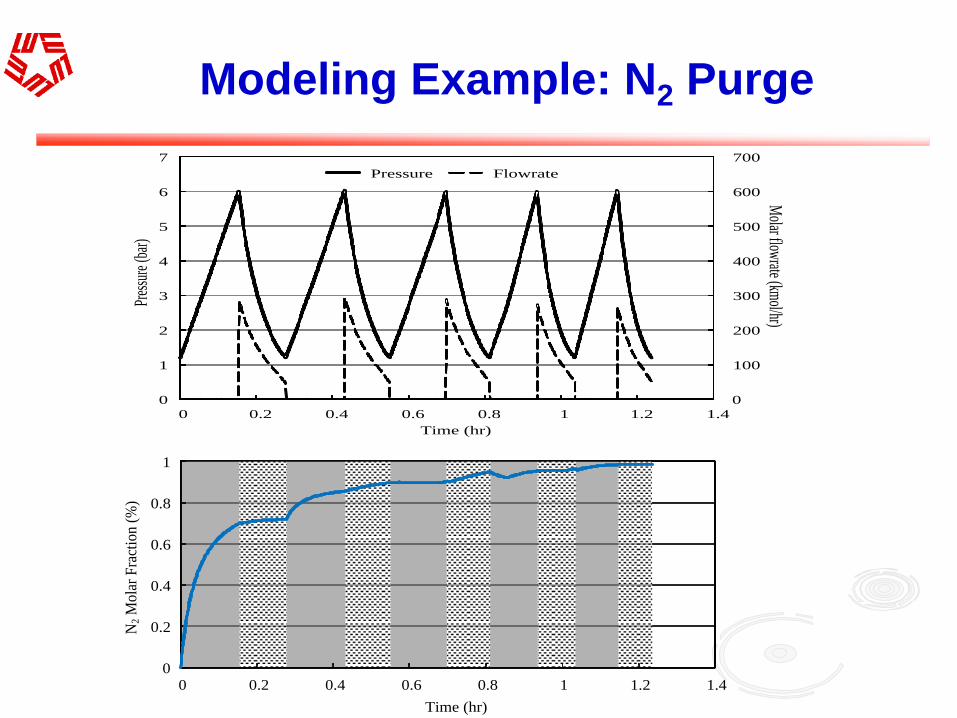
Modeling Example: N2 Purge
0
100
200
300
400
500
600
700
0
1
2
3
4
5
6
7
0 0.2 0.4 0.6 0.8 1 1.2 1.4
Molar flow
rate (kmol/hr)
Pres
sure
(bar
)
Time (hr)
Pressure Flowrate
0
0.2
0.4
0.6
0.8
1
0 0.2 0.4 0.6 0.8 1 1.2 1.4
N2 M
ola
r F
ract
ion
(%
)
Time (hr)
Pressurizing Operation Depressurizing Operation
Legend:

Schedule for An Olefin Plant Shutdown
0 5 10 15 20 25 30
Furnaces
CGC
Chilling Train
& DeC1
DeC2
C2S
DeC3
C3S
DeC4
Time (hr)
Facility Shutdown
Liquid Discharge
Vapor Discharge
Nitrogen Purge
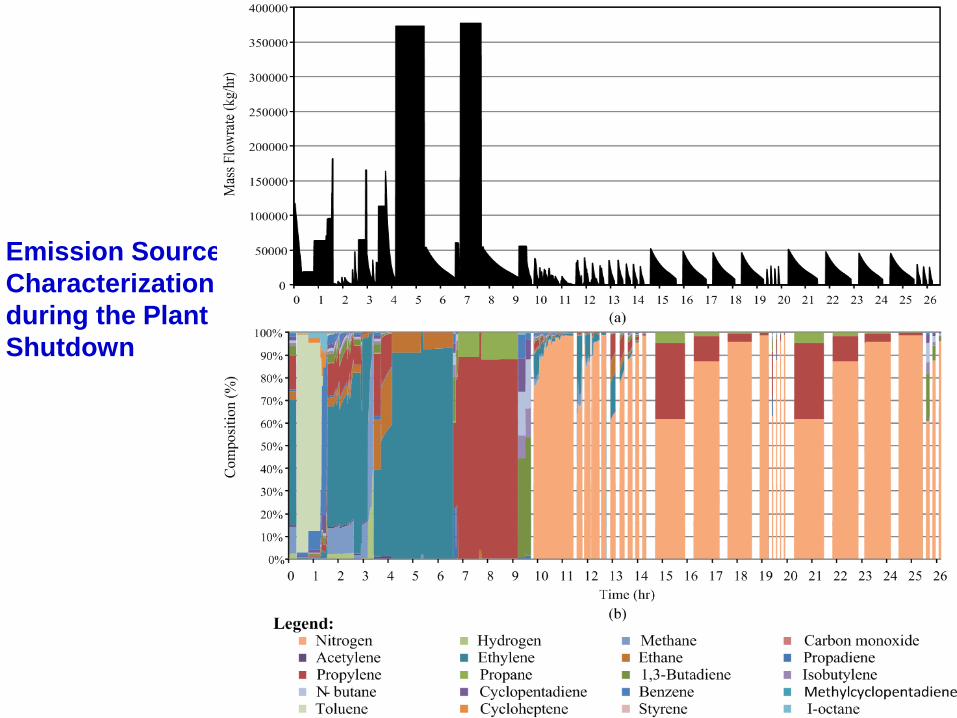
Emission Source
Characterization
during the Plant
Shutdown

Emissions
after Flaring
0
50
100
150
200
250
0 1 2 3 4 5 6 7 8 9 10 11 12 13 14 15 16 17 18 19 20 21 22 23 24 25 26 27
Mo
lar
Flo
wra
te (k
mo
l/h
r)
Time (hr)
(a)
0%
10%
20%
30%
40%
50%
60%
70%
80%
90%
100%
0 1 2 3 4 5 6 7 8 9 10 11 12 13 14 15 16 17 18 19 20 21 22 23 24 25 26 27
Mol
ar F
ract
ion
(%)
Time (hr)
NO NO2 OLE PAR TOL XYL FORM ALD2 ETH MEOH
ETOH ISOP IOLE ALDX TERP CH4 ETHA NR NASN CO
Legend:
(b)

Air Quality Modeling: Positions of the
Plant and Monitoring Station
JEFC,
C64
BMTC,
C2
S43S,
C643
PAWC,
C28
SEPA,
C628
S40S,
C640
WORA,
C9
S42S,
C642
NDLD ,
C1035
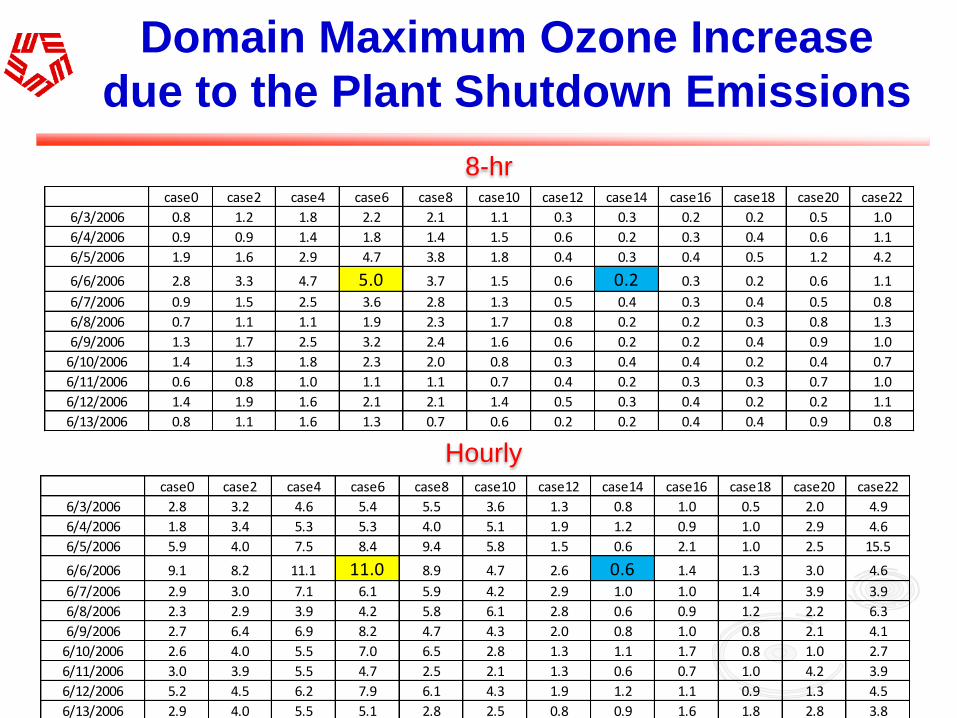
Domain Maximum Ozone Increase
due to the Plant Shutdown Emissions
Hourly
8-hr
case0 case2 case4 case6 case8 case10 case12 case14 case16 case18 case20 case22
6/3/2006 2.8 3.2 4.6 5.4 5.5 3.6 1.3 0.8 1.0 0.5 2.0 4.9
6/4/2006 1.8 3.4 5.3 5.3 4.0 5.1 1.9 1.2 0.9 1.0 2.9 4.6
6/5/2006 5.9 4.0 7.5 8.4 9.4 5.8 1.5 0.6 2.1 1.0 2.5 15.5
6/6/2006 9.1 8.2 11.1 11.0 8.9 4.7 2.6 0.6 1.4 1.3 3.0 4.6
6/7/2006 2.9 3.0 7.1 6.1 5.9 4.2 2.9 1.0 1.0 1.4 3.9 3.9
6/8/2006 2.3 2.9 3.9 4.2 5.8 6.1 2.8 0.6 0.9 1.2 2.2 6.3
6/9/2006 2.7 6.4 6.9 8.2 4.7 4.3 2.0 0.8 1.0 0.8 2.1 4.1
6/10/2006 2.6 4.0 5.5 7.0 6.5 2.8 1.3 1.1 1.7 0.8 1.0 2.7
6/11/2006 3.0 3.9 5.5 4.7 2.5 2.1 1.3 0.6 0.7 1.0 4.2 3.9
6/12/2006 5.2 4.5 6.2 7.9 6.1 4.3 1.9 1.2 1.1 0.9 1.3 4.5
6/13/2006 2.9 4.0 5.5 5.1 2.8 2.5 0.8 0.9 1.6 1.8 2.8 3.8
case0 case2 case4 case6 case8 case10 case12 case14 case16 case18 case20 case22
6/3/2006 0.8 1.2 1.8 2.2 2.1 1.1 0.3 0.3 0.2 0.2 0.5 1.0
6/4/2006 0.9 0.9 1.4 1.8 1.4 1.5 0.6 0.2 0.3 0.4 0.6 1.1
6/5/2006 1.9 1.6 2.9 4.7 3.8 1.8 0.4 0.3 0.4 0.5 1.2 4.2
6/6/2006 2.8 3.3 4.7 5.0 3.7 1.5 0.6 0.2 0.3 0.2 0.6 1.1
6/7/2006 0.9 1.5 2.5 3.6 2.8 1.3 0.5 0.4 0.3 0.4 0.5 0.8
6/8/2006 0.7 1.1 1.1 1.9 2.3 1.7 0.8 0.2 0.2 0.3 0.8 1.3
6/9/2006 1.3 1.7 2.5 3.2 2.4 1.6 0.6 0.2 0.2 0.4 0.9 1.0
6/10/2006 1.4 1.3 1.8 2.3 2.0 0.8 0.3 0.4 0.4 0.2 0.4 0.7
6/11/2006 0.6 0.8 1.0 1.1 1.1 0.7 0.4 0.2 0.3 0.3 0.7 1.0
6/12/2006 1.4 1.9 1.6 2.1 2.1 1.4 0.5 0.3 0.4 0.2 0.2 1.1
6/13/2006 0.8 1.1 1.6 1.3 0.7 0.6 0.2 0.2 0.4 0.4 0.9 0.8
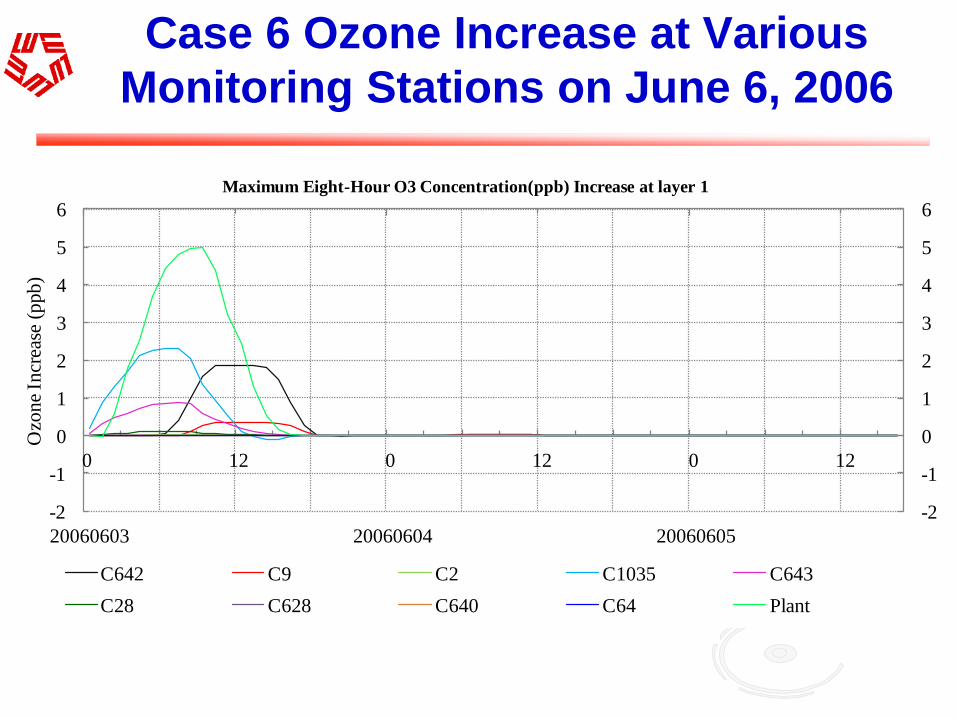
Case 6 Ozone Increase at Various
Monitoring Stations on June 6, 2006
20060603 20060604 20060605
-2
-1
0
1
2
3
4
5
6
-2
-1
0
1
2
3
4
5
6
0 12 0 12 0 12
Ozo
ne
Incr
ease
(p
pb
)
Maximum Eight-Hour O3 Concentration(ppb) Increase at layer 1
C642 C9 C2 C1035 C643
C28 C628 C640 C64 Plant

OP1
Furn
ace
Furn
ace
Furn
ace
CGC
Stages
1-3 HP
-DeC
3
CGC
Stage 4
C2
Conver
ter
LP
-DeC
3
DeC
4
DeC
5
DeC
1 S
trip
per
DeC
1
Chilling Train 1st
DeC
2
2n
d D
eC2
C2 S
pli
tter
C3 S
pli
tter
Legend: Ordinary Process
Stream
New Stream for
Plant Start-up
Oil & Water
Quench
C2 Refrig.
System
C3 Refrig.
System
Furn
ace
Furn
ace
A Novel Shutdown Strategy for Flare
Minimization at An Olefin Plant

3. Flare Minimization under Process Upsets

Flare Minimization Support
• Short-time and small quantity of off-spec flaring source ---> to CGC suction.
• Long-time and large quantity of off-spec flaring source ---> to furnace feed with the consideration of fresh feed reduction.
• CGC dynamic simulation will determine the quantitative impacts.

Flare Minimization Strategy under
Process Upsets
C2 Reactor
Effluent
Off-spec Stream
Identification?
C2 Splitter
Overhead
Process Upsets
Identification?
Process Upsets
Identification?
STSQ Upsets LTLQ Upsets STSQ Upsets LTLQ Upsets
Recycle to CGC
InletRecycle to Furnace
System Inlet
Recycle to Both CGC and
Furnace System Inlets
F1 F3
F2 F4 F5 F1'
F3'
F2' F4'
F5'
Flare System
Fflared= F-F5 (F5')F > F5 F > F5’
Legend:
First Priority Choice Second Priority Choice: : Third Priority Choice: Others:

4. Air-quality Conscious Plant Site
Selection

Air-quality Conscious Plant Site
Selection (Cont’d)
270280
290300
310320
072
144216
288360
0
3
6
9
12
15
Ambient Temperature (K)
Wind Direction (degree)
Win
d S
peed (
m/s
)
270 275 280 285 290 295 300 305 310 315 3200
50
100
150
200
250
300
Temperature (K)
Count
200
400
600
800
30
210
60
240
90
270
120
300
150
330
180 0
0
0 2 4 6 8 10 12 14 16 180
500
1000
1500
2000
2500
3000
Wind Speed (m/s)
Count
Count
X (meter)
Y (
met
er)
0 500 1000 1500 2000 2500 3000 3500 4000 4500 50000
500
1000
1500
2000
2500
3000
3500
4000
4500
5000
E1
E2
E3
E4E5
E6
E7
E8
E9
01
23
45
01
23
450
20
40
60
80
100
120
X (kilometer)Y (kilometer)
Co
nce
ntr
atio
n (
pp
b)
0
20
40
60
80
100
120

Case Study 1: Domain Peak Concentration
Impact from Candidate Locations
X (meter)
Y (
met
er)
0 500 1000 1500 2000 2500 3000 3500 4000 4500 50000
500
1000
1500
2000
2500
3000
3500
4000
4500
5000
E1
E2
E3
E4E5
E6
E7
E8
E9
0
20
40
60
80
100
120

Case Study 2: Peak Concentration
Impact from Two New Plants
Location Node of New Plant A
Loca
tion N
ode
of
New
Pla
nt
B
1 13 25 37 49 61 73 851
13
25
37
49
61
73
85
70
75
80
85
90
95
65

5. Optimization for Smart Air-quality
Monitoring Station Allocation
X (meter)
Y (
mete
r)
0 500 1000 1500 2000 2500 3000 3500 4000 4500 50000
500
1000
1500
2000
2500
3000
3500
4000
4500
5000
E1
E2
E3
E4E5
E6
E7
E8
E9
10
15
20
5
5

Case Studies
X (x100m)
Y (
x100m
)
0 5 10 15 20 25 30 35 40 45 500
5
10
15
20
25
30
35
40
45
50
5
10
15
20
25
30
35
40
X (x100m)
Y (
x100m
)
0 5 10 15 20 25 30 35 40 45 500
5
10
15
20
25
30
35
40
45
50
5
10
15
20
25
30
35
40
45
X (x100m)
Y (
x100m
)
0 5 10 15 20 25 30 35 40 45 500
5
10
15
20
25
30
35
40
45
50
5
10
15
20
25
30
35
40
45
X (x100m)
Y (
x100m
)
0 5 10 15 20 25 30 35 40 45 500
5
10
15
20
25
30
35
40
45
50
5
10
15
20
25
30
35
40
45
New Emission
Profile
25 Units of
Budget
110 Units of
Budget
85 Units of
Budget
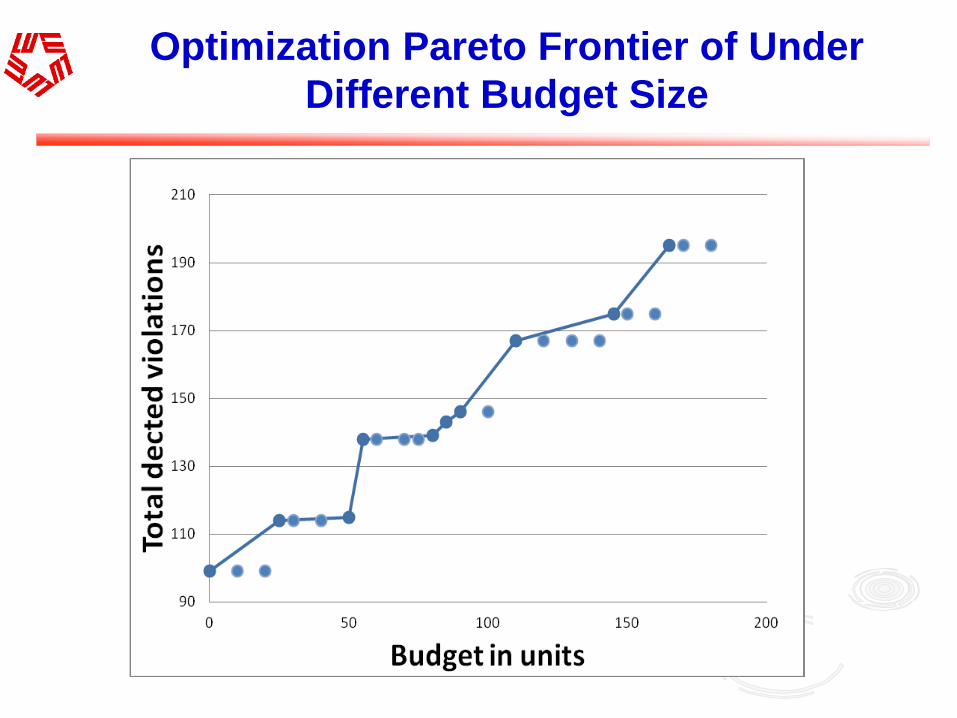
Optimization Pareto Frontier of Under
Different Budget Size

Summary of Current Progress and
Future Study Expectation
• Partially supported by the TARC project, 7 journal papers and 4 conference papers have been published;
• 12 conference presentations;
• Conduct more case studies for different chemical processes under various turnarounds;
• Integrate various industrial practices on emission reduction with air-quality modeling;
• Study cost-effective and air-quality-conscious emission control strategies.

Concluding Remarks
• Multi-scale dynamic simulation and optimization by coupling emission source reduction and air quality modeling is important to study Texas air quality;
• This project helps identify cost-effective and air-quality-conscious control strategies, which benefits Texas air quality control;
• Significant progresses have been made;
• Look forward to the success of the final project.

http://customersrock.files.wordpress.com/2007/04/thank-you.jpg

Cases with Different Starting Time
0
100
200
300
400
500
600
1 4 7 10 13 16 19 22
To
tal E
mis
sio
ns (
km
ol/
hr)
Time (hour)
Case 1
Case 2
Case 3
Case 4
Case 5
Case 6
Case 7
Case 8
Case 9
Starting Time
Peak Time
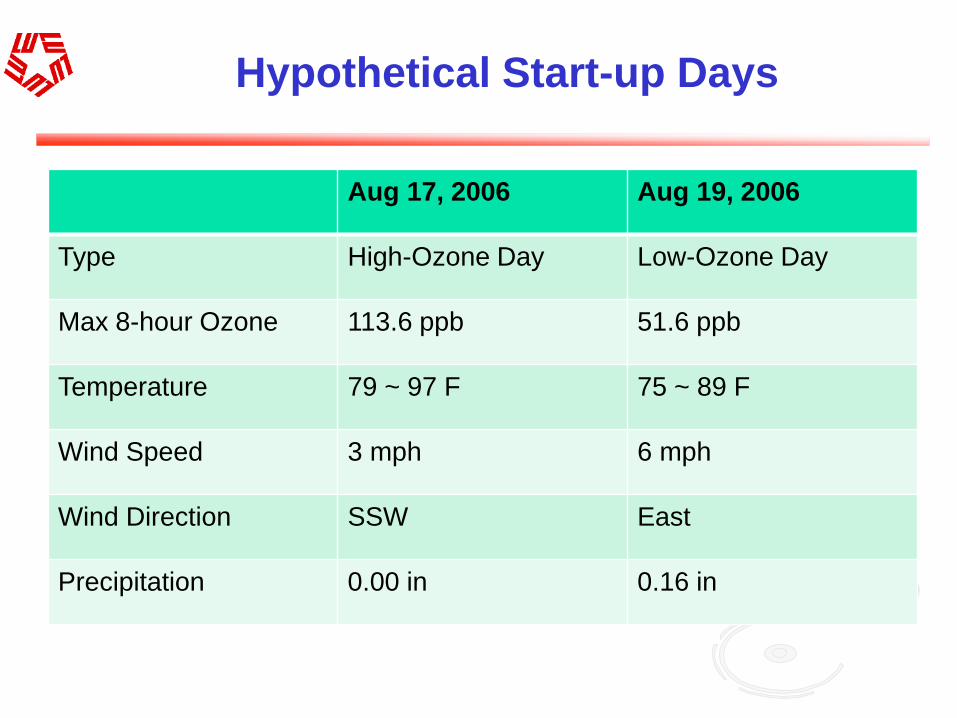
Hypothetical Start-up Days
Aug 17, 2006 Aug 19, 2006
Type High-Ozone Day Low-Ozone Day
Max 8-hour Ozone 113.6 ppb 51.6 ppb
Temperature 79 ~ 97 F 75 ~ 89 F
Wind Speed 3 mph 6 mph
Wind Direction SSW East
Precipitation 0.00 in 0.16 in

Plant Located in VOC Control Area
10:00 11:00 12:00