study status report - florida institute of...
TRANSCRIPT
Final Study Report
Renewable Energy
Development of a Wind Speed Test Bedand an Electrical Generator for
the Botanical Gardens Demonstration Waterwheel
8/3/2006
Florida Institute of Technology,Melbourne, Florida 32901
Frank R. Leslie, Adjunct Professor,Department of Marine and Environmental Systems
Advisor, Dr. Robert L. Sullivan, Director, Institute for Electrical Systems
AbstractThe Renewable Energy Research and Education Laboratory was enhanced by developing a motor-generator system to emulate wind variations acting upon a wind turbine generator.
The Botanical Gardens waterwheel was modified to generate low voltage electrical power as a demonstration of hydroelectric systems.
These advances provide students with further opportunities in studying renewable energy.
1.0 IntroductionThe Renewable Energy Research and Education Laboratory will establish technical capability to support the goals of the Institute for Energy Systems and the Florida Solar Energy Center (FSEC). This lab focuses on the fields of wind, solar, hydro, and ocean energy. Other renewable energies, such as geothermal and biomass, may be added in future years.
The proposal project plan and budget were submitted 5/1/2005. Areas of study and laboratory improvement were to be enhanced to provide more accurate data and a teaching lab area for students. The intended solar concentrator and ocean current flow tank modification tasks were eliminated due to lack of time and personnel, and those dedicated funds were returned to Dr. Sullivan.
Initial funding authorization finally was received 11/20/2005. This report covers the period from that date until the date of this report.
This report will have continuing revisions that will appear at my.fit.edu/~fleslie under the Grants section.
Florida Tech increases its strengths in energy to prepare students for the challenges that will result as fossil fuels diminish in ready availability and thus increase in price. Florida Tech is fortunate to have an excellent working relationship with the Florida Solar Energy Center. The present Q-12 Renewable Energy Laboratory has initial accumulated and some borrowed (from F. R. Leslie) equipment, but needed additional dataloggers, and robust mechanical motor and generator drive equipment.
2.0 Original Tasks and Plans(This section was modified from the original proposal when it became clear that there was insufficient time and personnel to complete the planned tasks when the funding authorization was delayed some five months.)

2.0.1 Tasks
Tasks were changed to expand upon or modify those of the original proposal. There were some adjustments, but the priority of completion of major progress by the end of the (extended) grant period determined the direction of effort.
2.0.2 Plans
The overall plan was to greatly enhance the Q-12 Renewable Energy Laboratory to allow students to complete dynamic generator power experiments within a class period.
2.0.3 Purchases
Definition of purchases often requires a tradeoff analysis to obtain adequate and cost-effective equipment. There are certain capabilities that must be demonstrated to establish the worthiness of future grants. Presentation software and equipment is necessary for education as well as for understanding complex data constructs. Energy operations require data collection of multiple parameters at rates commensurate with twice the highest frequency of the natural parameters to be measured (Nyquist Criterion). Defined purchases will be obtained early in the program through the final days.
2.1 Wind
Advanced datalogging and measurement capabilities are needed to accurately define energy conversion. Wind energy in this coastal area is limited, but correlates well with the utility power peaks that are driven by air conditioning systems. According to Putnam[1], “Winds with the same hourly average may give widely different values of output”. This effect is due to the distribution of speeds. Most regimes have a Rayleigh distribution, but Weibull is more general.
2.2 Hydro
Hydropower in this region is limited to North Florida, but our students need to understand hydroelectric systems. A small waterwheel was constructed for the Botanical Garden and installed in June 2004. The existing 2 ft wide by 2 ft diameter breast-shot waterwheel in the Botanical Gardens has had a continuing maintenance problem due to the PVC bearings. They lasted about two years, but wore through with the continual rotation. The garden area floods perhaps thirty times per year whenever there is a heavy rain storm to the west. The wheel was then under water approximately 1.0 to 1.5 ft, resulting in sediment, primarily sand, entering the open bearings and causing wear. These bearings were be replaced by sealed ball bearings with grease fittings for occasional purging if necessary.
A generator is to be added so that the variations of this minor power source may be researched in correlation with local rainfall as measured by the Roberts Hall rain gage some five hundred feet to the north. A datalogger will provide timed data of stream height and the power generated. The garden area floods frequently, providing data for support of energy, mechanical/electrical/civil engineering, meteorology, and hydrology classes.
2.3 Solar
This phase was set aside due to the limited time, lack of student work-study support, and the necessary time to teach the Renewable Energy course, ENS4300/5300 in the Spring 2006 semester. Remaining budgeted funds were returned to Dr. Sullivan for reallocation.
Solar energy in the “Sunshine State” is not as good as one might expect due to the cloudiness and rainfall that develop with the advent of the sea breeze. A satellite C-Band communications antenna was to be converted to a paraboloidal concentrating reflector for research in dissociation of water to extract hydrogen, generate steam, and test high temperature materials. Facilities Management has designated an existing, surplus 10-ft diameter antenna and promised fabrication help. There is also a ~7-ft diameter antenna (X-Band?) that may be used for a prototype. There are several challenges: developing a mount that can resist hurricane force winds, servo tracking the sun to an accuracy better than one degree of arc, and applying a reflective surface of Alanod mirror metal to develop a nonimaging focus to concentrate upon the receiver.
2.4 Ocean
This phase was set aside due to the limited time, lack of student work-study support, and the necessary time to teach the Renewable Energy course, ENS4300/5300. Remaining budgeted funds were returned to Dr. Sullivan for reassignment.
DMES is a systems-oriented organization that contains our oceanography curriculum. Other countries from the United Kingdom to Norway are more advanced in development of ocean energy systems that use tidal, wave, and current power converters. The department has a 30-foot wave channel building southeast of the Olin Physical Sciences Building. This tank could be modified by placing a removable horizontal separator halfway down in the tank. A flow device (pump or paddlewheel) could then propel water along the top half to return underneath to be recirculated. A speed of four knots (6.75 feet per second) would be needed to simulate the Gulf Stream; faster for use in ship hull dynamic testing. Energy efficiency could be studied by placing various slippery coatings on hull models to measure their effects on reducing drag and improving propulsion efficiency. A flow tank produces unlimited data as opposed to a towing tank where a model hull must start and stop.
3.0 ResultsSeveral new laboratory capabilities have been added to educate students in renewable energy principles. In addition, the motor-generator test bed may be used to turn various rotating machines to demonstrate electrical responses and generate characteristic curves.
3.1 Wind
The direct-connected wind turbine on the field station can be evaluated as to starting speed, battery charging voltage, and aerodynamic efficiency. Graphing (charting) will be developed to display dynamic results. Additional datalogging capability will provide speed measurements.

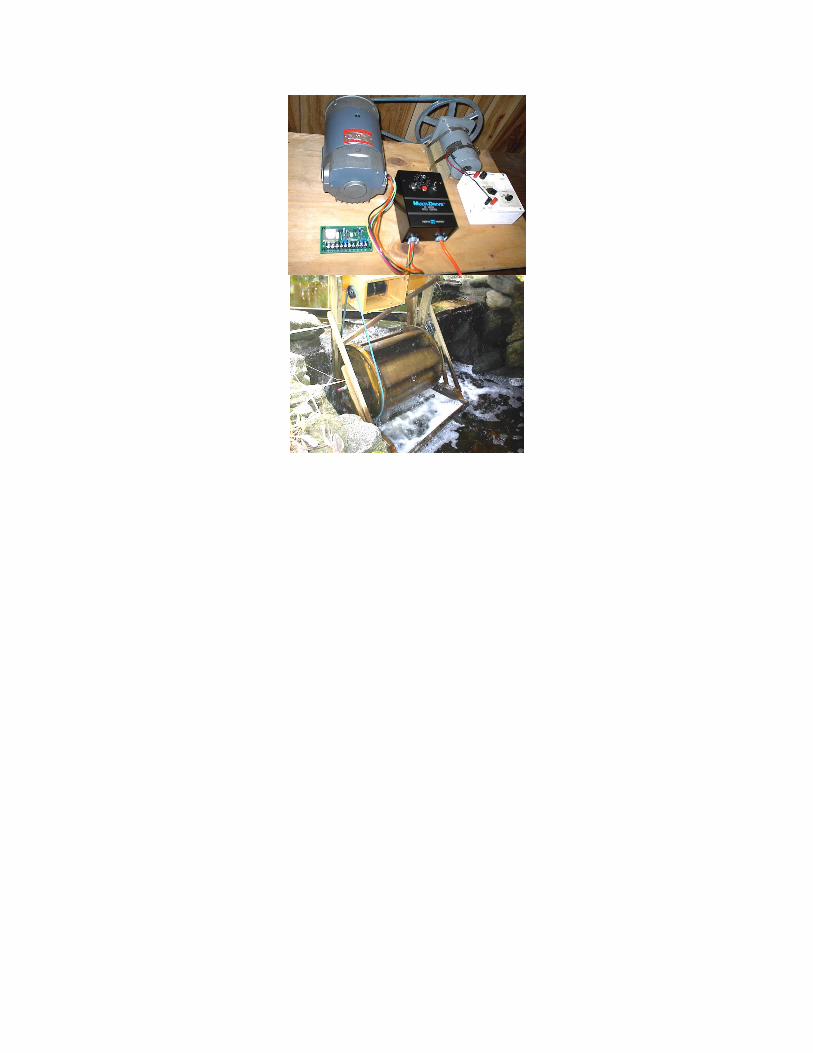
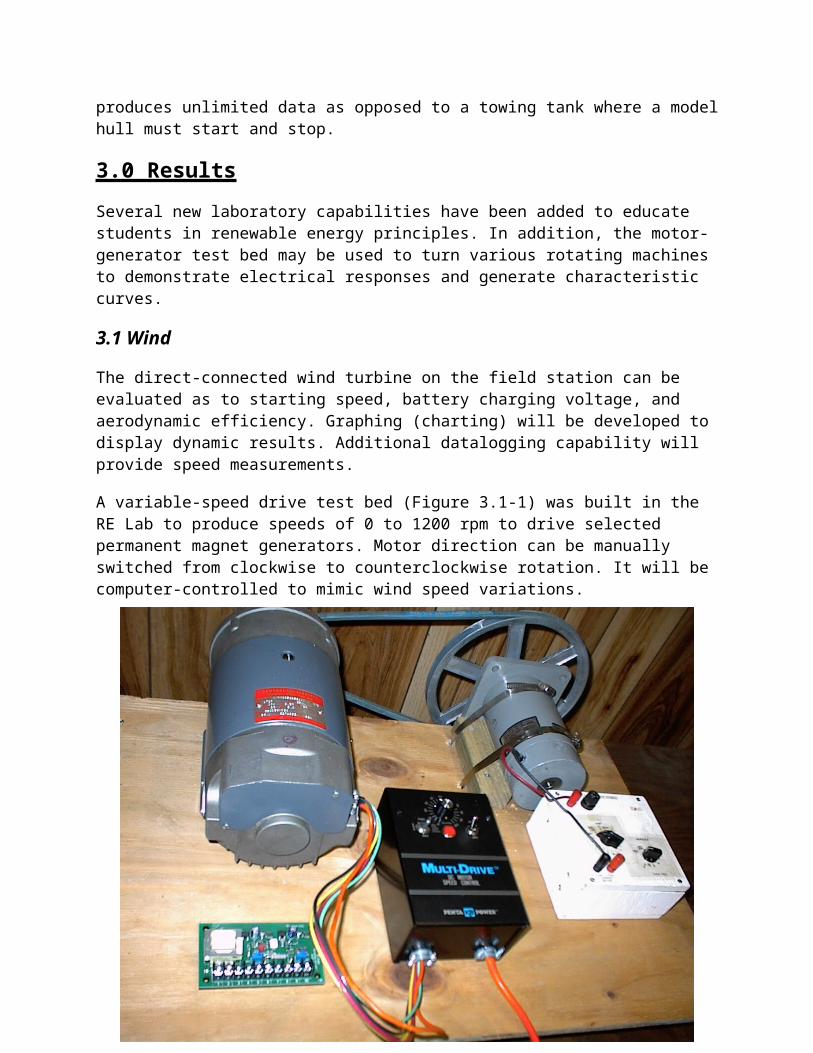
A variable-speed drive test bed (Figure 3.1-1) was built in the RE Lab to produce speeds of 0 to 1200 rpm to drive selected permanent magnet generators. Motor direction can be manually switched from clockwise to counterclockwise rotation. It will be computer-controlled to mimic wind speed variations.
Figure 3.1-1. The generator test bed drives a generator at variable speeds for characteristic curve testing.
Figure 3.1-1 shows a ½ hp direct current motor (upper left) that is controlled by a KB Electronics KBM-240D Multi-Drive controller. The KB Electronics KBSI-240D green isolator card at the lower left will be connected to the controller to drive it with a computer digital to analog convertor signal with 0-5Vdc or 0-10Vdc in proportion to the wind speed data file. Since the Roberts Hall web data is available real time, real time drive motor response may simulate the wind regime in other locations.
Dataq datalogger/converter equipment[2] has been selected for instrumentation. The model DI-720-USB runs from a computer USB port and thus will remain current for many years.
The generator under test (upper right) is turned at a nominal 400 rpm that represents a slower speed wind turbine rotor. The 10-inch pulley is driven by a 3.5-inch pulley to reach the speed of a representative wind regime. The pulley ratios may be changed to obtain a different ratio. A digital photo tachometer will measure shaft speed.
The previously existing white load box (lower right) allows various loads to be applied to the permanent magnet generator for I vs. E characteristic curve development as a function of rpm.
The isolator card connections (Figure 3.1-2) are shown in KB Electronic’s Figure 6B below.
Figure 3.1-2. The KBSI-240D isolator card permits safe connection to a computer-driven digital to analog convertor that controls the motor speed.
The DAC output of 0-10Vdc is input to the KBSI-240D, and a select switch will still allow manual knob speed control for testing. The motor will then be capable of adjustable fixed speeds as well as the computer program control.
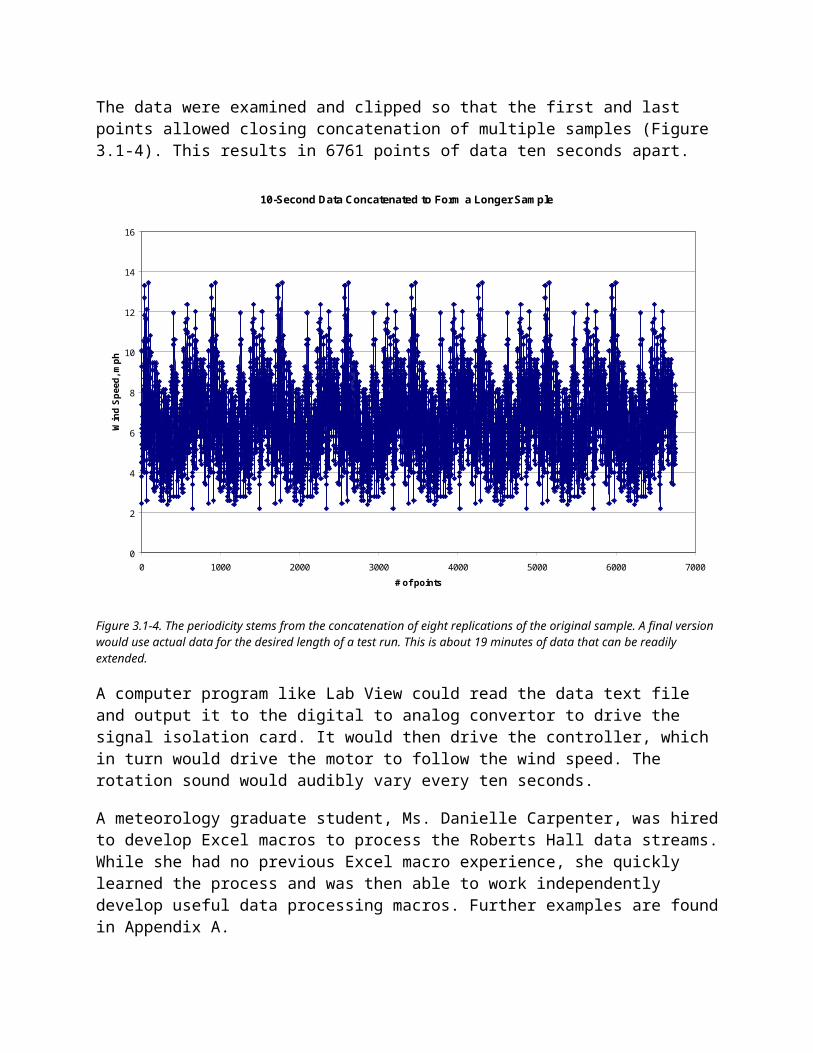
A series of ten-second wind data from the Roberts Hall installation was selected as a representative or typical sample (Figure 3.1-3).
10-Second Data
0
2
4
6
8
10
12
14
16
0 20 40 60 80 100 120 140 160
# of ten-second points
Figure 3.1-3. This ten-second sample shows typical wind speed (mph) variation in Melbourne FL.
The data were examined and clipped so that the first and last points allowed closing concatenation of multiple samples (Figure 3.1-4). This results in 6761 points of data ten seconds apart.
10-Second Data Concatenated to Form a Longer Sample
0
2
4
6
8
10
12
14
16
0 1000 2000 3000 4000 5000 6000 7000
# of points
Win
d Sp
eed,
mph
Figure 3.1-4. The periodicity stems from the concatenation of eight replications of the original sample. A final version would use actual data for the desired length of a test run. This is about 19 minutes of data that can be readily extended.
A computer program like Lab View could read the data text file and output it to the digital to analog convertor to drive the signal isolation card. It would then drive the controller, which in turn would drive the motor to follow the wind speed. The rotation sound would audibly vary every ten seconds.
A meteorology graduate student, Ms. Danielle Carpenter, was hired to develop Excel macros to process the Roberts Hall data streams. While she had no previous Excel macro experience, she quickly learned the process and was then able to work independently develop useful data processing macros. Further examples are found in Appendix A.
3.2 Hydro
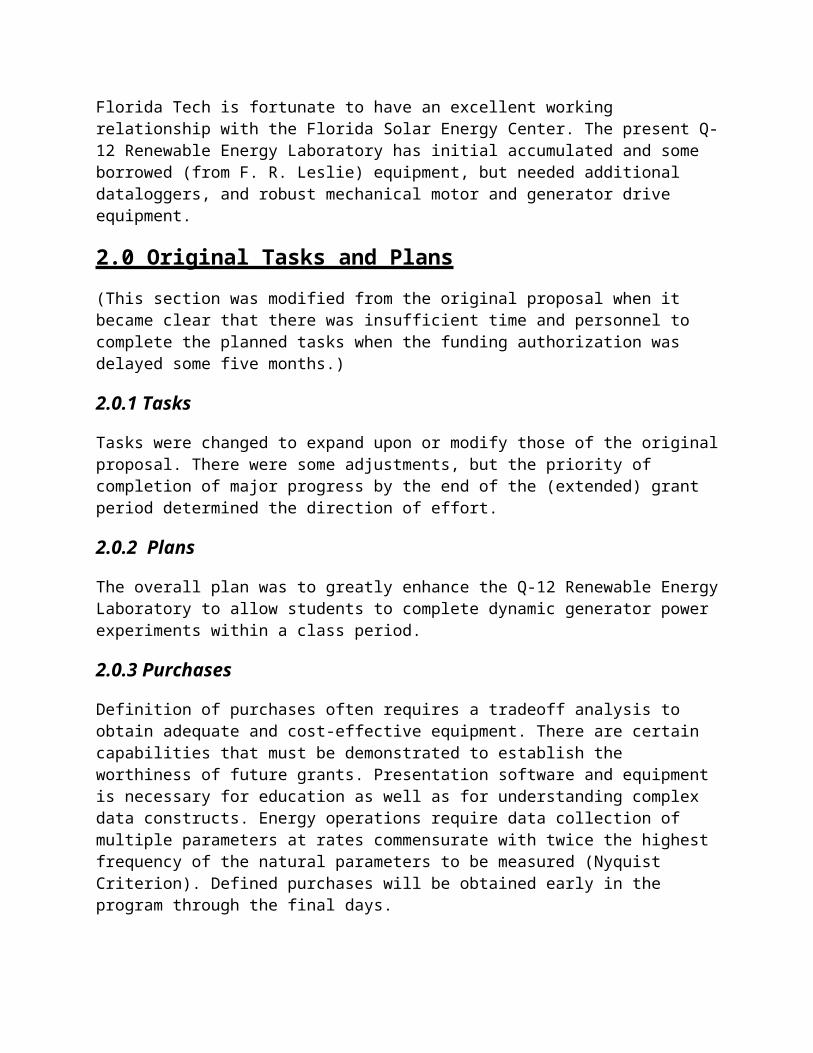
The Botanical Gardens waterwheel was modified to have the newly-fabricated, 24-inch diameter pulley installed. A new mounting structure for the generator was fabricated and installed on the west rim of the wheel. New ball bearings were installed on the wheel axle. A permanent magnet generator was installed and driven by the waterwheel to provide power measurements.

This waterwheel has operated since ~April, 2004 and has endured many rainstorm floods.
The approximate power[3] is P(kW) = 10 · η · Q · H,where η is the efficiency of ~70%Q is the flow in cubic meters per secondand H is the water head in meters
For the waterwheel installation, this will be P = 10 · 0.7 · 0.0154 · 0.5 = 0.053 kilowatts or 53 watts
An initial test has shown nine watts at lower spillway water. While limited power is generated, it is sufficient for demonstrations and experiments.
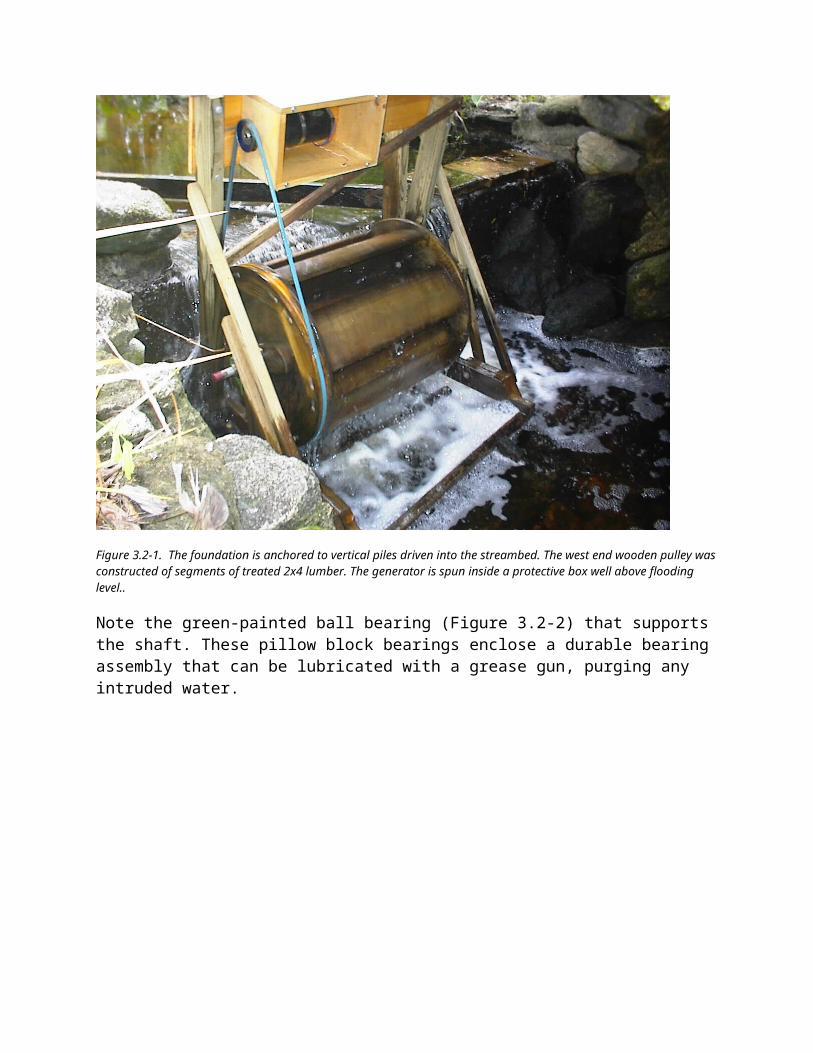
Figure 3.2-1. The foundation is anchored to vertical piles driven into the streambed. The west end wooden pulley was constructed of segments of treated 2x4 lumber. The generator is spun inside a protective box well above flooding level..
Note the green-painted ball bearing (Figure 3.2-2) that supports the shaft. These pillow block bearings enclose a durable bearing assembly that can be lubricated with a grease gun, purging any intruded water.
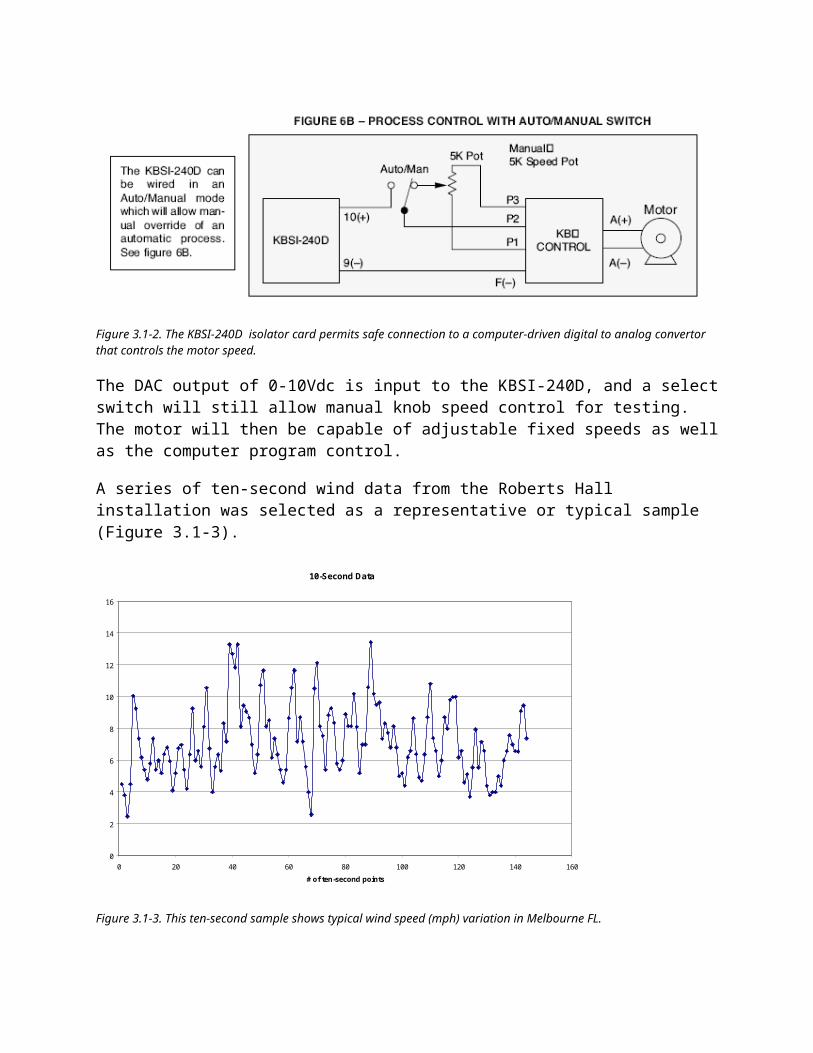
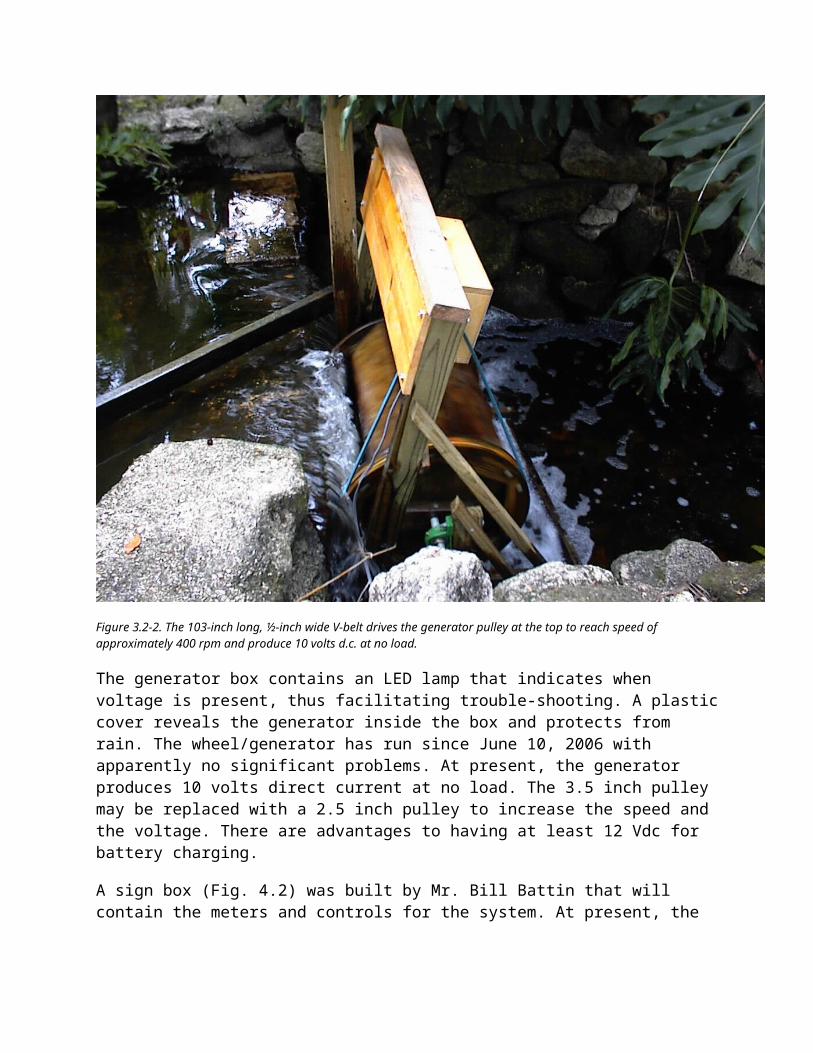
Figure 3.2-2. The 103-inch long, ½-inch wide V-belt drives the generator pulley at the top to reach speed of approximately 400 rpm and produce 10 volts d.c. at no load.
The generator box contains an LED lamp that indicates when voltage is present, thus facilitating trouble-shooting. A plastic cover reveals the generator inside the box and protects from rain. The wheel/generator has run since June 10, 2006 with apparently no significant problems. At present, the generator produces 10 volts direct current at no load. The 3.5 inch pulley may be replaced with a 2.5 inch pulley to increase the speed and the voltage. There are advantages to having at least 12 Vdc for battery charging.
A sign box (Fig. 4.2) was built by Mr. Bill Battin that will contain the meters and controls for the system. At present, the generator output temporarily drives some small bulbs for demonstration.
3.3 Solar
This task was set aside and funds were remanded to Dr. Sullivan. The solar concentrator project will be deferred until there is focused funding to support the task. This is a candidate for a senior project as it involves engineering design in electrical, physics, and mechanical areas.
3.4 Ocean
Task set aside and funds were remanded to Dr. Sullivan.
4.0 Plans for Project ContinuationSince I am a volunteer researcher except when teaching the Renewable Energy course (ENS4300/5300) in the spring, I will be able to extend and complete many aspects of the two projects during the Fall Semester if the equipment/software is on hand. No labor costs are necessary in this pro bono effort.
4.1 Wind
4.1.1 Test Bed
A surplus computer will be used for drive control and datalogger interfacing. This computer has two USB ports and two serial ports.
While the drive speed will be manually controlled initially, the eventual goal is to produce a variable speed drive from a looped digital signal recorded from actual hydro, wind, or solar speed variations for the evaluation of efficiency and battery charging capability. This approach was stimulated by viewing the National Wind Technology Center’s 2.5 megawatt, 3305 hp drive system[4]. (Ours will be somewhat smaller.)
This test bed might be used in reverse as a dynamometer to evaluate motor speed characteristics.
4.1.2 Field System Wind Turbine Evaluation
Voltage and current measurements will be developed to show the power generated at each wind speed within the operating range. The present turbine on the Wind/Solar Field Instrumentation Station is a Mallard 800H, 24 volts from “Mikes Windmill Shop” of Show Low, Arizona[5]. This type was picked due to its low $384 cost and its likely appeal to those looking for inexpensive experimental wind power generation. The low cost would enable it to be installed for elementary and middle school science labs. This turbine has internal diodes but no regulator that would make energy measurements difficult. A datalogger will be temporarily installed to extract and record the data. This work was deemphasized to concentrate upon other tasks.
4.2 Hydro
The waterwheel will be tuned up mechanically after it has run a few weeks. The generator pulley will be replaced with a smaller size to gain voltage, and the V-belt will be retensioned. Various

structural improvements will increase its ability to survive buoyant forces during hurricane rain floods. Some of the structure will be refinished to ensure longevity.
The sign box will be reworked to incorporate switches and meters to display the voltage and current being produced. A power outlet on the back will permit connecting external equipment to the generator. The front of the display will look somewhat like the Figure 4.2.
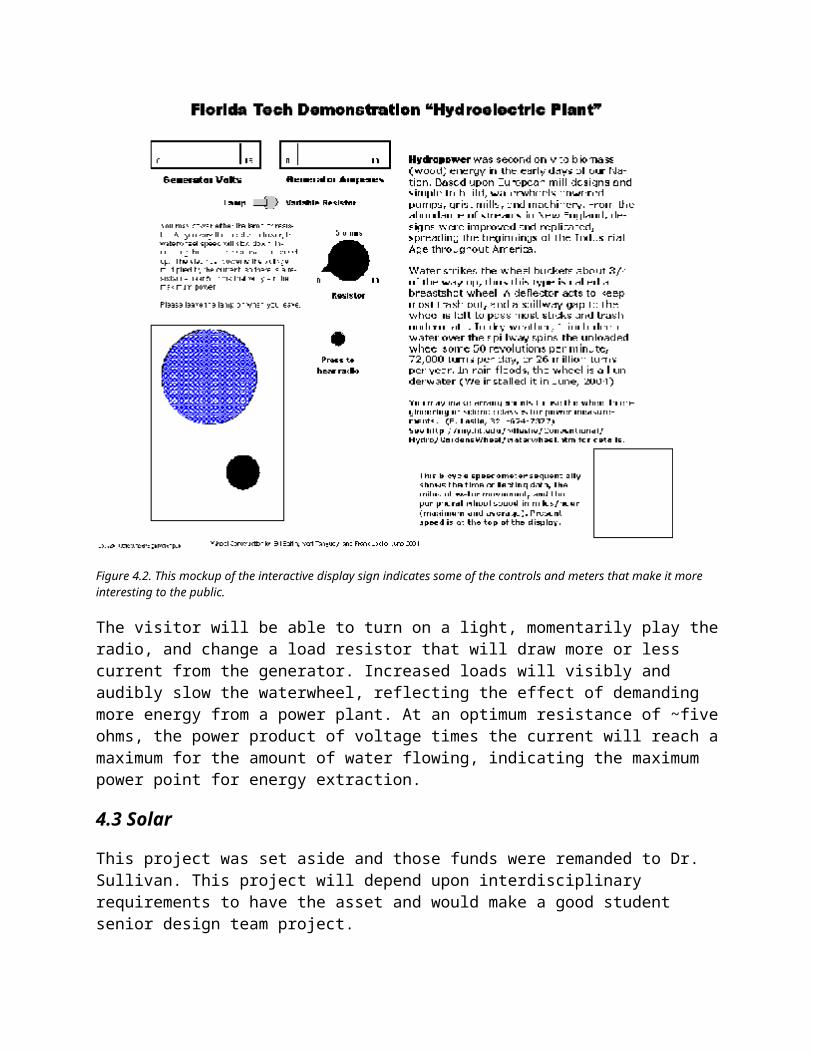
Figure 4.2. This mockup of the interactive display sign indicates some of the controls and meters that make it more interesting to the public.
The visitor will be able to turn on a light, momentarily play the radio, and change a load resistor that will draw more or less current from the generator. Increased loads will visibly and audibly slow the waterwheel, reflecting the effect of demanding more energy from a power plant. At an optimum resistance of ~five ohms, the power product of voltage times the current will reach a maximum for the amount of water flowing, indicating the maximum power point for energy extraction.
4.3 Solar
This project was set aside and those funds were remanded to Dr. Sullivan. This project will depend upon interdisciplinary requirements to have the asset and would make a good student senior design team project.
4.4 Ocean
This project was set aside and those funds were remanded to Dr. Sullivan. This might be a student project to enhance the facility for a student ocean current experiment.
5.0 ConclusionThe Renewable Energy Laboratory was enhanced to provide a more effective area for energy investigations and student demonstrations.
Disparate energy sources were developed to attract the attention of students and educate them in the advantages and limitations of renewable energy.
A prototype wind speed text file was developed to provide a driving signal to the computer digital to analog convertor. This signal will drive the test bed generator as though it were connected mechanically to a wind turbine rotor. The speed of the generator will vary with the wind speed file that is presented to it. Energy produced thus varies and statistical studies of replicable data can be studied.
A unique demonstration hydroelectric plant was built in the Botanical Gardens. The next closest hydroelectric plant is the C. H. Corn Plant near Tallahassee. This system will allow students to vary the load on the waterwheel and assess the changes in power.
Excel macros were developed to process the continuing real-time weather and energy data from the DMES Roberts Hall installation.
Significant advances have been made to improve student experimental capacity. The public has a greater awareness of renewable energy, thus prospective students and their parents may find these capabilities of interest.
References1. Palmer Cosslett Putnam. New York: Van Nostrand Reinhold Company, p. 128, 1948.
2. Dataq website http://www.dataq.com/ and http://www.dataq.com/products/hardware/di720.htm [last accessed 8/1/2006]
3. Godfrey Boyle. Renewable Energy, Second Edition. New York: Oxford University Press. p. 156. Eq. 2b, 2004.
4. National Renewable Energy Laboratory, National Wind Technology Center, Rocky Flats CO. http://www.nrel.gov/docs/fy00osti/27959.pdf [last accessed 8/3/2006]
5. Mike’s Windmill Shop, Show Low AZ. http://www.mikeswindmillshop.com/wgenerators.html [last accessed 8/3/2006]
Appendices
A. Excel Macro Development
A.1 Introduction
This Excel spreadsheet (Figure A.1) is part of the entire width of many columns that is produced as http://my.fit.edu/wx_fit/roberts/RH.htm. Each minute, our Campbell Scientific CR10X datalogger in Roberts Hall collects weather and energy data. In fifteen-minute groups, the data are read out by a computer in DMES, Link Building, added to the data file, and are sent to a separate computer to be processed for the World Wide Web at http://my.fit.edu/wx_fit/observations_&_forecasts/real-time_data/fitroofdata.php.
These data are presented in a text file format that must be converted for analysis, trouble-shooting, and interpretation. There are some 20 columns of data, and they are produced continually. The quantity of data requires automated processing to produce rapid results.
Figure A.1-1. This near-real-time display shows one-minute data of the Roberts Hall instrumentation system.

The Meteorology webpage at http://my.fit.edu/wx_fit/observations_&_forecasts/real-time_data/fitroofdata.php (Fig. A.1-2) adds the capability to produce graphs or charts of selected data.
Figure A.1-2. Various public displays of the data and derived charts show 15-minute weather and energy data.
For example (Figure A.1-3), the solar radiation of 7/31/2006 shows cloudy weather, with interruptions from the drifting clouds. These points are the single-minute readings at 15-minute intervals.
Figure A.1-3. To the right, the daylight hours show less than normal sunlight with cloud interruptions.

The pyranometer (solar intensity) value of watts per square meter is just one parameter of many.
A.2 Excel Macro Summary
Microsoft Excel has the capability to use Visual Basic to run selected tasks. The program can record tasks entered by keyboard, or the programs may be written directly in code.
A.3 Selected Macros
One initial task is to convert the text files of Figure A.1-1 into Excel compatible xls files. Each line must have the fields that are delimited by spaces converted into a column in the spreadsheet.
Here is one of the subroutines:
This subroutine takes a set of text data and pastes it into cell A7. The consecutive lines are available in ascending rows, but all of the line is in text in column A. Sub ImportingDataIntoExcel()'' ImportingDataIntoExcel Macro' Macro takes copied raw data from the website and pastes it into an excel worksheet' Macro recorded 3/22/2006 by Danielle'
' Range("A7").Select ActiveSheet.Paste Range("A1").SelectEnd Sub
After the single lines of text data are pasted, the TextToColumns subroutine parses the combined text of column A data across the proper columns. Sub TextToColumns()'' TextToColumns Macro' Macro spreads out data into specific columns' Macro recorded 4/3/2006 by dmes'
' Columns("A:A").Select Selection.TextToColumns Destination:=Range("A1"), DataType:=xlFixedWidth, _ FieldInfo:=Array(Array(0, 1), Array(6, 1), Array(12, 1), Array(18, 1), Array(22, 1), _ Array(24, 1), Array(30, 1), Array(36, 1), Array(42, 1), Array(48, 1), Array(54, 1), Array( _ 60, 1), Array(66, 1), Array(72, 1), Array(78, 1), Array(84, 1), Array(90, 1), Array(96, 1), _ Array(103, 1), Array(110, 1), Array(117, 1), Array(123, 1), Array(129, 1), Array(135, 1), _ Array(141, 1), Array(147, 1)), TrailingMinusNumbers:=True Range("D6").Select ActiveCell.FormulaR1C1 = "EST" Range("E6").Select ActiveCell.FormulaR1C1 = "EST" Range("A1").SelectEnd Sub
These two subroutines give an example of how macros work. A “supermacro” calls the subs by name in turn to complete a very large operation of thousands of hours in about one second.
B. Expenditure Summary
B-1 General
The Budget Status Report received for May 30, 2006 shows total expenditures of $1211.43 against an account balance of $8600.00. Several expenses (~$1700) have been incurred since that date, but the accounting sheets have not yet been received. Some expenses will be updated in the August accounting. These accounting indices were categorized in a different way than my original budgets, which were by energy subtasks.
Secondary account lines are as follows:Salaries and Wages 61030: $1161.59 actual vs. $0 budget
“ “ GSA 61070: $0.00 vs. $1400 budget (Ms. Danielle Carpenter)Expense Supplies 72199: $49.84 vs. $3470.00 budgetTravel Expense 72605: $0.00 vs. $945.00 (AWEA conference not yet debited)Professional Services 74138: $0.00 vs. $160.00 budgetedPlant Addition Equipment 79138: $0.00 vs. $4025.00
B.2 Principal Expenses
$1161.59 was expended to hire Ms. Danielle Carpenter, Meteorology graduate student to construct Excel macro programs to automate data processing.
Approximately $1500 was expended to purchase data interface equipment to log real time data, controllers, and drive motor for the Wind Generator Test Bed. This equipment can measure voltage and current produced and it can also drive a motor through a controller.
$945 was expended to attend the AWEA Windpower 2006 at Pittsburg, PA on June 4 through 7, 2006 to assess the state of knowledge in wind energy. This information will be used to update the Renewable Energy course for the Spring 2007 semester. The conference also addressed solar and hydro energy, since these are secondary or indirect forms of solar energy. A preliminary session was held on wind energy education in the US, presented by KidWind under a grant from the National Renewable Energy Laboratories (I did not arrive early enough to attend, but talked with the presenter and with the NREL grantor, Ms. Trudy Forsyth.
No expenses were incurred for solar or ocean energies, and these budgeted task amounts were reallocated back to Dr. Sullivan.