studying phenotypic variability in crops using a hand … · studying phenotypic variability in...
TRANSCRIPT

Studying Phenotypic Variability in Cropsusing a Hand-held Sensor Platform
Raghav Khanna, Joern Rehder, Martin Moller, Enric Galceran and Roland Siegwart
Abstract—Recent developments in visual-inertial and LiDARsensors and simultaneous localization and mapping (SLAM)enable recording and digital reconstruction of the physical world.In this paper we utilize a hand-held multi-sensor platform forremotely recording and characterizing physical properties ofcrops on a field. The platform consists of a visual-inertial sensor,color camera and 2D LiDAR. We syncronize the data from thisplatform and fuse them in a standard SLAM framework to obtaina detailed model of the field environment in the form of a 3Dpoint cloud. Such a model is then fed into semi-automated cropparameter estimation pipelines to extract the spatio-temporalvariation of physical crop height and canopy cover, which maybe used to support decision making for breeding and precisionagriculture. We present experimental results with data collectedon a winter wheat field in Eschikon, Switzerland, showing theutility of our approach towards automating variability studies incrops.
Index Terms—Precision agriculture, visual-inertial sensor, 3Dreconstruction, agricultural robotics, crop phenotyping, pointcloud processing
I. INTRODUCTION
Remote, non-invasive monitoring of crops has garneredsignificant interest in recent times. Crop phenotyping, theapplication of high throughput methods to characterize plantarchitecture and performance, is currently a focus in cropresearch and breeding programs [1], [2]. However, most cropbreeding programs currently employ human expert breederswho primarily evaluate plant growth visually. This process istime consuming and expensive, and may be error prone. Highthroughput phenotyping facilities allow crop variability datacollection in controlled environments that can be extrapolatedto large-scale crops. These facilities are typically run by largeseed and crop care companies and plant research institutionswithin large, controlled environments, such as greenhouses orgrowth chambers. This limits their ability to extrapolate andpredict plant behavior under heterogeneous field conditions[3]. Large-scale field phenotyping platforms are typicallyexpensive, take a long time for construction and are limitedin their area of operation. The increased demand for on-field phenotyping to support breeding [4] has spurred thedevelopment of mobile platforms, [5], [6] and [7], basedon ground vehicles. Ground vehicles, however, are intrusive,limiting the frequency of the measurements, and have anadverse impact on the soil.
This research was sponsored by the European Communitys frameworkprogramme Horizon 2020 under grant agreement no. 644227-Flourish.The authors are with the Autonomous Systems Lab at ETH Zurich(e-mail: {raghav.khanna, joern.rehder, enric.galceran}@mavt.ethz.ch, [email protected], [email protected]).
Fig. 1. The hand-held sensor platform used in this work for studying cropvariability, comprising of a visual-inertial sensor, a color camera and laserrange finder.
Therefore, an easy-to-use, flexible and mobile sensor plat-form (such as the one shown in Figure 1) can enable breedersand agronomists to quickly and frequently collect real worlddata about their crops, offering valuable insights into cropstatus and field variation.
In light of these considerations, we present a light-weight,hand-held system consisting of a high resolution color camera,a laser scanner and a visual-inertial sensor, offering flexibilityand ease of use to monitor crops. We show preliminary resultsin the form of user-readable crop height and canopy covermaps which can be used to study the spatio-temporal growthof the crops on the field. Our height estimates, based on thesensor platform measurements, are also shown to comparefavorably with manual measurements. An overview of thepipeline is shown in Figure 2.
II. SENSOR PLATFORM AND CALIBRATION
We employed a combination of the visual-inertial sensordeveloped at the Autonomous Systems Lab [8], a HokuyoUTM-30LX laser range finder (LRF) and a rigidly attachedPoint Grey Flea3 color camera for data collection, as shownin Figure 1. The visual-inertial sensor and LRF were synchro-nized in hardware, while software synchronization accordingto Zhang et al. [9] was performed for the color camera. We

Fig. 2. A schematic overview of our hand-held scanner based phenotypicpipeline.
used the kalibr1[10] framework for calibrating the camerasintrinsically and extrinsically with respect to the inertial mea-surement unit (IMU), and for determining the communicationdelay of the color camera. The transformation between IMUand LRF was estimated according to our previous work [11].
Our plant segmentation is based on data acquired with thecolor camera, exploiting that the spectra of light reflectedby plants and soil are generally different. Besides irradiance,image intensity is dependent on the camera response functionas well as on the optical transmission of the lense system. Weestimated these quantities using the well established empiricalmodel of response [12] as well as a simple polynomial modelfor vignetting [13], and subsequently compensated for theseinfluences to facilitate segmentation.
III. 3D RECONSTRUCTION
Our 3D reconstruction follows a two-step procedure. In afirst step, non-linear optimization [14] over a sliding windowof measurements from the visual-inertial sensor provides aninitial estimate of the sensor trajectory. While this approach isreal-time capable and has been demonstrated to provide state-of-the-art accuracy, we subject the initial trajectory estimate toa full batch optimization [15] in a second step, taking all visualand inertial measurements into account. This offline post-processing step further improves the accuracy of the recon-struction. Given the sensor trajectory, range measurements aretransformed into the coordinate frame of our map to produce apoint cloud. Subsequently, an irradiance2 value is sampled forevery point by projecting it into the temporally closest colorimage.
1Available at https://github.com/ethz-asl/kalibr2We follow Debevec et al. [16] in using this term. For insights on why this
term is not strictly correct and a justification for its use, please see their work.
Fig. 3. 3D reconstructions of the winter wheat field on 10-04-2015 (top) and12-05-2015 (bottom). The plot sizes are 1.5 m x 1 m with different genotypesplanted for breeding experiments. One can observe the dramatic variationin the appearance of the crops which presents a challenge for automatedsegmentation and analysis pipelines.
IV. QUANTIFYING PHENOTYPIC VARIATION ON THE FIELD
There exist well established parameters to characterize thedifferences between crops growing on the field, such asheight, canopy cover, leaf area index (LAI) and chlorophyllfluorescence. We use the point clouds generated using ourhand-held platform to estimate the crop height and canopycover. These estimates, converted into human-readable maps,can be used to assist and verify breeders’ rating values fordifferent plots and provide an estimate of the growth rate ofplants and its spatial variation.
A. Height Estimation
We use our previously developed height estimation pipeline,described in detail in [17]. An overview is provided herefor completeness. The point clouds are first segmented usinga color threshold to separate the vegetation from the soil.A linear regression surface is then fitted through all thesoil points to get the global orientation of the scene. Forheight estimation, a finer tessellation of this ground surfaceis performed and a local multinomial regression surface is fitthrough the soil points in each region. The ground plane isfurther subdivided into regions with dimensions approximatingthe plant size of the crop under study. The height of each plantregion is then estimated as the height of the vegetation pointcorresponding to the 99th percentile within that region.
B. Canopy Cover Estimation
We define canopy cover as the percentage of the groundcovered by vegetation when looking down along the normal tothe ground plane. We compute it by subdividing the field intosmall areas, each of which we consider covered by vegetation,if we find at least one plant vertex above them. The canopycover is then found as the ratio of the sum of all coveredareas to the area of the entire field. The challenge now lies inaccurately choosing the tessellation size. If chosen too high,large areas would inadvertently be considered covered evenif they contained only one point (which might be an outlierfrom the reconstruction). On the other hand, a leaf can only berepresented by a finite number of points which have no volumethemselves. Thus, if the tile size is chosen too small the areasbetween closely neighboring points would not be consideredcovered even though it is quite likely that the points belongto the same leaf. In the limit, the estimated crop cover wouldeventually converge towards zero when the tile size approacheszero.
It is therefore reasonable to choose the tile size based onthe individual density of each point cloud. For this purposewe compute the distances from all points in the point cloud totheir corresponding nearest neighbor. Among all these inter-vertex distances we look for the median. We then subdividethe field into squares and choose their side-length as twice themedian found in the previous step. Finally the canopy cover isfound as the ratio of the number of squares that have at leastone plant vertex above them to the overall number of squares.
V. RESULTS AND DISCUSSION
We collected two datasets on an experimental winter wheatfield at Lindau, Eschikon in Switzerland. An overview of thefield is shown in Figure 4. The field is used for breedingexperiments and consists of 1.5 m x 1 m plots with differentwheat genotypes. The purpose of such experiments is todetermine which of the genotypes are better suited to acertain type of environment or abiotic stress, by measuring andquantifying plant growth over time and comparing the differentplots. The datasets were collected on April 10 and May 12,2015 during the growth period of the plants. Data collectionwas performed in a nadir configuration, recording images at20 Hz, range scans at 40 Hz and inertial measurements at800 Hz. We oriented the sensor suite in a way that optimizedcoverage for our push-broom approach to reconstruction andwalked at normal speed (approximately 1m/s).
The point clouds for one row of plots for both days areshown in Figure 3. One can clearly observe the large variabilityin the visual appearance of the crops at different times. Thisis attributed to the ambient illumination and the change in thephysical structure of the plants which has an influence on theshadows and occlusions. The dramatic change was observedto cause issues with automated segmentation procedures andhence the segmentation thresholds had to be set manually. Onecan observe that the number of soil points reduces dramaticallyin the second point cloud due to occlusions caused by plantgrowth. While a limited number of ground points makes it
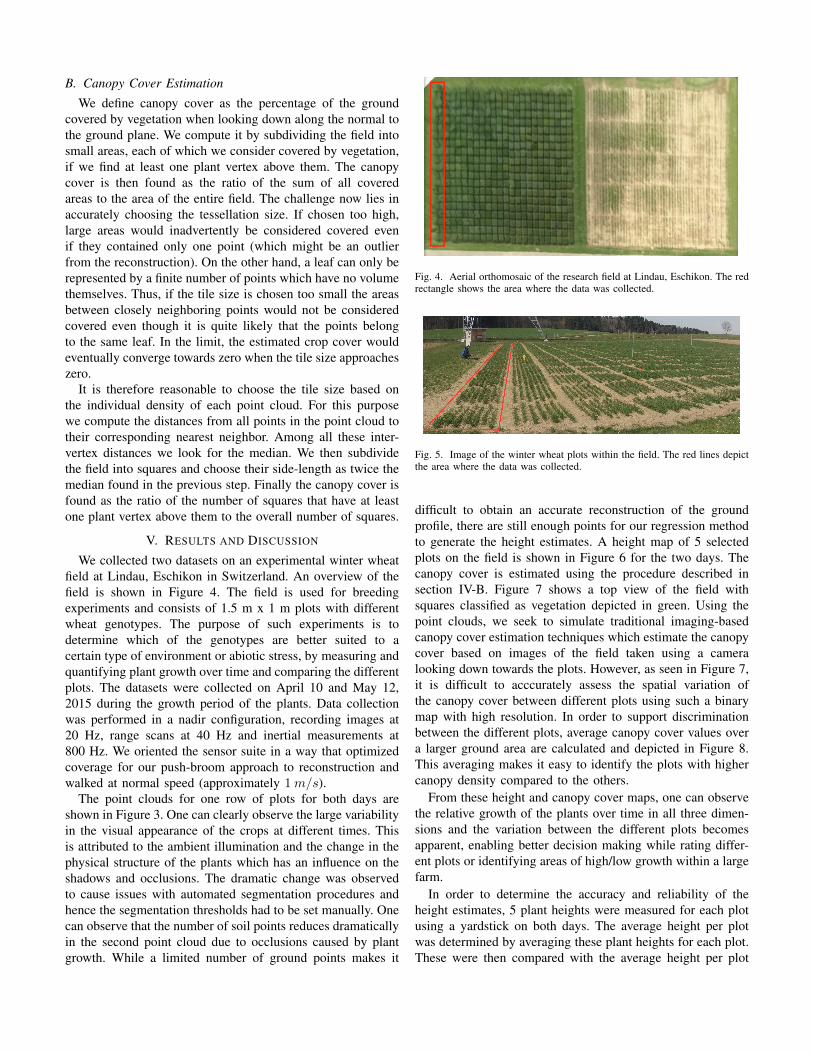
Fig. 4. Aerial orthomosaic of the research field at Lindau, Eschikon. The redrectangle shows the area where the data was collected.
Fig. 5. Image of the winter wheat plots within the field. The red lines depictthe area where the data was collected.
difficult to obtain an accurate reconstruction of the groundprofile, there are still enough points for our regression methodto generate the height estimates. A height map of 5 selectedplots on the field is shown in Figure 6 for the two days. Thecanopy cover is estimated using the procedure described insection IV-B. Figure 7 shows a top view of the field withsquares classified as vegetation depicted in green. Using thepoint clouds, we seek to simulate traditional imaging-basedcanopy cover estimation techniques which estimate the canopycover based on images of the field taken using a cameralooking down towards the plots. However, as seen in Figure 7,it is difficult to acccurately assess the spatial variation ofthe canopy cover between different plots using such a binarymap with high resolution. In order to support discriminationbetween the different plots, average canopy cover values overa larger ground area are calculated and depicted in Figure 8.This averaging makes it easy to identify the plots with highercanopy density compared to the others.
From these height and canopy cover maps, one can observethe relative growth of the plants over time in all three dimen-sions and the variation between the different plots becomesapparent, enabling better decision making while rating differ-ent plots or identifying areas of high/low growth within a largefarm.
In order to determine the accuracy and reliability of theheight estimates, 5 plant heights were measured for each plotusing a yardstick on both days. The average height per plotwas determined by averaging these plant heights for each plot.These were then compared with the average height per plot
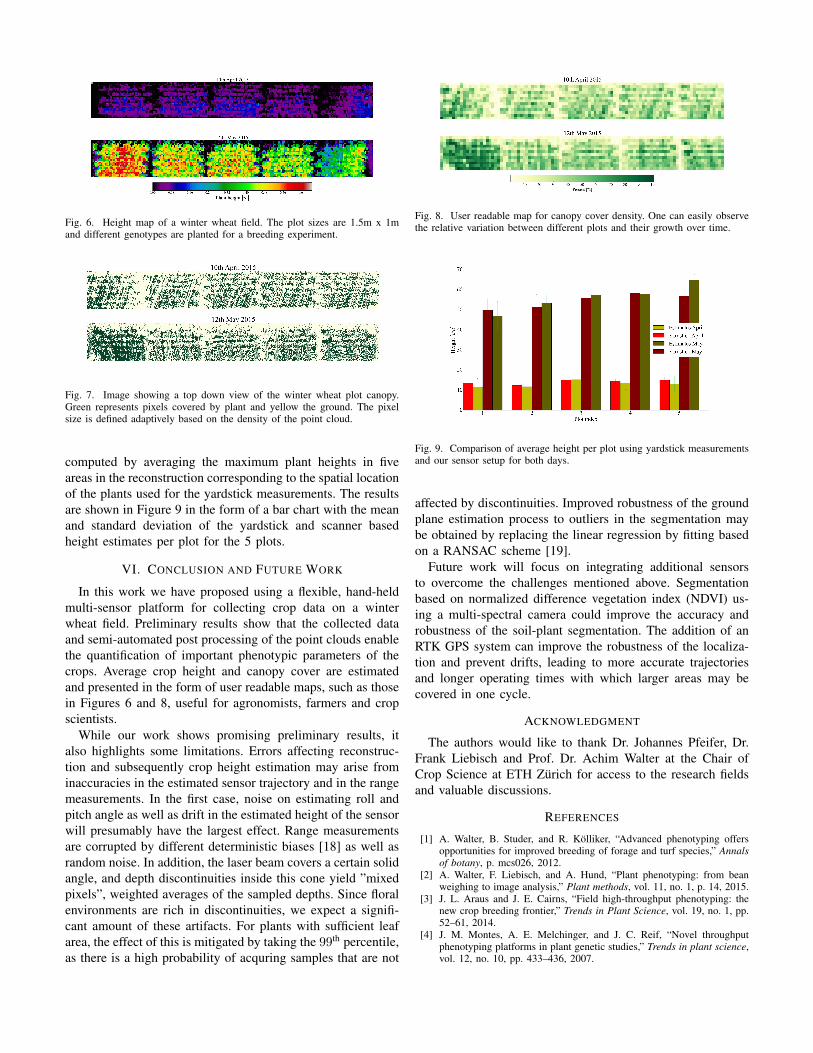
Fig. 6. Height map of a winter wheat field. The plot sizes are 1.5m x 1mand different genotypes are planted for a breeding experiment.
Fig. 7. Image showing a top down view of the winter wheat plot canopy.Green represents pixels covered by plant and yellow the ground. The pixelsize is defined adaptively based on the density of the point cloud.
computed by averaging the maximum plant heights in fiveareas in the reconstruction corresponding to the spatial locationof the plants used for the yardstick measurements. The resultsare shown in Figure 9 in the form of a bar chart with the meanand standard deviation of the yardstick and scanner basedheight estimates per plot for the 5 plots.
VI. CONCLUSION AND FUTURE WORK
In this work we have proposed using a flexible, hand-heldmulti-sensor platform for collecting crop data on a winterwheat field. Preliminary results show that the collected dataand semi-automated post processing of the point clouds enablethe quantification of important phenotypic parameters of thecrops. Average crop height and canopy cover are estimatedand presented in the form of user readable maps, such as thosein Figures 6 and 8, useful for agronomists, farmers and cropscientists.
While our work shows promising preliminary results, italso highlights some limitations. Errors affecting reconstruc-tion and subsequently crop height estimation may arise frominaccuracies in the estimated sensor trajectory and in the rangemeasurements. In the first case, noise on estimating roll andpitch angle as well as drift in the estimated height of the sensorwill presumably have the largest effect. Range measurementsare corrupted by different deterministic biases [18] as well asrandom noise. In addition, the laser beam covers a certain solidangle, and depth discontinuities inside this cone yield ”mixedpixels”, weighted averages of the sampled depths. Since floralenvironments are rich in discontinuities, we expect a signifi-cant amount of these artifacts. For plants with sufficient leafarea, the effect of this is mitigated by taking the 99th percentile,as there is a high probability of acquring samples that are not
Fig. 8. User readable map for canopy cover density. One can easily observethe relative variation between different plots and their growth over time.
Fig. 9. Comparison of average height per plot using yardstick measurementsand our sensor setup for both days.
affected by discontinuities. Improved robustness of the groundplane estimation process to outliers in the segmentation maybe obtained by replacing the linear regression by fitting basedon a RANSAC scheme [19].
Future work will focus on integrating additional sensorsto overcome the challenges mentioned above. Segmentationbased on normalized difference vegetation index (NDVI) us-ing a multi-spectral camera could improve the accuracy androbustness of the soil-plant segmentation. The addition of anRTK GPS system can improve the robustness of the localiza-tion and prevent drifts, leading to more accurate trajectoriesand longer operating times with which larger areas may becovered in one cycle.
ACKNOWLEDGMENT
The authors would like to thank Dr. Johannes Pfeifer, Dr.Frank Liebisch and Prof. Dr. Achim Walter at the Chair ofCrop Science at ETH Zurich for access to the research fieldsand valuable discussions.
REFERENCES
[1] A. Walter, B. Studer, and R. Kolliker, “Advanced phenotyping offersopportunities for improved breeding of forage and turf species,” Annalsof botany, p. mcs026, 2012.
[2] A. Walter, F. Liebisch, and A. Hund, “Plant phenotyping: from beanweighing to image analysis,” Plant methods, vol. 11, no. 1, p. 14, 2015.
[3] J. L. Araus and J. E. Cairns, “Field high-throughput phenotyping: thenew crop breeding frontier,” Trends in Plant Science, vol. 19, no. 1, pp.52–61, 2014.
[4] J. M. Montes, A. E. Melchinger, and J. C. Reif, “Novel throughputphenotyping platforms in plant genetic studies,” Trends in plant science,vol. 12, no. 10, pp. 433–436, 2007.

[5] L. Busemeyer, D. Mentrup, K. Moller, E. Wunder, K. Alheit, V. Hahn,H. P. Maurer, J. C. Reif, T. Wurschum, J. Muller et al., “Breedvisionamulti-sensor platform for non-destructive field-based phenotyping inplant breeding,” Sensors, vol. 13, no. 3, pp. 2830–2847, 2013.
[6] D. Deery, J. Jimenez-Berni, H. Jones, X. Sirault, and R. Furbank,“Proximal remote sensing buggies and potential applications for field-based phenotyping,” Agronomy, vol. 4, no. 3, pp. 349–379, 2014.
[7] G. R. T. C. J. Dong, L. Carlone and F. Dellaert, “4d mapping of fieldsusing autonomous ground and aerial vehicles,” in CSBE/ASABE JointMeeting Presentation, 2014, 2014.
[8] J. Nikolic, J. Rehder, M. Burri, P. Gohl, S. Leutenegger, P. T. Furgale,and R. Siegwart, “A synchronized visual-inertial sensor system with fpgapre-processing for accurate real-time slam,” in Robotics and Automation(ICRA), 2014 IEEE International Conference on. IEEE, 2014, pp. 431–437.
[9] L. Zhang, Z. Liu, and C. Honghui Xia, “Clock synchronization algo-rithms for network measurements,” in INFOCOM 2002. Twenty-FirstAnnual Joint Conference of the IEEE Computer and CommunicationsSocieties. Proceedings. IEEE, vol. 1. IEEE, 2002, pp. 160–169.
[10] P. Furgale, J. Rehder, and R. Siegwart, “Unified temporal and spatialcalibration for multi-sensor systems,” in Intelligent Robots and Systems(IROS), 2013 IEEE/RSJ International Conference on. IEEE, 2013, pp.1280–1286.
[11] J. Rehder, P. Beardsley, R. Siegwart, and P. Furgale, “Spatio-temporallaser to visual/inertial calibration with applications to hand-held, largescale scanning,” in Intelligent Robots and Systems (IROS 2014), 2014IEEE/RSJ International Conference on. IEEE, 2014, pp. 459–465.
[12] M. D. Grossberg and S. K. Nayar, “What is the space of camera
response functions?” in Computer Vision and Pattern Recognition, 2003.Proceedings. 2003 IEEE Computer Society Conference on, vol. 2. IEEE,2003, pp. II–602.
[13] D. B. Goldman, “Vignette and exposure calibration and compensation,”Pattern Analysis and Machine Intelligence, IEEE Transactions on,vol. 32, no. 12, pp. 2276–2288, 2010.
[14] S. Leutenegger, S. Lynen, M. Bosse, R. Siegwart, and P. Furgale,“Keyframe-based visual–inertial odometry using nonlinear optimiza-tion,” The International Journal of Robotics Research, vol. 34, no. 3,pp. 314–334, 2015.
[15] T. Cieslewski, S. Lynen, M. Dymczyk, S. Magnenat, and R. Siegwart,“Map api - scalable decentralized map building for robots,” in Interna-tional Conference on Robotics and Automation. IEEE, 2015.
[16] P. E. Debevec and J. Malik, “Recovering high dynamic range radiancemaps from photographs,” in ACM SIGGRAPH 2008 classes. ACM,2008, p. 31.
[17] R. Khanna, M. Moller, J. Pfeifer, F. Liebisch, A. Walter, and R. Siegwart,“Beyond point clouds - 3d mapping and field parameter measurementsusing uavs,” p. to appear, 2015.
[18] P. Demski, M. Mikulski, and R. Koteras, “Characterization of hokuyoutm-30lx laser range finder for an autonomous mobile robot,” in Ad-vanced Technologies for Intelligent Systems of National Border Security.Springer, 2013, pp. 143–153.
[19] M. A. Fischler and R. C. Bolles, “Random sample consensus: a paradigmfor model fitting with applications to image analysis and automatedcartography,” Communications of the ACM, vol. 24, no. 6, pp. 381–395,1981.