stuff stuff and long car trips! application of the 4see socio-economic-energy model to the uk and...
TRANSCRIPT
Stuff stuff and long car trips!
Application of the 4see socio-economic-energy model to the UK and designing future scenarios
Simon Roberts
Foresight Group
Arup (London)
Seminar to: The Design Group
The Open University (Milton Keynes)
13th January 2010

13Jan10, Simon Roberts© Arup 2010
2
Problems!
• We’ve all heard about climate change…• But COP15 at Copenhagen only reached an accord.• Climate change has slipped from the “finite pool of worry” (fatigue)
– In 2008 and 2009, climate change fell to the bottom of people’s list of concerns as anxiety about the economy rose.
• Then there’s “peak oil”…• And what about just plain sustainable development (recall Report of
the Brundtland Commission 1987)?• What are we actually going to do?
www.cred.columbia.edu/guide/

13Jan10, Simon Roberts© Arup 2010
3
Stuff stuff and long car trips!
Policy 1 – stuff stuff• reduce consumer consumption of goods
Policy 2 – stuff long car trips• get a grip on the growth of personal transport by car

13Jan10, Simon Roberts© Arup 2010
4
Policy 1 - Stuff stuff
1. “Goods Tax” of 15% (say)• Note: services have no extra tax
2. Non-consumers get rebate so only consumers are hit• Note: very similar to VAT except targeted specifically on goods
and hypothecated (as follows)
3. This Goods Tax (less non-consumer rebate) goes into “REEF”, the Renewables and Energy Efficiency Fund
4. REEF used by national and local government for major investment programme into:• large- and small-scale renewables• energy efficiency improvement for all properties (homes,
industry, offices, etc)
13Jan10, Simon Roberts© Arup 2010
5
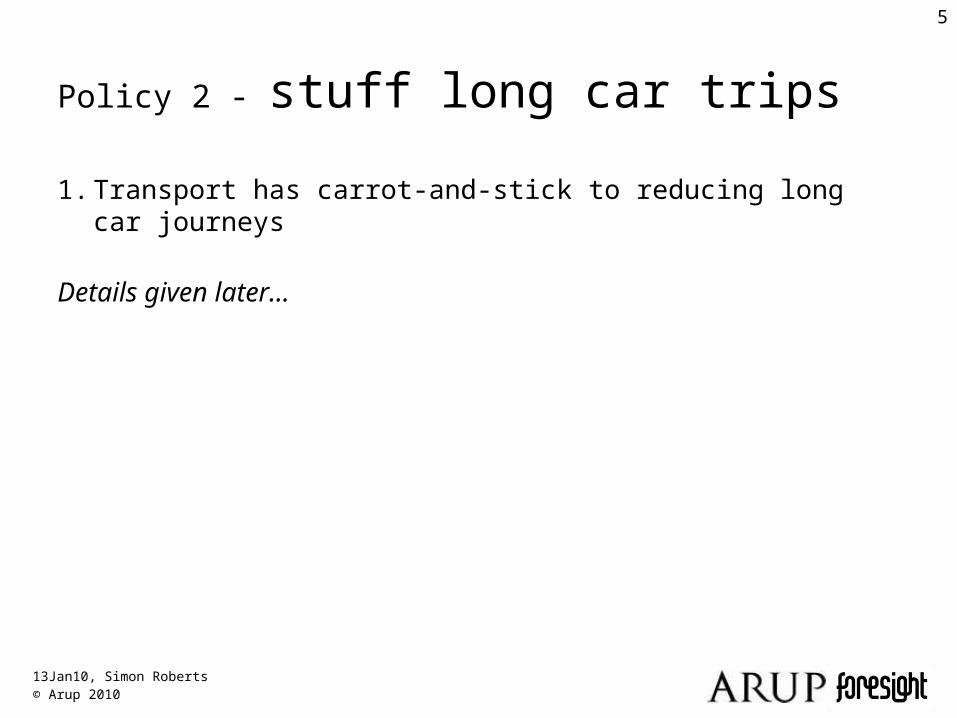
Policy 2 - stuff long car trips
1. Transport has carrot-and-stick to reducing long car journeys
Details given later…
13Jan10, Simon Roberts© Arup 2010
6
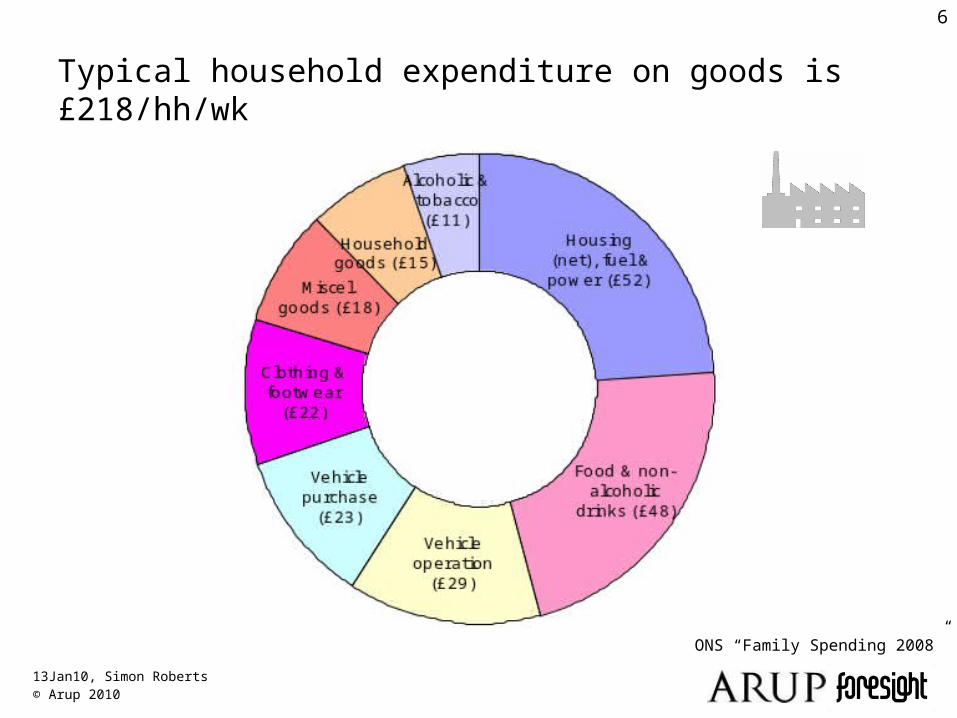
Typical household expenditure on goods is £218/hh/wk
ONS ONS “Family Spending 2008”

13Jan10, Simon Roberts© Arup 2010
7
Typical household expenditure on services is £162/hh/wk
ONS “Family Spending 2008”

13Jan10, Simon Roberts© Arup 2010
8
15% Goods Tax on household expenditure of £380/hh/wk

13Jan10, Simon Roberts© Arup 2010
9
total national consumption
£0b/y
£200b/y
£400b/y
£600b/y
£800b/y
£1,000b/y
£1,200b/y
£1,400b/y
£1,600b/y
£1,800b/y
19
90
19
92
19
94
19
96
19
98
20
00
20
02
20
04
20
06
20
08
year
good
s &
serv
ices
con
sum
pti
on
by
econ
om
y
0%/y
1%/y
2%/y
3%/y
4%/y
GD
P
Expand to national view
just households consumption
£0b/y
£200b/y
£400b/y
£600b/y
£800b/y
£1,000b/y
£1,200b/y
£1,400b/y
£1,600b/y
£1,800b/y
19
90
19
92
19
94
19
96
19
98
20
00
20
02
20
04
20
06
20
08
year
goo
ds
& s
ervi
ces
con
sum
pti
on b
y h
ou
seh
old
s
services
goods
services
goods
13Jan10, Simon Roberts© Arup 2010
10
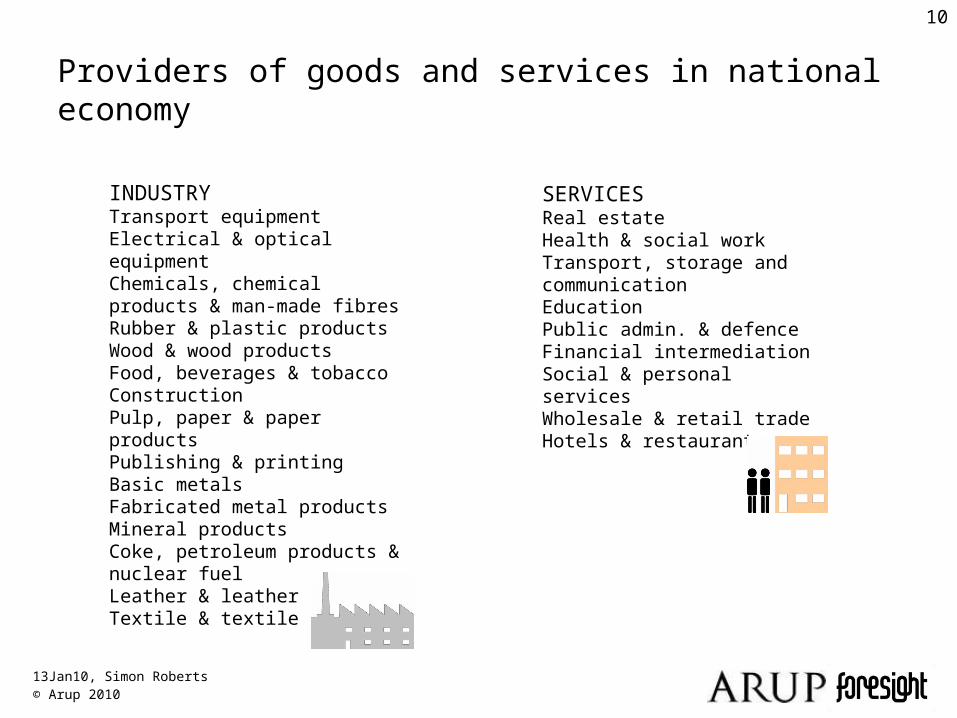
INDUSTRYTransport equipmentElectrical & optical equipmentChemicals, chemical products & man-made fibresRubber & plastic productsWood & wood productsFood, beverages & tobaccoConstructionPulp, paper & paper productsPublishing & printingBasic metalsFabricated metal productsMineral productsCoke, petroleum products & nuclear fuelLeather & leather productsTextile & textile products
SERVICESReal estateHealth & social workTransport, storage and communicationEducationPublic admin. & defenceFinancial intermediationSocial & personal servicesWholesale & retail tradeHotels & restaurants
Providers of goods and services in national economy

13Jan10, Simon Roberts© Arup 2010
11
just households consumption
£0b/y
£200b/y
£400b/y
£600b/y
£800b/y
£1,000b/y
£1,200b/y
£1,400b/y
£1,600b/y
£1,800b/y
19
90
19
92
19
94
19
96
19
98
20
00
20
02
20
04
20
06
20
08
year
goo
ds
& s
ervi
ces
con
sum
pti
on b
y h
ou
seh
old
s
total national consumption
£0b/y
£200b/y
£400b/y
£600b/y
£800b/y
£1,000b/y
£1,200b/y
£1,400b/y
£1,600b/y
£1,800b/y
19
90
19
92
19
94
19
96
19
98
20
00
20
02
20
04
20
06
20
08
year
good
s &
serv
ices
con
sum
pti
on
by
econ
om
y
0%/y
1%/y
2%/y
3%/y
4%/y
GD
P
Economic growth
GDP
services
goods
services
goods

13Jan10, Simon Roberts© Arup 2010
12
Effect of Goods Tax is a shift to investment in economy
15% of household goods 50% of investment in economy

13Jan10, Simon Roberts© Arup 2010
13
jobs energy security balance of payments welfare CO2
Policy effectiveness of Stuff stuff and long car trips!
13Jan10, Simon Roberts© Arup 2010
14
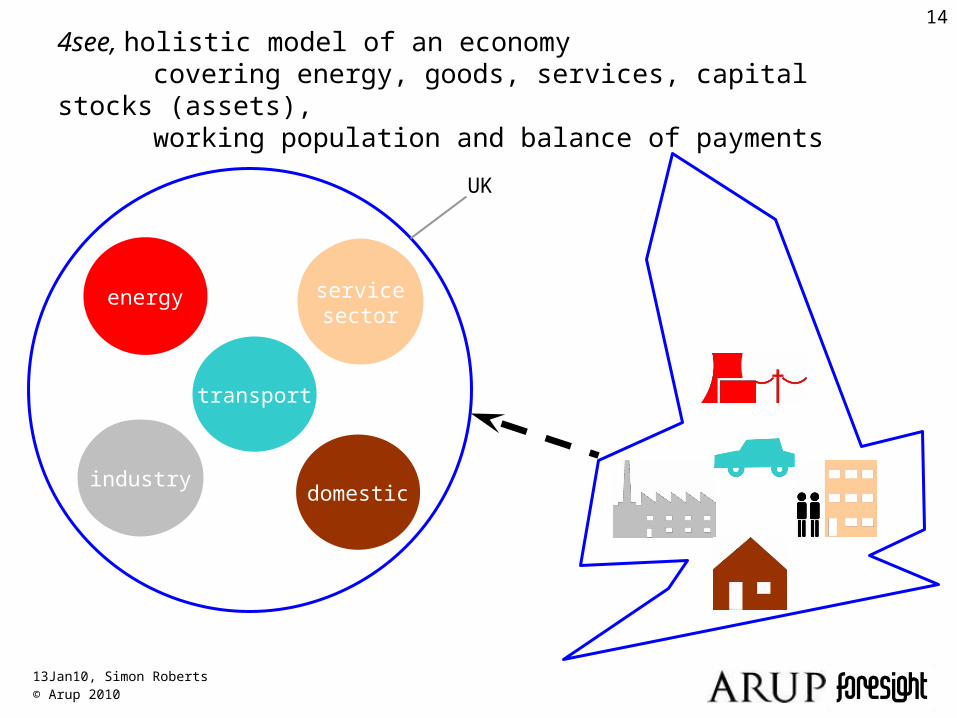
4see, holistic model of an economy covering energy, goods, services, capital stocks (assets),
working population and balance of payments
industry
servicesector
UK
energy
domestic
transport

13Jan10, Simon Roberts© Arup 2010
15
4see, energy
industry
servicesector
UK
energy
domestic
transport

13Jan10, Simon Roberts© Arup 2010
16
consump-tion
4see, goods and asset growth
industry
servicesector
UK
energy
domestic
transport
13Jan10, Simon Roberts© Arup 2010
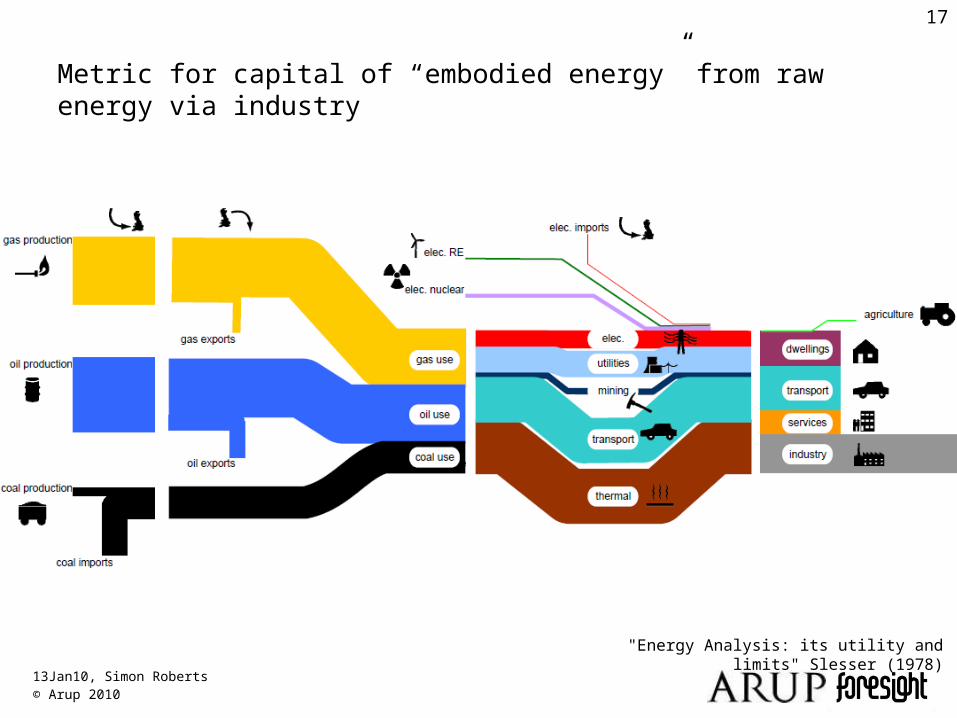
17
Metric for capital of “embodied energy” from raw energy via industry
"Energy Analysis: its utility and limits" Slesser (1978)

13Jan10, Simon Roberts© Arup 2010
18
consump-tion
4see, services
industry
servicesector
UK
energy
domestic
transport

13Jan10, Simon Roberts© Arup 2010
19
What does 4see ignore?
Includes all fundamentals• stocks of:
– energy– industry– service sector– transport– domestic
• flows of:– energy– goods– services– labour
• flows of:– income– rent– pensions
• “stocks” of:– property values– equities– debt– loans– savings
LubricantDivvy-up-the-spoilsPromises
industry
servicesector
UK
energy
domestic
transport
“The Economic Growth Engine” Ayres & Warr (2009)

13Jan10, Simon Roberts© Arup 2010
20
4see, across UK boundary
trade in energy, goods & services balance of payments
energy service sector industry domestic liabilities foreign assets
13Jan10, Simon Roberts© Arup 2010
21
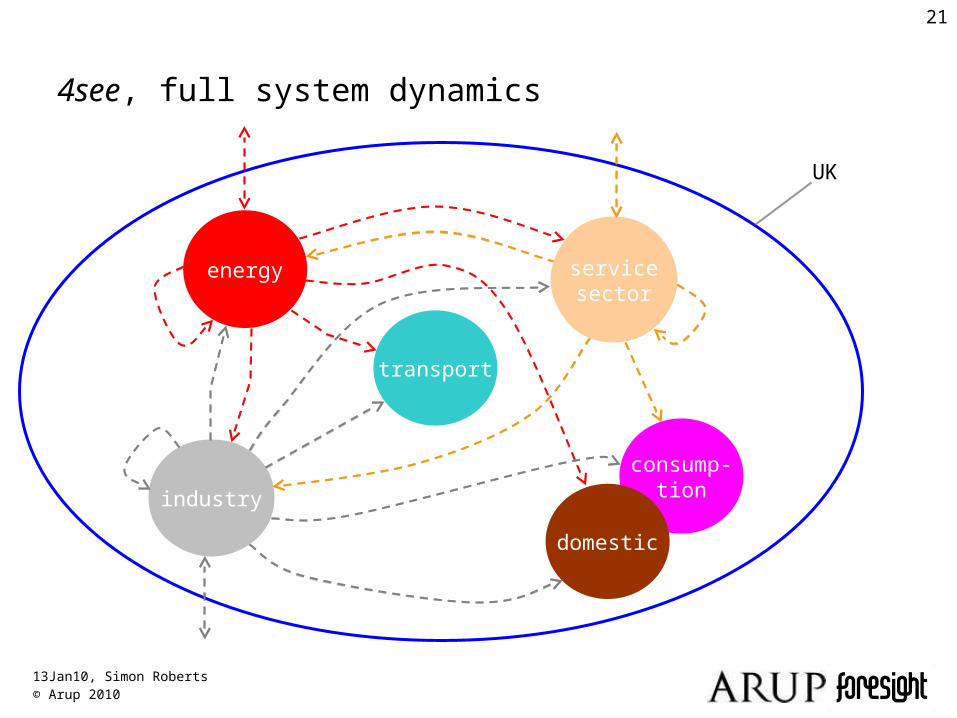
consump-tion
4see, full system dynamics
industry
servicesector
UK
energy
domestic
transport

13Jan10, Simon Roberts© Arup 2010
22
Applying 4see
1. Use as a window onto historical data (since 1990)
2. Derive indices from historical period to give insight
3. For future scenarios (to 2025)• extrapolate insight indices• implement policies

13Jan10, Simon Roberts© Arup 2010
23
Historical period: sector sizes (capital stocks)

13Jan10, Simon Roberts© Arup 2010
24
Historical period: direct energy use

13Jan10, Simon Roberts© Arup 2010
25
Historical period: total output of goods
consump-tion

13Jan10, Simon Roberts© Arup 2010
26
Historical period: investment in the economy

13Jan10, Simon Roberts© Arup 2010
27
Historical period: service demand
consump-tion
13Jan10, Simon Roberts© Arup 2010
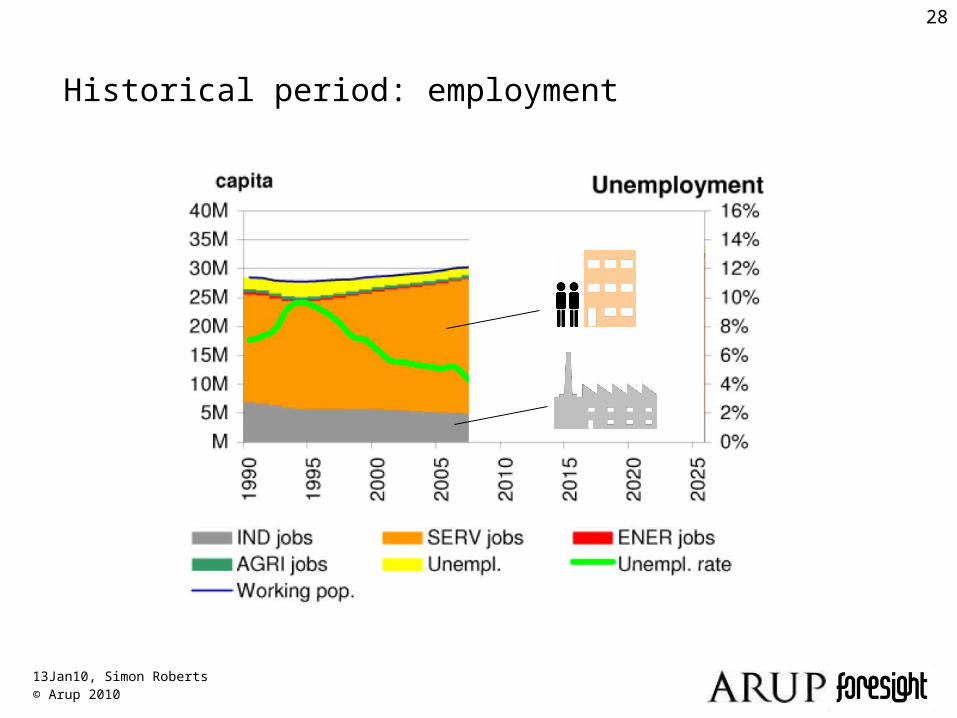
28
Historical period: employment
13Jan10, Simon Roberts© Arup 2010
29
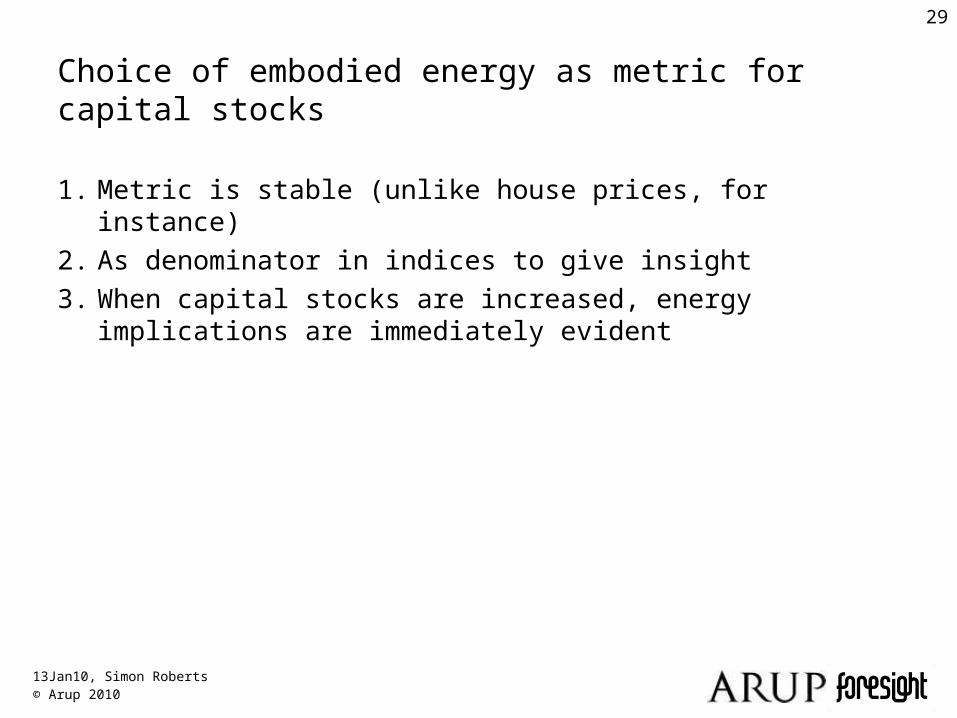
Choice of embodied energy as metric for capital stocks
1. Metric is stable (unlike house prices, for instance)
2. As denominator in indices to give insight
3. When capital stocks are increased, energy implications are immediately evident

13Jan10, Simon Roberts© Arup 2010
30
Historical period: indices
energy
jobs
service demand
÷

13Jan10, Simon Roberts© Arup 2010
31
energy use ÷ sector size = energy efficacy
13Jan10, Simon Roberts© Arup 2010
32
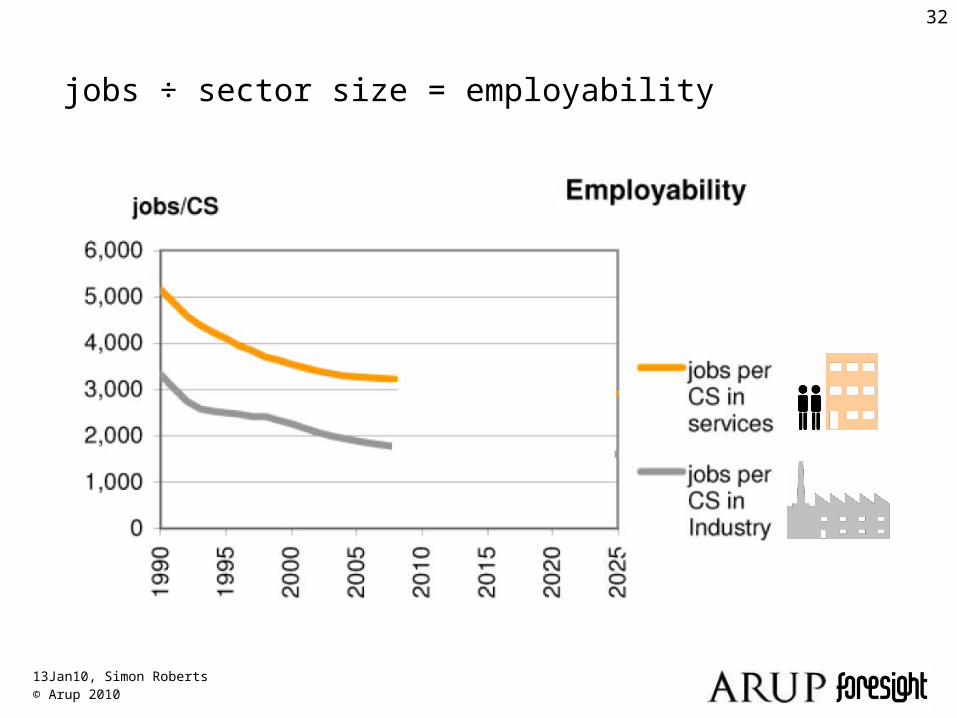
jobs ÷ sector size = employability

13Jan10, Simon Roberts© Arup 2010
33
consump-tion
service demand ÷ sector size = service demand indices

13Jan10, Simon Roberts© Arup 2010
34
4see framework is…
• is an extensive (complete?) picture of economy• is a socio + economic + energy model• has a full physical basis• sets maximum physical envelope for physical growth• handles opportunity costs of investment options• handles “how quickly can we…?”• sets its own rate of growth
industry
servicesector
UK
energy
domestic
transport

13Jan10, Simon Roberts© Arup 2010
35
About economic growth
• Growth is spurred by need to provide employment..• ..against a background of declining need for labour
(labour is a declining factor of production)• 2 views:
“…This prospect of investment falling and creating widespread unemployment terrifies governments so much that they work very closely with their business sectors to ensure that their economies continue to grow almost regardless of any social or environmental damage the growth process may be causing.”
“The Economic Challenge of Sustainability” Douthwaite & Siochrú (2006)
“a country’s ability to improve its standard of living over time depends almost entirely on its ability to raise its output per worker.”
“The Age of Diminished Expectations” Paul Krugman (1994)
13Jan10, Simon Roberts© Arup 2010
36
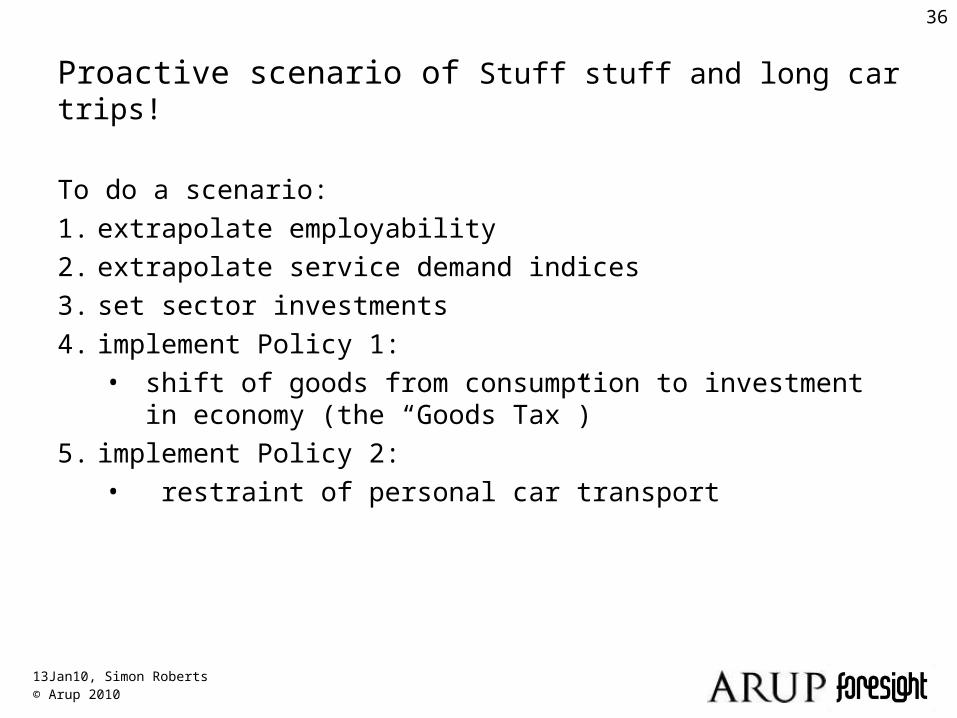
Proactive scenario of Stuff stuff and long car trips!
To do a scenario:
1. extrapolate employability
2. extrapolate service demand indices
3. set sector investments
4. implement Policy 1:• shift of goods from consumption to investment in economy
(the “Goods Tax”)
5. implement Policy 2:• restraint of personal car transport

13Jan10, Simon Roberts© Arup 2010
37
Proactive scenario, setting: employability

13Jan10, Simon Roberts© Arup 2010
38
Proactive scenario, setting: sector investments

13Jan10, Simon Roberts© Arup 2010
39
Proactive scenario, observation: GDP
13Jan10, Simon Roberts© Arup 2010
40
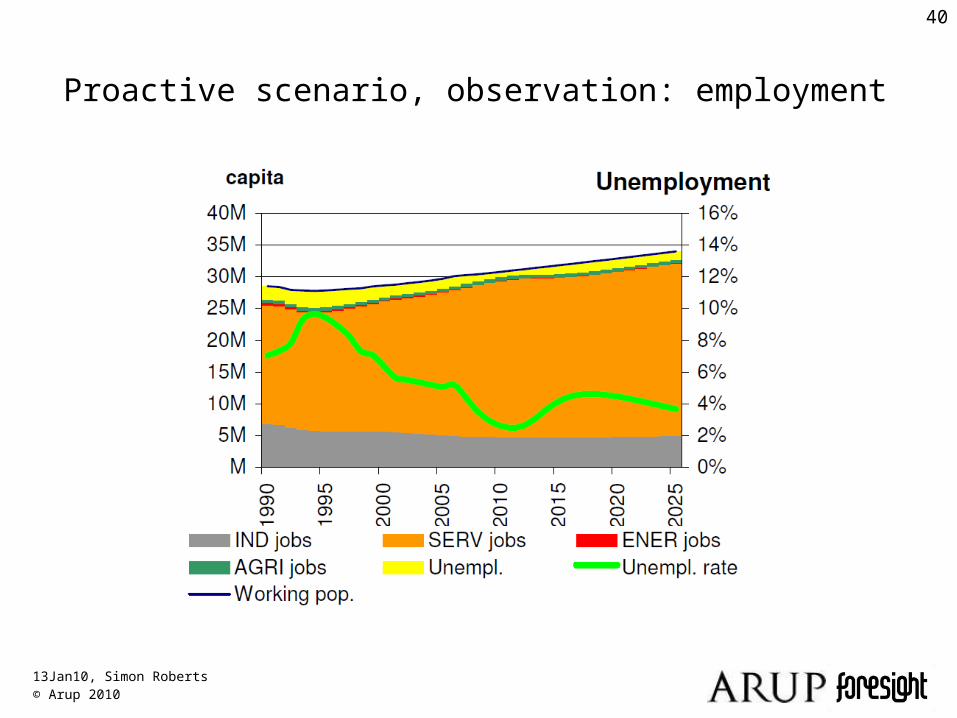
Proactive scenario, observation: employment

13Jan10, Simon Roberts© Arup 2010
41
Proactive scenario, observation: energy efficacy
13Jan10, Simon Roberts© Arup 2010
42
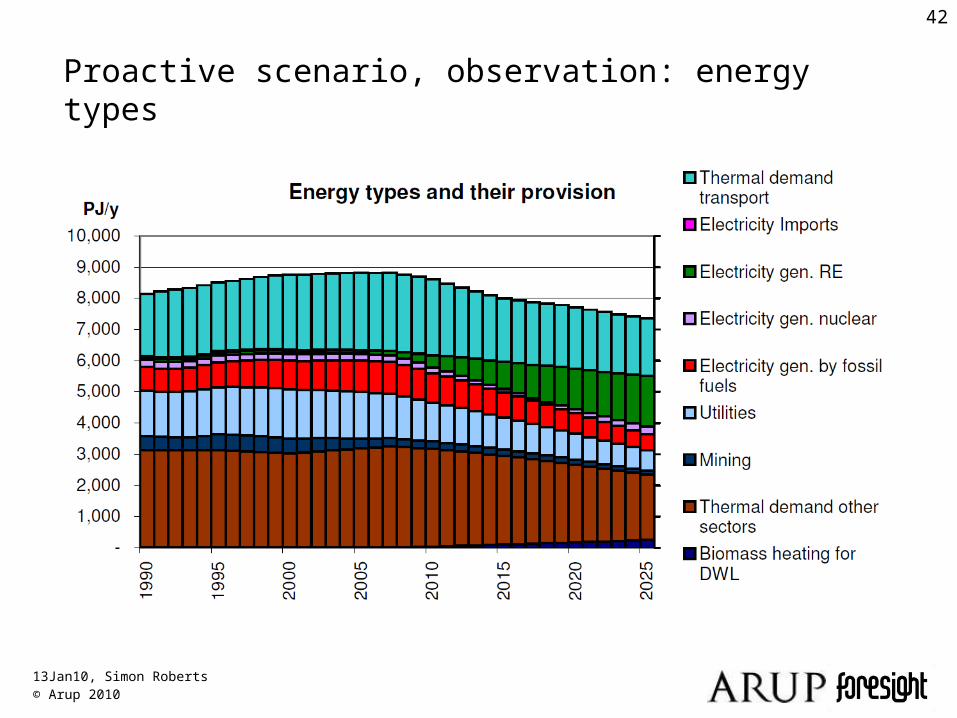
Proactive scenario, observation: energy types

13Jan10, Simon Roberts© Arup 2010
43
Proactive scenario, observation: primary fuel

13Jan10, Simon Roberts© Arup 2010
44
Proactive scenario, observation: balance of payments
13Jan10, Simon Roberts© Arup 2010
45
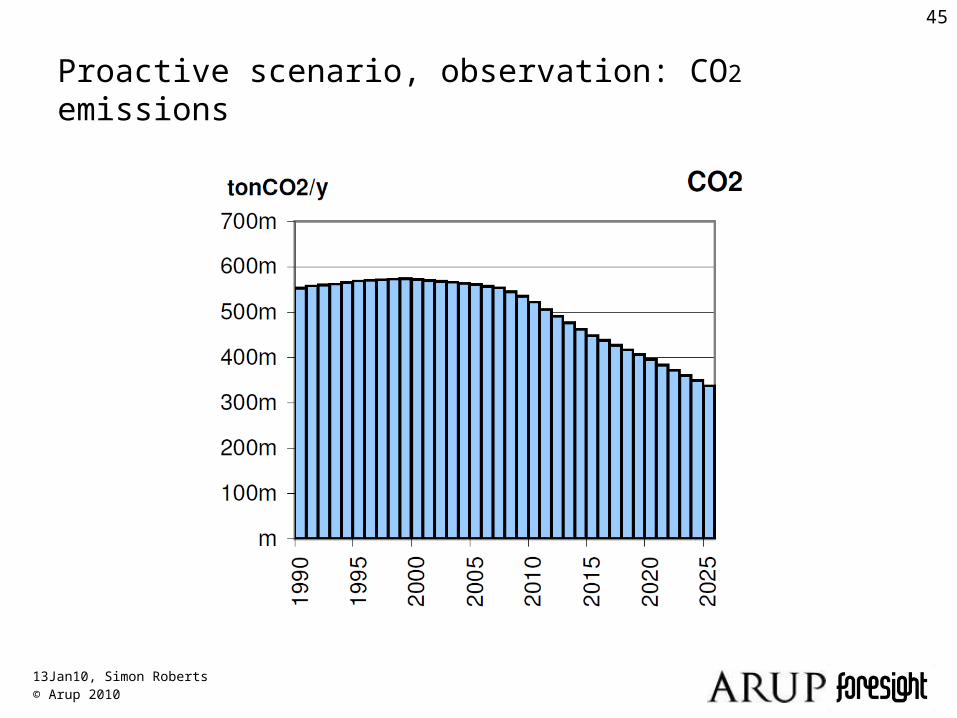
Proactive scenario, observation: CO2 emissions

13Jan10, Simon Roberts© Arup 2010
46
Policy 2 - stuff long car trips
• Commuter and business travel account for ~40% of distance driven.• Transport presents a problem for legislators!
1. Package of measures to deliver behavioural change and secure modal shift.
2. Redress the balance of the relative cost/convenience of different transport modes.
3. Allocation of road space based on most fuel and carbon efficient modes.
4. More integration of sustainable transport policies with land use planning.
5. Encourage car clubs and home working and similar.• (Electric cars will take long to penetrate and only offset short trips)
13Jan10, Simon Roberts© Arup 2010
47
Vision of 2025 under Stuff stuff and long car trips
• You’ve got a job!• Shop prices are up (a little)• Long car trips are expensive• More home and local working• Its easier and less costly to use trains and coaches, and travel is in
comfortable stock• Increase in recreation and leisure services• Care services for the aged have increased
13Jan10, Simon Roberts© Arup 2010
48
What if we don’t Stuff stuff and long car trips!
The reactive scenario

13Jan10, Simon Roberts© Arup 2010
49
Reactive scenario, setting: sector investments
13Jan10, Simon Roberts© Arup 2010
50
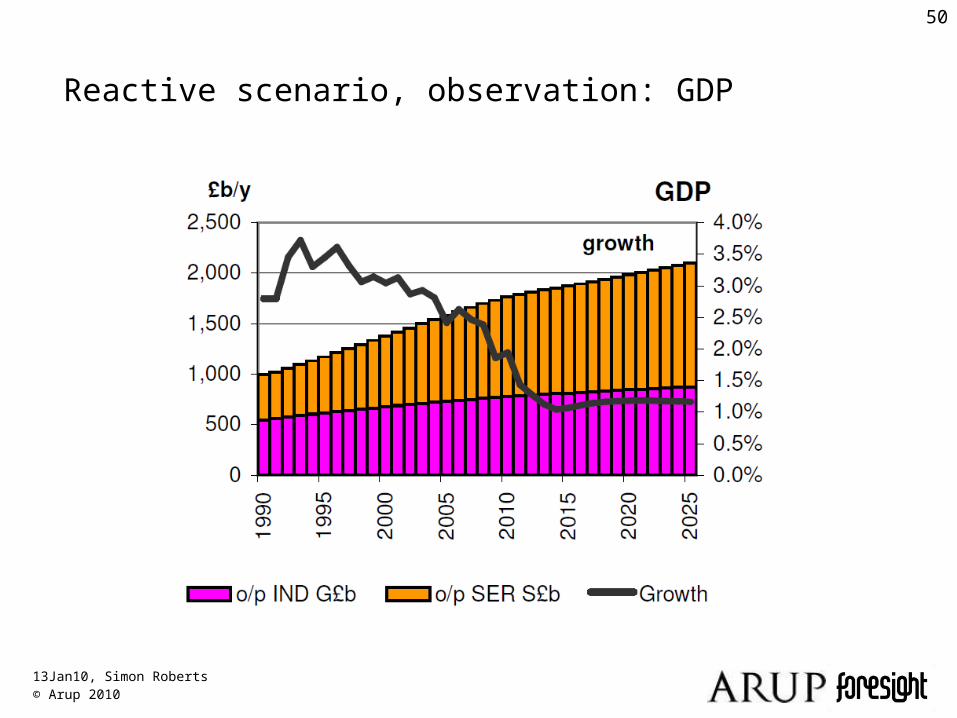
Reactive scenario, observation: GDP
13Jan10, Simon Roberts© Arup 2010
51
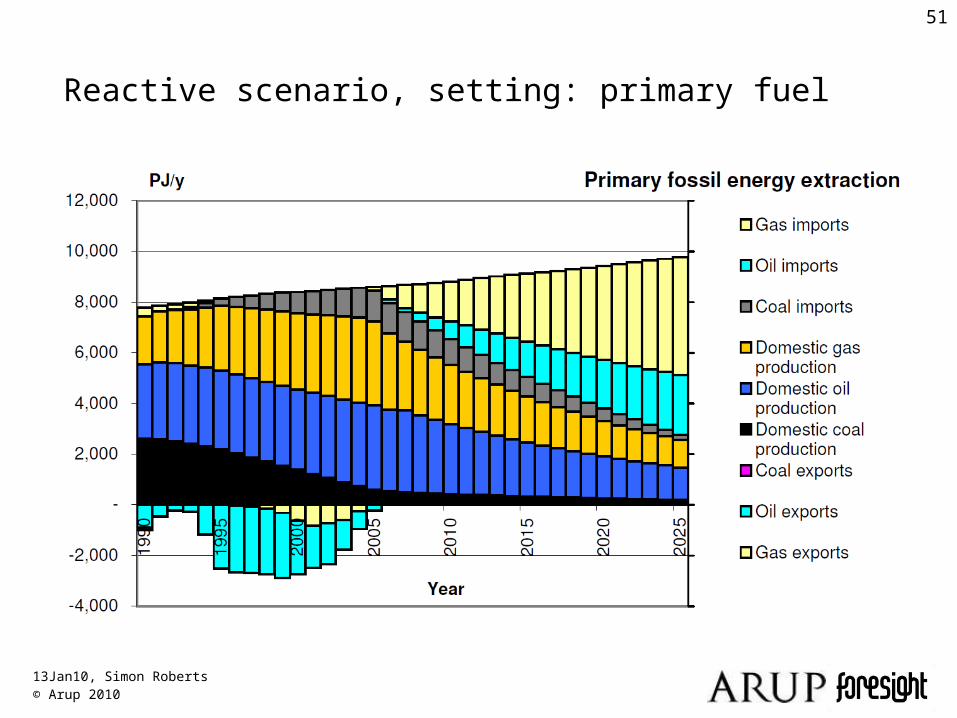
Reactive scenario, setting: primary fuel
13Jan10, Simon Roberts© Arup 2010
52
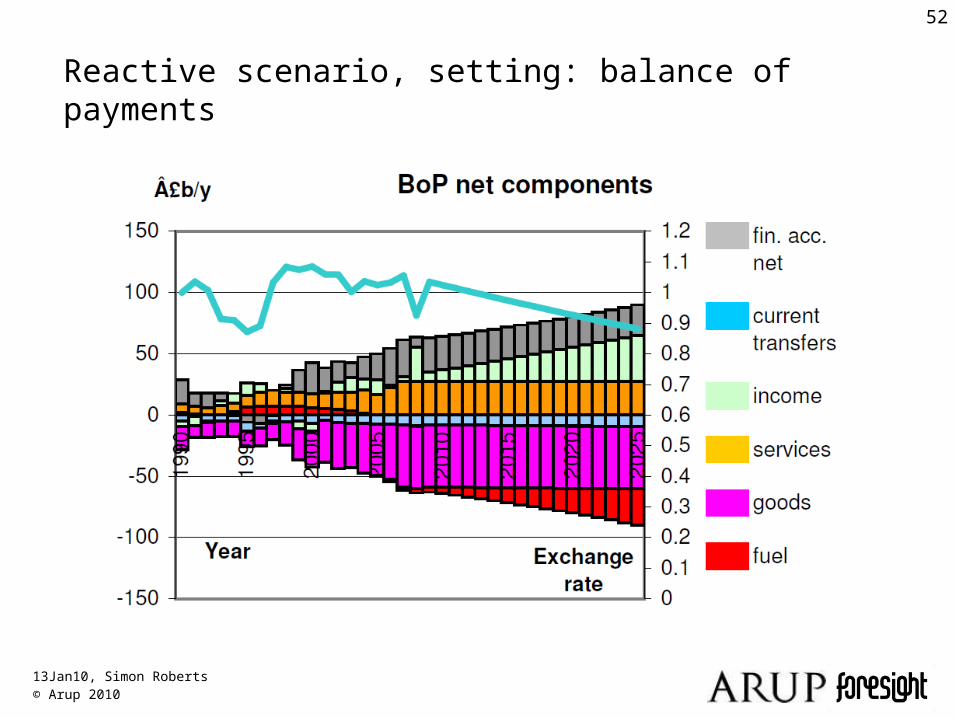
Reactive scenario, setting: balance of payments

13Jan10, Simon Roberts© Arup 2010
53
Reactive scenario, setting: CO2 emissions

13Jan10, Simon Roberts© Arup 2010
54
jobs energy security balance of payments welfare CO2
Policy effectiveness of reactive scenario

13Jan10, Simon Roberts© Arup 2010
55
Wrap up
1. Some consumer consumption of goods could be diverted to ambitious investment programmes for RE and EE.
2. Economic growth and low unemployment would be maintained.
3. Constraints on personal mobility by car are essential to reduce oil imports.
4. Decline of North Sea suggests UK should be taking these steps unilaterally; if nothing else to benefit balance-of-payments…
5. …and the UK can shout about its climate change leadership!
6. The 4see framework enables diverse components of the economy to be examined and their interaction modelled.
13Jan10, Simon Roberts© Arup 2010
56
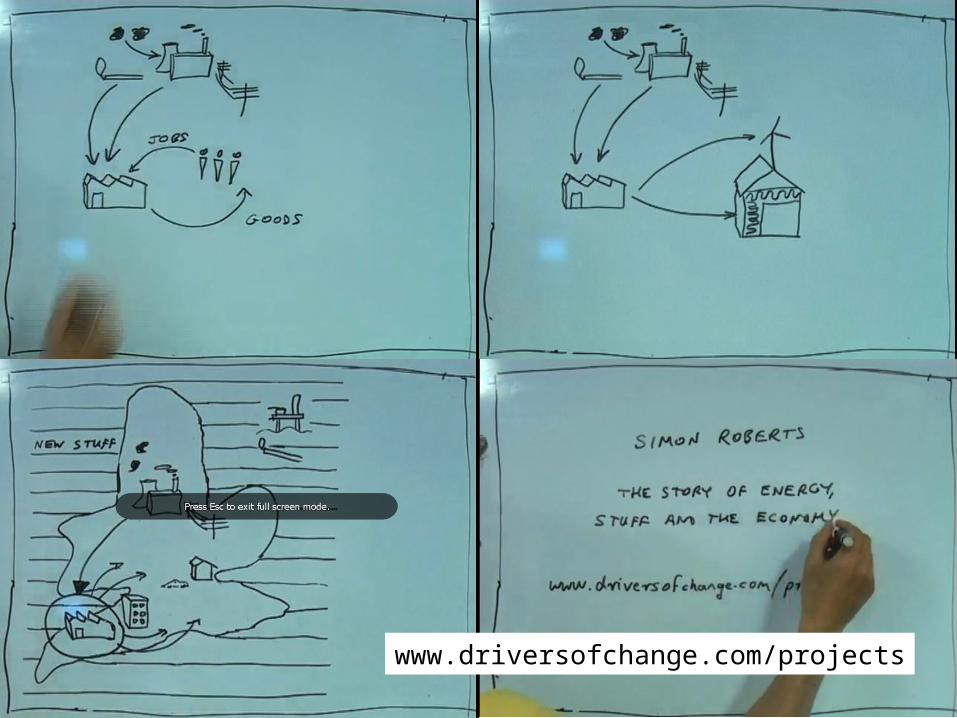
Video (June 2009)
www.driversofchange.com/projects

13Jan10, Simon Roberts© Arup 2010
57
Epilogue
• But CO2 is down only 40% by 2025...• …and there is still growth of stuff.• Need a fundamental review of employment.• Hint from Denmark on enlightened employment policies in 1990s.• More research needed.• Anyone got any ideas on this?

13Jan10, Simon Roberts© Arup 2010
58
Thank you
© just means“You’re welcome to but please tell me if you plan to use the
material”