sub-saharan africa’s integration in the global financial ... · pdf filesub-saharan...
TRANSCRIPT
Sub-Saharan Africarsquos Integration in the Global Financial Markets
Corinne Deleacutechat Gustavo Ramirez
Smita Wagh and John Wakeman-Linn
WP09114
2
copy 2009 International Monetary Fund WP09114 IMF Working Paper African Department
Sub-Saharan Africarsquos Integration in the Global Financial Markets
Prepared by Corinne Deleacutechat Gustavo Ramirez Smita Wagh and John Wakeman-Linn
May 2009
Abstract
This Working Paper should not be reported as representing the views of the IMF The views expressed in this Working Paper are those of the author(s) and do not necessarily represent those of the IMF or IMF policy Working Papers describe research in progress by the author(s) and are published to elicit comments and to further debate
The paper uses a unique database covering 44 countries in sub-Saharan Africa (SSA) countries between 2000 and 2007 to study the determinants of the allocation and composition of flows across countries as well as channels through which private capital flows could affect growth In our sample the degree of financial market development is an important determinant of the distribution of capital flows across countries as opposed to property rights institutions The fairly consistent positive association between net capital flows and growth for SSA countries contrasts with the more pessimistic results of recent studies though our data do not allow us to make conclusive inferences about a causality relationship JEL Classification Numbers F21 F36 F43 O16 O43 O55 Key words International capital movements financial integration economic growth institutions and growth Africa Authorsrsquo E-Mail cdelechatimforg gramirezimforg swaghworldbankorg jwakemanlinnimforg
3
Contents Page
I Introduction 4
II Recent trends in financial globalization in SSA6
III Determinants of Private Capital Flows to SSA9 A Recent Literature12 B Estimation strategy and Model13 C Empirical Analysis 14
IV Do private capital flows have an impact on growth in SSA20 A Correlation Analysis 22 B Testing channels of transmission of private capital flows on growth 23 C How do Private Capital Flows Affect Growth 25
V Conclusion 27 Tables 1 Private Capital Flows Volatility8 2 Capital Market Development in Sub-Saharan Africa 10 3 Baseline OLS Estimation Results 18 4 Instrumental Variables Estimation Results19 5 Correlations Net Capital Flows and Real Growth 23 6 Channels of Transmission Between Capital Flows and Growth 24 7 Estimation Results Linear Growth Model with Capital Flows26 Figures 1 Private Capital Inflows to Sub-Saharan Africa 2000-07 5 2 Global Liquidity6 3 Domestic 7 4 Recipients of Private Capital Flows8 5 Top Ten Recipients of Private Capital8 6 External Vulnerability9 7 Sub-Saharan Africa Capital Flows and Real GDP Growth 22 Appendices I Capital Flows Data28 II Variables Definitions and Sources30 III Determinants of Capital Flows Descriptive Statistics and Correlations32 IV Private Capital Flows and Growth34 References35
4
I INTRODUCTION
For decades Africa has been heavily dependent on official development assistance (ODA) to finance persistent balance of payments deficits With low incomes and generally weak economic policies most countries in sub-Saharan Africa (SSA) were unattractive to private investors and thus received little private capital except for foreign direct investment (FDI) in sectors focused on natural resource extraction This has changed in the last decade Abundant global liquidity combined with improved economic policies and prospects in many SSA countries led to a surge in private capital flows with sharp increases in all forms of private capital inflowsmdashFDI portfolio investment and private debt flowsmdashto SSA (Figure 1) As a result in 2007 for the first time ever private capital inflows increased almost six-fold since 2000 to reach an estimated US$84 billion double the amount of ODA to SSA The onset of the financial crisis radically changed the picture with a drying up and in some cases such as South Africa a large reversal of capital flows These developments raise important questions and policy challenges for SSA countries How dependable are these capital flows Have they contributed or are they likely to contribute to improved economic growth prospects How can governments enhance prospects for continued capital inflows particularly in the face of the recent global financial crisis which have seen a sharp decline in global liquidity and a reduced global appetite for risk To begin to answer these questions one must first understand better the factors driving the recent surge in private capital flows to SSA That is the objective of the paper to identify factors behind the composition and distribution of recent private capital flows to sub-Saharan Africa and to begin investigating their possible contribution to growth Building on the observation that the distribution and composition of capital inflows varies substantially across SSA countries we analyze the impact of key country characteristics in attracting different amounts and types of private capital Other studies have highlighted the importance of slow-moving determinants such as the level of economic development or growth performance de jure capital account openness and the quality of institutions These country characteristics are also going to have both a direct and indirect impact on growth in recipient countries along with private capital flows making it difficult to identify the direction of causality To complicate matters further the empirical literature is ambiguous as to whether capital flows have a positive impact on economic growth To partly address these issues we use an instrumental variables approach to study the determinants of private capital flows On the growth impact following Rodrik and Subramanian (2009) we use a two-step approach to investigate possible channels of transmission through which capital flows could influence growth in order to have even a second-order impact on growth capital flows should as a necessary condition at least have a first-order impact on variables known to influence growth
5
Figure 1 Private Capital Inflows to Sub-Saharan Africa 2000-07
Source African Department Database and IMF staff calculations
Fig 1a Private Capital Inflows(Billions of US Dollars)
0
10
20
30
40
50
60
70
80
90
2000 2001 2002 2003 2004 2005 2006 2007
LoansPortfolio FDI
Fig 1b Private Capital Inflows(percent of total flows)
0
20
40
60
80
100
2000 2001 2002 2003 2004 2005 2006 2007
On the determinants side we find that capital market development rather than basic property rights institutions is more closely associated with higher private capital inflows This may be a reflection of the increasing importance of portfolio and debt flows relative to FDI that has been observed in the recent period in SSA Looking at the growth impact we find strong positive correlations between private capital inflows and real GDP growth in the recipient countries However in part because of the limited time-period of our sample we are unable to prove a causal relationship whereby inflows increase growth The paper is related to recent research on determinants of capital flows and on the growth impact of capital flows As documented below both strands of the literature are quite well-populated but to our knowledge this study is the first to analyze these issues for the whole of sub-Saharan Africa in the context of the recent surge in global private capital flows It exploits a unique data set for 44 sub-Saharan African countries1 including annual data on private capital inflows (broken down by FDI portfolio and private debt) between 2000 and 2007 Appendix I provides further details about the capital flows database and how it compares to similar published datasets and Appendix II presents the definitions and sources of other variables used in the empirical analysis The paper is organized as follows Section II looks into recent trends in private capital flows to SSA Section III discusses the determinants of private capital flows and section IV investigates the association between these capital flows and growth Section V concludes
1 For the analysis we also had to exclude Zimbabwe due to sketchy and unreliable data over the sample period
6
II RECENT TRENDS IN FINANCIAL GLOBALIZATION IN SSA
In the period of the recently-ended boom in global financial markets inflows of private capital became the most important source of external finance for sub-Saharan Africa The increase in private capital flows to the region was in line with that in other regions and all low-income countries (Dorsey et al 2008 World Bank 2007) On average in the period between 2001 and 2007 total gross inflows to the region increased by 32 percent annuallymdashthe rate accelerating to 44 percent after 2005 Private capital flows to SSA have risen almost 6-fold since 2000 from about $15 billion to about $84 billion in 2007 (the latest year for which data is available) Recorded private capital outflows are on the whole much smaller than inflows so that in 2007 net capital flows to sub-Saharan Africa amounted to about US$76 billion As of 2007 private capital flows represented 10 percent of the regionrsquos GDP about twice the volume of official development assistance (about US$40 billion) A confluence of factors was responsible for the surge in private capital A significantly improved macroeconomic performance across much of the continent (Figure 2) and for some countries the implementation of the Multilateral Debt Relief Initiative (MDRI) coincided with increases in global liquidity and higher oil and commodity prices (Figure 3)
Figure 2 Global Liquidity ldquoPushrdquo Factors
Source African Department Database and IMF staff calculations
Fig 2a World Real GDP Growth ( Percent)
0
1
2
3
4
5
6
2000 2001 2002 2003 2004 2005 2006 2007
Fig 2b Oil And Commodity Prices (percent change)
-50
-40
-30
-20
-10
0
10
20
30
40
50
60
2000 2001 2002 2003 2004 2005 2006 2007
Non-fuel commodity prices
Oil prices
7
Figure 3 Domestic ldquoPullrdquo Factors
Source African Department Database and IMF staff calculations
Fig 3a Sub-Saharan Africa Real GDP Growth and Per Capita GDP
0
1
2
3
4
5
6
2000 2001 2002 2003 2004 2005 2006 20070
200
400
600
800
1000
1200
1400
1600
1800
2000(Percent) (US dollars)
Real GDPgrowth
(left scale)
Per capita GDP(right scale)
Fig 3bSub-Saharan Africa Inflation and Central Government Balance
0
5
10
15
20
25
30
2000 2001 2002 2003 2004 2005 2006 2007-10
-9
-8
-7
-6
-5
-4
-3
-2
-1
0
Note Excluding Zimbabwe
(Annual averagepercent)
(Percent ofGDP)
Inflation(left scale) Government balance
(right scale excludes grants)
These inflows represent a potential source of vulnerability as countries become increasingly dependent on potentially volatile private capital flows While the overall volatility of capital flows fell in the latter years in the sample the volatility of FDI has actually increased (Table 1)2 In addition for low income SSA countries in particular there has been a strong correlation between capital inflows and current account balances with inflows increasing as the current account improves and decreasing as the current account deteriorates magnifying the resulting swings in the overall balance of payments (Figure 6) On the other hand the surge in private capital inflows has contributed to a steady increase in international reserves of SSA countries providing these countries with increased scope to finance balance of payments deficits
MeanStandard Deviation Volatility Mean
Standard Deviation Volatility
Total inf low 198 45 44 522 243 21FDI 124 50 25 186 42 45Portfolio 13 07 19 177 131 14Private deb 61 05 132 158 88 18Source IMF African Department database 2008
Table 1 Private Capital Flows Volatility2000-03 2004-07
2 An important factor in the increase in FDI volatility seems to be a fairly large movement in FDI in South Africa in 2005-2006
8
Figure 4 Recipients of Private Capital Flows
Fig 4c Share of Portfolio and Debt Flows 2000-03(percent of total)
South Africa 231
Kenya 74
Ethiopia 68
Ghana 68Congo Dem Rep of 63
Other SSA 496
Fig 4d Share of Portfolio and Debt Flows 2004-07(percent of total)
South Africa 728
Nigeria 56
Ghana 22
Angola 20
Kenya 17
Other SSA 157
Fig 4a Share of FDI Inflows 2000-03
South Africa 273
Nigeria 168
Angola 165
Equatorial Guinea 58
Chad 50
Other SSA 285
Fig 4b Share of FDI Inflows 2004-07
Nigeria 343
South Africa 155Equatorial Guinea
102
Tanzania 32
Congo Republic of 29
Other SSA 338
Figure 5 Top Ten Recipients of Private Capital
F ig 5 a T o t a l In f l o w s( m i l l io n s o f U S d o l la rs )
A n g o la
K e n ya
C h a d
T a n z a n ia
S o u th A f r ic a
N ig e r ia
E q u a t o r ia l G u in e a
G h a n a
C o n g o D e m R e p o f
E t h io p ia
0 5 0 0 0 1 0 0 0 0 1 5 0 0 0 2 0 0 0 0
F i g 5 b I n fl o w s t o G D P( p e r c e n t)
C h a d
S e yc h e l le s
C o n g o R e p u b l ic o f
S atilde o T o m eacute amp P r iacute n c i p e
A n g o l a
E q u a t o r ia l G u in e a
G a m b ia T h e
C a p e V e rd e
C o n g o D e m R e p o f
G u in e a - B i s s a u
0 5 1 0 1 5 2 0 2 5 3 0 3 5
F ig 5 c In f lo w s to P o p u la ti o n( r a ti o )
A n g o la
G a b o nC o n g o
R e p u b l ic o fC a p e V e r d e
N a m ib ia
B o t s w a n a
S o u t h A fr i c a
M a u r i t i u sE q u a t o r i a l
G u in e aS e yc h e l le s
0 5 0 0 1 0 0 0 1 5 0 0 2 0 0 0
Note All rankings based on averages for 2000-07 Source African Department data base and IMF staff calculations
9
Figure 6 External Vulnerability
Fig 6a Low-income African Countries Current Account Balance and Capital Inflows 2000-07
0
100
200
300
400
500
600
700
800
900
2000 2001 2002 2003 2004 2005 2006 2007-14
-12
-10
-8
-6
-4
-2
0
Capital Flowsleft axis
Current Account Balanceright axis
Fig 6b Oil Producers Current Account Balance and Capital Inflows 2000-07
0
500
1000
1500
2000
2500
2000 2001 2002 2003 2004 2005 2006 2007-20
-15
-10
-5
0
5
10
Capital Flowsleft axis
Current Account Balanceright axis
Fig 6c Low Income Africa Countries International Reserves and Capital Flows
0
100
200
300
400
500
600
700
800
900
2000 2001 2002 2003 2004 2005 2006 200700
02
04
06
08
10
12
14
16
Reservesright axis
Capital flowsleft axis
Fig 6d Oil Producers International Reserves and Capital Flows
0
500
1000
1500
2000
2500
2000 2001 2002 2003 2004 2005 2006 20070
2
4
6
8
10
12
Capital Flowsleft axis
Reservesright axis
III DETERMINANTS OF PRIVATE CAPITAL FLOWS TO SSA
This section investigates the determinants of private capital flows to sub-Saharan Africa during 2000-2007 with particular focus on the role of domestic capital market development Capital flows to sub-Saharan Africa particularly portfolio flows have been concentrated in a relatively small number of countries with relatively sophisticated financial markets In these countries capital has flown into equities where the stock market was sufficiently developed (eg Kenya Nigeria) government bonds in countries that had sovereign issues (Botswana Ghana) and short-term government securities (Uganda Tanzania and Zambia) when few other investment vehicles open to non-residents were available The availability of investment instruments appears to have dominated the existence of capital controls For example in Tanzania legal loopholes allowed international investors to purchase significant amounts of government securities although in principle foreigners were not allowed to hold government debt (IMF 2008)3
3 Nevertheless targeted capital controls as in Ghana appear to have been successful in developing the longer end of the market for government debt
10
We use a new indicator of capital market development in sub-Saharan Africa that captures the structure of capital markets Capital markets along with money foreign exchange and derivatives markets form part of a countryrsquos ldquoessential financial marketsrdquo (Stone et al 2008 Lukonga forthcoming) In particular we consider government securities markets both for treasury bills and treasury bonds as well as corporate bond markets and equities markets (see Lukonga forthcoming) We construct a simple index which is the sum of four dummy variables taking the value of 1 if the market in question exists and is well-developed The index covers all sub-Saharan African countries except Somalia Using this index simple tabulations show that the average level of financial market development is fairly low in sub-Saharan Africa with only 10 countries or 21 percent of the sample countries having complete capital markets (Table 2)4 However as discussed earlier these countries are also among the largest recipients of private capital inflows in sub-Saharan Africa along with a few oil exporters (Angola Congo Chad and Equatorial Guinea) While the role of institutional development in attracting international capital flows has been emphasized in recent studies very few have attempted to isolate the role of financial versus basic property rights institutions The measures of financial market development used in the literature and that would be available for low-income countries such as ratios of money and credit to GDP have their limitations They measure outcomes such as the ability of the financial (mostly banking) sector to provide transaction services (in the case of the ratios of money or broad money to GDP) or the capacity of the banking system to channel savings rather than the extent of financial market development as measured by the availability of investment instruments Our empirical results detailed below indicate that along with other factors such as market size (particularly for portfolio inflows) and oil exporting status (particularly for FDI flows) the index of capital market development is a significant and robust determinant of international capital flows to sub-Saharan African countries
4 The countries are Botswana Ghana Kenya Namibia Nigeria South Africa Swaziland Tanzania Uganda and Zambia
11
Capital Markets
T-Bills T-BondsCorporate
Bonds Equities
Botswana X X X XGhana X X X XKenya X X X XNamibia X X X XNigeria X X X XSouth Africa X X X XSwaziland X X X XTanzania X X X XUganda X X X XZambia X X X XBenin X X X Burkina Faso X X X NCape Verde X X N XMauritius X X XMozambique X X X Zimbabwe X X XAngola X X N NCocircte dIvoire N X N XGambia The X X N NSenegal X X N Seychelles X X N NCameroon N N XCongo Dem Rep of X N N NEthiopia X N N NGuinea X N N NGuinea-Bissau X N N NLesotho X N N NMadagascar X N N NMalawi X N N Rwanda X N N NSierra Leone X N NTogo X N Burundi N N NCentral African Republic NChad N N N NComoros N N N NCongo Republic of N N N NEquatorial Guinea N N N NEritrea N N NGabon N N N NLiberia N N N NMali N N NNiger N Satildeo Tomeacute and Priacutencipe N N N N
Sources Lukonga (forthcoming) and authors calculationsNotes X denotes that the market is fairly or very well developed denotes that the market nominally exists or is partially developedN denotes that the market does not exist
Table 2 Capital Market Development in Sub-Saharan Africa
12
A Recent Literature
The starting point of much of the recent literature on determinants of capital flows has been an attempt to explain the Lucas Paradox or why private capital doesnrsquot seem to flow from rich to poor countries Standard neoclassical theory predicts that capital should flow from capital-rich countries (with low marginal productivity of capital) to capital-scarce countries (with a high marginal product of capital) In practice however the bulk of observed flows particularly in the modern period consists of flows among developed economies Compared to the early 20th century era of financial globalization the current wave of capital flows is characterized by massive diversification of flows between high-income economies and a relative marginalization of less-developed economies (Obstfeld and Taylor 2004 Schularick 2006 and Schularick and Steger 2008) Some authors posit that the paradox is due to country-specific fundamentals that tend to lower the marginal product of capital in developing countries such as missing factors of production including human capital poor economic policies and poor institutions (Alfaro Kalemli-Ozcan and Volosovych 2005a and 2005b Faria et al 2006 Faria and Mauro 2004 Schularick and Steger 2008) In this vein a recent study shows that the extent of domestic financial market development and the quality of domestic financial institutions has played a significant role in attracting capital flows to emerging markets (IMF 2007) The second set of explanations centers around international capital market imperfections such as asymmetric information sovereign risk and capital controls For example Portes and Rey (2005) find that informational frictions proxied by geographic distance affect the amount and direction of capital flows and Lane (2004) also finds that credit market frictions are a determinant of debt flows in 1970-1995 The studies that focus on the role of institutions in attracting foreign private capital highlight the importance of basic institutions particularly property rights protection Weak property rights owing to poor quality institutions affect entrepreneursrsquo investment decisions Risks of expropriation armed conflict and malfunctioning legal systems all have a potentially negative impact on the returns from those investments Empirically property rights institutions have been proxied by an index derived from the Kaufman Kray and Mastruzzi World Governance IndicatorsWGIs or by an index derived from the ICRG indicators 5 Using those proxies better quality institutions are found to be positively and significantly correlated with foreign equity flows (Alfaro et al 2005a 2005b) and with a higher share of equity in a countryrsquos total stock of external liabilities (Faria and Mauro 2004 and Faria et al 2006) 5 The ICRG composite index aggregates over several dimensions such as government stability investment profile internal and external conflict non-corruption law and order protection from religious and ethnic tensions non-militarized politics democratic accountability and quality of bureaucracy (wwwprsgroupcom) Similarly the WGIs measure countriesrsquo score according to 6 governance dimensions namely voice and accountability political instability government effectiveness regulatory burden rule of law and control of corruption (wwwworldbankorgwbigovernancegovdata)
13
As mentioned earlier few studies focus on the role played by the extent of domestic financial market development in attracting international capital flows While the literature tends to link capital flows (financial globalization) to improvements in domestic financial systems (eg Chinn and Ito 2005 2002 Mishkin 2006) in principle the direction of causality is not clear Chinn and Ito (2005) and Klein (2005) find empirical evidence supporting the notion of a threshold effect financial openness contributes to equity market development only when a threshold level of general development of legal systems and financial development is attained However although property rights and financial institutions could potentially affect capital flows differently no study of the determinants of capital flows has empirically attempted to properly disentangle the effects of both Ju and Wei (2007 2006) develop theoretical models showing that financial institutions and property rights institutions can have different effects on capital flows Whereas an inefficient financial system can be bypassed by international capital flows as they could come in the form of FDI instead of portfolio and debt flows high expropriation risk cannot be bypassed Conversely the stronger domestic property rights the more the country will benefit from international capital flows
B Estimation strategy and Model
Cross-country regressions have been found appropriate to investigate the fundamental (and thus slow-moving) determinants of why some countries attract more inflows or more of a certain type of inflows than other countries In particular we are interested in testing whether financial institutions have a separate and different effect on capital inflows than property rights institutions That effect may also differ depending on the type of capital flows Empirically Acemoglu and Johnson (2005) show that property rights and contractingfinancial market development institutions do affect economic outcomes differently While property rights institutions have a first order effect on economic outcomes such as long-run GDP growth investment rates and financial depth contracting institutions seem to mostly affect the degree of financial market development As others we use instrumental variables to tackle the issue of reverse causality and endogeneity associated with the measures of institutions (Acemoglu and Johnson 2005 Alfaro Kalemli-Ozcan and Volosovych 2005a and 2005b DellrsquoAriccia et al 2008 Faria et al 2006 Faria and Mauro 2004) Building on the recent literature the reduced-form linear equation to be estimated is
iiiii uCPFK +sdot+sdot+sdot+= χβαμ (1) Where iK is log of average inflows to country i iF is a measure of financial institutions and iP a measure of property rights iC is a set of exogenous control variables and iu is an independent error term α β and γ are coefficients capturing the impact of financial development property rights institutions and other controls on capital flows where α and β are of particular interest and μ is a constant
14
Given that the measures of financial and property rights institutions are endogenous simple OLS estimates of equation (1) will be biased As indicated in Acemoglu and Johnson (2005) the α and β coefficients may capture reverse causality or the effect of some other omitted characteristic Second as financial market development and property rights are measured with error there may be a downward attenuation bias and finally if contracting and property rights institutions are correlated the effect of the type of institution that is measured with greater error will load onto the other variable Following Acemoglu and Johnson (2005) the estimation strategy therefore relies on estimating equation (1) with two-stage least squares (2SLS) using valid and separate instruments for financial and property rights institutions The two first stage equations will thus be of the form
iiiii CELF 11111 εχηδν +sdot+sdot+sdot+=
iiiii CELP 22222 εχηδν +sdot+sdot+sdot+= (2) Where iL and iE are instruments for financial institutions and property rights institutions respectively The key exclusion restriction is that Cov( iu iL ) = Cov ( iu iE ) =0 iu being the error term in the second-stage equation (1)
C Empirical Analysis This study utilizes a unique data set on capital inflows to SSA prepared by the staff of the International Monetary Fund described in Appendix I Choice of variables The following set of variables was chosen to estimate equations (1) and (2) (see Appendix II for definitions and sources Descriptive statistics are presented in Appendix III Table 1 bull Financial institutions are proxied by the simple index of capital market development
described earlier (Lukonga forthcoming) The more developed capital markets the higher capital flows
bull Property rights institutions are proxied by the rule of law score from the World Governance Indicators (Kaufmann Kray and Mastruzzi 2008) Among the six governance dimensions used by Kaufmann et al 2008 this is the closest proxy for property rights protection6 Better property rights protection should lead to higher capital flows
6 Various other proxies for property rights institutions exist and have been used in empirical studies Faria et al (2006) and Faria and Mauro (2004) use the simple average of KKMrsquos governance indicators for a single year Alfaro et al use the ICRG score (2005a 2005b) Acemoglu and Johnson (2005) and Acemoglu Johnson and
(continuedhellip)
15
bull Following Acemoglu and Johnson (2005) we use British legal origin as the instrument for financial market development taken from La Porta et al (1999) Acemoglu Johnson and Robinson 2002 Glaeser and Schleifer 2002 and La Porta et al1999 show that in the case of former European colonies legal origin is a valid instrument for contracting institutionsfinancial market development and property rights respectively Legal origin is shown to be positively and significantly associated with financial institutions with civil law countries exhibiting lower financial development than common law countries (Glaeser and Schleifer 2002 La Porta et al 1999)
bull The instruments for property rights institutions are the degree of ethno linguistic fragmentation and the countryrsquos latitude taken from La Porta et al (1999) which have been found to be associated with worse property rights and regulations7 Acemoglu and Johnson 2005 Acemoglu Johnson and Richardson (2002) Faria et al 2006 and Faria and Mauro 2004 use settler mortality in 1500 or population density in 1500 and show that they are valid instruments for property rights institutions For sub-Saharan African countries however settler mortality and population density in 1500 are available only for a subset of countries (Acemoglu and Johnson 2002)8 Given the better country coverage we have chosen to proceed with ethno linguistic fragmentation and latitude
bull A dummy variable to control for oil-exporting countries (the dummy variable takes the value of 1 if the country is an oil exporter) Oil-exporting countries attract more FDI other things equal
bull A dummy variable to control for market size (the dummy variable takes the value of 1 if the country is South Africa or Nigeria) Larger and more sophisticated economies attract more capital flows
Similar studies also include a number of additional explanatory variables though it is more difficult both to argue that they are exogenous and to find valid instruments for them We use these variables in our baseline regression
bull Human capital proxied by the share of secondary school enrollment in the population from the WDI This variable features in explanations of the Lucas Paradox that focus on missing factors of production (Alfaro et al 2005a 2005b) The expected impact of higher human capital on capital flows is expected to be positive
Robinson (2002) use average protection against expropriation risk and constraint on the executive as measures of property rights but these measures are not available for a sufficiently large number of our sample countries 7 La Porta et al (1999) however note that the adverse effects of ethno linguistic fractionalization on government performance tend to disappear when controlling for per capita income and latitude except for public good provision and state-owned enterprises This can be interpreted as countries with a large public enterprises sector tend to have less regard for private enterprises and private property rights 8 Robustness checks using population density in 1500 as an instrument yield results that are consistent with those obtained with ethno linguistic fragmentation (results not shown)
16
bull A measures of de jure capital account openness proxied by the Chinn-Ito measure of capital account openness based on the IMFrsquos AREAER (Chinn and Ito 2007) We use the average value of the Chinn-Ito variable for sub-Saharan African countries over 1999-20059 The effect of capital account openness on capital flows is expected to be positive
bull A measure of trade openness proxied by the sum of exports and imports over GDP Particularly at an initial stage capital mobility develops around greater openness to trade flows Arguably countries that are more open to trade may also be politically more open to greater integration with the rest of the world
bull Macroeconomic performance proxied here by the real GDP growth rate In a panel study of 47 industrial and emerging countries IMF (2007) find that expected macroeconomic performance proxied by lagged real GDP growth is a significant determinant of private capital inflows IMF (2008) similarly finds that real GDP growth and lower fiscal deficits are significantly correlated with higher private capital inflows Alfaro (2005b) uses inflation volatility as a proxy for macroeconomic performance However it is difficult to establish causality as inflows directly affect macroeconomic outcomes (also see below) Further macroeconomic outcomes have been shown to be shaped by institutions making it difficult to study the independent effect of institutional development on capital flows
Correlations Appendix Table III2 shows pairwise correlations between different measures of capital flows while Appendix Table III3 shows the pairwise correlations corresponding to the baseline regressions and Appendix Table III4 focuses on the pairwise correlations of the institutional variables and the instruments
Appendix Table III2 indicates that for our sample the choice of scaling variable affects the pairwise correlations of the inflows with the independent variables This confirms the impression from Figure 5 above that the picture of the allocation of private capital inflows across sub-Saharan countries is very different whether one looks at overall volume of inflows or at the size of the inflows relative to a countryrsquos population or GDP Whereas total inflows as a share of population or GDP will be the variable of interest when studying the economic impact of the inflows on individual countries (see Section IV below) the investigation of the factors determining the allocation of private capital flows to sub-Saharan Africa across the
9 Unlike many other studies that use the simple average of the four dummy variables or the dummy on capital account restrictions (Alfaro et al 2005a 2005b IMF 2007b) the Chinn-Ito measure attempts to capture the intensity of the capital controls by incorporating all the restrictions in the index using a principal components approach Whereas the other restrictions are not directly related to capital account restrictions they are taken as indicative of the overall restrictiveness of the regime The advantage of this measure over other more detailed indices that capture the intensity of capital controls (Quinn 1997 2003 Miniane 2004 Schindler 2009) is its near universal country and extended time coverage 181 countries between 1970 and 2005
17
continent should focus on the total volume of inflows A simple explanation is that private investors are more likely to decide on allocating specific amounts of money to various markets or projects than to fix investment limits relative to a countryrsquos population or GDP Therefore for the remainder of this section the variable of interest will be the log of private capital inflows and their components FDI on the one hand and portfolio and debt flows on the other averaged over 2000-2007 for each sub-Saharan African country excluding Somalia and Zimbabwe Looking at the potential determinants of private capital flows to SSA and their composition in Appendix Table III2 (columns 1-4) overall inflows as well as portfolio and debt inflows are correlated with the index of financial sector development secondary school enrollment the market size dummy variable and the log of initial GDP per capita There are however interesting variations for the determinants of FDI flows to which GDP per capita and secondary school enrollment are not significantly correlated but the proxy for property rights and the dummy for oil producers are The measure of trade openness and the Chinn-Ito capital openness variable are never significantly correlated with private inflows or their components However capital account openness is correlated with the degree of financial sector development as in Chinn and Ito (2005) and with secondary school enrollment
Appendix Table III3 illustrates the challenges associated with finding truly exogenous determinants of private capital flows and their composition as a number of potential explanatory variables are correlated with each other In particular the measure of financial market development is highly correlated with the proxies for property rights institutions as discussed above Further educational achievement is significantly correlated with the institutional quality variables and economic development This is not surprising as it can be understood as an outcome of good institutions and higher degree of economic development This strong degree of endogeneity and the fact that we are interested in disentangling the impact of institutions on capital inflows argues that like the variables capturing macroeconomic performance it is probably not a useful explanatory variable given our focus on the impact of institutions per se on capital inflows The same holds true for the proxy for economic development log of GDP per capita in 2000 (Alfaro et al 2005b show that log real GDP per capita has no additional explanatory power once a measure of institutional quality is introduced)
The pairwise correlations of the potential instrumentsmdashBritish legal origin population density in 1500 and ethno linguistic fragmentationmdashwith the institutional variables and with the capital flows variables are encouraging for the instrumental variables approach (Appendix Table III4) The potential instruments for property rights institutions are uncorrelated with the inflows variables but are significantly correlated with the property rights proxies Although British legal origin is significantly correlated with total inflows in addition to financial institutions it is not correlated with property rights nor its potential instruments
18
Regression results
Table 3 presents the results of simple OLS estimations of various specifications of equation (1) as a benchmark The coefficient on the financial market development index is positive and significant and robust across all specifications For portfolio and debt flows it is even the only variable that is significant maybe highlighting the particular importance of capital market development for non-FDI flows The coefficient on property rights institutions (rule of law score) is never significant and has the wrong sign The coefficients on the controls for country size and oil exporters are large and generally significant but while oil exporters do receive more FDI than other countries they do not have any particular advantage with portfolio and debt inflows Real GDP growth is the only other variable that is significant for total inflows and FDI However as discussed earlier real GDP growth is not exogenous and to study the impact of institutions further we use the specification in column (3) as our baseline The log of real GDP per capita in 2000 secondary enrollment and capital account and trade openness are never significant10 The results obtained are similar when breaking the sample into two sub-periods capturing the period before and after the acceleration of private capital inflows This is not surprising considering that the determinants of inflows are fairly slowly-moving country characteristics They are also robust to excluding South Africa and Nigeria indicating that the results are not driven by the two largest recipients and to excluding all oil exporters (Results available upon request) Indeed the impact of financial market development on inflows is even larger in both cases
(1) (2) (3) (4) (5) (6) (7) (8) (1) (2) (3) (4) (1) (2) (3) (4)Financial Institutions 050 056 052 055 056 058 056 057 067 063 055 057 055
(-346) (586) (548) (544) (565) (527) (603) (536) (499) (343) (348) (322)Rule of Law -021 -033 -041 -027 -028 -033 -037 -003 -010 -020 -018 -052 -058
(-056) (-114) (-136) (-070) (-085) (-112) (-129) (-008) (-025) (052) (-046) (-124) (-131)South Africa and Nigeria 185 187 198 189 179 158 135 137 211 212
(168) (170) (121) (160) (161) (137) (134) (137) (160 (160)Oil Exporters 161 101 162 168 160 164 267 194 051 012
(314) (190) (304) (276) (308) (306) (441) (367) (078) (014)Real GDP growth
011 014 007(326) (304) (127)
Secondary Enrollment -000
(-028)Log 2000 per capita GDP -05
(-032)Capital Account Openness -06
(-06)Trade Openness
-001(-202)
Constant 447 522 379 335 392 413 374 441 342 442 268 216 345 430 288 260(-125) (2317) (1146) (966) (836) (398) (1015) (867) (713) (1956) (635) (477) (900) (1361) (482) (410)
Observations 43 43 43 43 42 43 43 43 43 43 43 43 43 43 43 43R-squared 026 001 057 062 057 057 058 059 022 000 055 059 025 000 042 044F-Statistic 1196 031 1200 1581 878 946 941 1532 1197 001 1289 1406 1176 021 545 493
Source Authors calculations
Note and indicate significant at 1 5and 10 percent t-Statistics are reported in parentheses Robust standard errors
Table 3 Baseline OLS Estimation ResultsTotal Inflows FDI Inflows Portfolio amp Debt Inflows
10 A recent study finds that as is the case for low-income countries de jure financial integration is fairly low for sub-Saharan Africa compared to other regions Capital control regulations tend to be complex and nontransparent and limited capacity to monitor capital flows can lead to inconsistent implementation Inconsistencies between different regulations have also made capital controls easy to circumvent This may explain the difficulties in establishing an empirical relation between capital controls and capital flows in the region (IMF 2008)
19
Table 4 presents the results of the 2SLS estimation The first stage equations are shown in Panel A and the second stage in Panel B Columns (1) and (2) report results using Ethno linguistic fractionalization as the instrument for property rights institutions and columns (3) and (4) using latitude Given the very low R-squared obtained in the latter case corresponding results are not shown for the components of the inflows Starting with the first-stage regressions British legal origin is shown to have a strong positive and significant impact on financial development but not on the rule of law while the instrument for property rights has a stronger and mostly significant impact on property rights (greater ethno linguistic fragmentation has a negative impact on rule of law as does closeness to the Equator) than on financial institutions Market size has a positive and significant impact on capital market development and oil exporting status has a negative and significant impact However market size is negatively related to rule of lawalthough this is likely to be mainly because of the relatively low ratings of Nigeria and South Africa regarding property rights protection Oil exporting status is also negatively related to rule of law a result attributed to the rent-seeking culture that appears to take hold in resource-rich countries (Auty 2001 Auty and Gelb 2001 Karl 1999 1997)
(1) (2) (3) (4) (1) (2) (1) (2) (1) (2)
Financial Institutions042 022 061 062 061 051 032 001 006 011(200) (097) (211) (134) (264) (214) (137) (004) (148) (259)
Rule of Law -101 -035 -225 -231 -096 025 -043 -020 -009 010(-092) (-028) (-198) (-160) (-082) (020) (-034) (-012) (-047) -041
South Africa and Nigeria 277 076 196 380 -037
(205) (039) (149) (241) (-195)Oil Exporters 115 067 265 -060 054
(157) (090 (298) (-006) (332)Constant 396 443 275 255 272 318 359 414 032 030
(430) (448) (233) (157) (287) (379) (348) (334) (188) (170)Observations 42 42 43 43 42 42 42 42 42 42R-squared 028 047 005 007 025 053 024 024 NA 012
British Legal Origin 181 148 188 155 181 148 181 148 181 148(408) (291) (419) (295) (408) (291) (408) (291) (408) (291)
Instrument for Rule of Law1 060 069 031 084 060 069 060 069 060 069
(097) (107) (024) 063) (097) (107) (097) (107) (097) (107)South Africa and Nigeria 145 158 145 145 145
(260) (295) (260) (260) (260)Oil Exporters -085 -074 -085 -085 -085
(-210) (-193) (-210) (-210) (-210)Constant 078 092 106 116 078 092 078 092 078 092
(188) (229) (394) (423) (188) (229) (188) (229) (188) (229)Adj R-squared 032 034 031 033 032 034 032 034 032 034
British Legal Origin 031 034 023 023 031 034 031 034 031 034(166) (161) (121) (121) (166) (161) (166) (161) (166) (161)
Instrument for Rule of Law1 -068 -053 143 148 -068 -053 -068 -053 -068 -053
(-211) (-157) (122) -163 (-211) (-157) (-211) (-157) (-211) (-157)South Africa and Nigeria -065 -058 -065 -065 -065
(-336) (-278) (-336) (-336) (-336)Oil Exporters -033 -048 -033 -033 -033
(-183) (-225) (-183) (-183) (-183)Constant -036 -038 -096 -086 -036 -038 -036 -038 -036 -038
(-150) (-154) (-591) (-514) (-150) (-154) (-150) (-154) (-150) (-154)Adj R-squared 010 017 008 019 010 017 010 017 010 017
Source Authors calculations
Financial Institutions Financial Institutions Financial Institutions
Table 4 Instrumental Variables Estimation ResultsPortfolio Inflows
Panel A Second-Stage Regressions
Panel B First-Stage Regressions
Rule of Law
Note and indicate significant at 1 5and 10 percent t-Statistics are reported in parentheses Robust standard 1 In columns (1) and (2) the instrument for rule of law is ethnolinguistic fractionalization In columns (3) and (4) the instrument is latitude
Total Inflows FDI Inflows
Rule of Law Rule of Law
Share of FDI
Financial Institutions
Rule of Law
20
Comparing the second-stage equations with the OLS estimates the impact of financial institutions is overall weaker (smaller coefficients) but remains strong and significant for total inflows and FDI inflows as well as the share of FDI in total inflows Interestingly the property rights variable is never significant and continues to have the ldquowrongrdquo sign in most cases except for FDI inflows and the share of FDI (column 2) perhaps indicating that non-FDI investors believe property rights are not critical for their relatively liquid investments Oil resources is a strong determinant of FDI inflows but not other types of flows whereas it is market size that seems to matter for portfolio and debt inflows When excluding South Africa and Nigeria or oil-rich countries from the estimation results are broadly similar with the coefficient on financial institutions larger particularly in the FDI regressions This indicates that in non-oil sub-Saharan African countries excluding South Africa FDI inflows are significantly larger the more financial markets are developed Perhaps surprisingly property rights protection is insignificant This may be explained by the fact that as FDI is harder to expropriate even countries with poor property rights protection receive FDI Alternatively for these relatively small countries it may be possible for foreign investors to effectively negotiate greater property rights for their FDI than is generally available in the country for other investors Given the small sample size the results must be interpreted with caution but overall they support the importance of unbundling institutions and measuring them more precisely Results also support the notion that for capital flows financial institutions as proxied by capital markets development matter more than basic property rights institutions capital including in the form of FDI will flow less to countries with less developed financial markets against the view presented in Albuquerque (2003) that FDI should flow more to financially constrained countries
IV DO PRIVATE CAPITAL FLOWS HAVE AN IMPACT ON GROWTH IN SSA This section undertakes a preliminary analysis of the relationship between capital inflows and growth in sub-Saharan Africa Significant capital flows to African countries are a relatively recent phenomenon and as noted above have so far been restricted to a limited number of markets Given the general inconclusiveness of the empirical evidence on the links between growth and capital flows from emerging markets that have been on the radar of international investors much longer than most African markets it is perhaps too early to expect robust econometric results with the particular sample in this paper While it is easy to make a theoretical case for the positive impact of capital flows on growth the empirical verification of this impact has proved much more challenging11 Alternate
11 See Edison and others 2004 Kose and others 2006 DellrsquoAricia and others 2008 and Prasad Rajan and Subramanian 2007 for comprehensive reviews of the empirical literature on the impact of capital flows Though evidence from empirical studies using aggregate data is inconclusive studies that use measures of de facto
(continuedhellip)
21
explanations to this empirical puzzle have predicated the gains from capital flows on the threshold development of certain domestic institutions andor proposed that such flows generate certain indirect or collateral benefits even when their direct impact on growth is difficult to gauge Klein (2005) finds support for a model in which institutional quality intermediates the impact of capital account liberalization on growth by affecting the extent to which savings are protected from expropriation and the premium borrowers pay for funds from abroad In countries with better institutions capital account openness has a significant positive impact on growth Bekaert Harvey and Lundblad (2005) find that the largest growth response to equity market liberalizations accrues to countries with better legal systems above-average financial development and better-quality institutions in terms of investor protection and accounting standards Using industry-level data Prasad Rajan and Subramanian (2007) indicate that for countries that have above-median levels of financial development foreign capital aids the relative growth of those industries dependent on finance But for countries below the median for financial development the effect of foreign capital inflows is diametrically opposite Using firm-level data Alfaro and Charlton (2007) find a significant relationship between entrepreneurial activity and both de jure and de facto international capital integration Their results suggest that foreign capital may improve access to capital either directly or through improved domestic financial intermediation
Recent evidence however indicates that countries that grow more rapidly are those that rely less and not more on foreign capital and in turn foreign capital tends to flow to countries that experience not high but low productivity growth (Prasad Rajan and Subramanian (2007) Gourinchas and Jeanne (2007)) One possible explanation for this puzzle is trade fast-growing countries also are the ones that experienced a takeoff in their export sector (Gourinchas and Jeanne 2007) If capital inflows lead to higher prices for nontraded goods owing to absorptive capacity constraints and thus to overvaluation they will have a negative impact on exports and hence growth (Kose and others 2006 Prasad Rajan and Subramanian 2007) Another explanation is that inflows from abroad that supplement domestic savings will have a limited impact in an economy where the binding constraint is the scarcity of viable investment opportunities (Rodrik and Subramanian 2009)
We estimate the gains from financial globalization using the same cross-section sample of average flows for the 2000-07 period as in the preceding section However in this section we also make use of data on net flows For most African countries the differences between net and total capital flows are not often vast nevertheless the economic impact of such flows depends on the actual infusion of foreign capital rather than gross flows Also we scale net flows to the size of the economy by alternatively dividing them by population or GDP
integration or finer measures of de jure integration tend to find more positive results Studies using micro data are also better able to find growth and productivity gains from financial integration
22
A Correlation Analysis
We begin the correlation analysis with a simple mapping between economic growth and capital flows in sub-Saharan Africa while not drawing any inferences about the direction of causation
12 The scatter plots indicate a generally positive correlation between growth and capital flows in our sample13 Consistent with the findings in the literature the relationship is more pronounced when only FDI flows are considered
Figure 7 Sub-Saharan Africa Capital Flows and Real GDP Growth
Capital Flows and Real Growth(net total flows to population)
-600
-500
-400
-300
-200
-100
0
100
200
300
-2 0 2 4 6 8 10 12 14
Capital Flows and Real Growth(net total flows to GDP)
-15
-10
-5
0
5
10
15
20
25
30
-5 0 5 10 15 20 25
FDI and Real Growth(net FDI to population)
0
20
40
60
80
100
120
140
160
180
-2 0 2 4 6 8 10 12 14
FDI and Real Growth(net FDI to GDP)
-5
0
5
10
15
20
25
30
-5 0 5 10 15 20 25
Note All variables are the average value of the 2000-07 period Where normalized over population the charts exclude the outliers Equatorial Guinea and Seychelles Table 5 provides further evidence of the positive significant correlation between capital flows to sub-Saharan Africa and real GDP growth in the recipient countries This relationship however does not hold when capital flows are disaggregatedmdashwhile FDI is positively correlated with growth portfolio and debt-creating flows are generally inversely related to growth though
12 As mentioned in the previous section in analyzing the relationship between growth and capital flows the latter are normalized over either the population or GDP of the recipient country All variables are considered at their average values over the 2000-07 period to deal with annual volatility 13 This is in contrast with Rodrick and Subramanian (2008) who in a sample of 110 developing countries running through 2004 do not find any relationship between financial globalization (measured as the sum of foreign assets and liabilities as a share of GDP) and growth
23
not significantly so This finding is also consistent with evidence from other studies(DellrsquoAricia and others 2008)
B Testing channels of transmission of private capital flows on growth Another approach to gauging the likely impact on capital inflows on growth is to test the various channels described in the literature on financial globalization and growth Three broad channels are identified as linking capital inflows and growth
bull Overvaluation to the extent that capital inflows cause currency appreciation they hurt exports and thus dampen growth This channel is well-documented in Rodrick (2007) but also discussed in Prasad et al (2007)
bull Savings and investment where foreign capital supplements domestic savings it fosters growth However this would only be true for economies where the main constraint on growth is a lack of savings Where the main hindrance to economic growth is the scarcity of viable investment opportunities additional foreign capital will only add to domestic distortions (Gourinchas and Jeanne 2007 Rodrick and Subramanian 2009)
bull Institutional development a number of studies argue that capital inflows carry indirect (collateral) benefits for recipient countries via the development of domestic institutions (Becker and others 2007 Kose and others 2006) or more particularly financial sector institutions (Mishkin 2006)
The testing methodology employed here utilizes correlations as well via bivariate regressions In the first stage the bivariate model regresses capital flows on the channel of interest If the first stage results indicate that the channel is significantly correlated with capital flows then in the second stage the model regresses the predicted value of the channel
Real GDP Growth
Net Total FlowsGDP
FDI FlowsGDP
Debt FlowsGDP
Portfolio FlowsGDP
Real GDP Growth 100Net Total FlowsGDP 038 100FDI FlowsGDP 066 054 100Debt FlowsGDP -002 072 -007 100Portfolio FlowsGDP -006 031 -010 002 100
Real GDP Growth
Net Total Flows per
capitaFDI Flows per capita
Debt Flows per capita
Portfolio Flows per capita
Real GDP Growth 100Net Total Flows per capita 037 100FDI Flows per capita 044 089 100Debt Flows per capita 008 053 022 100Portfolio Flows per capita -007 025 -001 -006 100Note indicates significant at 10 percentSource Authors calculations
Table 5 Correlations Net Capital Flows and Real Growth
24
from the first regression ie that part of the channel variable correlated with capital flows on growth If the coefficient in the second regression is significant and with the expected sign it implies that the channel is likely to be operational for this particular sample of countries Evidence that a particular channel could be at work is not sufficient to demonstrate the impact of private capital flows on growth but it is a necessary first step Thus Yi = α1 + β Ki + u1 (1) gi = α 2 + η Ŷi + u2 (2) Where Yi is the channel variable of interest Ki are capital flows normalized over GDP or population gi is the real GDP growth rate and Ŷi is the predicted value of the channel variable of interest derived from the first regression All variables are in their level values so that sign and significance of β and η are of greater interest than their magnitude The results are presented in Table 6 below
Overvaluation InvestmentDomestic
Savings InstitutionsNet flowsGDP -0004 0164 0337 -0214Net flows per capita -000003 0012 0021 -00042Note and indicate significant at 1 and 5 percent respectivellySource Authors calculations
Table 6 Channels of Transmission Between Capital Flows and Growth
The findings indicate that in most instances capital flows are not significantly correlated with the channel variables in our sample Except when capital flows are scaled to the size of the recipient countryrsquos population mdash both savings and investment are positively and significantly related to capital flows in this instance14 This implies that for SSA countries the impact of private capital flows on growth could be partly intermediated through the impact of net capital flows on domestic savings and investment Another implication would also be that African economies are not necessarily investment-constrained15 14 As expected the impact of the predicted values of investment and domestic savings in the second stage regressions is positive
15 Rodrik and Subramanian (2009) define an economy to be savings-constrained when private investment is low despite the existence of many privately profitable projects because credit is either not available or too costly and to be investment-constrained when credit is available but there is a lack of profitable investment opportunities (p12) In savings-constrained economies foreign capital will supplement scarce domestic savings (evidenced by high real interest rates) and lead to increased investment In investment-constrained economies real interest rates will be low and additional capital flows will finance consumption rather than investment
25
In an unexpected outcome the institutional variable is negatively related to growth a result that holds even when oil-exporters are excluded from the sample (not shown)
C How do Private Capital Flows Affect Growth Going beyond bivariate correlations we first present a simple cross-country multivariate regression model making use of a averages for the 2000-07 period 16 Although this method is not without shortcomings the limited time coverage of our dataset and year-on-year volatility dampens the usefulness of panel estimation However our analysis is subject to the considerable limitations of the ordinary least squares estimator in growth models mdash especially those arising from endogenous variables We fit a simple ordinary least squares specification to estimate the relationship between capital flows and growth gi = α + β Ki + η Xi + ui Where gi is real GDP growth Ki are capital flows normalized over GDP or population Xi is a set of control variables and ui is an independent error term In our choice of control variables we are guided by the ldquochannelsrdquo analysis from the preceding section since our interest in primarily in the impact of capital flows on growth Thus our multivariate model is essentially a simultaneous test of the correlations between of the various channel variables (plus capital flows directly) and growth As discussed above other factors shown in the literature on financial globalization to influence growth include savings and investment exchange rate overvaluation and institutions The exchange rate overvaluation measure is constructed as the ratio of the nominal exchange rate to the purchasing power parity exchange rate17 The measure of institutions used here is the number of procedures to enforce a contract (Contracts) from the World Bankrsquos Doing Business database We also control for level of economic development by including the log of initial per capita real GDP growth The results are documented in Table 7
16 See Appendix Table IV1 and Appendix Table IV2 for summary statistics and correlations for the variables included here 17 More precisely the variable is the residual of a simple panel regression between the nominal exchange rate (local currency per US dollar) versus the PPP valuation of the exchange rate The regression was run for all countries in the world and the variable is normalized to be 1 for the world as a whole
26
[1] [2] [3] [4]Initial per capita GDP (log) -153 -186 -167 -216
(-311) (-403) (-362) (-415)Overvaluation -082 -153 -068 -125
(-045) (-084) (-038) (-068)Domestic savings 009 010 009 010
(339) (359) (361) (362)Investment 018 016 015 017
(333) (293) (258) (297)Contract enforcement 011 009 009 008
(164) (142) (153) (123)Net total flowsGDP 011
-194Net total flows per capita 0003
205Total inflowsGDP 018
(227)Total inflows per capita 0003
(147)Constant -106 412 054 629
(-013) (054) (007) (080)
Adjusted R2 051 052 053 057Number of observations 42 42 42 42Note and indicate significant at 1 5 and 10 percent respectivelly t-statistics in parenthesis
Table 7 Estimation Results Linear Growth Model with Capital Flows
The results indicate that capital flows are positively and significantly (in all but one instance) associated with growth Initial per capita GDP comes in with a negative and significant coefficient in all specifications indicating support for growth convergence Domestic savings and investment are the other significant right-hand side variables that also come in with the expected sign Contract enforcement the proxy for institutional development is not significant in any of the specifications Overvaluation has the expected sign but is never significant Estimating the equation with measures of net FDI instead of total net private capital yields similar results with an even stronger association between the FDI variable and growth Aside from the positive correlations and partial evidence of a possible through the savings-investment channel our analysis is rendered incomplete by the short time period since these inflows began While the limited number of observations in our sample required us to focus on average growth and inflows over the period 2000-2007 most of the inflows came late in this period This is an issue which requires further study as additional observations (years) become available As described in Section II the observed rise in private capital flows and growth during the sample period is an important necessary condition in particular because other studies even fail to uncover such an association for different country groups andor sample periods However it is also far from sufficient for making inferences about causality
27
V CONCLUSION
As a result of the global financial crisis and recession private capital flows to all regions of the world have declined Even when the international economy recovers and financial markets return to health it is likely that investors will remain for some time more risk-averse than they were previously At the same time donor flows to low-income countries including those in sub-Saharan Africa are likely to be adversely impacted by these global developments Our results were inconclusive regarding the impact of private capital flows on growth in SSA countries Additional research will be needed before a definitive statement can be made in this regard once additional observations are available However most SSA countries are likely to remain dependant on financial inflows in some form to help finance current account deficitsmdashdeficits that will be the counterpart of development-oriented investments in these economies As donor flows are likely to be restricted in the coming years due to the fiscal problems the traditional donor countries find themselves confronting SSA countries will need private capital flows to finance these current account deficits The alternative would require smaller or no current account deficits meaning reduced development-oriented investments in infrastructure and other key areas with adverse consequences for growth potential All this means that policy makers in SSA will need to pay increasing attention to efforts to attract private capital to their countries Our results indicate that one of the most important things policy makers can do to attract private capital is to strengthen domestic capital markets Deep and well-functioning money foreign exchange equity and (where relevant) derivative markets are key to attracting private capital Governments in SSA countries would be well-advised to redouble their efforts to develop and strengthen these markets to put their countries in a position to attract private capital in the future At the same time an important of the current financial crisis should also be to put in place strong monitoring regulatory and supervisory frameworks to avoid a buildup of balance-sheet vulnerabilities
28
Appendix I Capital Flows Data The information on private capital flows is based on detailed balance of payments data obtained from AFR country desk economists in late 2007 for 44 sub-Saharan African countries Data for 2000-2006 are actual and data for 2007 are preliminary estimates The data distinguishes between FDI portfolio (debt and equity) and private debt-creating flows and between inflows and outflows The definition of capital inflows adopted for this study differs from other papers using balance of payments data as a measure of capital flows (see Appendix Box I1 for precise definitions used in the paper) Appendix Box I1 Balance of payments recording of capital flows
From the perspective of the financial account one usually thinks of changes in liabilities as positive (inflows) and changes in assets as negative (outflows) In practice both changes in liabilities and assets are reported as net of any disinvestment and consequently both can have any sign In the BOP accounts an increase (decrease) in liabilities to nonresidents is entered as positive (negative) while an increase (decrease) in net foreign assets held by residents is entered as negative (positive) If a resident sells an asset held abroad the transaction is recorded as a reduction in net foreign assets held by residents bringing an inflow of capital For this study capital inflows (outflows) are taken to be the sum of increases (decreases) in liabilities to non-residents and of decreases (increases) in net foreign assets held by residents in a year This allows to capture all transactions that give rise to a inflow of capital into a country on the liability and asset side and avoids negative ldquoinflowsrdquo Net flows of capital are calculated as the sum of the inflows (positive sign) and outflows (negative sign)
This data differs from other published data sources with respect to its timeliness coverage and level of detail bull The 2000-2007 period covers the most recent episode of private capital inflows to
sub-Saharan Africa which took off around 2005-2006
bull It covers 43 sub-Saharan African countries
bull It allows to distinguish between different types of private capital flows (FDI portfolio flows and debt-creating flows) In contrast with other studies (eg Faria and Mauro 2004) that add together FDI and portfolio equity flows we keep them separate and group portfolio debt and equity (either category is too small to stand on its own) We are interested in the determinants of various types of flows particularly as regards the development of financial markets and straight FDI doesnrsquot require any particular type of financial market infrastructure However portfolio debt and equity investment require the existence of bond and equity markets
Other data sources that cover all sub-Saharan African countries include the IMFrsquos WEO IFS Balance of payments data and the World Bankrsquos global development finance data Another
29
widely used data base is the Lane-Milesi-Ferretti data but the most recent updated version goes until 2005 and covers only a sub-set SSA countries Another group of studies use current account data as a proxy for capital flows (Prasad et al 2007 Gourinchas and Jeanne 2007) ndash which have the advantage of providing wide coverage in terms of years and countries but make it impossible to disaggregate between official and private transfers and different types of capital flows The Fundrsquos World Economic Outlook (WEO) database and the World Bankrsquos Global Development Finance (GDF) database provide the most comprehensive coverage of capital flows to sub-Saharan countries These data sets have few missing countries and few missing observations for the countries that are in the data sets However the comprehensiveness of the WEO and the GDF databases is achieved at a price as each data set relies on Fund and Bank staff estimates to fill in the lacunae left from official statistics (Dorsey et al 2008) Other data sets such as the Fundrsquos International Financial Statistics and the Balance of Payments Statistics databases rely on official reporting without the use of staff estimates to fill in the gaps The more detailed and comprehensive coverage of the international transactions at the country level is available in the Balance of Payment Statistics published once a year by the IMF Although information for most of the sub-Saharan African countries is included in the publication the most recent database shows a complete set of annual data for just 18 out of 44 countries in the region mostly the middle-income countries two oil-exporters and the largest low-income economies among them The other countries have missing data either for the capital flows components or some years specially at the end of the period covered in the study which is crucial for the econometric analysis The work of the country desk economists was essentially to make sure that all series were available and the components were consistent with the main aggregates We checked also consistency across the different published databases finding discrepancies mostly in the last few years of the sample and few revisions to historical numbers in the early 2000rsquos for the countries with data in the various publications Looking into the World Economic Outlook database there is a full coverage of the countries in the region but it is difficult to separate actual figures from the forecasted ones or estimates (specially for countries with lags in reporting official data from the authorities) and programs with the Fund requiring accurate estimates on the missing BOP data embedded in the Program We used the WEO data which are also reported by country desk economist in the Fund as a starting point and asked the desk economists to look into the details and components that are normally not used in the aggregated analysis of the external accounts offered in the WEO studies and data In brief we have not created a separate database but rather taken the available information and refined it in a way that allows us to cover as many countries in the region as possible regardless of the size of the country and the level of development weighing properly in the model those countries with no capital flows (reporting zeros) and including those null figures as information in the dependent variable
30
Appendix II Variables Definitions and Sources
Variable Description Units Source
Net total flows FDI portfolio and debt net flows See below Billions of US$ IMF African Department database
Net FDI Net foreign direct investment flows (FDI in the reporting economy net of direct investment abroad)
Billions of US$ IMF African Department database
Net portfolio and debt flows Net private portfolio investment and other private flows Includes equity and debt securities as well as all other net private debt creating flows
Billions of US$ IMF African Department database
Total Inflows FDI portfolio and debt inflows See below Billions of US$ IMF African Department database
FDI Inflows Foreign direct investment in the reporting economy Billions of US$ IMF African Department database
Portfolio and debt inflows Portfolio investment liabilities including equity and debt securities liabilities plus other private capital inflows Includes all other private debt creating flows (Liabilities excludes monetary authorities and government)
Billions of US$ IMF African Department database
CPIA Country Policy and Institutional Assessment Composite index based on sixteen criteria grouped in four categories (i) economic management (ii) structural policies (iii) policies for social inclusion and equity and (iv) public sector management and institutions
1 to 7 World Bank
Financial Institutions Index of capital markets development defined as the sum of four dummy variables Treasury bills treasury bonds corporate bonds and equity markets exist
0 1 2 3 4 with 0 for countries without any market to 4 for countries with all four markets present
Lukonga (forthcoming) and authors calculations
Rule of law The extent to which agents have confidence in and abide by the rules of society and in particular the quality of contract enforcement the police and the courts as well as the likelihood of crime and violence One of the six components of the Governance Indicators
-25 (lower score) to 25 for the highest score
httpinfoworldbankorggovernancewgiindexasp
South Africa and Nigeria Dummy variable 1 for South Africa and Nigeria 0 otherwise 0 1 Authors calculations
Oil exporters Dummy variable 1 for Angola Cameroon Chad Congo Rep of Equatorial Guinea Gabon and Nigeria 0 otherwise
0 1 IMF African Department database
Real GDP growth Real GDP growth Calculated as the percent change of the constant Gross domestic product in 2000 local currency units Measure of quality of macroeconomic policies
Percent IMF World Economic Outlook
Secondary enrollment Total enrolment in secondary level of education regardless of age expressed as a percentage of the population in the official age group corresponding to this level of education
Percent World Bank World Development Indicators
2000 per capita GDP Per capita GDP in constant US dollar for the year 2000 Constant 2000 US dollars IMF World Economic Outlook
Capital account openness De jure capital account openness index as the simple average of four dummy variables representing exchange rate arrangements payments restrictions on current and capital transactions and
t i ti i t f t di A l f
Index Chinn-Ito forthcoming
Trade openness Sum of exports and imports of goods and non-factor services over GDP
Percent of GDP IMF World Economic Outlook
British legal origin Dummy variable that takes the value 1 for former British colonies and 0 otherwise
0 1 La Porta et al (1999)
Ethno linguistic fragmentation
Average value of five different indices of ethno linguistic fractionalization
Index La Porta et al (1999)
Latitude Measure of the closeness to the equator Miles La Porta et al (1999)
Appendix II Variables Definitions and Sources
31
Overvaluation Residual of a simple panel regression between the nominal exchange rate (local currency per US dollar) Vs the PPP valuation of the exchange rate The regression includes 182 countries The overvaluation measure in normalized to be 1 for the world
Deviation from equilibrium between PPP and market rate with 1 defined as the norm
IMF African Department database
GDP in dollars GDP in dollars (Converted at the nominal market exchange rate) Billions of US$ IMF World Economic Outlook
Per capita GDP in dollars Per capita GDP (constant 2000 US dollar) Constant 2000 US dollars IMF World Economic Outlook
Inflation Headline consumer price index (Average annual percent change) Percent IMF World Economic Outlook
Government balance General government balance excluding grants Percent of GDP IMF World Economic OutlookCredit Total credit to the private sector in percent of GDP Percent of GDP IMF International Financial StatisticsCurrent account Current account balance excluding grants Percent of GDP IMF African Department databaseREER Real effective exchange rate weighted index using total trade
(exports and imports composition for 1999 to 2001) and consumer price indices
Percent IMF Information Notice System
NEER Nominal effective exchange rate weighted index using total trade (exports and imports composition for 1999 to 2001)
IMF Information Notice System
US Tbill rate United States Treasury bill rate Percent IMF International Financial StatisticsTerms of trade Terms of trade (Exports prices to import prices goods and services) Percent IMF World Economic Outlook
Rest of the world real GDP Rest of the world real GDP growth (Weighted by country exports) Percent IMF World Economic Outlook
Oil prices Price of oil Simple average of Texas Dubai and Brent prices deflated by the manufacturing unit cost index
Percent IMF World Economic Outlook
Domestic savings Total domestic savings Percent of GDP IMF World Economic OutlookInvestment Total private investment Percent of GDP IMF World Economic Outlook
Reserves Stock of international reserves (US dollar billions) Billions of US$ IMF World Economic Outlook
Non-fuel commodity prices Real non-fuel commodity price (Weighted by country specific exports deflated by the manufacturing unit price)
Percent IMF World Economic Outlook
Population Population Millions IMF World Economic OutlookContract enforcement Efficiency of contract enforcement by following the evolution of a
sale of goods dispute and tracking the time cost and number of procedures involved from the moment the plaintiff files the lawsuit until actual payment
Number of procedures httpwwwdoingbusinessorg
Constraint on the executive Index that ranks from 1 (unlimited authority to the executive) to 7 (Executive parity or subordination) as decribed in the Freedom House Index
1 to 7 httpwwwfreedomhoseorg and Polity IV Databse at wwwsystemicpeaceorg politypolity4htm
ICRG ranking International Country Risk Guide rank for each country is based on three components of risk analysis Political financial and economic components The higher the rating the lower the risk for that particular country The index covers 140 countries
0 to 100 wwwprsgroupcom
Appendix II Variables Definitions and Sources (Contd)
32
Appendix III Determinants of Capital Flows Descriptive Statistics and Correlations
Total inflows FDI inflows Portf amp debt Share of FDI Total inflows FDI inflows Portf amp debt Total inflows FDI inflows Portf amp debt
Financial Institutions 031 033 026 008 002 -005 019 -012 -011 -006004 003 009 062 088 074 022 044 050 070
Rule of Law -021 -029 -015 003 013 005 027 -007 -009 000018 006 034 083 042 077 007 065 058 099
Market size 087 093 074 000 005 -003 021 -006 -004 -005000 000 000 099 077 084 019 069 079 074
Oil exporter 010 043 -004 045 019 027 -005 034 054 -019052 000 078 000 023 008 075 003 000 022
Real GDP growth 012 039 000 034 028 041 -010 055 070 -005043 001 099 003 007 001 052 000 000 077
Secondary enrollment 036 019 039 003 060 044 081 009 011 000002 023 001 083 000 000 000 057 050 099
Log 2000 GDP per capita 027 020 026 027 063 052 070 011 026 -020008 019 009 008 000 000 000 049 009 020
Capital account openness -007 -005 -007 -004 012 006 022 007 001 011066 073 068 079 046 072 016 066 094 049
Trade openness -017 -017 -015 011 014 015 008 013 017 -003027 027 034 050 036 033 059 042 027 086
UKleg 027 028 023 016 -010 -011 -005 -010 -004 -011008 007 014 031 052 048 076 053 078 047
Ethling 015 021 011 012 006 004 009 -005 001 -010033 018 048 044 069 080 055 077 094 053
LAT -011 -012 -009 039 -004 -006 002 -015 -005 -020050 046 057 001 080 068 088 032 073 020
Pop_dens 000 -003 002 -047 -004 -005 -002 004 -023 037099 085 093 000 080 075 089 081 018 003
Note pairwise correlation coefficient reported in first row significance level reported in second row Source Authors calculations
Appendix Table III2 Bivariate Correlations of Capital Flows with Independent Variables
(US$ mn) (per capita) (in percent of GDP)
1 Dependent variables Observations Minimum Maximum Mean MedianStandard Deviation
Total inflows 43 63 162106 8265 2339 25410FDI inflows 43 00 42371 3598 909 8027Portfolio and debt inflows 43 00 130724 4666 1021 19786Total inflows per capita 43 35 16250 1291 255 3078FDI inflows per capita 43 00 11653 826 105 2325Portfolio and debt inflows pc 43 00 5906 465 147 1038Total inflows to GDP 43 11 307 81 62 65FDI inflows to GDP 43 00 290 42 24 53Portfolio and debt inflows to GDP 43 00 187 39 32 36
2 Explanatory variablesFinancial institutions 43 00 40 18 10 16Rule of law 43 -18 08 -07 -07 06Market size 43 00 10 00 00 02Oil exporter 43 00 10 02 00 04Real GDP growth 43 -04 201 48 42 36Secondary enrollment 42 82 1079 342 283 226Log of 2000 GDP per capita 43 45 90 61 58 11Capital account openness 43 -16 25 -05 -11 13Trade openness 43 369 1559 818 789 3043 Alternative measures of institutions and instrumentsCPIA 42 18 43 32 32 06Doing Business Index 43 303 1760 1321 1487 410ICRG ranking 28 483 808 614 605 73Legal rights 43 10 80 40 35 16Property rights 41 14 45 30 30 06Constraint on the executive 40 17 70 41 43 16British legal origin 43 00 10 03 00 05Ethnolinguistic fragmentation 42 00 10 06 07 03Population density in 1500 36 01 250 38 20 55Latitude 43 00 07 01 01 01Source Authors calculations
Appendix Table III1 Descriptive Statistics for Regression Variables
33
Fin Instit Rule of Law Market size Oil exporter Real GDP growth Second Enr Log 2000 GDP pc Capital open Trade openTotal inflows
Financial Institutions 100
Rule of Law 042 100000
Market size 032 -023 100004 015
Oil exporter -022 -034 020 100016 002 019
Real GDP growth 008 001 012 047 100060 095 044 000
Secondary enrollment 040 049 027 -008 -012 100001 000 008 063 044
Log 2000 GDP per capita 034 039 018 024 000 083 100002 001 025 012 098 000
Capital account openness 034 019 -006 -020 -005 031 020 100003 021 071 021 074 005 030
Trade openness -015 -008 -022 003 -010 008 010 -001 100035 061 017 085 054 061 060 096
Note Pairwise correlation coefficients reported in first row significance level reported below Source Authors calculations
Appendix Table III3 Bivariate Correlations of Baseline Regression Variables
Financial inst CPIA indexDoing
Business ICRG ranking Legal rightsRule of
law Property rightsConstraint on the executive
British legal origen
Ethnoling fragmentation Latitude
Population density
Financial institutions 100
4300
CPIA index 063 100000
4200 4200
Doing Business index -060 -044 100000 000
4300 4200 4300
ICRG ranking 029 040 -069 100013 003 000
2800 2800 2800 2800
Legal rights 061 046 -061 020 100000 000 000 030
4300 4200 4300 2800 4300
Rule of Law 042 063 -069 082 034 100000 000 000 000 003
4300 4200 4300 2800 4300 4300
Property rights 057 081 -064 070 046 081 100000 000 000 000 000 000
4100 4100 4100 2700 4100 4100 4100
Constraint on the executive 044 041 -051 016 042 049 055 100000 001 000 043 001 000 000
4000 3900 4000 2800 4000 4000 3800 4000
British legal origin 059 040 -055 031 069 021 036 028 100000 001 000 011 000 018 002 008
4300 4200 4300 2800 4300 4300 4100 4000 4300
Ethnolinguistic fragmentation 017 -015 005 -032 014 -029 -018 002 011 100027 036 074 010 038 006 028 093 050
4200 4100 4200 2800 4200 4200 4000 3900 4200 4200
Latitude 009 016 -028 037 013 030 029 019 011 001 100058 032 007 006 041 005 007 025 049 094
4300 4200 4300 2800 4300 4300 4100 4000 4300 4200 4300
Population density -014 -002 021 -025 -045 -023 -011 -018 -018 -043 -037 100042 090 022 022 001 017 052 031 028 001 003
3600 3600 3600 2500 3600 3600 3600 3500 3600 3500 3600 3600Note Pairwise correlation coefficients reported in first row significance level reported in the second row and number of observation in the third row Source Authors calculations
Appendix Table III4 Bivariate Correlations of Measures of Institutions and Instruments
34
Appendix IV Private Capital Flows and Growth
Variable Number of
observations MeanStandard deviation Min Max
Real GDP growth 43 48 36 -04 201Initial per capita GDP 43 61 11 45 90Net total flowsGDP 43 37 74 -109 271Net total flows per capita 43 547 2782 -5006 12323Total inflowsGDP 43 77 57 10 282Total inflows per capita 43 1311 3139 35 16450Overvaluation 43 11 03 07 17Domestic savings 42 122 200 -247 813Investment 42 216 87 87 469Contract enforcement 43 1014 66 826 1133Source Authors calculations
Appendix Table IV1 Private Capital Flows and Growth Summary Statistics for Multivariate Regression
Rea
l GD
P gr
owth
Initi
al p
er
capi
ta G
DP
Net
flow
sG
DP
Net
flow
s pe
r ca
pita
Inflo
ws
GD
P
Inflo
ws
per
capi
ta
Ove
rval
uatio
n
Dom
estic
sa
ving
s
Inve
stm
ent
Con
tract
en
forc
emen
t
Real GDP growth 100
Initial per capita GDP 000 100
NetflowsGDP 038 -013 100
Netflows per capita 037 028 067 100
InflowsGDP 049 016 076 066 100
Inflows per capita 028 063 042 087 061 100
Overvaluation -032 -021 -011 -003 -024 -016 100
Domestic savings 048 058 013 029 028 048 -036 100
Investment 045 045 014 039 045 051 -026 042 100
Contract enforcement 018 -007 -024 -018 -017 -013 -015 010 -012 100Note indicates significant at 10 percentSource Authors calculations
Appendix Table IV2 Private Capital Flows and Growth Pairwise Correlations for Multivariate Regression
35
References
Acemoglu D and S Johnson 2005 ldquoUnbundling Institutionsrdquo Journal of Political
Economy Vol 113 No 5 pp 949995 Acemoglu D Johnson S and D Robinson 2002 ldquoReversal of Fortune Geography and
Institutions in the Making of the Making of the Modern World Income Distributionrdquo Quarterly Journal of Economics pp 12311294
Albuquerque R 2003 ldquoThe Composition of International Capital Flows Risk Sharing
Through Foreign Direct Investmentrdquo Journal of International Economics Vol 61 pp 353ndash383
Alfaro L and A Charlton 2007 ldquoInternational Financial Integration and Entrepreneurial
Firm Activityrdquo NBER Working Paper No 13118 (Cambridge Massachusetts National Bureau of Economic Research)
mdashmdashmdash S Kalemli-Ozcan and V Volosovych 2005a ldquoCapital Flows in a Globalized
World The Role of Policies and InstitutionsrdquoNBER Working Paper No 11696 (Cambridge Massachusetts National Bureau of Economic Research)
mdashmdashmdash 2005b ldquoWhy Doesnrsquot Capital Flow from Rich to Poor Countries An Empirical
Investigationrdquo NBER Working Paper Series No 11901 (Cambridge Massachusetts National Bureau of Economic Research)
Auty R M ed 2001 Resource abundance and Economic Development Improving the
Performance of Resource-Rich Countries (Oxford Oxford University Press) mdashmdashmdash and A Gelb 2001 ldquoPolitical Economy of Resource-Abundant Statesrdquo in Resource
abundance and Economic Development Improving the Performance of Resource-Rich Countries ed by R M Auty (Oxford Oxford University Press)
Becker T O Jeanne P Mauro J D Ostry and R Ranciegravere 2007 Country InsurancemdashThe Role of Domestic Policies IMF Occasional Paper No
254 (Washington International Monetary Fund) Bekaert G Campbell R H and C Lundblad 2005 ldquoDoes Financial Liberalization Spur
Growthrdquo Journal of Financial Economics Vol 77 (July) Chinn MD and H Ito 2007 ldquoA New Measure of Financial Opennessrdquo Available via the
Internet at wwwsscwiscedu7Emchinnresearchhtml
36
Chinn MD and H Ito 2006 ldquoWhat Matters for Financial Development Capital Controls Institutions and Interactionsrdquo Journal of Development Economics Vol 81 (October) pp 163ndash92
Chinn MD Ito H 2002 ldquoCapital Account Liberalization Institutions and Financial
Development Cross-Country Evidencerdquo NBER Working Paper Series No 8967 (Cambridge Massachusetts National Bureau of Economic Research)
DellAriccia G Di Giovanni J Faria A Kose M A Mauro P Schindler M Terrones M and J D Ostry 2008 ldquoReaping the Benefits of Financial Globalizationrdquo IMF Occasional Paper No 264 (Washington International Monetary Fund)
Dorsey T E Tadesse H Singh S and Z Brixiova 2008 ldquoThe Landscape of Capital
Flows to Low-Income Countriesrdquo IMF Working Paper 0851 (Washington International Monetary Fund)
Edison H Klein M W Ricci L A and T Slok 2004 ldquoCapital Account Liberalization
and Economic Performance Survey and Synthesisrdquo IMF Staff Papers Vol 51 No 2 pp 220256
Faria A and P Mauro 2004 ldquoInstitutions and the External Capital Structure of Countriesrdquo
IMF Working Paper 04236 (Washington International Monetary Fund) mdashmdashmdash Minnoni M and AZaklan 2006 ldquoThe External Financing of Emerging Market
Countries Evidence from Two Waves of Financial Globalizationrdquo IMF Working Paper 06205 (Washington International Monetary Fund)
Glaeser E L and A Shleifer 2002 ldquoLegal Originsrdquo Quarterly Journal of Economics
Vol117 pp 1193ndash1229 Gourinchas P-O and O Jeanne 2007 ldquoCapital Flows to Developing Countries The
Allocation Puzzlerdquo NBER Working Paper No 13602 (Cambridge Massachusetts National Bureau of Economic Research)
International Monetary Fund 2007 Global Financial Stability Report (Washington
October) mdashmdashmdash 2008 Regional Economic Outlook Sub-Saharan Africa (Washington September) Ju J and S-J Wei 2007 ldquoDomestic Institutions and the Bypass Effect of Financial
Globalizationrdquo NBER Working Paper No 13148 (Cambridge Massachusetts National Bureau of Economic Research)
37
mdashmdashmdash 2006 ldquoA Solution to Two Paradoxes of International Capital Flowsrdquo NBER Working Paper No 12668 (Cambridge Massachusetts National Bureau of
Economic Research) Karl T L 1997 The Paradox of Plenty Oil Booms and Petro-States (Berkeley University
of California Press) Kaufmann D Kray A and M Mastruzzi 2008 ldquoGovernance Matters VII Aggregate and
Individual Governance Indicators 1996-2007rdquo Policy Research Working Paper No 4654 (Washington DC World Bank Group)
Klein MW 2005 ldquoCapital Account Liberalization Institutional Quality and Economic
Growth Theory and Evidencerdquo NBER Working Paper No 11112 (Cambridge Massachusetts National Bureau of Economic Research)
Kose M A Prasad E Wei S-J and K Rogoff 2006 ldquoFinancial Globalization A
Reappraisalrdquo IMF Working Paper 06189 (Washington DC International Monetary Fund)
Lane P R 2004 ldquoEmpirical Perspectives on Long-Term External Debtrdquo Topics in Macroeconomics Vol 4 No 1 httpwwwbepresscombejmtopicsvol4iss1art1 La Porta R F Lopez-de-Silanes A Shleifer and R W Vishny 1999 ldquoThe Quality of
Governmentrdquo Journal of Law Economics and Organization Vol 15 pp 222ndash79 Lukonga forthcoming ldquoFinancial Market Development Survey of Sub-Saharan African
Countriesrdquo mimeo Mauro P Minnoni M and AZaklan 2006 ldquoThe External Financing of Emerging Market
Countries Evidence from Two Waves of Financial Globalizationrdquo IMF Working Paper 06205 (Washington International Monetary Fund)
Miniane J 2004 ldquoA New Set of Measures on Capital Account Restrictionsrdquo IMF Staff Papers Vol 51 No 2 pp 276ndash308 Mishkin F S 2006 The Next Great Globalization How Disadvantaged Nations can
Harness their Financial Systems to Get Rich (Princeton NJ Princeton University Press)
Obstfeld M and A M Taylor 2004 Global Capital Markets Integration Crisis and Growth Cambridge University Press (2004) Portes R and H Rey 2005 ldquoThe Determinants of Cross-Border Equity Flowsrdquo Journal of
International Economics Vol 64 pp269-296 Prasad Eswar S Raghuram G Rajan and Arvind Subramanian 2007 ldquoForeign Capital and Economic Growthrdquo Brookings Papers on Economic Activity 1 Brookings
38
Quinn D P 1997 ldquoThe Correlates of Change in International Financial Regulationrdquo
American Political Science Review Vol 91 (September) pp 531ndash51 mdashmdashmdash and A Maria Toyoda forthcoming ldquoDoes Capital Account Liberalization Lead to
Economic Growthrdquo Review of Financial Studies Rodrick D 2007 ldquoThe Real Exchange Rate and Economic Growth Theory and Evidencerdquo
Harvard University Working Paper httpksghomeharvardedu~drodrikRER20and20growthpdf
mdashmdashmdash and A Subramanian 2008 ldquoWhy did Financial Globalization Disappointrdquo IMF
Staff Papers Vol 56 No 1 (Washington International Monetary Fund) Schindler M 2009 ldquoMeasuring Financial Integration A New Datasetrdquo IMF Staff Papers
Vol 56 No 1 (Washington International Monetary Fund) Schularick M 2006 ldquoA Tale of Two Globalizations Capital Flows from Rich to Poor in
Two Eras of Global Financerdquo International Journal of Finance and Economics Vol11 pp339-354
Schularick M Steger T 2008 ldquoThe Lucas Paradox and the Quality of Institutions Then
and Nowrdquo Berlin University Working Paper N20083 Stone M R Shimizu S Nordstrom A and H J Ferhani 2008 ldquoDeveloping Essential
Financial Markets in Smaller Economies Stylized Facts and Policy Optionsrdquo IMF Occasional Paper No 265 (Washington International Monetary Fund)
World Bank 2007 Global Development Finance The Globalization of Corporate Finance in Developing Countries (Washington World Bank Group)

2
copy 2009 International Monetary Fund WP09114 IMF Working Paper African Department
Sub-Saharan Africarsquos Integration in the Global Financial Markets
Prepared by Corinne Deleacutechat Gustavo Ramirez Smita Wagh and John Wakeman-Linn
May 2009
Abstract
This Working Paper should not be reported as representing the views of the IMF The views expressed in this Working Paper are those of the author(s) and do not necessarily represent those of the IMF or IMF policy Working Papers describe research in progress by the author(s) and are published to elicit comments and to further debate
The paper uses a unique database covering 44 countries in sub-Saharan Africa (SSA) countries between 2000 and 2007 to study the determinants of the allocation and composition of flows across countries as well as channels through which private capital flows could affect growth In our sample the degree of financial market development is an important determinant of the distribution of capital flows across countries as opposed to property rights institutions The fairly consistent positive association between net capital flows and growth for SSA countries contrasts with the more pessimistic results of recent studies though our data do not allow us to make conclusive inferences about a causality relationship JEL Classification Numbers F21 F36 F43 O16 O43 O55 Key words International capital movements financial integration economic growth institutions and growth Africa Authorsrsquo E-Mail cdelechatimforg gramirezimforg swaghworldbankorg jwakemanlinnimforg
3
Contents Page
I Introduction 4
II Recent trends in financial globalization in SSA6
III Determinants of Private Capital Flows to SSA9 A Recent Literature12 B Estimation strategy and Model13 C Empirical Analysis 14
IV Do private capital flows have an impact on growth in SSA20 A Correlation Analysis 22 B Testing channels of transmission of private capital flows on growth 23 C How do Private Capital Flows Affect Growth 25
V Conclusion 27 Tables 1 Private Capital Flows Volatility8 2 Capital Market Development in Sub-Saharan Africa 10 3 Baseline OLS Estimation Results 18 4 Instrumental Variables Estimation Results19 5 Correlations Net Capital Flows and Real Growth 23 6 Channels of Transmission Between Capital Flows and Growth 24 7 Estimation Results Linear Growth Model with Capital Flows26 Figures 1 Private Capital Inflows to Sub-Saharan Africa 2000-07 5 2 Global Liquidity6 3 Domestic 7 4 Recipients of Private Capital Flows8 5 Top Ten Recipients of Private Capital8 6 External Vulnerability9 7 Sub-Saharan Africa Capital Flows and Real GDP Growth 22 Appendices I Capital Flows Data28 II Variables Definitions and Sources30 III Determinants of Capital Flows Descriptive Statistics and Correlations32 IV Private Capital Flows and Growth34 References35
4
I INTRODUCTION
For decades Africa has been heavily dependent on official development assistance (ODA) to finance persistent balance of payments deficits With low incomes and generally weak economic policies most countries in sub-Saharan Africa (SSA) were unattractive to private investors and thus received little private capital except for foreign direct investment (FDI) in sectors focused on natural resource extraction This has changed in the last decade Abundant global liquidity combined with improved economic policies and prospects in many SSA countries led to a surge in private capital flows with sharp increases in all forms of private capital inflowsmdashFDI portfolio investment and private debt flowsmdashto SSA (Figure 1) As a result in 2007 for the first time ever private capital inflows increased almost six-fold since 2000 to reach an estimated US$84 billion double the amount of ODA to SSA The onset of the financial crisis radically changed the picture with a drying up and in some cases such as South Africa a large reversal of capital flows These developments raise important questions and policy challenges for SSA countries How dependable are these capital flows Have they contributed or are they likely to contribute to improved economic growth prospects How can governments enhance prospects for continued capital inflows particularly in the face of the recent global financial crisis which have seen a sharp decline in global liquidity and a reduced global appetite for risk To begin to answer these questions one must first understand better the factors driving the recent surge in private capital flows to SSA That is the objective of the paper to identify factors behind the composition and distribution of recent private capital flows to sub-Saharan Africa and to begin investigating their possible contribution to growth Building on the observation that the distribution and composition of capital inflows varies substantially across SSA countries we analyze the impact of key country characteristics in attracting different amounts and types of private capital Other studies have highlighted the importance of slow-moving determinants such as the level of economic development or growth performance de jure capital account openness and the quality of institutions These country characteristics are also going to have both a direct and indirect impact on growth in recipient countries along with private capital flows making it difficult to identify the direction of causality To complicate matters further the empirical literature is ambiguous as to whether capital flows have a positive impact on economic growth To partly address these issues we use an instrumental variables approach to study the determinants of private capital flows On the growth impact following Rodrik and Subramanian (2009) we use a two-step approach to investigate possible channels of transmission through which capital flows could influence growth in order to have even a second-order impact on growth capital flows should as a necessary condition at least have a first-order impact on variables known to influence growth
5
Figure 1 Private Capital Inflows to Sub-Saharan Africa 2000-07
Source African Department Database and IMF staff calculations
Fig 1a Private Capital Inflows(Billions of US Dollars)
0
10
20
30
40
50
60
70
80
90
2000 2001 2002 2003 2004 2005 2006 2007
LoansPortfolio FDI
Fig 1b Private Capital Inflows(percent of total flows)
0
20
40
60
80
100
2000 2001 2002 2003 2004 2005 2006 2007
On the determinants side we find that capital market development rather than basic property rights institutions is more closely associated with higher private capital inflows This may be a reflection of the increasing importance of portfolio and debt flows relative to FDI that has been observed in the recent period in SSA Looking at the growth impact we find strong positive correlations between private capital inflows and real GDP growth in the recipient countries However in part because of the limited time-period of our sample we are unable to prove a causal relationship whereby inflows increase growth The paper is related to recent research on determinants of capital flows and on the growth impact of capital flows As documented below both strands of the literature are quite well-populated but to our knowledge this study is the first to analyze these issues for the whole of sub-Saharan Africa in the context of the recent surge in global private capital flows It exploits a unique data set for 44 sub-Saharan African countries1 including annual data on private capital inflows (broken down by FDI portfolio and private debt) between 2000 and 2007 Appendix I provides further details about the capital flows database and how it compares to similar published datasets and Appendix II presents the definitions and sources of other variables used in the empirical analysis The paper is organized as follows Section II looks into recent trends in private capital flows to SSA Section III discusses the determinants of private capital flows and section IV investigates the association between these capital flows and growth Section V concludes
1 For the analysis we also had to exclude Zimbabwe due to sketchy and unreliable data over the sample period
6
II RECENT TRENDS IN FINANCIAL GLOBALIZATION IN SSA
In the period of the recently-ended boom in global financial markets inflows of private capital became the most important source of external finance for sub-Saharan Africa The increase in private capital flows to the region was in line with that in other regions and all low-income countries (Dorsey et al 2008 World Bank 2007) On average in the period between 2001 and 2007 total gross inflows to the region increased by 32 percent annuallymdashthe rate accelerating to 44 percent after 2005 Private capital flows to SSA have risen almost 6-fold since 2000 from about $15 billion to about $84 billion in 2007 (the latest year for which data is available) Recorded private capital outflows are on the whole much smaller than inflows so that in 2007 net capital flows to sub-Saharan Africa amounted to about US$76 billion As of 2007 private capital flows represented 10 percent of the regionrsquos GDP about twice the volume of official development assistance (about US$40 billion) A confluence of factors was responsible for the surge in private capital A significantly improved macroeconomic performance across much of the continent (Figure 2) and for some countries the implementation of the Multilateral Debt Relief Initiative (MDRI) coincided with increases in global liquidity and higher oil and commodity prices (Figure 3)
Figure 2 Global Liquidity ldquoPushrdquo Factors
Source African Department Database and IMF staff calculations
Fig 2a World Real GDP Growth ( Percent)
0
1
2
3
4
5
6
2000 2001 2002 2003 2004 2005 2006 2007
Fig 2b Oil And Commodity Prices (percent change)
-50
-40
-30
-20
-10
0
10
20
30
40
50
60
2000 2001 2002 2003 2004 2005 2006 2007
Non-fuel commodity prices
Oil prices
7
Figure 3 Domestic ldquoPullrdquo Factors
Source African Department Database and IMF staff calculations
Fig 3a Sub-Saharan Africa Real GDP Growth and Per Capita GDP
0
1
2
3
4
5
6
2000 2001 2002 2003 2004 2005 2006 20070
200
400
600
800
1000
1200
1400
1600
1800
2000(Percent) (US dollars)
Real GDPgrowth
(left scale)
Per capita GDP(right scale)
Fig 3bSub-Saharan Africa Inflation and Central Government Balance
0
5
10
15
20
25
30
2000 2001 2002 2003 2004 2005 2006 2007-10
-9
-8
-7
-6
-5
-4
-3
-2
-1
0
Note Excluding Zimbabwe
(Annual averagepercent)
(Percent ofGDP)
Inflation(left scale) Government balance
(right scale excludes grants)
These inflows represent a potential source of vulnerability as countries become increasingly dependent on potentially volatile private capital flows While the overall volatility of capital flows fell in the latter years in the sample the volatility of FDI has actually increased (Table 1)2 In addition for low income SSA countries in particular there has been a strong correlation between capital inflows and current account balances with inflows increasing as the current account improves and decreasing as the current account deteriorates magnifying the resulting swings in the overall balance of payments (Figure 6) On the other hand the surge in private capital inflows has contributed to a steady increase in international reserves of SSA countries providing these countries with increased scope to finance balance of payments deficits
MeanStandard Deviation Volatility Mean
Standard Deviation Volatility
Total inf low 198 45 44 522 243 21FDI 124 50 25 186 42 45Portfolio 13 07 19 177 131 14Private deb 61 05 132 158 88 18Source IMF African Department database 2008
Table 1 Private Capital Flows Volatility2000-03 2004-07
2 An important factor in the increase in FDI volatility seems to be a fairly large movement in FDI in South Africa in 2005-2006
8
Figure 4 Recipients of Private Capital Flows
Fig 4c Share of Portfolio and Debt Flows 2000-03(percent of total)
South Africa 231
Kenya 74
Ethiopia 68
Ghana 68Congo Dem Rep of 63
Other SSA 496
Fig 4d Share of Portfolio and Debt Flows 2004-07(percent of total)
South Africa 728
Nigeria 56
Ghana 22
Angola 20
Kenya 17
Other SSA 157
Fig 4a Share of FDI Inflows 2000-03
South Africa 273
Nigeria 168
Angola 165
Equatorial Guinea 58
Chad 50
Other SSA 285
Fig 4b Share of FDI Inflows 2004-07
Nigeria 343
South Africa 155Equatorial Guinea
102
Tanzania 32
Congo Republic of 29
Other SSA 338
Figure 5 Top Ten Recipients of Private Capital
F ig 5 a T o t a l In f l o w s( m i l l io n s o f U S d o l la rs )
A n g o la
K e n ya
C h a d
T a n z a n ia
S o u th A f r ic a
N ig e r ia
E q u a t o r ia l G u in e a
G h a n a
C o n g o D e m R e p o f
E t h io p ia
0 5 0 0 0 1 0 0 0 0 1 5 0 0 0 2 0 0 0 0
F i g 5 b I n fl o w s t o G D P( p e r c e n t)
C h a d
S e yc h e l le s
C o n g o R e p u b l ic o f
S atilde o T o m eacute amp P r iacute n c i p e
A n g o l a
E q u a t o r ia l G u in e a
G a m b ia T h e
C a p e V e rd e
C o n g o D e m R e p o f
G u in e a - B i s s a u
0 5 1 0 1 5 2 0 2 5 3 0 3 5
F ig 5 c In f lo w s to P o p u la ti o n( r a ti o )
A n g o la
G a b o nC o n g o
R e p u b l ic o fC a p e V e r d e
N a m ib ia
B o t s w a n a
S o u t h A fr i c a
M a u r i t i u sE q u a t o r i a l
G u in e aS e yc h e l le s
0 5 0 0 1 0 0 0 1 5 0 0 2 0 0 0
Note All rankings based on averages for 2000-07 Source African Department data base and IMF staff calculations
9
Figure 6 External Vulnerability
Fig 6a Low-income African Countries Current Account Balance and Capital Inflows 2000-07
0
100
200
300
400
500
600
700
800
900
2000 2001 2002 2003 2004 2005 2006 2007-14
-12
-10
-8
-6
-4
-2
0
Capital Flowsleft axis
Current Account Balanceright axis
Fig 6b Oil Producers Current Account Balance and Capital Inflows 2000-07
0
500
1000
1500
2000
2500
2000 2001 2002 2003 2004 2005 2006 2007-20
-15
-10
-5
0
5
10
Capital Flowsleft axis
Current Account Balanceright axis
Fig 6c Low Income Africa Countries International Reserves and Capital Flows
0
100
200
300
400
500
600
700
800
900
2000 2001 2002 2003 2004 2005 2006 200700
02
04
06
08
10
12
14
16
Reservesright axis
Capital flowsleft axis
Fig 6d Oil Producers International Reserves and Capital Flows
0
500
1000
1500
2000
2500
2000 2001 2002 2003 2004 2005 2006 20070
2
4
6
8
10
12
Capital Flowsleft axis
Reservesright axis
III DETERMINANTS OF PRIVATE CAPITAL FLOWS TO SSA
This section investigates the determinants of private capital flows to sub-Saharan Africa during 2000-2007 with particular focus on the role of domestic capital market development Capital flows to sub-Saharan Africa particularly portfolio flows have been concentrated in a relatively small number of countries with relatively sophisticated financial markets In these countries capital has flown into equities where the stock market was sufficiently developed (eg Kenya Nigeria) government bonds in countries that had sovereign issues (Botswana Ghana) and short-term government securities (Uganda Tanzania and Zambia) when few other investment vehicles open to non-residents were available The availability of investment instruments appears to have dominated the existence of capital controls For example in Tanzania legal loopholes allowed international investors to purchase significant amounts of government securities although in principle foreigners were not allowed to hold government debt (IMF 2008)3
3 Nevertheless targeted capital controls as in Ghana appear to have been successful in developing the longer end of the market for government debt
10
We use a new indicator of capital market development in sub-Saharan Africa that captures the structure of capital markets Capital markets along with money foreign exchange and derivatives markets form part of a countryrsquos ldquoessential financial marketsrdquo (Stone et al 2008 Lukonga forthcoming) In particular we consider government securities markets both for treasury bills and treasury bonds as well as corporate bond markets and equities markets (see Lukonga forthcoming) We construct a simple index which is the sum of four dummy variables taking the value of 1 if the market in question exists and is well-developed The index covers all sub-Saharan African countries except Somalia Using this index simple tabulations show that the average level of financial market development is fairly low in sub-Saharan Africa with only 10 countries or 21 percent of the sample countries having complete capital markets (Table 2)4 However as discussed earlier these countries are also among the largest recipients of private capital inflows in sub-Saharan Africa along with a few oil exporters (Angola Congo Chad and Equatorial Guinea) While the role of institutional development in attracting international capital flows has been emphasized in recent studies very few have attempted to isolate the role of financial versus basic property rights institutions The measures of financial market development used in the literature and that would be available for low-income countries such as ratios of money and credit to GDP have their limitations They measure outcomes such as the ability of the financial (mostly banking) sector to provide transaction services (in the case of the ratios of money or broad money to GDP) or the capacity of the banking system to channel savings rather than the extent of financial market development as measured by the availability of investment instruments Our empirical results detailed below indicate that along with other factors such as market size (particularly for portfolio inflows) and oil exporting status (particularly for FDI flows) the index of capital market development is a significant and robust determinant of international capital flows to sub-Saharan African countries
4 The countries are Botswana Ghana Kenya Namibia Nigeria South Africa Swaziland Tanzania Uganda and Zambia
11
Capital Markets
T-Bills T-BondsCorporate
Bonds Equities
Botswana X X X XGhana X X X XKenya X X X XNamibia X X X XNigeria X X X XSouth Africa X X X XSwaziland X X X XTanzania X X X XUganda X X X XZambia X X X XBenin X X X Burkina Faso X X X NCape Verde X X N XMauritius X X XMozambique X X X Zimbabwe X X XAngola X X N NCocircte dIvoire N X N XGambia The X X N NSenegal X X N Seychelles X X N NCameroon N N XCongo Dem Rep of X N N NEthiopia X N N NGuinea X N N NGuinea-Bissau X N N NLesotho X N N NMadagascar X N N NMalawi X N N Rwanda X N N NSierra Leone X N NTogo X N Burundi N N NCentral African Republic NChad N N N NComoros N N N NCongo Republic of N N N NEquatorial Guinea N N N NEritrea N N NGabon N N N NLiberia N N N NMali N N NNiger N Satildeo Tomeacute and Priacutencipe N N N N
Sources Lukonga (forthcoming) and authors calculationsNotes X denotes that the market is fairly or very well developed denotes that the market nominally exists or is partially developedN denotes that the market does not exist
Table 2 Capital Market Development in Sub-Saharan Africa
12
A Recent Literature
The starting point of much of the recent literature on determinants of capital flows has been an attempt to explain the Lucas Paradox or why private capital doesnrsquot seem to flow from rich to poor countries Standard neoclassical theory predicts that capital should flow from capital-rich countries (with low marginal productivity of capital) to capital-scarce countries (with a high marginal product of capital) In practice however the bulk of observed flows particularly in the modern period consists of flows among developed economies Compared to the early 20th century era of financial globalization the current wave of capital flows is characterized by massive diversification of flows between high-income economies and a relative marginalization of less-developed economies (Obstfeld and Taylor 2004 Schularick 2006 and Schularick and Steger 2008) Some authors posit that the paradox is due to country-specific fundamentals that tend to lower the marginal product of capital in developing countries such as missing factors of production including human capital poor economic policies and poor institutions (Alfaro Kalemli-Ozcan and Volosovych 2005a and 2005b Faria et al 2006 Faria and Mauro 2004 Schularick and Steger 2008) In this vein a recent study shows that the extent of domestic financial market development and the quality of domestic financial institutions has played a significant role in attracting capital flows to emerging markets (IMF 2007) The second set of explanations centers around international capital market imperfections such as asymmetric information sovereign risk and capital controls For example Portes and Rey (2005) find that informational frictions proxied by geographic distance affect the amount and direction of capital flows and Lane (2004) also finds that credit market frictions are a determinant of debt flows in 1970-1995 The studies that focus on the role of institutions in attracting foreign private capital highlight the importance of basic institutions particularly property rights protection Weak property rights owing to poor quality institutions affect entrepreneursrsquo investment decisions Risks of expropriation armed conflict and malfunctioning legal systems all have a potentially negative impact on the returns from those investments Empirically property rights institutions have been proxied by an index derived from the Kaufman Kray and Mastruzzi World Governance IndicatorsWGIs or by an index derived from the ICRG indicators 5 Using those proxies better quality institutions are found to be positively and significantly correlated with foreign equity flows (Alfaro et al 2005a 2005b) and with a higher share of equity in a countryrsquos total stock of external liabilities (Faria and Mauro 2004 and Faria et al 2006) 5 The ICRG composite index aggregates over several dimensions such as government stability investment profile internal and external conflict non-corruption law and order protection from religious and ethnic tensions non-militarized politics democratic accountability and quality of bureaucracy (wwwprsgroupcom) Similarly the WGIs measure countriesrsquo score according to 6 governance dimensions namely voice and accountability political instability government effectiveness regulatory burden rule of law and control of corruption (wwwworldbankorgwbigovernancegovdata)
13
As mentioned earlier few studies focus on the role played by the extent of domestic financial market development in attracting international capital flows While the literature tends to link capital flows (financial globalization) to improvements in domestic financial systems (eg Chinn and Ito 2005 2002 Mishkin 2006) in principle the direction of causality is not clear Chinn and Ito (2005) and Klein (2005) find empirical evidence supporting the notion of a threshold effect financial openness contributes to equity market development only when a threshold level of general development of legal systems and financial development is attained However although property rights and financial institutions could potentially affect capital flows differently no study of the determinants of capital flows has empirically attempted to properly disentangle the effects of both Ju and Wei (2007 2006) develop theoretical models showing that financial institutions and property rights institutions can have different effects on capital flows Whereas an inefficient financial system can be bypassed by international capital flows as they could come in the form of FDI instead of portfolio and debt flows high expropriation risk cannot be bypassed Conversely the stronger domestic property rights the more the country will benefit from international capital flows
B Estimation strategy and Model
Cross-country regressions have been found appropriate to investigate the fundamental (and thus slow-moving) determinants of why some countries attract more inflows or more of a certain type of inflows than other countries In particular we are interested in testing whether financial institutions have a separate and different effect on capital inflows than property rights institutions That effect may also differ depending on the type of capital flows Empirically Acemoglu and Johnson (2005) show that property rights and contractingfinancial market development institutions do affect economic outcomes differently While property rights institutions have a first order effect on economic outcomes such as long-run GDP growth investment rates and financial depth contracting institutions seem to mostly affect the degree of financial market development As others we use instrumental variables to tackle the issue of reverse causality and endogeneity associated with the measures of institutions (Acemoglu and Johnson 2005 Alfaro Kalemli-Ozcan and Volosovych 2005a and 2005b DellrsquoAriccia et al 2008 Faria et al 2006 Faria and Mauro 2004) Building on the recent literature the reduced-form linear equation to be estimated is
iiiii uCPFK +sdot+sdot+sdot+= χβαμ (1) Where iK is log of average inflows to country i iF is a measure of financial institutions and iP a measure of property rights iC is a set of exogenous control variables and iu is an independent error term α β and γ are coefficients capturing the impact of financial development property rights institutions and other controls on capital flows where α and β are of particular interest and μ is a constant
14
Given that the measures of financial and property rights institutions are endogenous simple OLS estimates of equation (1) will be biased As indicated in Acemoglu and Johnson (2005) the α and β coefficients may capture reverse causality or the effect of some other omitted characteristic Second as financial market development and property rights are measured with error there may be a downward attenuation bias and finally if contracting and property rights institutions are correlated the effect of the type of institution that is measured with greater error will load onto the other variable Following Acemoglu and Johnson (2005) the estimation strategy therefore relies on estimating equation (1) with two-stage least squares (2SLS) using valid and separate instruments for financial and property rights institutions The two first stage equations will thus be of the form
iiiii CELF 11111 εχηδν +sdot+sdot+sdot+=
iiiii CELP 22222 εχηδν +sdot+sdot+sdot+= (2) Where iL and iE are instruments for financial institutions and property rights institutions respectively The key exclusion restriction is that Cov( iu iL ) = Cov ( iu iE ) =0 iu being the error term in the second-stage equation (1)
C Empirical Analysis This study utilizes a unique data set on capital inflows to SSA prepared by the staff of the International Monetary Fund described in Appendix I Choice of variables The following set of variables was chosen to estimate equations (1) and (2) (see Appendix II for definitions and sources Descriptive statistics are presented in Appendix III Table 1 bull Financial institutions are proxied by the simple index of capital market development
described earlier (Lukonga forthcoming) The more developed capital markets the higher capital flows
bull Property rights institutions are proxied by the rule of law score from the World Governance Indicators (Kaufmann Kray and Mastruzzi 2008) Among the six governance dimensions used by Kaufmann et al 2008 this is the closest proxy for property rights protection6 Better property rights protection should lead to higher capital flows
6 Various other proxies for property rights institutions exist and have been used in empirical studies Faria et al (2006) and Faria and Mauro (2004) use the simple average of KKMrsquos governance indicators for a single year Alfaro et al use the ICRG score (2005a 2005b) Acemoglu and Johnson (2005) and Acemoglu Johnson and
(continuedhellip)
15
bull Following Acemoglu and Johnson (2005) we use British legal origin as the instrument for financial market development taken from La Porta et al (1999) Acemoglu Johnson and Robinson 2002 Glaeser and Schleifer 2002 and La Porta et al1999 show that in the case of former European colonies legal origin is a valid instrument for contracting institutionsfinancial market development and property rights respectively Legal origin is shown to be positively and significantly associated with financial institutions with civil law countries exhibiting lower financial development than common law countries (Glaeser and Schleifer 2002 La Porta et al 1999)
bull The instruments for property rights institutions are the degree of ethno linguistic fragmentation and the countryrsquos latitude taken from La Porta et al (1999) which have been found to be associated with worse property rights and regulations7 Acemoglu and Johnson 2005 Acemoglu Johnson and Richardson (2002) Faria et al 2006 and Faria and Mauro 2004 use settler mortality in 1500 or population density in 1500 and show that they are valid instruments for property rights institutions For sub-Saharan African countries however settler mortality and population density in 1500 are available only for a subset of countries (Acemoglu and Johnson 2002)8 Given the better country coverage we have chosen to proceed with ethno linguistic fragmentation and latitude
bull A dummy variable to control for oil-exporting countries (the dummy variable takes the value of 1 if the country is an oil exporter) Oil-exporting countries attract more FDI other things equal
bull A dummy variable to control for market size (the dummy variable takes the value of 1 if the country is South Africa or Nigeria) Larger and more sophisticated economies attract more capital flows
Similar studies also include a number of additional explanatory variables though it is more difficult both to argue that they are exogenous and to find valid instruments for them We use these variables in our baseline regression
bull Human capital proxied by the share of secondary school enrollment in the population from the WDI This variable features in explanations of the Lucas Paradox that focus on missing factors of production (Alfaro et al 2005a 2005b) The expected impact of higher human capital on capital flows is expected to be positive
Robinson (2002) use average protection against expropriation risk and constraint on the executive as measures of property rights but these measures are not available for a sufficiently large number of our sample countries 7 La Porta et al (1999) however note that the adverse effects of ethno linguistic fractionalization on government performance tend to disappear when controlling for per capita income and latitude except for public good provision and state-owned enterprises This can be interpreted as countries with a large public enterprises sector tend to have less regard for private enterprises and private property rights 8 Robustness checks using population density in 1500 as an instrument yield results that are consistent with those obtained with ethno linguistic fragmentation (results not shown)
16
bull A measures of de jure capital account openness proxied by the Chinn-Ito measure of capital account openness based on the IMFrsquos AREAER (Chinn and Ito 2007) We use the average value of the Chinn-Ito variable for sub-Saharan African countries over 1999-20059 The effect of capital account openness on capital flows is expected to be positive
bull A measure of trade openness proxied by the sum of exports and imports over GDP Particularly at an initial stage capital mobility develops around greater openness to trade flows Arguably countries that are more open to trade may also be politically more open to greater integration with the rest of the world
bull Macroeconomic performance proxied here by the real GDP growth rate In a panel study of 47 industrial and emerging countries IMF (2007) find that expected macroeconomic performance proxied by lagged real GDP growth is a significant determinant of private capital inflows IMF (2008) similarly finds that real GDP growth and lower fiscal deficits are significantly correlated with higher private capital inflows Alfaro (2005b) uses inflation volatility as a proxy for macroeconomic performance However it is difficult to establish causality as inflows directly affect macroeconomic outcomes (also see below) Further macroeconomic outcomes have been shown to be shaped by institutions making it difficult to study the independent effect of institutional development on capital flows
Correlations Appendix Table III2 shows pairwise correlations between different measures of capital flows while Appendix Table III3 shows the pairwise correlations corresponding to the baseline regressions and Appendix Table III4 focuses on the pairwise correlations of the institutional variables and the instruments
Appendix Table III2 indicates that for our sample the choice of scaling variable affects the pairwise correlations of the inflows with the independent variables This confirms the impression from Figure 5 above that the picture of the allocation of private capital inflows across sub-Saharan countries is very different whether one looks at overall volume of inflows or at the size of the inflows relative to a countryrsquos population or GDP Whereas total inflows as a share of population or GDP will be the variable of interest when studying the economic impact of the inflows on individual countries (see Section IV below) the investigation of the factors determining the allocation of private capital flows to sub-Saharan Africa across the
9 Unlike many other studies that use the simple average of the four dummy variables or the dummy on capital account restrictions (Alfaro et al 2005a 2005b IMF 2007b) the Chinn-Ito measure attempts to capture the intensity of the capital controls by incorporating all the restrictions in the index using a principal components approach Whereas the other restrictions are not directly related to capital account restrictions they are taken as indicative of the overall restrictiveness of the regime The advantage of this measure over other more detailed indices that capture the intensity of capital controls (Quinn 1997 2003 Miniane 2004 Schindler 2009) is its near universal country and extended time coverage 181 countries between 1970 and 2005
17
continent should focus on the total volume of inflows A simple explanation is that private investors are more likely to decide on allocating specific amounts of money to various markets or projects than to fix investment limits relative to a countryrsquos population or GDP Therefore for the remainder of this section the variable of interest will be the log of private capital inflows and their components FDI on the one hand and portfolio and debt flows on the other averaged over 2000-2007 for each sub-Saharan African country excluding Somalia and Zimbabwe Looking at the potential determinants of private capital flows to SSA and their composition in Appendix Table III2 (columns 1-4) overall inflows as well as portfolio and debt inflows are correlated with the index of financial sector development secondary school enrollment the market size dummy variable and the log of initial GDP per capita There are however interesting variations for the determinants of FDI flows to which GDP per capita and secondary school enrollment are not significantly correlated but the proxy for property rights and the dummy for oil producers are The measure of trade openness and the Chinn-Ito capital openness variable are never significantly correlated with private inflows or their components However capital account openness is correlated with the degree of financial sector development as in Chinn and Ito (2005) and with secondary school enrollment
Appendix Table III3 illustrates the challenges associated with finding truly exogenous determinants of private capital flows and their composition as a number of potential explanatory variables are correlated with each other In particular the measure of financial market development is highly correlated with the proxies for property rights institutions as discussed above Further educational achievement is significantly correlated with the institutional quality variables and economic development This is not surprising as it can be understood as an outcome of good institutions and higher degree of economic development This strong degree of endogeneity and the fact that we are interested in disentangling the impact of institutions on capital inflows argues that like the variables capturing macroeconomic performance it is probably not a useful explanatory variable given our focus on the impact of institutions per se on capital inflows The same holds true for the proxy for economic development log of GDP per capita in 2000 (Alfaro et al 2005b show that log real GDP per capita has no additional explanatory power once a measure of institutional quality is introduced)
The pairwise correlations of the potential instrumentsmdashBritish legal origin population density in 1500 and ethno linguistic fragmentationmdashwith the institutional variables and with the capital flows variables are encouraging for the instrumental variables approach (Appendix Table III4) The potential instruments for property rights institutions are uncorrelated with the inflows variables but are significantly correlated with the property rights proxies Although British legal origin is significantly correlated with total inflows in addition to financial institutions it is not correlated with property rights nor its potential instruments
18
Regression results
Table 3 presents the results of simple OLS estimations of various specifications of equation (1) as a benchmark The coefficient on the financial market development index is positive and significant and robust across all specifications For portfolio and debt flows it is even the only variable that is significant maybe highlighting the particular importance of capital market development for non-FDI flows The coefficient on property rights institutions (rule of law score) is never significant and has the wrong sign The coefficients on the controls for country size and oil exporters are large and generally significant but while oil exporters do receive more FDI than other countries they do not have any particular advantage with portfolio and debt inflows Real GDP growth is the only other variable that is significant for total inflows and FDI However as discussed earlier real GDP growth is not exogenous and to study the impact of institutions further we use the specification in column (3) as our baseline The log of real GDP per capita in 2000 secondary enrollment and capital account and trade openness are never significant10 The results obtained are similar when breaking the sample into two sub-periods capturing the period before and after the acceleration of private capital inflows This is not surprising considering that the determinants of inflows are fairly slowly-moving country characteristics They are also robust to excluding South Africa and Nigeria indicating that the results are not driven by the two largest recipients and to excluding all oil exporters (Results available upon request) Indeed the impact of financial market development on inflows is even larger in both cases
(1) (2) (3) (4) (5) (6) (7) (8) (1) (2) (3) (4) (1) (2) (3) (4)Financial Institutions 050 056 052 055 056 058 056 057 067 063 055 057 055
(-346) (586) (548) (544) (565) (527) (603) (536) (499) (343) (348) (322)Rule of Law -021 -033 -041 -027 -028 -033 -037 -003 -010 -020 -018 -052 -058
(-056) (-114) (-136) (-070) (-085) (-112) (-129) (-008) (-025) (052) (-046) (-124) (-131)South Africa and Nigeria 185 187 198 189 179 158 135 137 211 212
(168) (170) (121) (160) (161) (137) (134) (137) (160 (160)Oil Exporters 161 101 162 168 160 164 267 194 051 012
(314) (190) (304) (276) (308) (306) (441) (367) (078) (014)Real GDP growth
011 014 007(326) (304) (127)
Secondary Enrollment -000
(-028)Log 2000 per capita GDP -05
(-032)Capital Account Openness -06
(-06)Trade Openness
-001(-202)
Constant 447 522 379 335 392 413 374 441 342 442 268 216 345 430 288 260(-125) (2317) (1146) (966) (836) (398) (1015) (867) (713) (1956) (635) (477) (900) (1361) (482) (410)
Observations 43 43 43 43 42 43 43 43 43 43 43 43 43 43 43 43R-squared 026 001 057 062 057 057 058 059 022 000 055 059 025 000 042 044F-Statistic 1196 031 1200 1581 878 946 941 1532 1197 001 1289 1406 1176 021 545 493
Source Authors calculations
Note and indicate significant at 1 5and 10 percent t-Statistics are reported in parentheses Robust standard errors
Table 3 Baseline OLS Estimation ResultsTotal Inflows FDI Inflows Portfolio amp Debt Inflows
10 A recent study finds that as is the case for low-income countries de jure financial integration is fairly low for sub-Saharan Africa compared to other regions Capital control regulations tend to be complex and nontransparent and limited capacity to monitor capital flows can lead to inconsistent implementation Inconsistencies between different regulations have also made capital controls easy to circumvent This may explain the difficulties in establishing an empirical relation between capital controls and capital flows in the region (IMF 2008)
19
Table 4 presents the results of the 2SLS estimation The first stage equations are shown in Panel A and the second stage in Panel B Columns (1) and (2) report results using Ethno linguistic fractionalization as the instrument for property rights institutions and columns (3) and (4) using latitude Given the very low R-squared obtained in the latter case corresponding results are not shown for the components of the inflows Starting with the first-stage regressions British legal origin is shown to have a strong positive and significant impact on financial development but not on the rule of law while the instrument for property rights has a stronger and mostly significant impact on property rights (greater ethno linguistic fragmentation has a negative impact on rule of law as does closeness to the Equator) than on financial institutions Market size has a positive and significant impact on capital market development and oil exporting status has a negative and significant impact However market size is negatively related to rule of lawalthough this is likely to be mainly because of the relatively low ratings of Nigeria and South Africa regarding property rights protection Oil exporting status is also negatively related to rule of law a result attributed to the rent-seeking culture that appears to take hold in resource-rich countries (Auty 2001 Auty and Gelb 2001 Karl 1999 1997)
(1) (2) (3) (4) (1) (2) (1) (2) (1) (2)
Financial Institutions042 022 061 062 061 051 032 001 006 011(200) (097) (211) (134) (264) (214) (137) (004) (148) (259)
Rule of Law -101 -035 -225 -231 -096 025 -043 -020 -009 010(-092) (-028) (-198) (-160) (-082) (020) (-034) (-012) (-047) -041
South Africa and Nigeria 277 076 196 380 -037
(205) (039) (149) (241) (-195)Oil Exporters 115 067 265 -060 054
(157) (090 (298) (-006) (332)Constant 396 443 275 255 272 318 359 414 032 030
(430) (448) (233) (157) (287) (379) (348) (334) (188) (170)Observations 42 42 43 43 42 42 42 42 42 42R-squared 028 047 005 007 025 053 024 024 NA 012
British Legal Origin 181 148 188 155 181 148 181 148 181 148(408) (291) (419) (295) (408) (291) (408) (291) (408) (291)
Instrument for Rule of Law1 060 069 031 084 060 069 060 069 060 069
(097) (107) (024) 063) (097) (107) (097) (107) (097) (107)South Africa and Nigeria 145 158 145 145 145
(260) (295) (260) (260) (260)Oil Exporters -085 -074 -085 -085 -085
(-210) (-193) (-210) (-210) (-210)Constant 078 092 106 116 078 092 078 092 078 092
(188) (229) (394) (423) (188) (229) (188) (229) (188) (229)Adj R-squared 032 034 031 033 032 034 032 034 032 034
British Legal Origin 031 034 023 023 031 034 031 034 031 034(166) (161) (121) (121) (166) (161) (166) (161) (166) (161)
Instrument for Rule of Law1 -068 -053 143 148 -068 -053 -068 -053 -068 -053
(-211) (-157) (122) -163 (-211) (-157) (-211) (-157) (-211) (-157)South Africa and Nigeria -065 -058 -065 -065 -065
(-336) (-278) (-336) (-336) (-336)Oil Exporters -033 -048 -033 -033 -033
(-183) (-225) (-183) (-183) (-183)Constant -036 -038 -096 -086 -036 -038 -036 -038 -036 -038
(-150) (-154) (-591) (-514) (-150) (-154) (-150) (-154) (-150) (-154)Adj R-squared 010 017 008 019 010 017 010 017 010 017
Source Authors calculations
Financial Institutions Financial Institutions Financial Institutions
Table 4 Instrumental Variables Estimation ResultsPortfolio Inflows
Panel A Second-Stage Regressions
Panel B First-Stage Regressions
Rule of Law
Note and indicate significant at 1 5and 10 percent t-Statistics are reported in parentheses Robust standard 1 In columns (1) and (2) the instrument for rule of law is ethnolinguistic fractionalization In columns (3) and (4) the instrument is latitude
Total Inflows FDI Inflows
Rule of Law Rule of Law
Share of FDI
Financial Institutions
Rule of Law
20
Comparing the second-stage equations with the OLS estimates the impact of financial institutions is overall weaker (smaller coefficients) but remains strong and significant for total inflows and FDI inflows as well as the share of FDI in total inflows Interestingly the property rights variable is never significant and continues to have the ldquowrongrdquo sign in most cases except for FDI inflows and the share of FDI (column 2) perhaps indicating that non-FDI investors believe property rights are not critical for their relatively liquid investments Oil resources is a strong determinant of FDI inflows but not other types of flows whereas it is market size that seems to matter for portfolio and debt inflows When excluding South Africa and Nigeria or oil-rich countries from the estimation results are broadly similar with the coefficient on financial institutions larger particularly in the FDI regressions This indicates that in non-oil sub-Saharan African countries excluding South Africa FDI inflows are significantly larger the more financial markets are developed Perhaps surprisingly property rights protection is insignificant This may be explained by the fact that as FDI is harder to expropriate even countries with poor property rights protection receive FDI Alternatively for these relatively small countries it may be possible for foreign investors to effectively negotiate greater property rights for their FDI than is generally available in the country for other investors Given the small sample size the results must be interpreted with caution but overall they support the importance of unbundling institutions and measuring them more precisely Results also support the notion that for capital flows financial institutions as proxied by capital markets development matter more than basic property rights institutions capital including in the form of FDI will flow less to countries with less developed financial markets against the view presented in Albuquerque (2003) that FDI should flow more to financially constrained countries
IV DO PRIVATE CAPITAL FLOWS HAVE AN IMPACT ON GROWTH IN SSA This section undertakes a preliminary analysis of the relationship between capital inflows and growth in sub-Saharan Africa Significant capital flows to African countries are a relatively recent phenomenon and as noted above have so far been restricted to a limited number of markets Given the general inconclusiveness of the empirical evidence on the links between growth and capital flows from emerging markets that have been on the radar of international investors much longer than most African markets it is perhaps too early to expect robust econometric results with the particular sample in this paper While it is easy to make a theoretical case for the positive impact of capital flows on growth the empirical verification of this impact has proved much more challenging11 Alternate
11 See Edison and others 2004 Kose and others 2006 DellrsquoAricia and others 2008 and Prasad Rajan and Subramanian 2007 for comprehensive reviews of the empirical literature on the impact of capital flows Though evidence from empirical studies using aggregate data is inconclusive studies that use measures of de facto
(continuedhellip)
21
explanations to this empirical puzzle have predicated the gains from capital flows on the threshold development of certain domestic institutions andor proposed that such flows generate certain indirect or collateral benefits even when their direct impact on growth is difficult to gauge Klein (2005) finds support for a model in which institutional quality intermediates the impact of capital account liberalization on growth by affecting the extent to which savings are protected from expropriation and the premium borrowers pay for funds from abroad In countries with better institutions capital account openness has a significant positive impact on growth Bekaert Harvey and Lundblad (2005) find that the largest growth response to equity market liberalizations accrues to countries with better legal systems above-average financial development and better-quality institutions in terms of investor protection and accounting standards Using industry-level data Prasad Rajan and Subramanian (2007) indicate that for countries that have above-median levels of financial development foreign capital aids the relative growth of those industries dependent on finance But for countries below the median for financial development the effect of foreign capital inflows is diametrically opposite Using firm-level data Alfaro and Charlton (2007) find a significant relationship between entrepreneurial activity and both de jure and de facto international capital integration Their results suggest that foreign capital may improve access to capital either directly or through improved domestic financial intermediation
Recent evidence however indicates that countries that grow more rapidly are those that rely less and not more on foreign capital and in turn foreign capital tends to flow to countries that experience not high but low productivity growth (Prasad Rajan and Subramanian (2007) Gourinchas and Jeanne (2007)) One possible explanation for this puzzle is trade fast-growing countries also are the ones that experienced a takeoff in their export sector (Gourinchas and Jeanne 2007) If capital inflows lead to higher prices for nontraded goods owing to absorptive capacity constraints and thus to overvaluation they will have a negative impact on exports and hence growth (Kose and others 2006 Prasad Rajan and Subramanian 2007) Another explanation is that inflows from abroad that supplement domestic savings will have a limited impact in an economy where the binding constraint is the scarcity of viable investment opportunities (Rodrik and Subramanian 2009)
We estimate the gains from financial globalization using the same cross-section sample of average flows for the 2000-07 period as in the preceding section However in this section we also make use of data on net flows For most African countries the differences between net and total capital flows are not often vast nevertheless the economic impact of such flows depends on the actual infusion of foreign capital rather than gross flows Also we scale net flows to the size of the economy by alternatively dividing them by population or GDP
integration or finer measures of de jure integration tend to find more positive results Studies using micro data are also better able to find growth and productivity gains from financial integration
22
A Correlation Analysis
We begin the correlation analysis with a simple mapping between economic growth and capital flows in sub-Saharan Africa while not drawing any inferences about the direction of causation
12 The scatter plots indicate a generally positive correlation between growth and capital flows in our sample13 Consistent with the findings in the literature the relationship is more pronounced when only FDI flows are considered
Figure 7 Sub-Saharan Africa Capital Flows and Real GDP Growth
Capital Flows and Real Growth(net total flows to population)
-600
-500
-400
-300
-200
-100
0
100
200
300
-2 0 2 4 6 8 10 12 14
Capital Flows and Real Growth(net total flows to GDP)
-15
-10
-5
0
5
10
15
20
25
30
-5 0 5 10 15 20 25
FDI and Real Growth(net FDI to population)
0
20
40
60
80
100
120
140
160
180
-2 0 2 4 6 8 10 12 14
FDI and Real Growth(net FDI to GDP)
-5
0
5
10
15
20
25
30
-5 0 5 10 15 20 25
Note All variables are the average value of the 2000-07 period Where normalized over population the charts exclude the outliers Equatorial Guinea and Seychelles Table 5 provides further evidence of the positive significant correlation between capital flows to sub-Saharan Africa and real GDP growth in the recipient countries This relationship however does not hold when capital flows are disaggregatedmdashwhile FDI is positively correlated with growth portfolio and debt-creating flows are generally inversely related to growth though
12 As mentioned in the previous section in analyzing the relationship between growth and capital flows the latter are normalized over either the population or GDP of the recipient country All variables are considered at their average values over the 2000-07 period to deal with annual volatility 13 This is in contrast with Rodrick and Subramanian (2008) who in a sample of 110 developing countries running through 2004 do not find any relationship between financial globalization (measured as the sum of foreign assets and liabilities as a share of GDP) and growth
23
not significantly so This finding is also consistent with evidence from other studies(DellrsquoAricia and others 2008)
B Testing channels of transmission of private capital flows on growth Another approach to gauging the likely impact on capital inflows on growth is to test the various channels described in the literature on financial globalization and growth Three broad channels are identified as linking capital inflows and growth
bull Overvaluation to the extent that capital inflows cause currency appreciation they hurt exports and thus dampen growth This channel is well-documented in Rodrick (2007) but also discussed in Prasad et al (2007)
bull Savings and investment where foreign capital supplements domestic savings it fosters growth However this would only be true for economies where the main constraint on growth is a lack of savings Where the main hindrance to economic growth is the scarcity of viable investment opportunities additional foreign capital will only add to domestic distortions (Gourinchas and Jeanne 2007 Rodrick and Subramanian 2009)
bull Institutional development a number of studies argue that capital inflows carry indirect (collateral) benefits for recipient countries via the development of domestic institutions (Becker and others 2007 Kose and others 2006) or more particularly financial sector institutions (Mishkin 2006)
The testing methodology employed here utilizes correlations as well via bivariate regressions In the first stage the bivariate model regresses capital flows on the channel of interest If the first stage results indicate that the channel is significantly correlated with capital flows then in the second stage the model regresses the predicted value of the channel
Real GDP Growth
Net Total FlowsGDP
FDI FlowsGDP
Debt FlowsGDP
Portfolio FlowsGDP
Real GDP Growth 100Net Total FlowsGDP 038 100FDI FlowsGDP 066 054 100Debt FlowsGDP -002 072 -007 100Portfolio FlowsGDP -006 031 -010 002 100
Real GDP Growth
Net Total Flows per
capitaFDI Flows per capita
Debt Flows per capita
Portfolio Flows per capita
Real GDP Growth 100Net Total Flows per capita 037 100FDI Flows per capita 044 089 100Debt Flows per capita 008 053 022 100Portfolio Flows per capita -007 025 -001 -006 100Note indicates significant at 10 percentSource Authors calculations
Table 5 Correlations Net Capital Flows and Real Growth
24
from the first regression ie that part of the channel variable correlated with capital flows on growth If the coefficient in the second regression is significant and with the expected sign it implies that the channel is likely to be operational for this particular sample of countries Evidence that a particular channel could be at work is not sufficient to demonstrate the impact of private capital flows on growth but it is a necessary first step Thus Yi = α1 + β Ki + u1 (1) gi = α 2 + η Ŷi + u2 (2) Where Yi is the channel variable of interest Ki are capital flows normalized over GDP or population gi is the real GDP growth rate and Ŷi is the predicted value of the channel variable of interest derived from the first regression All variables are in their level values so that sign and significance of β and η are of greater interest than their magnitude The results are presented in Table 6 below
Overvaluation InvestmentDomestic
Savings InstitutionsNet flowsGDP -0004 0164 0337 -0214Net flows per capita -000003 0012 0021 -00042Note and indicate significant at 1 and 5 percent respectivellySource Authors calculations
Table 6 Channels of Transmission Between Capital Flows and Growth
The findings indicate that in most instances capital flows are not significantly correlated with the channel variables in our sample Except when capital flows are scaled to the size of the recipient countryrsquos population mdash both savings and investment are positively and significantly related to capital flows in this instance14 This implies that for SSA countries the impact of private capital flows on growth could be partly intermediated through the impact of net capital flows on domestic savings and investment Another implication would also be that African economies are not necessarily investment-constrained15 14 As expected the impact of the predicted values of investment and domestic savings in the second stage regressions is positive
15 Rodrik and Subramanian (2009) define an economy to be savings-constrained when private investment is low despite the existence of many privately profitable projects because credit is either not available or too costly and to be investment-constrained when credit is available but there is a lack of profitable investment opportunities (p12) In savings-constrained economies foreign capital will supplement scarce domestic savings (evidenced by high real interest rates) and lead to increased investment In investment-constrained economies real interest rates will be low and additional capital flows will finance consumption rather than investment
25
In an unexpected outcome the institutional variable is negatively related to growth a result that holds even when oil-exporters are excluded from the sample (not shown)
C How do Private Capital Flows Affect Growth Going beyond bivariate correlations we first present a simple cross-country multivariate regression model making use of a averages for the 2000-07 period 16 Although this method is not without shortcomings the limited time coverage of our dataset and year-on-year volatility dampens the usefulness of panel estimation However our analysis is subject to the considerable limitations of the ordinary least squares estimator in growth models mdash especially those arising from endogenous variables We fit a simple ordinary least squares specification to estimate the relationship between capital flows and growth gi = α + β Ki + η Xi + ui Where gi is real GDP growth Ki are capital flows normalized over GDP or population Xi is a set of control variables and ui is an independent error term In our choice of control variables we are guided by the ldquochannelsrdquo analysis from the preceding section since our interest in primarily in the impact of capital flows on growth Thus our multivariate model is essentially a simultaneous test of the correlations between of the various channel variables (plus capital flows directly) and growth As discussed above other factors shown in the literature on financial globalization to influence growth include savings and investment exchange rate overvaluation and institutions The exchange rate overvaluation measure is constructed as the ratio of the nominal exchange rate to the purchasing power parity exchange rate17 The measure of institutions used here is the number of procedures to enforce a contract (Contracts) from the World Bankrsquos Doing Business database We also control for level of economic development by including the log of initial per capita real GDP growth The results are documented in Table 7
16 See Appendix Table IV1 and Appendix Table IV2 for summary statistics and correlations for the variables included here 17 More precisely the variable is the residual of a simple panel regression between the nominal exchange rate (local currency per US dollar) versus the PPP valuation of the exchange rate The regression was run for all countries in the world and the variable is normalized to be 1 for the world as a whole
26
[1] [2] [3] [4]Initial per capita GDP (log) -153 -186 -167 -216
(-311) (-403) (-362) (-415)Overvaluation -082 -153 -068 -125
(-045) (-084) (-038) (-068)Domestic savings 009 010 009 010
(339) (359) (361) (362)Investment 018 016 015 017
(333) (293) (258) (297)Contract enforcement 011 009 009 008
(164) (142) (153) (123)Net total flowsGDP 011
-194Net total flows per capita 0003
205Total inflowsGDP 018
(227)Total inflows per capita 0003
(147)Constant -106 412 054 629
(-013) (054) (007) (080)
Adjusted R2 051 052 053 057Number of observations 42 42 42 42Note and indicate significant at 1 5 and 10 percent respectivelly t-statistics in parenthesis
Table 7 Estimation Results Linear Growth Model with Capital Flows
The results indicate that capital flows are positively and significantly (in all but one instance) associated with growth Initial per capita GDP comes in with a negative and significant coefficient in all specifications indicating support for growth convergence Domestic savings and investment are the other significant right-hand side variables that also come in with the expected sign Contract enforcement the proxy for institutional development is not significant in any of the specifications Overvaluation has the expected sign but is never significant Estimating the equation with measures of net FDI instead of total net private capital yields similar results with an even stronger association between the FDI variable and growth Aside from the positive correlations and partial evidence of a possible through the savings-investment channel our analysis is rendered incomplete by the short time period since these inflows began While the limited number of observations in our sample required us to focus on average growth and inflows over the period 2000-2007 most of the inflows came late in this period This is an issue which requires further study as additional observations (years) become available As described in Section II the observed rise in private capital flows and growth during the sample period is an important necessary condition in particular because other studies even fail to uncover such an association for different country groups andor sample periods However it is also far from sufficient for making inferences about causality
27
V CONCLUSION
As a result of the global financial crisis and recession private capital flows to all regions of the world have declined Even when the international economy recovers and financial markets return to health it is likely that investors will remain for some time more risk-averse than they were previously At the same time donor flows to low-income countries including those in sub-Saharan Africa are likely to be adversely impacted by these global developments Our results were inconclusive regarding the impact of private capital flows on growth in SSA countries Additional research will be needed before a definitive statement can be made in this regard once additional observations are available However most SSA countries are likely to remain dependant on financial inflows in some form to help finance current account deficitsmdashdeficits that will be the counterpart of development-oriented investments in these economies As donor flows are likely to be restricted in the coming years due to the fiscal problems the traditional donor countries find themselves confronting SSA countries will need private capital flows to finance these current account deficits The alternative would require smaller or no current account deficits meaning reduced development-oriented investments in infrastructure and other key areas with adverse consequences for growth potential All this means that policy makers in SSA will need to pay increasing attention to efforts to attract private capital to their countries Our results indicate that one of the most important things policy makers can do to attract private capital is to strengthen domestic capital markets Deep and well-functioning money foreign exchange equity and (where relevant) derivative markets are key to attracting private capital Governments in SSA countries would be well-advised to redouble their efforts to develop and strengthen these markets to put their countries in a position to attract private capital in the future At the same time an important of the current financial crisis should also be to put in place strong monitoring regulatory and supervisory frameworks to avoid a buildup of balance-sheet vulnerabilities
28
Appendix I Capital Flows Data The information on private capital flows is based on detailed balance of payments data obtained from AFR country desk economists in late 2007 for 44 sub-Saharan African countries Data for 2000-2006 are actual and data for 2007 are preliminary estimates The data distinguishes between FDI portfolio (debt and equity) and private debt-creating flows and between inflows and outflows The definition of capital inflows adopted for this study differs from other papers using balance of payments data as a measure of capital flows (see Appendix Box I1 for precise definitions used in the paper) Appendix Box I1 Balance of payments recording of capital flows
From the perspective of the financial account one usually thinks of changes in liabilities as positive (inflows) and changes in assets as negative (outflows) In practice both changes in liabilities and assets are reported as net of any disinvestment and consequently both can have any sign In the BOP accounts an increase (decrease) in liabilities to nonresidents is entered as positive (negative) while an increase (decrease) in net foreign assets held by residents is entered as negative (positive) If a resident sells an asset held abroad the transaction is recorded as a reduction in net foreign assets held by residents bringing an inflow of capital For this study capital inflows (outflows) are taken to be the sum of increases (decreases) in liabilities to non-residents and of decreases (increases) in net foreign assets held by residents in a year This allows to capture all transactions that give rise to a inflow of capital into a country on the liability and asset side and avoids negative ldquoinflowsrdquo Net flows of capital are calculated as the sum of the inflows (positive sign) and outflows (negative sign)
This data differs from other published data sources with respect to its timeliness coverage and level of detail bull The 2000-2007 period covers the most recent episode of private capital inflows to
sub-Saharan Africa which took off around 2005-2006
bull It covers 43 sub-Saharan African countries
bull It allows to distinguish between different types of private capital flows (FDI portfolio flows and debt-creating flows) In contrast with other studies (eg Faria and Mauro 2004) that add together FDI and portfolio equity flows we keep them separate and group portfolio debt and equity (either category is too small to stand on its own) We are interested in the determinants of various types of flows particularly as regards the development of financial markets and straight FDI doesnrsquot require any particular type of financial market infrastructure However portfolio debt and equity investment require the existence of bond and equity markets
Other data sources that cover all sub-Saharan African countries include the IMFrsquos WEO IFS Balance of payments data and the World Bankrsquos global development finance data Another
29
widely used data base is the Lane-Milesi-Ferretti data but the most recent updated version goes until 2005 and covers only a sub-set SSA countries Another group of studies use current account data as a proxy for capital flows (Prasad et al 2007 Gourinchas and Jeanne 2007) ndash which have the advantage of providing wide coverage in terms of years and countries but make it impossible to disaggregate between official and private transfers and different types of capital flows The Fundrsquos World Economic Outlook (WEO) database and the World Bankrsquos Global Development Finance (GDF) database provide the most comprehensive coverage of capital flows to sub-Saharan countries These data sets have few missing countries and few missing observations for the countries that are in the data sets However the comprehensiveness of the WEO and the GDF databases is achieved at a price as each data set relies on Fund and Bank staff estimates to fill in the lacunae left from official statistics (Dorsey et al 2008) Other data sets such as the Fundrsquos International Financial Statistics and the Balance of Payments Statistics databases rely on official reporting without the use of staff estimates to fill in the gaps The more detailed and comprehensive coverage of the international transactions at the country level is available in the Balance of Payment Statistics published once a year by the IMF Although information for most of the sub-Saharan African countries is included in the publication the most recent database shows a complete set of annual data for just 18 out of 44 countries in the region mostly the middle-income countries two oil-exporters and the largest low-income economies among them The other countries have missing data either for the capital flows components or some years specially at the end of the period covered in the study which is crucial for the econometric analysis The work of the country desk economists was essentially to make sure that all series were available and the components were consistent with the main aggregates We checked also consistency across the different published databases finding discrepancies mostly in the last few years of the sample and few revisions to historical numbers in the early 2000rsquos for the countries with data in the various publications Looking into the World Economic Outlook database there is a full coverage of the countries in the region but it is difficult to separate actual figures from the forecasted ones or estimates (specially for countries with lags in reporting official data from the authorities) and programs with the Fund requiring accurate estimates on the missing BOP data embedded in the Program We used the WEO data which are also reported by country desk economist in the Fund as a starting point and asked the desk economists to look into the details and components that are normally not used in the aggregated analysis of the external accounts offered in the WEO studies and data In brief we have not created a separate database but rather taken the available information and refined it in a way that allows us to cover as many countries in the region as possible regardless of the size of the country and the level of development weighing properly in the model those countries with no capital flows (reporting zeros) and including those null figures as information in the dependent variable
30
Appendix II Variables Definitions and Sources
Variable Description Units Source
Net total flows FDI portfolio and debt net flows See below Billions of US$ IMF African Department database
Net FDI Net foreign direct investment flows (FDI in the reporting economy net of direct investment abroad)
Billions of US$ IMF African Department database
Net portfolio and debt flows Net private portfolio investment and other private flows Includes equity and debt securities as well as all other net private debt creating flows
Billions of US$ IMF African Department database
Total Inflows FDI portfolio and debt inflows See below Billions of US$ IMF African Department database
FDI Inflows Foreign direct investment in the reporting economy Billions of US$ IMF African Department database
Portfolio and debt inflows Portfolio investment liabilities including equity and debt securities liabilities plus other private capital inflows Includes all other private debt creating flows (Liabilities excludes monetary authorities and government)
Billions of US$ IMF African Department database
CPIA Country Policy and Institutional Assessment Composite index based on sixteen criteria grouped in four categories (i) economic management (ii) structural policies (iii) policies for social inclusion and equity and (iv) public sector management and institutions
1 to 7 World Bank
Financial Institutions Index of capital markets development defined as the sum of four dummy variables Treasury bills treasury bonds corporate bonds and equity markets exist
0 1 2 3 4 with 0 for countries without any market to 4 for countries with all four markets present
Lukonga (forthcoming) and authors calculations
Rule of law The extent to which agents have confidence in and abide by the rules of society and in particular the quality of contract enforcement the police and the courts as well as the likelihood of crime and violence One of the six components of the Governance Indicators
-25 (lower score) to 25 for the highest score
httpinfoworldbankorggovernancewgiindexasp
South Africa and Nigeria Dummy variable 1 for South Africa and Nigeria 0 otherwise 0 1 Authors calculations
Oil exporters Dummy variable 1 for Angola Cameroon Chad Congo Rep of Equatorial Guinea Gabon and Nigeria 0 otherwise
0 1 IMF African Department database
Real GDP growth Real GDP growth Calculated as the percent change of the constant Gross domestic product in 2000 local currency units Measure of quality of macroeconomic policies
Percent IMF World Economic Outlook
Secondary enrollment Total enrolment in secondary level of education regardless of age expressed as a percentage of the population in the official age group corresponding to this level of education
Percent World Bank World Development Indicators
2000 per capita GDP Per capita GDP in constant US dollar for the year 2000 Constant 2000 US dollars IMF World Economic Outlook
Capital account openness De jure capital account openness index as the simple average of four dummy variables representing exchange rate arrangements payments restrictions on current and capital transactions and
t i ti i t f t di A l f
Index Chinn-Ito forthcoming
Trade openness Sum of exports and imports of goods and non-factor services over GDP
Percent of GDP IMF World Economic Outlook
British legal origin Dummy variable that takes the value 1 for former British colonies and 0 otherwise
0 1 La Porta et al (1999)
Ethno linguistic fragmentation
Average value of five different indices of ethno linguistic fractionalization
Index La Porta et al (1999)
Latitude Measure of the closeness to the equator Miles La Porta et al (1999)
Appendix II Variables Definitions and Sources
31
Overvaluation Residual of a simple panel regression between the nominal exchange rate (local currency per US dollar) Vs the PPP valuation of the exchange rate The regression includes 182 countries The overvaluation measure in normalized to be 1 for the world
Deviation from equilibrium between PPP and market rate with 1 defined as the norm
IMF African Department database
GDP in dollars GDP in dollars (Converted at the nominal market exchange rate) Billions of US$ IMF World Economic Outlook
Per capita GDP in dollars Per capita GDP (constant 2000 US dollar) Constant 2000 US dollars IMF World Economic Outlook
Inflation Headline consumer price index (Average annual percent change) Percent IMF World Economic Outlook
Government balance General government balance excluding grants Percent of GDP IMF World Economic OutlookCredit Total credit to the private sector in percent of GDP Percent of GDP IMF International Financial StatisticsCurrent account Current account balance excluding grants Percent of GDP IMF African Department databaseREER Real effective exchange rate weighted index using total trade
(exports and imports composition for 1999 to 2001) and consumer price indices
Percent IMF Information Notice System
NEER Nominal effective exchange rate weighted index using total trade (exports and imports composition for 1999 to 2001)
IMF Information Notice System
US Tbill rate United States Treasury bill rate Percent IMF International Financial StatisticsTerms of trade Terms of trade (Exports prices to import prices goods and services) Percent IMF World Economic Outlook
Rest of the world real GDP Rest of the world real GDP growth (Weighted by country exports) Percent IMF World Economic Outlook
Oil prices Price of oil Simple average of Texas Dubai and Brent prices deflated by the manufacturing unit cost index
Percent IMF World Economic Outlook
Domestic savings Total domestic savings Percent of GDP IMF World Economic OutlookInvestment Total private investment Percent of GDP IMF World Economic Outlook
Reserves Stock of international reserves (US dollar billions) Billions of US$ IMF World Economic Outlook
Non-fuel commodity prices Real non-fuel commodity price (Weighted by country specific exports deflated by the manufacturing unit price)
Percent IMF World Economic Outlook
Population Population Millions IMF World Economic OutlookContract enforcement Efficiency of contract enforcement by following the evolution of a
sale of goods dispute and tracking the time cost and number of procedures involved from the moment the plaintiff files the lawsuit until actual payment
Number of procedures httpwwwdoingbusinessorg
Constraint on the executive Index that ranks from 1 (unlimited authority to the executive) to 7 (Executive parity or subordination) as decribed in the Freedom House Index
1 to 7 httpwwwfreedomhoseorg and Polity IV Databse at wwwsystemicpeaceorg politypolity4htm
ICRG ranking International Country Risk Guide rank for each country is based on three components of risk analysis Political financial and economic components The higher the rating the lower the risk for that particular country The index covers 140 countries
0 to 100 wwwprsgroupcom
Appendix II Variables Definitions and Sources (Contd)
32
Appendix III Determinants of Capital Flows Descriptive Statistics and Correlations
Total inflows FDI inflows Portf amp debt Share of FDI Total inflows FDI inflows Portf amp debt Total inflows FDI inflows Portf amp debt
Financial Institutions 031 033 026 008 002 -005 019 -012 -011 -006004 003 009 062 088 074 022 044 050 070
Rule of Law -021 -029 -015 003 013 005 027 -007 -009 000018 006 034 083 042 077 007 065 058 099
Market size 087 093 074 000 005 -003 021 -006 -004 -005000 000 000 099 077 084 019 069 079 074
Oil exporter 010 043 -004 045 019 027 -005 034 054 -019052 000 078 000 023 008 075 003 000 022
Real GDP growth 012 039 000 034 028 041 -010 055 070 -005043 001 099 003 007 001 052 000 000 077
Secondary enrollment 036 019 039 003 060 044 081 009 011 000002 023 001 083 000 000 000 057 050 099
Log 2000 GDP per capita 027 020 026 027 063 052 070 011 026 -020008 019 009 008 000 000 000 049 009 020
Capital account openness -007 -005 -007 -004 012 006 022 007 001 011066 073 068 079 046 072 016 066 094 049
Trade openness -017 -017 -015 011 014 015 008 013 017 -003027 027 034 050 036 033 059 042 027 086
UKleg 027 028 023 016 -010 -011 -005 -010 -004 -011008 007 014 031 052 048 076 053 078 047
Ethling 015 021 011 012 006 004 009 -005 001 -010033 018 048 044 069 080 055 077 094 053
LAT -011 -012 -009 039 -004 -006 002 -015 -005 -020050 046 057 001 080 068 088 032 073 020
Pop_dens 000 -003 002 -047 -004 -005 -002 004 -023 037099 085 093 000 080 075 089 081 018 003
Note pairwise correlation coefficient reported in first row significance level reported in second row Source Authors calculations
Appendix Table III2 Bivariate Correlations of Capital Flows with Independent Variables
(US$ mn) (per capita) (in percent of GDP)
1 Dependent variables Observations Minimum Maximum Mean MedianStandard Deviation
Total inflows 43 63 162106 8265 2339 25410FDI inflows 43 00 42371 3598 909 8027Portfolio and debt inflows 43 00 130724 4666 1021 19786Total inflows per capita 43 35 16250 1291 255 3078FDI inflows per capita 43 00 11653 826 105 2325Portfolio and debt inflows pc 43 00 5906 465 147 1038Total inflows to GDP 43 11 307 81 62 65FDI inflows to GDP 43 00 290 42 24 53Portfolio and debt inflows to GDP 43 00 187 39 32 36
2 Explanatory variablesFinancial institutions 43 00 40 18 10 16Rule of law 43 -18 08 -07 -07 06Market size 43 00 10 00 00 02Oil exporter 43 00 10 02 00 04Real GDP growth 43 -04 201 48 42 36Secondary enrollment 42 82 1079 342 283 226Log of 2000 GDP per capita 43 45 90 61 58 11Capital account openness 43 -16 25 -05 -11 13Trade openness 43 369 1559 818 789 3043 Alternative measures of institutions and instrumentsCPIA 42 18 43 32 32 06Doing Business Index 43 303 1760 1321 1487 410ICRG ranking 28 483 808 614 605 73Legal rights 43 10 80 40 35 16Property rights 41 14 45 30 30 06Constraint on the executive 40 17 70 41 43 16British legal origin 43 00 10 03 00 05Ethnolinguistic fragmentation 42 00 10 06 07 03Population density in 1500 36 01 250 38 20 55Latitude 43 00 07 01 01 01Source Authors calculations
Appendix Table III1 Descriptive Statistics for Regression Variables
33
Fin Instit Rule of Law Market size Oil exporter Real GDP growth Second Enr Log 2000 GDP pc Capital open Trade openTotal inflows
Financial Institutions 100
Rule of Law 042 100000
Market size 032 -023 100004 015
Oil exporter -022 -034 020 100016 002 019
Real GDP growth 008 001 012 047 100060 095 044 000
Secondary enrollment 040 049 027 -008 -012 100001 000 008 063 044
Log 2000 GDP per capita 034 039 018 024 000 083 100002 001 025 012 098 000
Capital account openness 034 019 -006 -020 -005 031 020 100003 021 071 021 074 005 030
Trade openness -015 -008 -022 003 -010 008 010 -001 100035 061 017 085 054 061 060 096
Note Pairwise correlation coefficients reported in first row significance level reported below Source Authors calculations
Appendix Table III3 Bivariate Correlations of Baseline Regression Variables
Financial inst CPIA indexDoing
Business ICRG ranking Legal rightsRule of
law Property rightsConstraint on the executive
British legal origen
Ethnoling fragmentation Latitude
Population density
Financial institutions 100
4300
CPIA index 063 100000
4200 4200
Doing Business index -060 -044 100000 000
4300 4200 4300
ICRG ranking 029 040 -069 100013 003 000
2800 2800 2800 2800
Legal rights 061 046 -061 020 100000 000 000 030
4300 4200 4300 2800 4300
Rule of Law 042 063 -069 082 034 100000 000 000 000 003
4300 4200 4300 2800 4300 4300
Property rights 057 081 -064 070 046 081 100000 000 000 000 000 000
4100 4100 4100 2700 4100 4100 4100
Constraint on the executive 044 041 -051 016 042 049 055 100000 001 000 043 001 000 000
4000 3900 4000 2800 4000 4000 3800 4000
British legal origin 059 040 -055 031 069 021 036 028 100000 001 000 011 000 018 002 008
4300 4200 4300 2800 4300 4300 4100 4000 4300
Ethnolinguistic fragmentation 017 -015 005 -032 014 -029 -018 002 011 100027 036 074 010 038 006 028 093 050
4200 4100 4200 2800 4200 4200 4000 3900 4200 4200
Latitude 009 016 -028 037 013 030 029 019 011 001 100058 032 007 006 041 005 007 025 049 094
4300 4200 4300 2800 4300 4300 4100 4000 4300 4200 4300
Population density -014 -002 021 -025 -045 -023 -011 -018 -018 -043 -037 100042 090 022 022 001 017 052 031 028 001 003
3600 3600 3600 2500 3600 3600 3600 3500 3600 3500 3600 3600Note Pairwise correlation coefficients reported in first row significance level reported in the second row and number of observation in the third row Source Authors calculations
Appendix Table III4 Bivariate Correlations of Measures of Institutions and Instruments
34
Appendix IV Private Capital Flows and Growth
Variable Number of
observations MeanStandard deviation Min Max
Real GDP growth 43 48 36 -04 201Initial per capita GDP 43 61 11 45 90Net total flowsGDP 43 37 74 -109 271Net total flows per capita 43 547 2782 -5006 12323Total inflowsGDP 43 77 57 10 282Total inflows per capita 43 1311 3139 35 16450Overvaluation 43 11 03 07 17Domestic savings 42 122 200 -247 813Investment 42 216 87 87 469Contract enforcement 43 1014 66 826 1133Source Authors calculations
Appendix Table IV1 Private Capital Flows and Growth Summary Statistics for Multivariate Regression
Rea
l GD
P gr
owth
Initi
al p
er
capi
ta G
DP
Net
flow
sG
DP
Net
flow
s pe
r ca
pita
Inflo
ws
GD
P
Inflo
ws
per
capi
ta
Ove
rval
uatio
n
Dom
estic
sa
ving
s
Inve
stm
ent
Con
tract
en
forc
emen
t
Real GDP growth 100
Initial per capita GDP 000 100
NetflowsGDP 038 -013 100
Netflows per capita 037 028 067 100
InflowsGDP 049 016 076 066 100
Inflows per capita 028 063 042 087 061 100
Overvaluation -032 -021 -011 -003 -024 -016 100
Domestic savings 048 058 013 029 028 048 -036 100
Investment 045 045 014 039 045 051 -026 042 100
Contract enforcement 018 -007 -024 -018 -017 -013 -015 010 -012 100Note indicates significant at 10 percentSource Authors calculations
Appendix Table IV2 Private Capital Flows and Growth Pairwise Correlations for Multivariate Regression
35
References
Acemoglu D and S Johnson 2005 ldquoUnbundling Institutionsrdquo Journal of Political
Economy Vol 113 No 5 pp 949995 Acemoglu D Johnson S and D Robinson 2002 ldquoReversal of Fortune Geography and
Institutions in the Making of the Making of the Modern World Income Distributionrdquo Quarterly Journal of Economics pp 12311294
Albuquerque R 2003 ldquoThe Composition of International Capital Flows Risk Sharing
Through Foreign Direct Investmentrdquo Journal of International Economics Vol 61 pp 353ndash383
Alfaro L and A Charlton 2007 ldquoInternational Financial Integration and Entrepreneurial
Firm Activityrdquo NBER Working Paper No 13118 (Cambridge Massachusetts National Bureau of Economic Research)
mdashmdashmdash S Kalemli-Ozcan and V Volosovych 2005a ldquoCapital Flows in a Globalized
World The Role of Policies and InstitutionsrdquoNBER Working Paper No 11696 (Cambridge Massachusetts National Bureau of Economic Research)
mdashmdashmdash 2005b ldquoWhy Doesnrsquot Capital Flow from Rich to Poor Countries An Empirical
Investigationrdquo NBER Working Paper Series No 11901 (Cambridge Massachusetts National Bureau of Economic Research)
Auty R M ed 2001 Resource abundance and Economic Development Improving the
Performance of Resource-Rich Countries (Oxford Oxford University Press) mdashmdashmdash and A Gelb 2001 ldquoPolitical Economy of Resource-Abundant Statesrdquo in Resource
abundance and Economic Development Improving the Performance of Resource-Rich Countries ed by R M Auty (Oxford Oxford University Press)
Becker T O Jeanne P Mauro J D Ostry and R Ranciegravere 2007 Country InsurancemdashThe Role of Domestic Policies IMF Occasional Paper No
254 (Washington International Monetary Fund) Bekaert G Campbell R H and C Lundblad 2005 ldquoDoes Financial Liberalization Spur
Growthrdquo Journal of Financial Economics Vol 77 (July) Chinn MD and H Ito 2007 ldquoA New Measure of Financial Opennessrdquo Available via the
Internet at wwwsscwiscedu7Emchinnresearchhtml
36
Chinn MD and H Ito 2006 ldquoWhat Matters for Financial Development Capital Controls Institutions and Interactionsrdquo Journal of Development Economics Vol 81 (October) pp 163ndash92
Chinn MD Ito H 2002 ldquoCapital Account Liberalization Institutions and Financial
Development Cross-Country Evidencerdquo NBER Working Paper Series No 8967 (Cambridge Massachusetts National Bureau of Economic Research)
DellAriccia G Di Giovanni J Faria A Kose M A Mauro P Schindler M Terrones M and J D Ostry 2008 ldquoReaping the Benefits of Financial Globalizationrdquo IMF Occasional Paper No 264 (Washington International Monetary Fund)
Dorsey T E Tadesse H Singh S and Z Brixiova 2008 ldquoThe Landscape of Capital
Flows to Low-Income Countriesrdquo IMF Working Paper 0851 (Washington International Monetary Fund)
Edison H Klein M W Ricci L A and T Slok 2004 ldquoCapital Account Liberalization
and Economic Performance Survey and Synthesisrdquo IMF Staff Papers Vol 51 No 2 pp 220256
Faria A and P Mauro 2004 ldquoInstitutions and the External Capital Structure of Countriesrdquo
IMF Working Paper 04236 (Washington International Monetary Fund) mdashmdashmdash Minnoni M and AZaklan 2006 ldquoThe External Financing of Emerging Market
Countries Evidence from Two Waves of Financial Globalizationrdquo IMF Working Paper 06205 (Washington International Monetary Fund)
Glaeser E L and A Shleifer 2002 ldquoLegal Originsrdquo Quarterly Journal of Economics
Vol117 pp 1193ndash1229 Gourinchas P-O and O Jeanne 2007 ldquoCapital Flows to Developing Countries The
Allocation Puzzlerdquo NBER Working Paper No 13602 (Cambridge Massachusetts National Bureau of Economic Research)
International Monetary Fund 2007 Global Financial Stability Report (Washington
October) mdashmdashmdash 2008 Regional Economic Outlook Sub-Saharan Africa (Washington September) Ju J and S-J Wei 2007 ldquoDomestic Institutions and the Bypass Effect of Financial
Globalizationrdquo NBER Working Paper No 13148 (Cambridge Massachusetts National Bureau of Economic Research)
37
mdashmdashmdash 2006 ldquoA Solution to Two Paradoxes of International Capital Flowsrdquo NBER Working Paper No 12668 (Cambridge Massachusetts National Bureau of
Economic Research) Karl T L 1997 The Paradox of Plenty Oil Booms and Petro-States (Berkeley University
of California Press) Kaufmann D Kray A and M Mastruzzi 2008 ldquoGovernance Matters VII Aggregate and
Individual Governance Indicators 1996-2007rdquo Policy Research Working Paper No 4654 (Washington DC World Bank Group)
Klein MW 2005 ldquoCapital Account Liberalization Institutional Quality and Economic
Growth Theory and Evidencerdquo NBER Working Paper No 11112 (Cambridge Massachusetts National Bureau of Economic Research)
Kose M A Prasad E Wei S-J and K Rogoff 2006 ldquoFinancial Globalization A
Reappraisalrdquo IMF Working Paper 06189 (Washington DC International Monetary Fund)
Lane P R 2004 ldquoEmpirical Perspectives on Long-Term External Debtrdquo Topics in Macroeconomics Vol 4 No 1 httpwwwbepresscombejmtopicsvol4iss1art1 La Porta R F Lopez-de-Silanes A Shleifer and R W Vishny 1999 ldquoThe Quality of
Governmentrdquo Journal of Law Economics and Organization Vol 15 pp 222ndash79 Lukonga forthcoming ldquoFinancial Market Development Survey of Sub-Saharan African
Countriesrdquo mimeo Mauro P Minnoni M and AZaklan 2006 ldquoThe External Financing of Emerging Market
Countries Evidence from Two Waves of Financial Globalizationrdquo IMF Working Paper 06205 (Washington International Monetary Fund)
Miniane J 2004 ldquoA New Set of Measures on Capital Account Restrictionsrdquo IMF Staff Papers Vol 51 No 2 pp 276ndash308 Mishkin F S 2006 The Next Great Globalization How Disadvantaged Nations can
Harness their Financial Systems to Get Rich (Princeton NJ Princeton University Press)
Obstfeld M and A M Taylor 2004 Global Capital Markets Integration Crisis and Growth Cambridge University Press (2004) Portes R and H Rey 2005 ldquoThe Determinants of Cross-Border Equity Flowsrdquo Journal of
International Economics Vol 64 pp269-296 Prasad Eswar S Raghuram G Rajan and Arvind Subramanian 2007 ldquoForeign Capital and Economic Growthrdquo Brookings Papers on Economic Activity 1 Brookings
38
Quinn D P 1997 ldquoThe Correlates of Change in International Financial Regulationrdquo
American Political Science Review Vol 91 (September) pp 531ndash51 mdashmdashmdash and A Maria Toyoda forthcoming ldquoDoes Capital Account Liberalization Lead to
Economic Growthrdquo Review of Financial Studies Rodrick D 2007 ldquoThe Real Exchange Rate and Economic Growth Theory and Evidencerdquo
Harvard University Working Paper httpksghomeharvardedu~drodrikRER20and20growthpdf
mdashmdashmdash and A Subramanian 2008 ldquoWhy did Financial Globalization Disappointrdquo IMF
Staff Papers Vol 56 No 1 (Washington International Monetary Fund) Schindler M 2009 ldquoMeasuring Financial Integration A New Datasetrdquo IMF Staff Papers
Vol 56 No 1 (Washington International Monetary Fund) Schularick M 2006 ldquoA Tale of Two Globalizations Capital Flows from Rich to Poor in
Two Eras of Global Financerdquo International Journal of Finance and Economics Vol11 pp339-354
Schularick M Steger T 2008 ldquoThe Lucas Paradox and the Quality of Institutions Then
and Nowrdquo Berlin University Working Paper N20083 Stone M R Shimizu S Nordstrom A and H J Ferhani 2008 ldquoDeveloping Essential
Financial Markets in Smaller Economies Stylized Facts and Policy Optionsrdquo IMF Occasional Paper No 265 (Washington International Monetary Fund)
World Bank 2007 Global Development Finance The Globalization of Corporate Finance in Developing Countries (Washington World Bank Group)

3
Contents Page
I Introduction 4
II Recent trends in financial globalization in SSA6
III Determinants of Private Capital Flows to SSA9 A Recent Literature12 B Estimation strategy and Model13 C Empirical Analysis 14
IV Do private capital flows have an impact on growth in SSA20 A Correlation Analysis 22 B Testing channels of transmission of private capital flows on growth 23 C How do Private Capital Flows Affect Growth 25
V Conclusion 27 Tables 1 Private Capital Flows Volatility8 2 Capital Market Development in Sub-Saharan Africa 10 3 Baseline OLS Estimation Results 18 4 Instrumental Variables Estimation Results19 5 Correlations Net Capital Flows and Real Growth 23 6 Channels of Transmission Between Capital Flows and Growth 24 7 Estimation Results Linear Growth Model with Capital Flows26 Figures 1 Private Capital Inflows to Sub-Saharan Africa 2000-07 5 2 Global Liquidity6 3 Domestic 7 4 Recipients of Private Capital Flows8 5 Top Ten Recipients of Private Capital8 6 External Vulnerability9 7 Sub-Saharan Africa Capital Flows and Real GDP Growth 22 Appendices I Capital Flows Data28 II Variables Definitions and Sources30 III Determinants of Capital Flows Descriptive Statistics and Correlations32 IV Private Capital Flows and Growth34 References35
4
I INTRODUCTION
For decades Africa has been heavily dependent on official development assistance (ODA) to finance persistent balance of payments deficits With low incomes and generally weak economic policies most countries in sub-Saharan Africa (SSA) were unattractive to private investors and thus received little private capital except for foreign direct investment (FDI) in sectors focused on natural resource extraction This has changed in the last decade Abundant global liquidity combined with improved economic policies and prospects in many SSA countries led to a surge in private capital flows with sharp increases in all forms of private capital inflowsmdashFDI portfolio investment and private debt flowsmdashto SSA (Figure 1) As a result in 2007 for the first time ever private capital inflows increased almost six-fold since 2000 to reach an estimated US$84 billion double the amount of ODA to SSA The onset of the financial crisis radically changed the picture with a drying up and in some cases such as South Africa a large reversal of capital flows These developments raise important questions and policy challenges for SSA countries How dependable are these capital flows Have they contributed or are they likely to contribute to improved economic growth prospects How can governments enhance prospects for continued capital inflows particularly in the face of the recent global financial crisis which have seen a sharp decline in global liquidity and a reduced global appetite for risk To begin to answer these questions one must first understand better the factors driving the recent surge in private capital flows to SSA That is the objective of the paper to identify factors behind the composition and distribution of recent private capital flows to sub-Saharan Africa and to begin investigating their possible contribution to growth Building on the observation that the distribution and composition of capital inflows varies substantially across SSA countries we analyze the impact of key country characteristics in attracting different amounts and types of private capital Other studies have highlighted the importance of slow-moving determinants such as the level of economic development or growth performance de jure capital account openness and the quality of institutions These country characteristics are also going to have both a direct and indirect impact on growth in recipient countries along with private capital flows making it difficult to identify the direction of causality To complicate matters further the empirical literature is ambiguous as to whether capital flows have a positive impact on economic growth To partly address these issues we use an instrumental variables approach to study the determinants of private capital flows On the growth impact following Rodrik and Subramanian (2009) we use a two-step approach to investigate possible channels of transmission through which capital flows could influence growth in order to have even a second-order impact on growth capital flows should as a necessary condition at least have a first-order impact on variables known to influence growth
5
Figure 1 Private Capital Inflows to Sub-Saharan Africa 2000-07
Source African Department Database and IMF staff calculations
Fig 1a Private Capital Inflows(Billions of US Dollars)
0
10
20
30
40
50
60
70
80
90
2000 2001 2002 2003 2004 2005 2006 2007
LoansPortfolio FDI
Fig 1b Private Capital Inflows(percent of total flows)
0
20
40
60
80
100
2000 2001 2002 2003 2004 2005 2006 2007
On the determinants side we find that capital market development rather than basic property rights institutions is more closely associated with higher private capital inflows This may be a reflection of the increasing importance of portfolio and debt flows relative to FDI that has been observed in the recent period in SSA Looking at the growth impact we find strong positive correlations between private capital inflows and real GDP growth in the recipient countries However in part because of the limited time-period of our sample we are unable to prove a causal relationship whereby inflows increase growth The paper is related to recent research on determinants of capital flows and on the growth impact of capital flows As documented below both strands of the literature are quite well-populated but to our knowledge this study is the first to analyze these issues for the whole of sub-Saharan Africa in the context of the recent surge in global private capital flows It exploits a unique data set for 44 sub-Saharan African countries1 including annual data on private capital inflows (broken down by FDI portfolio and private debt) between 2000 and 2007 Appendix I provides further details about the capital flows database and how it compares to similar published datasets and Appendix II presents the definitions and sources of other variables used in the empirical analysis The paper is organized as follows Section II looks into recent trends in private capital flows to SSA Section III discusses the determinants of private capital flows and section IV investigates the association between these capital flows and growth Section V concludes
1 For the analysis we also had to exclude Zimbabwe due to sketchy and unreliable data over the sample period
6
II RECENT TRENDS IN FINANCIAL GLOBALIZATION IN SSA
In the period of the recently-ended boom in global financial markets inflows of private capital became the most important source of external finance for sub-Saharan Africa The increase in private capital flows to the region was in line with that in other regions and all low-income countries (Dorsey et al 2008 World Bank 2007) On average in the period between 2001 and 2007 total gross inflows to the region increased by 32 percent annuallymdashthe rate accelerating to 44 percent after 2005 Private capital flows to SSA have risen almost 6-fold since 2000 from about $15 billion to about $84 billion in 2007 (the latest year for which data is available) Recorded private capital outflows are on the whole much smaller than inflows so that in 2007 net capital flows to sub-Saharan Africa amounted to about US$76 billion As of 2007 private capital flows represented 10 percent of the regionrsquos GDP about twice the volume of official development assistance (about US$40 billion) A confluence of factors was responsible for the surge in private capital A significantly improved macroeconomic performance across much of the continent (Figure 2) and for some countries the implementation of the Multilateral Debt Relief Initiative (MDRI) coincided with increases in global liquidity and higher oil and commodity prices (Figure 3)
Figure 2 Global Liquidity ldquoPushrdquo Factors
Source African Department Database and IMF staff calculations
Fig 2a World Real GDP Growth ( Percent)
0
1
2
3
4
5
6
2000 2001 2002 2003 2004 2005 2006 2007
Fig 2b Oil And Commodity Prices (percent change)
-50
-40
-30
-20
-10
0
10
20
30
40
50
60
2000 2001 2002 2003 2004 2005 2006 2007
Non-fuel commodity prices
Oil prices
7
Figure 3 Domestic ldquoPullrdquo Factors
Source African Department Database and IMF staff calculations
Fig 3a Sub-Saharan Africa Real GDP Growth and Per Capita GDP
0
1
2
3
4
5
6
2000 2001 2002 2003 2004 2005 2006 20070
200
400
600
800
1000
1200
1400
1600
1800
2000(Percent) (US dollars)
Real GDPgrowth
(left scale)
Per capita GDP(right scale)
Fig 3bSub-Saharan Africa Inflation and Central Government Balance
0
5
10
15
20
25
30
2000 2001 2002 2003 2004 2005 2006 2007-10
-9
-8
-7
-6
-5
-4
-3
-2
-1
0
Note Excluding Zimbabwe
(Annual averagepercent)
(Percent ofGDP)
Inflation(left scale) Government balance
(right scale excludes grants)
These inflows represent a potential source of vulnerability as countries become increasingly dependent on potentially volatile private capital flows While the overall volatility of capital flows fell in the latter years in the sample the volatility of FDI has actually increased (Table 1)2 In addition for low income SSA countries in particular there has been a strong correlation between capital inflows and current account balances with inflows increasing as the current account improves and decreasing as the current account deteriorates magnifying the resulting swings in the overall balance of payments (Figure 6) On the other hand the surge in private capital inflows has contributed to a steady increase in international reserves of SSA countries providing these countries with increased scope to finance balance of payments deficits
MeanStandard Deviation Volatility Mean
Standard Deviation Volatility
Total inf low 198 45 44 522 243 21FDI 124 50 25 186 42 45Portfolio 13 07 19 177 131 14Private deb 61 05 132 158 88 18Source IMF African Department database 2008
Table 1 Private Capital Flows Volatility2000-03 2004-07
2 An important factor in the increase in FDI volatility seems to be a fairly large movement in FDI in South Africa in 2005-2006
8
Figure 4 Recipients of Private Capital Flows
Fig 4c Share of Portfolio and Debt Flows 2000-03(percent of total)
South Africa 231
Kenya 74
Ethiopia 68
Ghana 68Congo Dem Rep of 63
Other SSA 496
Fig 4d Share of Portfolio and Debt Flows 2004-07(percent of total)
South Africa 728
Nigeria 56
Ghana 22
Angola 20
Kenya 17
Other SSA 157
Fig 4a Share of FDI Inflows 2000-03
South Africa 273
Nigeria 168
Angola 165
Equatorial Guinea 58
Chad 50
Other SSA 285
Fig 4b Share of FDI Inflows 2004-07
Nigeria 343
South Africa 155Equatorial Guinea
102
Tanzania 32
Congo Republic of 29
Other SSA 338
Figure 5 Top Ten Recipients of Private Capital
F ig 5 a T o t a l In f l o w s( m i l l io n s o f U S d o l la rs )
A n g o la
K e n ya
C h a d
T a n z a n ia
S o u th A f r ic a
N ig e r ia
E q u a t o r ia l G u in e a
G h a n a
C o n g o D e m R e p o f
E t h io p ia
0 5 0 0 0 1 0 0 0 0 1 5 0 0 0 2 0 0 0 0
F i g 5 b I n fl o w s t o G D P( p e r c e n t)
C h a d
S e yc h e l le s
C o n g o R e p u b l ic o f
S atilde o T o m eacute amp P r iacute n c i p e
A n g o l a
E q u a t o r ia l G u in e a
G a m b ia T h e
C a p e V e rd e
C o n g o D e m R e p o f
G u in e a - B i s s a u
0 5 1 0 1 5 2 0 2 5 3 0 3 5
F ig 5 c In f lo w s to P o p u la ti o n( r a ti o )
A n g o la
G a b o nC o n g o
R e p u b l ic o fC a p e V e r d e
N a m ib ia
B o t s w a n a
S o u t h A fr i c a
M a u r i t i u sE q u a t o r i a l
G u in e aS e yc h e l le s
0 5 0 0 1 0 0 0 1 5 0 0 2 0 0 0
Note All rankings based on averages for 2000-07 Source African Department data base and IMF staff calculations
9
Figure 6 External Vulnerability
Fig 6a Low-income African Countries Current Account Balance and Capital Inflows 2000-07
0
100
200
300
400
500
600
700
800
900
2000 2001 2002 2003 2004 2005 2006 2007-14
-12
-10
-8
-6
-4
-2
0
Capital Flowsleft axis
Current Account Balanceright axis
Fig 6b Oil Producers Current Account Balance and Capital Inflows 2000-07
0
500
1000
1500
2000
2500
2000 2001 2002 2003 2004 2005 2006 2007-20
-15
-10
-5
0
5
10
Capital Flowsleft axis
Current Account Balanceright axis
Fig 6c Low Income Africa Countries International Reserves and Capital Flows
0
100
200
300
400
500
600
700
800
900
2000 2001 2002 2003 2004 2005 2006 200700
02
04
06
08
10
12
14
16
Reservesright axis
Capital flowsleft axis
Fig 6d Oil Producers International Reserves and Capital Flows
0
500
1000
1500
2000
2500
2000 2001 2002 2003 2004 2005 2006 20070
2
4
6
8
10
12
Capital Flowsleft axis
Reservesright axis
III DETERMINANTS OF PRIVATE CAPITAL FLOWS TO SSA
This section investigates the determinants of private capital flows to sub-Saharan Africa during 2000-2007 with particular focus on the role of domestic capital market development Capital flows to sub-Saharan Africa particularly portfolio flows have been concentrated in a relatively small number of countries with relatively sophisticated financial markets In these countries capital has flown into equities where the stock market was sufficiently developed (eg Kenya Nigeria) government bonds in countries that had sovereign issues (Botswana Ghana) and short-term government securities (Uganda Tanzania and Zambia) when few other investment vehicles open to non-residents were available The availability of investment instruments appears to have dominated the existence of capital controls For example in Tanzania legal loopholes allowed international investors to purchase significant amounts of government securities although in principle foreigners were not allowed to hold government debt (IMF 2008)3
3 Nevertheless targeted capital controls as in Ghana appear to have been successful in developing the longer end of the market for government debt
10
We use a new indicator of capital market development in sub-Saharan Africa that captures the structure of capital markets Capital markets along with money foreign exchange and derivatives markets form part of a countryrsquos ldquoessential financial marketsrdquo (Stone et al 2008 Lukonga forthcoming) In particular we consider government securities markets both for treasury bills and treasury bonds as well as corporate bond markets and equities markets (see Lukonga forthcoming) We construct a simple index which is the sum of four dummy variables taking the value of 1 if the market in question exists and is well-developed The index covers all sub-Saharan African countries except Somalia Using this index simple tabulations show that the average level of financial market development is fairly low in sub-Saharan Africa with only 10 countries or 21 percent of the sample countries having complete capital markets (Table 2)4 However as discussed earlier these countries are also among the largest recipients of private capital inflows in sub-Saharan Africa along with a few oil exporters (Angola Congo Chad and Equatorial Guinea) While the role of institutional development in attracting international capital flows has been emphasized in recent studies very few have attempted to isolate the role of financial versus basic property rights institutions The measures of financial market development used in the literature and that would be available for low-income countries such as ratios of money and credit to GDP have their limitations They measure outcomes such as the ability of the financial (mostly banking) sector to provide transaction services (in the case of the ratios of money or broad money to GDP) or the capacity of the banking system to channel savings rather than the extent of financial market development as measured by the availability of investment instruments Our empirical results detailed below indicate that along with other factors such as market size (particularly for portfolio inflows) and oil exporting status (particularly for FDI flows) the index of capital market development is a significant and robust determinant of international capital flows to sub-Saharan African countries
4 The countries are Botswana Ghana Kenya Namibia Nigeria South Africa Swaziland Tanzania Uganda and Zambia
11
Capital Markets
T-Bills T-BondsCorporate
Bonds Equities
Botswana X X X XGhana X X X XKenya X X X XNamibia X X X XNigeria X X X XSouth Africa X X X XSwaziland X X X XTanzania X X X XUganda X X X XZambia X X X XBenin X X X Burkina Faso X X X NCape Verde X X N XMauritius X X XMozambique X X X Zimbabwe X X XAngola X X N NCocircte dIvoire N X N XGambia The X X N NSenegal X X N Seychelles X X N NCameroon N N XCongo Dem Rep of X N N NEthiopia X N N NGuinea X N N NGuinea-Bissau X N N NLesotho X N N NMadagascar X N N NMalawi X N N Rwanda X N N NSierra Leone X N NTogo X N Burundi N N NCentral African Republic NChad N N N NComoros N N N NCongo Republic of N N N NEquatorial Guinea N N N NEritrea N N NGabon N N N NLiberia N N N NMali N N NNiger N Satildeo Tomeacute and Priacutencipe N N N N
Sources Lukonga (forthcoming) and authors calculationsNotes X denotes that the market is fairly or very well developed denotes that the market nominally exists or is partially developedN denotes that the market does not exist
Table 2 Capital Market Development in Sub-Saharan Africa
12
A Recent Literature
The starting point of much of the recent literature on determinants of capital flows has been an attempt to explain the Lucas Paradox or why private capital doesnrsquot seem to flow from rich to poor countries Standard neoclassical theory predicts that capital should flow from capital-rich countries (with low marginal productivity of capital) to capital-scarce countries (with a high marginal product of capital) In practice however the bulk of observed flows particularly in the modern period consists of flows among developed economies Compared to the early 20th century era of financial globalization the current wave of capital flows is characterized by massive diversification of flows between high-income economies and a relative marginalization of less-developed economies (Obstfeld and Taylor 2004 Schularick 2006 and Schularick and Steger 2008) Some authors posit that the paradox is due to country-specific fundamentals that tend to lower the marginal product of capital in developing countries such as missing factors of production including human capital poor economic policies and poor institutions (Alfaro Kalemli-Ozcan and Volosovych 2005a and 2005b Faria et al 2006 Faria and Mauro 2004 Schularick and Steger 2008) In this vein a recent study shows that the extent of domestic financial market development and the quality of domestic financial institutions has played a significant role in attracting capital flows to emerging markets (IMF 2007) The second set of explanations centers around international capital market imperfections such as asymmetric information sovereign risk and capital controls For example Portes and Rey (2005) find that informational frictions proxied by geographic distance affect the amount and direction of capital flows and Lane (2004) also finds that credit market frictions are a determinant of debt flows in 1970-1995 The studies that focus on the role of institutions in attracting foreign private capital highlight the importance of basic institutions particularly property rights protection Weak property rights owing to poor quality institutions affect entrepreneursrsquo investment decisions Risks of expropriation armed conflict and malfunctioning legal systems all have a potentially negative impact on the returns from those investments Empirically property rights institutions have been proxied by an index derived from the Kaufman Kray and Mastruzzi World Governance IndicatorsWGIs or by an index derived from the ICRG indicators 5 Using those proxies better quality institutions are found to be positively and significantly correlated with foreign equity flows (Alfaro et al 2005a 2005b) and with a higher share of equity in a countryrsquos total stock of external liabilities (Faria and Mauro 2004 and Faria et al 2006) 5 The ICRG composite index aggregates over several dimensions such as government stability investment profile internal and external conflict non-corruption law and order protection from religious and ethnic tensions non-militarized politics democratic accountability and quality of bureaucracy (wwwprsgroupcom) Similarly the WGIs measure countriesrsquo score according to 6 governance dimensions namely voice and accountability political instability government effectiveness regulatory burden rule of law and control of corruption (wwwworldbankorgwbigovernancegovdata)
13
As mentioned earlier few studies focus on the role played by the extent of domestic financial market development in attracting international capital flows While the literature tends to link capital flows (financial globalization) to improvements in domestic financial systems (eg Chinn and Ito 2005 2002 Mishkin 2006) in principle the direction of causality is not clear Chinn and Ito (2005) and Klein (2005) find empirical evidence supporting the notion of a threshold effect financial openness contributes to equity market development only when a threshold level of general development of legal systems and financial development is attained However although property rights and financial institutions could potentially affect capital flows differently no study of the determinants of capital flows has empirically attempted to properly disentangle the effects of both Ju and Wei (2007 2006) develop theoretical models showing that financial institutions and property rights institutions can have different effects on capital flows Whereas an inefficient financial system can be bypassed by international capital flows as they could come in the form of FDI instead of portfolio and debt flows high expropriation risk cannot be bypassed Conversely the stronger domestic property rights the more the country will benefit from international capital flows
B Estimation strategy and Model
Cross-country regressions have been found appropriate to investigate the fundamental (and thus slow-moving) determinants of why some countries attract more inflows or more of a certain type of inflows than other countries In particular we are interested in testing whether financial institutions have a separate and different effect on capital inflows than property rights institutions That effect may also differ depending on the type of capital flows Empirically Acemoglu and Johnson (2005) show that property rights and contractingfinancial market development institutions do affect economic outcomes differently While property rights institutions have a first order effect on economic outcomes such as long-run GDP growth investment rates and financial depth contracting institutions seem to mostly affect the degree of financial market development As others we use instrumental variables to tackle the issue of reverse causality and endogeneity associated with the measures of institutions (Acemoglu and Johnson 2005 Alfaro Kalemli-Ozcan and Volosovych 2005a and 2005b DellrsquoAriccia et al 2008 Faria et al 2006 Faria and Mauro 2004) Building on the recent literature the reduced-form linear equation to be estimated is
iiiii uCPFK +sdot+sdot+sdot+= χβαμ (1) Where iK is log of average inflows to country i iF is a measure of financial institutions and iP a measure of property rights iC is a set of exogenous control variables and iu is an independent error term α β and γ are coefficients capturing the impact of financial development property rights institutions and other controls on capital flows where α and β are of particular interest and μ is a constant
14
Given that the measures of financial and property rights institutions are endogenous simple OLS estimates of equation (1) will be biased As indicated in Acemoglu and Johnson (2005) the α and β coefficients may capture reverse causality or the effect of some other omitted characteristic Second as financial market development and property rights are measured with error there may be a downward attenuation bias and finally if contracting and property rights institutions are correlated the effect of the type of institution that is measured with greater error will load onto the other variable Following Acemoglu and Johnson (2005) the estimation strategy therefore relies on estimating equation (1) with two-stage least squares (2SLS) using valid and separate instruments for financial and property rights institutions The two first stage equations will thus be of the form
iiiii CELF 11111 εχηδν +sdot+sdot+sdot+=
iiiii CELP 22222 εχηδν +sdot+sdot+sdot+= (2) Where iL and iE are instruments for financial institutions and property rights institutions respectively The key exclusion restriction is that Cov( iu iL ) = Cov ( iu iE ) =0 iu being the error term in the second-stage equation (1)
C Empirical Analysis This study utilizes a unique data set on capital inflows to SSA prepared by the staff of the International Monetary Fund described in Appendix I Choice of variables The following set of variables was chosen to estimate equations (1) and (2) (see Appendix II for definitions and sources Descriptive statistics are presented in Appendix III Table 1 bull Financial institutions are proxied by the simple index of capital market development
described earlier (Lukonga forthcoming) The more developed capital markets the higher capital flows
bull Property rights institutions are proxied by the rule of law score from the World Governance Indicators (Kaufmann Kray and Mastruzzi 2008) Among the six governance dimensions used by Kaufmann et al 2008 this is the closest proxy for property rights protection6 Better property rights protection should lead to higher capital flows
6 Various other proxies for property rights institutions exist and have been used in empirical studies Faria et al (2006) and Faria and Mauro (2004) use the simple average of KKMrsquos governance indicators for a single year Alfaro et al use the ICRG score (2005a 2005b) Acemoglu and Johnson (2005) and Acemoglu Johnson and
(continuedhellip)
15
bull Following Acemoglu and Johnson (2005) we use British legal origin as the instrument for financial market development taken from La Porta et al (1999) Acemoglu Johnson and Robinson 2002 Glaeser and Schleifer 2002 and La Porta et al1999 show that in the case of former European colonies legal origin is a valid instrument for contracting institutionsfinancial market development and property rights respectively Legal origin is shown to be positively and significantly associated with financial institutions with civil law countries exhibiting lower financial development than common law countries (Glaeser and Schleifer 2002 La Porta et al 1999)
bull The instruments for property rights institutions are the degree of ethno linguistic fragmentation and the countryrsquos latitude taken from La Porta et al (1999) which have been found to be associated with worse property rights and regulations7 Acemoglu and Johnson 2005 Acemoglu Johnson and Richardson (2002) Faria et al 2006 and Faria and Mauro 2004 use settler mortality in 1500 or population density in 1500 and show that they are valid instruments for property rights institutions For sub-Saharan African countries however settler mortality and population density in 1500 are available only for a subset of countries (Acemoglu and Johnson 2002)8 Given the better country coverage we have chosen to proceed with ethno linguistic fragmentation and latitude
bull A dummy variable to control for oil-exporting countries (the dummy variable takes the value of 1 if the country is an oil exporter) Oil-exporting countries attract more FDI other things equal
bull A dummy variable to control for market size (the dummy variable takes the value of 1 if the country is South Africa or Nigeria) Larger and more sophisticated economies attract more capital flows
Similar studies also include a number of additional explanatory variables though it is more difficult both to argue that they are exogenous and to find valid instruments for them We use these variables in our baseline regression
bull Human capital proxied by the share of secondary school enrollment in the population from the WDI This variable features in explanations of the Lucas Paradox that focus on missing factors of production (Alfaro et al 2005a 2005b) The expected impact of higher human capital on capital flows is expected to be positive
Robinson (2002) use average protection against expropriation risk and constraint on the executive as measures of property rights but these measures are not available for a sufficiently large number of our sample countries 7 La Porta et al (1999) however note that the adverse effects of ethno linguistic fractionalization on government performance tend to disappear when controlling for per capita income and latitude except for public good provision and state-owned enterprises This can be interpreted as countries with a large public enterprises sector tend to have less regard for private enterprises and private property rights 8 Robustness checks using population density in 1500 as an instrument yield results that are consistent with those obtained with ethno linguistic fragmentation (results not shown)
16
bull A measures of de jure capital account openness proxied by the Chinn-Ito measure of capital account openness based on the IMFrsquos AREAER (Chinn and Ito 2007) We use the average value of the Chinn-Ito variable for sub-Saharan African countries over 1999-20059 The effect of capital account openness on capital flows is expected to be positive
bull A measure of trade openness proxied by the sum of exports and imports over GDP Particularly at an initial stage capital mobility develops around greater openness to trade flows Arguably countries that are more open to trade may also be politically more open to greater integration with the rest of the world
bull Macroeconomic performance proxied here by the real GDP growth rate In a panel study of 47 industrial and emerging countries IMF (2007) find that expected macroeconomic performance proxied by lagged real GDP growth is a significant determinant of private capital inflows IMF (2008) similarly finds that real GDP growth and lower fiscal deficits are significantly correlated with higher private capital inflows Alfaro (2005b) uses inflation volatility as a proxy for macroeconomic performance However it is difficult to establish causality as inflows directly affect macroeconomic outcomes (also see below) Further macroeconomic outcomes have been shown to be shaped by institutions making it difficult to study the independent effect of institutional development on capital flows
Correlations Appendix Table III2 shows pairwise correlations between different measures of capital flows while Appendix Table III3 shows the pairwise correlations corresponding to the baseline regressions and Appendix Table III4 focuses on the pairwise correlations of the institutional variables and the instruments
Appendix Table III2 indicates that for our sample the choice of scaling variable affects the pairwise correlations of the inflows with the independent variables This confirms the impression from Figure 5 above that the picture of the allocation of private capital inflows across sub-Saharan countries is very different whether one looks at overall volume of inflows or at the size of the inflows relative to a countryrsquos population or GDP Whereas total inflows as a share of population or GDP will be the variable of interest when studying the economic impact of the inflows on individual countries (see Section IV below) the investigation of the factors determining the allocation of private capital flows to sub-Saharan Africa across the
9 Unlike many other studies that use the simple average of the four dummy variables or the dummy on capital account restrictions (Alfaro et al 2005a 2005b IMF 2007b) the Chinn-Ito measure attempts to capture the intensity of the capital controls by incorporating all the restrictions in the index using a principal components approach Whereas the other restrictions are not directly related to capital account restrictions they are taken as indicative of the overall restrictiveness of the regime The advantage of this measure over other more detailed indices that capture the intensity of capital controls (Quinn 1997 2003 Miniane 2004 Schindler 2009) is its near universal country and extended time coverage 181 countries between 1970 and 2005
17
continent should focus on the total volume of inflows A simple explanation is that private investors are more likely to decide on allocating specific amounts of money to various markets or projects than to fix investment limits relative to a countryrsquos population or GDP Therefore for the remainder of this section the variable of interest will be the log of private capital inflows and their components FDI on the one hand and portfolio and debt flows on the other averaged over 2000-2007 for each sub-Saharan African country excluding Somalia and Zimbabwe Looking at the potential determinants of private capital flows to SSA and their composition in Appendix Table III2 (columns 1-4) overall inflows as well as portfolio and debt inflows are correlated with the index of financial sector development secondary school enrollment the market size dummy variable and the log of initial GDP per capita There are however interesting variations for the determinants of FDI flows to which GDP per capita and secondary school enrollment are not significantly correlated but the proxy for property rights and the dummy for oil producers are The measure of trade openness and the Chinn-Ito capital openness variable are never significantly correlated with private inflows or their components However capital account openness is correlated with the degree of financial sector development as in Chinn and Ito (2005) and with secondary school enrollment
Appendix Table III3 illustrates the challenges associated with finding truly exogenous determinants of private capital flows and their composition as a number of potential explanatory variables are correlated with each other In particular the measure of financial market development is highly correlated with the proxies for property rights institutions as discussed above Further educational achievement is significantly correlated with the institutional quality variables and economic development This is not surprising as it can be understood as an outcome of good institutions and higher degree of economic development This strong degree of endogeneity and the fact that we are interested in disentangling the impact of institutions on capital inflows argues that like the variables capturing macroeconomic performance it is probably not a useful explanatory variable given our focus on the impact of institutions per se on capital inflows The same holds true for the proxy for economic development log of GDP per capita in 2000 (Alfaro et al 2005b show that log real GDP per capita has no additional explanatory power once a measure of institutional quality is introduced)
The pairwise correlations of the potential instrumentsmdashBritish legal origin population density in 1500 and ethno linguistic fragmentationmdashwith the institutional variables and with the capital flows variables are encouraging for the instrumental variables approach (Appendix Table III4) The potential instruments for property rights institutions are uncorrelated with the inflows variables but are significantly correlated with the property rights proxies Although British legal origin is significantly correlated with total inflows in addition to financial institutions it is not correlated with property rights nor its potential instruments
18
Regression results
Table 3 presents the results of simple OLS estimations of various specifications of equation (1) as a benchmark The coefficient on the financial market development index is positive and significant and robust across all specifications For portfolio and debt flows it is even the only variable that is significant maybe highlighting the particular importance of capital market development for non-FDI flows The coefficient on property rights institutions (rule of law score) is never significant and has the wrong sign The coefficients on the controls for country size and oil exporters are large and generally significant but while oil exporters do receive more FDI than other countries they do not have any particular advantage with portfolio and debt inflows Real GDP growth is the only other variable that is significant for total inflows and FDI However as discussed earlier real GDP growth is not exogenous and to study the impact of institutions further we use the specification in column (3) as our baseline The log of real GDP per capita in 2000 secondary enrollment and capital account and trade openness are never significant10 The results obtained are similar when breaking the sample into two sub-periods capturing the period before and after the acceleration of private capital inflows This is not surprising considering that the determinants of inflows are fairly slowly-moving country characteristics They are also robust to excluding South Africa and Nigeria indicating that the results are not driven by the two largest recipients and to excluding all oil exporters (Results available upon request) Indeed the impact of financial market development on inflows is even larger in both cases
(1) (2) (3) (4) (5) (6) (7) (8) (1) (2) (3) (4) (1) (2) (3) (4)Financial Institutions 050 056 052 055 056 058 056 057 067 063 055 057 055
(-346) (586) (548) (544) (565) (527) (603) (536) (499) (343) (348) (322)Rule of Law -021 -033 -041 -027 -028 -033 -037 -003 -010 -020 -018 -052 -058
(-056) (-114) (-136) (-070) (-085) (-112) (-129) (-008) (-025) (052) (-046) (-124) (-131)South Africa and Nigeria 185 187 198 189 179 158 135 137 211 212
(168) (170) (121) (160) (161) (137) (134) (137) (160 (160)Oil Exporters 161 101 162 168 160 164 267 194 051 012
(314) (190) (304) (276) (308) (306) (441) (367) (078) (014)Real GDP growth
011 014 007(326) (304) (127)
Secondary Enrollment -000
(-028)Log 2000 per capita GDP -05
(-032)Capital Account Openness -06
(-06)Trade Openness
-001(-202)
Constant 447 522 379 335 392 413 374 441 342 442 268 216 345 430 288 260(-125) (2317) (1146) (966) (836) (398) (1015) (867) (713) (1956) (635) (477) (900) (1361) (482) (410)
Observations 43 43 43 43 42 43 43 43 43 43 43 43 43 43 43 43R-squared 026 001 057 062 057 057 058 059 022 000 055 059 025 000 042 044F-Statistic 1196 031 1200 1581 878 946 941 1532 1197 001 1289 1406 1176 021 545 493
Source Authors calculations
Note and indicate significant at 1 5and 10 percent t-Statistics are reported in parentheses Robust standard errors
Table 3 Baseline OLS Estimation ResultsTotal Inflows FDI Inflows Portfolio amp Debt Inflows
10 A recent study finds that as is the case for low-income countries de jure financial integration is fairly low for sub-Saharan Africa compared to other regions Capital control regulations tend to be complex and nontransparent and limited capacity to monitor capital flows can lead to inconsistent implementation Inconsistencies between different regulations have also made capital controls easy to circumvent This may explain the difficulties in establishing an empirical relation between capital controls and capital flows in the region (IMF 2008)
19
Table 4 presents the results of the 2SLS estimation The first stage equations are shown in Panel A and the second stage in Panel B Columns (1) and (2) report results using Ethno linguistic fractionalization as the instrument for property rights institutions and columns (3) and (4) using latitude Given the very low R-squared obtained in the latter case corresponding results are not shown for the components of the inflows Starting with the first-stage regressions British legal origin is shown to have a strong positive and significant impact on financial development but not on the rule of law while the instrument for property rights has a stronger and mostly significant impact on property rights (greater ethno linguistic fragmentation has a negative impact on rule of law as does closeness to the Equator) than on financial institutions Market size has a positive and significant impact on capital market development and oil exporting status has a negative and significant impact However market size is negatively related to rule of lawalthough this is likely to be mainly because of the relatively low ratings of Nigeria and South Africa regarding property rights protection Oil exporting status is also negatively related to rule of law a result attributed to the rent-seeking culture that appears to take hold in resource-rich countries (Auty 2001 Auty and Gelb 2001 Karl 1999 1997)
(1) (2) (3) (4) (1) (2) (1) (2) (1) (2)
Financial Institutions042 022 061 062 061 051 032 001 006 011(200) (097) (211) (134) (264) (214) (137) (004) (148) (259)
Rule of Law -101 -035 -225 -231 -096 025 -043 -020 -009 010(-092) (-028) (-198) (-160) (-082) (020) (-034) (-012) (-047) -041
South Africa and Nigeria 277 076 196 380 -037
(205) (039) (149) (241) (-195)Oil Exporters 115 067 265 -060 054
(157) (090 (298) (-006) (332)Constant 396 443 275 255 272 318 359 414 032 030
(430) (448) (233) (157) (287) (379) (348) (334) (188) (170)Observations 42 42 43 43 42 42 42 42 42 42R-squared 028 047 005 007 025 053 024 024 NA 012
British Legal Origin 181 148 188 155 181 148 181 148 181 148(408) (291) (419) (295) (408) (291) (408) (291) (408) (291)
Instrument for Rule of Law1 060 069 031 084 060 069 060 069 060 069
(097) (107) (024) 063) (097) (107) (097) (107) (097) (107)South Africa and Nigeria 145 158 145 145 145
(260) (295) (260) (260) (260)Oil Exporters -085 -074 -085 -085 -085
(-210) (-193) (-210) (-210) (-210)Constant 078 092 106 116 078 092 078 092 078 092
(188) (229) (394) (423) (188) (229) (188) (229) (188) (229)Adj R-squared 032 034 031 033 032 034 032 034 032 034
British Legal Origin 031 034 023 023 031 034 031 034 031 034(166) (161) (121) (121) (166) (161) (166) (161) (166) (161)
Instrument for Rule of Law1 -068 -053 143 148 -068 -053 -068 -053 -068 -053
(-211) (-157) (122) -163 (-211) (-157) (-211) (-157) (-211) (-157)South Africa and Nigeria -065 -058 -065 -065 -065
(-336) (-278) (-336) (-336) (-336)Oil Exporters -033 -048 -033 -033 -033
(-183) (-225) (-183) (-183) (-183)Constant -036 -038 -096 -086 -036 -038 -036 -038 -036 -038
(-150) (-154) (-591) (-514) (-150) (-154) (-150) (-154) (-150) (-154)Adj R-squared 010 017 008 019 010 017 010 017 010 017
Source Authors calculations
Financial Institutions Financial Institutions Financial Institutions
Table 4 Instrumental Variables Estimation ResultsPortfolio Inflows
Panel A Second-Stage Regressions
Panel B First-Stage Regressions
Rule of Law
Note and indicate significant at 1 5and 10 percent t-Statistics are reported in parentheses Robust standard 1 In columns (1) and (2) the instrument for rule of law is ethnolinguistic fractionalization In columns (3) and (4) the instrument is latitude
Total Inflows FDI Inflows
Rule of Law Rule of Law
Share of FDI
Financial Institutions
Rule of Law
20
Comparing the second-stage equations with the OLS estimates the impact of financial institutions is overall weaker (smaller coefficients) but remains strong and significant for total inflows and FDI inflows as well as the share of FDI in total inflows Interestingly the property rights variable is never significant and continues to have the ldquowrongrdquo sign in most cases except for FDI inflows and the share of FDI (column 2) perhaps indicating that non-FDI investors believe property rights are not critical for their relatively liquid investments Oil resources is a strong determinant of FDI inflows but not other types of flows whereas it is market size that seems to matter for portfolio and debt inflows When excluding South Africa and Nigeria or oil-rich countries from the estimation results are broadly similar with the coefficient on financial institutions larger particularly in the FDI regressions This indicates that in non-oil sub-Saharan African countries excluding South Africa FDI inflows are significantly larger the more financial markets are developed Perhaps surprisingly property rights protection is insignificant This may be explained by the fact that as FDI is harder to expropriate even countries with poor property rights protection receive FDI Alternatively for these relatively small countries it may be possible for foreign investors to effectively negotiate greater property rights for their FDI than is generally available in the country for other investors Given the small sample size the results must be interpreted with caution but overall they support the importance of unbundling institutions and measuring them more precisely Results also support the notion that for capital flows financial institutions as proxied by capital markets development matter more than basic property rights institutions capital including in the form of FDI will flow less to countries with less developed financial markets against the view presented in Albuquerque (2003) that FDI should flow more to financially constrained countries
IV DO PRIVATE CAPITAL FLOWS HAVE AN IMPACT ON GROWTH IN SSA This section undertakes a preliminary analysis of the relationship between capital inflows and growth in sub-Saharan Africa Significant capital flows to African countries are a relatively recent phenomenon and as noted above have so far been restricted to a limited number of markets Given the general inconclusiveness of the empirical evidence on the links between growth and capital flows from emerging markets that have been on the radar of international investors much longer than most African markets it is perhaps too early to expect robust econometric results with the particular sample in this paper While it is easy to make a theoretical case for the positive impact of capital flows on growth the empirical verification of this impact has proved much more challenging11 Alternate
11 See Edison and others 2004 Kose and others 2006 DellrsquoAricia and others 2008 and Prasad Rajan and Subramanian 2007 for comprehensive reviews of the empirical literature on the impact of capital flows Though evidence from empirical studies using aggregate data is inconclusive studies that use measures of de facto
(continuedhellip)
21
explanations to this empirical puzzle have predicated the gains from capital flows on the threshold development of certain domestic institutions andor proposed that such flows generate certain indirect or collateral benefits even when their direct impact on growth is difficult to gauge Klein (2005) finds support for a model in which institutional quality intermediates the impact of capital account liberalization on growth by affecting the extent to which savings are protected from expropriation and the premium borrowers pay for funds from abroad In countries with better institutions capital account openness has a significant positive impact on growth Bekaert Harvey and Lundblad (2005) find that the largest growth response to equity market liberalizations accrues to countries with better legal systems above-average financial development and better-quality institutions in terms of investor protection and accounting standards Using industry-level data Prasad Rajan and Subramanian (2007) indicate that for countries that have above-median levels of financial development foreign capital aids the relative growth of those industries dependent on finance But for countries below the median for financial development the effect of foreign capital inflows is diametrically opposite Using firm-level data Alfaro and Charlton (2007) find a significant relationship between entrepreneurial activity and both de jure and de facto international capital integration Their results suggest that foreign capital may improve access to capital either directly or through improved domestic financial intermediation
Recent evidence however indicates that countries that grow more rapidly are those that rely less and not more on foreign capital and in turn foreign capital tends to flow to countries that experience not high but low productivity growth (Prasad Rajan and Subramanian (2007) Gourinchas and Jeanne (2007)) One possible explanation for this puzzle is trade fast-growing countries also are the ones that experienced a takeoff in their export sector (Gourinchas and Jeanne 2007) If capital inflows lead to higher prices for nontraded goods owing to absorptive capacity constraints and thus to overvaluation they will have a negative impact on exports and hence growth (Kose and others 2006 Prasad Rajan and Subramanian 2007) Another explanation is that inflows from abroad that supplement domestic savings will have a limited impact in an economy where the binding constraint is the scarcity of viable investment opportunities (Rodrik and Subramanian 2009)
We estimate the gains from financial globalization using the same cross-section sample of average flows for the 2000-07 period as in the preceding section However in this section we also make use of data on net flows For most African countries the differences between net and total capital flows are not often vast nevertheless the economic impact of such flows depends on the actual infusion of foreign capital rather than gross flows Also we scale net flows to the size of the economy by alternatively dividing them by population or GDP
integration or finer measures of de jure integration tend to find more positive results Studies using micro data are also better able to find growth and productivity gains from financial integration
22
A Correlation Analysis
We begin the correlation analysis with a simple mapping between economic growth and capital flows in sub-Saharan Africa while not drawing any inferences about the direction of causation
12 The scatter plots indicate a generally positive correlation between growth and capital flows in our sample13 Consistent with the findings in the literature the relationship is more pronounced when only FDI flows are considered
Figure 7 Sub-Saharan Africa Capital Flows and Real GDP Growth
Capital Flows and Real Growth(net total flows to population)
-600
-500
-400
-300
-200
-100
0
100
200
300
-2 0 2 4 6 8 10 12 14
Capital Flows and Real Growth(net total flows to GDP)
-15
-10
-5
0
5
10
15
20
25
30
-5 0 5 10 15 20 25
FDI and Real Growth(net FDI to population)
0
20
40
60
80
100
120
140
160
180
-2 0 2 4 6 8 10 12 14
FDI and Real Growth(net FDI to GDP)
-5
0
5
10
15
20
25
30
-5 0 5 10 15 20 25
Note All variables are the average value of the 2000-07 period Where normalized over population the charts exclude the outliers Equatorial Guinea and Seychelles Table 5 provides further evidence of the positive significant correlation between capital flows to sub-Saharan Africa and real GDP growth in the recipient countries This relationship however does not hold when capital flows are disaggregatedmdashwhile FDI is positively correlated with growth portfolio and debt-creating flows are generally inversely related to growth though
12 As mentioned in the previous section in analyzing the relationship between growth and capital flows the latter are normalized over either the population or GDP of the recipient country All variables are considered at their average values over the 2000-07 period to deal with annual volatility 13 This is in contrast with Rodrick and Subramanian (2008) who in a sample of 110 developing countries running through 2004 do not find any relationship between financial globalization (measured as the sum of foreign assets and liabilities as a share of GDP) and growth
23
not significantly so This finding is also consistent with evidence from other studies(DellrsquoAricia and others 2008)
B Testing channels of transmission of private capital flows on growth Another approach to gauging the likely impact on capital inflows on growth is to test the various channels described in the literature on financial globalization and growth Three broad channels are identified as linking capital inflows and growth
bull Overvaluation to the extent that capital inflows cause currency appreciation they hurt exports and thus dampen growth This channel is well-documented in Rodrick (2007) but also discussed in Prasad et al (2007)
bull Savings and investment where foreign capital supplements domestic savings it fosters growth However this would only be true for economies where the main constraint on growth is a lack of savings Where the main hindrance to economic growth is the scarcity of viable investment opportunities additional foreign capital will only add to domestic distortions (Gourinchas and Jeanne 2007 Rodrick and Subramanian 2009)
bull Institutional development a number of studies argue that capital inflows carry indirect (collateral) benefits for recipient countries via the development of domestic institutions (Becker and others 2007 Kose and others 2006) or more particularly financial sector institutions (Mishkin 2006)
The testing methodology employed here utilizes correlations as well via bivariate regressions In the first stage the bivariate model regresses capital flows on the channel of interest If the first stage results indicate that the channel is significantly correlated with capital flows then in the second stage the model regresses the predicted value of the channel
Real GDP Growth
Net Total FlowsGDP
FDI FlowsGDP
Debt FlowsGDP
Portfolio FlowsGDP
Real GDP Growth 100Net Total FlowsGDP 038 100FDI FlowsGDP 066 054 100Debt FlowsGDP -002 072 -007 100Portfolio FlowsGDP -006 031 -010 002 100
Real GDP Growth
Net Total Flows per
capitaFDI Flows per capita
Debt Flows per capita
Portfolio Flows per capita
Real GDP Growth 100Net Total Flows per capita 037 100FDI Flows per capita 044 089 100Debt Flows per capita 008 053 022 100Portfolio Flows per capita -007 025 -001 -006 100Note indicates significant at 10 percentSource Authors calculations
Table 5 Correlations Net Capital Flows and Real Growth
24
from the first regression ie that part of the channel variable correlated with capital flows on growth If the coefficient in the second regression is significant and with the expected sign it implies that the channel is likely to be operational for this particular sample of countries Evidence that a particular channel could be at work is not sufficient to demonstrate the impact of private capital flows on growth but it is a necessary first step Thus Yi = α1 + β Ki + u1 (1) gi = α 2 + η Ŷi + u2 (2) Where Yi is the channel variable of interest Ki are capital flows normalized over GDP or population gi is the real GDP growth rate and Ŷi is the predicted value of the channel variable of interest derived from the first regression All variables are in their level values so that sign and significance of β and η are of greater interest than their magnitude The results are presented in Table 6 below
Overvaluation InvestmentDomestic
Savings InstitutionsNet flowsGDP -0004 0164 0337 -0214Net flows per capita -000003 0012 0021 -00042Note and indicate significant at 1 and 5 percent respectivellySource Authors calculations
Table 6 Channels of Transmission Between Capital Flows and Growth
The findings indicate that in most instances capital flows are not significantly correlated with the channel variables in our sample Except when capital flows are scaled to the size of the recipient countryrsquos population mdash both savings and investment are positively and significantly related to capital flows in this instance14 This implies that for SSA countries the impact of private capital flows on growth could be partly intermediated through the impact of net capital flows on domestic savings and investment Another implication would also be that African economies are not necessarily investment-constrained15 14 As expected the impact of the predicted values of investment and domestic savings in the second stage regressions is positive
15 Rodrik and Subramanian (2009) define an economy to be savings-constrained when private investment is low despite the existence of many privately profitable projects because credit is either not available or too costly and to be investment-constrained when credit is available but there is a lack of profitable investment opportunities (p12) In savings-constrained economies foreign capital will supplement scarce domestic savings (evidenced by high real interest rates) and lead to increased investment In investment-constrained economies real interest rates will be low and additional capital flows will finance consumption rather than investment
25
In an unexpected outcome the institutional variable is negatively related to growth a result that holds even when oil-exporters are excluded from the sample (not shown)
C How do Private Capital Flows Affect Growth Going beyond bivariate correlations we first present a simple cross-country multivariate regression model making use of a averages for the 2000-07 period 16 Although this method is not without shortcomings the limited time coverage of our dataset and year-on-year volatility dampens the usefulness of panel estimation However our analysis is subject to the considerable limitations of the ordinary least squares estimator in growth models mdash especially those arising from endogenous variables We fit a simple ordinary least squares specification to estimate the relationship between capital flows and growth gi = α + β Ki + η Xi + ui Where gi is real GDP growth Ki are capital flows normalized over GDP or population Xi is a set of control variables and ui is an independent error term In our choice of control variables we are guided by the ldquochannelsrdquo analysis from the preceding section since our interest in primarily in the impact of capital flows on growth Thus our multivariate model is essentially a simultaneous test of the correlations between of the various channel variables (plus capital flows directly) and growth As discussed above other factors shown in the literature on financial globalization to influence growth include savings and investment exchange rate overvaluation and institutions The exchange rate overvaluation measure is constructed as the ratio of the nominal exchange rate to the purchasing power parity exchange rate17 The measure of institutions used here is the number of procedures to enforce a contract (Contracts) from the World Bankrsquos Doing Business database We also control for level of economic development by including the log of initial per capita real GDP growth The results are documented in Table 7
16 See Appendix Table IV1 and Appendix Table IV2 for summary statistics and correlations for the variables included here 17 More precisely the variable is the residual of a simple panel regression between the nominal exchange rate (local currency per US dollar) versus the PPP valuation of the exchange rate The regression was run for all countries in the world and the variable is normalized to be 1 for the world as a whole
26
[1] [2] [3] [4]Initial per capita GDP (log) -153 -186 -167 -216
(-311) (-403) (-362) (-415)Overvaluation -082 -153 -068 -125
(-045) (-084) (-038) (-068)Domestic savings 009 010 009 010
(339) (359) (361) (362)Investment 018 016 015 017
(333) (293) (258) (297)Contract enforcement 011 009 009 008
(164) (142) (153) (123)Net total flowsGDP 011
-194Net total flows per capita 0003
205Total inflowsGDP 018
(227)Total inflows per capita 0003
(147)Constant -106 412 054 629
(-013) (054) (007) (080)
Adjusted R2 051 052 053 057Number of observations 42 42 42 42Note and indicate significant at 1 5 and 10 percent respectivelly t-statistics in parenthesis
Table 7 Estimation Results Linear Growth Model with Capital Flows
The results indicate that capital flows are positively and significantly (in all but one instance) associated with growth Initial per capita GDP comes in with a negative and significant coefficient in all specifications indicating support for growth convergence Domestic savings and investment are the other significant right-hand side variables that also come in with the expected sign Contract enforcement the proxy for institutional development is not significant in any of the specifications Overvaluation has the expected sign but is never significant Estimating the equation with measures of net FDI instead of total net private capital yields similar results with an even stronger association between the FDI variable and growth Aside from the positive correlations and partial evidence of a possible through the savings-investment channel our analysis is rendered incomplete by the short time period since these inflows began While the limited number of observations in our sample required us to focus on average growth and inflows over the period 2000-2007 most of the inflows came late in this period This is an issue which requires further study as additional observations (years) become available As described in Section II the observed rise in private capital flows and growth during the sample period is an important necessary condition in particular because other studies even fail to uncover such an association for different country groups andor sample periods However it is also far from sufficient for making inferences about causality
27
V CONCLUSION
As a result of the global financial crisis and recession private capital flows to all regions of the world have declined Even when the international economy recovers and financial markets return to health it is likely that investors will remain for some time more risk-averse than they were previously At the same time donor flows to low-income countries including those in sub-Saharan Africa are likely to be adversely impacted by these global developments Our results were inconclusive regarding the impact of private capital flows on growth in SSA countries Additional research will be needed before a definitive statement can be made in this regard once additional observations are available However most SSA countries are likely to remain dependant on financial inflows in some form to help finance current account deficitsmdashdeficits that will be the counterpart of development-oriented investments in these economies As donor flows are likely to be restricted in the coming years due to the fiscal problems the traditional donor countries find themselves confronting SSA countries will need private capital flows to finance these current account deficits The alternative would require smaller or no current account deficits meaning reduced development-oriented investments in infrastructure and other key areas with adverse consequences for growth potential All this means that policy makers in SSA will need to pay increasing attention to efforts to attract private capital to their countries Our results indicate that one of the most important things policy makers can do to attract private capital is to strengthen domestic capital markets Deep and well-functioning money foreign exchange equity and (where relevant) derivative markets are key to attracting private capital Governments in SSA countries would be well-advised to redouble their efforts to develop and strengthen these markets to put their countries in a position to attract private capital in the future At the same time an important of the current financial crisis should also be to put in place strong monitoring regulatory and supervisory frameworks to avoid a buildup of balance-sheet vulnerabilities
28
Appendix I Capital Flows Data The information on private capital flows is based on detailed balance of payments data obtained from AFR country desk economists in late 2007 for 44 sub-Saharan African countries Data for 2000-2006 are actual and data for 2007 are preliminary estimates The data distinguishes between FDI portfolio (debt and equity) and private debt-creating flows and between inflows and outflows The definition of capital inflows adopted for this study differs from other papers using balance of payments data as a measure of capital flows (see Appendix Box I1 for precise definitions used in the paper) Appendix Box I1 Balance of payments recording of capital flows
From the perspective of the financial account one usually thinks of changes in liabilities as positive (inflows) and changes in assets as negative (outflows) In practice both changes in liabilities and assets are reported as net of any disinvestment and consequently both can have any sign In the BOP accounts an increase (decrease) in liabilities to nonresidents is entered as positive (negative) while an increase (decrease) in net foreign assets held by residents is entered as negative (positive) If a resident sells an asset held abroad the transaction is recorded as a reduction in net foreign assets held by residents bringing an inflow of capital For this study capital inflows (outflows) are taken to be the sum of increases (decreases) in liabilities to non-residents and of decreases (increases) in net foreign assets held by residents in a year This allows to capture all transactions that give rise to a inflow of capital into a country on the liability and asset side and avoids negative ldquoinflowsrdquo Net flows of capital are calculated as the sum of the inflows (positive sign) and outflows (negative sign)
This data differs from other published data sources with respect to its timeliness coverage and level of detail bull The 2000-2007 period covers the most recent episode of private capital inflows to
sub-Saharan Africa which took off around 2005-2006
bull It covers 43 sub-Saharan African countries
bull It allows to distinguish between different types of private capital flows (FDI portfolio flows and debt-creating flows) In contrast with other studies (eg Faria and Mauro 2004) that add together FDI and portfolio equity flows we keep them separate and group portfolio debt and equity (either category is too small to stand on its own) We are interested in the determinants of various types of flows particularly as regards the development of financial markets and straight FDI doesnrsquot require any particular type of financial market infrastructure However portfolio debt and equity investment require the existence of bond and equity markets
Other data sources that cover all sub-Saharan African countries include the IMFrsquos WEO IFS Balance of payments data and the World Bankrsquos global development finance data Another
29
widely used data base is the Lane-Milesi-Ferretti data but the most recent updated version goes until 2005 and covers only a sub-set SSA countries Another group of studies use current account data as a proxy for capital flows (Prasad et al 2007 Gourinchas and Jeanne 2007) ndash which have the advantage of providing wide coverage in terms of years and countries but make it impossible to disaggregate between official and private transfers and different types of capital flows The Fundrsquos World Economic Outlook (WEO) database and the World Bankrsquos Global Development Finance (GDF) database provide the most comprehensive coverage of capital flows to sub-Saharan countries These data sets have few missing countries and few missing observations for the countries that are in the data sets However the comprehensiveness of the WEO and the GDF databases is achieved at a price as each data set relies on Fund and Bank staff estimates to fill in the lacunae left from official statistics (Dorsey et al 2008) Other data sets such as the Fundrsquos International Financial Statistics and the Balance of Payments Statistics databases rely on official reporting without the use of staff estimates to fill in the gaps The more detailed and comprehensive coverage of the international transactions at the country level is available in the Balance of Payment Statistics published once a year by the IMF Although information for most of the sub-Saharan African countries is included in the publication the most recent database shows a complete set of annual data for just 18 out of 44 countries in the region mostly the middle-income countries two oil-exporters and the largest low-income economies among them The other countries have missing data either for the capital flows components or some years specially at the end of the period covered in the study which is crucial for the econometric analysis The work of the country desk economists was essentially to make sure that all series were available and the components were consistent with the main aggregates We checked also consistency across the different published databases finding discrepancies mostly in the last few years of the sample and few revisions to historical numbers in the early 2000rsquos for the countries with data in the various publications Looking into the World Economic Outlook database there is a full coverage of the countries in the region but it is difficult to separate actual figures from the forecasted ones or estimates (specially for countries with lags in reporting official data from the authorities) and programs with the Fund requiring accurate estimates on the missing BOP data embedded in the Program We used the WEO data which are also reported by country desk economist in the Fund as a starting point and asked the desk economists to look into the details and components that are normally not used in the aggregated analysis of the external accounts offered in the WEO studies and data In brief we have not created a separate database but rather taken the available information and refined it in a way that allows us to cover as many countries in the region as possible regardless of the size of the country and the level of development weighing properly in the model those countries with no capital flows (reporting zeros) and including those null figures as information in the dependent variable
30
Appendix II Variables Definitions and Sources
Variable Description Units Source
Net total flows FDI portfolio and debt net flows See below Billions of US$ IMF African Department database
Net FDI Net foreign direct investment flows (FDI in the reporting economy net of direct investment abroad)
Billions of US$ IMF African Department database
Net portfolio and debt flows Net private portfolio investment and other private flows Includes equity and debt securities as well as all other net private debt creating flows
Billions of US$ IMF African Department database
Total Inflows FDI portfolio and debt inflows See below Billions of US$ IMF African Department database
FDI Inflows Foreign direct investment in the reporting economy Billions of US$ IMF African Department database
Portfolio and debt inflows Portfolio investment liabilities including equity and debt securities liabilities plus other private capital inflows Includes all other private debt creating flows (Liabilities excludes monetary authorities and government)
Billions of US$ IMF African Department database
CPIA Country Policy and Institutional Assessment Composite index based on sixteen criteria grouped in four categories (i) economic management (ii) structural policies (iii) policies for social inclusion and equity and (iv) public sector management and institutions
1 to 7 World Bank
Financial Institutions Index of capital markets development defined as the sum of four dummy variables Treasury bills treasury bonds corporate bonds and equity markets exist
0 1 2 3 4 with 0 for countries without any market to 4 for countries with all four markets present
Lukonga (forthcoming) and authors calculations
Rule of law The extent to which agents have confidence in and abide by the rules of society and in particular the quality of contract enforcement the police and the courts as well as the likelihood of crime and violence One of the six components of the Governance Indicators
-25 (lower score) to 25 for the highest score
httpinfoworldbankorggovernancewgiindexasp
South Africa and Nigeria Dummy variable 1 for South Africa and Nigeria 0 otherwise 0 1 Authors calculations
Oil exporters Dummy variable 1 for Angola Cameroon Chad Congo Rep of Equatorial Guinea Gabon and Nigeria 0 otherwise
0 1 IMF African Department database
Real GDP growth Real GDP growth Calculated as the percent change of the constant Gross domestic product in 2000 local currency units Measure of quality of macroeconomic policies
Percent IMF World Economic Outlook
Secondary enrollment Total enrolment in secondary level of education regardless of age expressed as a percentage of the population in the official age group corresponding to this level of education
Percent World Bank World Development Indicators
2000 per capita GDP Per capita GDP in constant US dollar for the year 2000 Constant 2000 US dollars IMF World Economic Outlook
Capital account openness De jure capital account openness index as the simple average of four dummy variables representing exchange rate arrangements payments restrictions on current and capital transactions and
t i ti i t f t di A l f
Index Chinn-Ito forthcoming
Trade openness Sum of exports and imports of goods and non-factor services over GDP
Percent of GDP IMF World Economic Outlook
British legal origin Dummy variable that takes the value 1 for former British colonies and 0 otherwise
0 1 La Porta et al (1999)
Ethno linguistic fragmentation
Average value of five different indices of ethno linguistic fractionalization
Index La Porta et al (1999)
Latitude Measure of the closeness to the equator Miles La Porta et al (1999)
Appendix II Variables Definitions and Sources
31
Overvaluation Residual of a simple panel regression between the nominal exchange rate (local currency per US dollar) Vs the PPP valuation of the exchange rate The regression includes 182 countries The overvaluation measure in normalized to be 1 for the world
Deviation from equilibrium between PPP and market rate with 1 defined as the norm
IMF African Department database
GDP in dollars GDP in dollars (Converted at the nominal market exchange rate) Billions of US$ IMF World Economic Outlook
Per capita GDP in dollars Per capita GDP (constant 2000 US dollar) Constant 2000 US dollars IMF World Economic Outlook
Inflation Headline consumer price index (Average annual percent change) Percent IMF World Economic Outlook
Government balance General government balance excluding grants Percent of GDP IMF World Economic OutlookCredit Total credit to the private sector in percent of GDP Percent of GDP IMF International Financial StatisticsCurrent account Current account balance excluding grants Percent of GDP IMF African Department databaseREER Real effective exchange rate weighted index using total trade
(exports and imports composition for 1999 to 2001) and consumer price indices
Percent IMF Information Notice System
NEER Nominal effective exchange rate weighted index using total trade (exports and imports composition for 1999 to 2001)
IMF Information Notice System
US Tbill rate United States Treasury bill rate Percent IMF International Financial StatisticsTerms of trade Terms of trade (Exports prices to import prices goods and services) Percent IMF World Economic Outlook
Rest of the world real GDP Rest of the world real GDP growth (Weighted by country exports) Percent IMF World Economic Outlook
Oil prices Price of oil Simple average of Texas Dubai and Brent prices deflated by the manufacturing unit cost index
Percent IMF World Economic Outlook
Domestic savings Total domestic savings Percent of GDP IMF World Economic OutlookInvestment Total private investment Percent of GDP IMF World Economic Outlook
Reserves Stock of international reserves (US dollar billions) Billions of US$ IMF World Economic Outlook
Non-fuel commodity prices Real non-fuel commodity price (Weighted by country specific exports deflated by the manufacturing unit price)
Percent IMF World Economic Outlook
Population Population Millions IMF World Economic OutlookContract enforcement Efficiency of contract enforcement by following the evolution of a
sale of goods dispute and tracking the time cost and number of procedures involved from the moment the plaintiff files the lawsuit until actual payment
Number of procedures httpwwwdoingbusinessorg
Constraint on the executive Index that ranks from 1 (unlimited authority to the executive) to 7 (Executive parity or subordination) as decribed in the Freedom House Index
1 to 7 httpwwwfreedomhoseorg and Polity IV Databse at wwwsystemicpeaceorg politypolity4htm
ICRG ranking International Country Risk Guide rank for each country is based on three components of risk analysis Political financial and economic components The higher the rating the lower the risk for that particular country The index covers 140 countries
0 to 100 wwwprsgroupcom
Appendix II Variables Definitions and Sources (Contd)
32
Appendix III Determinants of Capital Flows Descriptive Statistics and Correlations
Total inflows FDI inflows Portf amp debt Share of FDI Total inflows FDI inflows Portf amp debt Total inflows FDI inflows Portf amp debt
Financial Institutions 031 033 026 008 002 -005 019 -012 -011 -006004 003 009 062 088 074 022 044 050 070
Rule of Law -021 -029 -015 003 013 005 027 -007 -009 000018 006 034 083 042 077 007 065 058 099
Market size 087 093 074 000 005 -003 021 -006 -004 -005000 000 000 099 077 084 019 069 079 074
Oil exporter 010 043 -004 045 019 027 -005 034 054 -019052 000 078 000 023 008 075 003 000 022
Real GDP growth 012 039 000 034 028 041 -010 055 070 -005043 001 099 003 007 001 052 000 000 077
Secondary enrollment 036 019 039 003 060 044 081 009 011 000002 023 001 083 000 000 000 057 050 099
Log 2000 GDP per capita 027 020 026 027 063 052 070 011 026 -020008 019 009 008 000 000 000 049 009 020
Capital account openness -007 -005 -007 -004 012 006 022 007 001 011066 073 068 079 046 072 016 066 094 049
Trade openness -017 -017 -015 011 014 015 008 013 017 -003027 027 034 050 036 033 059 042 027 086
UKleg 027 028 023 016 -010 -011 -005 -010 -004 -011008 007 014 031 052 048 076 053 078 047
Ethling 015 021 011 012 006 004 009 -005 001 -010033 018 048 044 069 080 055 077 094 053
LAT -011 -012 -009 039 -004 -006 002 -015 -005 -020050 046 057 001 080 068 088 032 073 020
Pop_dens 000 -003 002 -047 -004 -005 -002 004 -023 037099 085 093 000 080 075 089 081 018 003
Note pairwise correlation coefficient reported in first row significance level reported in second row Source Authors calculations
Appendix Table III2 Bivariate Correlations of Capital Flows with Independent Variables
(US$ mn) (per capita) (in percent of GDP)
1 Dependent variables Observations Minimum Maximum Mean MedianStandard Deviation
Total inflows 43 63 162106 8265 2339 25410FDI inflows 43 00 42371 3598 909 8027Portfolio and debt inflows 43 00 130724 4666 1021 19786Total inflows per capita 43 35 16250 1291 255 3078FDI inflows per capita 43 00 11653 826 105 2325Portfolio and debt inflows pc 43 00 5906 465 147 1038Total inflows to GDP 43 11 307 81 62 65FDI inflows to GDP 43 00 290 42 24 53Portfolio and debt inflows to GDP 43 00 187 39 32 36
2 Explanatory variablesFinancial institutions 43 00 40 18 10 16Rule of law 43 -18 08 -07 -07 06Market size 43 00 10 00 00 02Oil exporter 43 00 10 02 00 04Real GDP growth 43 -04 201 48 42 36Secondary enrollment 42 82 1079 342 283 226Log of 2000 GDP per capita 43 45 90 61 58 11Capital account openness 43 -16 25 -05 -11 13Trade openness 43 369 1559 818 789 3043 Alternative measures of institutions and instrumentsCPIA 42 18 43 32 32 06Doing Business Index 43 303 1760 1321 1487 410ICRG ranking 28 483 808 614 605 73Legal rights 43 10 80 40 35 16Property rights 41 14 45 30 30 06Constraint on the executive 40 17 70 41 43 16British legal origin 43 00 10 03 00 05Ethnolinguistic fragmentation 42 00 10 06 07 03Population density in 1500 36 01 250 38 20 55Latitude 43 00 07 01 01 01Source Authors calculations
Appendix Table III1 Descriptive Statistics for Regression Variables
33
Fin Instit Rule of Law Market size Oil exporter Real GDP growth Second Enr Log 2000 GDP pc Capital open Trade openTotal inflows
Financial Institutions 100
Rule of Law 042 100000
Market size 032 -023 100004 015
Oil exporter -022 -034 020 100016 002 019
Real GDP growth 008 001 012 047 100060 095 044 000
Secondary enrollment 040 049 027 -008 -012 100001 000 008 063 044
Log 2000 GDP per capita 034 039 018 024 000 083 100002 001 025 012 098 000
Capital account openness 034 019 -006 -020 -005 031 020 100003 021 071 021 074 005 030
Trade openness -015 -008 -022 003 -010 008 010 -001 100035 061 017 085 054 061 060 096
Note Pairwise correlation coefficients reported in first row significance level reported below Source Authors calculations
Appendix Table III3 Bivariate Correlations of Baseline Regression Variables
Financial inst CPIA indexDoing
Business ICRG ranking Legal rightsRule of
law Property rightsConstraint on the executive
British legal origen
Ethnoling fragmentation Latitude
Population density
Financial institutions 100
4300
CPIA index 063 100000
4200 4200
Doing Business index -060 -044 100000 000
4300 4200 4300
ICRG ranking 029 040 -069 100013 003 000
2800 2800 2800 2800
Legal rights 061 046 -061 020 100000 000 000 030
4300 4200 4300 2800 4300
Rule of Law 042 063 -069 082 034 100000 000 000 000 003
4300 4200 4300 2800 4300 4300
Property rights 057 081 -064 070 046 081 100000 000 000 000 000 000
4100 4100 4100 2700 4100 4100 4100
Constraint on the executive 044 041 -051 016 042 049 055 100000 001 000 043 001 000 000
4000 3900 4000 2800 4000 4000 3800 4000
British legal origin 059 040 -055 031 069 021 036 028 100000 001 000 011 000 018 002 008
4300 4200 4300 2800 4300 4300 4100 4000 4300
Ethnolinguistic fragmentation 017 -015 005 -032 014 -029 -018 002 011 100027 036 074 010 038 006 028 093 050
4200 4100 4200 2800 4200 4200 4000 3900 4200 4200
Latitude 009 016 -028 037 013 030 029 019 011 001 100058 032 007 006 041 005 007 025 049 094
4300 4200 4300 2800 4300 4300 4100 4000 4300 4200 4300
Population density -014 -002 021 -025 -045 -023 -011 -018 -018 -043 -037 100042 090 022 022 001 017 052 031 028 001 003
3600 3600 3600 2500 3600 3600 3600 3500 3600 3500 3600 3600Note Pairwise correlation coefficients reported in first row significance level reported in the second row and number of observation in the third row Source Authors calculations
Appendix Table III4 Bivariate Correlations of Measures of Institutions and Instruments
34
Appendix IV Private Capital Flows and Growth
Variable Number of
observations MeanStandard deviation Min Max
Real GDP growth 43 48 36 -04 201Initial per capita GDP 43 61 11 45 90Net total flowsGDP 43 37 74 -109 271Net total flows per capita 43 547 2782 -5006 12323Total inflowsGDP 43 77 57 10 282Total inflows per capita 43 1311 3139 35 16450Overvaluation 43 11 03 07 17Domestic savings 42 122 200 -247 813Investment 42 216 87 87 469Contract enforcement 43 1014 66 826 1133Source Authors calculations
Appendix Table IV1 Private Capital Flows and Growth Summary Statistics for Multivariate Regression
Rea
l GD
P gr
owth
Initi
al p
er
capi
ta G
DP
Net
flow
sG
DP
Net
flow
s pe
r ca
pita
Inflo
ws
GD
P
Inflo
ws
per
capi
ta
Ove
rval
uatio
n
Dom
estic
sa
ving
s
Inve
stm
ent
Con
tract
en
forc
emen
t
Real GDP growth 100
Initial per capita GDP 000 100
NetflowsGDP 038 -013 100
Netflows per capita 037 028 067 100
InflowsGDP 049 016 076 066 100
Inflows per capita 028 063 042 087 061 100
Overvaluation -032 -021 -011 -003 -024 -016 100
Domestic savings 048 058 013 029 028 048 -036 100
Investment 045 045 014 039 045 051 -026 042 100
Contract enforcement 018 -007 -024 -018 -017 -013 -015 010 -012 100Note indicates significant at 10 percentSource Authors calculations
Appendix Table IV2 Private Capital Flows and Growth Pairwise Correlations for Multivariate Regression
35
References
Acemoglu D and S Johnson 2005 ldquoUnbundling Institutionsrdquo Journal of Political
Economy Vol 113 No 5 pp 949995 Acemoglu D Johnson S and D Robinson 2002 ldquoReversal of Fortune Geography and
Institutions in the Making of the Making of the Modern World Income Distributionrdquo Quarterly Journal of Economics pp 12311294
Albuquerque R 2003 ldquoThe Composition of International Capital Flows Risk Sharing
Through Foreign Direct Investmentrdquo Journal of International Economics Vol 61 pp 353ndash383
Alfaro L and A Charlton 2007 ldquoInternational Financial Integration and Entrepreneurial
Firm Activityrdquo NBER Working Paper No 13118 (Cambridge Massachusetts National Bureau of Economic Research)
mdashmdashmdash S Kalemli-Ozcan and V Volosovych 2005a ldquoCapital Flows in a Globalized
World The Role of Policies and InstitutionsrdquoNBER Working Paper No 11696 (Cambridge Massachusetts National Bureau of Economic Research)
mdashmdashmdash 2005b ldquoWhy Doesnrsquot Capital Flow from Rich to Poor Countries An Empirical
Investigationrdquo NBER Working Paper Series No 11901 (Cambridge Massachusetts National Bureau of Economic Research)
Auty R M ed 2001 Resource abundance and Economic Development Improving the
Performance of Resource-Rich Countries (Oxford Oxford University Press) mdashmdashmdash and A Gelb 2001 ldquoPolitical Economy of Resource-Abundant Statesrdquo in Resource
abundance and Economic Development Improving the Performance of Resource-Rich Countries ed by R M Auty (Oxford Oxford University Press)
Becker T O Jeanne P Mauro J D Ostry and R Ranciegravere 2007 Country InsurancemdashThe Role of Domestic Policies IMF Occasional Paper No
254 (Washington International Monetary Fund) Bekaert G Campbell R H and C Lundblad 2005 ldquoDoes Financial Liberalization Spur
Growthrdquo Journal of Financial Economics Vol 77 (July) Chinn MD and H Ito 2007 ldquoA New Measure of Financial Opennessrdquo Available via the
Internet at wwwsscwiscedu7Emchinnresearchhtml
36
Chinn MD and H Ito 2006 ldquoWhat Matters for Financial Development Capital Controls Institutions and Interactionsrdquo Journal of Development Economics Vol 81 (October) pp 163ndash92
Chinn MD Ito H 2002 ldquoCapital Account Liberalization Institutions and Financial
Development Cross-Country Evidencerdquo NBER Working Paper Series No 8967 (Cambridge Massachusetts National Bureau of Economic Research)
DellAriccia G Di Giovanni J Faria A Kose M A Mauro P Schindler M Terrones M and J D Ostry 2008 ldquoReaping the Benefits of Financial Globalizationrdquo IMF Occasional Paper No 264 (Washington International Monetary Fund)
Dorsey T E Tadesse H Singh S and Z Brixiova 2008 ldquoThe Landscape of Capital
Flows to Low-Income Countriesrdquo IMF Working Paper 0851 (Washington International Monetary Fund)
Edison H Klein M W Ricci L A and T Slok 2004 ldquoCapital Account Liberalization
and Economic Performance Survey and Synthesisrdquo IMF Staff Papers Vol 51 No 2 pp 220256
Faria A and P Mauro 2004 ldquoInstitutions and the External Capital Structure of Countriesrdquo
IMF Working Paper 04236 (Washington International Monetary Fund) mdashmdashmdash Minnoni M and AZaklan 2006 ldquoThe External Financing of Emerging Market
Countries Evidence from Two Waves of Financial Globalizationrdquo IMF Working Paper 06205 (Washington International Monetary Fund)
Glaeser E L and A Shleifer 2002 ldquoLegal Originsrdquo Quarterly Journal of Economics
Vol117 pp 1193ndash1229 Gourinchas P-O and O Jeanne 2007 ldquoCapital Flows to Developing Countries The
Allocation Puzzlerdquo NBER Working Paper No 13602 (Cambridge Massachusetts National Bureau of Economic Research)
International Monetary Fund 2007 Global Financial Stability Report (Washington
October) mdashmdashmdash 2008 Regional Economic Outlook Sub-Saharan Africa (Washington September) Ju J and S-J Wei 2007 ldquoDomestic Institutions and the Bypass Effect of Financial
Globalizationrdquo NBER Working Paper No 13148 (Cambridge Massachusetts National Bureau of Economic Research)
37
mdashmdashmdash 2006 ldquoA Solution to Two Paradoxes of International Capital Flowsrdquo NBER Working Paper No 12668 (Cambridge Massachusetts National Bureau of
Economic Research) Karl T L 1997 The Paradox of Plenty Oil Booms and Petro-States (Berkeley University
of California Press) Kaufmann D Kray A and M Mastruzzi 2008 ldquoGovernance Matters VII Aggregate and
Individual Governance Indicators 1996-2007rdquo Policy Research Working Paper No 4654 (Washington DC World Bank Group)
Klein MW 2005 ldquoCapital Account Liberalization Institutional Quality and Economic
Growth Theory and Evidencerdquo NBER Working Paper No 11112 (Cambridge Massachusetts National Bureau of Economic Research)
Kose M A Prasad E Wei S-J and K Rogoff 2006 ldquoFinancial Globalization A
Reappraisalrdquo IMF Working Paper 06189 (Washington DC International Monetary Fund)
Lane P R 2004 ldquoEmpirical Perspectives on Long-Term External Debtrdquo Topics in Macroeconomics Vol 4 No 1 httpwwwbepresscombejmtopicsvol4iss1art1 La Porta R F Lopez-de-Silanes A Shleifer and R W Vishny 1999 ldquoThe Quality of
Governmentrdquo Journal of Law Economics and Organization Vol 15 pp 222ndash79 Lukonga forthcoming ldquoFinancial Market Development Survey of Sub-Saharan African
Countriesrdquo mimeo Mauro P Minnoni M and AZaklan 2006 ldquoThe External Financing of Emerging Market
Countries Evidence from Two Waves of Financial Globalizationrdquo IMF Working Paper 06205 (Washington International Monetary Fund)
Miniane J 2004 ldquoA New Set of Measures on Capital Account Restrictionsrdquo IMF Staff Papers Vol 51 No 2 pp 276ndash308 Mishkin F S 2006 The Next Great Globalization How Disadvantaged Nations can
Harness their Financial Systems to Get Rich (Princeton NJ Princeton University Press)
Obstfeld M and A M Taylor 2004 Global Capital Markets Integration Crisis and Growth Cambridge University Press (2004) Portes R and H Rey 2005 ldquoThe Determinants of Cross-Border Equity Flowsrdquo Journal of
International Economics Vol 64 pp269-296 Prasad Eswar S Raghuram G Rajan and Arvind Subramanian 2007 ldquoForeign Capital and Economic Growthrdquo Brookings Papers on Economic Activity 1 Brookings
38
Quinn D P 1997 ldquoThe Correlates of Change in International Financial Regulationrdquo
American Political Science Review Vol 91 (September) pp 531ndash51 mdashmdashmdash and A Maria Toyoda forthcoming ldquoDoes Capital Account Liberalization Lead to
Economic Growthrdquo Review of Financial Studies Rodrick D 2007 ldquoThe Real Exchange Rate and Economic Growth Theory and Evidencerdquo
Harvard University Working Paper httpksghomeharvardedu~drodrikRER20and20growthpdf
mdashmdashmdash and A Subramanian 2008 ldquoWhy did Financial Globalization Disappointrdquo IMF
Staff Papers Vol 56 No 1 (Washington International Monetary Fund) Schindler M 2009 ldquoMeasuring Financial Integration A New Datasetrdquo IMF Staff Papers
Vol 56 No 1 (Washington International Monetary Fund) Schularick M 2006 ldquoA Tale of Two Globalizations Capital Flows from Rich to Poor in
Two Eras of Global Financerdquo International Journal of Finance and Economics Vol11 pp339-354
Schularick M Steger T 2008 ldquoThe Lucas Paradox and the Quality of Institutions Then
and Nowrdquo Berlin University Working Paper N20083 Stone M R Shimizu S Nordstrom A and H J Ferhani 2008 ldquoDeveloping Essential
Financial Markets in Smaller Economies Stylized Facts and Policy Optionsrdquo IMF Occasional Paper No 265 (Washington International Monetary Fund)
World Bank 2007 Global Development Finance The Globalization of Corporate Finance in Developing Countries (Washington World Bank Group)

4
I INTRODUCTION
For decades Africa has been heavily dependent on official development assistance (ODA) to finance persistent balance of payments deficits With low incomes and generally weak economic policies most countries in sub-Saharan Africa (SSA) were unattractive to private investors and thus received little private capital except for foreign direct investment (FDI) in sectors focused on natural resource extraction This has changed in the last decade Abundant global liquidity combined with improved economic policies and prospects in many SSA countries led to a surge in private capital flows with sharp increases in all forms of private capital inflowsmdashFDI portfolio investment and private debt flowsmdashto SSA (Figure 1) As a result in 2007 for the first time ever private capital inflows increased almost six-fold since 2000 to reach an estimated US$84 billion double the amount of ODA to SSA The onset of the financial crisis radically changed the picture with a drying up and in some cases such as South Africa a large reversal of capital flows These developments raise important questions and policy challenges for SSA countries How dependable are these capital flows Have they contributed or are they likely to contribute to improved economic growth prospects How can governments enhance prospects for continued capital inflows particularly in the face of the recent global financial crisis which have seen a sharp decline in global liquidity and a reduced global appetite for risk To begin to answer these questions one must first understand better the factors driving the recent surge in private capital flows to SSA That is the objective of the paper to identify factors behind the composition and distribution of recent private capital flows to sub-Saharan Africa and to begin investigating their possible contribution to growth Building on the observation that the distribution and composition of capital inflows varies substantially across SSA countries we analyze the impact of key country characteristics in attracting different amounts and types of private capital Other studies have highlighted the importance of slow-moving determinants such as the level of economic development or growth performance de jure capital account openness and the quality of institutions These country characteristics are also going to have both a direct and indirect impact on growth in recipient countries along with private capital flows making it difficult to identify the direction of causality To complicate matters further the empirical literature is ambiguous as to whether capital flows have a positive impact on economic growth To partly address these issues we use an instrumental variables approach to study the determinants of private capital flows On the growth impact following Rodrik and Subramanian (2009) we use a two-step approach to investigate possible channels of transmission through which capital flows could influence growth in order to have even a second-order impact on growth capital flows should as a necessary condition at least have a first-order impact on variables known to influence growth
5
Figure 1 Private Capital Inflows to Sub-Saharan Africa 2000-07
Source African Department Database and IMF staff calculations
Fig 1a Private Capital Inflows(Billions of US Dollars)
0
10
20
30
40
50
60
70
80
90
2000 2001 2002 2003 2004 2005 2006 2007
LoansPortfolio FDI
Fig 1b Private Capital Inflows(percent of total flows)
0
20
40
60
80
100
2000 2001 2002 2003 2004 2005 2006 2007
On the determinants side we find that capital market development rather than basic property rights institutions is more closely associated with higher private capital inflows This may be a reflection of the increasing importance of portfolio and debt flows relative to FDI that has been observed in the recent period in SSA Looking at the growth impact we find strong positive correlations between private capital inflows and real GDP growth in the recipient countries However in part because of the limited time-period of our sample we are unable to prove a causal relationship whereby inflows increase growth The paper is related to recent research on determinants of capital flows and on the growth impact of capital flows As documented below both strands of the literature are quite well-populated but to our knowledge this study is the first to analyze these issues for the whole of sub-Saharan Africa in the context of the recent surge in global private capital flows It exploits a unique data set for 44 sub-Saharan African countries1 including annual data on private capital inflows (broken down by FDI portfolio and private debt) between 2000 and 2007 Appendix I provides further details about the capital flows database and how it compares to similar published datasets and Appendix II presents the definitions and sources of other variables used in the empirical analysis The paper is organized as follows Section II looks into recent trends in private capital flows to SSA Section III discusses the determinants of private capital flows and section IV investigates the association between these capital flows and growth Section V concludes
1 For the analysis we also had to exclude Zimbabwe due to sketchy and unreliable data over the sample period
6
II RECENT TRENDS IN FINANCIAL GLOBALIZATION IN SSA
In the period of the recently-ended boom in global financial markets inflows of private capital became the most important source of external finance for sub-Saharan Africa The increase in private capital flows to the region was in line with that in other regions and all low-income countries (Dorsey et al 2008 World Bank 2007) On average in the period between 2001 and 2007 total gross inflows to the region increased by 32 percent annuallymdashthe rate accelerating to 44 percent after 2005 Private capital flows to SSA have risen almost 6-fold since 2000 from about $15 billion to about $84 billion in 2007 (the latest year for which data is available) Recorded private capital outflows are on the whole much smaller than inflows so that in 2007 net capital flows to sub-Saharan Africa amounted to about US$76 billion As of 2007 private capital flows represented 10 percent of the regionrsquos GDP about twice the volume of official development assistance (about US$40 billion) A confluence of factors was responsible for the surge in private capital A significantly improved macroeconomic performance across much of the continent (Figure 2) and for some countries the implementation of the Multilateral Debt Relief Initiative (MDRI) coincided with increases in global liquidity and higher oil and commodity prices (Figure 3)
Figure 2 Global Liquidity ldquoPushrdquo Factors
Source African Department Database and IMF staff calculations
Fig 2a World Real GDP Growth ( Percent)
0
1
2
3
4
5
6
2000 2001 2002 2003 2004 2005 2006 2007
Fig 2b Oil And Commodity Prices (percent change)
-50
-40
-30
-20
-10
0
10
20
30
40
50
60
2000 2001 2002 2003 2004 2005 2006 2007
Non-fuel commodity prices
Oil prices
7
Figure 3 Domestic ldquoPullrdquo Factors
Source African Department Database and IMF staff calculations
Fig 3a Sub-Saharan Africa Real GDP Growth and Per Capita GDP
0
1
2
3
4
5
6
2000 2001 2002 2003 2004 2005 2006 20070
200
400
600
800
1000
1200
1400
1600
1800
2000(Percent) (US dollars)
Real GDPgrowth
(left scale)
Per capita GDP(right scale)
Fig 3bSub-Saharan Africa Inflation and Central Government Balance
0
5
10
15
20
25
30
2000 2001 2002 2003 2004 2005 2006 2007-10
-9
-8
-7
-6
-5
-4
-3
-2
-1
0
Note Excluding Zimbabwe
(Annual averagepercent)
(Percent ofGDP)
Inflation(left scale) Government balance
(right scale excludes grants)
These inflows represent a potential source of vulnerability as countries become increasingly dependent on potentially volatile private capital flows While the overall volatility of capital flows fell in the latter years in the sample the volatility of FDI has actually increased (Table 1)2 In addition for low income SSA countries in particular there has been a strong correlation between capital inflows and current account balances with inflows increasing as the current account improves and decreasing as the current account deteriorates magnifying the resulting swings in the overall balance of payments (Figure 6) On the other hand the surge in private capital inflows has contributed to a steady increase in international reserves of SSA countries providing these countries with increased scope to finance balance of payments deficits
MeanStandard Deviation Volatility Mean
Standard Deviation Volatility
Total inf low 198 45 44 522 243 21FDI 124 50 25 186 42 45Portfolio 13 07 19 177 131 14Private deb 61 05 132 158 88 18Source IMF African Department database 2008
Table 1 Private Capital Flows Volatility2000-03 2004-07
2 An important factor in the increase in FDI volatility seems to be a fairly large movement in FDI in South Africa in 2005-2006
8
Figure 4 Recipients of Private Capital Flows
Fig 4c Share of Portfolio and Debt Flows 2000-03(percent of total)
South Africa 231
Kenya 74
Ethiopia 68
Ghana 68Congo Dem Rep of 63
Other SSA 496
Fig 4d Share of Portfolio and Debt Flows 2004-07(percent of total)
South Africa 728
Nigeria 56
Ghana 22
Angola 20
Kenya 17
Other SSA 157
Fig 4a Share of FDI Inflows 2000-03
South Africa 273
Nigeria 168
Angola 165
Equatorial Guinea 58
Chad 50
Other SSA 285
Fig 4b Share of FDI Inflows 2004-07
Nigeria 343
South Africa 155Equatorial Guinea
102
Tanzania 32
Congo Republic of 29
Other SSA 338
Figure 5 Top Ten Recipients of Private Capital
F ig 5 a T o t a l In f l o w s( m i l l io n s o f U S d o l la rs )
A n g o la
K e n ya
C h a d
T a n z a n ia
S o u th A f r ic a
N ig e r ia
E q u a t o r ia l G u in e a
G h a n a
C o n g o D e m R e p o f
E t h io p ia
0 5 0 0 0 1 0 0 0 0 1 5 0 0 0 2 0 0 0 0
F i g 5 b I n fl o w s t o G D P( p e r c e n t)
C h a d
S e yc h e l le s
C o n g o R e p u b l ic o f
S atilde o T o m eacute amp P r iacute n c i p e
A n g o l a
E q u a t o r ia l G u in e a
G a m b ia T h e
C a p e V e rd e
C o n g o D e m R e p o f
G u in e a - B i s s a u
0 5 1 0 1 5 2 0 2 5 3 0 3 5
F ig 5 c In f lo w s to P o p u la ti o n( r a ti o )
A n g o la
G a b o nC o n g o
R e p u b l ic o fC a p e V e r d e
N a m ib ia
B o t s w a n a
S o u t h A fr i c a
M a u r i t i u sE q u a t o r i a l
G u in e aS e yc h e l le s
0 5 0 0 1 0 0 0 1 5 0 0 2 0 0 0
Note All rankings based on averages for 2000-07 Source African Department data base and IMF staff calculations
9
Figure 6 External Vulnerability
Fig 6a Low-income African Countries Current Account Balance and Capital Inflows 2000-07
0
100
200
300
400
500
600
700
800
900
2000 2001 2002 2003 2004 2005 2006 2007-14
-12
-10
-8
-6
-4
-2
0
Capital Flowsleft axis
Current Account Balanceright axis
Fig 6b Oil Producers Current Account Balance and Capital Inflows 2000-07
0
500
1000
1500
2000
2500
2000 2001 2002 2003 2004 2005 2006 2007-20
-15
-10
-5
0
5
10
Capital Flowsleft axis
Current Account Balanceright axis
Fig 6c Low Income Africa Countries International Reserves and Capital Flows
0
100
200
300
400
500
600
700
800
900
2000 2001 2002 2003 2004 2005 2006 200700
02
04
06
08
10
12
14
16
Reservesright axis
Capital flowsleft axis
Fig 6d Oil Producers International Reserves and Capital Flows
0
500
1000
1500
2000
2500
2000 2001 2002 2003 2004 2005 2006 20070
2
4
6
8
10
12
Capital Flowsleft axis
Reservesright axis
III DETERMINANTS OF PRIVATE CAPITAL FLOWS TO SSA
This section investigates the determinants of private capital flows to sub-Saharan Africa during 2000-2007 with particular focus on the role of domestic capital market development Capital flows to sub-Saharan Africa particularly portfolio flows have been concentrated in a relatively small number of countries with relatively sophisticated financial markets In these countries capital has flown into equities where the stock market was sufficiently developed (eg Kenya Nigeria) government bonds in countries that had sovereign issues (Botswana Ghana) and short-term government securities (Uganda Tanzania and Zambia) when few other investment vehicles open to non-residents were available The availability of investment instruments appears to have dominated the existence of capital controls For example in Tanzania legal loopholes allowed international investors to purchase significant amounts of government securities although in principle foreigners were not allowed to hold government debt (IMF 2008)3
3 Nevertheless targeted capital controls as in Ghana appear to have been successful in developing the longer end of the market for government debt
10
We use a new indicator of capital market development in sub-Saharan Africa that captures the structure of capital markets Capital markets along with money foreign exchange and derivatives markets form part of a countryrsquos ldquoessential financial marketsrdquo (Stone et al 2008 Lukonga forthcoming) In particular we consider government securities markets both for treasury bills and treasury bonds as well as corporate bond markets and equities markets (see Lukonga forthcoming) We construct a simple index which is the sum of four dummy variables taking the value of 1 if the market in question exists and is well-developed The index covers all sub-Saharan African countries except Somalia Using this index simple tabulations show that the average level of financial market development is fairly low in sub-Saharan Africa with only 10 countries or 21 percent of the sample countries having complete capital markets (Table 2)4 However as discussed earlier these countries are also among the largest recipients of private capital inflows in sub-Saharan Africa along with a few oil exporters (Angola Congo Chad and Equatorial Guinea) While the role of institutional development in attracting international capital flows has been emphasized in recent studies very few have attempted to isolate the role of financial versus basic property rights institutions The measures of financial market development used in the literature and that would be available for low-income countries such as ratios of money and credit to GDP have their limitations They measure outcomes such as the ability of the financial (mostly banking) sector to provide transaction services (in the case of the ratios of money or broad money to GDP) or the capacity of the banking system to channel savings rather than the extent of financial market development as measured by the availability of investment instruments Our empirical results detailed below indicate that along with other factors such as market size (particularly for portfolio inflows) and oil exporting status (particularly for FDI flows) the index of capital market development is a significant and robust determinant of international capital flows to sub-Saharan African countries
4 The countries are Botswana Ghana Kenya Namibia Nigeria South Africa Swaziland Tanzania Uganda and Zambia
11
Capital Markets
T-Bills T-BondsCorporate
Bonds Equities
Botswana X X X XGhana X X X XKenya X X X XNamibia X X X XNigeria X X X XSouth Africa X X X XSwaziland X X X XTanzania X X X XUganda X X X XZambia X X X XBenin X X X Burkina Faso X X X NCape Verde X X N XMauritius X X XMozambique X X X Zimbabwe X X XAngola X X N NCocircte dIvoire N X N XGambia The X X N NSenegal X X N Seychelles X X N NCameroon N N XCongo Dem Rep of X N N NEthiopia X N N NGuinea X N N NGuinea-Bissau X N N NLesotho X N N NMadagascar X N N NMalawi X N N Rwanda X N N NSierra Leone X N NTogo X N Burundi N N NCentral African Republic NChad N N N NComoros N N N NCongo Republic of N N N NEquatorial Guinea N N N NEritrea N N NGabon N N N NLiberia N N N NMali N N NNiger N Satildeo Tomeacute and Priacutencipe N N N N
Sources Lukonga (forthcoming) and authors calculationsNotes X denotes that the market is fairly or very well developed denotes that the market nominally exists or is partially developedN denotes that the market does not exist
Table 2 Capital Market Development in Sub-Saharan Africa
12
A Recent Literature
The starting point of much of the recent literature on determinants of capital flows has been an attempt to explain the Lucas Paradox or why private capital doesnrsquot seem to flow from rich to poor countries Standard neoclassical theory predicts that capital should flow from capital-rich countries (with low marginal productivity of capital) to capital-scarce countries (with a high marginal product of capital) In practice however the bulk of observed flows particularly in the modern period consists of flows among developed economies Compared to the early 20th century era of financial globalization the current wave of capital flows is characterized by massive diversification of flows between high-income economies and a relative marginalization of less-developed economies (Obstfeld and Taylor 2004 Schularick 2006 and Schularick and Steger 2008) Some authors posit that the paradox is due to country-specific fundamentals that tend to lower the marginal product of capital in developing countries such as missing factors of production including human capital poor economic policies and poor institutions (Alfaro Kalemli-Ozcan and Volosovych 2005a and 2005b Faria et al 2006 Faria and Mauro 2004 Schularick and Steger 2008) In this vein a recent study shows that the extent of domestic financial market development and the quality of domestic financial institutions has played a significant role in attracting capital flows to emerging markets (IMF 2007) The second set of explanations centers around international capital market imperfections such as asymmetric information sovereign risk and capital controls For example Portes and Rey (2005) find that informational frictions proxied by geographic distance affect the amount and direction of capital flows and Lane (2004) also finds that credit market frictions are a determinant of debt flows in 1970-1995 The studies that focus on the role of institutions in attracting foreign private capital highlight the importance of basic institutions particularly property rights protection Weak property rights owing to poor quality institutions affect entrepreneursrsquo investment decisions Risks of expropriation armed conflict and malfunctioning legal systems all have a potentially negative impact on the returns from those investments Empirically property rights institutions have been proxied by an index derived from the Kaufman Kray and Mastruzzi World Governance IndicatorsWGIs or by an index derived from the ICRG indicators 5 Using those proxies better quality institutions are found to be positively and significantly correlated with foreign equity flows (Alfaro et al 2005a 2005b) and with a higher share of equity in a countryrsquos total stock of external liabilities (Faria and Mauro 2004 and Faria et al 2006) 5 The ICRG composite index aggregates over several dimensions such as government stability investment profile internal and external conflict non-corruption law and order protection from religious and ethnic tensions non-militarized politics democratic accountability and quality of bureaucracy (wwwprsgroupcom) Similarly the WGIs measure countriesrsquo score according to 6 governance dimensions namely voice and accountability political instability government effectiveness regulatory burden rule of law and control of corruption (wwwworldbankorgwbigovernancegovdata)
13
As mentioned earlier few studies focus on the role played by the extent of domestic financial market development in attracting international capital flows While the literature tends to link capital flows (financial globalization) to improvements in domestic financial systems (eg Chinn and Ito 2005 2002 Mishkin 2006) in principle the direction of causality is not clear Chinn and Ito (2005) and Klein (2005) find empirical evidence supporting the notion of a threshold effect financial openness contributes to equity market development only when a threshold level of general development of legal systems and financial development is attained However although property rights and financial institutions could potentially affect capital flows differently no study of the determinants of capital flows has empirically attempted to properly disentangle the effects of both Ju and Wei (2007 2006) develop theoretical models showing that financial institutions and property rights institutions can have different effects on capital flows Whereas an inefficient financial system can be bypassed by international capital flows as they could come in the form of FDI instead of portfolio and debt flows high expropriation risk cannot be bypassed Conversely the stronger domestic property rights the more the country will benefit from international capital flows
B Estimation strategy and Model
Cross-country regressions have been found appropriate to investigate the fundamental (and thus slow-moving) determinants of why some countries attract more inflows or more of a certain type of inflows than other countries In particular we are interested in testing whether financial institutions have a separate and different effect on capital inflows than property rights institutions That effect may also differ depending on the type of capital flows Empirically Acemoglu and Johnson (2005) show that property rights and contractingfinancial market development institutions do affect economic outcomes differently While property rights institutions have a first order effect on economic outcomes such as long-run GDP growth investment rates and financial depth contracting institutions seem to mostly affect the degree of financial market development As others we use instrumental variables to tackle the issue of reverse causality and endogeneity associated with the measures of institutions (Acemoglu and Johnson 2005 Alfaro Kalemli-Ozcan and Volosovych 2005a and 2005b DellrsquoAriccia et al 2008 Faria et al 2006 Faria and Mauro 2004) Building on the recent literature the reduced-form linear equation to be estimated is
iiiii uCPFK +sdot+sdot+sdot+= χβαμ (1) Where iK is log of average inflows to country i iF is a measure of financial institutions and iP a measure of property rights iC is a set of exogenous control variables and iu is an independent error term α β and γ are coefficients capturing the impact of financial development property rights institutions and other controls on capital flows where α and β are of particular interest and μ is a constant
14
Given that the measures of financial and property rights institutions are endogenous simple OLS estimates of equation (1) will be biased As indicated in Acemoglu and Johnson (2005) the α and β coefficients may capture reverse causality or the effect of some other omitted characteristic Second as financial market development and property rights are measured with error there may be a downward attenuation bias and finally if contracting and property rights institutions are correlated the effect of the type of institution that is measured with greater error will load onto the other variable Following Acemoglu and Johnson (2005) the estimation strategy therefore relies on estimating equation (1) with two-stage least squares (2SLS) using valid and separate instruments for financial and property rights institutions The two first stage equations will thus be of the form
iiiii CELF 11111 εχηδν +sdot+sdot+sdot+=
iiiii CELP 22222 εχηδν +sdot+sdot+sdot+= (2) Where iL and iE are instruments for financial institutions and property rights institutions respectively The key exclusion restriction is that Cov( iu iL ) = Cov ( iu iE ) =0 iu being the error term in the second-stage equation (1)
C Empirical Analysis This study utilizes a unique data set on capital inflows to SSA prepared by the staff of the International Monetary Fund described in Appendix I Choice of variables The following set of variables was chosen to estimate equations (1) and (2) (see Appendix II for definitions and sources Descriptive statistics are presented in Appendix III Table 1 bull Financial institutions are proxied by the simple index of capital market development
described earlier (Lukonga forthcoming) The more developed capital markets the higher capital flows
bull Property rights institutions are proxied by the rule of law score from the World Governance Indicators (Kaufmann Kray and Mastruzzi 2008) Among the six governance dimensions used by Kaufmann et al 2008 this is the closest proxy for property rights protection6 Better property rights protection should lead to higher capital flows
6 Various other proxies for property rights institutions exist and have been used in empirical studies Faria et al (2006) and Faria and Mauro (2004) use the simple average of KKMrsquos governance indicators for a single year Alfaro et al use the ICRG score (2005a 2005b) Acemoglu and Johnson (2005) and Acemoglu Johnson and
(continuedhellip)
15
bull Following Acemoglu and Johnson (2005) we use British legal origin as the instrument for financial market development taken from La Porta et al (1999) Acemoglu Johnson and Robinson 2002 Glaeser and Schleifer 2002 and La Porta et al1999 show that in the case of former European colonies legal origin is a valid instrument for contracting institutionsfinancial market development and property rights respectively Legal origin is shown to be positively and significantly associated with financial institutions with civil law countries exhibiting lower financial development than common law countries (Glaeser and Schleifer 2002 La Porta et al 1999)
bull The instruments for property rights institutions are the degree of ethno linguistic fragmentation and the countryrsquos latitude taken from La Porta et al (1999) which have been found to be associated with worse property rights and regulations7 Acemoglu and Johnson 2005 Acemoglu Johnson and Richardson (2002) Faria et al 2006 and Faria and Mauro 2004 use settler mortality in 1500 or population density in 1500 and show that they are valid instruments for property rights institutions For sub-Saharan African countries however settler mortality and population density in 1500 are available only for a subset of countries (Acemoglu and Johnson 2002)8 Given the better country coverage we have chosen to proceed with ethno linguistic fragmentation and latitude
bull A dummy variable to control for oil-exporting countries (the dummy variable takes the value of 1 if the country is an oil exporter) Oil-exporting countries attract more FDI other things equal
bull A dummy variable to control for market size (the dummy variable takes the value of 1 if the country is South Africa or Nigeria) Larger and more sophisticated economies attract more capital flows
Similar studies also include a number of additional explanatory variables though it is more difficult both to argue that they are exogenous and to find valid instruments for them We use these variables in our baseline regression
bull Human capital proxied by the share of secondary school enrollment in the population from the WDI This variable features in explanations of the Lucas Paradox that focus on missing factors of production (Alfaro et al 2005a 2005b) The expected impact of higher human capital on capital flows is expected to be positive
Robinson (2002) use average protection against expropriation risk and constraint on the executive as measures of property rights but these measures are not available for a sufficiently large number of our sample countries 7 La Porta et al (1999) however note that the adverse effects of ethno linguistic fractionalization on government performance tend to disappear when controlling for per capita income and latitude except for public good provision and state-owned enterprises This can be interpreted as countries with a large public enterprises sector tend to have less regard for private enterprises and private property rights 8 Robustness checks using population density in 1500 as an instrument yield results that are consistent with those obtained with ethno linguistic fragmentation (results not shown)
16
bull A measures of de jure capital account openness proxied by the Chinn-Ito measure of capital account openness based on the IMFrsquos AREAER (Chinn and Ito 2007) We use the average value of the Chinn-Ito variable for sub-Saharan African countries over 1999-20059 The effect of capital account openness on capital flows is expected to be positive
bull A measure of trade openness proxied by the sum of exports and imports over GDP Particularly at an initial stage capital mobility develops around greater openness to trade flows Arguably countries that are more open to trade may also be politically more open to greater integration with the rest of the world
bull Macroeconomic performance proxied here by the real GDP growth rate In a panel study of 47 industrial and emerging countries IMF (2007) find that expected macroeconomic performance proxied by lagged real GDP growth is a significant determinant of private capital inflows IMF (2008) similarly finds that real GDP growth and lower fiscal deficits are significantly correlated with higher private capital inflows Alfaro (2005b) uses inflation volatility as a proxy for macroeconomic performance However it is difficult to establish causality as inflows directly affect macroeconomic outcomes (also see below) Further macroeconomic outcomes have been shown to be shaped by institutions making it difficult to study the independent effect of institutional development on capital flows
Correlations Appendix Table III2 shows pairwise correlations between different measures of capital flows while Appendix Table III3 shows the pairwise correlations corresponding to the baseline regressions and Appendix Table III4 focuses on the pairwise correlations of the institutional variables and the instruments
Appendix Table III2 indicates that for our sample the choice of scaling variable affects the pairwise correlations of the inflows with the independent variables This confirms the impression from Figure 5 above that the picture of the allocation of private capital inflows across sub-Saharan countries is very different whether one looks at overall volume of inflows or at the size of the inflows relative to a countryrsquos population or GDP Whereas total inflows as a share of population or GDP will be the variable of interest when studying the economic impact of the inflows on individual countries (see Section IV below) the investigation of the factors determining the allocation of private capital flows to sub-Saharan Africa across the
9 Unlike many other studies that use the simple average of the four dummy variables or the dummy on capital account restrictions (Alfaro et al 2005a 2005b IMF 2007b) the Chinn-Ito measure attempts to capture the intensity of the capital controls by incorporating all the restrictions in the index using a principal components approach Whereas the other restrictions are not directly related to capital account restrictions they are taken as indicative of the overall restrictiveness of the regime The advantage of this measure over other more detailed indices that capture the intensity of capital controls (Quinn 1997 2003 Miniane 2004 Schindler 2009) is its near universal country and extended time coverage 181 countries between 1970 and 2005
17
continent should focus on the total volume of inflows A simple explanation is that private investors are more likely to decide on allocating specific amounts of money to various markets or projects than to fix investment limits relative to a countryrsquos population or GDP Therefore for the remainder of this section the variable of interest will be the log of private capital inflows and their components FDI on the one hand and portfolio and debt flows on the other averaged over 2000-2007 for each sub-Saharan African country excluding Somalia and Zimbabwe Looking at the potential determinants of private capital flows to SSA and their composition in Appendix Table III2 (columns 1-4) overall inflows as well as portfolio and debt inflows are correlated with the index of financial sector development secondary school enrollment the market size dummy variable and the log of initial GDP per capita There are however interesting variations for the determinants of FDI flows to which GDP per capita and secondary school enrollment are not significantly correlated but the proxy for property rights and the dummy for oil producers are The measure of trade openness and the Chinn-Ito capital openness variable are never significantly correlated with private inflows or their components However capital account openness is correlated with the degree of financial sector development as in Chinn and Ito (2005) and with secondary school enrollment
Appendix Table III3 illustrates the challenges associated with finding truly exogenous determinants of private capital flows and their composition as a number of potential explanatory variables are correlated with each other In particular the measure of financial market development is highly correlated with the proxies for property rights institutions as discussed above Further educational achievement is significantly correlated with the institutional quality variables and economic development This is not surprising as it can be understood as an outcome of good institutions and higher degree of economic development This strong degree of endogeneity and the fact that we are interested in disentangling the impact of institutions on capital inflows argues that like the variables capturing macroeconomic performance it is probably not a useful explanatory variable given our focus on the impact of institutions per se on capital inflows The same holds true for the proxy for economic development log of GDP per capita in 2000 (Alfaro et al 2005b show that log real GDP per capita has no additional explanatory power once a measure of institutional quality is introduced)
The pairwise correlations of the potential instrumentsmdashBritish legal origin population density in 1500 and ethno linguistic fragmentationmdashwith the institutional variables and with the capital flows variables are encouraging for the instrumental variables approach (Appendix Table III4) The potential instruments for property rights institutions are uncorrelated with the inflows variables but are significantly correlated with the property rights proxies Although British legal origin is significantly correlated with total inflows in addition to financial institutions it is not correlated with property rights nor its potential instruments
18
Regression results
Table 3 presents the results of simple OLS estimations of various specifications of equation (1) as a benchmark The coefficient on the financial market development index is positive and significant and robust across all specifications For portfolio and debt flows it is even the only variable that is significant maybe highlighting the particular importance of capital market development for non-FDI flows The coefficient on property rights institutions (rule of law score) is never significant and has the wrong sign The coefficients on the controls for country size and oil exporters are large and generally significant but while oil exporters do receive more FDI than other countries they do not have any particular advantage with portfolio and debt inflows Real GDP growth is the only other variable that is significant for total inflows and FDI However as discussed earlier real GDP growth is not exogenous and to study the impact of institutions further we use the specification in column (3) as our baseline The log of real GDP per capita in 2000 secondary enrollment and capital account and trade openness are never significant10 The results obtained are similar when breaking the sample into two sub-periods capturing the period before and after the acceleration of private capital inflows This is not surprising considering that the determinants of inflows are fairly slowly-moving country characteristics They are also robust to excluding South Africa and Nigeria indicating that the results are not driven by the two largest recipients and to excluding all oil exporters (Results available upon request) Indeed the impact of financial market development on inflows is even larger in both cases
(1) (2) (3) (4) (5) (6) (7) (8) (1) (2) (3) (4) (1) (2) (3) (4)Financial Institutions 050 056 052 055 056 058 056 057 067 063 055 057 055
(-346) (586) (548) (544) (565) (527) (603) (536) (499) (343) (348) (322)Rule of Law -021 -033 -041 -027 -028 -033 -037 -003 -010 -020 -018 -052 -058
(-056) (-114) (-136) (-070) (-085) (-112) (-129) (-008) (-025) (052) (-046) (-124) (-131)South Africa and Nigeria 185 187 198 189 179 158 135 137 211 212
(168) (170) (121) (160) (161) (137) (134) (137) (160 (160)Oil Exporters 161 101 162 168 160 164 267 194 051 012
(314) (190) (304) (276) (308) (306) (441) (367) (078) (014)Real GDP growth
011 014 007(326) (304) (127)
Secondary Enrollment -000
(-028)Log 2000 per capita GDP -05
(-032)Capital Account Openness -06
(-06)Trade Openness
-001(-202)
Constant 447 522 379 335 392 413 374 441 342 442 268 216 345 430 288 260(-125) (2317) (1146) (966) (836) (398) (1015) (867) (713) (1956) (635) (477) (900) (1361) (482) (410)
Observations 43 43 43 43 42 43 43 43 43 43 43 43 43 43 43 43R-squared 026 001 057 062 057 057 058 059 022 000 055 059 025 000 042 044F-Statistic 1196 031 1200 1581 878 946 941 1532 1197 001 1289 1406 1176 021 545 493
Source Authors calculations
Note and indicate significant at 1 5and 10 percent t-Statistics are reported in parentheses Robust standard errors
Table 3 Baseline OLS Estimation ResultsTotal Inflows FDI Inflows Portfolio amp Debt Inflows
10 A recent study finds that as is the case for low-income countries de jure financial integration is fairly low for sub-Saharan Africa compared to other regions Capital control regulations tend to be complex and nontransparent and limited capacity to monitor capital flows can lead to inconsistent implementation Inconsistencies between different regulations have also made capital controls easy to circumvent This may explain the difficulties in establishing an empirical relation between capital controls and capital flows in the region (IMF 2008)
19
Table 4 presents the results of the 2SLS estimation The first stage equations are shown in Panel A and the second stage in Panel B Columns (1) and (2) report results using Ethno linguistic fractionalization as the instrument for property rights institutions and columns (3) and (4) using latitude Given the very low R-squared obtained in the latter case corresponding results are not shown for the components of the inflows Starting with the first-stage regressions British legal origin is shown to have a strong positive and significant impact on financial development but not on the rule of law while the instrument for property rights has a stronger and mostly significant impact on property rights (greater ethno linguistic fragmentation has a negative impact on rule of law as does closeness to the Equator) than on financial institutions Market size has a positive and significant impact on capital market development and oil exporting status has a negative and significant impact However market size is negatively related to rule of lawalthough this is likely to be mainly because of the relatively low ratings of Nigeria and South Africa regarding property rights protection Oil exporting status is also negatively related to rule of law a result attributed to the rent-seeking culture that appears to take hold in resource-rich countries (Auty 2001 Auty and Gelb 2001 Karl 1999 1997)
(1) (2) (3) (4) (1) (2) (1) (2) (1) (2)
Financial Institutions042 022 061 062 061 051 032 001 006 011(200) (097) (211) (134) (264) (214) (137) (004) (148) (259)
Rule of Law -101 -035 -225 -231 -096 025 -043 -020 -009 010(-092) (-028) (-198) (-160) (-082) (020) (-034) (-012) (-047) -041
South Africa and Nigeria 277 076 196 380 -037
(205) (039) (149) (241) (-195)Oil Exporters 115 067 265 -060 054
(157) (090 (298) (-006) (332)Constant 396 443 275 255 272 318 359 414 032 030
(430) (448) (233) (157) (287) (379) (348) (334) (188) (170)Observations 42 42 43 43 42 42 42 42 42 42R-squared 028 047 005 007 025 053 024 024 NA 012
British Legal Origin 181 148 188 155 181 148 181 148 181 148(408) (291) (419) (295) (408) (291) (408) (291) (408) (291)
Instrument for Rule of Law1 060 069 031 084 060 069 060 069 060 069
(097) (107) (024) 063) (097) (107) (097) (107) (097) (107)South Africa and Nigeria 145 158 145 145 145
(260) (295) (260) (260) (260)Oil Exporters -085 -074 -085 -085 -085
(-210) (-193) (-210) (-210) (-210)Constant 078 092 106 116 078 092 078 092 078 092
(188) (229) (394) (423) (188) (229) (188) (229) (188) (229)Adj R-squared 032 034 031 033 032 034 032 034 032 034
British Legal Origin 031 034 023 023 031 034 031 034 031 034(166) (161) (121) (121) (166) (161) (166) (161) (166) (161)
Instrument for Rule of Law1 -068 -053 143 148 -068 -053 -068 -053 -068 -053
(-211) (-157) (122) -163 (-211) (-157) (-211) (-157) (-211) (-157)South Africa and Nigeria -065 -058 -065 -065 -065
(-336) (-278) (-336) (-336) (-336)Oil Exporters -033 -048 -033 -033 -033
(-183) (-225) (-183) (-183) (-183)Constant -036 -038 -096 -086 -036 -038 -036 -038 -036 -038
(-150) (-154) (-591) (-514) (-150) (-154) (-150) (-154) (-150) (-154)Adj R-squared 010 017 008 019 010 017 010 017 010 017
Source Authors calculations
Financial Institutions Financial Institutions Financial Institutions
Table 4 Instrumental Variables Estimation ResultsPortfolio Inflows
Panel A Second-Stage Regressions
Panel B First-Stage Regressions
Rule of Law
Note and indicate significant at 1 5and 10 percent t-Statistics are reported in parentheses Robust standard 1 In columns (1) and (2) the instrument for rule of law is ethnolinguistic fractionalization In columns (3) and (4) the instrument is latitude
Total Inflows FDI Inflows
Rule of Law Rule of Law
Share of FDI
Financial Institutions
Rule of Law
20
Comparing the second-stage equations with the OLS estimates the impact of financial institutions is overall weaker (smaller coefficients) but remains strong and significant for total inflows and FDI inflows as well as the share of FDI in total inflows Interestingly the property rights variable is never significant and continues to have the ldquowrongrdquo sign in most cases except for FDI inflows and the share of FDI (column 2) perhaps indicating that non-FDI investors believe property rights are not critical for their relatively liquid investments Oil resources is a strong determinant of FDI inflows but not other types of flows whereas it is market size that seems to matter for portfolio and debt inflows When excluding South Africa and Nigeria or oil-rich countries from the estimation results are broadly similar with the coefficient on financial institutions larger particularly in the FDI regressions This indicates that in non-oil sub-Saharan African countries excluding South Africa FDI inflows are significantly larger the more financial markets are developed Perhaps surprisingly property rights protection is insignificant This may be explained by the fact that as FDI is harder to expropriate even countries with poor property rights protection receive FDI Alternatively for these relatively small countries it may be possible for foreign investors to effectively negotiate greater property rights for their FDI than is generally available in the country for other investors Given the small sample size the results must be interpreted with caution but overall they support the importance of unbundling institutions and measuring them more precisely Results also support the notion that for capital flows financial institutions as proxied by capital markets development matter more than basic property rights institutions capital including in the form of FDI will flow less to countries with less developed financial markets against the view presented in Albuquerque (2003) that FDI should flow more to financially constrained countries
IV DO PRIVATE CAPITAL FLOWS HAVE AN IMPACT ON GROWTH IN SSA This section undertakes a preliminary analysis of the relationship between capital inflows and growth in sub-Saharan Africa Significant capital flows to African countries are a relatively recent phenomenon and as noted above have so far been restricted to a limited number of markets Given the general inconclusiveness of the empirical evidence on the links between growth and capital flows from emerging markets that have been on the radar of international investors much longer than most African markets it is perhaps too early to expect robust econometric results with the particular sample in this paper While it is easy to make a theoretical case for the positive impact of capital flows on growth the empirical verification of this impact has proved much more challenging11 Alternate
11 See Edison and others 2004 Kose and others 2006 DellrsquoAricia and others 2008 and Prasad Rajan and Subramanian 2007 for comprehensive reviews of the empirical literature on the impact of capital flows Though evidence from empirical studies using aggregate data is inconclusive studies that use measures of de facto
(continuedhellip)
21
explanations to this empirical puzzle have predicated the gains from capital flows on the threshold development of certain domestic institutions andor proposed that such flows generate certain indirect or collateral benefits even when their direct impact on growth is difficult to gauge Klein (2005) finds support for a model in which institutional quality intermediates the impact of capital account liberalization on growth by affecting the extent to which savings are protected from expropriation and the premium borrowers pay for funds from abroad In countries with better institutions capital account openness has a significant positive impact on growth Bekaert Harvey and Lundblad (2005) find that the largest growth response to equity market liberalizations accrues to countries with better legal systems above-average financial development and better-quality institutions in terms of investor protection and accounting standards Using industry-level data Prasad Rajan and Subramanian (2007) indicate that for countries that have above-median levels of financial development foreign capital aids the relative growth of those industries dependent on finance But for countries below the median for financial development the effect of foreign capital inflows is diametrically opposite Using firm-level data Alfaro and Charlton (2007) find a significant relationship between entrepreneurial activity and both de jure and de facto international capital integration Their results suggest that foreign capital may improve access to capital either directly or through improved domestic financial intermediation
Recent evidence however indicates that countries that grow more rapidly are those that rely less and not more on foreign capital and in turn foreign capital tends to flow to countries that experience not high but low productivity growth (Prasad Rajan and Subramanian (2007) Gourinchas and Jeanne (2007)) One possible explanation for this puzzle is trade fast-growing countries also are the ones that experienced a takeoff in their export sector (Gourinchas and Jeanne 2007) If capital inflows lead to higher prices for nontraded goods owing to absorptive capacity constraints and thus to overvaluation they will have a negative impact on exports and hence growth (Kose and others 2006 Prasad Rajan and Subramanian 2007) Another explanation is that inflows from abroad that supplement domestic savings will have a limited impact in an economy where the binding constraint is the scarcity of viable investment opportunities (Rodrik and Subramanian 2009)
We estimate the gains from financial globalization using the same cross-section sample of average flows for the 2000-07 period as in the preceding section However in this section we also make use of data on net flows For most African countries the differences between net and total capital flows are not often vast nevertheless the economic impact of such flows depends on the actual infusion of foreign capital rather than gross flows Also we scale net flows to the size of the economy by alternatively dividing them by population or GDP
integration or finer measures of de jure integration tend to find more positive results Studies using micro data are also better able to find growth and productivity gains from financial integration
22
A Correlation Analysis
We begin the correlation analysis with a simple mapping between economic growth and capital flows in sub-Saharan Africa while not drawing any inferences about the direction of causation
12 The scatter plots indicate a generally positive correlation between growth and capital flows in our sample13 Consistent with the findings in the literature the relationship is more pronounced when only FDI flows are considered
Figure 7 Sub-Saharan Africa Capital Flows and Real GDP Growth
Capital Flows and Real Growth(net total flows to population)
-600
-500
-400
-300
-200
-100
0
100
200
300
-2 0 2 4 6 8 10 12 14
Capital Flows and Real Growth(net total flows to GDP)
-15
-10
-5
0
5
10
15
20
25
30
-5 0 5 10 15 20 25
FDI and Real Growth(net FDI to population)
0
20
40
60
80
100
120
140
160
180
-2 0 2 4 6 8 10 12 14
FDI and Real Growth(net FDI to GDP)
-5
0
5
10
15
20
25
30
-5 0 5 10 15 20 25
Note All variables are the average value of the 2000-07 period Where normalized over population the charts exclude the outliers Equatorial Guinea and Seychelles Table 5 provides further evidence of the positive significant correlation between capital flows to sub-Saharan Africa and real GDP growth in the recipient countries This relationship however does not hold when capital flows are disaggregatedmdashwhile FDI is positively correlated with growth portfolio and debt-creating flows are generally inversely related to growth though
12 As mentioned in the previous section in analyzing the relationship between growth and capital flows the latter are normalized over either the population or GDP of the recipient country All variables are considered at their average values over the 2000-07 period to deal with annual volatility 13 This is in contrast with Rodrick and Subramanian (2008) who in a sample of 110 developing countries running through 2004 do not find any relationship between financial globalization (measured as the sum of foreign assets and liabilities as a share of GDP) and growth
23
not significantly so This finding is also consistent with evidence from other studies(DellrsquoAricia and others 2008)
B Testing channels of transmission of private capital flows on growth Another approach to gauging the likely impact on capital inflows on growth is to test the various channels described in the literature on financial globalization and growth Three broad channels are identified as linking capital inflows and growth
bull Overvaluation to the extent that capital inflows cause currency appreciation they hurt exports and thus dampen growth This channel is well-documented in Rodrick (2007) but also discussed in Prasad et al (2007)
bull Savings and investment where foreign capital supplements domestic savings it fosters growth However this would only be true for economies where the main constraint on growth is a lack of savings Where the main hindrance to economic growth is the scarcity of viable investment opportunities additional foreign capital will only add to domestic distortions (Gourinchas and Jeanne 2007 Rodrick and Subramanian 2009)
bull Institutional development a number of studies argue that capital inflows carry indirect (collateral) benefits for recipient countries via the development of domestic institutions (Becker and others 2007 Kose and others 2006) or more particularly financial sector institutions (Mishkin 2006)
The testing methodology employed here utilizes correlations as well via bivariate regressions In the first stage the bivariate model regresses capital flows on the channel of interest If the first stage results indicate that the channel is significantly correlated with capital flows then in the second stage the model regresses the predicted value of the channel
Real GDP Growth
Net Total FlowsGDP
FDI FlowsGDP
Debt FlowsGDP
Portfolio FlowsGDP
Real GDP Growth 100Net Total FlowsGDP 038 100FDI FlowsGDP 066 054 100Debt FlowsGDP -002 072 -007 100Portfolio FlowsGDP -006 031 -010 002 100
Real GDP Growth
Net Total Flows per
capitaFDI Flows per capita
Debt Flows per capita
Portfolio Flows per capita
Real GDP Growth 100Net Total Flows per capita 037 100FDI Flows per capita 044 089 100Debt Flows per capita 008 053 022 100Portfolio Flows per capita -007 025 -001 -006 100Note indicates significant at 10 percentSource Authors calculations
Table 5 Correlations Net Capital Flows and Real Growth
24
from the first regression ie that part of the channel variable correlated with capital flows on growth If the coefficient in the second regression is significant and with the expected sign it implies that the channel is likely to be operational for this particular sample of countries Evidence that a particular channel could be at work is not sufficient to demonstrate the impact of private capital flows on growth but it is a necessary first step Thus Yi = α1 + β Ki + u1 (1) gi = α 2 + η Ŷi + u2 (2) Where Yi is the channel variable of interest Ki are capital flows normalized over GDP or population gi is the real GDP growth rate and Ŷi is the predicted value of the channel variable of interest derived from the first regression All variables are in their level values so that sign and significance of β and η are of greater interest than their magnitude The results are presented in Table 6 below
Overvaluation InvestmentDomestic
Savings InstitutionsNet flowsGDP -0004 0164 0337 -0214Net flows per capita -000003 0012 0021 -00042Note and indicate significant at 1 and 5 percent respectivellySource Authors calculations
Table 6 Channels of Transmission Between Capital Flows and Growth
The findings indicate that in most instances capital flows are not significantly correlated with the channel variables in our sample Except when capital flows are scaled to the size of the recipient countryrsquos population mdash both savings and investment are positively and significantly related to capital flows in this instance14 This implies that for SSA countries the impact of private capital flows on growth could be partly intermediated through the impact of net capital flows on domestic savings and investment Another implication would also be that African economies are not necessarily investment-constrained15 14 As expected the impact of the predicted values of investment and domestic savings in the second stage regressions is positive
15 Rodrik and Subramanian (2009) define an economy to be savings-constrained when private investment is low despite the existence of many privately profitable projects because credit is either not available or too costly and to be investment-constrained when credit is available but there is a lack of profitable investment opportunities (p12) In savings-constrained economies foreign capital will supplement scarce domestic savings (evidenced by high real interest rates) and lead to increased investment In investment-constrained economies real interest rates will be low and additional capital flows will finance consumption rather than investment
25
In an unexpected outcome the institutional variable is negatively related to growth a result that holds even when oil-exporters are excluded from the sample (not shown)
C How do Private Capital Flows Affect Growth Going beyond bivariate correlations we first present a simple cross-country multivariate regression model making use of a averages for the 2000-07 period 16 Although this method is not without shortcomings the limited time coverage of our dataset and year-on-year volatility dampens the usefulness of panel estimation However our analysis is subject to the considerable limitations of the ordinary least squares estimator in growth models mdash especially those arising from endogenous variables We fit a simple ordinary least squares specification to estimate the relationship between capital flows and growth gi = α + β Ki + η Xi + ui Where gi is real GDP growth Ki are capital flows normalized over GDP or population Xi is a set of control variables and ui is an independent error term In our choice of control variables we are guided by the ldquochannelsrdquo analysis from the preceding section since our interest in primarily in the impact of capital flows on growth Thus our multivariate model is essentially a simultaneous test of the correlations between of the various channel variables (plus capital flows directly) and growth As discussed above other factors shown in the literature on financial globalization to influence growth include savings and investment exchange rate overvaluation and institutions The exchange rate overvaluation measure is constructed as the ratio of the nominal exchange rate to the purchasing power parity exchange rate17 The measure of institutions used here is the number of procedures to enforce a contract (Contracts) from the World Bankrsquos Doing Business database We also control for level of economic development by including the log of initial per capita real GDP growth The results are documented in Table 7
16 See Appendix Table IV1 and Appendix Table IV2 for summary statistics and correlations for the variables included here 17 More precisely the variable is the residual of a simple panel regression between the nominal exchange rate (local currency per US dollar) versus the PPP valuation of the exchange rate The regression was run for all countries in the world and the variable is normalized to be 1 for the world as a whole
26
[1] [2] [3] [4]Initial per capita GDP (log) -153 -186 -167 -216
(-311) (-403) (-362) (-415)Overvaluation -082 -153 -068 -125
(-045) (-084) (-038) (-068)Domestic savings 009 010 009 010
(339) (359) (361) (362)Investment 018 016 015 017
(333) (293) (258) (297)Contract enforcement 011 009 009 008
(164) (142) (153) (123)Net total flowsGDP 011
-194Net total flows per capita 0003
205Total inflowsGDP 018
(227)Total inflows per capita 0003
(147)Constant -106 412 054 629
(-013) (054) (007) (080)
Adjusted R2 051 052 053 057Number of observations 42 42 42 42Note and indicate significant at 1 5 and 10 percent respectivelly t-statistics in parenthesis
Table 7 Estimation Results Linear Growth Model with Capital Flows
The results indicate that capital flows are positively and significantly (in all but one instance) associated with growth Initial per capita GDP comes in with a negative and significant coefficient in all specifications indicating support for growth convergence Domestic savings and investment are the other significant right-hand side variables that also come in with the expected sign Contract enforcement the proxy for institutional development is not significant in any of the specifications Overvaluation has the expected sign but is never significant Estimating the equation with measures of net FDI instead of total net private capital yields similar results with an even stronger association between the FDI variable and growth Aside from the positive correlations and partial evidence of a possible through the savings-investment channel our analysis is rendered incomplete by the short time period since these inflows began While the limited number of observations in our sample required us to focus on average growth and inflows over the period 2000-2007 most of the inflows came late in this period This is an issue which requires further study as additional observations (years) become available As described in Section II the observed rise in private capital flows and growth during the sample period is an important necessary condition in particular because other studies even fail to uncover such an association for different country groups andor sample periods However it is also far from sufficient for making inferences about causality
27
V CONCLUSION
As a result of the global financial crisis and recession private capital flows to all regions of the world have declined Even when the international economy recovers and financial markets return to health it is likely that investors will remain for some time more risk-averse than they were previously At the same time donor flows to low-income countries including those in sub-Saharan Africa are likely to be adversely impacted by these global developments Our results were inconclusive regarding the impact of private capital flows on growth in SSA countries Additional research will be needed before a definitive statement can be made in this regard once additional observations are available However most SSA countries are likely to remain dependant on financial inflows in some form to help finance current account deficitsmdashdeficits that will be the counterpart of development-oriented investments in these economies As donor flows are likely to be restricted in the coming years due to the fiscal problems the traditional donor countries find themselves confronting SSA countries will need private capital flows to finance these current account deficits The alternative would require smaller or no current account deficits meaning reduced development-oriented investments in infrastructure and other key areas with adverse consequences for growth potential All this means that policy makers in SSA will need to pay increasing attention to efforts to attract private capital to their countries Our results indicate that one of the most important things policy makers can do to attract private capital is to strengthen domestic capital markets Deep and well-functioning money foreign exchange equity and (where relevant) derivative markets are key to attracting private capital Governments in SSA countries would be well-advised to redouble their efforts to develop and strengthen these markets to put their countries in a position to attract private capital in the future At the same time an important of the current financial crisis should also be to put in place strong monitoring regulatory and supervisory frameworks to avoid a buildup of balance-sheet vulnerabilities
28
Appendix I Capital Flows Data The information on private capital flows is based on detailed balance of payments data obtained from AFR country desk economists in late 2007 for 44 sub-Saharan African countries Data for 2000-2006 are actual and data for 2007 are preliminary estimates The data distinguishes between FDI portfolio (debt and equity) and private debt-creating flows and between inflows and outflows The definition of capital inflows adopted for this study differs from other papers using balance of payments data as a measure of capital flows (see Appendix Box I1 for precise definitions used in the paper) Appendix Box I1 Balance of payments recording of capital flows
From the perspective of the financial account one usually thinks of changes in liabilities as positive (inflows) and changes in assets as negative (outflows) In practice both changes in liabilities and assets are reported as net of any disinvestment and consequently both can have any sign In the BOP accounts an increase (decrease) in liabilities to nonresidents is entered as positive (negative) while an increase (decrease) in net foreign assets held by residents is entered as negative (positive) If a resident sells an asset held abroad the transaction is recorded as a reduction in net foreign assets held by residents bringing an inflow of capital For this study capital inflows (outflows) are taken to be the sum of increases (decreases) in liabilities to non-residents and of decreases (increases) in net foreign assets held by residents in a year This allows to capture all transactions that give rise to a inflow of capital into a country on the liability and asset side and avoids negative ldquoinflowsrdquo Net flows of capital are calculated as the sum of the inflows (positive sign) and outflows (negative sign)
This data differs from other published data sources with respect to its timeliness coverage and level of detail bull The 2000-2007 period covers the most recent episode of private capital inflows to
sub-Saharan Africa which took off around 2005-2006
bull It covers 43 sub-Saharan African countries
bull It allows to distinguish between different types of private capital flows (FDI portfolio flows and debt-creating flows) In contrast with other studies (eg Faria and Mauro 2004) that add together FDI and portfolio equity flows we keep them separate and group portfolio debt and equity (either category is too small to stand on its own) We are interested in the determinants of various types of flows particularly as regards the development of financial markets and straight FDI doesnrsquot require any particular type of financial market infrastructure However portfolio debt and equity investment require the existence of bond and equity markets
Other data sources that cover all sub-Saharan African countries include the IMFrsquos WEO IFS Balance of payments data and the World Bankrsquos global development finance data Another
29
widely used data base is the Lane-Milesi-Ferretti data but the most recent updated version goes until 2005 and covers only a sub-set SSA countries Another group of studies use current account data as a proxy for capital flows (Prasad et al 2007 Gourinchas and Jeanne 2007) ndash which have the advantage of providing wide coverage in terms of years and countries but make it impossible to disaggregate between official and private transfers and different types of capital flows The Fundrsquos World Economic Outlook (WEO) database and the World Bankrsquos Global Development Finance (GDF) database provide the most comprehensive coverage of capital flows to sub-Saharan countries These data sets have few missing countries and few missing observations for the countries that are in the data sets However the comprehensiveness of the WEO and the GDF databases is achieved at a price as each data set relies on Fund and Bank staff estimates to fill in the lacunae left from official statistics (Dorsey et al 2008) Other data sets such as the Fundrsquos International Financial Statistics and the Balance of Payments Statistics databases rely on official reporting without the use of staff estimates to fill in the gaps The more detailed and comprehensive coverage of the international transactions at the country level is available in the Balance of Payment Statistics published once a year by the IMF Although information for most of the sub-Saharan African countries is included in the publication the most recent database shows a complete set of annual data for just 18 out of 44 countries in the region mostly the middle-income countries two oil-exporters and the largest low-income economies among them The other countries have missing data either for the capital flows components or some years specially at the end of the period covered in the study which is crucial for the econometric analysis The work of the country desk economists was essentially to make sure that all series were available and the components were consistent with the main aggregates We checked also consistency across the different published databases finding discrepancies mostly in the last few years of the sample and few revisions to historical numbers in the early 2000rsquos for the countries with data in the various publications Looking into the World Economic Outlook database there is a full coverage of the countries in the region but it is difficult to separate actual figures from the forecasted ones or estimates (specially for countries with lags in reporting official data from the authorities) and programs with the Fund requiring accurate estimates on the missing BOP data embedded in the Program We used the WEO data which are also reported by country desk economist in the Fund as a starting point and asked the desk economists to look into the details and components that are normally not used in the aggregated analysis of the external accounts offered in the WEO studies and data In brief we have not created a separate database but rather taken the available information and refined it in a way that allows us to cover as many countries in the region as possible regardless of the size of the country and the level of development weighing properly in the model those countries with no capital flows (reporting zeros) and including those null figures as information in the dependent variable
30
Appendix II Variables Definitions and Sources
Variable Description Units Source
Net total flows FDI portfolio and debt net flows See below Billions of US$ IMF African Department database
Net FDI Net foreign direct investment flows (FDI in the reporting economy net of direct investment abroad)
Billions of US$ IMF African Department database
Net portfolio and debt flows Net private portfolio investment and other private flows Includes equity and debt securities as well as all other net private debt creating flows
Billions of US$ IMF African Department database
Total Inflows FDI portfolio and debt inflows See below Billions of US$ IMF African Department database
FDI Inflows Foreign direct investment in the reporting economy Billions of US$ IMF African Department database
Portfolio and debt inflows Portfolio investment liabilities including equity and debt securities liabilities plus other private capital inflows Includes all other private debt creating flows (Liabilities excludes monetary authorities and government)
Billions of US$ IMF African Department database
CPIA Country Policy and Institutional Assessment Composite index based on sixteen criteria grouped in four categories (i) economic management (ii) structural policies (iii) policies for social inclusion and equity and (iv) public sector management and institutions
1 to 7 World Bank
Financial Institutions Index of capital markets development defined as the sum of four dummy variables Treasury bills treasury bonds corporate bonds and equity markets exist
0 1 2 3 4 with 0 for countries without any market to 4 for countries with all four markets present
Lukonga (forthcoming) and authors calculations
Rule of law The extent to which agents have confidence in and abide by the rules of society and in particular the quality of contract enforcement the police and the courts as well as the likelihood of crime and violence One of the six components of the Governance Indicators
-25 (lower score) to 25 for the highest score
httpinfoworldbankorggovernancewgiindexasp
South Africa and Nigeria Dummy variable 1 for South Africa and Nigeria 0 otherwise 0 1 Authors calculations
Oil exporters Dummy variable 1 for Angola Cameroon Chad Congo Rep of Equatorial Guinea Gabon and Nigeria 0 otherwise
0 1 IMF African Department database
Real GDP growth Real GDP growth Calculated as the percent change of the constant Gross domestic product in 2000 local currency units Measure of quality of macroeconomic policies
Percent IMF World Economic Outlook
Secondary enrollment Total enrolment in secondary level of education regardless of age expressed as a percentage of the population in the official age group corresponding to this level of education
Percent World Bank World Development Indicators
2000 per capita GDP Per capita GDP in constant US dollar for the year 2000 Constant 2000 US dollars IMF World Economic Outlook
Capital account openness De jure capital account openness index as the simple average of four dummy variables representing exchange rate arrangements payments restrictions on current and capital transactions and
t i ti i t f t di A l f
Index Chinn-Ito forthcoming
Trade openness Sum of exports and imports of goods and non-factor services over GDP
Percent of GDP IMF World Economic Outlook
British legal origin Dummy variable that takes the value 1 for former British colonies and 0 otherwise
0 1 La Porta et al (1999)
Ethno linguistic fragmentation
Average value of five different indices of ethno linguistic fractionalization
Index La Porta et al (1999)
Latitude Measure of the closeness to the equator Miles La Porta et al (1999)
Appendix II Variables Definitions and Sources
31
Overvaluation Residual of a simple panel regression between the nominal exchange rate (local currency per US dollar) Vs the PPP valuation of the exchange rate The regression includes 182 countries The overvaluation measure in normalized to be 1 for the world
Deviation from equilibrium between PPP and market rate with 1 defined as the norm
IMF African Department database
GDP in dollars GDP in dollars (Converted at the nominal market exchange rate) Billions of US$ IMF World Economic Outlook
Per capita GDP in dollars Per capita GDP (constant 2000 US dollar) Constant 2000 US dollars IMF World Economic Outlook
Inflation Headline consumer price index (Average annual percent change) Percent IMF World Economic Outlook
Government balance General government balance excluding grants Percent of GDP IMF World Economic OutlookCredit Total credit to the private sector in percent of GDP Percent of GDP IMF International Financial StatisticsCurrent account Current account balance excluding grants Percent of GDP IMF African Department databaseREER Real effective exchange rate weighted index using total trade
(exports and imports composition for 1999 to 2001) and consumer price indices
Percent IMF Information Notice System
NEER Nominal effective exchange rate weighted index using total trade (exports and imports composition for 1999 to 2001)
IMF Information Notice System
US Tbill rate United States Treasury bill rate Percent IMF International Financial StatisticsTerms of trade Terms of trade (Exports prices to import prices goods and services) Percent IMF World Economic Outlook
Rest of the world real GDP Rest of the world real GDP growth (Weighted by country exports) Percent IMF World Economic Outlook
Oil prices Price of oil Simple average of Texas Dubai and Brent prices deflated by the manufacturing unit cost index
Percent IMF World Economic Outlook
Domestic savings Total domestic savings Percent of GDP IMF World Economic OutlookInvestment Total private investment Percent of GDP IMF World Economic Outlook
Reserves Stock of international reserves (US dollar billions) Billions of US$ IMF World Economic Outlook
Non-fuel commodity prices Real non-fuel commodity price (Weighted by country specific exports deflated by the manufacturing unit price)
Percent IMF World Economic Outlook
Population Population Millions IMF World Economic OutlookContract enforcement Efficiency of contract enforcement by following the evolution of a
sale of goods dispute and tracking the time cost and number of procedures involved from the moment the plaintiff files the lawsuit until actual payment
Number of procedures httpwwwdoingbusinessorg
Constraint on the executive Index that ranks from 1 (unlimited authority to the executive) to 7 (Executive parity or subordination) as decribed in the Freedom House Index
1 to 7 httpwwwfreedomhoseorg and Polity IV Databse at wwwsystemicpeaceorg politypolity4htm
ICRG ranking International Country Risk Guide rank for each country is based on three components of risk analysis Political financial and economic components The higher the rating the lower the risk for that particular country The index covers 140 countries
0 to 100 wwwprsgroupcom
Appendix II Variables Definitions and Sources (Contd)
32
Appendix III Determinants of Capital Flows Descriptive Statistics and Correlations
Total inflows FDI inflows Portf amp debt Share of FDI Total inflows FDI inflows Portf amp debt Total inflows FDI inflows Portf amp debt
Financial Institutions 031 033 026 008 002 -005 019 -012 -011 -006004 003 009 062 088 074 022 044 050 070
Rule of Law -021 -029 -015 003 013 005 027 -007 -009 000018 006 034 083 042 077 007 065 058 099
Market size 087 093 074 000 005 -003 021 -006 -004 -005000 000 000 099 077 084 019 069 079 074
Oil exporter 010 043 -004 045 019 027 -005 034 054 -019052 000 078 000 023 008 075 003 000 022
Real GDP growth 012 039 000 034 028 041 -010 055 070 -005043 001 099 003 007 001 052 000 000 077
Secondary enrollment 036 019 039 003 060 044 081 009 011 000002 023 001 083 000 000 000 057 050 099
Log 2000 GDP per capita 027 020 026 027 063 052 070 011 026 -020008 019 009 008 000 000 000 049 009 020
Capital account openness -007 -005 -007 -004 012 006 022 007 001 011066 073 068 079 046 072 016 066 094 049
Trade openness -017 -017 -015 011 014 015 008 013 017 -003027 027 034 050 036 033 059 042 027 086
UKleg 027 028 023 016 -010 -011 -005 -010 -004 -011008 007 014 031 052 048 076 053 078 047
Ethling 015 021 011 012 006 004 009 -005 001 -010033 018 048 044 069 080 055 077 094 053
LAT -011 -012 -009 039 -004 -006 002 -015 -005 -020050 046 057 001 080 068 088 032 073 020
Pop_dens 000 -003 002 -047 -004 -005 -002 004 -023 037099 085 093 000 080 075 089 081 018 003
Note pairwise correlation coefficient reported in first row significance level reported in second row Source Authors calculations
Appendix Table III2 Bivariate Correlations of Capital Flows with Independent Variables
(US$ mn) (per capita) (in percent of GDP)
1 Dependent variables Observations Minimum Maximum Mean MedianStandard Deviation
Total inflows 43 63 162106 8265 2339 25410FDI inflows 43 00 42371 3598 909 8027Portfolio and debt inflows 43 00 130724 4666 1021 19786Total inflows per capita 43 35 16250 1291 255 3078FDI inflows per capita 43 00 11653 826 105 2325Portfolio and debt inflows pc 43 00 5906 465 147 1038Total inflows to GDP 43 11 307 81 62 65FDI inflows to GDP 43 00 290 42 24 53Portfolio and debt inflows to GDP 43 00 187 39 32 36
2 Explanatory variablesFinancial institutions 43 00 40 18 10 16Rule of law 43 -18 08 -07 -07 06Market size 43 00 10 00 00 02Oil exporter 43 00 10 02 00 04Real GDP growth 43 -04 201 48 42 36Secondary enrollment 42 82 1079 342 283 226Log of 2000 GDP per capita 43 45 90 61 58 11Capital account openness 43 -16 25 -05 -11 13Trade openness 43 369 1559 818 789 3043 Alternative measures of institutions and instrumentsCPIA 42 18 43 32 32 06Doing Business Index 43 303 1760 1321 1487 410ICRG ranking 28 483 808 614 605 73Legal rights 43 10 80 40 35 16Property rights 41 14 45 30 30 06Constraint on the executive 40 17 70 41 43 16British legal origin 43 00 10 03 00 05Ethnolinguistic fragmentation 42 00 10 06 07 03Population density in 1500 36 01 250 38 20 55Latitude 43 00 07 01 01 01Source Authors calculations
Appendix Table III1 Descriptive Statistics for Regression Variables
33
Fin Instit Rule of Law Market size Oil exporter Real GDP growth Second Enr Log 2000 GDP pc Capital open Trade openTotal inflows
Financial Institutions 100
Rule of Law 042 100000
Market size 032 -023 100004 015
Oil exporter -022 -034 020 100016 002 019
Real GDP growth 008 001 012 047 100060 095 044 000
Secondary enrollment 040 049 027 -008 -012 100001 000 008 063 044
Log 2000 GDP per capita 034 039 018 024 000 083 100002 001 025 012 098 000
Capital account openness 034 019 -006 -020 -005 031 020 100003 021 071 021 074 005 030
Trade openness -015 -008 -022 003 -010 008 010 -001 100035 061 017 085 054 061 060 096
Note Pairwise correlation coefficients reported in first row significance level reported below Source Authors calculations
Appendix Table III3 Bivariate Correlations of Baseline Regression Variables
Financial inst CPIA indexDoing
Business ICRG ranking Legal rightsRule of
law Property rightsConstraint on the executive
British legal origen
Ethnoling fragmentation Latitude
Population density
Financial institutions 100
4300
CPIA index 063 100000
4200 4200
Doing Business index -060 -044 100000 000
4300 4200 4300
ICRG ranking 029 040 -069 100013 003 000
2800 2800 2800 2800
Legal rights 061 046 -061 020 100000 000 000 030
4300 4200 4300 2800 4300
Rule of Law 042 063 -069 082 034 100000 000 000 000 003
4300 4200 4300 2800 4300 4300
Property rights 057 081 -064 070 046 081 100000 000 000 000 000 000
4100 4100 4100 2700 4100 4100 4100
Constraint on the executive 044 041 -051 016 042 049 055 100000 001 000 043 001 000 000
4000 3900 4000 2800 4000 4000 3800 4000
British legal origin 059 040 -055 031 069 021 036 028 100000 001 000 011 000 018 002 008
4300 4200 4300 2800 4300 4300 4100 4000 4300
Ethnolinguistic fragmentation 017 -015 005 -032 014 -029 -018 002 011 100027 036 074 010 038 006 028 093 050
4200 4100 4200 2800 4200 4200 4000 3900 4200 4200
Latitude 009 016 -028 037 013 030 029 019 011 001 100058 032 007 006 041 005 007 025 049 094
4300 4200 4300 2800 4300 4300 4100 4000 4300 4200 4300
Population density -014 -002 021 -025 -045 -023 -011 -018 -018 -043 -037 100042 090 022 022 001 017 052 031 028 001 003
3600 3600 3600 2500 3600 3600 3600 3500 3600 3500 3600 3600Note Pairwise correlation coefficients reported in first row significance level reported in the second row and number of observation in the third row Source Authors calculations
Appendix Table III4 Bivariate Correlations of Measures of Institutions and Instruments
34
Appendix IV Private Capital Flows and Growth
Variable Number of
observations MeanStandard deviation Min Max
Real GDP growth 43 48 36 -04 201Initial per capita GDP 43 61 11 45 90Net total flowsGDP 43 37 74 -109 271Net total flows per capita 43 547 2782 -5006 12323Total inflowsGDP 43 77 57 10 282Total inflows per capita 43 1311 3139 35 16450Overvaluation 43 11 03 07 17Domestic savings 42 122 200 -247 813Investment 42 216 87 87 469Contract enforcement 43 1014 66 826 1133Source Authors calculations
Appendix Table IV1 Private Capital Flows and Growth Summary Statistics for Multivariate Regression
Rea
l GD
P gr
owth
Initi
al p
er
capi
ta G
DP
Net
flow
sG
DP
Net
flow
s pe
r ca
pita
Inflo
ws
GD
P
Inflo
ws
per
capi
ta
Ove
rval
uatio
n
Dom
estic
sa
ving
s
Inve
stm
ent
Con
tract
en
forc
emen
t
Real GDP growth 100
Initial per capita GDP 000 100
NetflowsGDP 038 -013 100
Netflows per capita 037 028 067 100
InflowsGDP 049 016 076 066 100
Inflows per capita 028 063 042 087 061 100
Overvaluation -032 -021 -011 -003 -024 -016 100
Domestic savings 048 058 013 029 028 048 -036 100
Investment 045 045 014 039 045 051 -026 042 100
Contract enforcement 018 -007 -024 -018 -017 -013 -015 010 -012 100Note indicates significant at 10 percentSource Authors calculations
Appendix Table IV2 Private Capital Flows and Growth Pairwise Correlations for Multivariate Regression
35
References
Acemoglu D and S Johnson 2005 ldquoUnbundling Institutionsrdquo Journal of Political
Economy Vol 113 No 5 pp 949995 Acemoglu D Johnson S and D Robinson 2002 ldquoReversal of Fortune Geography and
Institutions in the Making of the Making of the Modern World Income Distributionrdquo Quarterly Journal of Economics pp 12311294
Albuquerque R 2003 ldquoThe Composition of International Capital Flows Risk Sharing
Through Foreign Direct Investmentrdquo Journal of International Economics Vol 61 pp 353ndash383
Alfaro L and A Charlton 2007 ldquoInternational Financial Integration and Entrepreneurial
Firm Activityrdquo NBER Working Paper No 13118 (Cambridge Massachusetts National Bureau of Economic Research)
mdashmdashmdash S Kalemli-Ozcan and V Volosovych 2005a ldquoCapital Flows in a Globalized
World The Role of Policies and InstitutionsrdquoNBER Working Paper No 11696 (Cambridge Massachusetts National Bureau of Economic Research)
mdashmdashmdash 2005b ldquoWhy Doesnrsquot Capital Flow from Rich to Poor Countries An Empirical
Investigationrdquo NBER Working Paper Series No 11901 (Cambridge Massachusetts National Bureau of Economic Research)
Auty R M ed 2001 Resource abundance and Economic Development Improving the
Performance of Resource-Rich Countries (Oxford Oxford University Press) mdashmdashmdash and A Gelb 2001 ldquoPolitical Economy of Resource-Abundant Statesrdquo in Resource
abundance and Economic Development Improving the Performance of Resource-Rich Countries ed by R M Auty (Oxford Oxford University Press)
Becker T O Jeanne P Mauro J D Ostry and R Ranciegravere 2007 Country InsurancemdashThe Role of Domestic Policies IMF Occasional Paper No
254 (Washington International Monetary Fund) Bekaert G Campbell R H and C Lundblad 2005 ldquoDoes Financial Liberalization Spur
Growthrdquo Journal of Financial Economics Vol 77 (July) Chinn MD and H Ito 2007 ldquoA New Measure of Financial Opennessrdquo Available via the
Internet at wwwsscwiscedu7Emchinnresearchhtml
36
Chinn MD and H Ito 2006 ldquoWhat Matters for Financial Development Capital Controls Institutions and Interactionsrdquo Journal of Development Economics Vol 81 (October) pp 163ndash92
Chinn MD Ito H 2002 ldquoCapital Account Liberalization Institutions and Financial
Development Cross-Country Evidencerdquo NBER Working Paper Series No 8967 (Cambridge Massachusetts National Bureau of Economic Research)
DellAriccia G Di Giovanni J Faria A Kose M A Mauro P Schindler M Terrones M and J D Ostry 2008 ldquoReaping the Benefits of Financial Globalizationrdquo IMF Occasional Paper No 264 (Washington International Monetary Fund)
Dorsey T E Tadesse H Singh S and Z Brixiova 2008 ldquoThe Landscape of Capital
Flows to Low-Income Countriesrdquo IMF Working Paper 0851 (Washington International Monetary Fund)
Edison H Klein M W Ricci L A and T Slok 2004 ldquoCapital Account Liberalization
and Economic Performance Survey and Synthesisrdquo IMF Staff Papers Vol 51 No 2 pp 220256
Faria A and P Mauro 2004 ldquoInstitutions and the External Capital Structure of Countriesrdquo
IMF Working Paper 04236 (Washington International Monetary Fund) mdashmdashmdash Minnoni M and AZaklan 2006 ldquoThe External Financing of Emerging Market
Countries Evidence from Two Waves of Financial Globalizationrdquo IMF Working Paper 06205 (Washington International Monetary Fund)
Glaeser E L and A Shleifer 2002 ldquoLegal Originsrdquo Quarterly Journal of Economics
Vol117 pp 1193ndash1229 Gourinchas P-O and O Jeanne 2007 ldquoCapital Flows to Developing Countries The
Allocation Puzzlerdquo NBER Working Paper No 13602 (Cambridge Massachusetts National Bureau of Economic Research)
International Monetary Fund 2007 Global Financial Stability Report (Washington
October) mdashmdashmdash 2008 Regional Economic Outlook Sub-Saharan Africa (Washington September) Ju J and S-J Wei 2007 ldquoDomestic Institutions and the Bypass Effect of Financial
Globalizationrdquo NBER Working Paper No 13148 (Cambridge Massachusetts National Bureau of Economic Research)
37
mdashmdashmdash 2006 ldquoA Solution to Two Paradoxes of International Capital Flowsrdquo NBER Working Paper No 12668 (Cambridge Massachusetts National Bureau of
Economic Research) Karl T L 1997 The Paradox of Plenty Oil Booms and Petro-States (Berkeley University
of California Press) Kaufmann D Kray A and M Mastruzzi 2008 ldquoGovernance Matters VII Aggregate and
Individual Governance Indicators 1996-2007rdquo Policy Research Working Paper No 4654 (Washington DC World Bank Group)
Klein MW 2005 ldquoCapital Account Liberalization Institutional Quality and Economic
Growth Theory and Evidencerdquo NBER Working Paper No 11112 (Cambridge Massachusetts National Bureau of Economic Research)
Kose M A Prasad E Wei S-J and K Rogoff 2006 ldquoFinancial Globalization A
Reappraisalrdquo IMF Working Paper 06189 (Washington DC International Monetary Fund)
Lane P R 2004 ldquoEmpirical Perspectives on Long-Term External Debtrdquo Topics in Macroeconomics Vol 4 No 1 httpwwwbepresscombejmtopicsvol4iss1art1 La Porta R F Lopez-de-Silanes A Shleifer and R W Vishny 1999 ldquoThe Quality of
Governmentrdquo Journal of Law Economics and Organization Vol 15 pp 222ndash79 Lukonga forthcoming ldquoFinancial Market Development Survey of Sub-Saharan African
Countriesrdquo mimeo Mauro P Minnoni M and AZaklan 2006 ldquoThe External Financing of Emerging Market
Countries Evidence from Two Waves of Financial Globalizationrdquo IMF Working Paper 06205 (Washington International Monetary Fund)
Miniane J 2004 ldquoA New Set of Measures on Capital Account Restrictionsrdquo IMF Staff Papers Vol 51 No 2 pp 276ndash308 Mishkin F S 2006 The Next Great Globalization How Disadvantaged Nations can
Harness their Financial Systems to Get Rich (Princeton NJ Princeton University Press)
Obstfeld M and A M Taylor 2004 Global Capital Markets Integration Crisis and Growth Cambridge University Press (2004) Portes R and H Rey 2005 ldquoThe Determinants of Cross-Border Equity Flowsrdquo Journal of
International Economics Vol 64 pp269-296 Prasad Eswar S Raghuram G Rajan and Arvind Subramanian 2007 ldquoForeign Capital and Economic Growthrdquo Brookings Papers on Economic Activity 1 Brookings
38
Quinn D P 1997 ldquoThe Correlates of Change in International Financial Regulationrdquo
American Political Science Review Vol 91 (September) pp 531ndash51 mdashmdashmdash and A Maria Toyoda forthcoming ldquoDoes Capital Account Liberalization Lead to
Economic Growthrdquo Review of Financial Studies Rodrick D 2007 ldquoThe Real Exchange Rate and Economic Growth Theory and Evidencerdquo
Harvard University Working Paper httpksghomeharvardedu~drodrikRER20and20growthpdf
mdashmdashmdash and A Subramanian 2008 ldquoWhy did Financial Globalization Disappointrdquo IMF
Staff Papers Vol 56 No 1 (Washington International Monetary Fund) Schindler M 2009 ldquoMeasuring Financial Integration A New Datasetrdquo IMF Staff Papers
Vol 56 No 1 (Washington International Monetary Fund) Schularick M 2006 ldquoA Tale of Two Globalizations Capital Flows from Rich to Poor in
Two Eras of Global Financerdquo International Journal of Finance and Economics Vol11 pp339-354
Schularick M Steger T 2008 ldquoThe Lucas Paradox and the Quality of Institutions Then
and Nowrdquo Berlin University Working Paper N20083 Stone M R Shimizu S Nordstrom A and H J Ferhani 2008 ldquoDeveloping Essential
Financial Markets in Smaller Economies Stylized Facts and Policy Optionsrdquo IMF Occasional Paper No 265 (Washington International Monetary Fund)
World Bank 2007 Global Development Finance The Globalization of Corporate Finance in Developing Countries (Washington World Bank Group)

5
Figure 1 Private Capital Inflows to Sub-Saharan Africa 2000-07
Source African Department Database and IMF staff calculations
Fig 1a Private Capital Inflows(Billions of US Dollars)
0
10
20
30
40
50
60
70
80
90
2000 2001 2002 2003 2004 2005 2006 2007
LoansPortfolio FDI
Fig 1b Private Capital Inflows(percent of total flows)
0
20
40
60
80
100
2000 2001 2002 2003 2004 2005 2006 2007
On the determinants side we find that capital market development rather than basic property rights institutions is more closely associated with higher private capital inflows This may be a reflection of the increasing importance of portfolio and debt flows relative to FDI that has been observed in the recent period in SSA Looking at the growth impact we find strong positive correlations between private capital inflows and real GDP growth in the recipient countries However in part because of the limited time-period of our sample we are unable to prove a causal relationship whereby inflows increase growth The paper is related to recent research on determinants of capital flows and on the growth impact of capital flows As documented below both strands of the literature are quite well-populated but to our knowledge this study is the first to analyze these issues for the whole of sub-Saharan Africa in the context of the recent surge in global private capital flows It exploits a unique data set for 44 sub-Saharan African countries1 including annual data on private capital inflows (broken down by FDI portfolio and private debt) between 2000 and 2007 Appendix I provides further details about the capital flows database and how it compares to similar published datasets and Appendix II presents the definitions and sources of other variables used in the empirical analysis The paper is organized as follows Section II looks into recent trends in private capital flows to SSA Section III discusses the determinants of private capital flows and section IV investigates the association between these capital flows and growth Section V concludes
1 For the analysis we also had to exclude Zimbabwe due to sketchy and unreliable data over the sample period
6
II RECENT TRENDS IN FINANCIAL GLOBALIZATION IN SSA
In the period of the recently-ended boom in global financial markets inflows of private capital became the most important source of external finance for sub-Saharan Africa The increase in private capital flows to the region was in line with that in other regions and all low-income countries (Dorsey et al 2008 World Bank 2007) On average in the period between 2001 and 2007 total gross inflows to the region increased by 32 percent annuallymdashthe rate accelerating to 44 percent after 2005 Private capital flows to SSA have risen almost 6-fold since 2000 from about $15 billion to about $84 billion in 2007 (the latest year for which data is available) Recorded private capital outflows are on the whole much smaller than inflows so that in 2007 net capital flows to sub-Saharan Africa amounted to about US$76 billion As of 2007 private capital flows represented 10 percent of the regionrsquos GDP about twice the volume of official development assistance (about US$40 billion) A confluence of factors was responsible for the surge in private capital A significantly improved macroeconomic performance across much of the continent (Figure 2) and for some countries the implementation of the Multilateral Debt Relief Initiative (MDRI) coincided with increases in global liquidity and higher oil and commodity prices (Figure 3)
Figure 2 Global Liquidity ldquoPushrdquo Factors
Source African Department Database and IMF staff calculations
Fig 2a World Real GDP Growth ( Percent)
0
1
2
3
4
5
6
2000 2001 2002 2003 2004 2005 2006 2007
Fig 2b Oil And Commodity Prices (percent change)
-50
-40
-30
-20
-10
0
10
20
30
40
50
60
2000 2001 2002 2003 2004 2005 2006 2007
Non-fuel commodity prices
Oil prices
7
Figure 3 Domestic ldquoPullrdquo Factors
Source African Department Database and IMF staff calculations
Fig 3a Sub-Saharan Africa Real GDP Growth and Per Capita GDP
0
1
2
3
4
5
6
2000 2001 2002 2003 2004 2005 2006 20070
200
400
600
800
1000
1200
1400
1600
1800
2000(Percent) (US dollars)
Real GDPgrowth
(left scale)
Per capita GDP(right scale)
Fig 3bSub-Saharan Africa Inflation and Central Government Balance
0
5
10
15
20
25
30
2000 2001 2002 2003 2004 2005 2006 2007-10
-9
-8
-7
-6
-5
-4
-3
-2
-1
0
Note Excluding Zimbabwe
(Annual averagepercent)
(Percent ofGDP)
Inflation(left scale) Government balance
(right scale excludes grants)
These inflows represent a potential source of vulnerability as countries become increasingly dependent on potentially volatile private capital flows While the overall volatility of capital flows fell in the latter years in the sample the volatility of FDI has actually increased (Table 1)2 In addition for low income SSA countries in particular there has been a strong correlation between capital inflows and current account balances with inflows increasing as the current account improves and decreasing as the current account deteriorates magnifying the resulting swings in the overall balance of payments (Figure 6) On the other hand the surge in private capital inflows has contributed to a steady increase in international reserves of SSA countries providing these countries with increased scope to finance balance of payments deficits
MeanStandard Deviation Volatility Mean
Standard Deviation Volatility
Total inf low 198 45 44 522 243 21FDI 124 50 25 186 42 45Portfolio 13 07 19 177 131 14Private deb 61 05 132 158 88 18Source IMF African Department database 2008
Table 1 Private Capital Flows Volatility2000-03 2004-07
2 An important factor in the increase in FDI volatility seems to be a fairly large movement in FDI in South Africa in 2005-2006
8
Figure 4 Recipients of Private Capital Flows
Fig 4c Share of Portfolio and Debt Flows 2000-03(percent of total)
South Africa 231
Kenya 74
Ethiopia 68
Ghana 68Congo Dem Rep of 63
Other SSA 496
Fig 4d Share of Portfolio and Debt Flows 2004-07(percent of total)
South Africa 728
Nigeria 56
Ghana 22
Angola 20
Kenya 17
Other SSA 157
Fig 4a Share of FDI Inflows 2000-03
South Africa 273
Nigeria 168
Angola 165
Equatorial Guinea 58
Chad 50
Other SSA 285
Fig 4b Share of FDI Inflows 2004-07
Nigeria 343
South Africa 155Equatorial Guinea
102
Tanzania 32
Congo Republic of 29
Other SSA 338
Figure 5 Top Ten Recipients of Private Capital
F ig 5 a T o t a l In f l o w s( m i l l io n s o f U S d o l la rs )
A n g o la
K e n ya
C h a d
T a n z a n ia
S o u th A f r ic a
N ig e r ia
E q u a t o r ia l G u in e a
G h a n a
C o n g o D e m R e p o f
E t h io p ia
0 5 0 0 0 1 0 0 0 0 1 5 0 0 0 2 0 0 0 0
F i g 5 b I n fl o w s t o G D P( p e r c e n t)
C h a d
S e yc h e l le s
C o n g o R e p u b l ic o f
S atilde o T o m eacute amp P r iacute n c i p e
A n g o l a
E q u a t o r ia l G u in e a
G a m b ia T h e
C a p e V e rd e
C o n g o D e m R e p o f
G u in e a - B i s s a u
0 5 1 0 1 5 2 0 2 5 3 0 3 5
F ig 5 c In f lo w s to P o p u la ti o n( r a ti o )
A n g o la
G a b o nC o n g o
R e p u b l ic o fC a p e V e r d e
N a m ib ia
B o t s w a n a
S o u t h A fr i c a
M a u r i t i u sE q u a t o r i a l
G u in e aS e yc h e l le s
0 5 0 0 1 0 0 0 1 5 0 0 2 0 0 0
Note All rankings based on averages for 2000-07 Source African Department data base and IMF staff calculations
9
Figure 6 External Vulnerability
Fig 6a Low-income African Countries Current Account Balance and Capital Inflows 2000-07
0
100
200
300
400
500
600
700
800
900
2000 2001 2002 2003 2004 2005 2006 2007-14
-12
-10
-8
-6
-4
-2
0
Capital Flowsleft axis
Current Account Balanceright axis
Fig 6b Oil Producers Current Account Balance and Capital Inflows 2000-07
0
500
1000
1500
2000
2500
2000 2001 2002 2003 2004 2005 2006 2007-20
-15
-10
-5
0
5
10
Capital Flowsleft axis
Current Account Balanceright axis
Fig 6c Low Income Africa Countries International Reserves and Capital Flows
0
100
200
300
400
500
600
700
800
900
2000 2001 2002 2003 2004 2005 2006 200700
02
04
06
08
10
12
14
16
Reservesright axis
Capital flowsleft axis
Fig 6d Oil Producers International Reserves and Capital Flows
0
500
1000
1500
2000
2500
2000 2001 2002 2003 2004 2005 2006 20070
2
4
6
8
10
12
Capital Flowsleft axis
Reservesright axis
III DETERMINANTS OF PRIVATE CAPITAL FLOWS TO SSA
This section investigates the determinants of private capital flows to sub-Saharan Africa during 2000-2007 with particular focus on the role of domestic capital market development Capital flows to sub-Saharan Africa particularly portfolio flows have been concentrated in a relatively small number of countries with relatively sophisticated financial markets In these countries capital has flown into equities where the stock market was sufficiently developed (eg Kenya Nigeria) government bonds in countries that had sovereign issues (Botswana Ghana) and short-term government securities (Uganda Tanzania and Zambia) when few other investment vehicles open to non-residents were available The availability of investment instruments appears to have dominated the existence of capital controls For example in Tanzania legal loopholes allowed international investors to purchase significant amounts of government securities although in principle foreigners were not allowed to hold government debt (IMF 2008)3
3 Nevertheless targeted capital controls as in Ghana appear to have been successful in developing the longer end of the market for government debt
10
We use a new indicator of capital market development in sub-Saharan Africa that captures the structure of capital markets Capital markets along with money foreign exchange and derivatives markets form part of a countryrsquos ldquoessential financial marketsrdquo (Stone et al 2008 Lukonga forthcoming) In particular we consider government securities markets both for treasury bills and treasury bonds as well as corporate bond markets and equities markets (see Lukonga forthcoming) We construct a simple index which is the sum of four dummy variables taking the value of 1 if the market in question exists and is well-developed The index covers all sub-Saharan African countries except Somalia Using this index simple tabulations show that the average level of financial market development is fairly low in sub-Saharan Africa with only 10 countries or 21 percent of the sample countries having complete capital markets (Table 2)4 However as discussed earlier these countries are also among the largest recipients of private capital inflows in sub-Saharan Africa along with a few oil exporters (Angola Congo Chad and Equatorial Guinea) While the role of institutional development in attracting international capital flows has been emphasized in recent studies very few have attempted to isolate the role of financial versus basic property rights institutions The measures of financial market development used in the literature and that would be available for low-income countries such as ratios of money and credit to GDP have their limitations They measure outcomes such as the ability of the financial (mostly banking) sector to provide transaction services (in the case of the ratios of money or broad money to GDP) or the capacity of the banking system to channel savings rather than the extent of financial market development as measured by the availability of investment instruments Our empirical results detailed below indicate that along with other factors such as market size (particularly for portfolio inflows) and oil exporting status (particularly for FDI flows) the index of capital market development is a significant and robust determinant of international capital flows to sub-Saharan African countries
4 The countries are Botswana Ghana Kenya Namibia Nigeria South Africa Swaziland Tanzania Uganda and Zambia
11
Capital Markets
T-Bills T-BondsCorporate
Bonds Equities
Botswana X X X XGhana X X X XKenya X X X XNamibia X X X XNigeria X X X XSouth Africa X X X XSwaziland X X X XTanzania X X X XUganda X X X XZambia X X X XBenin X X X Burkina Faso X X X NCape Verde X X N XMauritius X X XMozambique X X X Zimbabwe X X XAngola X X N NCocircte dIvoire N X N XGambia The X X N NSenegal X X N Seychelles X X N NCameroon N N XCongo Dem Rep of X N N NEthiopia X N N NGuinea X N N NGuinea-Bissau X N N NLesotho X N N NMadagascar X N N NMalawi X N N Rwanda X N N NSierra Leone X N NTogo X N Burundi N N NCentral African Republic NChad N N N NComoros N N N NCongo Republic of N N N NEquatorial Guinea N N N NEritrea N N NGabon N N N NLiberia N N N NMali N N NNiger N Satildeo Tomeacute and Priacutencipe N N N N
Sources Lukonga (forthcoming) and authors calculationsNotes X denotes that the market is fairly or very well developed denotes that the market nominally exists or is partially developedN denotes that the market does not exist
Table 2 Capital Market Development in Sub-Saharan Africa
12
A Recent Literature
The starting point of much of the recent literature on determinants of capital flows has been an attempt to explain the Lucas Paradox or why private capital doesnrsquot seem to flow from rich to poor countries Standard neoclassical theory predicts that capital should flow from capital-rich countries (with low marginal productivity of capital) to capital-scarce countries (with a high marginal product of capital) In practice however the bulk of observed flows particularly in the modern period consists of flows among developed economies Compared to the early 20th century era of financial globalization the current wave of capital flows is characterized by massive diversification of flows between high-income economies and a relative marginalization of less-developed economies (Obstfeld and Taylor 2004 Schularick 2006 and Schularick and Steger 2008) Some authors posit that the paradox is due to country-specific fundamentals that tend to lower the marginal product of capital in developing countries such as missing factors of production including human capital poor economic policies and poor institutions (Alfaro Kalemli-Ozcan and Volosovych 2005a and 2005b Faria et al 2006 Faria and Mauro 2004 Schularick and Steger 2008) In this vein a recent study shows that the extent of domestic financial market development and the quality of domestic financial institutions has played a significant role in attracting capital flows to emerging markets (IMF 2007) The second set of explanations centers around international capital market imperfections such as asymmetric information sovereign risk and capital controls For example Portes and Rey (2005) find that informational frictions proxied by geographic distance affect the amount and direction of capital flows and Lane (2004) also finds that credit market frictions are a determinant of debt flows in 1970-1995 The studies that focus on the role of institutions in attracting foreign private capital highlight the importance of basic institutions particularly property rights protection Weak property rights owing to poor quality institutions affect entrepreneursrsquo investment decisions Risks of expropriation armed conflict and malfunctioning legal systems all have a potentially negative impact on the returns from those investments Empirically property rights institutions have been proxied by an index derived from the Kaufman Kray and Mastruzzi World Governance IndicatorsWGIs or by an index derived from the ICRG indicators 5 Using those proxies better quality institutions are found to be positively and significantly correlated with foreign equity flows (Alfaro et al 2005a 2005b) and with a higher share of equity in a countryrsquos total stock of external liabilities (Faria and Mauro 2004 and Faria et al 2006) 5 The ICRG composite index aggregates over several dimensions such as government stability investment profile internal and external conflict non-corruption law and order protection from religious and ethnic tensions non-militarized politics democratic accountability and quality of bureaucracy (wwwprsgroupcom) Similarly the WGIs measure countriesrsquo score according to 6 governance dimensions namely voice and accountability political instability government effectiveness regulatory burden rule of law and control of corruption (wwwworldbankorgwbigovernancegovdata)
13
As mentioned earlier few studies focus on the role played by the extent of domestic financial market development in attracting international capital flows While the literature tends to link capital flows (financial globalization) to improvements in domestic financial systems (eg Chinn and Ito 2005 2002 Mishkin 2006) in principle the direction of causality is not clear Chinn and Ito (2005) and Klein (2005) find empirical evidence supporting the notion of a threshold effect financial openness contributes to equity market development only when a threshold level of general development of legal systems and financial development is attained However although property rights and financial institutions could potentially affect capital flows differently no study of the determinants of capital flows has empirically attempted to properly disentangle the effects of both Ju and Wei (2007 2006) develop theoretical models showing that financial institutions and property rights institutions can have different effects on capital flows Whereas an inefficient financial system can be bypassed by international capital flows as they could come in the form of FDI instead of portfolio and debt flows high expropriation risk cannot be bypassed Conversely the stronger domestic property rights the more the country will benefit from international capital flows
B Estimation strategy and Model
Cross-country regressions have been found appropriate to investigate the fundamental (and thus slow-moving) determinants of why some countries attract more inflows or more of a certain type of inflows than other countries In particular we are interested in testing whether financial institutions have a separate and different effect on capital inflows than property rights institutions That effect may also differ depending on the type of capital flows Empirically Acemoglu and Johnson (2005) show that property rights and contractingfinancial market development institutions do affect economic outcomes differently While property rights institutions have a first order effect on economic outcomes such as long-run GDP growth investment rates and financial depth contracting institutions seem to mostly affect the degree of financial market development As others we use instrumental variables to tackle the issue of reverse causality and endogeneity associated with the measures of institutions (Acemoglu and Johnson 2005 Alfaro Kalemli-Ozcan and Volosovych 2005a and 2005b DellrsquoAriccia et al 2008 Faria et al 2006 Faria and Mauro 2004) Building on the recent literature the reduced-form linear equation to be estimated is
iiiii uCPFK +sdot+sdot+sdot+= χβαμ (1) Where iK is log of average inflows to country i iF is a measure of financial institutions and iP a measure of property rights iC is a set of exogenous control variables and iu is an independent error term α β and γ are coefficients capturing the impact of financial development property rights institutions and other controls on capital flows where α and β are of particular interest and μ is a constant
14
Given that the measures of financial and property rights institutions are endogenous simple OLS estimates of equation (1) will be biased As indicated in Acemoglu and Johnson (2005) the α and β coefficients may capture reverse causality or the effect of some other omitted characteristic Second as financial market development and property rights are measured with error there may be a downward attenuation bias and finally if contracting and property rights institutions are correlated the effect of the type of institution that is measured with greater error will load onto the other variable Following Acemoglu and Johnson (2005) the estimation strategy therefore relies on estimating equation (1) with two-stage least squares (2SLS) using valid and separate instruments for financial and property rights institutions The two first stage equations will thus be of the form
iiiii CELF 11111 εχηδν +sdot+sdot+sdot+=
iiiii CELP 22222 εχηδν +sdot+sdot+sdot+= (2) Where iL and iE are instruments for financial institutions and property rights institutions respectively The key exclusion restriction is that Cov( iu iL ) = Cov ( iu iE ) =0 iu being the error term in the second-stage equation (1)
C Empirical Analysis This study utilizes a unique data set on capital inflows to SSA prepared by the staff of the International Monetary Fund described in Appendix I Choice of variables The following set of variables was chosen to estimate equations (1) and (2) (see Appendix II for definitions and sources Descriptive statistics are presented in Appendix III Table 1 bull Financial institutions are proxied by the simple index of capital market development
described earlier (Lukonga forthcoming) The more developed capital markets the higher capital flows
bull Property rights institutions are proxied by the rule of law score from the World Governance Indicators (Kaufmann Kray and Mastruzzi 2008) Among the six governance dimensions used by Kaufmann et al 2008 this is the closest proxy for property rights protection6 Better property rights protection should lead to higher capital flows
6 Various other proxies for property rights institutions exist and have been used in empirical studies Faria et al (2006) and Faria and Mauro (2004) use the simple average of KKMrsquos governance indicators for a single year Alfaro et al use the ICRG score (2005a 2005b) Acemoglu and Johnson (2005) and Acemoglu Johnson and
(continuedhellip)
15
bull Following Acemoglu and Johnson (2005) we use British legal origin as the instrument for financial market development taken from La Porta et al (1999) Acemoglu Johnson and Robinson 2002 Glaeser and Schleifer 2002 and La Porta et al1999 show that in the case of former European colonies legal origin is a valid instrument for contracting institutionsfinancial market development and property rights respectively Legal origin is shown to be positively and significantly associated with financial institutions with civil law countries exhibiting lower financial development than common law countries (Glaeser and Schleifer 2002 La Porta et al 1999)
bull The instruments for property rights institutions are the degree of ethno linguistic fragmentation and the countryrsquos latitude taken from La Porta et al (1999) which have been found to be associated with worse property rights and regulations7 Acemoglu and Johnson 2005 Acemoglu Johnson and Richardson (2002) Faria et al 2006 and Faria and Mauro 2004 use settler mortality in 1500 or population density in 1500 and show that they are valid instruments for property rights institutions For sub-Saharan African countries however settler mortality and population density in 1500 are available only for a subset of countries (Acemoglu and Johnson 2002)8 Given the better country coverage we have chosen to proceed with ethno linguistic fragmentation and latitude
bull A dummy variable to control for oil-exporting countries (the dummy variable takes the value of 1 if the country is an oil exporter) Oil-exporting countries attract more FDI other things equal
bull A dummy variable to control for market size (the dummy variable takes the value of 1 if the country is South Africa or Nigeria) Larger and more sophisticated economies attract more capital flows
Similar studies also include a number of additional explanatory variables though it is more difficult both to argue that they are exogenous and to find valid instruments for them We use these variables in our baseline regression
bull Human capital proxied by the share of secondary school enrollment in the population from the WDI This variable features in explanations of the Lucas Paradox that focus on missing factors of production (Alfaro et al 2005a 2005b) The expected impact of higher human capital on capital flows is expected to be positive
Robinson (2002) use average protection against expropriation risk and constraint on the executive as measures of property rights but these measures are not available for a sufficiently large number of our sample countries 7 La Porta et al (1999) however note that the adverse effects of ethno linguistic fractionalization on government performance tend to disappear when controlling for per capita income and latitude except for public good provision and state-owned enterprises This can be interpreted as countries with a large public enterprises sector tend to have less regard for private enterprises and private property rights 8 Robustness checks using population density in 1500 as an instrument yield results that are consistent with those obtained with ethno linguistic fragmentation (results not shown)
16
bull A measures of de jure capital account openness proxied by the Chinn-Ito measure of capital account openness based on the IMFrsquos AREAER (Chinn and Ito 2007) We use the average value of the Chinn-Ito variable for sub-Saharan African countries over 1999-20059 The effect of capital account openness on capital flows is expected to be positive
bull A measure of trade openness proxied by the sum of exports and imports over GDP Particularly at an initial stage capital mobility develops around greater openness to trade flows Arguably countries that are more open to trade may also be politically more open to greater integration with the rest of the world
bull Macroeconomic performance proxied here by the real GDP growth rate In a panel study of 47 industrial and emerging countries IMF (2007) find that expected macroeconomic performance proxied by lagged real GDP growth is a significant determinant of private capital inflows IMF (2008) similarly finds that real GDP growth and lower fiscal deficits are significantly correlated with higher private capital inflows Alfaro (2005b) uses inflation volatility as a proxy for macroeconomic performance However it is difficult to establish causality as inflows directly affect macroeconomic outcomes (also see below) Further macroeconomic outcomes have been shown to be shaped by institutions making it difficult to study the independent effect of institutional development on capital flows
Correlations Appendix Table III2 shows pairwise correlations between different measures of capital flows while Appendix Table III3 shows the pairwise correlations corresponding to the baseline regressions and Appendix Table III4 focuses on the pairwise correlations of the institutional variables and the instruments
Appendix Table III2 indicates that for our sample the choice of scaling variable affects the pairwise correlations of the inflows with the independent variables This confirms the impression from Figure 5 above that the picture of the allocation of private capital inflows across sub-Saharan countries is very different whether one looks at overall volume of inflows or at the size of the inflows relative to a countryrsquos population or GDP Whereas total inflows as a share of population or GDP will be the variable of interest when studying the economic impact of the inflows on individual countries (see Section IV below) the investigation of the factors determining the allocation of private capital flows to sub-Saharan Africa across the
9 Unlike many other studies that use the simple average of the four dummy variables or the dummy on capital account restrictions (Alfaro et al 2005a 2005b IMF 2007b) the Chinn-Ito measure attempts to capture the intensity of the capital controls by incorporating all the restrictions in the index using a principal components approach Whereas the other restrictions are not directly related to capital account restrictions they are taken as indicative of the overall restrictiveness of the regime The advantage of this measure over other more detailed indices that capture the intensity of capital controls (Quinn 1997 2003 Miniane 2004 Schindler 2009) is its near universal country and extended time coverage 181 countries between 1970 and 2005
17
continent should focus on the total volume of inflows A simple explanation is that private investors are more likely to decide on allocating specific amounts of money to various markets or projects than to fix investment limits relative to a countryrsquos population or GDP Therefore for the remainder of this section the variable of interest will be the log of private capital inflows and their components FDI on the one hand and portfolio and debt flows on the other averaged over 2000-2007 for each sub-Saharan African country excluding Somalia and Zimbabwe Looking at the potential determinants of private capital flows to SSA and their composition in Appendix Table III2 (columns 1-4) overall inflows as well as portfolio and debt inflows are correlated with the index of financial sector development secondary school enrollment the market size dummy variable and the log of initial GDP per capita There are however interesting variations for the determinants of FDI flows to which GDP per capita and secondary school enrollment are not significantly correlated but the proxy for property rights and the dummy for oil producers are The measure of trade openness and the Chinn-Ito capital openness variable are never significantly correlated with private inflows or their components However capital account openness is correlated with the degree of financial sector development as in Chinn and Ito (2005) and with secondary school enrollment
Appendix Table III3 illustrates the challenges associated with finding truly exogenous determinants of private capital flows and their composition as a number of potential explanatory variables are correlated with each other In particular the measure of financial market development is highly correlated with the proxies for property rights institutions as discussed above Further educational achievement is significantly correlated with the institutional quality variables and economic development This is not surprising as it can be understood as an outcome of good institutions and higher degree of economic development This strong degree of endogeneity and the fact that we are interested in disentangling the impact of institutions on capital inflows argues that like the variables capturing macroeconomic performance it is probably not a useful explanatory variable given our focus on the impact of institutions per se on capital inflows The same holds true for the proxy for economic development log of GDP per capita in 2000 (Alfaro et al 2005b show that log real GDP per capita has no additional explanatory power once a measure of institutional quality is introduced)
The pairwise correlations of the potential instrumentsmdashBritish legal origin population density in 1500 and ethno linguistic fragmentationmdashwith the institutional variables and with the capital flows variables are encouraging for the instrumental variables approach (Appendix Table III4) The potential instruments for property rights institutions are uncorrelated with the inflows variables but are significantly correlated with the property rights proxies Although British legal origin is significantly correlated with total inflows in addition to financial institutions it is not correlated with property rights nor its potential instruments
18
Regression results
Table 3 presents the results of simple OLS estimations of various specifications of equation (1) as a benchmark The coefficient on the financial market development index is positive and significant and robust across all specifications For portfolio and debt flows it is even the only variable that is significant maybe highlighting the particular importance of capital market development for non-FDI flows The coefficient on property rights institutions (rule of law score) is never significant and has the wrong sign The coefficients on the controls for country size and oil exporters are large and generally significant but while oil exporters do receive more FDI than other countries they do not have any particular advantage with portfolio and debt inflows Real GDP growth is the only other variable that is significant for total inflows and FDI However as discussed earlier real GDP growth is not exogenous and to study the impact of institutions further we use the specification in column (3) as our baseline The log of real GDP per capita in 2000 secondary enrollment and capital account and trade openness are never significant10 The results obtained are similar when breaking the sample into two sub-periods capturing the period before and after the acceleration of private capital inflows This is not surprising considering that the determinants of inflows are fairly slowly-moving country characteristics They are also robust to excluding South Africa and Nigeria indicating that the results are not driven by the two largest recipients and to excluding all oil exporters (Results available upon request) Indeed the impact of financial market development on inflows is even larger in both cases
(1) (2) (3) (4) (5) (6) (7) (8) (1) (2) (3) (4) (1) (2) (3) (4)Financial Institutions 050 056 052 055 056 058 056 057 067 063 055 057 055
(-346) (586) (548) (544) (565) (527) (603) (536) (499) (343) (348) (322)Rule of Law -021 -033 -041 -027 -028 -033 -037 -003 -010 -020 -018 -052 -058
(-056) (-114) (-136) (-070) (-085) (-112) (-129) (-008) (-025) (052) (-046) (-124) (-131)South Africa and Nigeria 185 187 198 189 179 158 135 137 211 212
(168) (170) (121) (160) (161) (137) (134) (137) (160 (160)Oil Exporters 161 101 162 168 160 164 267 194 051 012
(314) (190) (304) (276) (308) (306) (441) (367) (078) (014)Real GDP growth
011 014 007(326) (304) (127)
Secondary Enrollment -000
(-028)Log 2000 per capita GDP -05
(-032)Capital Account Openness -06
(-06)Trade Openness
-001(-202)
Constant 447 522 379 335 392 413 374 441 342 442 268 216 345 430 288 260(-125) (2317) (1146) (966) (836) (398) (1015) (867) (713) (1956) (635) (477) (900) (1361) (482) (410)
Observations 43 43 43 43 42 43 43 43 43 43 43 43 43 43 43 43R-squared 026 001 057 062 057 057 058 059 022 000 055 059 025 000 042 044F-Statistic 1196 031 1200 1581 878 946 941 1532 1197 001 1289 1406 1176 021 545 493
Source Authors calculations
Note and indicate significant at 1 5and 10 percent t-Statistics are reported in parentheses Robust standard errors
Table 3 Baseline OLS Estimation ResultsTotal Inflows FDI Inflows Portfolio amp Debt Inflows
10 A recent study finds that as is the case for low-income countries de jure financial integration is fairly low for sub-Saharan Africa compared to other regions Capital control regulations tend to be complex and nontransparent and limited capacity to monitor capital flows can lead to inconsistent implementation Inconsistencies between different regulations have also made capital controls easy to circumvent This may explain the difficulties in establishing an empirical relation between capital controls and capital flows in the region (IMF 2008)
19
Table 4 presents the results of the 2SLS estimation The first stage equations are shown in Panel A and the second stage in Panel B Columns (1) and (2) report results using Ethno linguistic fractionalization as the instrument for property rights institutions and columns (3) and (4) using latitude Given the very low R-squared obtained in the latter case corresponding results are not shown for the components of the inflows Starting with the first-stage regressions British legal origin is shown to have a strong positive and significant impact on financial development but not on the rule of law while the instrument for property rights has a stronger and mostly significant impact on property rights (greater ethno linguistic fragmentation has a negative impact on rule of law as does closeness to the Equator) than on financial institutions Market size has a positive and significant impact on capital market development and oil exporting status has a negative and significant impact However market size is negatively related to rule of lawalthough this is likely to be mainly because of the relatively low ratings of Nigeria and South Africa regarding property rights protection Oil exporting status is also negatively related to rule of law a result attributed to the rent-seeking culture that appears to take hold in resource-rich countries (Auty 2001 Auty and Gelb 2001 Karl 1999 1997)
(1) (2) (3) (4) (1) (2) (1) (2) (1) (2)
Financial Institutions042 022 061 062 061 051 032 001 006 011(200) (097) (211) (134) (264) (214) (137) (004) (148) (259)
Rule of Law -101 -035 -225 -231 -096 025 -043 -020 -009 010(-092) (-028) (-198) (-160) (-082) (020) (-034) (-012) (-047) -041
South Africa and Nigeria 277 076 196 380 -037
(205) (039) (149) (241) (-195)Oil Exporters 115 067 265 -060 054
(157) (090 (298) (-006) (332)Constant 396 443 275 255 272 318 359 414 032 030
(430) (448) (233) (157) (287) (379) (348) (334) (188) (170)Observations 42 42 43 43 42 42 42 42 42 42R-squared 028 047 005 007 025 053 024 024 NA 012
British Legal Origin 181 148 188 155 181 148 181 148 181 148(408) (291) (419) (295) (408) (291) (408) (291) (408) (291)
Instrument for Rule of Law1 060 069 031 084 060 069 060 069 060 069
(097) (107) (024) 063) (097) (107) (097) (107) (097) (107)South Africa and Nigeria 145 158 145 145 145
(260) (295) (260) (260) (260)Oil Exporters -085 -074 -085 -085 -085
(-210) (-193) (-210) (-210) (-210)Constant 078 092 106 116 078 092 078 092 078 092
(188) (229) (394) (423) (188) (229) (188) (229) (188) (229)Adj R-squared 032 034 031 033 032 034 032 034 032 034
British Legal Origin 031 034 023 023 031 034 031 034 031 034(166) (161) (121) (121) (166) (161) (166) (161) (166) (161)
Instrument for Rule of Law1 -068 -053 143 148 -068 -053 -068 -053 -068 -053
(-211) (-157) (122) -163 (-211) (-157) (-211) (-157) (-211) (-157)South Africa and Nigeria -065 -058 -065 -065 -065
(-336) (-278) (-336) (-336) (-336)Oil Exporters -033 -048 -033 -033 -033
(-183) (-225) (-183) (-183) (-183)Constant -036 -038 -096 -086 -036 -038 -036 -038 -036 -038
(-150) (-154) (-591) (-514) (-150) (-154) (-150) (-154) (-150) (-154)Adj R-squared 010 017 008 019 010 017 010 017 010 017
Source Authors calculations
Financial Institutions Financial Institutions Financial Institutions
Table 4 Instrumental Variables Estimation ResultsPortfolio Inflows
Panel A Second-Stage Regressions
Panel B First-Stage Regressions
Rule of Law
Note and indicate significant at 1 5and 10 percent t-Statistics are reported in parentheses Robust standard 1 In columns (1) and (2) the instrument for rule of law is ethnolinguistic fractionalization In columns (3) and (4) the instrument is latitude
Total Inflows FDI Inflows
Rule of Law Rule of Law
Share of FDI
Financial Institutions
Rule of Law
20
Comparing the second-stage equations with the OLS estimates the impact of financial institutions is overall weaker (smaller coefficients) but remains strong and significant for total inflows and FDI inflows as well as the share of FDI in total inflows Interestingly the property rights variable is never significant and continues to have the ldquowrongrdquo sign in most cases except for FDI inflows and the share of FDI (column 2) perhaps indicating that non-FDI investors believe property rights are not critical for their relatively liquid investments Oil resources is a strong determinant of FDI inflows but not other types of flows whereas it is market size that seems to matter for portfolio and debt inflows When excluding South Africa and Nigeria or oil-rich countries from the estimation results are broadly similar with the coefficient on financial institutions larger particularly in the FDI regressions This indicates that in non-oil sub-Saharan African countries excluding South Africa FDI inflows are significantly larger the more financial markets are developed Perhaps surprisingly property rights protection is insignificant This may be explained by the fact that as FDI is harder to expropriate even countries with poor property rights protection receive FDI Alternatively for these relatively small countries it may be possible for foreign investors to effectively negotiate greater property rights for their FDI than is generally available in the country for other investors Given the small sample size the results must be interpreted with caution but overall they support the importance of unbundling institutions and measuring them more precisely Results also support the notion that for capital flows financial institutions as proxied by capital markets development matter more than basic property rights institutions capital including in the form of FDI will flow less to countries with less developed financial markets against the view presented in Albuquerque (2003) that FDI should flow more to financially constrained countries
IV DO PRIVATE CAPITAL FLOWS HAVE AN IMPACT ON GROWTH IN SSA This section undertakes a preliminary analysis of the relationship between capital inflows and growth in sub-Saharan Africa Significant capital flows to African countries are a relatively recent phenomenon and as noted above have so far been restricted to a limited number of markets Given the general inconclusiveness of the empirical evidence on the links between growth and capital flows from emerging markets that have been on the radar of international investors much longer than most African markets it is perhaps too early to expect robust econometric results with the particular sample in this paper While it is easy to make a theoretical case for the positive impact of capital flows on growth the empirical verification of this impact has proved much more challenging11 Alternate
11 See Edison and others 2004 Kose and others 2006 DellrsquoAricia and others 2008 and Prasad Rajan and Subramanian 2007 for comprehensive reviews of the empirical literature on the impact of capital flows Though evidence from empirical studies using aggregate data is inconclusive studies that use measures of de facto
(continuedhellip)
21
explanations to this empirical puzzle have predicated the gains from capital flows on the threshold development of certain domestic institutions andor proposed that such flows generate certain indirect or collateral benefits even when their direct impact on growth is difficult to gauge Klein (2005) finds support for a model in which institutional quality intermediates the impact of capital account liberalization on growth by affecting the extent to which savings are protected from expropriation and the premium borrowers pay for funds from abroad In countries with better institutions capital account openness has a significant positive impact on growth Bekaert Harvey and Lundblad (2005) find that the largest growth response to equity market liberalizations accrues to countries with better legal systems above-average financial development and better-quality institutions in terms of investor protection and accounting standards Using industry-level data Prasad Rajan and Subramanian (2007) indicate that for countries that have above-median levels of financial development foreign capital aids the relative growth of those industries dependent on finance But for countries below the median for financial development the effect of foreign capital inflows is diametrically opposite Using firm-level data Alfaro and Charlton (2007) find a significant relationship between entrepreneurial activity and both de jure and de facto international capital integration Their results suggest that foreign capital may improve access to capital either directly or through improved domestic financial intermediation
Recent evidence however indicates that countries that grow more rapidly are those that rely less and not more on foreign capital and in turn foreign capital tends to flow to countries that experience not high but low productivity growth (Prasad Rajan and Subramanian (2007) Gourinchas and Jeanne (2007)) One possible explanation for this puzzle is trade fast-growing countries also are the ones that experienced a takeoff in their export sector (Gourinchas and Jeanne 2007) If capital inflows lead to higher prices for nontraded goods owing to absorptive capacity constraints and thus to overvaluation they will have a negative impact on exports and hence growth (Kose and others 2006 Prasad Rajan and Subramanian 2007) Another explanation is that inflows from abroad that supplement domestic savings will have a limited impact in an economy where the binding constraint is the scarcity of viable investment opportunities (Rodrik and Subramanian 2009)
We estimate the gains from financial globalization using the same cross-section sample of average flows for the 2000-07 period as in the preceding section However in this section we also make use of data on net flows For most African countries the differences between net and total capital flows are not often vast nevertheless the economic impact of such flows depends on the actual infusion of foreign capital rather than gross flows Also we scale net flows to the size of the economy by alternatively dividing them by population or GDP
integration or finer measures of de jure integration tend to find more positive results Studies using micro data are also better able to find growth and productivity gains from financial integration
22
A Correlation Analysis
We begin the correlation analysis with a simple mapping between economic growth and capital flows in sub-Saharan Africa while not drawing any inferences about the direction of causation
12 The scatter plots indicate a generally positive correlation between growth and capital flows in our sample13 Consistent with the findings in the literature the relationship is more pronounced when only FDI flows are considered
Figure 7 Sub-Saharan Africa Capital Flows and Real GDP Growth
Capital Flows and Real Growth(net total flows to population)
-600
-500
-400
-300
-200
-100
0
100
200
300
-2 0 2 4 6 8 10 12 14
Capital Flows and Real Growth(net total flows to GDP)
-15
-10
-5
0
5
10
15
20
25
30
-5 0 5 10 15 20 25
FDI and Real Growth(net FDI to population)
0
20
40
60
80
100
120
140
160
180
-2 0 2 4 6 8 10 12 14
FDI and Real Growth(net FDI to GDP)
-5
0
5
10
15
20
25
30
-5 0 5 10 15 20 25
Note All variables are the average value of the 2000-07 period Where normalized over population the charts exclude the outliers Equatorial Guinea and Seychelles Table 5 provides further evidence of the positive significant correlation between capital flows to sub-Saharan Africa and real GDP growth in the recipient countries This relationship however does not hold when capital flows are disaggregatedmdashwhile FDI is positively correlated with growth portfolio and debt-creating flows are generally inversely related to growth though
12 As mentioned in the previous section in analyzing the relationship between growth and capital flows the latter are normalized over either the population or GDP of the recipient country All variables are considered at their average values over the 2000-07 period to deal with annual volatility 13 This is in contrast with Rodrick and Subramanian (2008) who in a sample of 110 developing countries running through 2004 do not find any relationship between financial globalization (measured as the sum of foreign assets and liabilities as a share of GDP) and growth
23
not significantly so This finding is also consistent with evidence from other studies(DellrsquoAricia and others 2008)
B Testing channels of transmission of private capital flows on growth Another approach to gauging the likely impact on capital inflows on growth is to test the various channels described in the literature on financial globalization and growth Three broad channels are identified as linking capital inflows and growth
bull Overvaluation to the extent that capital inflows cause currency appreciation they hurt exports and thus dampen growth This channel is well-documented in Rodrick (2007) but also discussed in Prasad et al (2007)
bull Savings and investment where foreign capital supplements domestic savings it fosters growth However this would only be true for economies where the main constraint on growth is a lack of savings Where the main hindrance to economic growth is the scarcity of viable investment opportunities additional foreign capital will only add to domestic distortions (Gourinchas and Jeanne 2007 Rodrick and Subramanian 2009)
bull Institutional development a number of studies argue that capital inflows carry indirect (collateral) benefits for recipient countries via the development of domestic institutions (Becker and others 2007 Kose and others 2006) or more particularly financial sector institutions (Mishkin 2006)
The testing methodology employed here utilizes correlations as well via bivariate regressions In the first stage the bivariate model regresses capital flows on the channel of interest If the first stage results indicate that the channel is significantly correlated with capital flows then in the second stage the model regresses the predicted value of the channel
Real GDP Growth
Net Total FlowsGDP
FDI FlowsGDP
Debt FlowsGDP
Portfolio FlowsGDP
Real GDP Growth 100Net Total FlowsGDP 038 100FDI FlowsGDP 066 054 100Debt FlowsGDP -002 072 -007 100Portfolio FlowsGDP -006 031 -010 002 100
Real GDP Growth
Net Total Flows per
capitaFDI Flows per capita
Debt Flows per capita
Portfolio Flows per capita
Real GDP Growth 100Net Total Flows per capita 037 100FDI Flows per capita 044 089 100Debt Flows per capita 008 053 022 100Portfolio Flows per capita -007 025 -001 -006 100Note indicates significant at 10 percentSource Authors calculations
Table 5 Correlations Net Capital Flows and Real Growth
24
from the first regression ie that part of the channel variable correlated with capital flows on growth If the coefficient in the second regression is significant and with the expected sign it implies that the channel is likely to be operational for this particular sample of countries Evidence that a particular channel could be at work is not sufficient to demonstrate the impact of private capital flows on growth but it is a necessary first step Thus Yi = α1 + β Ki + u1 (1) gi = α 2 + η Ŷi + u2 (2) Where Yi is the channel variable of interest Ki are capital flows normalized over GDP or population gi is the real GDP growth rate and Ŷi is the predicted value of the channel variable of interest derived from the first regression All variables are in their level values so that sign and significance of β and η are of greater interest than their magnitude The results are presented in Table 6 below
Overvaluation InvestmentDomestic
Savings InstitutionsNet flowsGDP -0004 0164 0337 -0214Net flows per capita -000003 0012 0021 -00042Note and indicate significant at 1 and 5 percent respectivellySource Authors calculations
Table 6 Channels of Transmission Between Capital Flows and Growth
The findings indicate that in most instances capital flows are not significantly correlated with the channel variables in our sample Except when capital flows are scaled to the size of the recipient countryrsquos population mdash both savings and investment are positively and significantly related to capital flows in this instance14 This implies that for SSA countries the impact of private capital flows on growth could be partly intermediated through the impact of net capital flows on domestic savings and investment Another implication would also be that African economies are not necessarily investment-constrained15 14 As expected the impact of the predicted values of investment and domestic savings in the second stage regressions is positive
15 Rodrik and Subramanian (2009) define an economy to be savings-constrained when private investment is low despite the existence of many privately profitable projects because credit is either not available or too costly and to be investment-constrained when credit is available but there is a lack of profitable investment opportunities (p12) In savings-constrained economies foreign capital will supplement scarce domestic savings (evidenced by high real interest rates) and lead to increased investment In investment-constrained economies real interest rates will be low and additional capital flows will finance consumption rather than investment
25
In an unexpected outcome the institutional variable is negatively related to growth a result that holds even when oil-exporters are excluded from the sample (not shown)
C How do Private Capital Flows Affect Growth Going beyond bivariate correlations we first present a simple cross-country multivariate regression model making use of a averages for the 2000-07 period 16 Although this method is not without shortcomings the limited time coverage of our dataset and year-on-year volatility dampens the usefulness of panel estimation However our analysis is subject to the considerable limitations of the ordinary least squares estimator in growth models mdash especially those arising from endogenous variables We fit a simple ordinary least squares specification to estimate the relationship between capital flows and growth gi = α + β Ki + η Xi + ui Where gi is real GDP growth Ki are capital flows normalized over GDP or population Xi is a set of control variables and ui is an independent error term In our choice of control variables we are guided by the ldquochannelsrdquo analysis from the preceding section since our interest in primarily in the impact of capital flows on growth Thus our multivariate model is essentially a simultaneous test of the correlations between of the various channel variables (plus capital flows directly) and growth As discussed above other factors shown in the literature on financial globalization to influence growth include savings and investment exchange rate overvaluation and institutions The exchange rate overvaluation measure is constructed as the ratio of the nominal exchange rate to the purchasing power parity exchange rate17 The measure of institutions used here is the number of procedures to enforce a contract (Contracts) from the World Bankrsquos Doing Business database We also control for level of economic development by including the log of initial per capita real GDP growth The results are documented in Table 7
16 See Appendix Table IV1 and Appendix Table IV2 for summary statistics and correlations for the variables included here 17 More precisely the variable is the residual of a simple panel regression between the nominal exchange rate (local currency per US dollar) versus the PPP valuation of the exchange rate The regression was run for all countries in the world and the variable is normalized to be 1 for the world as a whole
26
[1] [2] [3] [4]Initial per capita GDP (log) -153 -186 -167 -216
(-311) (-403) (-362) (-415)Overvaluation -082 -153 -068 -125
(-045) (-084) (-038) (-068)Domestic savings 009 010 009 010
(339) (359) (361) (362)Investment 018 016 015 017
(333) (293) (258) (297)Contract enforcement 011 009 009 008
(164) (142) (153) (123)Net total flowsGDP 011
-194Net total flows per capita 0003
205Total inflowsGDP 018
(227)Total inflows per capita 0003
(147)Constant -106 412 054 629
(-013) (054) (007) (080)
Adjusted R2 051 052 053 057Number of observations 42 42 42 42Note and indicate significant at 1 5 and 10 percent respectivelly t-statistics in parenthesis
Table 7 Estimation Results Linear Growth Model with Capital Flows
The results indicate that capital flows are positively and significantly (in all but one instance) associated with growth Initial per capita GDP comes in with a negative and significant coefficient in all specifications indicating support for growth convergence Domestic savings and investment are the other significant right-hand side variables that also come in with the expected sign Contract enforcement the proxy for institutional development is not significant in any of the specifications Overvaluation has the expected sign but is never significant Estimating the equation with measures of net FDI instead of total net private capital yields similar results with an even stronger association between the FDI variable and growth Aside from the positive correlations and partial evidence of a possible through the savings-investment channel our analysis is rendered incomplete by the short time period since these inflows began While the limited number of observations in our sample required us to focus on average growth and inflows over the period 2000-2007 most of the inflows came late in this period This is an issue which requires further study as additional observations (years) become available As described in Section II the observed rise in private capital flows and growth during the sample period is an important necessary condition in particular because other studies even fail to uncover such an association for different country groups andor sample periods However it is also far from sufficient for making inferences about causality
27
V CONCLUSION
As a result of the global financial crisis and recession private capital flows to all regions of the world have declined Even when the international economy recovers and financial markets return to health it is likely that investors will remain for some time more risk-averse than they were previously At the same time donor flows to low-income countries including those in sub-Saharan Africa are likely to be adversely impacted by these global developments Our results were inconclusive regarding the impact of private capital flows on growth in SSA countries Additional research will be needed before a definitive statement can be made in this regard once additional observations are available However most SSA countries are likely to remain dependant on financial inflows in some form to help finance current account deficitsmdashdeficits that will be the counterpart of development-oriented investments in these economies As donor flows are likely to be restricted in the coming years due to the fiscal problems the traditional donor countries find themselves confronting SSA countries will need private capital flows to finance these current account deficits The alternative would require smaller or no current account deficits meaning reduced development-oriented investments in infrastructure and other key areas with adverse consequences for growth potential All this means that policy makers in SSA will need to pay increasing attention to efforts to attract private capital to their countries Our results indicate that one of the most important things policy makers can do to attract private capital is to strengthen domestic capital markets Deep and well-functioning money foreign exchange equity and (where relevant) derivative markets are key to attracting private capital Governments in SSA countries would be well-advised to redouble their efforts to develop and strengthen these markets to put their countries in a position to attract private capital in the future At the same time an important of the current financial crisis should also be to put in place strong monitoring regulatory and supervisory frameworks to avoid a buildup of balance-sheet vulnerabilities
28
Appendix I Capital Flows Data The information on private capital flows is based on detailed balance of payments data obtained from AFR country desk economists in late 2007 for 44 sub-Saharan African countries Data for 2000-2006 are actual and data for 2007 are preliminary estimates The data distinguishes between FDI portfolio (debt and equity) and private debt-creating flows and between inflows and outflows The definition of capital inflows adopted for this study differs from other papers using balance of payments data as a measure of capital flows (see Appendix Box I1 for precise definitions used in the paper) Appendix Box I1 Balance of payments recording of capital flows
From the perspective of the financial account one usually thinks of changes in liabilities as positive (inflows) and changes in assets as negative (outflows) In practice both changes in liabilities and assets are reported as net of any disinvestment and consequently both can have any sign In the BOP accounts an increase (decrease) in liabilities to nonresidents is entered as positive (negative) while an increase (decrease) in net foreign assets held by residents is entered as negative (positive) If a resident sells an asset held abroad the transaction is recorded as a reduction in net foreign assets held by residents bringing an inflow of capital For this study capital inflows (outflows) are taken to be the sum of increases (decreases) in liabilities to non-residents and of decreases (increases) in net foreign assets held by residents in a year This allows to capture all transactions that give rise to a inflow of capital into a country on the liability and asset side and avoids negative ldquoinflowsrdquo Net flows of capital are calculated as the sum of the inflows (positive sign) and outflows (negative sign)
This data differs from other published data sources with respect to its timeliness coverage and level of detail bull The 2000-2007 period covers the most recent episode of private capital inflows to
sub-Saharan Africa which took off around 2005-2006
bull It covers 43 sub-Saharan African countries
bull It allows to distinguish between different types of private capital flows (FDI portfolio flows and debt-creating flows) In contrast with other studies (eg Faria and Mauro 2004) that add together FDI and portfolio equity flows we keep them separate and group portfolio debt and equity (either category is too small to stand on its own) We are interested in the determinants of various types of flows particularly as regards the development of financial markets and straight FDI doesnrsquot require any particular type of financial market infrastructure However portfolio debt and equity investment require the existence of bond and equity markets
Other data sources that cover all sub-Saharan African countries include the IMFrsquos WEO IFS Balance of payments data and the World Bankrsquos global development finance data Another
29
widely used data base is the Lane-Milesi-Ferretti data but the most recent updated version goes until 2005 and covers only a sub-set SSA countries Another group of studies use current account data as a proxy for capital flows (Prasad et al 2007 Gourinchas and Jeanne 2007) ndash which have the advantage of providing wide coverage in terms of years and countries but make it impossible to disaggregate between official and private transfers and different types of capital flows The Fundrsquos World Economic Outlook (WEO) database and the World Bankrsquos Global Development Finance (GDF) database provide the most comprehensive coverage of capital flows to sub-Saharan countries These data sets have few missing countries and few missing observations for the countries that are in the data sets However the comprehensiveness of the WEO and the GDF databases is achieved at a price as each data set relies on Fund and Bank staff estimates to fill in the lacunae left from official statistics (Dorsey et al 2008) Other data sets such as the Fundrsquos International Financial Statistics and the Balance of Payments Statistics databases rely on official reporting without the use of staff estimates to fill in the gaps The more detailed and comprehensive coverage of the international transactions at the country level is available in the Balance of Payment Statistics published once a year by the IMF Although information for most of the sub-Saharan African countries is included in the publication the most recent database shows a complete set of annual data for just 18 out of 44 countries in the region mostly the middle-income countries two oil-exporters and the largest low-income economies among them The other countries have missing data either for the capital flows components or some years specially at the end of the period covered in the study which is crucial for the econometric analysis The work of the country desk economists was essentially to make sure that all series were available and the components were consistent with the main aggregates We checked also consistency across the different published databases finding discrepancies mostly in the last few years of the sample and few revisions to historical numbers in the early 2000rsquos for the countries with data in the various publications Looking into the World Economic Outlook database there is a full coverage of the countries in the region but it is difficult to separate actual figures from the forecasted ones or estimates (specially for countries with lags in reporting official data from the authorities) and programs with the Fund requiring accurate estimates on the missing BOP data embedded in the Program We used the WEO data which are also reported by country desk economist in the Fund as a starting point and asked the desk economists to look into the details and components that are normally not used in the aggregated analysis of the external accounts offered in the WEO studies and data In brief we have not created a separate database but rather taken the available information and refined it in a way that allows us to cover as many countries in the region as possible regardless of the size of the country and the level of development weighing properly in the model those countries with no capital flows (reporting zeros) and including those null figures as information in the dependent variable
30
Appendix II Variables Definitions and Sources
Variable Description Units Source
Net total flows FDI portfolio and debt net flows See below Billions of US$ IMF African Department database
Net FDI Net foreign direct investment flows (FDI in the reporting economy net of direct investment abroad)
Billions of US$ IMF African Department database
Net portfolio and debt flows Net private portfolio investment and other private flows Includes equity and debt securities as well as all other net private debt creating flows
Billions of US$ IMF African Department database
Total Inflows FDI portfolio and debt inflows See below Billions of US$ IMF African Department database
FDI Inflows Foreign direct investment in the reporting economy Billions of US$ IMF African Department database
Portfolio and debt inflows Portfolio investment liabilities including equity and debt securities liabilities plus other private capital inflows Includes all other private debt creating flows (Liabilities excludes monetary authorities and government)
Billions of US$ IMF African Department database
CPIA Country Policy and Institutional Assessment Composite index based on sixteen criteria grouped in four categories (i) economic management (ii) structural policies (iii) policies for social inclusion and equity and (iv) public sector management and institutions
1 to 7 World Bank
Financial Institutions Index of capital markets development defined as the sum of four dummy variables Treasury bills treasury bonds corporate bonds and equity markets exist
0 1 2 3 4 with 0 for countries without any market to 4 for countries with all four markets present
Lukonga (forthcoming) and authors calculations
Rule of law The extent to which agents have confidence in and abide by the rules of society and in particular the quality of contract enforcement the police and the courts as well as the likelihood of crime and violence One of the six components of the Governance Indicators
-25 (lower score) to 25 for the highest score
httpinfoworldbankorggovernancewgiindexasp
South Africa and Nigeria Dummy variable 1 for South Africa and Nigeria 0 otherwise 0 1 Authors calculations
Oil exporters Dummy variable 1 for Angola Cameroon Chad Congo Rep of Equatorial Guinea Gabon and Nigeria 0 otherwise
0 1 IMF African Department database
Real GDP growth Real GDP growth Calculated as the percent change of the constant Gross domestic product in 2000 local currency units Measure of quality of macroeconomic policies
Percent IMF World Economic Outlook
Secondary enrollment Total enrolment in secondary level of education regardless of age expressed as a percentage of the population in the official age group corresponding to this level of education
Percent World Bank World Development Indicators
2000 per capita GDP Per capita GDP in constant US dollar for the year 2000 Constant 2000 US dollars IMF World Economic Outlook
Capital account openness De jure capital account openness index as the simple average of four dummy variables representing exchange rate arrangements payments restrictions on current and capital transactions and
t i ti i t f t di A l f
Index Chinn-Ito forthcoming
Trade openness Sum of exports and imports of goods and non-factor services over GDP
Percent of GDP IMF World Economic Outlook
British legal origin Dummy variable that takes the value 1 for former British colonies and 0 otherwise
0 1 La Porta et al (1999)
Ethno linguistic fragmentation
Average value of five different indices of ethno linguistic fractionalization
Index La Porta et al (1999)
Latitude Measure of the closeness to the equator Miles La Porta et al (1999)
Appendix II Variables Definitions and Sources
31
Overvaluation Residual of a simple panel regression between the nominal exchange rate (local currency per US dollar) Vs the PPP valuation of the exchange rate The regression includes 182 countries The overvaluation measure in normalized to be 1 for the world
Deviation from equilibrium between PPP and market rate with 1 defined as the norm
IMF African Department database
GDP in dollars GDP in dollars (Converted at the nominal market exchange rate) Billions of US$ IMF World Economic Outlook
Per capita GDP in dollars Per capita GDP (constant 2000 US dollar) Constant 2000 US dollars IMF World Economic Outlook
Inflation Headline consumer price index (Average annual percent change) Percent IMF World Economic Outlook
Government balance General government balance excluding grants Percent of GDP IMF World Economic OutlookCredit Total credit to the private sector in percent of GDP Percent of GDP IMF International Financial StatisticsCurrent account Current account balance excluding grants Percent of GDP IMF African Department databaseREER Real effective exchange rate weighted index using total trade
(exports and imports composition for 1999 to 2001) and consumer price indices
Percent IMF Information Notice System
NEER Nominal effective exchange rate weighted index using total trade (exports and imports composition for 1999 to 2001)
IMF Information Notice System
US Tbill rate United States Treasury bill rate Percent IMF International Financial StatisticsTerms of trade Terms of trade (Exports prices to import prices goods and services) Percent IMF World Economic Outlook
Rest of the world real GDP Rest of the world real GDP growth (Weighted by country exports) Percent IMF World Economic Outlook
Oil prices Price of oil Simple average of Texas Dubai and Brent prices deflated by the manufacturing unit cost index
Percent IMF World Economic Outlook
Domestic savings Total domestic savings Percent of GDP IMF World Economic OutlookInvestment Total private investment Percent of GDP IMF World Economic Outlook
Reserves Stock of international reserves (US dollar billions) Billions of US$ IMF World Economic Outlook
Non-fuel commodity prices Real non-fuel commodity price (Weighted by country specific exports deflated by the manufacturing unit price)
Percent IMF World Economic Outlook
Population Population Millions IMF World Economic OutlookContract enforcement Efficiency of contract enforcement by following the evolution of a
sale of goods dispute and tracking the time cost and number of procedures involved from the moment the plaintiff files the lawsuit until actual payment
Number of procedures httpwwwdoingbusinessorg
Constraint on the executive Index that ranks from 1 (unlimited authority to the executive) to 7 (Executive parity or subordination) as decribed in the Freedom House Index
1 to 7 httpwwwfreedomhoseorg and Polity IV Databse at wwwsystemicpeaceorg politypolity4htm
ICRG ranking International Country Risk Guide rank for each country is based on three components of risk analysis Political financial and economic components The higher the rating the lower the risk for that particular country The index covers 140 countries
0 to 100 wwwprsgroupcom
Appendix II Variables Definitions and Sources (Contd)
32
Appendix III Determinants of Capital Flows Descriptive Statistics and Correlations
Total inflows FDI inflows Portf amp debt Share of FDI Total inflows FDI inflows Portf amp debt Total inflows FDI inflows Portf amp debt
Financial Institutions 031 033 026 008 002 -005 019 -012 -011 -006004 003 009 062 088 074 022 044 050 070
Rule of Law -021 -029 -015 003 013 005 027 -007 -009 000018 006 034 083 042 077 007 065 058 099
Market size 087 093 074 000 005 -003 021 -006 -004 -005000 000 000 099 077 084 019 069 079 074
Oil exporter 010 043 -004 045 019 027 -005 034 054 -019052 000 078 000 023 008 075 003 000 022
Real GDP growth 012 039 000 034 028 041 -010 055 070 -005043 001 099 003 007 001 052 000 000 077
Secondary enrollment 036 019 039 003 060 044 081 009 011 000002 023 001 083 000 000 000 057 050 099
Log 2000 GDP per capita 027 020 026 027 063 052 070 011 026 -020008 019 009 008 000 000 000 049 009 020
Capital account openness -007 -005 -007 -004 012 006 022 007 001 011066 073 068 079 046 072 016 066 094 049
Trade openness -017 -017 -015 011 014 015 008 013 017 -003027 027 034 050 036 033 059 042 027 086
UKleg 027 028 023 016 -010 -011 -005 -010 -004 -011008 007 014 031 052 048 076 053 078 047
Ethling 015 021 011 012 006 004 009 -005 001 -010033 018 048 044 069 080 055 077 094 053
LAT -011 -012 -009 039 -004 -006 002 -015 -005 -020050 046 057 001 080 068 088 032 073 020
Pop_dens 000 -003 002 -047 -004 -005 -002 004 -023 037099 085 093 000 080 075 089 081 018 003
Note pairwise correlation coefficient reported in first row significance level reported in second row Source Authors calculations
Appendix Table III2 Bivariate Correlations of Capital Flows with Independent Variables
(US$ mn) (per capita) (in percent of GDP)
1 Dependent variables Observations Minimum Maximum Mean MedianStandard Deviation
Total inflows 43 63 162106 8265 2339 25410FDI inflows 43 00 42371 3598 909 8027Portfolio and debt inflows 43 00 130724 4666 1021 19786Total inflows per capita 43 35 16250 1291 255 3078FDI inflows per capita 43 00 11653 826 105 2325Portfolio and debt inflows pc 43 00 5906 465 147 1038Total inflows to GDP 43 11 307 81 62 65FDI inflows to GDP 43 00 290 42 24 53Portfolio and debt inflows to GDP 43 00 187 39 32 36
2 Explanatory variablesFinancial institutions 43 00 40 18 10 16Rule of law 43 -18 08 -07 -07 06Market size 43 00 10 00 00 02Oil exporter 43 00 10 02 00 04Real GDP growth 43 -04 201 48 42 36Secondary enrollment 42 82 1079 342 283 226Log of 2000 GDP per capita 43 45 90 61 58 11Capital account openness 43 -16 25 -05 -11 13Trade openness 43 369 1559 818 789 3043 Alternative measures of institutions and instrumentsCPIA 42 18 43 32 32 06Doing Business Index 43 303 1760 1321 1487 410ICRG ranking 28 483 808 614 605 73Legal rights 43 10 80 40 35 16Property rights 41 14 45 30 30 06Constraint on the executive 40 17 70 41 43 16British legal origin 43 00 10 03 00 05Ethnolinguistic fragmentation 42 00 10 06 07 03Population density in 1500 36 01 250 38 20 55Latitude 43 00 07 01 01 01Source Authors calculations
Appendix Table III1 Descriptive Statistics for Regression Variables
33
Fin Instit Rule of Law Market size Oil exporter Real GDP growth Second Enr Log 2000 GDP pc Capital open Trade openTotal inflows
Financial Institutions 100
Rule of Law 042 100000
Market size 032 -023 100004 015
Oil exporter -022 -034 020 100016 002 019
Real GDP growth 008 001 012 047 100060 095 044 000
Secondary enrollment 040 049 027 -008 -012 100001 000 008 063 044
Log 2000 GDP per capita 034 039 018 024 000 083 100002 001 025 012 098 000
Capital account openness 034 019 -006 -020 -005 031 020 100003 021 071 021 074 005 030
Trade openness -015 -008 -022 003 -010 008 010 -001 100035 061 017 085 054 061 060 096
Note Pairwise correlation coefficients reported in first row significance level reported below Source Authors calculations
Appendix Table III3 Bivariate Correlations of Baseline Regression Variables
Financial inst CPIA indexDoing
Business ICRG ranking Legal rightsRule of
law Property rightsConstraint on the executive
British legal origen
Ethnoling fragmentation Latitude
Population density
Financial institutions 100
4300
CPIA index 063 100000
4200 4200
Doing Business index -060 -044 100000 000
4300 4200 4300
ICRG ranking 029 040 -069 100013 003 000
2800 2800 2800 2800
Legal rights 061 046 -061 020 100000 000 000 030
4300 4200 4300 2800 4300
Rule of Law 042 063 -069 082 034 100000 000 000 000 003
4300 4200 4300 2800 4300 4300
Property rights 057 081 -064 070 046 081 100000 000 000 000 000 000
4100 4100 4100 2700 4100 4100 4100
Constraint on the executive 044 041 -051 016 042 049 055 100000 001 000 043 001 000 000
4000 3900 4000 2800 4000 4000 3800 4000
British legal origin 059 040 -055 031 069 021 036 028 100000 001 000 011 000 018 002 008
4300 4200 4300 2800 4300 4300 4100 4000 4300
Ethnolinguistic fragmentation 017 -015 005 -032 014 -029 -018 002 011 100027 036 074 010 038 006 028 093 050
4200 4100 4200 2800 4200 4200 4000 3900 4200 4200
Latitude 009 016 -028 037 013 030 029 019 011 001 100058 032 007 006 041 005 007 025 049 094
4300 4200 4300 2800 4300 4300 4100 4000 4300 4200 4300
Population density -014 -002 021 -025 -045 -023 -011 -018 -018 -043 -037 100042 090 022 022 001 017 052 031 028 001 003
3600 3600 3600 2500 3600 3600 3600 3500 3600 3500 3600 3600Note Pairwise correlation coefficients reported in first row significance level reported in the second row and number of observation in the third row Source Authors calculations
Appendix Table III4 Bivariate Correlations of Measures of Institutions and Instruments
34
Appendix IV Private Capital Flows and Growth
Variable Number of
observations MeanStandard deviation Min Max
Real GDP growth 43 48 36 -04 201Initial per capita GDP 43 61 11 45 90Net total flowsGDP 43 37 74 -109 271Net total flows per capita 43 547 2782 -5006 12323Total inflowsGDP 43 77 57 10 282Total inflows per capita 43 1311 3139 35 16450Overvaluation 43 11 03 07 17Domestic savings 42 122 200 -247 813Investment 42 216 87 87 469Contract enforcement 43 1014 66 826 1133Source Authors calculations
Appendix Table IV1 Private Capital Flows and Growth Summary Statistics for Multivariate Regression
Rea
l GD
P gr
owth
Initi
al p
er
capi
ta G
DP
Net
flow
sG
DP
Net
flow
s pe
r ca
pita
Inflo
ws
GD
P
Inflo
ws
per
capi
ta
Ove
rval
uatio
n
Dom
estic
sa
ving
s
Inve
stm
ent
Con
tract
en
forc
emen
t
Real GDP growth 100
Initial per capita GDP 000 100
NetflowsGDP 038 -013 100
Netflows per capita 037 028 067 100
InflowsGDP 049 016 076 066 100
Inflows per capita 028 063 042 087 061 100
Overvaluation -032 -021 -011 -003 -024 -016 100
Domestic savings 048 058 013 029 028 048 -036 100
Investment 045 045 014 039 045 051 -026 042 100
Contract enforcement 018 -007 -024 -018 -017 -013 -015 010 -012 100Note indicates significant at 10 percentSource Authors calculations
Appendix Table IV2 Private Capital Flows and Growth Pairwise Correlations for Multivariate Regression
35
References
Acemoglu D and S Johnson 2005 ldquoUnbundling Institutionsrdquo Journal of Political
Economy Vol 113 No 5 pp 949995 Acemoglu D Johnson S and D Robinson 2002 ldquoReversal of Fortune Geography and
Institutions in the Making of the Making of the Modern World Income Distributionrdquo Quarterly Journal of Economics pp 12311294
Albuquerque R 2003 ldquoThe Composition of International Capital Flows Risk Sharing
Through Foreign Direct Investmentrdquo Journal of International Economics Vol 61 pp 353ndash383
Alfaro L and A Charlton 2007 ldquoInternational Financial Integration and Entrepreneurial
Firm Activityrdquo NBER Working Paper No 13118 (Cambridge Massachusetts National Bureau of Economic Research)
mdashmdashmdash S Kalemli-Ozcan and V Volosovych 2005a ldquoCapital Flows in a Globalized
World The Role of Policies and InstitutionsrdquoNBER Working Paper No 11696 (Cambridge Massachusetts National Bureau of Economic Research)
mdashmdashmdash 2005b ldquoWhy Doesnrsquot Capital Flow from Rich to Poor Countries An Empirical
Investigationrdquo NBER Working Paper Series No 11901 (Cambridge Massachusetts National Bureau of Economic Research)
Auty R M ed 2001 Resource abundance and Economic Development Improving the
Performance of Resource-Rich Countries (Oxford Oxford University Press) mdashmdashmdash and A Gelb 2001 ldquoPolitical Economy of Resource-Abundant Statesrdquo in Resource
abundance and Economic Development Improving the Performance of Resource-Rich Countries ed by R M Auty (Oxford Oxford University Press)
Becker T O Jeanne P Mauro J D Ostry and R Ranciegravere 2007 Country InsurancemdashThe Role of Domestic Policies IMF Occasional Paper No
254 (Washington International Monetary Fund) Bekaert G Campbell R H and C Lundblad 2005 ldquoDoes Financial Liberalization Spur
Growthrdquo Journal of Financial Economics Vol 77 (July) Chinn MD and H Ito 2007 ldquoA New Measure of Financial Opennessrdquo Available via the
Internet at wwwsscwiscedu7Emchinnresearchhtml
36
Chinn MD and H Ito 2006 ldquoWhat Matters for Financial Development Capital Controls Institutions and Interactionsrdquo Journal of Development Economics Vol 81 (October) pp 163ndash92
Chinn MD Ito H 2002 ldquoCapital Account Liberalization Institutions and Financial
Development Cross-Country Evidencerdquo NBER Working Paper Series No 8967 (Cambridge Massachusetts National Bureau of Economic Research)
DellAriccia G Di Giovanni J Faria A Kose M A Mauro P Schindler M Terrones M and J D Ostry 2008 ldquoReaping the Benefits of Financial Globalizationrdquo IMF Occasional Paper No 264 (Washington International Monetary Fund)
Dorsey T E Tadesse H Singh S and Z Brixiova 2008 ldquoThe Landscape of Capital
Flows to Low-Income Countriesrdquo IMF Working Paper 0851 (Washington International Monetary Fund)
Edison H Klein M W Ricci L A and T Slok 2004 ldquoCapital Account Liberalization
and Economic Performance Survey and Synthesisrdquo IMF Staff Papers Vol 51 No 2 pp 220256
Faria A and P Mauro 2004 ldquoInstitutions and the External Capital Structure of Countriesrdquo
IMF Working Paper 04236 (Washington International Monetary Fund) mdashmdashmdash Minnoni M and AZaklan 2006 ldquoThe External Financing of Emerging Market
Countries Evidence from Two Waves of Financial Globalizationrdquo IMF Working Paper 06205 (Washington International Monetary Fund)
Glaeser E L and A Shleifer 2002 ldquoLegal Originsrdquo Quarterly Journal of Economics
Vol117 pp 1193ndash1229 Gourinchas P-O and O Jeanne 2007 ldquoCapital Flows to Developing Countries The
Allocation Puzzlerdquo NBER Working Paper No 13602 (Cambridge Massachusetts National Bureau of Economic Research)
International Monetary Fund 2007 Global Financial Stability Report (Washington
October) mdashmdashmdash 2008 Regional Economic Outlook Sub-Saharan Africa (Washington September) Ju J and S-J Wei 2007 ldquoDomestic Institutions and the Bypass Effect of Financial
Globalizationrdquo NBER Working Paper No 13148 (Cambridge Massachusetts National Bureau of Economic Research)
37
mdashmdashmdash 2006 ldquoA Solution to Two Paradoxes of International Capital Flowsrdquo NBER Working Paper No 12668 (Cambridge Massachusetts National Bureau of
Economic Research) Karl T L 1997 The Paradox of Plenty Oil Booms and Petro-States (Berkeley University
of California Press) Kaufmann D Kray A and M Mastruzzi 2008 ldquoGovernance Matters VII Aggregate and
Individual Governance Indicators 1996-2007rdquo Policy Research Working Paper No 4654 (Washington DC World Bank Group)
Klein MW 2005 ldquoCapital Account Liberalization Institutional Quality and Economic
Growth Theory and Evidencerdquo NBER Working Paper No 11112 (Cambridge Massachusetts National Bureau of Economic Research)
Kose M A Prasad E Wei S-J and K Rogoff 2006 ldquoFinancial Globalization A
Reappraisalrdquo IMF Working Paper 06189 (Washington DC International Monetary Fund)
Lane P R 2004 ldquoEmpirical Perspectives on Long-Term External Debtrdquo Topics in Macroeconomics Vol 4 No 1 httpwwwbepresscombejmtopicsvol4iss1art1 La Porta R F Lopez-de-Silanes A Shleifer and R W Vishny 1999 ldquoThe Quality of
Governmentrdquo Journal of Law Economics and Organization Vol 15 pp 222ndash79 Lukonga forthcoming ldquoFinancial Market Development Survey of Sub-Saharan African
Countriesrdquo mimeo Mauro P Minnoni M and AZaklan 2006 ldquoThe External Financing of Emerging Market
Countries Evidence from Two Waves of Financial Globalizationrdquo IMF Working Paper 06205 (Washington International Monetary Fund)
Miniane J 2004 ldquoA New Set of Measures on Capital Account Restrictionsrdquo IMF Staff Papers Vol 51 No 2 pp 276ndash308 Mishkin F S 2006 The Next Great Globalization How Disadvantaged Nations can
Harness their Financial Systems to Get Rich (Princeton NJ Princeton University Press)
Obstfeld M and A M Taylor 2004 Global Capital Markets Integration Crisis and Growth Cambridge University Press (2004) Portes R and H Rey 2005 ldquoThe Determinants of Cross-Border Equity Flowsrdquo Journal of
International Economics Vol 64 pp269-296 Prasad Eswar S Raghuram G Rajan and Arvind Subramanian 2007 ldquoForeign Capital and Economic Growthrdquo Brookings Papers on Economic Activity 1 Brookings
38
Quinn D P 1997 ldquoThe Correlates of Change in International Financial Regulationrdquo
American Political Science Review Vol 91 (September) pp 531ndash51 mdashmdashmdash and A Maria Toyoda forthcoming ldquoDoes Capital Account Liberalization Lead to
Economic Growthrdquo Review of Financial Studies Rodrick D 2007 ldquoThe Real Exchange Rate and Economic Growth Theory and Evidencerdquo
Harvard University Working Paper httpksghomeharvardedu~drodrikRER20and20growthpdf
mdashmdashmdash and A Subramanian 2008 ldquoWhy did Financial Globalization Disappointrdquo IMF
Staff Papers Vol 56 No 1 (Washington International Monetary Fund) Schindler M 2009 ldquoMeasuring Financial Integration A New Datasetrdquo IMF Staff Papers
Vol 56 No 1 (Washington International Monetary Fund) Schularick M 2006 ldquoA Tale of Two Globalizations Capital Flows from Rich to Poor in
Two Eras of Global Financerdquo International Journal of Finance and Economics Vol11 pp339-354
Schularick M Steger T 2008 ldquoThe Lucas Paradox and the Quality of Institutions Then
and Nowrdquo Berlin University Working Paper N20083 Stone M R Shimizu S Nordstrom A and H J Ferhani 2008 ldquoDeveloping Essential
Financial Markets in Smaller Economies Stylized Facts and Policy Optionsrdquo IMF Occasional Paper No 265 (Washington International Monetary Fund)
World Bank 2007 Global Development Finance The Globalization of Corporate Finance in Developing Countries (Washington World Bank Group)

6
II RECENT TRENDS IN FINANCIAL GLOBALIZATION IN SSA
In the period of the recently-ended boom in global financial markets inflows of private capital became the most important source of external finance for sub-Saharan Africa The increase in private capital flows to the region was in line with that in other regions and all low-income countries (Dorsey et al 2008 World Bank 2007) On average in the period between 2001 and 2007 total gross inflows to the region increased by 32 percent annuallymdashthe rate accelerating to 44 percent after 2005 Private capital flows to SSA have risen almost 6-fold since 2000 from about $15 billion to about $84 billion in 2007 (the latest year for which data is available) Recorded private capital outflows are on the whole much smaller than inflows so that in 2007 net capital flows to sub-Saharan Africa amounted to about US$76 billion As of 2007 private capital flows represented 10 percent of the regionrsquos GDP about twice the volume of official development assistance (about US$40 billion) A confluence of factors was responsible for the surge in private capital A significantly improved macroeconomic performance across much of the continent (Figure 2) and for some countries the implementation of the Multilateral Debt Relief Initiative (MDRI) coincided with increases in global liquidity and higher oil and commodity prices (Figure 3)
Figure 2 Global Liquidity ldquoPushrdquo Factors
Source African Department Database and IMF staff calculations
Fig 2a World Real GDP Growth ( Percent)
0
1
2
3
4
5
6
2000 2001 2002 2003 2004 2005 2006 2007
Fig 2b Oil And Commodity Prices (percent change)
-50
-40
-30
-20
-10
0
10
20
30
40
50
60
2000 2001 2002 2003 2004 2005 2006 2007
Non-fuel commodity prices
Oil prices
7
Figure 3 Domestic ldquoPullrdquo Factors
Source African Department Database and IMF staff calculations
Fig 3a Sub-Saharan Africa Real GDP Growth and Per Capita GDP
0
1
2
3
4
5
6
2000 2001 2002 2003 2004 2005 2006 20070
200
400
600
800
1000
1200
1400
1600
1800
2000(Percent) (US dollars)
Real GDPgrowth
(left scale)
Per capita GDP(right scale)
Fig 3bSub-Saharan Africa Inflation and Central Government Balance
0
5
10
15
20
25
30
2000 2001 2002 2003 2004 2005 2006 2007-10
-9
-8
-7
-6
-5
-4
-3
-2
-1
0
Note Excluding Zimbabwe
(Annual averagepercent)
(Percent ofGDP)
Inflation(left scale) Government balance
(right scale excludes grants)
These inflows represent a potential source of vulnerability as countries become increasingly dependent on potentially volatile private capital flows While the overall volatility of capital flows fell in the latter years in the sample the volatility of FDI has actually increased (Table 1)2 In addition for low income SSA countries in particular there has been a strong correlation between capital inflows and current account balances with inflows increasing as the current account improves and decreasing as the current account deteriorates magnifying the resulting swings in the overall balance of payments (Figure 6) On the other hand the surge in private capital inflows has contributed to a steady increase in international reserves of SSA countries providing these countries with increased scope to finance balance of payments deficits
MeanStandard Deviation Volatility Mean
Standard Deviation Volatility
Total inf low 198 45 44 522 243 21FDI 124 50 25 186 42 45Portfolio 13 07 19 177 131 14Private deb 61 05 132 158 88 18Source IMF African Department database 2008
Table 1 Private Capital Flows Volatility2000-03 2004-07
2 An important factor in the increase in FDI volatility seems to be a fairly large movement in FDI in South Africa in 2005-2006
8
Figure 4 Recipients of Private Capital Flows
Fig 4c Share of Portfolio and Debt Flows 2000-03(percent of total)
South Africa 231
Kenya 74
Ethiopia 68
Ghana 68Congo Dem Rep of 63
Other SSA 496
Fig 4d Share of Portfolio and Debt Flows 2004-07(percent of total)
South Africa 728
Nigeria 56
Ghana 22
Angola 20
Kenya 17
Other SSA 157
Fig 4a Share of FDI Inflows 2000-03
South Africa 273
Nigeria 168
Angola 165
Equatorial Guinea 58
Chad 50
Other SSA 285
Fig 4b Share of FDI Inflows 2004-07
Nigeria 343
South Africa 155Equatorial Guinea
102
Tanzania 32
Congo Republic of 29
Other SSA 338
Figure 5 Top Ten Recipients of Private Capital
F ig 5 a T o t a l In f l o w s( m i l l io n s o f U S d o l la rs )
A n g o la
K e n ya
C h a d
T a n z a n ia
S o u th A f r ic a
N ig e r ia
E q u a t o r ia l G u in e a
G h a n a
C o n g o D e m R e p o f
E t h io p ia
0 5 0 0 0 1 0 0 0 0 1 5 0 0 0 2 0 0 0 0
F i g 5 b I n fl o w s t o G D P( p e r c e n t)
C h a d
S e yc h e l le s
C o n g o R e p u b l ic o f
S atilde o T o m eacute amp P r iacute n c i p e
A n g o l a
E q u a t o r ia l G u in e a
G a m b ia T h e
C a p e V e rd e
C o n g o D e m R e p o f
G u in e a - B i s s a u
0 5 1 0 1 5 2 0 2 5 3 0 3 5
F ig 5 c In f lo w s to P o p u la ti o n( r a ti o )
A n g o la
G a b o nC o n g o
R e p u b l ic o fC a p e V e r d e
N a m ib ia
B o t s w a n a
S o u t h A fr i c a
M a u r i t i u sE q u a t o r i a l
G u in e aS e yc h e l le s
0 5 0 0 1 0 0 0 1 5 0 0 2 0 0 0
Note All rankings based on averages for 2000-07 Source African Department data base and IMF staff calculations
9
Figure 6 External Vulnerability
Fig 6a Low-income African Countries Current Account Balance and Capital Inflows 2000-07
0
100
200
300
400
500
600
700
800
900
2000 2001 2002 2003 2004 2005 2006 2007-14
-12
-10
-8
-6
-4
-2
0
Capital Flowsleft axis
Current Account Balanceright axis
Fig 6b Oil Producers Current Account Balance and Capital Inflows 2000-07
0
500
1000
1500
2000
2500
2000 2001 2002 2003 2004 2005 2006 2007-20
-15
-10
-5
0
5
10
Capital Flowsleft axis
Current Account Balanceright axis
Fig 6c Low Income Africa Countries International Reserves and Capital Flows
0
100
200
300
400
500
600
700
800
900
2000 2001 2002 2003 2004 2005 2006 200700
02
04
06
08
10
12
14
16
Reservesright axis
Capital flowsleft axis
Fig 6d Oil Producers International Reserves and Capital Flows
0
500
1000
1500
2000
2500
2000 2001 2002 2003 2004 2005 2006 20070
2
4
6
8
10
12
Capital Flowsleft axis
Reservesright axis
III DETERMINANTS OF PRIVATE CAPITAL FLOWS TO SSA
This section investigates the determinants of private capital flows to sub-Saharan Africa during 2000-2007 with particular focus on the role of domestic capital market development Capital flows to sub-Saharan Africa particularly portfolio flows have been concentrated in a relatively small number of countries with relatively sophisticated financial markets In these countries capital has flown into equities where the stock market was sufficiently developed (eg Kenya Nigeria) government bonds in countries that had sovereign issues (Botswana Ghana) and short-term government securities (Uganda Tanzania and Zambia) when few other investment vehicles open to non-residents were available The availability of investment instruments appears to have dominated the existence of capital controls For example in Tanzania legal loopholes allowed international investors to purchase significant amounts of government securities although in principle foreigners were not allowed to hold government debt (IMF 2008)3
3 Nevertheless targeted capital controls as in Ghana appear to have been successful in developing the longer end of the market for government debt
10
We use a new indicator of capital market development in sub-Saharan Africa that captures the structure of capital markets Capital markets along with money foreign exchange and derivatives markets form part of a countryrsquos ldquoessential financial marketsrdquo (Stone et al 2008 Lukonga forthcoming) In particular we consider government securities markets both for treasury bills and treasury bonds as well as corporate bond markets and equities markets (see Lukonga forthcoming) We construct a simple index which is the sum of four dummy variables taking the value of 1 if the market in question exists and is well-developed The index covers all sub-Saharan African countries except Somalia Using this index simple tabulations show that the average level of financial market development is fairly low in sub-Saharan Africa with only 10 countries or 21 percent of the sample countries having complete capital markets (Table 2)4 However as discussed earlier these countries are also among the largest recipients of private capital inflows in sub-Saharan Africa along with a few oil exporters (Angola Congo Chad and Equatorial Guinea) While the role of institutional development in attracting international capital flows has been emphasized in recent studies very few have attempted to isolate the role of financial versus basic property rights institutions The measures of financial market development used in the literature and that would be available for low-income countries such as ratios of money and credit to GDP have their limitations They measure outcomes such as the ability of the financial (mostly banking) sector to provide transaction services (in the case of the ratios of money or broad money to GDP) or the capacity of the banking system to channel savings rather than the extent of financial market development as measured by the availability of investment instruments Our empirical results detailed below indicate that along with other factors such as market size (particularly for portfolio inflows) and oil exporting status (particularly for FDI flows) the index of capital market development is a significant and robust determinant of international capital flows to sub-Saharan African countries
4 The countries are Botswana Ghana Kenya Namibia Nigeria South Africa Swaziland Tanzania Uganda and Zambia
11
Capital Markets
T-Bills T-BondsCorporate
Bonds Equities
Botswana X X X XGhana X X X XKenya X X X XNamibia X X X XNigeria X X X XSouth Africa X X X XSwaziland X X X XTanzania X X X XUganda X X X XZambia X X X XBenin X X X Burkina Faso X X X NCape Verde X X N XMauritius X X XMozambique X X X Zimbabwe X X XAngola X X N NCocircte dIvoire N X N XGambia The X X N NSenegal X X N Seychelles X X N NCameroon N N XCongo Dem Rep of X N N NEthiopia X N N NGuinea X N N NGuinea-Bissau X N N NLesotho X N N NMadagascar X N N NMalawi X N N Rwanda X N N NSierra Leone X N NTogo X N Burundi N N NCentral African Republic NChad N N N NComoros N N N NCongo Republic of N N N NEquatorial Guinea N N N NEritrea N N NGabon N N N NLiberia N N N NMali N N NNiger N Satildeo Tomeacute and Priacutencipe N N N N
Sources Lukonga (forthcoming) and authors calculationsNotes X denotes that the market is fairly or very well developed denotes that the market nominally exists or is partially developedN denotes that the market does not exist
Table 2 Capital Market Development in Sub-Saharan Africa
12
A Recent Literature
The starting point of much of the recent literature on determinants of capital flows has been an attempt to explain the Lucas Paradox or why private capital doesnrsquot seem to flow from rich to poor countries Standard neoclassical theory predicts that capital should flow from capital-rich countries (with low marginal productivity of capital) to capital-scarce countries (with a high marginal product of capital) In practice however the bulk of observed flows particularly in the modern period consists of flows among developed economies Compared to the early 20th century era of financial globalization the current wave of capital flows is characterized by massive diversification of flows between high-income economies and a relative marginalization of less-developed economies (Obstfeld and Taylor 2004 Schularick 2006 and Schularick and Steger 2008) Some authors posit that the paradox is due to country-specific fundamentals that tend to lower the marginal product of capital in developing countries such as missing factors of production including human capital poor economic policies and poor institutions (Alfaro Kalemli-Ozcan and Volosovych 2005a and 2005b Faria et al 2006 Faria and Mauro 2004 Schularick and Steger 2008) In this vein a recent study shows that the extent of domestic financial market development and the quality of domestic financial institutions has played a significant role in attracting capital flows to emerging markets (IMF 2007) The second set of explanations centers around international capital market imperfections such as asymmetric information sovereign risk and capital controls For example Portes and Rey (2005) find that informational frictions proxied by geographic distance affect the amount and direction of capital flows and Lane (2004) also finds that credit market frictions are a determinant of debt flows in 1970-1995 The studies that focus on the role of institutions in attracting foreign private capital highlight the importance of basic institutions particularly property rights protection Weak property rights owing to poor quality institutions affect entrepreneursrsquo investment decisions Risks of expropriation armed conflict and malfunctioning legal systems all have a potentially negative impact on the returns from those investments Empirically property rights institutions have been proxied by an index derived from the Kaufman Kray and Mastruzzi World Governance IndicatorsWGIs or by an index derived from the ICRG indicators 5 Using those proxies better quality institutions are found to be positively and significantly correlated with foreign equity flows (Alfaro et al 2005a 2005b) and with a higher share of equity in a countryrsquos total stock of external liabilities (Faria and Mauro 2004 and Faria et al 2006) 5 The ICRG composite index aggregates over several dimensions such as government stability investment profile internal and external conflict non-corruption law and order protection from religious and ethnic tensions non-militarized politics democratic accountability and quality of bureaucracy (wwwprsgroupcom) Similarly the WGIs measure countriesrsquo score according to 6 governance dimensions namely voice and accountability political instability government effectiveness regulatory burden rule of law and control of corruption (wwwworldbankorgwbigovernancegovdata)
13
As mentioned earlier few studies focus on the role played by the extent of domestic financial market development in attracting international capital flows While the literature tends to link capital flows (financial globalization) to improvements in domestic financial systems (eg Chinn and Ito 2005 2002 Mishkin 2006) in principle the direction of causality is not clear Chinn and Ito (2005) and Klein (2005) find empirical evidence supporting the notion of a threshold effect financial openness contributes to equity market development only when a threshold level of general development of legal systems and financial development is attained However although property rights and financial institutions could potentially affect capital flows differently no study of the determinants of capital flows has empirically attempted to properly disentangle the effects of both Ju and Wei (2007 2006) develop theoretical models showing that financial institutions and property rights institutions can have different effects on capital flows Whereas an inefficient financial system can be bypassed by international capital flows as they could come in the form of FDI instead of portfolio and debt flows high expropriation risk cannot be bypassed Conversely the stronger domestic property rights the more the country will benefit from international capital flows
B Estimation strategy and Model
Cross-country regressions have been found appropriate to investigate the fundamental (and thus slow-moving) determinants of why some countries attract more inflows or more of a certain type of inflows than other countries In particular we are interested in testing whether financial institutions have a separate and different effect on capital inflows than property rights institutions That effect may also differ depending on the type of capital flows Empirically Acemoglu and Johnson (2005) show that property rights and contractingfinancial market development institutions do affect economic outcomes differently While property rights institutions have a first order effect on economic outcomes such as long-run GDP growth investment rates and financial depth contracting institutions seem to mostly affect the degree of financial market development As others we use instrumental variables to tackle the issue of reverse causality and endogeneity associated with the measures of institutions (Acemoglu and Johnson 2005 Alfaro Kalemli-Ozcan and Volosovych 2005a and 2005b DellrsquoAriccia et al 2008 Faria et al 2006 Faria and Mauro 2004) Building on the recent literature the reduced-form linear equation to be estimated is
iiiii uCPFK +sdot+sdot+sdot+= χβαμ (1) Where iK is log of average inflows to country i iF is a measure of financial institutions and iP a measure of property rights iC is a set of exogenous control variables and iu is an independent error term α β and γ are coefficients capturing the impact of financial development property rights institutions and other controls on capital flows where α and β are of particular interest and μ is a constant
14
Given that the measures of financial and property rights institutions are endogenous simple OLS estimates of equation (1) will be biased As indicated in Acemoglu and Johnson (2005) the α and β coefficients may capture reverse causality or the effect of some other omitted characteristic Second as financial market development and property rights are measured with error there may be a downward attenuation bias and finally if contracting and property rights institutions are correlated the effect of the type of institution that is measured with greater error will load onto the other variable Following Acemoglu and Johnson (2005) the estimation strategy therefore relies on estimating equation (1) with two-stage least squares (2SLS) using valid and separate instruments for financial and property rights institutions The two first stage equations will thus be of the form
iiiii CELF 11111 εχηδν +sdot+sdot+sdot+=
iiiii CELP 22222 εχηδν +sdot+sdot+sdot+= (2) Where iL and iE are instruments for financial institutions and property rights institutions respectively The key exclusion restriction is that Cov( iu iL ) = Cov ( iu iE ) =0 iu being the error term in the second-stage equation (1)
C Empirical Analysis This study utilizes a unique data set on capital inflows to SSA prepared by the staff of the International Monetary Fund described in Appendix I Choice of variables The following set of variables was chosen to estimate equations (1) and (2) (see Appendix II for definitions and sources Descriptive statistics are presented in Appendix III Table 1 bull Financial institutions are proxied by the simple index of capital market development
described earlier (Lukonga forthcoming) The more developed capital markets the higher capital flows
bull Property rights institutions are proxied by the rule of law score from the World Governance Indicators (Kaufmann Kray and Mastruzzi 2008) Among the six governance dimensions used by Kaufmann et al 2008 this is the closest proxy for property rights protection6 Better property rights protection should lead to higher capital flows
6 Various other proxies for property rights institutions exist and have been used in empirical studies Faria et al (2006) and Faria and Mauro (2004) use the simple average of KKMrsquos governance indicators for a single year Alfaro et al use the ICRG score (2005a 2005b) Acemoglu and Johnson (2005) and Acemoglu Johnson and
(continuedhellip)
15
bull Following Acemoglu and Johnson (2005) we use British legal origin as the instrument for financial market development taken from La Porta et al (1999) Acemoglu Johnson and Robinson 2002 Glaeser and Schleifer 2002 and La Porta et al1999 show that in the case of former European colonies legal origin is a valid instrument for contracting institutionsfinancial market development and property rights respectively Legal origin is shown to be positively and significantly associated with financial institutions with civil law countries exhibiting lower financial development than common law countries (Glaeser and Schleifer 2002 La Porta et al 1999)
bull The instruments for property rights institutions are the degree of ethno linguistic fragmentation and the countryrsquos latitude taken from La Porta et al (1999) which have been found to be associated with worse property rights and regulations7 Acemoglu and Johnson 2005 Acemoglu Johnson and Richardson (2002) Faria et al 2006 and Faria and Mauro 2004 use settler mortality in 1500 or population density in 1500 and show that they are valid instruments for property rights institutions For sub-Saharan African countries however settler mortality and population density in 1500 are available only for a subset of countries (Acemoglu and Johnson 2002)8 Given the better country coverage we have chosen to proceed with ethno linguistic fragmentation and latitude
bull A dummy variable to control for oil-exporting countries (the dummy variable takes the value of 1 if the country is an oil exporter) Oil-exporting countries attract more FDI other things equal
bull A dummy variable to control for market size (the dummy variable takes the value of 1 if the country is South Africa or Nigeria) Larger and more sophisticated economies attract more capital flows
Similar studies also include a number of additional explanatory variables though it is more difficult both to argue that they are exogenous and to find valid instruments for them We use these variables in our baseline regression
bull Human capital proxied by the share of secondary school enrollment in the population from the WDI This variable features in explanations of the Lucas Paradox that focus on missing factors of production (Alfaro et al 2005a 2005b) The expected impact of higher human capital on capital flows is expected to be positive
Robinson (2002) use average protection against expropriation risk and constraint on the executive as measures of property rights but these measures are not available for a sufficiently large number of our sample countries 7 La Porta et al (1999) however note that the adverse effects of ethno linguistic fractionalization on government performance tend to disappear when controlling for per capita income and latitude except for public good provision and state-owned enterprises This can be interpreted as countries with a large public enterprises sector tend to have less regard for private enterprises and private property rights 8 Robustness checks using population density in 1500 as an instrument yield results that are consistent with those obtained with ethno linguistic fragmentation (results not shown)
16
bull A measures of de jure capital account openness proxied by the Chinn-Ito measure of capital account openness based on the IMFrsquos AREAER (Chinn and Ito 2007) We use the average value of the Chinn-Ito variable for sub-Saharan African countries over 1999-20059 The effect of capital account openness on capital flows is expected to be positive
bull A measure of trade openness proxied by the sum of exports and imports over GDP Particularly at an initial stage capital mobility develops around greater openness to trade flows Arguably countries that are more open to trade may also be politically more open to greater integration with the rest of the world
bull Macroeconomic performance proxied here by the real GDP growth rate In a panel study of 47 industrial and emerging countries IMF (2007) find that expected macroeconomic performance proxied by lagged real GDP growth is a significant determinant of private capital inflows IMF (2008) similarly finds that real GDP growth and lower fiscal deficits are significantly correlated with higher private capital inflows Alfaro (2005b) uses inflation volatility as a proxy for macroeconomic performance However it is difficult to establish causality as inflows directly affect macroeconomic outcomes (also see below) Further macroeconomic outcomes have been shown to be shaped by institutions making it difficult to study the independent effect of institutional development on capital flows
Correlations Appendix Table III2 shows pairwise correlations between different measures of capital flows while Appendix Table III3 shows the pairwise correlations corresponding to the baseline regressions and Appendix Table III4 focuses on the pairwise correlations of the institutional variables and the instruments
Appendix Table III2 indicates that for our sample the choice of scaling variable affects the pairwise correlations of the inflows with the independent variables This confirms the impression from Figure 5 above that the picture of the allocation of private capital inflows across sub-Saharan countries is very different whether one looks at overall volume of inflows or at the size of the inflows relative to a countryrsquos population or GDP Whereas total inflows as a share of population or GDP will be the variable of interest when studying the economic impact of the inflows on individual countries (see Section IV below) the investigation of the factors determining the allocation of private capital flows to sub-Saharan Africa across the
9 Unlike many other studies that use the simple average of the four dummy variables or the dummy on capital account restrictions (Alfaro et al 2005a 2005b IMF 2007b) the Chinn-Ito measure attempts to capture the intensity of the capital controls by incorporating all the restrictions in the index using a principal components approach Whereas the other restrictions are not directly related to capital account restrictions they are taken as indicative of the overall restrictiveness of the regime The advantage of this measure over other more detailed indices that capture the intensity of capital controls (Quinn 1997 2003 Miniane 2004 Schindler 2009) is its near universal country and extended time coverage 181 countries between 1970 and 2005
17
continent should focus on the total volume of inflows A simple explanation is that private investors are more likely to decide on allocating specific amounts of money to various markets or projects than to fix investment limits relative to a countryrsquos population or GDP Therefore for the remainder of this section the variable of interest will be the log of private capital inflows and their components FDI on the one hand and portfolio and debt flows on the other averaged over 2000-2007 for each sub-Saharan African country excluding Somalia and Zimbabwe Looking at the potential determinants of private capital flows to SSA and their composition in Appendix Table III2 (columns 1-4) overall inflows as well as portfolio and debt inflows are correlated with the index of financial sector development secondary school enrollment the market size dummy variable and the log of initial GDP per capita There are however interesting variations for the determinants of FDI flows to which GDP per capita and secondary school enrollment are not significantly correlated but the proxy for property rights and the dummy for oil producers are The measure of trade openness and the Chinn-Ito capital openness variable are never significantly correlated with private inflows or their components However capital account openness is correlated with the degree of financial sector development as in Chinn and Ito (2005) and with secondary school enrollment
Appendix Table III3 illustrates the challenges associated with finding truly exogenous determinants of private capital flows and their composition as a number of potential explanatory variables are correlated with each other In particular the measure of financial market development is highly correlated with the proxies for property rights institutions as discussed above Further educational achievement is significantly correlated with the institutional quality variables and economic development This is not surprising as it can be understood as an outcome of good institutions and higher degree of economic development This strong degree of endogeneity and the fact that we are interested in disentangling the impact of institutions on capital inflows argues that like the variables capturing macroeconomic performance it is probably not a useful explanatory variable given our focus on the impact of institutions per se on capital inflows The same holds true for the proxy for economic development log of GDP per capita in 2000 (Alfaro et al 2005b show that log real GDP per capita has no additional explanatory power once a measure of institutional quality is introduced)
The pairwise correlations of the potential instrumentsmdashBritish legal origin population density in 1500 and ethno linguistic fragmentationmdashwith the institutional variables and with the capital flows variables are encouraging for the instrumental variables approach (Appendix Table III4) The potential instruments for property rights institutions are uncorrelated with the inflows variables but are significantly correlated with the property rights proxies Although British legal origin is significantly correlated with total inflows in addition to financial institutions it is not correlated with property rights nor its potential instruments
18
Regression results
Table 3 presents the results of simple OLS estimations of various specifications of equation (1) as a benchmark The coefficient on the financial market development index is positive and significant and robust across all specifications For portfolio and debt flows it is even the only variable that is significant maybe highlighting the particular importance of capital market development for non-FDI flows The coefficient on property rights institutions (rule of law score) is never significant and has the wrong sign The coefficients on the controls for country size and oil exporters are large and generally significant but while oil exporters do receive more FDI than other countries they do not have any particular advantage with portfolio and debt inflows Real GDP growth is the only other variable that is significant for total inflows and FDI However as discussed earlier real GDP growth is not exogenous and to study the impact of institutions further we use the specification in column (3) as our baseline The log of real GDP per capita in 2000 secondary enrollment and capital account and trade openness are never significant10 The results obtained are similar when breaking the sample into two sub-periods capturing the period before and after the acceleration of private capital inflows This is not surprising considering that the determinants of inflows are fairly slowly-moving country characteristics They are also robust to excluding South Africa and Nigeria indicating that the results are not driven by the two largest recipients and to excluding all oil exporters (Results available upon request) Indeed the impact of financial market development on inflows is even larger in both cases
(1) (2) (3) (4) (5) (6) (7) (8) (1) (2) (3) (4) (1) (2) (3) (4)Financial Institutions 050 056 052 055 056 058 056 057 067 063 055 057 055
(-346) (586) (548) (544) (565) (527) (603) (536) (499) (343) (348) (322)Rule of Law -021 -033 -041 -027 -028 -033 -037 -003 -010 -020 -018 -052 -058
(-056) (-114) (-136) (-070) (-085) (-112) (-129) (-008) (-025) (052) (-046) (-124) (-131)South Africa and Nigeria 185 187 198 189 179 158 135 137 211 212
(168) (170) (121) (160) (161) (137) (134) (137) (160 (160)Oil Exporters 161 101 162 168 160 164 267 194 051 012
(314) (190) (304) (276) (308) (306) (441) (367) (078) (014)Real GDP growth
011 014 007(326) (304) (127)
Secondary Enrollment -000
(-028)Log 2000 per capita GDP -05
(-032)Capital Account Openness -06
(-06)Trade Openness
-001(-202)
Constant 447 522 379 335 392 413 374 441 342 442 268 216 345 430 288 260(-125) (2317) (1146) (966) (836) (398) (1015) (867) (713) (1956) (635) (477) (900) (1361) (482) (410)
Observations 43 43 43 43 42 43 43 43 43 43 43 43 43 43 43 43R-squared 026 001 057 062 057 057 058 059 022 000 055 059 025 000 042 044F-Statistic 1196 031 1200 1581 878 946 941 1532 1197 001 1289 1406 1176 021 545 493
Source Authors calculations
Note and indicate significant at 1 5and 10 percent t-Statistics are reported in parentheses Robust standard errors
Table 3 Baseline OLS Estimation ResultsTotal Inflows FDI Inflows Portfolio amp Debt Inflows
10 A recent study finds that as is the case for low-income countries de jure financial integration is fairly low for sub-Saharan Africa compared to other regions Capital control regulations tend to be complex and nontransparent and limited capacity to monitor capital flows can lead to inconsistent implementation Inconsistencies between different regulations have also made capital controls easy to circumvent This may explain the difficulties in establishing an empirical relation between capital controls and capital flows in the region (IMF 2008)
19
Table 4 presents the results of the 2SLS estimation The first stage equations are shown in Panel A and the second stage in Panel B Columns (1) and (2) report results using Ethno linguistic fractionalization as the instrument for property rights institutions and columns (3) and (4) using latitude Given the very low R-squared obtained in the latter case corresponding results are not shown for the components of the inflows Starting with the first-stage regressions British legal origin is shown to have a strong positive and significant impact on financial development but not on the rule of law while the instrument for property rights has a stronger and mostly significant impact on property rights (greater ethno linguistic fragmentation has a negative impact on rule of law as does closeness to the Equator) than on financial institutions Market size has a positive and significant impact on capital market development and oil exporting status has a negative and significant impact However market size is negatively related to rule of lawalthough this is likely to be mainly because of the relatively low ratings of Nigeria and South Africa regarding property rights protection Oil exporting status is also negatively related to rule of law a result attributed to the rent-seeking culture that appears to take hold in resource-rich countries (Auty 2001 Auty and Gelb 2001 Karl 1999 1997)
(1) (2) (3) (4) (1) (2) (1) (2) (1) (2)
Financial Institutions042 022 061 062 061 051 032 001 006 011(200) (097) (211) (134) (264) (214) (137) (004) (148) (259)
Rule of Law -101 -035 -225 -231 -096 025 -043 -020 -009 010(-092) (-028) (-198) (-160) (-082) (020) (-034) (-012) (-047) -041
South Africa and Nigeria 277 076 196 380 -037
(205) (039) (149) (241) (-195)Oil Exporters 115 067 265 -060 054
(157) (090 (298) (-006) (332)Constant 396 443 275 255 272 318 359 414 032 030
(430) (448) (233) (157) (287) (379) (348) (334) (188) (170)Observations 42 42 43 43 42 42 42 42 42 42R-squared 028 047 005 007 025 053 024 024 NA 012
British Legal Origin 181 148 188 155 181 148 181 148 181 148(408) (291) (419) (295) (408) (291) (408) (291) (408) (291)
Instrument for Rule of Law1 060 069 031 084 060 069 060 069 060 069
(097) (107) (024) 063) (097) (107) (097) (107) (097) (107)South Africa and Nigeria 145 158 145 145 145
(260) (295) (260) (260) (260)Oil Exporters -085 -074 -085 -085 -085
(-210) (-193) (-210) (-210) (-210)Constant 078 092 106 116 078 092 078 092 078 092
(188) (229) (394) (423) (188) (229) (188) (229) (188) (229)Adj R-squared 032 034 031 033 032 034 032 034 032 034
British Legal Origin 031 034 023 023 031 034 031 034 031 034(166) (161) (121) (121) (166) (161) (166) (161) (166) (161)
Instrument for Rule of Law1 -068 -053 143 148 -068 -053 -068 -053 -068 -053
(-211) (-157) (122) -163 (-211) (-157) (-211) (-157) (-211) (-157)South Africa and Nigeria -065 -058 -065 -065 -065
(-336) (-278) (-336) (-336) (-336)Oil Exporters -033 -048 -033 -033 -033
(-183) (-225) (-183) (-183) (-183)Constant -036 -038 -096 -086 -036 -038 -036 -038 -036 -038
(-150) (-154) (-591) (-514) (-150) (-154) (-150) (-154) (-150) (-154)Adj R-squared 010 017 008 019 010 017 010 017 010 017
Source Authors calculations
Financial Institutions Financial Institutions Financial Institutions
Table 4 Instrumental Variables Estimation ResultsPortfolio Inflows
Panel A Second-Stage Regressions
Panel B First-Stage Regressions
Rule of Law
Note and indicate significant at 1 5and 10 percent t-Statistics are reported in parentheses Robust standard 1 In columns (1) and (2) the instrument for rule of law is ethnolinguistic fractionalization In columns (3) and (4) the instrument is latitude
Total Inflows FDI Inflows
Rule of Law Rule of Law
Share of FDI
Financial Institutions
Rule of Law
20
Comparing the second-stage equations with the OLS estimates the impact of financial institutions is overall weaker (smaller coefficients) but remains strong and significant for total inflows and FDI inflows as well as the share of FDI in total inflows Interestingly the property rights variable is never significant and continues to have the ldquowrongrdquo sign in most cases except for FDI inflows and the share of FDI (column 2) perhaps indicating that non-FDI investors believe property rights are not critical for their relatively liquid investments Oil resources is a strong determinant of FDI inflows but not other types of flows whereas it is market size that seems to matter for portfolio and debt inflows When excluding South Africa and Nigeria or oil-rich countries from the estimation results are broadly similar with the coefficient on financial institutions larger particularly in the FDI regressions This indicates that in non-oil sub-Saharan African countries excluding South Africa FDI inflows are significantly larger the more financial markets are developed Perhaps surprisingly property rights protection is insignificant This may be explained by the fact that as FDI is harder to expropriate even countries with poor property rights protection receive FDI Alternatively for these relatively small countries it may be possible for foreign investors to effectively negotiate greater property rights for their FDI than is generally available in the country for other investors Given the small sample size the results must be interpreted with caution but overall they support the importance of unbundling institutions and measuring them more precisely Results also support the notion that for capital flows financial institutions as proxied by capital markets development matter more than basic property rights institutions capital including in the form of FDI will flow less to countries with less developed financial markets against the view presented in Albuquerque (2003) that FDI should flow more to financially constrained countries
IV DO PRIVATE CAPITAL FLOWS HAVE AN IMPACT ON GROWTH IN SSA This section undertakes a preliminary analysis of the relationship between capital inflows and growth in sub-Saharan Africa Significant capital flows to African countries are a relatively recent phenomenon and as noted above have so far been restricted to a limited number of markets Given the general inconclusiveness of the empirical evidence on the links between growth and capital flows from emerging markets that have been on the radar of international investors much longer than most African markets it is perhaps too early to expect robust econometric results with the particular sample in this paper While it is easy to make a theoretical case for the positive impact of capital flows on growth the empirical verification of this impact has proved much more challenging11 Alternate
11 See Edison and others 2004 Kose and others 2006 DellrsquoAricia and others 2008 and Prasad Rajan and Subramanian 2007 for comprehensive reviews of the empirical literature on the impact of capital flows Though evidence from empirical studies using aggregate data is inconclusive studies that use measures of de facto
(continuedhellip)
21
explanations to this empirical puzzle have predicated the gains from capital flows on the threshold development of certain domestic institutions andor proposed that such flows generate certain indirect or collateral benefits even when their direct impact on growth is difficult to gauge Klein (2005) finds support for a model in which institutional quality intermediates the impact of capital account liberalization on growth by affecting the extent to which savings are protected from expropriation and the premium borrowers pay for funds from abroad In countries with better institutions capital account openness has a significant positive impact on growth Bekaert Harvey and Lundblad (2005) find that the largest growth response to equity market liberalizations accrues to countries with better legal systems above-average financial development and better-quality institutions in terms of investor protection and accounting standards Using industry-level data Prasad Rajan and Subramanian (2007) indicate that for countries that have above-median levels of financial development foreign capital aids the relative growth of those industries dependent on finance But for countries below the median for financial development the effect of foreign capital inflows is diametrically opposite Using firm-level data Alfaro and Charlton (2007) find a significant relationship between entrepreneurial activity and both de jure and de facto international capital integration Their results suggest that foreign capital may improve access to capital either directly or through improved domestic financial intermediation
Recent evidence however indicates that countries that grow more rapidly are those that rely less and not more on foreign capital and in turn foreign capital tends to flow to countries that experience not high but low productivity growth (Prasad Rajan and Subramanian (2007) Gourinchas and Jeanne (2007)) One possible explanation for this puzzle is trade fast-growing countries also are the ones that experienced a takeoff in their export sector (Gourinchas and Jeanne 2007) If capital inflows lead to higher prices for nontraded goods owing to absorptive capacity constraints and thus to overvaluation they will have a negative impact on exports and hence growth (Kose and others 2006 Prasad Rajan and Subramanian 2007) Another explanation is that inflows from abroad that supplement domestic savings will have a limited impact in an economy where the binding constraint is the scarcity of viable investment opportunities (Rodrik and Subramanian 2009)
We estimate the gains from financial globalization using the same cross-section sample of average flows for the 2000-07 period as in the preceding section However in this section we also make use of data on net flows For most African countries the differences between net and total capital flows are not often vast nevertheless the economic impact of such flows depends on the actual infusion of foreign capital rather than gross flows Also we scale net flows to the size of the economy by alternatively dividing them by population or GDP
integration or finer measures of de jure integration tend to find more positive results Studies using micro data are also better able to find growth and productivity gains from financial integration
22
A Correlation Analysis
We begin the correlation analysis with a simple mapping between economic growth and capital flows in sub-Saharan Africa while not drawing any inferences about the direction of causation
12 The scatter plots indicate a generally positive correlation between growth and capital flows in our sample13 Consistent with the findings in the literature the relationship is more pronounced when only FDI flows are considered
Figure 7 Sub-Saharan Africa Capital Flows and Real GDP Growth
Capital Flows and Real Growth(net total flows to population)
-600
-500
-400
-300
-200
-100
0
100
200
300
-2 0 2 4 6 8 10 12 14
Capital Flows and Real Growth(net total flows to GDP)
-15
-10
-5
0
5
10
15
20
25
30
-5 0 5 10 15 20 25
FDI and Real Growth(net FDI to population)
0
20
40
60
80
100
120
140
160
180
-2 0 2 4 6 8 10 12 14
FDI and Real Growth(net FDI to GDP)
-5
0
5
10
15
20
25
30
-5 0 5 10 15 20 25
Note All variables are the average value of the 2000-07 period Where normalized over population the charts exclude the outliers Equatorial Guinea and Seychelles Table 5 provides further evidence of the positive significant correlation between capital flows to sub-Saharan Africa and real GDP growth in the recipient countries This relationship however does not hold when capital flows are disaggregatedmdashwhile FDI is positively correlated with growth portfolio and debt-creating flows are generally inversely related to growth though
12 As mentioned in the previous section in analyzing the relationship between growth and capital flows the latter are normalized over either the population or GDP of the recipient country All variables are considered at their average values over the 2000-07 period to deal with annual volatility 13 This is in contrast with Rodrick and Subramanian (2008) who in a sample of 110 developing countries running through 2004 do not find any relationship between financial globalization (measured as the sum of foreign assets and liabilities as a share of GDP) and growth
23
not significantly so This finding is also consistent with evidence from other studies(DellrsquoAricia and others 2008)
B Testing channels of transmission of private capital flows on growth Another approach to gauging the likely impact on capital inflows on growth is to test the various channels described in the literature on financial globalization and growth Three broad channels are identified as linking capital inflows and growth
bull Overvaluation to the extent that capital inflows cause currency appreciation they hurt exports and thus dampen growth This channel is well-documented in Rodrick (2007) but also discussed in Prasad et al (2007)
bull Savings and investment where foreign capital supplements domestic savings it fosters growth However this would only be true for economies where the main constraint on growth is a lack of savings Where the main hindrance to economic growth is the scarcity of viable investment opportunities additional foreign capital will only add to domestic distortions (Gourinchas and Jeanne 2007 Rodrick and Subramanian 2009)
bull Institutional development a number of studies argue that capital inflows carry indirect (collateral) benefits for recipient countries via the development of domestic institutions (Becker and others 2007 Kose and others 2006) or more particularly financial sector institutions (Mishkin 2006)
The testing methodology employed here utilizes correlations as well via bivariate regressions In the first stage the bivariate model regresses capital flows on the channel of interest If the first stage results indicate that the channel is significantly correlated with capital flows then in the second stage the model regresses the predicted value of the channel
Real GDP Growth
Net Total FlowsGDP
FDI FlowsGDP
Debt FlowsGDP
Portfolio FlowsGDP
Real GDP Growth 100Net Total FlowsGDP 038 100FDI FlowsGDP 066 054 100Debt FlowsGDP -002 072 -007 100Portfolio FlowsGDP -006 031 -010 002 100
Real GDP Growth
Net Total Flows per
capitaFDI Flows per capita
Debt Flows per capita
Portfolio Flows per capita
Real GDP Growth 100Net Total Flows per capita 037 100FDI Flows per capita 044 089 100Debt Flows per capita 008 053 022 100Portfolio Flows per capita -007 025 -001 -006 100Note indicates significant at 10 percentSource Authors calculations
Table 5 Correlations Net Capital Flows and Real Growth
24
from the first regression ie that part of the channel variable correlated with capital flows on growth If the coefficient in the second regression is significant and with the expected sign it implies that the channel is likely to be operational for this particular sample of countries Evidence that a particular channel could be at work is not sufficient to demonstrate the impact of private capital flows on growth but it is a necessary first step Thus Yi = α1 + β Ki + u1 (1) gi = α 2 + η Ŷi + u2 (2) Where Yi is the channel variable of interest Ki are capital flows normalized over GDP or population gi is the real GDP growth rate and Ŷi is the predicted value of the channel variable of interest derived from the first regression All variables are in their level values so that sign and significance of β and η are of greater interest than their magnitude The results are presented in Table 6 below
Overvaluation InvestmentDomestic
Savings InstitutionsNet flowsGDP -0004 0164 0337 -0214Net flows per capita -000003 0012 0021 -00042Note and indicate significant at 1 and 5 percent respectivellySource Authors calculations
Table 6 Channels of Transmission Between Capital Flows and Growth
The findings indicate that in most instances capital flows are not significantly correlated with the channel variables in our sample Except when capital flows are scaled to the size of the recipient countryrsquos population mdash both savings and investment are positively and significantly related to capital flows in this instance14 This implies that for SSA countries the impact of private capital flows on growth could be partly intermediated through the impact of net capital flows on domestic savings and investment Another implication would also be that African economies are not necessarily investment-constrained15 14 As expected the impact of the predicted values of investment and domestic savings in the second stage regressions is positive
15 Rodrik and Subramanian (2009) define an economy to be savings-constrained when private investment is low despite the existence of many privately profitable projects because credit is either not available or too costly and to be investment-constrained when credit is available but there is a lack of profitable investment opportunities (p12) In savings-constrained economies foreign capital will supplement scarce domestic savings (evidenced by high real interest rates) and lead to increased investment In investment-constrained economies real interest rates will be low and additional capital flows will finance consumption rather than investment
25
In an unexpected outcome the institutional variable is negatively related to growth a result that holds even when oil-exporters are excluded from the sample (not shown)
C How do Private Capital Flows Affect Growth Going beyond bivariate correlations we first present a simple cross-country multivariate regression model making use of a averages for the 2000-07 period 16 Although this method is not without shortcomings the limited time coverage of our dataset and year-on-year volatility dampens the usefulness of panel estimation However our analysis is subject to the considerable limitations of the ordinary least squares estimator in growth models mdash especially those arising from endogenous variables We fit a simple ordinary least squares specification to estimate the relationship between capital flows and growth gi = α + β Ki + η Xi + ui Where gi is real GDP growth Ki are capital flows normalized over GDP or population Xi is a set of control variables and ui is an independent error term In our choice of control variables we are guided by the ldquochannelsrdquo analysis from the preceding section since our interest in primarily in the impact of capital flows on growth Thus our multivariate model is essentially a simultaneous test of the correlations between of the various channel variables (plus capital flows directly) and growth As discussed above other factors shown in the literature on financial globalization to influence growth include savings and investment exchange rate overvaluation and institutions The exchange rate overvaluation measure is constructed as the ratio of the nominal exchange rate to the purchasing power parity exchange rate17 The measure of institutions used here is the number of procedures to enforce a contract (Contracts) from the World Bankrsquos Doing Business database We also control for level of economic development by including the log of initial per capita real GDP growth The results are documented in Table 7
16 See Appendix Table IV1 and Appendix Table IV2 for summary statistics and correlations for the variables included here 17 More precisely the variable is the residual of a simple panel regression between the nominal exchange rate (local currency per US dollar) versus the PPP valuation of the exchange rate The regression was run for all countries in the world and the variable is normalized to be 1 for the world as a whole
26
[1] [2] [3] [4]Initial per capita GDP (log) -153 -186 -167 -216
(-311) (-403) (-362) (-415)Overvaluation -082 -153 -068 -125
(-045) (-084) (-038) (-068)Domestic savings 009 010 009 010
(339) (359) (361) (362)Investment 018 016 015 017
(333) (293) (258) (297)Contract enforcement 011 009 009 008
(164) (142) (153) (123)Net total flowsGDP 011
-194Net total flows per capita 0003
205Total inflowsGDP 018
(227)Total inflows per capita 0003
(147)Constant -106 412 054 629
(-013) (054) (007) (080)
Adjusted R2 051 052 053 057Number of observations 42 42 42 42Note and indicate significant at 1 5 and 10 percent respectivelly t-statistics in parenthesis
Table 7 Estimation Results Linear Growth Model with Capital Flows
The results indicate that capital flows are positively and significantly (in all but one instance) associated with growth Initial per capita GDP comes in with a negative and significant coefficient in all specifications indicating support for growth convergence Domestic savings and investment are the other significant right-hand side variables that also come in with the expected sign Contract enforcement the proxy for institutional development is not significant in any of the specifications Overvaluation has the expected sign but is never significant Estimating the equation with measures of net FDI instead of total net private capital yields similar results with an even stronger association between the FDI variable and growth Aside from the positive correlations and partial evidence of a possible through the savings-investment channel our analysis is rendered incomplete by the short time period since these inflows began While the limited number of observations in our sample required us to focus on average growth and inflows over the period 2000-2007 most of the inflows came late in this period This is an issue which requires further study as additional observations (years) become available As described in Section II the observed rise in private capital flows and growth during the sample period is an important necessary condition in particular because other studies even fail to uncover such an association for different country groups andor sample periods However it is also far from sufficient for making inferences about causality
27
V CONCLUSION
As a result of the global financial crisis and recession private capital flows to all regions of the world have declined Even when the international economy recovers and financial markets return to health it is likely that investors will remain for some time more risk-averse than they were previously At the same time donor flows to low-income countries including those in sub-Saharan Africa are likely to be adversely impacted by these global developments Our results were inconclusive regarding the impact of private capital flows on growth in SSA countries Additional research will be needed before a definitive statement can be made in this regard once additional observations are available However most SSA countries are likely to remain dependant on financial inflows in some form to help finance current account deficitsmdashdeficits that will be the counterpart of development-oriented investments in these economies As donor flows are likely to be restricted in the coming years due to the fiscal problems the traditional donor countries find themselves confronting SSA countries will need private capital flows to finance these current account deficits The alternative would require smaller or no current account deficits meaning reduced development-oriented investments in infrastructure and other key areas with adverse consequences for growth potential All this means that policy makers in SSA will need to pay increasing attention to efforts to attract private capital to their countries Our results indicate that one of the most important things policy makers can do to attract private capital is to strengthen domestic capital markets Deep and well-functioning money foreign exchange equity and (where relevant) derivative markets are key to attracting private capital Governments in SSA countries would be well-advised to redouble their efforts to develop and strengthen these markets to put their countries in a position to attract private capital in the future At the same time an important of the current financial crisis should also be to put in place strong monitoring regulatory and supervisory frameworks to avoid a buildup of balance-sheet vulnerabilities
28
Appendix I Capital Flows Data The information on private capital flows is based on detailed balance of payments data obtained from AFR country desk economists in late 2007 for 44 sub-Saharan African countries Data for 2000-2006 are actual and data for 2007 are preliminary estimates The data distinguishes between FDI portfolio (debt and equity) and private debt-creating flows and between inflows and outflows The definition of capital inflows adopted for this study differs from other papers using balance of payments data as a measure of capital flows (see Appendix Box I1 for precise definitions used in the paper) Appendix Box I1 Balance of payments recording of capital flows
From the perspective of the financial account one usually thinks of changes in liabilities as positive (inflows) and changes in assets as negative (outflows) In practice both changes in liabilities and assets are reported as net of any disinvestment and consequently both can have any sign In the BOP accounts an increase (decrease) in liabilities to nonresidents is entered as positive (negative) while an increase (decrease) in net foreign assets held by residents is entered as negative (positive) If a resident sells an asset held abroad the transaction is recorded as a reduction in net foreign assets held by residents bringing an inflow of capital For this study capital inflows (outflows) are taken to be the sum of increases (decreases) in liabilities to non-residents and of decreases (increases) in net foreign assets held by residents in a year This allows to capture all transactions that give rise to a inflow of capital into a country on the liability and asset side and avoids negative ldquoinflowsrdquo Net flows of capital are calculated as the sum of the inflows (positive sign) and outflows (negative sign)
This data differs from other published data sources with respect to its timeliness coverage and level of detail bull The 2000-2007 period covers the most recent episode of private capital inflows to
sub-Saharan Africa which took off around 2005-2006
bull It covers 43 sub-Saharan African countries
bull It allows to distinguish between different types of private capital flows (FDI portfolio flows and debt-creating flows) In contrast with other studies (eg Faria and Mauro 2004) that add together FDI and portfolio equity flows we keep them separate and group portfolio debt and equity (either category is too small to stand on its own) We are interested in the determinants of various types of flows particularly as regards the development of financial markets and straight FDI doesnrsquot require any particular type of financial market infrastructure However portfolio debt and equity investment require the existence of bond and equity markets
Other data sources that cover all sub-Saharan African countries include the IMFrsquos WEO IFS Balance of payments data and the World Bankrsquos global development finance data Another
29
widely used data base is the Lane-Milesi-Ferretti data but the most recent updated version goes until 2005 and covers only a sub-set SSA countries Another group of studies use current account data as a proxy for capital flows (Prasad et al 2007 Gourinchas and Jeanne 2007) ndash which have the advantage of providing wide coverage in terms of years and countries but make it impossible to disaggregate between official and private transfers and different types of capital flows The Fundrsquos World Economic Outlook (WEO) database and the World Bankrsquos Global Development Finance (GDF) database provide the most comprehensive coverage of capital flows to sub-Saharan countries These data sets have few missing countries and few missing observations for the countries that are in the data sets However the comprehensiveness of the WEO and the GDF databases is achieved at a price as each data set relies on Fund and Bank staff estimates to fill in the lacunae left from official statistics (Dorsey et al 2008) Other data sets such as the Fundrsquos International Financial Statistics and the Balance of Payments Statistics databases rely on official reporting without the use of staff estimates to fill in the gaps The more detailed and comprehensive coverage of the international transactions at the country level is available in the Balance of Payment Statistics published once a year by the IMF Although information for most of the sub-Saharan African countries is included in the publication the most recent database shows a complete set of annual data for just 18 out of 44 countries in the region mostly the middle-income countries two oil-exporters and the largest low-income economies among them The other countries have missing data either for the capital flows components or some years specially at the end of the period covered in the study which is crucial for the econometric analysis The work of the country desk economists was essentially to make sure that all series were available and the components were consistent with the main aggregates We checked also consistency across the different published databases finding discrepancies mostly in the last few years of the sample and few revisions to historical numbers in the early 2000rsquos for the countries with data in the various publications Looking into the World Economic Outlook database there is a full coverage of the countries in the region but it is difficult to separate actual figures from the forecasted ones or estimates (specially for countries with lags in reporting official data from the authorities) and programs with the Fund requiring accurate estimates on the missing BOP data embedded in the Program We used the WEO data which are also reported by country desk economist in the Fund as a starting point and asked the desk economists to look into the details and components that are normally not used in the aggregated analysis of the external accounts offered in the WEO studies and data In brief we have not created a separate database but rather taken the available information and refined it in a way that allows us to cover as many countries in the region as possible regardless of the size of the country and the level of development weighing properly in the model those countries with no capital flows (reporting zeros) and including those null figures as information in the dependent variable
30
Appendix II Variables Definitions and Sources
Variable Description Units Source
Net total flows FDI portfolio and debt net flows See below Billions of US$ IMF African Department database
Net FDI Net foreign direct investment flows (FDI in the reporting economy net of direct investment abroad)
Billions of US$ IMF African Department database
Net portfolio and debt flows Net private portfolio investment and other private flows Includes equity and debt securities as well as all other net private debt creating flows
Billions of US$ IMF African Department database
Total Inflows FDI portfolio and debt inflows See below Billions of US$ IMF African Department database
FDI Inflows Foreign direct investment in the reporting economy Billions of US$ IMF African Department database
Portfolio and debt inflows Portfolio investment liabilities including equity and debt securities liabilities plus other private capital inflows Includes all other private debt creating flows (Liabilities excludes monetary authorities and government)
Billions of US$ IMF African Department database
CPIA Country Policy and Institutional Assessment Composite index based on sixteen criteria grouped in four categories (i) economic management (ii) structural policies (iii) policies for social inclusion and equity and (iv) public sector management and institutions
1 to 7 World Bank
Financial Institutions Index of capital markets development defined as the sum of four dummy variables Treasury bills treasury bonds corporate bonds and equity markets exist
0 1 2 3 4 with 0 for countries without any market to 4 for countries with all four markets present
Lukonga (forthcoming) and authors calculations
Rule of law The extent to which agents have confidence in and abide by the rules of society and in particular the quality of contract enforcement the police and the courts as well as the likelihood of crime and violence One of the six components of the Governance Indicators
-25 (lower score) to 25 for the highest score
httpinfoworldbankorggovernancewgiindexasp
South Africa and Nigeria Dummy variable 1 for South Africa and Nigeria 0 otherwise 0 1 Authors calculations
Oil exporters Dummy variable 1 for Angola Cameroon Chad Congo Rep of Equatorial Guinea Gabon and Nigeria 0 otherwise
0 1 IMF African Department database
Real GDP growth Real GDP growth Calculated as the percent change of the constant Gross domestic product in 2000 local currency units Measure of quality of macroeconomic policies
Percent IMF World Economic Outlook
Secondary enrollment Total enrolment in secondary level of education regardless of age expressed as a percentage of the population in the official age group corresponding to this level of education
Percent World Bank World Development Indicators
2000 per capita GDP Per capita GDP in constant US dollar for the year 2000 Constant 2000 US dollars IMF World Economic Outlook
Capital account openness De jure capital account openness index as the simple average of four dummy variables representing exchange rate arrangements payments restrictions on current and capital transactions and
t i ti i t f t di A l f
Index Chinn-Ito forthcoming
Trade openness Sum of exports and imports of goods and non-factor services over GDP
Percent of GDP IMF World Economic Outlook
British legal origin Dummy variable that takes the value 1 for former British colonies and 0 otherwise
0 1 La Porta et al (1999)
Ethno linguistic fragmentation
Average value of five different indices of ethno linguistic fractionalization
Index La Porta et al (1999)
Latitude Measure of the closeness to the equator Miles La Porta et al (1999)
Appendix II Variables Definitions and Sources
31
Overvaluation Residual of a simple panel regression between the nominal exchange rate (local currency per US dollar) Vs the PPP valuation of the exchange rate The regression includes 182 countries The overvaluation measure in normalized to be 1 for the world
Deviation from equilibrium between PPP and market rate with 1 defined as the norm
IMF African Department database
GDP in dollars GDP in dollars (Converted at the nominal market exchange rate) Billions of US$ IMF World Economic Outlook
Per capita GDP in dollars Per capita GDP (constant 2000 US dollar) Constant 2000 US dollars IMF World Economic Outlook
Inflation Headline consumer price index (Average annual percent change) Percent IMF World Economic Outlook
Government balance General government balance excluding grants Percent of GDP IMF World Economic OutlookCredit Total credit to the private sector in percent of GDP Percent of GDP IMF International Financial StatisticsCurrent account Current account balance excluding grants Percent of GDP IMF African Department databaseREER Real effective exchange rate weighted index using total trade
(exports and imports composition for 1999 to 2001) and consumer price indices
Percent IMF Information Notice System
NEER Nominal effective exchange rate weighted index using total trade (exports and imports composition for 1999 to 2001)
IMF Information Notice System
US Tbill rate United States Treasury bill rate Percent IMF International Financial StatisticsTerms of trade Terms of trade (Exports prices to import prices goods and services) Percent IMF World Economic Outlook
Rest of the world real GDP Rest of the world real GDP growth (Weighted by country exports) Percent IMF World Economic Outlook
Oil prices Price of oil Simple average of Texas Dubai and Brent prices deflated by the manufacturing unit cost index
Percent IMF World Economic Outlook
Domestic savings Total domestic savings Percent of GDP IMF World Economic OutlookInvestment Total private investment Percent of GDP IMF World Economic Outlook
Reserves Stock of international reserves (US dollar billions) Billions of US$ IMF World Economic Outlook
Non-fuel commodity prices Real non-fuel commodity price (Weighted by country specific exports deflated by the manufacturing unit price)
Percent IMF World Economic Outlook
Population Population Millions IMF World Economic OutlookContract enforcement Efficiency of contract enforcement by following the evolution of a
sale of goods dispute and tracking the time cost and number of procedures involved from the moment the plaintiff files the lawsuit until actual payment
Number of procedures httpwwwdoingbusinessorg
Constraint on the executive Index that ranks from 1 (unlimited authority to the executive) to 7 (Executive parity or subordination) as decribed in the Freedom House Index
1 to 7 httpwwwfreedomhoseorg and Polity IV Databse at wwwsystemicpeaceorg politypolity4htm
ICRG ranking International Country Risk Guide rank for each country is based on three components of risk analysis Political financial and economic components The higher the rating the lower the risk for that particular country The index covers 140 countries
0 to 100 wwwprsgroupcom
Appendix II Variables Definitions and Sources (Contd)
32
Appendix III Determinants of Capital Flows Descriptive Statistics and Correlations
Total inflows FDI inflows Portf amp debt Share of FDI Total inflows FDI inflows Portf amp debt Total inflows FDI inflows Portf amp debt
Financial Institutions 031 033 026 008 002 -005 019 -012 -011 -006004 003 009 062 088 074 022 044 050 070
Rule of Law -021 -029 -015 003 013 005 027 -007 -009 000018 006 034 083 042 077 007 065 058 099
Market size 087 093 074 000 005 -003 021 -006 -004 -005000 000 000 099 077 084 019 069 079 074
Oil exporter 010 043 -004 045 019 027 -005 034 054 -019052 000 078 000 023 008 075 003 000 022
Real GDP growth 012 039 000 034 028 041 -010 055 070 -005043 001 099 003 007 001 052 000 000 077
Secondary enrollment 036 019 039 003 060 044 081 009 011 000002 023 001 083 000 000 000 057 050 099
Log 2000 GDP per capita 027 020 026 027 063 052 070 011 026 -020008 019 009 008 000 000 000 049 009 020
Capital account openness -007 -005 -007 -004 012 006 022 007 001 011066 073 068 079 046 072 016 066 094 049
Trade openness -017 -017 -015 011 014 015 008 013 017 -003027 027 034 050 036 033 059 042 027 086
UKleg 027 028 023 016 -010 -011 -005 -010 -004 -011008 007 014 031 052 048 076 053 078 047
Ethling 015 021 011 012 006 004 009 -005 001 -010033 018 048 044 069 080 055 077 094 053
LAT -011 -012 -009 039 -004 -006 002 -015 -005 -020050 046 057 001 080 068 088 032 073 020
Pop_dens 000 -003 002 -047 -004 -005 -002 004 -023 037099 085 093 000 080 075 089 081 018 003
Note pairwise correlation coefficient reported in first row significance level reported in second row Source Authors calculations
Appendix Table III2 Bivariate Correlations of Capital Flows with Independent Variables
(US$ mn) (per capita) (in percent of GDP)
1 Dependent variables Observations Minimum Maximum Mean MedianStandard Deviation
Total inflows 43 63 162106 8265 2339 25410FDI inflows 43 00 42371 3598 909 8027Portfolio and debt inflows 43 00 130724 4666 1021 19786Total inflows per capita 43 35 16250 1291 255 3078FDI inflows per capita 43 00 11653 826 105 2325Portfolio and debt inflows pc 43 00 5906 465 147 1038Total inflows to GDP 43 11 307 81 62 65FDI inflows to GDP 43 00 290 42 24 53Portfolio and debt inflows to GDP 43 00 187 39 32 36
2 Explanatory variablesFinancial institutions 43 00 40 18 10 16Rule of law 43 -18 08 -07 -07 06Market size 43 00 10 00 00 02Oil exporter 43 00 10 02 00 04Real GDP growth 43 -04 201 48 42 36Secondary enrollment 42 82 1079 342 283 226Log of 2000 GDP per capita 43 45 90 61 58 11Capital account openness 43 -16 25 -05 -11 13Trade openness 43 369 1559 818 789 3043 Alternative measures of institutions and instrumentsCPIA 42 18 43 32 32 06Doing Business Index 43 303 1760 1321 1487 410ICRG ranking 28 483 808 614 605 73Legal rights 43 10 80 40 35 16Property rights 41 14 45 30 30 06Constraint on the executive 40 17 70 41 43 16British legal origin 43 00 10 03 00 05Ethnolinguistic fragmentation 42 00 10 06 07 03Population density in 1500 36 01 250 38 20 55Latitude 43 00 07 01 01 01Source Authors calculations
Appendix Table III1 Descriptive Statistics for Regression Variables
33
Fin Instit Rule of Law Market size Oil exporter Real GDP growth Second Enr Log 2000 GDP pc Capital open Trade openTotal inflows
Financial Institutions 100
Rule of Law 042 100000
Market size 032 -023 100004 015
Oil exporter -022 -034 020 100016 002 019
Real GDP growth 008 001 012 047 100060 095 044 000
Secondary enrollment 040 049 027 -008 -012 100001 000 008 063 044
Log 2000 GDP per capita 034 039 018 024 000 083 100002 001 025 012 098 000
Capital account openness 034 019 -006 -020 -005 031 020 100003 021 071 021 074 005 030
Trade openness -015 -008 -022 003 -010 008 010 -001 100035 061 017 085 054 061 060 096
Note Pairwise correlation coefficients reported in first row significance level reported below Source Authors calculations
Appendix Table III3 Bivariate Correlations of Baseline Regression Variables
Financial inst CPIA indexDoing
Business ICRG ranking Legal rightsRule of
law Property rightsConstraint on the executive
British legal origen
Ethnoling fragmentation Latitude
Population density
Financial institutions 100
4300
CPIA index 063 100000
4200 4200
Doing Business index -060 -044 100000 000
4300 4200 4300
ICRG ranking 029 040 -069 100013 003 000
2800 2800 2800 2800
Legal rights 061 046 -061 020 100000 000 000 030
4300 4200 4300 2800 4300
Rule of Law 042 063 -069 082 034 100000 000 000 000 003
4300 4200 4300 2800 4300 4300
Property rights 057 081 -064 070 046 081 100000 000 000 000 000 000
4100 4100 4100 2700 4100 4100 4100
Constraint on the executive 044 041 -051 016 042 049 055 100000 001 000 043 001 000 000
4000 3900 4000 2800 4000 4000 3800 4000
British legal origin 059 040 -055 031 069 021 036 028 100000 001 000 011 000 018 002 008
4300 4200 4300 2800 4300 4300 4100 4000 4300
Ethnolinguistic fragmentation 017 -015 005 -032 014 -029 -018 002 011 100027 036 074 010 038 006 028 093 050
4200 4100 4200 2800 4200 4200 4000 3900 4200 4200
Latitude 009 016 -028 037 013 030 029 019 011 001 100058 032 007 006 041 005 007 025 049 094
4300 4200 4300 2800 4300 4300 4100 4000 4300 4200 4300
Population density -014 -002 021 -025 -045 -023 -011 -018 -018 -043 -037 100042 090 022 022 001 017 052 031 028 001 003
3600 3600 3600 2500 3600 3600 3600 3500 3600 3500 3600 3600Note Pairwise correlation coefficients reported in first row significance level reported in the second row and number of observation in the third row Source Authors calculations
Appendix Table III4 Bivariate Correlations of Measures of Institutions and Instruments
34
Appendix IV Private Capital Flows and Growth
Variable Number of
observations MeanStandard deviation Min Max
Real GDP growth 43 48 36 -04 201Initial per capita GDP 43 61 11 45 90Net total flowsGDP 43 37 74 -109 271Net total flows per capita 43 547 2782 -5006 12323Total inflowsGDP 43 77 57 10 282Total inflows per capita 43 1311 3139 35 16450Overvaluation 43 11 03 07 17Domestic savings 42 122 200 -247 813Investment 42 216 87 87 469Contract enforcement 43 1014 66 826 1133Source Authors calculations
Appendix Table IV1 Private Capital Flows and Growth Summary Statistics for Multivariate Regression
Rea
l GD
P gr
owth
Initi
al p
er
capi
ta G
DP
Net
flow
sG
DP
Net
flow
s pe
r ca
pita
Inflo
ws
GD
P
Inflo
ws
per
capi
ta
Ove
rval
uatio
n
Dom
estic
sa
ving
s
Inve
stm
ent
Con
tract
en
forc
emen
t
Real GDP growth 100
Initial per capita GDP 000 100
NetflowsGDP 038 -013 100
Netflows per capita 037 028 067 100
InflowsGDP 049 016 076 066 100
Inflows per capita 028 063 042 087 061 100
Overvaluation -032 -021 -011 -003 -024 -016 100
Domestic savings 048 058 013 029 028 048 -036 100
Investment 045 045 014 039 045 051 -026 042 100
Contract enforcement 018 -007 -024 -018 -017 -013 -015 010 -012 100Note indicates significant at 10 percentSource Authors calculations
Appendix Table IV2 Private Capital Flows and Growth Pairwise Correlations for Multivariate Regression
35
References
Acemoglu D and S Johnson 2005 ldquoUnbundling Institutionsrdquo Journal of Political
Economy Vol 113 No 5 pp 949995 Acemoglu D Johnson S and D Robinson 2002 ldquoReversal of Fortune Geography and
Institutions in the Making of the Making of the Modern World Income Distributionrdquo Quarterly Journal of Economics pp 12311294
Albuquerque R 2003 ldquoThe Composition of International Capital Flows Risk Sharing
Through Foreign Direct Investmentrdquo Journal of International Economics Vol 61 pp 353ndash383
Alfaro L and A Charlton 2007 ldquoInternational Financial Integration and Entrepreneurial
Firm Activityrdquo NBER Working Paper No 13118 (Cambridge Massachusetts National Bureau of Economic Research)
mdashmdashmdash S Kalemli-Ozcan and V Volosovych 2005a ldquoCapital Flows in a Globalized
World The Role of Policies and InstitutionsrdquoNBER Working Paper No 11696 (Cambridge Massachusetts National Bureau of Economic Research)
mdashmdashmdash 2005b ldquoWhy Doesnrsquot Capital Flow from Rich to Poor Countries An Empirical
Investigationrdquo NBER Working Paper Series No 11901 (Cambridge Massachusetts National Bureau of Economic Research)
Auty R M ed 2001 Resource abundance and Economic Development Improving the
Performance of Resource-Rich Countries (Oxford Oxford University Press) mdashmdashmdash and A Gelb 2001 ldquoPolitical Economy of Resource-Abundant Statesrdquo in Resource
abundance and Economic Development Improving the Performance of Resource-Rich Countries ed by R M Auty (Oxford Oxford University Press)
Becker T O Jeanne P Mauro J D Ostry and R Ranciegravere 2007 Country InsurancemdashThe Role of Domestic Policies IMF Occasional Paper No
254 (Washington International Monetary Fund) Bekaert G Campbell R H and C Lundblad 2005 ldquoDoes Financial Liberalization Spur
Growthrdquo Journal of Financial Economics Vol 77 (July) Chinn MD and H Ito 2007 ldquoA New Measure of Financial Opennessrdquo Available via the
Internet at wwwsscwiscedu7Emchinnresearchhtml
36
Chinn MD and H Ito 2006 ldquoWhat Matters for Financial Development Capital Controls Institutions and Interactionsrdquo Journal of Development Economics Vol 81 (October) pp 163ndash92
Chinn MD Ito H 2002 ldquoCapital Account Liberalization Institutions and Financial
Development Cross-Country Evidencerdquo NBER Working Paper Series No 8967 (Cambridge Massachusetts National Bureau of Economic Research)
DellAriccia G Di Giovanni J Faria A Kose M A Mauro P Schindler M Terrones M and J D Ostry 2008 ldquoReaping the Benefits of Financial Globalizationrdquo IMF Occasional Paper No 264 (Washington International Monetary Fund)
Dorsey T E Tadesse H Singh S and Z Brixiova 2008 ldquoThe Landscape of Capital
Flows to Low-Income Countriesrdquo IMF Working Paper 0851 (Washington International Monetary Fund)
Edison H Klein M W Ricci L A and T Slok 2004 ldquoCapital Account Liberalization
and Economic Performance Survey and Synthesisrdquo IMF Staff Papers Vol 51 No 2 pp 220256
Faria A and P Mauro 2004 ldquoInstitutions and the External Capital Structure of Countriesrdquo
IMF Working Paper 04236 (Washington International Monetary Fund) mdashmdashmdash Minnoni M and AZaklan 2006 ldquoThe External Financing of Emerging Market
Countries Evidence from Two Waves of Financial Globalizationrdquo IMF Working Paper 06205 (Washington International Monetary Fund)
Glaeser E L and A Shleifer 2002 ldquoLegal Originsrdquo Quarterly Journal of Economics
Vol117 pp 1193ndash1229 Gourinchas P-O and O Jeanne 2007 ldquoCapital Flows to Developing Countries The
Allocation Puzzlerdquo NBER Working Paper No 13602 (Cambridge Massachusetts National Bureau of Economic Research)
International Monetary Fund 2007 Global Financial Stability Report (Washington
October) mdashmdashmdash 2008 Regional Economic Outlook Sub-Saharan Africa (Washington September) Ju J and S-J Wei 2007 ldquoDomestic Institutions and the Bypass Effect of Financial
Globalizationrdquo NBER Working Paper No 13148 (Cambridge Massachusetts National Bureau of Economic Research)
37
mdashmdashmdash 2006 ldquoA Solution to Two Paradoxes of International Capital Flowsrdquo NBER Working Paper No 12668 (Cambridge Massachusetts National Bureau of
Economic Research) Karl T L 1997 The Paradox of Plenty Oil Booms and Petro-States (Berkeley University
of California Press) Kaufmann D Kray A and M Mastruzzi 2008 ldquoGovernance Matters VII Aggregate and
Individual Governance Indicators 1996-2007rdquo Policy Research Working Paper No 4654 (Washington DC World Bank Group)
Klein MW 2005 ldquoCapital Account Liberalization Institutional Quality and Economic
Growth Theory and Evidencerdquo NBER Working Paper No 11112 (Cambridge Massachusetts National Bureau of Economic Research)
Kose M A Prasad E Wei S-J and K Rogoff 2006 ldquoFinancial Globalization A
Reappraisalrdquo IMF Working Paper 06189 (Washington DC International Monetary Fund)
Lane P R 2004 ldquoEmpirical Perspectives on Long-Term External Debtrdquo Topics in Macroeconomics Vol 4 No 1 httpwwwbepresscombejmtopicsvol4iss1art1 La Porta R F Lopez-de-Silanes A Shleifer and R W Vishny 1999 ldquoThe Quality of
Governmentrdquo Journal of Law Economics and Organization Vol 15 pp 222ndash79 Lukonga forthcoming ldquoFinancial Market Development Survey of Sub-Saharan African
Countriesrdquo mimeo Mauro P Minnoni M and AZaklan 2006 ldquoThe External Financing of Emerging Market
Countries Evidence from Two Waves of Financial Globalizationrdquo IMF Working Paper 06205 (Washington International Monetary Fund)
Miniane J 2004 ldquoA New Set of Measures on Capital Account Restrictionsrdquo IMF Staff Papers Vol 51 No 2 pp 276ndash308 Mishkin F S 2006 The Next Great Globalization How Disadvantaged Nations can
Harness their Financial Systems to Get Rich (Princeton NJ Princeton University Press)
Obstfeld M and A M Taylor 2004 Global Capital Markets Integration Crisis and Growth Cambridge University Press (2004) Portes R and H Rey 2005 ldquoThe Determinants of Cross-Border Equity Flowsrdquo Journal of
International Economics Vol 64 pp269-296 Prasad Eswar S Raghuram G Rajan and Arvind Subramanian 2007 ldquoForeign Capital and Economic Growthrdquo Brookings Papers on Economic Activity 1 Brookings
38
Quinn D P 1997 ldquoThe Correlates of Change in International Financial Regulationrdquo
American Political Science Review Vol 91 (September) pp 531ndash51 mdashmdashmdash and A Maria Toyoda forthcoming ldquoDoes Capital Account Liberalization Lead to
Economic Growthrdquo Review of Financial Studies Rodrick D 2007 ldquoThe Real Exchange Rate and Economic Growth Theory and Evidencerdquo
Harvard University Working Paper httpksghomeharvardedu~drodrikRER20and20growthpdf
mdashmdashmdash and A Subramanian 2008 ldquoWhy did Financial Globalization Disappointrdquo IMF
Staff Papers Vol 56 No 1 (Washington International Monetary Fund) Schindler M 2009 ldquoMeasuring Financial Integration A New Datasetrdquo IMF Staff Papers
Vol 56 No 1 (Washington International Monetary Fund) Schularick M 2006 ldquoA Tale of Two Globalizations Capital Flows from Rich to Poor in
Two Eras of Global Financerdquo International Journal of Finance and Economics Vol11 pp339-354
Schularick M Steger T 2008 ldquoThe Lucas Paradox and the Quality of Institutions Then
and Nowrdquo Berlin University Working Paper N20083 Stone M R Shimizu S Nordstrom A and H J Ferhani 2008 ldquoDeveloping Essential
Financial Markets in Smaller Economies Stylized Facts and Policy Optionsrdquo IMF Occasional Paper No 265 (Washington International Monetary Fund)
World Bank 2007 Global Development Finance The Globalization of Corporate Finance in Developing Countries (Washington World Bank Group)

8
Figure 4 Recipients of Private Capital Flows
Fig 4c Share of Portfolio and Debt Flows 2000-03(percent of total)
South Africa 231
Kenya 74
Ethiopia 68
Ghana 68Congo Dem Rep of 63
Other SSA 496
Fig 4d Share of Portfolio and Debt Flows 2004-07(percent of total)
South Africa 728
Nigeria 56
Ghana 22
Angola 20
Kenya 17
Other SSA 157
Fig 4a Share of FDI Inflows 2000-03
South Africa 273
Nigeria 168
Angola 165
Equatorial Guinea 58
Chad 50
Other SSA 285
Fig 4b Share of FDI Inflows 2004-07
Nigeria 343
South Africa 155Equatorial Guinea
102
Tanzania 32
Congo Republic of 29
Other SSA 338
Figure 5 Top Ten Recipients of Private Capital
F ig 5 a T o t a l In f l o w s( m i l l io n s o f U S d o l la rs )
A n g o la
K e n ya
C h a d
T a n z a n ia
S o u th A f r ic a
N ig e r ia
E q u a t o r ia l G u in e a
G h a n a
C o n g o D e m R e p o f
E t h io p ia
0 5 0 0 0 1 0 0 0 0 1 5 0 0 0 2 0 0 0 0
F i g 5 b I n fl o w s t o G D P( p e r c e n t)
C h a d
S e yc h e l le s
C o n g o R e p u b l ic o f
S atilde o T o m eacute amp P r iacute n c i p e
A n g o l a
E q u a t o r ia l G u in e a
G a m b ia T h e
C a p e V e rd e
C o n g o D e m R e p o f
G u in e a - B i s s a u
0 5 1 0 1 5 2 0 2 5 3 0 3 5
F ig 5 c In f lo w s to P o p u la ti o n( r a ti o )
A n g o la
G a b o nC o n g o
R e p u b l ic o fC a p e V e r d e
N a m ib ia
B o t s w a n a
S o u t h A fr i c a
M a u r i t i u sE q u a t o r i a l
G u in e aS e yc h e l le s
0 5 0 0 1 0 0 0 1 5 0 0 2 0 0 0
Note All rankings based on averages for 2000-07 Source African Department data base and IMF staff calculations
9
Figure 6 External Vulnerability
Fig 6a Low-income African Countries Current Account Balance and Capital Inflows 2000-07
0
100
200
300
400
500
600
700
800
900
2000 2001 2002 2003 2004 2005 2006 2007-14
-12
-10
-8
-6
-4
-2
0
Capital Flowsleft axis
Current Account Balanceright axis
Fig 6b Oil Producers Current Account Balance and Capital Inflows 2000-07
0
500
1000
1500
2000
2500
2000 2001 2002 2003 2004 2005 2006 2007-20
-15
-10
-5
0
5
10
Capital Flowsleft axis
Current Account Balanceright axis
Fig 6c Low Income Africa Countries International Reserves and Capital Flows
0
100
200
300
400
500
600
700
800
900
2000 2001 2002 2003 2004 2005 2006 200700
02
04
06
08
10
12
14
16
Reservesright axis
Capital flowsleft axis
Fig 6d Oil Producers International Reserves and Capital Flows
0
500
1000
1500
2000
2500
2000 2001 2002 2003 2004 2005 2006 20070
2
4
6
8
10
12
Capital Flowsleft axis
Reservesright axis
III DETERMINANTS OF PRIVATE CAPITAL FLOWS TO SSA
This section investigates the determinants of private capital flows to sub-Saharan Africa during 2000-2007 with particular focus on the role of domestic capital market development Capital flows to sub-Saharan Africa particularly portfolio flows have been concentrated in a relatively small number of countries with relatively sophisticated financial markets In these countries capital has flown into equities where the stock market was sufficiently developed (eg Kenya Nigeria) government bonds in countries that had sovereign issues (Botswana Ghana) and short-term government securities (Uganda Tanzania and Zambia) when few other investment vehicles open to non-residents were available The availability of investment instruments appears to have dominated the existence of capital controls For example in Tanzania legal loopholes allowed international investors to purchase significant amounts of government securities although in principle foreigners were not allowed to hold government debt (IMF 2008)3
3 Nevertheless targeted capital controls as in Ghana appear to have been successful in developing the longer end of the market for government debt
10
We use a new indicator of capital market development in sub-Saharan Africa that captures the structure of capital markets Capital markets along with money foreign exchange and derivatives markets form part of a countryrsquos ldquoessential financial marketsrdquo (Stone et al 2008 Lukonga forthcoming) In particular we consider government securities markets both for treasury bills and treasury bonds as well as corporate bond markets and equities markets (see Lukonga forthcoming) We construct a simple index which is the sum of four dummy variables taking the value of 1 if the market in question exists and is well-developed The index covers all sub-Saharan African countries except Somalia Using this index simple tabulations show that the average level of financial market development is fairly low in sub-Saharan Africa with only 10 countries or 21 percent of the sample countries having complete capital markets (Table 2)4 However as discussed earlier these countries are also among the largest recipients of private capital inflows in sub-Saharan Africa along with a few oil exporters (Angola Congo Chad and Equatorial Guinea) While the role of institutional development in attracting international capital flows has been emphasized in recent studies very few have attempted to isolate the role of financial versus basic property rights institutions The measures of financial market development used in the literature and that would be available for low-income countries such as ratios of money and credit to GDP have their limitations They measure outcomes such as the ability of the financial (mostly banking) sector to provide transaction services (in the case of the ratios of money or broad money to GDP) or the capacity of the banking system to channel savings rather than the extent of financial market development as measured by the availability of investment instruments Our empirical results detailed below indicate that along with other factors such as market size (particularly for portfolio inflows) and oil exporting status (particularly for FDI flows) the index of capital market development is a significant and robust determinant of international capital flows to sub-Saharan African countries
4 The countries are Botswana Ghana Kenya Namibia Nigeria South Africa Swaziland Tanzania Uganda and Zambia
11
Capital Markets
T-Bills T-BondsCorporate
Bonds Equities
Botswana X X X XGhana X X X XKenya X X X XNamibia X X X XNigeria X X X XSouth Africa X X X XSwaziland X X X XTanzania X X X XUganda X X X XZambia X X X XBenin X X X Burkina Faso X X X NCape Verde X X N XMauritius X X XMozambique X X X Zimbabwe X X XAngola X X N NCocircte dIvoire N X N XGambia The X X N NSenegal X X N Seychelles X X N NCameroon N N XCongo Dem Rep of X N N NEthiopia X N N NGuinea X N N NGuinea-Bissau X N N NLesotho X N N NMadagascar X N N NMalawi X N N Rwanda X N N NSierra Leone X N NTogo X N Burundi N N NCentral African Republic NChad N N N NComoros N N N NCongo Republic of N N N NEquatorial Guinea N N N NEritrea N N NGabon N N N NLiberia N N N NMali N N NNiger N Satildeo Tomeacute and Priacutencipe N N N N
Sources Lukonga (forthcoming) and authors calculationsNotes X denotes that the market is fairly or very well developed denotes that the market nominally exists or is partially developedN denotes that the market does not exist
Table 2 Capital Market Development in Sub-Saharan Africa
12
A Recent Literature
The starting point of much of the recent literature on determinants of capital flows has been an attempt to explain the Lucas Paradox or why private capital doesnrsquot seem to flow from rich to poor countries Standard neoclassical theory predicts that capital should flow from capital-rich countries (with low marginal productivity of capital) to capital-scarce countries (with a high marginal product of capital) In practice however the bulk of observed flows particularly in the modern period consists of flows among developed economies Compared to the early 20th century era of financial globalization the current wave of capital flows is characterized by massive diversification of flows between high-income economies and a relative marginalization of less-developed economies (Obstfeld and Taylor 2004 Schularick 2006 and Schularick and Steger 2008) Some authors posit that the paradox is due to country-specific fundamentals that tend to lower the marginal product of capital in developing countries such as missing factors of production including human capital poor economic policies and poor institutions (Alfaro Kalemli-Ozcan and Volosovych 2005a and 2005b Faria et al 2006 Faria and Mauro 2004 Schularick and Steger 2008) In this vein a recent study shows that the extent of domestic financial market development and the quality of domestic financial institutions has played a significant role in attracting capital flows to emerging markets (IMF 2007) The second set of explanations centers around international capital market imperfections such as asymmetric information sovereign risk and capital controls For example Portes and Rey (2005) find that informational frictions proxied by geographic distance affect the amount and direction of capital flows and Lane (2004) also finds that credit market frictions are a determinant of debt flows in 1970-1995 The studies that focus on the role of institutions in attracting foreign private capital highlight the importance of basic institutions particularly property rights protection Weak property rights owing to poor quality institutions affect entrepreneursrsquo investment decisions Risks of expropriation armed conflict and malfunctioning legal systems all have a potentially negative impact on the returns from those investments Empirically property rights institutions have been proxied by an index derived from the Kaufman Kray and Mastruzzi World Governance IndicatorsWGIs or by an index derived from the ICRG indicators 5 Using those proxies better quality institutions are found to be positively and significantly correlated with foreign equity flows (Alfaro et al 2005a 2005b) and with a higher share of equity in a countryrsquos total stock of external liabilities (Faria and Mauro 2004 and Faria et al 2006) 5 The ICRG composite index aggregates over several dimensions such as government stability investment profile internal and external conflict non-corruption law and order protection from religious and ethnic tensions non-militarized politics democratic accountability and quality of bureaucracy (wwwprsgroupcom) Similarly the WGIs measure countriesrsquo score according to 6 governance dimensions namely voice and accountability political instability government effectiveness regulatory burden rule of law and control of corruption (wwwworldbankorgwbigovernancegovdata)
13
As mentioned earlier few studies focus on the role played by the extent of domestic financial market development in attracting international capital flows While the literature tends to link capital flows (financial globalization) to improvements in domestic financial systems (eg Chinn and Ito 2005 2002 Mishkin 2006) in principle the direction of causality is not clear Chinn and Ito (2005) and Klein (2005) find empirical evidence supporting the notion of a threshold effect financial openness contributes to equity market development only when a threshold level of general development of legal systems and financial development is attained However although property rights and financial institutions could potentially affect capital flows differently no study of the determinants of capital flows has empirically attempted to properly disentangle the effects of both Ju and Wei (2007 2006) develop theoretical models showing that financial institutions and property rights institutions can have different effects on capital flows Whereas an inefficient financial system can be bypassed by international capital flows as they could come in the form of FDI instead of portfolio and debt flows high expropriation risk cannot be bypassed Conversely the stronger domestic property rights the more the country will benefit from international capital flows
B Estimation strategy and Model
Cross-country regressions have been found appropriate to investigate the fundamental (and thus slow-moving) determinants of why some countries attract more inflows or more of a certain type of inflows than other countries In particular we are interested in testing whether financial institutions have a separate and different effect on capital inflows than property rights institutions That effect may also differ depending on the type of capital flows Empirically Acemoglu and Johnson (2005) show that property rights and contractingfinancial market development institutions do affect economic outcomes differently While property rights institutions have a first order effect on economic outcomes such as long-run GDP growth investment rates and financial depth contracting institutions seem to mostly affect the degree of financial market development As others we use instrumental variables to tackle the issue of reverse causality and endogeneity associated with the measures of institutions (Acemoglu and Johnson 2005 Alfaro Kalemli-Ozcan and Volosovych 2005a and 2005b DellrsquoAriccia et al 2008 Faria et al 2006 Faria and Mauro 2004) Building on the recent literature the reduced-form linear equation to be estimated is
iiiii uCPFK +sdot+sdot+sdot+= χβαμ (1) Where iK is log of average inflows to country i iF is a measure of financial institutions and iP a measure of property rights iC is a set of exogenous control variables and iu is an independent error term α β and γ are coefficients capturing the impact of financial development property rights institutions and other controls on capital flows where α and β are of particular interest and μ is a constant
14
Given that the measures of financial and property rights institutions are endogenous simple OLS estimates of equation (1) will be biased As indicated in Acemoglu and Johnson (2005) the α and β coefficients may capture reverse causality or the effect of some other omitted characteristic Second as financial market development and property rights are measured with error there may be a downward attenuation bias and finally if contracting and property rights institutions are correlated the effect of the type of institution that is measured with greater error will load onto the other variable Following Acemoglu and Johnson (2005) the estimation strategy therefore relies on estimating equation (1) with two-stage least squares (2SLS) using valid and separate instruments for financial and property rights institutions The two first stage equations will thus be of the form
iiiii CELF 11111 εχηδν +sdot+sdot+sdot+=
iiiii CELP 22222 εχηδν +sdot+sdot+sdot+= (2) Where iL and iE are instruments for financial institutions and property rights institutions respectively The key exclusion restriction is that Cov( iu iL ) = Cov ( iu iE ) =0 iu being the error term in the second-stage equation (1)
C Empirical Analysis This study utilizes a unique data set on capital inflows to SSA prepared by the staff of the International Monetary Fund described in Appendix I Choice of variables The following set of variables was chosen to estimate equations (1) and (2) (see Appendix II for definitions and sources Descriptive statistics are presented in Appendix III Table 1 bull Financial institutions are proxied by the simple index of capital market development
described earlier (Lukonga forthcoming) The more developed capital markets the higher capital flows
bull Property rights institutions are proxied by the rule of law score from the World Governance Indicators (Kaufmann Kray and Mastruzzi 2008) Among the six governance dimensions used by Kaufmann et al 2008 this is the closest proxy for property rights protection6 Better property rights protection should lead to higher capital flows
6 Various other proxies for property rights institutions exist and have been used in empirical studies Faria et al (2006) and Faria and Mauro (2004) use the simple average of KKMrsquos governance indicators for a single year Alfaro et al use the ICRG score (2005a 2005b) Acemoglu and Johnson (2005) and Acemoglu Johnson and
(continuedhellip)
15
bull Following Acemoglu and Johnson (2005) we use British legal origin as the instrument for financial market development taken from La Porta et al (1999) Acemoglu Johnson and Robinson 2002 Glaeser and Schleifer 2002 and La Porta et al1999 show that in the case of former European colonies legal origin is a valid instrument for contracting institutionsfinancial market development and property rights respectively Legal origin is shown to be positively and significantly associated with financial institutions with civil law countries exhibiting lower financial development than common law countries (Glaeser and Schleifer 2002 La Porta et al 1999)
bull The instruments for property rights institutions are the degree of ethno linguistic fragmentation and the countryrsquos latitude taken from La Porta et al (1999) which have been found to be associated with worse property rights and regulations7 Acemoglu and Johnson 2005 Acemoglu Johnson and Richardson (2002) Faria et al 2006 and Faria and Mauro 2004 use settler mortality in 1500 or population density in 1500 and show that they are valid instruments for property rights institutions For sub-Saharan African countries however settler mortality and population density in 1500 are available only for a subset of countries (Acemoglu and Johnson 2002)8 Given the better country coverage we have chosen to proceed with ethno linguistic fragmentation and latitude
bull A dummy variable to control for oil-exporting countries (the dummy variable takes the value of 1 if the country is an oil exporter) Oil-exporting countries attract more FDI other things equal
bull A dummy variable to control for market size (the dummy variable takes the value of 1 if the country is South Africa or Nigeria) Larger and more sophisticated economies attract more capital flows
Similar studies also include a number of additional explanatory variables though it is more difficult both to argue that they are exogenous and to find valid instruments for them We use these variables in our baseline regression
bull Human capital proxied by the share of secondary school enrollment in the population from the WDI This variable features in explanations of the Lucas Paradox that focus on missing factors of production (Alfaro et al 2005a 2005b) The expected impact of higher human capital on capital flows is expected to be positive
Robinson (2002) use average protection against expropriation risk and constraint on the executive as measures of property rights but these measures are not available for a sufficiently large number of our sample countries 7 La Porta et al (1999) however note that the adverse effects of ethno linguistic fractionalization on government performance tend to disappear when controlling for per capita income and latitude except for public good provision and state-owned enterprises This can be interpreted as countries with a large public enterprises sector tend to have less regard for private enterprises and private property rights 8 Robustness checks using population density in 1500 as an instrument yield results that are consistent with those obtained with ethno linguistic fragmentation (results not shown)
16
bull A measures of de jure capital account openness proxied by the Chinn-Ito measure of capital account openness based on the IMFrsquos AREAER (Chinn and Ito 2007) We use the average value of the Chinn-Ito variable for sub-Saharan African countries over 1999-20059 The effect of capital account openness on capital flows is expected to be positive
bull A measure of trade openness proxied by the sum of exports and imports over GDP Particularly at an initial stage capital mobility develops around greater openness to trade flows Arguably countries that are more open to trade may also be politically more open to greater integration with the rest of the world
bull Macroeconomic performance proxied here by the real GDP growth rate In a panel study of 47 industrial and emerging countries IMF (2007) find that expected macroeconomic performance proxied by lagged real GDP growth is a significant determinant of private capital inflows IMF (2008) similarly finds that real GDP growth and lower fiscal deficits are significantly correlated with higher private capital inflows Alfaro (2005b) uses inflation volatility as a proxy for macroeconomic performance However it is difficult to establish causality as inflows directly affect macroeconomic outcomes (also see below) Further macroeconomic outcomes have been shown to be shaped by institutions making it difficult to study the independent effect of institutional development on capital flows
Correlations Appendix Table III2 shows pairwise correlations between different measures of capital flows while Appendix Table III3 shows the pairwise correlations corresponding to the baseline regressions and Appendix Table III4 focuses on the pairwise correlations of the institutional variables and the instruments
Appendix Table III2 indicates that for our sample the choice of scaling variable affects the pairwise correlations of the inflows with the independent variables This confirms the impression from Figure 5 above that the picture of the allocation of private capital inflows across sub-Saharan countries is very different whether one looks at overall volume of inflows or at the size of the inflows relative to a countryrsquos population or GDP Whereas total inflows as a share of population or GDP will be the variable of interest when studying the economic impact of the inflows on individual countries (see Section IV below) the investigation of the factors determining the allocation of private capital flows to sub-Saharan Africa across the
9 Unlike many other studies that use the simple average of the four dummy variables or the dummy on capital account restrictions (Alfaro et al 2005a 2005b IMF 2007b) the Chinn-Ito measure attempts to capture the intensity of the capital controls by incorporating all the restrictions in the index using a principal components approach Whereas the other restrictions are not directly related to capital account restrictions they are taken as indicative of the overall restrictiveness of the regime The advantage of this measure over other more detailed indices that capture the intensity of capital controls (Quinn 1997 2003 Miniane 2004 Schindler 2009) is its near universal country and extended time coverage 181 countries between 1970 and 2005
17
continent should focus on the total volume of inflows A simple explanation is that private investors are more likely to decide on allocating specific amounts of money to various markets or projects than to fix investment limits relative to a countryrsquos population or GDP Therefore for the remainder of this section the variable of interest will be the log of private capital inflows and their components FDI on the one hand and portfolio and debt flows on the other averaged over 2000-2007 for each sub-Saharan African country excluding Somalia and Zimbabwe Looking at the potential determinants of private capital flows to SSA and their composition in Appendix Table III2 (columns 1-4) overall inflows as well as portfolio and debt inflows are correlated with the index of financial sector development secondary school enrollment the market size dummy variable and the log of initial GDP per capita There are however interesting variations for the determinants of FDI flows to which GDP per capita and secondary school enrollment are not significantly correlated but the proxy for property rights and the dummy for oil producers are The measure of trade openness and the Chinn-Ito capital openness variable are never significantly correlated with private inflows or their components However capital account openness is correlated with the degree of financial sector development as in Chinn and Ito (2005) and with secondary school enrollment
Appendix Table III3 illustrates the challenges associated with finding truly exogenous determinants of private capital flows and their composition as a number of potential explanatory variables are correlated with each other In particular the measure of financial market development is highly correlated with the proxies for property rights institutions as discussed above Further educational achievement is significantly correlated with the institutional quality variables and economic development This is not surprising as it can be understood as an outcome of good institutions and higher degree of economic development This strong degree of endogeneity and the fact that we are interested in disentangling the impact of institutions on capital inflows argues that like the variables capturing macroeconomic performance it is probably not a useful explanatory variable given our focus on the impact of institutions per se on capital inflows The same holds true for the proxy for economic development log of GDP per capita in 2000 (Alfaro et al 2005b show that log real GDP per capita has no additional explanatory power once a measure of institutional quality is introduced)
The pairwise correlations of the potential instrumentsmdashBritish legal origin population density in 1500 and ethno linguistic fragmentationmdashwith the institutional variables and with the capital flows variables are encouraging for the instrumental variables approach (Appendix Table III4) The potential instruments for property rights institutions are uncorrelated with the inflows variables but are significantly correlated with the property rights proxies Although British legal origin is significantly correlated with total inflows in addition to financial institutions it is not correlated with property rights nor its potential instruments
18
Regression results
Table 3 presents the results of simple OLS estimations of various specifications of equation (1) as a benchmark The coefficient on the financial market development index is positive and significant and robust across all specifications For portfolio and debt flows it is even the only variable that is significant maybe highlighting the particular importance of capital market development for non-FDI flows The coefficient on property rights institutions (rule of law score) is never significant and has the wrong sign The coefficients on the controls for country size and oil exporters are large and generally significant but while oil exporters do receive more FDI than other countries they do not have any particular advantage with portfolio and debt inflows Real GDP growth is the only other variable that is significant for total inflows and FDI However as discussed earlier real GDP growth is not exogenous and to study the impact of institutions further we use the specification in column (3) as our baseline The log of real GDP per capita in 2000 secondary enrollment and capital account and trade openness are never significant10 The results obtained are similar when breaking the sample into two sub-periods capturing the period before and after the acceleration of private capital inflows This is not surprising considering that the determinants of inflows are fairly slowly-moving country characteristics They are also robust to excluding South Africa and Nigeria indicating that the results are not driven by the two largest recipients and to excluding all oil exporters (Results available upon request) Indeed the impact of financial market development on inflows is even larger in both cases
(1) (2) (3) (4) (5) (6) (7) (8) (1) (2) (3) (4) (1) (2) (3) (4)Financial Institutions 050 056 052 055 056 058 056 057 067 063 055 057 055
(-346) (586) (548) (544) (565) (527) (603) (536) (499) (343) (348) (322)Rule of Law -021 -033 -041 -027 -028 -033 -037 -003 -010 -020 -018 -052 -058
(-056) (-114) (-136) (-070) (-085) (-112) (-129) (-008) (-025) (052) (-046) (-124) (-131)South Africa and Nigeria 185 187 198 189 179 158 135 137 211 212
(168) (170) (121) (160) (161) (137) (134) (137) (160 (160)Oil Exporters 161 101 162 168 160 164 267 194 051 012
(314) (190) (304) (276) (308) (306) (441) (367) (078) (014)Real GDP growth
011 014 007(326) (304) (127)
Secondary Enrollment -000
(-028)Log 2000 per capita GDP -05
(-032)Capital Account Openness -06
(-06)Trade Openness
-001(-202)
Constant 447 522 379 335 392 413 374 441 342 442 268 216 345 430 288 260(-125) (2317) (1146) (966) (836) (398) (1015) (867) (713) (1956) (635) (477) (900) (1361) (482) (410)
Observations 43 43 43 43 42 43 43 43 43 43 43 43 43 43 43 43R-squared 026 001 057 062 057 057 058 059 022 000 055 059 025 000 042 044F-Statistic 1196 031 1200 1581 878 946 941 1532 1197 001 1289 1406 1176 021 545 493
Source Authors calculations
Note and indicate significant at 1 5and 10 percent t-Statistics are reported in parentheses Robust standard errors
Table 3 Baseline OLS Estimation ResultsTotal Inflows FDI Inflows Portfolio amp Debt Inflows
10 A recent study finds that as is the case for low-income countries de jure financial integration is fairly low for sub-Saharan Africa compared to other regions Capital control regulations tend to be complex and nontransparent and limited capacity to monitor capital flows can lead to inconsistent implementation Inconsistencies between different regulations have also made capital controls easy to circumvent This may explain the difficulties in establishing an empirical relation between capital controls and capital flows in the region (IMF 2008)
19
Table 4 presents the results of the 2SLS estimation The first stage equations are shown in Panel A and the second stage in Panel B Columns (1) and (2) report results using Ethno linguistic fractionalization as the instrument for property rights institutions and columns (3) and (4) using latitude Given the very low R-squared obtained in the latter case corresponding results are not shown for the components of the inflows Starting with the first-stage regressions British legal origin is shown to have a strong positive and significant impact on financial development but not on the rule of law while the instrument for property rights has a stronger and mostly significant impact on property rights (greater ethno linguistic fragmentation has a negative impact on rule of law as does closeness to the Equator) than on financial institutions Market size has a positive and significant impact on capital market development and oil exporting status has a negative and significant impact However market size is negatively related to rule of lawalthough this is likely to be mainly because of the relatively low ratings of Nigeria and South Africa regarding property rights protection Oil exporting status is also negatively related to rule of law a result attributed to the rent-seeking culture that appears to take hold in resource-rich countries (Auty 2001 Auty and Gelb 2001 Karl 1999 1997)
(1) (2) (3) (4) (1) (2) (1) (2) (1) (2)
Financial Institutions042 022 061 062 061 051 032 001 006 011(200) (097) (211) (134) (264) (214) (137) (004) (148) (259)
Rule of Law -101 -035 -225 -231 -096 025 -043 -020 -009 010(-092) (-028) (-198) (-160) (-082) (020) (-034) (-012) (-047) -041
South Africa and Nigeria 277 076 196 380 -037
(205) (039) (149) (241) (-195)Oil Exporters 115 067 265 -060 054
(157) (090 (298) (-006) (332)Constant 396 443 275 255 272 318 359 414 032 030
(430) (448) (233) (157) (287) (379) (348) (334) (188) (170)Observations 42 42 43 43 42 42 42 42 42 42R-squared 028 047 005 007 025 053 024 024 NA 012
British Legal Origin 181 148 188 155 181 148 181 148 181 148(408) (291) (419) (295) (408) (291) (408) (291) (408) (291)
Instrument for Rule of Law1 060 069 031 084 060 069 060 069 060 069
(097) (107) (024) 063) (097) (107) (097) (107) (097) (107)South Africa and Nigeria 145 158 145 145 145
(260) (295) (260) (260) (260)Oil Exporters -085 -074 -085 -085 -085
(-210) (-193) (-210) (-210) (-210)Constant 078 092 106 116 078 092 078 092 078 092
(188) (229) (394) (423) (188) (229) (188) (229) (188) (229)Adj R-squared 032 034 031 033 032 034 032 034 032 034
British Legal Origin 031 034 023 023 031 034 031 034 031 034(166) (161) (121) (121) (166) (161) (166) (161) (166) (161)
Instrument for Rule of Law1 -068 -053 143 148 -068 -053 -068 -053 -068 -053
(-211) (-157) (122) -163 (-211) (-157) (-211) (-157) (-211) (-157)South Africa and Nigeria -065 -058 -065 -065 -065
(-336) (-278) (-336) (-336) (-336)Oil Exporters -033 -048 -033 -033 -033
(-183) (-225) (-183) (-183) (-183)Constant -036 -038 -096 -086 -036 -038 -036 -038 -036 -038
(-150) (-154) (-591) (-514) (-150) (-154) (-150) (-154) (-150) (-154)Adj R-squared 010 017 008 019 010 017 010 017 010 017
Source Authors calculations
Financial Institutions Financial Institutions Financial Institutions
Table 4 Instrumental Variables Estimation ResultsPortfolio Inflows
Panel A Second-Stage Regressions
Panel B First-Stage Regressions
Rule of Law
Note and indicate significant at 1 5and 10 percent t-Statistics are reported in parentheses Robust standard 1 In columns (1) and (2) the instrument for rule of law is ethnolinguistic fractionalization In columns (3) and (4) the instrument is latitude
Total Inflows FDI Inflows
Rule of Law Rule of Law
Share of FDI
Financial Institutions
Rule of Law
20
Comparing the second-stage equations with the OLS estimates the impact of financial institutions is overall weaker (smaller coefficients) but remains strong and significant for total inflows and FDI inflows as well as the share of FDI in total inflows Interestingly the property rights variable is never significant and continues to have the ldquowrongrdquo sign in most cases except for FDI inflows and the share of FDI (column 2) perhaps indicating that non-FDI investors believe property rights are not critical for their relatively liquid investments Oil resources is a strong determinant of FDI inflows but not other types of flows whereas it is market size that seems to matter for portfolio and debt inflows When excluding South Africa and Nigeria or oil-rich countries from the estimation results are broadly similar with the coefficient on financial institutions larger particularly in the FDI regressions This indicates that in non-oil sub-Saharan African countries excluding South Africa FDI inflows are significantly larger the more financial markets are developed Perhaps surprisingly property rights protection is insignificant This may be explained by the fact that as FDI is harder to expropriate even countries with poor property rights protection receive FDI Alternatively for these relatively small countries it may be possible for foreign investors to effectively negotiate greater property rights for their FDI than is generally available in the country for other investors Given the small sample size the results must be interpreted with caution but overall they support the importance of unbundling institutions and measuring them more precisely Results also support the notion that for capital flows financial institutions as proxied by capital markets development matter more than basic property rights institutions capital including in the form of FDI will flow less to countries with less developed financial markets against the view presented in Albuquerque (2003) that FDI should flow more to financially constrained countries
IV DO PRIVATE CAPITAL FLOWS HAVE AN IMPACT ON GROWTH IN SSA This section undertakes a preliminary analysis of the relationship between capital inflows and growth in sub-Saharan Africa Significant capital flows to African countries are a relatively recent phenomenon and as noted above have so far been restricted to a limited number of markets Given the general inconclusiveness of the empirical evidence on the links between growth and capital flows from emerging markets that have been on the radar of international investors much longer than most African markets it is perhaps too early to expect robust econometric results with the particular sample in this paper While it is easy to make a theoretical case for the positive impact of capital flows on growth the empirical verification of this impact has proved much more challenging11 Alternate
11 See Edison and others 2004 Kose and others 2006 DellrsquoAricia and others 2008 and Prasad Rajan and Subramanian 2007 for comprehensive reviews of the empirical literature on the impact of capital flows Though evidence from empirical studies using aggregate data is inconclusive studies that use measures of de facto
(continuedhellip)
21
explanations to this empirical puzzle have predicated the gains from capital flows on the threshold development of certain domestic institutions andor proposed that such flows generate certain indirect or collateral benefits even when their direct impact on growth is difficult to gauge Klein (2005) finds support for a model in which institutional quality intermediates the impact of capital account liberalization on growth by affecting the extent to which savings are protected from expropriation and the premium borrowers pay for funds from abroad In countries with better institutions capital account openness has a significant positive impact on growth Bekaert Harvey and Lundblad (2005) find that the largest growth response to equity market liberalizations accrues to countries with better legal systems above-average financial development and better-quality institutions in terms of investor protection and accounting standards Using industry-level data Prasad Rajan and Subramanian (2007) indicate that for countries that have above-median levels of financial development foreign capital aids the relative growth of those industries dependent on finance But for countries below the median for financial development the effect of foreign capital inflows is diametrically opposite Using firm-level data Alfaro and Charlton (2007) find a significant relationship between entrepreneurial activity and both de jure and de facto international capital integration Their results suggest that foreign capital may improve access to capital either directly or through improved domestic financial intermediation
Recent evidence however indicates that countries that grow more rapidly are those that rely less and not more on foreign capital and in turn foreign capital tends to flow to countries that experience not high but low productivity growth (Prasad Rajan and Subramanian (2007) Gourinchas and Jeanne (2007)) One possible explanation for this puzzle is trade fast-growing countries also are the ones that experienced a takeoff in their export sector (Gourinchas and Jeanne 2007) If capital inflows lead to higher prices for nontraded goods owing to absorptive capacity constraints and thus to overvaluation they will have a negative impact on exports and hence growth (Kose and others 2006 Prasad Rajan and Subramanian 2007) Another explanation is that inflows from abroad that supplement domestic savings will have a limited impact in an economy where the binding constraint is the scarcity of viable investment opportunities (Rodrik and Subramanian 2009)
We estimate the gains from financial globalization using the same cross-section sample of average flows for the 2000-07 period as in the preceding section However in this section we also make use of data on net flows For most African countries the differences between net and total capital flows are not often vast nevertheless the economic impact of such flows depends on the actual infusion of foreign capital rather than gross flows Also we scale net flows to the size of the economy by alternatively dividing them by population or GDP
integration or finer measures of de jure integration tend to find more positive results Studies using micro data are also better able to find growth and productivity gains from financial integration
22
A Correlation Analysis
We begin the correlation analysis with a simple mapping between economic growth and capital flows in sub-Saharan Africa while not drawing any inferences about the direction of causation
12 The scatter plots indicate a generally positive correlation between growth and capital flows in our sample13 Consistent with the findings in the literature the relationship is more pronounced when only FDI flows are considered
Figure 7 Sub-Saharan Africa Capital Flows and Real GDP Growth
Capital Flows and Real Growth(net total flows to population)
-600
-500
-400
-300
-200
-100
0
100
200
300
-2 0 2 4 6 8 10 12 14
Capital Flows and Real Growth(net total flows to GDP)
-15
-10
-5
0
5
10
15
20
25
30
-5 0 5 10 15 20 25
FDI and Real Growth(net FDI to population)
0
20
40
60
80
100
120
140
160
180
-2 0 2 4 6 8 10 12 14
FDI and Real Growth(net FDI to GDP)
-5
0
5
10
15
20
25
30
-5 0 5 10 15 20 25
Note All variables are the average value of the 2000-07 period Where normalized over population the charts exclude the outliers Equatorial Guinea and Seychelles Table 5 provides further evidence of the positive significant correlation between capital flows to sub-Saharan Africa and real GDP growth in the recipient countries This relationship however does not hold when capital flows are disaggregatedmdashwhile FDI is positively correlated with growth portfolio and debt-creating flows are generally inversely related to growth though
12 As mentioned in the previous section in analyzing the relationship between growth and capital flows the latter are normalized over either the population or GDP of the recipient country All variables are considered at their average values over the 2000-07 period to deal with annual volatility 13 This is in contrast with Rodrick and Subramanian (2008) who in a sample of 110 developing countries running through 2004 do not find any relationship between financial globalization (measured as the sum of foreign assets and liabilities as a share of GDP) and growth
23
not significantly so This finding is also consistent with evidence from other studies(DellrsquoAricia and others 2008)
B Testing channels of transmission of private capital flows on growth Another approach to gauging the likely impact on capital inflows on growth is to test the various channels described in the literature on financial globalization and growth Three broad channels are identified as linking capital inflows and growth
bull Overvaluation to the extent that capital inflows cause currency appreciation they hurt exports and thus dampen growth This channel is well-documented in Rodrick (2007) but also discussed in Prasad et al (2007)
bull Savings and investment where foreign capital supplements domestic savings it fosters growth However this would only be true for economies where the main constraint on growth is a lack of savings Where the main hindrance to economic growth is the scarcity of viable investment opportunities additional foreign capital will only add to domestic distortions (Gourinchas and Jeanne 2007 Rodrick and Subramanian 2009)
bull Institutional development a number of studies argue that capital inflows carry indirect (collateral) benefits for recipient countries via the development of domestic institutions (Becker and others 2007 Kose and others 2006) or more particularly financial sector institutions (Mishkin 2006)
The testing methodology employed here utilizes correlations as well via bivariate regressions In the first stage the bivariate model regresses capital flows on the channel of interest If the first stage results indicate that the channel is significantly correlated with capital flows then in the second stage the model regresses the predicted value of the channel
Real GDP Growth
Net Total FlowsGDP
FDI FlowsGDP
Debt FlowsGDP
Portfolio FlowsGDP
Real GDP Growth 100Net Total FlowsGDP 038 100FDI FlowsGDP 066 054 100Debt FlowsGDP -002 072 -007 100Portfolio FlowsGDP -006 031 -010 002 100
Real GDP Growth
Net Total Flows per
capitaFDI Flows per capita
Debt Flows per capita
Portfolio Flows per capita
Real GDP Growth 100Net Total Flows per capita 037 100FDI Flows per capita 044 089 100Debt Flows per capita 008 053 022 100Portfolio Flows per capita -007 025 -001 -006 100Note indicates significant at 10 percentSource Authors calculations
Table 5 Correlations Net Capital Flows and Real Growth
24
from the first regression ie that part of the channel variable correlated with capital flows on growth If the coefficient in the second regression is significant and with the expected sign it implies that the channel is likely to be operational for this particular sample of countries Evidence that a particular channel could be at work is not sufficient to demonstrate the impact of private capital flows on growth but it is a necessary first step Thus Yi = α1 + β Ki + u1 (1) gi = α 2 + η Ŷi + u2 (2) Where Yi is the channel variable of interest Ki are capital flows normalized over GDP or population gi is the real GDP growth rate and Ŷi is the predicted value of the channel variable of interest derived from the first regression All variables are in their level values so that sign and significance of β and η are of greater interest than their magnitude The results are presented in Table 6 below
Overvaluation InvestmentDomestic
Savings InstitutionsNet flowsGDP -0004 0164 0337 -0214Net flows per capita -000003 0012 0021 -00042Note and indicate significant at 1 and 5 percent respectivellySource Authors calculations
Table 6 Channels of Transmission Between Capital Flows and Growth
The findings indicate that in most instances capital flows are not significantly correlated with the channel variables in our sample Except when capital flows are scaled to the size of the recipient countryrsquos population mdash both savings and investment are positively and significantly related to capital flows in this instance14 This implies that for SSA countries the impact of private capital flows on growth could be partly intermediated through the impact of net capital flows on domestic savings and investment Another implication would also be that African economies are not necessarily investment-constrained15 14 As expected the impact of the predicted values of investment and domestic savings in the second stage regressions is positive
15 Rodrik and Subramanian (2009) define an economy to be savings-constrained when private investment is low despite the existence of many privately profitable projects because credit is either not available or too costly and to be investment-constrained when credit is available but there is a lack of profitable investment opportunities (p12) In savings-constrained economies foreign capital will supplement scarce domestic savings (evidenced by high real interest rates) and lead to increased investment In investment-constrained economies real interest rates will be low and additional capital flows will finance consumption rather than investment
25
In an unexpected outcome the institutional variable is negatively related to growth a result that holds even when oil-exporters are excluded from the sample (not shown)
C How do Private Capital Flows Affect Growth Going beyond bivariate correlations we first present a simple cross-country multivariate regression model making use of a averages for the 2000-07 period 16 Although this method is not without shortcomings the limited time coverage of our dataset and year-on-year volatility dampens the usefulness of panel estimation However our analysis is subject to the considerable limitations of the ordinary least squares estimator in growth models mdash especially those arising from endogenous variables We fit a simple ordinary least squares specification to estimate the relationship between capital flows and growth gi = α + β Ki + η Xi + ui Where gi is real GDP growth Ki are capital flows normalized over GDP or population Xi is a set of control variables and ui is an independent error term In our choice of control variables we are guided by the ldquochannelsrdquo analysis from the preceding section since our interest in primarily in the impact of capital flows on growth Thus our multivariate model is essentially a simultaneous test of the correlations between of the various channel variables (plus capital flows directly) and growth As discussed above other factors shown in the literature on financial globalization to influence growth include savings and investment exchange rate overvaluation and institutions The exchange rate overvaluation measure is constructed as the ratio of the nominal exchange rate to the purchasing power parity exchange rate17 The measure of institutions used here is the number of procedures to enforce a contract (Contracts) from the World Bankrsquos Doing Business database We also control for level of economic development by including the log of initial per capita real GDP growth The results are documented in Table 7
16 See Appendix Table IV1 and Appendix Table IV2 for summary statistics and correlations for the variables included here 17 More precisely the variable is the residual of a simple panel regression between the nominal exchange rate (local currency per US dollar) versus the PPP valuation of the exchange rate The regression was run for all countries in the world and the variable is normalized to be 1 for the world as a whole
26
[1] [2] [3] [4]Initial per capita GDP (log) -153 -186 -167 -216
(-311) (-403) (-362) (-415)Overvaluation -082 -153 -068 -125
(-045) (-084) (-038) (-068)Domestic savings 009 010 009 010
(339) (359) (361) (362)Investment 018 016 015 017
(333) (293) (258) (297)Contract enforcement 011 009 009 008
(164) (142) (153) (123)Net total flowsGDP 011
-194Net total flows per capita 0003
205Total inflowsGDP 018
(227)Total inflows per capita 0003
(147)Constant -106 412 054 629
(-013) (054) (007) (080)
Adjusted R2 051 052 053 057Number of observations 42 42 42 42Note and indicate significant at 1 5 and 10 percent respectivelly t-statistics in parenthesis
Table 7 Estimation Results Linear Growth Model with Capital Flows
The results indicate that capital flows are positively and significantly (in all but one instance) associated with growth Initial per capita GDP comes in with a negative and significant coefficient in all specifications indicating support for growth convergence Domestic savings and investment are the other significant right-hand side variables that also come in with the expected sign Contract enforcement the proxy for institutional development is not significant in any of the specifications Overvaluation has the expected sign but is never significant Estimating the equation with measures of net FDI instead of total net private capital yields similar results with an even stronger association between the FDI variable and growth Aside from the positive correlations and partial evidence of a possible through the savings-investment channel our analysis is rendered incomplete by the short time period since these inflows began While the limited number of observations in our sample required us to focus on average growth and inflows over the period 2000-2007 most of the inflows came late in this period This is an issue which requires further study as additional observations (years) become available As described in Section II the observed rise in private capital flows and growth during the sample period is an important necessary condition in particular because other studies even fail to uncover such an association for different country groups andor sample periods However it is also far from sufficient for making inferences about causality
27
V CONCLUSION
As a result of the global financial crisis and recession private capital flows to all regions of the world have declined Even when the international economy recovers and financial markets return to health it is likely that investors will remain for some time more risk-averse than they were previously At the same time donor flows to low-income countries including those in sub-Saharan Africa are likely to be adversely impacted by these global developments Our results were inconclusive regarding the impact of private capital flows on growth in SSA countries Additional research will be needed before a definitive statement can be made in this regard once additional observations are available However most SSA countries are likely to remain dependant on financial inflows in some form to help finance current account deficitsmdashdeficits that will be the counterpart of development-oriented investments in these economies As donor flows are likely to be restricted in the coming years due to the fiscal problems the traditional donor countries find themselves confronting SSA countries will need private capital flows to finance these current account deficits The alternative would require smaller or no current account deficits meaning reduced development-oriented investments in infrastructure and other key areas with adverse consequences for growth potential All this means that policy makers in SSA will need to pay increasing attention to efforts to attract private capital to their countries Our results indicate that one of the most important things policy makers can do to attract private capital is to strengthen domestic capital markets Deep and well-functioning money foreign exchange equity and (where relevant) derivative markets are key to attracting private capital Governments in SSA countries would be well-advised to redouble their efforts to develop and strengthen these markets to put their countries in a position to attract private capital in the future At the same time an important of the current financial crisis should also be to put in place strong monitoring regulatory and supervisory frameworks to avoid a buildup of balance-sheet vulnerabilities
28
Appendix I Capital Flows Data The information on private capital flows is based on detailed balance of payments data obtained from AFR country desk economists in late 2007 for 44 sub-Saharan African countries Data for 2000-2006 are actual and data for 2007 are preliminary estimates The data distinguishes between FDI portfolio (debt and equity) and private debt-creating flows and between inflows and outflows The definition of capital inflows adopted for this study differs from other papers using balance of payments data as a measure of capital flows (see Appendix Box I1 for precise definitions used in the paper) Appendix Box I1 Balance of payments recording of capital flows
From the perspective of the financial account one usually thinks of changes in liabilities as positive (inflows) and changes in assets as negative (outflows) In practice both changes in liabilities and assets are reported as net of any disinvestment and consequently both can have any sign In the BOP accounts an increase (decrease) in liabilities to nonresidents is entered as positive (negative) while an increase (decrease) in net foreign assets held by residents is entered as negative (positive) If a resident sells an asset held abroad the transaction is recorded as a reduction in net foreign assets held by residents bringing an inflow of capital For this study capital inflows (outflows) are taken to be the sum of increases (decreases) in liabilities to non-residents and of decreases (increases) in net foreign assets held by residents in a year This allows to capture all transactions that give rise to a inflow of capital into a country on the liability and asset side and avoids negative ldquoinflowsrdquo Net flows of capital are calculated as the sum of the inflows (positive sign) and outflows (negative sign)
This data differs from other published data sources with respect to its timeliness coverage and level of detail bull The 2000-2007 period covers the most recent episode of private capital inflows to
sub-Saharan Africa which took off around 2005-2006
bull It covers 43 sub-Saharan African countries
bull It allows to distinguish between different types of private capital flows (FDI portfolio flows and debt-creating flows) In contrast with other studies (eg Faria and Mauro 2004) that add together FDI and portfolio equity flows we keep them separate and group portfolio debt and equity (either category is too small to stand on its own) We are interested in the determinants of various types of flows particularly as regards the development of financial markets and straight FDI doesnrsquot require any particular type of financial market infrastructure However portfolio debt and equity investment require the existence of bond and equity markets
Other data sources that cover all sub-Saharan African countries include the IMFrsquos WEO IFS Balance of payments data and the World Bankrsquos global development finance data Another
29
widely used data base is the Lane-Milesi-Ferretti data but the most recent updated version goes until 2005 and covers only a sub-set SSA countries Another group of studies use current account data as a proxy for capital flows (Prasad et al 2007 Gourinchas and Jeanne 2007) ndash which have the advantage of providing wide coverage in terms of years and countries but make it impossible to disaggregate between official and private transfers and different types of capital flows The Fundrsquos World Economic Outlook (WEO) database and the World Bankrsquos Global Development Finance (GDF) database provide the most comprehensive coverage of capital flows to sub-Saharan countries These data sets have few missing countries and few missing observations for the countries that are in the data sets However the comprehensiveness of the WEO and the GDF databases is achieved at a price as each data set relies on Fund and Bank staff estimates to fill in the lacunae left from official statistics (Dorsey et al 2008) Other data sets such as the Fundrsquos International Financial Statistics and the Balance of Payments Statistics databases rely on official reporting without the use of staff estimates to fill in the gaps The more detailed and comprehensive coverage of the international transactions at the country level is available in the Balance of Payment Statistics published once a year by the IMF Although information for most of the sub-Saharan African countries is included in the publication the most recent database shows a complete set of annual data for just 18 out of 44 countries in the region mostly the middle-income countries two oil-exporters and the largest low-income economies among them The other countries have missing data either for the capital flows components or some years specially at the end of the period covered in the study which is crucial for the econometric analysis The work of the country desk economists was essentially to make sure that all series were available and the components were consistent with the main aggregates We checked also consistency across the different published databases finding discrepancies mostly in the last few years of the sample and few revisions to historical numbers in the early 2000rsquos for the countries with data in the various publications Looking into the World Economic Outlook database there is a full coverage of the countries in the region but it is difficult to separate actual figures from the forecasted ones or estimates (specially for countries with lags in reporting official data from the authorities) and programs with the Fund requiring accurate estimates on the missing BOP data embedded in the Program We used the WEO data which are also reported by country desk economist in the Fund as a starting point and asked the desk economists to look into the details and components that are normally not used in the aggregated analysis of the external accounts offered in the WEO studies and data In brief we have not created a separate database but rather taken the available information and refined it in a way that allows us to cover as many countries in the region as possible regardless of the size of the country and the level of development weighing properly in the model those countries with no capital flows (reporting zeros) and including those null figures as information in the dependent variable
30
Appendix II Variables Definitions and Sources
Variable Description Units Source
Net total flows FDI portfolio and debt net flows See below Billions of US$ IMF African Department database
Net FDI Net foreign direct investment flows (FDI in the reporting economy net of direct investment abroad)
Billions of US$ IMF African Department database
Net portfolio and debt flows Net private portfolio investment and other private flows Includes equity and debt securities as well as all other net private debt creating flows
Billions of US$ IMF African Department database
Total Inflows FDI portfolio and debt inflows See below Billions of US$ IMF African Department database
FDI Inflows Foreign direct investment in the reporting economy Billions of US$ IMF African Department database
Portfolio and debt inflows Portfolio investment liabilities including equity and debt securities liabilities plus other private capital inflows Includes all other private debt creating flows (Liabilities excludes monetary authorities and government)
Billions of US$ IMF African Department database
CPIA Country Policy and Institutional Assessment Composite index based on sixteen criteria grouped in four categories (i) economic management (ii) structural policies (iii) policies for social inclusion and equity and (iv) public sector management and institutions
1 to 7 World Bank
Financial Institutions Index of capital markets development defined as the sum of four dummy variables Treasury bills treasury bonds corporate bonds and equity markets exist
0 1 2 3 4 with 0 for countries without any market to 4 for countries with all four markets present
Lukonga (forthcoming) and authors calculations
Rule of law The extent to which agents have confidence in and abide by the rules of society and in particular the quality of contract enforcement the police and the courts as well as the likelihood of crime and violence One of the six components of the Governance Indicators
-25 (lower score) to 25 for the highest score
httpinfoworldbankorggovernancewgiindexasp
South Africa and Nigeria Dummy variable 1 for South Africa and Nigeria 0 otherwise 0 1 Authors calculations
Oil exporters Dummy variable 1 for Angola Cameroon Chad Congo Rep of Equatorial Guinea Gabon and Nigeria 0 otherwise
0 1 IMF African Department database
Real GDP growth Real GDP growth Calculated as the percent change of the constant Gross domestic product in 2000 local currency units Measure of quality of macroeconomic policies
Percent IMF World Economic Outlook
Secondary enrollment Total enrolment in secondary level of education regardless of age expressed as a percentage of the population in the official age group corresponding to this level of education
Percent World Bank World Development Indicators
2000 per capita GDP Per capita GDP in constant US dollar for the year 2000 Constant 2000 US dollars IMF World Economic Outlook
Capital account openness De jure capital account openness index as the simple average of four dummy variables representing exchange rate arrangements payments restrictions on current and capital transactions and
t i ti i t f t di A l f
Index Chinn-Ito forthcoming
Trade openness Sum of exports and imports of goods and non-factor services over GDP
Percent of GDP IMF World Economic Outlook
British legal origin Dummy variable that takes the value 1 for former British colonies and 0 otherwise
0 1 La Porta et al (1999)
Ethno linguistic fragmentation
Average value of five different indices of ethno linguistic fractionalization
Index La Porta et al (1999)
Latitude Measure of the closeness to the equator Miles La Porta et al (1999)
Appendix II Variables Definitions and Sources
31
Overvaluation Residual of a simple panel regression between the nominal exchange rate (local currency per US dollar) Vs the PPP valuation of the exchange rate The regression includes 182 countries The overvaluation measure in normalized to be 1 for the world
Deviation from equilibrium between PPP and market rate with 1 defined as the norm
IMF African Department database
GDP in dollars GDP in dollars (Converted at the nominal market exchange rate) Billions of US$ IMF World Economic Outlook
Per capita GDP in dollars Per capita GDP (constant 2000 US dollar) Constant 2000 US dollars IMF World Economic Outlook
Inflation Headline consumer price index (Average annual percent change) Percent IMF World Economic Outlook
Government balance General government balance excluding grants Percent of GDP IMF World Economic OutlookCredit Total credit to the private sector in percent of GDP Percent of GDP IMF International Financial StatisticsCurrent account Current account balance excluding grants Percent of GDP IMF African Department databaseREER Real effective exchange rate weighted index using total trade
(exports and imports composition for 1999 to 2001) and consumer price indices
Percent IMF Information Notice System
NEER Nominal effective exchange rate weighted index using total trade (exports and imports composition for 1999 to 2001)
IMF Information Notice System
US Tbill rate United States Treasury bill rate Percent IMF International Financial StatisticsTerms of trade Terms of trade (Exports prices to import prices goods and services) Percent IMF World Economic Outlook
Rest of the world real GDP Rest of the world real GDP growth (Weighted by country exports) Percent IMF World Economic Outlook
Oil prices Price of oil Simple average of Texas Dubai and Brent prices deflated by the manufacturing unit cost index
Percent IMF World Economic Outlook
Domestic savings Total domestic savings Percent of GDP IMF World Economic OutlookInvestment Total private investment Percent of GDP IMF World Economic Outlook
Reserves Stock of international reserves (US dollar billions) Billions of US$ IMF World Economic Outlook
Non-fuel commodity prices Real non-fuel commodity price (Weighted by country specific exports deflated by the manufacturing unit price)
Percent IMF World Economic Outlook
Population Population Millions IMF World Economic OutlookContract enforcement Efficiency of contract enforcement by following the evolution of a
sale of goods dispute and tracking the time cost and number of procedures involved from the moment the plaintiff files the lawsuit until actual payment
Number of procedures httpwwwdoingbusinessorg
Constraint on the executive Index that ranks from 1 (unlimited authority to the executive) to 7 (Executive parity or subordination) as decribed in the Freedom House Index
1 to 7 httpwwwfreedomhoseorg and Polity IV Databse at wwwsystemicpeaceorg politypolity4htm
ICRG ranking International Country Risk Guide rank for each country is based on three components of risk analysis Political financial and economic components The higher the rating the lower the risk for that particular country The index covers 140 countries
0 to 100 wwwprsgroupcom
Appendix II Variables Definitions and Sources (Contd)
32
Appendix III Determinants of Capital Flows Descriptive Statistics and Correlations
Total inflows FDI inflows Portf amp debt Share of FDI Total inflows FDI inflows Portf amp debt Total inflows FDI inflows Portf amp debt
Financial Institutions 031 033 026 008 002 -005 019 -012 -011 -006004 003 009 062 088 074 022 044 050 070
Rule of Law -021 -029 -015 003 013 005 027 -007 -009 000018 006 034 083 042 077 007 065 058 099
Market size 087 093 074 000 005 -003 021 -006 -004 -005000 000 000 099 077 084 019 069 079 074
Oil exporter 010 043 -004 045 019 027 -005 034 054 -019052 000 078 000 023 008 075 003 000 022
Real GDP growth 012 039 000 034 028 041 -010 055 070 -005043 001 099 003 007 001 052 000 000 077
Secondary enrollment 036 019 039 003 060 044 081 009 011 000002 023 001 083 000 000 000 057 050 099
Log 2000 GDP per capita 027 020 026 027 063 052 070 011 026 -020008 019 009 008 000 000 000 049 009 020
Capital account openness -007 -005 -007 -004 012 006 022 007 001 011066 073 068 079 046 072 016 066 094 049
Trade openness -017 -017 -015 011 014 015 008 013 017 -003027 027 034 050 036 033 059 042 027 086
UKleg 027 028 023 016 -010 -011 -005 -010 -004 -011008 007 014 031 052 048 076 053 078 047
Ethling 015 021 011 012 006 004 009 -005 001 -010033 018 048 044 069 080 055 077 094 053
LAT -011 -012 -009 039 -004 -006 002 -015 -005 -020050 046 057 001 080 068 088 032 073 020
Pop_dens 000 -003 002 -047 -004 -005 -002 004 -023 037099 085 093 000 080 075 089 081 018 003
Note pairwise correlation coefficient reported in first row significance level reported in second row Source Authors calculations
Appendix Table III2 Bivariate Correlations of Capital Flows with Independent Variables
(US$ mn) (per capita) (in percent of GDP)
1 Dependent variables Observations Minimum Maximum Mean MedianStandard Deviation
Total inflows 43 63 162106 8265 2339 25410FDI inflows 43 00 42371 3598 909 8027Portfolio and debt inflows 43 00 130724 4666 1021 19786Total inflows per capita 43 35 16250 1291 255 3078FDI inflows per capita 43 00 11653 826 105 2325Portfolio and debt inflows pc 43 00 5906 465 147 1038Total inflows to GDP 43 11 307 81 62 65FDI inflows to GDP 43 00 290 42 24 53Portfolio and debt inflows to GDP 43 00 187 39 32 36
2 Explanatory variablesFinancial institutions 43 00 40 18 10 16Rule of law 43 -18 08 -07 -07 06Market size 43 00 10 00 00 02Oil exporter 43 00 10 02 00 04Real GDP growth 43 -04 201 48 42 36Secondary enrollment 42 82 1079 342 283 226Log of 2000 GDP per capita 43 45 90 61 58 11Capital account openness 43 -16 25 -05 -11 13Trade openness 43 369 1559 818 789 3043 Alternative measures of institutions and instrumentsCPIA 42 18 43 32 32 06Doing Business Index 43 303 1760 1321 1487 410ICRG ranking 28 483 808 614 605 73Legal rights 43 10 80 40 35 16Property rights 41 14 45 30 30 06Constraint on the executive 40 17 70 41 43 16British legal origin 43 00 10 03 00 05Ethnolinguistic fragmentation 42 00 10 06 07 03Population density in 1500 36 01 250 38 20 55Latitude 43 00 07 01 01 01Source Authors calculations
Appendix Table III1 Descriptive Statistics for Regression Variables
33
Fin Instit Rule of Law Market size Oil exporter Real GDP growth Second Enr Log 2000 GDP pc Capital open Trade openTotal inflows
Financial Institutions 100
Rule of Law 042 100000
Market size 032 -023 100004 015
Oil exporter -022 -034 020 100016 002 019
Real GDP growth 008 001 012 047 100060 095 044 000
Secondary enrollment 040 049 027 -008 -012 100001 000 008 063 044
Log 2000 GDP per capita 034 039 018 024 000 083 100002 001 025 012 098 000
Capital account openness 034 019 -006 -020 -005 031 020 100003 021 071 021 074 005 030
Trade openness -015 -008 -022 003 -010 008 010 -001 100035 061 017 085 054 061 060 096
Note Pairwise correlation coefficients reported in first row significance level reported below Source Authors calculations
Appendix Table III3 Bivariate Correlations of Baseline Regression Variables
Financial inst CPIA indexDoing
Business ICRG ranking Legal rightsRule of
law Property rightsConstraint on the executive
British legal origen
Ethnoling fragmentation Latitude
Population density
Financial institutions 100
4300
CPIA index 063 100000
4200 4200
Doing Business index -060 -044 100000 000
4300 4200 4300
ICRG ranking 029 040 -069 100013 003 000
2800 2800 2800 2800
Legal rights 061 046 -061 020 100000 000 000 030
4300 4200 4300 2800 4300
Rule of Law 042 063 -069 082 034 100000 000 000 000 003
4300 4200 4300 2800 4300 4300
Property rights 057 081 -064 070 046 081 100000 000 000 000 000 000
4100 4100 4100 2700 4100 4100 4100
Constraint on the executive 044 041 -051 016 042 049 055 100000 001 000 043 001 000 000
4000 3900 4000 2800 4000 4000 3800 4000
British legal origin 059 040 -055 031 069 021 036 028 100000 001 000 011 000 018 002 008
4300 4200 4300 2800 4300 4300 4100 4000 4300
Ethnolinguistic fragmentation 017 -015 005 -032 014 -029 -018 002 011 100027 036 074 010 038 006 028 093 050
4200 4100 4200 2800 4200 4200 4000 3900 4200 4200
Latitude 009 016 -028 037 013 030 029 019 011 001 100058 032 007 006 041 005 007 025 049 094
4300 4200 4300 2800 4300 4300 4100 4000 4300 4200 4300
Population density -014 -002 021 -025 -045 -023 -011 -018 -018 -043 -037 100042 090 022 022 001 017 052 031 028 001 003
3600 3600 3600 2500 3600 3600 3600 3500 3600 3500 3600 3600Note Pairwise correlation coefficients reported in first row significance level reported in the second row and number of observation in the third row Source Authors calculations
Appendix Table III4 Bivariate Correlations of Measures of Institutions and Instruments
34
Appendix IV Private Capital Flows and Growth
Variable Number of
observations MeanStandard deviation Min Max
Real GDP growth 43 48 36 -04 201Initial per capita GDP 43 61 11 45 90Net total flowsGDP 43 37 74 -109 271Net total flows per capita 43 547 2782 -5006 12323Total inflowsGDP 43 77 57 10 282Total inflows per capita 43 1311 3139 35 16450Overvaluation 43 11 03 07 17Domestic savings 42 122 200 -247 813Investment 42 216 87 87 469Contract enforcement 43 1014 66 826 1133Source Authors calculations
Appendix Table IV1 Private Capital Flows and Growth Summary Statistics for Multivariate Regression
Rea
l GD
P gr
owth
Initi
al p
er
capi
ta G
DP
Net
flow
sG
DP
Net
flow
s pe
r ca
pita
Inflo
ws
GD
P
Inflo
ws
per
capi
ta
Ove
rval
uatio
n
Dom
estic
sa
ving
s
Inve
stm
ent
Con
tract
en
forc
emen
t
Real GDP growth 100
Initial per capita GDP 000 100
NetflowsGDP 038 -013 100
Netflows per capita 037 028 067 100
InflowsGDP 049 016 076 066 100
Inflows per capita 028 063 042 087 061 100
Overvaluation -032 -021 -011 -003 -024 -016 100
Domestic savings 048 058 013 029 028 048 -036 100
Investment 045 045 014 039 045 051 -026 042 100
Contract enforcement 018 -007 -024 -018 -017 -013 -015 010 -012 100Note indicates significant at 10 percentSource Authors calculations
Appendix Table IV2 Private Capital Flows and Growth Pairwise Correlations for Multivariate Regression
35
References
Acemoglu D and S Johnson 2005 ldquoUnbundling Institutionsrdquo Journal of Political
Economy Vol 113 No 5 pp 949995 Acemoglu D Johnson S and D Robinson 2002 ldquoReversal of Fortune Geography and
Institutions in the Making of the Making of the Modern World Income Distributionrdquo Quarterly Journal of Economics pp 12311294
Albuquerque R 2003 ldquoThe Composition of International Capital Flows Risk Sharing
Through Foreign Direct Investmentrdquo Journal of International Economics Vol 61 pp 353ndash383
Alfaro L and A Charlton 2007 ldquoInternational Financial Integration and Entrepreneurial
Firm Activityrdquo NBER Working Paper No 13118 (Cambridge Massachusetts National Bureau of Economic Research)
mdashmdashmdash S Kalemli-Ozcan and V Volosovych 2005a ldquoCapital Flows in a Globalized
World The Role of Policies and InstitutionsrdquoNBER Working Paper No 11696 (Cambridge Massachusetts National Bureau of Economic Research)
mdashmdashmdash 2005b ldquoWhy Doesnrsquot Capital Flow from Rich to Poor Countries An Empirical
Investigationrdquo NBER Working Paper Series No 11901 (Cambridge Massachusetts National Bureau of Economic Research)
Auty R M ed 2001 Resource abundance and Economic Development Improving the
Performance of Resource-Rich Countries (Oxford Oxford University Press) mdashmdashmdash and A Gelb 2001 ldquoPolitical Economy of Resource-Abundant Statesrdquo in Resource
abundance and Economic Development Improving the Performance of Resource-Rich Countries ed by R M Auty (Oxford Oxford University Press)
Becker T O Jeanne P Mauro J D Ostry and R Ranciegravere 2007 Country InsurancemdashThe Role of Domestic Policies IMF Occasional Paper No
254 (Washington International Monetary Fund) Bekaert G Campbell R H and C Lundblad 2005 ldquoDoes Financial Liberalization Spur
Growthrdquo Journal of Financial Economics Vol 77 (July) Chinn MD and H Ito 2007 ldquoA New Measure of Financial Opennessrdquo Available via the
Internet at wwwsscwiscedu7Emchinnresearchhtml
36
Chinn MD and H Ito 2006 ldquoWhat Matters for Financial Development Capital Controls Institutions and Interactionsrdquo Journal of Development Economics Vol 81 (October) pp 163ndash92
Chinn MD Ito H 2002 ldquoCapital Account Liberalization Institutions and Financial
Development Cross-Country Evidencerdquo NBER Working Paper Series No 8967 (Cambridge Massachusetts National Bureau of Economic Research)
DellAriccia G Di Giovanni J Faria A Kose M A Mauro P Schindler M Terrones M and J D Ostry 2008 ldquoReaping the Benefits of Financial Globalizationrdquo IMF Occasional Paper No 264 (Washington International Monetary Fund)
Dorsey T E Tadesse H Singh S and Z Brixiova 2008 ldquoThe Landscape of Capital
Flows to Low-Income Countriesrdquo IMF Working Paper 0851 (Washington International Monetary Fund)
Edison H Klein M W Ricci L A and T Slok 2004 ldquoCapital Account Liberalization
and Economic Performance Survey and Synthesisrdquo IMF Staff Papers Vol 51 No 2 pp 220256
Faria A and P Mauro 2004 ldquoInstitutions and the External Capital Structure of Countriesrdquo
IMF Working Paper 04236 (Washington International Monetary Fund) mdashmdashmdash Minnoni M and AZaklan 2006 ldquoThe External Financing of Emerging Market
Countries Evidence from Two Waves of Financial Globalizationrdquo IMF Working Paper 06205 (Washington International Monetary Fund)
Glaeser E L and A Shleifer 2002 ldquoLegal Originsrdquo Quarterly Journal of Economics
Vol117 pp 1193ndash1229 Gourinchas P-O and O Jeanne 2007 ldquoCapital Flows to Developing Countries The
Allocation Puzzlerdquo NBER Working Paper No 13602 (Cambridge Massachusetts National Bureau of Economic Research)
International Monetary Fund 2007 Global Financial Stability Report (Washington
October) mdashmdashmdash 2008 Regional Economic Outlook Sub-Saharan Africa (Washington September) Ju J and S-J Wei 2007 ldquoDomestic Institutions and the Bypass Effect of Financial
Globalizationrdquo NBER Working Paper No 13148 (Cambridge Massachusetts National Bureau of Economic Research)
37
mdashmdashmdash 2006 ldquoA Solution to Two Paradoxes of International Capital Flowsrdquo NBER Working Paper No 12668 (Cambridge Massachusetts National Bureau of
Economic Research) Karl T L 1997 The Paradox of Plenty Oil Booms and Petro-States (Berkeley University
of California Press) Kaufmann D Kray A and M Mastruzzi 2008 ldquoGovernance Matters VII Aggregate and
Individual Governance Indicators 1996-2007rdquo Policy Research Working Paper No 4654 (Washington DC World Bank Group)
Klein MW 2005 ldquoCapital Account Liberalization Institutional Quality and Economic
Growth Theory and Evidencerdquo NBER Working Paper No 11112 (Cambridge Massachusetts National Bureau of Economic Research)
Kose M A Prasad E Wei S-J and K Rogoff 2006 ldquoFinancial Globalization A
Reappraisalrdquo IMF Working Paper 06189 (Washington DC International Monetary Fund)
Lane P R 2004 ldquoEmpirical Perspectives on Long-Term External Debtrdquo Topics in Macroeconomics Vol 4 No 1 httpwwwbepresscombejmtopicsvol4iss1art1 La Porta R F Lopez-de-Silanes A Shleifer and R W Vishny 1999 ldquoThe Quality of
Governmentrdquo Journal of Law Economics and Organization Vol 15 pp 222ndash79 Lukonga forthcoming ldquoFinancial Market Development Survey of Sub-Saharan African
Countriesrdquo mimeo Mauro P Minnoni M and AZaklan 2006 ldquoThe External Financing of Emerging Market
Countries Evidence from Two Waves of Financial Globalizationrdquo IMF Working Paper 06205 (Washington International Monetary Fund)
Miniane J 2004 ldquoA New Set of Measures on Capital Account Restrictionsrdquo IMF Staff Papers Vol 51 No 2 pp 276ndash308 Mishkin F S 2006 The Next Great Globalization How Disadvantaged Nations can
Harness their Financial Systems to Get Rich (Princeton NJ Princeton University Press)
Obstfeld M and A M Taylor 2004 Global Capital Markets Integration Crisis and Growth Cambridge University Press (2004) Portes R and H Rey 2005 ldquoThe Determinants of Cross-Border Equity Flowsrdquo Journal of
International Economics Vol 64 pp269-296 Prasad Eswar S Raghuram G Rajan and Arvind Subramanian 2007 ldquoForeign Capital and Economic Growthrdquo Brookings Papers on Economic Activity 1 Brookings
38
Quinn D P 1997 ldquoThe Correlates of Change in International Financial Regulationrdquo
American Political Science Review Vol 91 (September) pp 531ndash51 mdashmdashmdash and A Maria Toyoda forthcoming ldquoDoes Capital Account Liberalization Lead to
Economic Growthrdquo Review of Financial Studies Rodrick D 2007 ldquoThe Real Exchange Rate and Economic Growth Theory and Evidencerdquo
Harvard University Working Paper httpksghomeharvardedu~drodrikRER20and20growthpdf
mdashmdashmdash and A Subramanian 2008 ldquoWhy did Financial Globalization Disappointrdquo IMF
Staff Papers Vol 56 No 1 (Washington International Monetary Fund) Schindler M 2009 ldquoMeasuring Financial Integration A New Datasetrdquo IMF Staff Papers
Vol 56 No 1 (Washington International Monetary Fund) Schularick M 2006 ldquoA Tale of Two Globalizations Capital Flows from Rich to Poor in
Two Eras of Global Financerdquo International Journal of Finance and Economics Vol11 pp339-354
Schularick M Steger T 2008 ldquoThe Lucas Paradox and the Quality of Institutions Then
and Nowrdquo Berlin University Working Paper N20083 Stone M R Shimizu S Nordstrom A and H J Ferhani 2008 ldquoDeveloping Essential
Financial Markets in Smaller Economies Stylized Facts and Policy Optionsrdquo IMF Occasional Paper No 265 (Washington International Monetary Fund)
World Bank 2007 Global Development Finance The Globalization of Corporate Finance in Developing Countries (Washington World Bank Group)

10
We use a new indicator of capital market development in sub-Saharan Africa that captures the structure of capital markets Capital markets along with money foreign exchange and derivatives markets form part of a countryrsquos ldquoessential financial marketsrdquo (Stone et al 2008 Lukonga forthcoming) In particular we consider government securities markets both for treasury bills and treasury bonds as well as corporate bond markets and equities markets (see Lukonga forthcoming) We construct a simple index which is the sum of four dummy variables taking the value of 1 if the market in question exists and is well-developed The index covers all sub-Saharan African countries except Somalia Using this index simple tabulations show that the average level of financial market development is fairly low in sub-Saharan Africa with only 10 countries or 21 percent of the sample countries having complete capital markets (Table 2)4 However as discussed earlier these countries are also among the largest recipients of private capital inflows in sub-Saharan Africa along with a few oil exporters (Angola Congo Chad and Equatorial Guinea) While the role of institutional development in attracting international capital flows has been emphasized in recent studies very few have attempted to isolate the role of financial versus basic property rights institutions The measures of financial market development used in the literature and that would be available for low-income countries such as ratios of money and credit to GDP have their limitations They measure outcomes such as the ability of the financial (mostly banking) sector to provide transaction services (in the case of the ratios of money or broad money to GDP) or the capacity of the banking system to channel savings rather than the extent of financial market development as measured by the availability of investment instruments Our empirical results detailed below indicate that along with other factors such as market size (particularly for portfolio inflows) and oil exporting status (particularly for FDI flows) the index of capital market development is a significant and robust determinant of international capital flows to sub-Saharan African countries
4 The countries are Botswana Ghana Kenya Namibia Nigeria South Africa Swaziland Tanzania Uganda and Zambia
11
Capital Markets
T-Bills T-BondsCorporate
Bonds Equities
Botswana X X X XGhana X X X XKenya X X X XNamibia X X X XNigeria X X X XSouth Africa X X X XSwaziland X X X XTanzania X X X XUganda X X X XZambia X X X XBenin X X X Burkina Faso X X X NCape Verde X X N XMauritius X X XMozambique X X X Zimbabwe X X XAngola X X N NCocircte dIvoire N X N XGambia The X X N NSenegal X X N Seychelles X X N NCameroon N N XCongo Dem Rep of X N N NEthiopia X N N NGuinea X N N NGuinea-Bissau X N N NLesotho X N N NMadagascar X N N NMalawi X N N Rwanda X N N NSierra Leone X N NTogo X N Burundi N N NCentral African Republic NChad N N N NComoros N N N NCongo Republic of N N N NEquatorial Guinea N N N NEritrea N N NGabon N N N NLiberia N N N NMali N N NNiger N Satildeo Tomeacute and Priacutencipe N N N N
Sources Lukonga (forthcoming) and authors calculationsNotes X denotes that the market is fairly or very well developed denotes that the market nominally exists or is partially developedN denotes that the market does not exist
Table 2 Capital Market Development in Sub-Saharan Africa
12
A Recent Literature
The starting point of much of the recent literature on determinants of capital flows has been an attempt to explain the Lucas Paradox or why private capital doesnrsquot seem to flow from rich to poor countries Standard neoclassical theory predicts that capital should flow from capital-rich countries (with low marginal productivity of capital) to capital-scarce countries (with a high marginal product of capital) In practice however the bulk of observed flows particularly in the modern period consists of flows among developed economies Compared to the early 20th century era of financial globalization the current wave of capital flows is characterized by massive diversification of flows between high-income economies and a relative marginalization of less-developed economies (Obstfeld and Taylor 2004 Schularick 2006 and Schularick and Steger 2008) Some authors posit that the paradox is due to country-specific fundamentals that tend to lower the marginal product of capital in developing countries such as missing factors of production including human capital poor economic policies and poor institutions (Alfaro Kalemli-Ozcan and Volosovych 2005a and 2005b Faria et al 2006 Faria and Mauro 2004 Schularick and Steger 2008) In this vein a recent study shows that the extent of domestic financial market development and the quality of domestic financial institutions has played a significant role in attracting capital flows to emerging markets (IMF 2007) The second set of explanations centers around international capital market imperfections such as asymmetric information sovereign risk and capital controls For example Portes and Rey (2005) find that informational frictions proxied by geographic distance affect the amount and direction of capital flows and Lane (2004) also finds that credit market frictions are a determinant of debt flows in 1970-1995 The studies that focus on the role of institutions in attracting foreign private capital highlight the importance of basic institutions particularly property rights protection Weak property rights owing to poor quality institutions affect entrepreneursrsquo investment decisions Risks of expropriation armed conflict and malfunctioning legal systems all have a potentially negative impact on the returns from those investments Empirically property rights institutions have been proxied by an index derived from the Kaufman Kray and Mastruzzi World Governance IndicatorsWGIs or by an index derived from the ICRG indicators 5 Using those proxies better quality institutions are found to be positively and significantly correlated with foreign equity flows (Alfaro et al 2005a 2005b) and with a higher share of equity in a countryrsquos total stock of external liabilities (Faria and Mauro 2004 and Faria et al 2006) 5 The ICRG composite index aggregates over several dimensions such as government stability investment profile internal and external conflict non-corruption law and order protection from religious and ethnic tensions non-militarized politics democratic accountability and quality of bureaucracy (wwwprsgroupcom) Similarly the WGIs measure countriesrsquo score according to 6 governance dimensions namely voice and accountability political instability government effectiveness regulatory burden rule of law and control of corruption (wwwworldbankorgwbigovernancegovdata)
13
As mentioned earlier few studies focus on the role played by the extent of domestic financial market development in attracting international capital flows While the literature tends to link capital flows (financial globalization) to improvements in domestic financial systems (eg Chinn and Ito 2005 2002 Mishkin 2006) in principle the direction of causality is not clear Chinn and Ito (2005) and Klein (2005) find empirical evidence supporting the notion of a threshold effect financial openness contributes to equity market development only when a threshold level of general development of legal systems and financial development is attained However although property rights and financial institutions could potentially affect capital flows differently no study of the determinants of capital flows has empirically attempted to properly disentangle the effects of both Ju and Wei (2007 2006) develop theoretical models showing that financial institutions and property rights institutions can have different effects on capital flows Whereas an inefficient financial system can be bypassed by international capital flows as they could come in the form of FDI instead of portfolio and debt flows high expropriation risk cannot be bypassed Conversely the stronger domestic property rights the more the country will benefit from international capital flows
B Estimation strategy and Model
Cross-country regressions have been found appropriate to investigate the fundamental (and thus slow-moving) determinants of why some countries attract more inflows or more of a certain type of inflows than other countries In particular we are interested in testing whether financial institutions have a separate and different effect on capital inflows than property rights institutions That effect may also differ depending on the type of capital flows Empirically Acemoglu and Johnson (2005) show that property rights and contractingfinancial market development institutions do affect economic outcomes differently While property rights institutions have a first order effect on economic outcomes such as long-run GDP growth investment rates and financial depth contracting institutions seem to mostly affect the degree of financial market development As others we use instrumental variables to tackle the issue of reverse causality and endogeneity associated with the measures of institutions (Acemoglu and Johnson 2005 Alfaro Kalemli-Ozcan and Volosovych 2005a and 2005b DellrsquoAriccia et al 2008 Faria et al 2006 Faria and Mauro 2004) Building on the recent literature the reduced-form linear equation to be estimated is
iiiii uCPFK +sdot+sdot+sdot+= χβαμ (1) Where iK is log of average inflows to country i iF is a measure of financial institutions and iP a measure of property rights iC is a set of exogenous control variables and iu is an independent error term α β and γ are coefficients capturing the impact of financial development property rights institutions and other controls on capital flows where α and β are of particular interest and μ is a constant
14
Given that the measures of financial and property rights institutions are endogenous simple OLS estimates of equation (1) will be biased As indicated in Acemoglu and Johnson (2005) the α and β coefficients may capture reverse causality or the effect of some other omitted characteristic Second as financial market development and property rights are measured with error there may be a downward attenuation bias and finally if contracting and property rights institutions are correlated the effect of the type of institution that is measured with greater error will load onto the other variable Following Acemoglu and Johnson (2005) the estimation strategy therefore relies on estimating equation (1) with two-stage least squares (2SLS) using valid and separate instruments for financial and property rights institutions The two first stage equations will thus be of the form
iiiii CELF 11111 εχηδν +sdot+sdot+sdot+=
iiiii CELP 22222 εχηδν +sdot+sdot+sdot+= (2) Where iL and iE are instruments for financial institutions and property rights institutions respectively The key exclusion restriction is that Cov( iu iL ) = Cov ( iu iE ) =0 iu being the error term in the second-stage equation (1)
C Empirical Analysis This study utilizes a unique data set on capital inflows to SSA prepared by the staff of the International Monetary Fund described in Appendix I Choice of variables The following set of variables was chosen to estimate equations (1) and (2) (see Appendix II for definitions and sources Descriptive statistics are presented in Appendix III Table 1 bull Financial institutions are proxied by the simple index of capital market development
described earlier (Lukonga forthcoming) The more developed capital markets the higher capital flows
bull Property rights institutions are proxied by the rule of law score from the World Governance Indicators (Kaufmann Kray and Mastruzzi 2008) Among the six governance dimensions used by Kaufmann et al 2008 this is the closest proxy for property rights protection6 Better property rights protection should lead to higher capital flows
6 Various other proxies for property rights institutions exist and have been used in empirical studies Faria et al (2006) and Faria and Mauro (2004) use the simple average of KKMrsquos governance indicators for a single year Alfaro et al use the ICRG score (2005a 2005b) Acemoglu and Johnson (2005) and Acemoglu Johnson and
(continuedhellip)
15
bull Following Acemoglu and Johnson (2005) we use British legal origin as the instrument for financial market development taken from La Porta et al (1999) Acemoglu Johnson and Robinson 2002 Glaeser and Schleifer 2002 and La Porta et al1999 show that in the case of former European colonies legal origin is a valid instrument for contracting institutionsfinancial market development and property rights respectively Legal origin is shown to be positively and significantly associated with financial institutions with civil law countries exhibiting lower financial development than common law countries (Glaeser and Schleifer 2002 La Porta et al 1999)
bull The instruments for property rights institutions are the degree of ethno linguistic fragmentation and the countryrsquos latitude taken from La Porta et al (1999) which have been found to be associated with worse property rights and regulations7 Acemoglu and Johnson 2005 Acemoglu Johnson and Richardson (2002) Faria et al 2006 and Faria and Mauro 2004 use settler mortality in 1500 or population density in 1500 and show that they are valid instruments for property rights institutions For sub-Saharan African countries however settler mortality and population density in 1500 are available only for a subset of countries (Acemoglu and Johnson 2002)8 Given the better country coverage we have chosen to proceed with ethno linguistic fragmentation and latitude
bull A dummy variable to control for oil-exporting countries (the dummy variable takes the value of 1 if the country is an oil exporter) Oil-exporting countries attract more FDI other things equal
bull A dummy variable to control for market size (the dummy variable takes the value of 1 if the country is South Africa or Nigeria) Larger and more sophisticated economies attract more capital flows
Similar studies also include a number of additional explanatory variables though it is more difficult both to argue that they are exogenous and to find valid instruments for them We use these variables in our baseline regression
bull Human capital proxied by the share of secondary school enrollment in the population from the WDI This variable features in explanations of the Lucas Paradox that focus on missing factors of production (Alfaro et al 2005a 2005b) The expected impact of higher human capital on capital flows is expected to be positive
Robinson (2002) use average protection against expropriation risk and constraint on the executive as measures of property rights but these measures are not available for a sufficiently large number of our sample countries 7 La Porta et al (1999) however note that the adverse effects of ethno linguistic fractionalization on government performance tend to disappear when controlling for per capita income and latitude except for public good provision and state-owned enterprises This can be interpreted as countries with a large public enterprises sector tend to have less regard for private enterprises and private property rights 8 Robustness checks using population density in 1500 as an instrument yield results that are consistent with those obtained with ethno linguistic fragmentation (results not shown)
16
bull A measures of de jure capital account openness proxied by the Chinn-Ito measure of capital account openness based on the IMFrsquos AREAER (Chinn and Ito 2007) We use the average value of the Chinn-Ito variable for sub-Saharan African countries over 1999-20059 The effect of capital account openness on capital flows is expected to be positive
bull A measure of trade openness proxied by the sum of exports and imports over GDP Particularly at an initial stage capital mobility develops around greater openness to trade flows Arguably countries that are more open to trade may also be politically more open to greater integration with the rest of the world
bull Macroeconomic performance proxied here by the real GDP growth rate In a panel study of 47 industrial and emerging countries IMF (2007) find that expected macroeconomic performance proxied by lagged real GDP growth is a significant determinant of private capital inflows IMF (2008) similarly finds that real GDP growth and lower fiscal deficits are significantly correlated with higher private capital inflows Alfaro (2005b) uses inflation volatility as a proxy for macroeconomic performance However it is difficult to establish causality as inflows directly affect macroeconomic outcomes (also see below) Further macroeconomic outcomes have been shown to be shaped by institutions making it difficult to study the independent effect of institutional development on capital flows
Correlations Appendix Table III2 shows pairwise correlations between different measures of capital flows while Appendix Table III3 shows the pairwise correlations corresponding to the baseline regressions and Appendix Table III4 focuses on the pairwise correlations of the institutional variables and the instruments
Appendix Table III2 indicates that for our sample the choice of scaling variable affects the pairwise correlations of the inflows with the independent variables This confirms the impression from Figure 5 above that the picture of the allocation of private capital inflows across sub-Saharan countries is very different whether one looks at overall volume of inflows or at the size of the inflows relative to a countryrsquos population or GDP Whereas total inflows as a share of population or GDP will be the variable of interest when studying the economic impact of the inflows on individual countries (see Section IV below) the investigation of the factors determining the allocation of private capital flows to sub-Saharan Africa across the
9 Unlike many other studies that use the simple average of the four dummy variables or the dummy on capital account restrictions (Alfaro et al 2005a 2005b IMF 2007b) the Chinn-Ito measure attempts to capture the intensity of the capital controls by incorporating all the restrictions in the index using a principal components approach Whereas the other restrictions are not directly related to capital account restrictions they are taken as indicative of the overall restrictiveness of the regime The advantage of this measure over other more detailed indices that capture the intensity of capital controls (Quinn 1997 2003 Miniane 2004 Schindler 2009) is its near universal country and extended time coverage 181 countries between 1970 and 2005
17
continent should focus on the total volume of inflows A simple explanation is that private investors are more likely to decide on allocating specific amounts of money to various markets or projects than to fix investment limits relative to a countryrsquos population or GDP Therefore for the remainder of this section the variable of interest will be the log of private capital inflows and their components FDI on the one hand and portfolio and debt flows on the other averaged over 2000-2007 for each sub-Saharan African country excluding Somalia and Zimbabwe Looking at the potential determinants of private capital flows to SSA and their composition in Appendix Table III2 (columns 1-4) overall inflows as well as portfolio and debt inflows are correlated with the index of financial sector development secondary school enrollment the market size dummy variable and the log of initial GDP per capita There are however interesting variations for the determinants of FDI flows to which GDP per capita and secondary school enrollment are not significantly correlated but the proxy for property rights and the dummy for oil producers are The measure of trade openness and the Chinn-Ito capital openness variable are never significantly correlated with private inflows or their components However capital account openness is correlated with the degree of financial sector development as in Chinn and Ito (2005) and with secondary school enrollment
Appendix Table III3 illustrates the challenges associated with finding truly exogenous determinants of private capital flows and their composition as a number of potential explanatory variables are correlated with each other In particular the measure of financial market development is highly correlated with the proxies for property rights institutions as discussed above Further educational achievement is significantly correlated with the institutional quality variables and economic development This is not surprising as it can be understood as an outcome of good institutions and higher degree of economic development This strong degree of endogeneity and the fact that we are interested in disentangling the impact of institutions on capital inflows argues that like the variables capturing macroeconomic performance it is probably not a useful explanatory variable given our focus on the impact of institutions per se on capital inflows The same holds true for the proxy for economic development log of GDP per capita in 2000 (Alfaro et al 2005b show that log real GDP per capita has no additional explanatory power once a measure of institutional quality is introduced)
The pairwise correlations of the potential instrumentsmdashBritish legal origin population density in 1500 and ethno linguistic fragmentationmdashwith the institutional variables and with the capital flows variables are encouraging for the instrumental variables approach (Appendix Table III4) The potential instruments for property rights institutions are uncorrelated with the inflows variables but are significantly correlated with the property rights proxies Although British legal origin is significantly correlated with total inflows in addition to financial institutions it is not correlated with property rights nor its potential instruments
18
Regression results
Table 3 presents the results of simple OLS estimations of various specifications of equation (1) as a benchmark The coefficient on the financial market development index is positive and significant and robust across all specifications For portfolio and debt flows it is even the only variable that is significant maybe highlighting the particular importance of capital market development for non-FDI flows The coefficient on property rights institutions (rule of law score) is never significant and has the wrong sign The coefficients on the controls for country size and oil exporters are large and generally significant but while oil exporters do receive more FDI than other countries they do not have any particular advantage with portfolio and debt inflows Real GDP growth is the only other variable that is significant for total inflows and FDI However as discussed earlier real GDP growth is not exogenous and to study the impact of institutions further we use the specification in column (3) as our baseline The log of real GDP per capita in 2000 secondary enrollment and capital account and trade openness are never significant10 The results obtained are similar when breaking the sample into two sub-periods capturing the period before and after the acceleration of private capital inflows This is not surprising considering that the determinants of inflows are fairly slowly-moving country characteristics They are also robust to excluding South Africa and Nigeria indicating that the results are not driven by the two largest recipients and to excluding all oil exporters (Results available upon request) Indeed the impact of financial market development on inflows is even larger in both cases
(1) (2) (3) (4) (5) (6) (7) (8) (1) (2) (3) (4) (1) (2) (3) (4)Financial Institutions 050 056 052 055 056 058 056 057 067 063 055 057 055
(-346) (586) (548) (544) (565) (527) (603) (536) (499) (343) (348) (322)Rule of Law -021 -033 -041 -027 -028 -033 -037 -003 -010 -020 -018 -052 -058
(-056) (-114) (-136) (-070) (-085) (-112) (-129) (-008) (-025) (052) (-046) (-124) (-131)South Africa and Nigeria 185 187 198 189 179 158 135 137 211 212
(168) (170) (121) (160) (161) (137) (134) (137) (160 (160)Oil Exporters 161 101 162 168 160 164 267 194 051 012
(314) (190) (304) (276) (308) (306) (441) (367) (078) (014)Real GDP growth
011 014 007(326) (304) (127)
Secondary Enrollment -000
(-028)Log 2000 per capita GDP -05
(-032)Capital Account Openness -06
(-06)Trade Openness
-001(-202)
Constant 447 522 379 335 392 413 374 441 342 442 268 216 345 430 288 260(-125) (2317) (1146) (966) (836) (398) (1015) (867) (713) (1956) (635) (477) (900) (1361) (482) (410)
Observations 43 43 43 43 42 43 43 43 43 43 43 43 43 43 43 43R-squared 026 001 057 062 057 057 058 059 022 000 055 059 025 000 042 044F-Statistic 1196 031 1200 1581 878 946 941 1532 1197 001 1289 1406 1176 021 545 493
Source Authors calculations
Note and indicate significant at 1 5and 10 percent t-Statistics are reported in parentheses Robust standard errors
Table 3 Baseline OLS Estimation ResultsTotal Inflows FDI Inflows Portfolio amp Debt Inflows
10 A recent study finds that as is the case for low-income countries de jure financial integration is fairly low for sub-Saharan Africa compared to other regions Capital control regulations tend to be complex and nontransparent and limited capacity to monitor capital flows can lead to inconsistent implementation Inconsistencies between different regulations have also made capital controls easy to circumvent This may explain the difficulties in establishing an empirical relation between capital controls and capital flows in the region (IMF 2008)
19
Table 4 presents the results of the 2SLS estimation The first stage equations are shown in Panel A and the second stage in Panel B Columns (1) and (2) report results using Ethno linguistic fractionalization as the instrument for property rights institutions and columns (3) and (4) using latitude Given the very low R-squared obtained in the latter case corresponding results are not shown for the components of the inflows Starting with the first-stage regressions British legal origin is shown to have a strong positive and significant impact on financial development but not on the rule of law while the instrument for property rights has a stronger and mostly significant impact on property rights (greater ethno linguistic fragmentation has a negative impact on rule of law as does closeness to the Equator) than on financial institutions Market size has a positive and significant impact on capital market development and oil exporting status has a negative and significant impact However market size is negatively related to rule of lawalthough this is likely to be mainly because of the relatively low ratings of Nigeria and South Africa regarding property rights protection Oil exporting status is also negatively related to rule of law a result attributed to the rent-seeking culture that appears to take hold in resource-rich countries (Auty 2001 Auty and Gelb 2001 Karl 1999 1997)
(1) (2) (3) (4) (1) (2) (1) (2) (1) (2)
Financial Institutions042 022 061 062 061 051 032 001 006 011(200) (097) (211) (134) (264) (214) (137) (004) (148) (259)
Rule of Law -101 -035 -225 -231 -096 025 -043 -020 -009 010(-092) (-028) (-198) (-160) (-082) (020) (-034) (-012) (-047) -041
South Africa and Nigeria 277 076 196 380 -037
(205) (039) (149) (241) (-195)Oil Exporters 115 067 265 -060 054
(157) (090 (298) (-006) (332)Constant 396 443 275 255 272 318 359 414 032 030
(430) (448) (233) (157) (287) (379) (348) (334) (188) (170)Observations 42 42 43 43 42 42 42 42 42 42R-squared 028 047 005 007 025 053 024 024 NA 012
British Legal Origin 181 148 188 155 181 148 181 148 181 148(408) (291) (419) (295) (408) (291) (408) (291) (408) (291)
Instrument for Rule of Law1 060 069 031 084 060 069 060 069 060 069
(097) (107) (024) 063) (097) (107) (097) (107) (097) (107)South Africa and Nigeria 145 158 145 145 145
(260) (295) (260) (260) (260)Oil Exporters -085 -074 -085 -085 -085
(-210) (-193) (-210) (-210) (-210)Constant 078 092 106 116 078 092 078 092 078 092
(188) (229) (394) (423) (188) (229) (188) (229) (188) (229)Adj R-squared 032 034 031 033 032 034 032 034 032 034
British Legal Origin 031 034 023 023 031 034 031 034 031 034(166) (161) (121) (121) (166) (161) (166) (161) (166) (161)
Instrument for Rule of Law1 -068 -053 143 148 -068 -053 -068 -053 -068 -053
(-211) (-157) (122) -163 (-211) (-157) (-211) (-157) (-211) (-157)South Africa and Nigeria -065 -058 -065 -065 -065
(-336) (-278) (-336) (-336) (-336)Oil Exporters -033 -048 -033 -033 -033
(-183) (-225) (-183) (-183) (-183)Constant -036 -038 -096 -086 -036 -038 -036 -038 -036 -038
(-150) (-154) (-591) (-514) (-150) (-154) (-150) (-154) (-150) (-154)Adj R-squared 010 017 008 019 010 017 010 017 010 017
Source Authors calculations
Financial Institutions Financial Institutions Financial Institutions
Table 4 Instrumental Variables Estimation ResultsPortfolio Inflows
Panel A Second-Stage Regressions
Panel B First-Stage Regressions
Rule of Law
Note and indicate significant at 1 5and 10 percent t-Statistics are reported in parentheses Robust standard 1 In columns (1) and (2) the instrument for rule of law is ethnolinguistic fractionalization In columns (3) and (4) the instrument is latitude
Total Inflows FDI Inflows
Rule of Law Rule of Law
Share of FDI
Financial Institutions
Rule of Law
20
Comparing the second-stage equations with the OLS estimates the impact of financial institutions is overall weaker (smaller coefficients) but remains strong and significant for total inflows and FDI inflows as well as the share of FDI in total inflows Interestingly the property rights variable is never significant and continues to have the ldquowrongrdquo sign in most cases except for FDI inflows and the share of FDI (column 2) perhaps indicating that non-FDI investors believe property rights are not critical for their relatively liquid investments Oil resources is a strong determinant of FDI inflows but not other types of flows whereas it is market size that seems to matter for portfolio and debt inflows When excluding South Africa and Nigeria or oil-rich countries from the estimation results are broadly similar with the coefficient on financial institutions larger particularly in the FDI regressions This indicates that in non-oil sub-Saharan African countries excluding South Africa FDI inflows are significantly larger the more financial markets are developed Perhaps surprisingly property rights protection is insignificant This may be explained by the fact that as FDI is harder to expropriate even countries with poor property rights protection receive FDI Alternatively for these relatively small countries it may be possible for foreign investors to effectively negotiate greater property rights for their FDI than is generally available in the country for other investors Given the small sample size the results must be interpreted with caution but overall they support the importance of unbundling institutions and measuring them more precisely Results also support the notion that for capital flows financial institutions as proxied by capital markets development matter more than basic property rights institutions capital including in the form of FDI will flow less to countries with less developed financial markets against the view presented in Albuquerque (2003) that FDI should flow more to financially constrained countries
IV DO PRIVATE CAPITAL FLOWS HAVE AN IMPACT ON GROWTH IN SSA This section undertakes a preliminary analysis of the relationship between capital inflows and growth in sub-Saharan Africa Significant capital flows to African countries are a relatively recent phenomenon and as noted above have so far been restricted to a limited number of markets Given the general inconclusiveness of the empirical evidence on the links between growth and capital flows from emerging markets that have been on the radar of international investors much longer than most African markets it is perhaps too early to expect robust econometric results with the particular sample in this paper While it is easy to make a theoretical case for the positive impact of capital flows on growth the empirical verification of this impact has proved much more challenging11 Alternate
11 See Edison and others 2004 Kose and others 2006 DellrsquoAricia and others 2008 and Prasad Rajan and Subramanian 2007 for comprehensive reviews of the empirical literature on the impact of capital flows Though evidence from empirical studies using aggregate data is inconclusive studies that use measures of de facto
(continuedhellip)
21
explanations to this empirical puzzle have predicated the gains from capital flows on the threshold development of certain domestic institutions andor proposed that such flows generate certain indirect or collateral benefits even when their direct impact on growth is difficult to gauge Klein (2005) finds support for a model in which institutional quality intermediates the impact of capital account liberalization on growth by affecting the extent to which savings are protected from expropriation and the premium borrowers pay for funds from abroad In countries with better institutions capital account openness has a significant positive impact on growth Bekaert Harvey and Lundblad (2005) find that the largest growth response to equity market liberalizations accrues to countries with better legal systems above-average financial development and better-quality institutions in terms of investor protection and accounting standards Using industry-level data Prasad Rajan and Subramanian (2007) indicate that for countries that have above-median levels of financial development foreign capital aids the relative growth of those industries dependent on finance But for countries below the median for financial development the effect of foreign capital inflows is diametrically opposite Using firm-level data Alfaro and Charlton (2007) find a significant relationship between entrepreneurial activity and both de jure and de facto international capital integration Their results suggest that foreign capital may improve access to capital either directly or through improved domestic financial intermediation
Recent evidence however indicates that countries that grow more rapidly are those that rely less and not more on foreign capital and in turn foreign capital tends to flow to countries that experience not high but low productivity growth (Prasad Rajan and Subramanian (2007) Gourinchas and Jeanne (2007)) One possible explanation for this puzzle is trade fast-growing countries also are the ones that experienced a takeoff in their export sector (Gourinchas and Jeanne 2007) If capital inflows lead to higher prices for nontraded goods owing to absorptive capacity constraints and thus to overvaluation they will have a negative impact on exports and hence growth (Kose and others 2006 Prasad Rajan and Subramanian 2007) Another explanation is that inflows from abroad that supplement domestic savings will have a limited impact in an economy where the binding constraint is the scarcity of viable investment opportunities (Rodrik and Subramanian 2009)
We estimate the gains from financial globalization using the same cross-section sample of average flows for the 2000-07 period as in the preceding section However in this section we also make use of data on net flows For most African countries the differences between net and total capital flows are not often vast nevertheless the economic impact of such flows depends on the actual infusion of foreign capital rather than gross flows Also we scale net flows to the size of the economy by alternatively dividing them by population or GDP
integration or finer measures of de jure integration tend to find more positive results Studies using micro data are also better able to find growth and productivity gains from financial integration
22
A Correlation Analysis
We begin the correlation analysis with a simple mapping between economic growth and capital flows in sub-Saharan Africa while not drawing any inferences about the direction of causation
12 The scatter plots indicate a generally positive correlation between growth and capital flows in our sample13 Consistent with the findings in the literature the relationship is more pronounced when only FDI flows are considered
Figure 7 Sub-Saharan Africa Capital Flows and Real GDP Growth
Capital Flows and Real Growth(net total flows to population)
-600
-500
-400
-300
-200
-100
0
100
200
300
-2 0 2 4 6 8 10 12 14
Capital Flows and Real Growth(net total flows to GDP)
-15
-10
-5
0
5
10
15
20
25
30
-5 0 5 10 15 20 25
FDI and Real Growth(net FDI to population)
0
20
40
60
80
100
120
140
160
180
-2 0 2 4 6 8 10 12 14
FDI and Real Growth(net FDI to GDP)
-5
0
5
10
15
20
25
30
-5 0 5 10 15 20 25
Note All variables are the average value of the 2000-07 period Where normalized over population the charts exclude the outliers Equatorial Guinea and Seychelles Table 5 provides further evidence of the positive significant correlation between capital flows to sub-Saharan Africa and real GDP growth in the recipient countries This relationship however does not hold when capital flows are disaggregatedmdashwhile FDI is positively correlated with growth portfolio and debt-creating flows are generally inversely related to growth though
12 As mentioned in the previous section in analyzing the relationship between growth and capital flows the latter are normalized over either the population or GDP of the recipient country All variables are considered at their average values over the 2000-07 period to deal with annual volatility 13 This is in contrast with Rodrick and Subramanian (2008) who in a sample of 110 developing countries running through 2004 do not find any relationship between financial globalization (measured as the sum of foreign assets and liabilities as a share of GDP) and growth
23
not significantly so This finding is also consistent with evidence from other studies(DellrsquoAricia and others 2008)
B Testing channels of transmission of private capital flows on growth Another approach to gauging the likely impact on capital inflows on growth is to test the various channels described in the literature on financial globalization and growth Three broad channels are identified as linking capital inflows and growth
bull Overvaluation to the extent that capital inflows cause currency appreciation they hurt exports and thus dampen growth This channel is well-documented in Rodrick (2007) but also discussed in Prasad et al (2007)
bull Savings and investment where foreign capital supplements domestic savings it fosters growth However this would only be true for economies where the main constraint on growth is a lack of savings Where the main hindrance to economic growth is the scarcity of viable investment opportunities additional foreign capital will only add to domestic distortions (Gourinchas and Jeanne 2007 Rodrick and Subramanian 2009)
bull Institutional development a number of studies argue that capital inflows carry indirect (collateral) benefits for recipient countries via the development of domestic institutions (Becker and others 2007 Kose and others 2006) or more particularly financial sector institutions (Mishkin 2006)
The testing methodology employed here utilizes correlations as well via bivariate regressions In the first stage the bivariate model regresses capital flows on the channel of interest If the first stage results indicate that the channel is significantly correlated with capital flows then in the second stage the model regresses the predicted value of the channel
Real GDP Growth
Net Total FlowsGDP
FDI FlowsGDP
Debt FlowsGDP
Portfolio FlowsGDP
Real GDP Growth 100Net Total FlowsGDP 038 100FDI FlowsGDP 066 054 100Debt FlowsGDP -002 072 -007 100Portfolio FlowsGDP -006 031 -010 002 100
Real GDP Growth
Net Total Flows per
capitaFDI Flows per capita
Debt Flows per capita
Portfolio Flows per capita
Real GDP Growth 100Net Total Flows per capita 037 100FDI Flows per capita 044 089 100Debt Flows per capita 008 053 022 100Portfolio Flows per capita -007 025 -001 -006 100Note indicates significant at 10 percentSource Authors calculations
Table 5 Correlations Net Capital Flows and Real Growth
24
from the first regression ie that part of the channel variable correlated with capital flows on growth If the coefficient in the second regression is significant and with the expected sign it implies that the channel is likely to be operational for this particular sample of countries Evidence that a particular channel could be at work is not sufficient to demonstrate the impact of private capital flows on growth but it is a necessary first step Thus Yi = α1 + β Ki + u1 (1) gi = α 2 + η Ŷi + u2 (2) Where Yi is the channel variable of interest Ki are capital flows normalized over GDP or population gi is the real GDP growth rate and Ŷi is the predicted value of the channel variable of interest derived from the first regression All variables are in their level values so that sign and significance of β and η are of greater interest than their magnitude The results are presented in Table 6 below
Overvaluation InvestmentDomestic
Savings InstitutionsNet flowsGDP -0004 0164 0337 -0214Net flows per capita -000003 0012 0021 -00042Note and indicate significant at 1 and 5 percent respectivellySource Authors calculations
Table 6 Channels of Transmission Between Capital Flows and Growth
The findings indicate that in most instances capital flows are not significantly correlated with the channel variables in our sample Except when capital flows are scaled to the size of the recipient countryrsquos population mdash both savings and investment are positively and significantly related to capital flows in this instance14 This implies that for SSA countries the impact of private capital flows on growth could be partly intermediated through the impact of net capital flows on domestic savings and investment Another implication would also be that African economies are not necessarily investment-constrained15 14 As expected the impact of the predicted values of investment and domestic savings in the second stage regressions is positive
15 Rodrik and Subramanian (2009) define an economy to be savings-constrained when private investment is low despite the existence of many privately profitable projects because credit is either not available or too costly and to be investment-constrained when credit is available but there is a lack of profitable investment opportunities (p12) In savings-constrained economies foreign capital will supplement scarce domestic savings (evidenced by high real interest rates) and lead to increased investment In investment-constrained economies real interest rates will be low and additional capital flows will finance consumption rather than investment
25
In an unexpected outcome the institutional variable is negatively related to growth a result that holds even when oil-exporters are excluded from the sample (not shown)
C How do Private Capital Flows Affect Growth Going beyond bivariate correlations we first present a simple cross-country multivariate regression model making use of a averages for the 2000-07 period 16 Although this method is not without shortcomings the limited time coverage of our dataset and year-on-year volatility dampens the usefulness of panel estimation However our analysis is subject to the considerable limitations of the ordinary least squares estimator in growth models mdash especially those arising from endogenous variables We fit a simple ordinary least squares specification to estimate the relationship between capital flows and growth gi = α + β Ki + η Xi + ui Where gi is real GDP growth Ki are capital flows normalized over GDP or population Xi is a set of control variables and ui is an independent error term In our choice of control variables we are guided by the ldquochannelsrdquo analysis from the preceding section since our interest in primarily in the impact of capital flows on growth Thus our multivariate model is essentially a simultaneous test of the correlations between of the various channel variables (plus capital flows directly) and growth As discussed above other factors shown in the literature on financial globalization to influence growth include savings and investment exchange rate overvaluation and institutions The exchange rate overvaluation measure is constructed as the ratio of the nominal exchange rate to the purchasing power parity exchange rate17 The measure of institutions used here is the number of procedures to enforce a contract (Contracts) from the World Bankrsquos Doing Business database We also control for level of economic development by including the log of initial per capita real GDP growth The results are documented in Table 7
16 See Appendix Table IV1 and Appendix Table IV2 for summary statistics and correlations for the variables included here 17 More precisely the variable is the residual of a simple panel regression between the nominal exchange rate (local currency per US dollar) versus the PPP valuation of the exchange rate The regression was run for all countries in the world and the variable is normalized to be 1 for the world as a whole
26
[1] [2] [3] [4]Initial per capita GDP (log) -153 -186 -167 -216
(-311) (-403) (-362) (-415)Overvaluation -082 -153 -068 -125
(-045) (-084) (-038) (-068)Domestic savings 009 010 009 010
(339) (359) (361) (362)Investment 018 016 015 017
(333) (293) (258) (297)Contract enforcement 011 009 009 008
(164) (142) (153) (123)Net total flowsGDP 011
-194Net total flows per capita 0003
205Total inflowsGDP 018
(227)Total inflows per capita 0003
(147)Constant -106 412 054 629
(-013) (054) (007) (080)
Adjusted R2 051 052 053 057Number of observations 42 42 42 42Note and indicate significant at 1 5 and 10 percent respectivelly t-statistics in parenthesis
Table 7 Estimation Results Linear Growth Model with Capital Flows
The results indicate that capital flows are positively and significantly (in all but one instance) associated with growth Initial per capita GDP comes in with a negative and significant coefficient in all specifications indicating support for growth convergence Domestic savings and investment are the other significant right-hand side variables that also come in with the expected sign Contract enforcement the proxy for institutional development is not significant in any of the specifications Overvaluation has the expected sign but is never significant Estimating the equation with measures of net FDI instead of total net private capital yields similar results with an even stronger association between the FDI variable and growth Aside from the positive correlations and partial evidence of a possible through the savings-investment channel our analysis is rendered incomplete by the short time period since these inflows began While the limited number of observations in our sample required us to focus on average growth and inflows over the period 2000-2007 most of the inflows came late in this period This is an issue which requires further study as additional observations (years) become available As described in Section II the observed rise in private capital flows and growth during the sample period is an important necessary condition in particular because other studies even fail to uncover such an association for different country groups andor sample periods However it is also far from sufficient for making inferences about causality
27
V CONCLUSION
As a result of the global financial crisis and recession private capital flows to all regions of the world have declined Even when the international economy recovers and financial markets return to health it is likely that investors will remain for some time more risk-averse than they were previously At the same time donor flows to low-income countries including those in sub-Saharan Africa are likely to be adversely impacted by these global developments Our results were inconclusive regarding the impact of private capital flows on growth in SSA countries Additional research will be needed before a definitive statement can be made in this regard once additional observations are available However most SSA countries are likely to remain dependant on financial inflows in some form to help finance current account deficitsmdashdeficits that will be the counterpart of development-oriented investments in these economies As donor flows are likely to be restricted in the coming years due to the fiscal problems the traditional donor countries find themselves confronting SSA countries will need private capital flows to finance these current account deficits The alternative would require smaller or no current account deficits meaning reduced development-oriented investments in infrastructure and other key areas with adverse consequences for growth potential All this means that policy makers in SSA will need to pay increasing attention to efforts to attract private capital to their countries Our results indicate that one of the most important things policy makers can do to attract private capital is to strengthen domestic capital markets Deep and well-functioning money foreign exchange equity and (where relevant) derivative markets are key to attracting private capital Governments in SSA countries would be well-advised to redouble their efforts to develop and strengthen these markets to put their countries in a position to attract private capital in the future At the same time an important of the current financial crisis should also be to put in place strong monitoring regulatory and supervisory frameworks to avoid a buildup of balance-sheet vulnerabilities
28
Appendix I Capital Flows Data The information on private capital flows is based on detailed balance of payments data obtained from AFR country desk economists in late 2007 for 44 sub-Saharan African countries Data for 2000-2006 are actual and data for 2007 are preliminary estimates The data distinguishes between FDI portfolio (debt and equity) and private debt-creating flows and between inflows and outflows The definition of capital inflows adopted for this study differs from other papers using balance of payments data as a measure of capital flows (see Appendix Box I1 for precise definitions used in the paper) Appendix Box I1 Balance of payments recording of capital flows
From the perspective of the financial account one usually thinks of changes in liabilities as positive (inflows) and changes in assets as negative (outflows) In practice both changes in liabilities and assets are reported as net of any disinvestment and consequently both can have any sign In the BOP accounts an increase (decrease) in liabilities to nonresidents is entered as positive (negative) while an increase (decrease) in net foreign assets held by residents is entered as negative (positive) If a resident sells an asset held abroad the transaction is recorded as a reduction in net foreign assets held by residents bringing an inflow of capital For this study capital inflows (outflows) are taken to be the sum of increases (decreases) in liabilities to non-residents and of decreases (increases) in net foreign assets held by residents in a year This allows to capture all transactions that give rise to a inflow of capital into a country on the liability and asset side and avoids negative ldquoinflowsrdquo Net flows of capital are calculated as the sum of the inflows (positive sign) and outflows (negative sign)
This data differs from other published data sources with respect to its timeliness coverage and level of detail bull The 2000-2007 period covers the most recent episode of private capital inflows to
sub-Saharan Africa which took off around 2005-2006
bull It covers 43 sub-Saharan African countries
bull It allows to distinguish between different types of private capital flows (FDI portfolio flows and debt-creating flows) In contrast with other studies (eg Faria and Mauro 2004) that add together FDI and portfolio equity flows we keep them separate and group portfolio debt and equity (either category is too small to stand on its own) We are interested in the determinants of various types of flows particularly as regards the development of financial markets and straight FDI doesnrsquot require any particular type of financial market infrastructure However portfolio debt and equity investment require the existence of bond and equity markets
Other data sources that cover all sub-Saharan African countries include the IMFrsquos WEO IFS Balance of payments data and the World Bankrsquos global development finance data Another
29
widely used data base is the Lane-Milesi-Ferretti data but the most recent updated version goes until 2005 and covers only a sub-set SSA countries Another group of studies use current account data as a proxy for capital flows (Prasad et al 2007 Gourinchas and Jeanne 2007) ndash which have the advantage of providing wide coverage in terms of years and countries but make it impossible to disaggregate between official and private transfers and different types of capital flows The Fundrsquos World Economic Outlook (WEO) database and the World Bankrsquos Global Development Finance (GDF) database provide the most comprehensive coverage of capital flows to sub-Saharan countries These data sets have few missing countries and few missing observations for the countries that are in the data sets However the comprehensiveness of the WEO and the GDF databases is achieved at a price as each data set relies on Fund and Bank staff estimates to fill in the lacunae left from official statistics (Dorsey et al 2008) Other data sets such as the Fundrsquos International Financial Statistics and the Balance of Payments Statistics databases rely on official reporting without the use of staff estimates to fill in the gaps The more detailed and comprehensive coverage of the international transactions at the country level is available in the Balance of Payment Statistics published once a year by the IMF Although information for most of the sub-Saharan African countries is included in the publication the most recent database shows a complete set of annual data for just 18 out of 44 countries in the region mostly the middle-income countries two oil-exporters and the largest low-income economies among them The other countries have missing data either for the capital flows components or some years specially at the end of the period covered in the study which is crucial for the econometric analysis The work of the country desk economists was essentially to make sure that all series were available and the components were consistent with the main aggregates We checked also consistency across the different published databases finding discrepancies mostly in the last few years of the sample and few revisions to historical numbers in the early 2000rsquos for the countries with data in the various publications Looking into the World Economic Outlook database there is a full coverage of the countries in the region but it is difficult to separate actual figures from the forecasted ones or estimates (specially for countries with lags in reporting official data from the authorities) and programs with the Fund requiring accurate estimates on the missing BOP data embedded in the Program We used the WEO data which are also reported by country desk economist in the Fund as a starting point and asked the desk economists to look into the details and components that are normally not used in the aggregated analysis of the external accounts offered in the WEO studies and data In brief we have not created a separate database but rather taken the available information and refined it in a way that allows us to cover as many countries in the region as possible regardless of the size of the country and the level of development weighing properly in the model those countries with no capital flows (reporting zeros) and including those null figures as information in the dependent variable
30
Appendix II Variables Definitions and Sources
Variable Description Units Source
Net total flows FDI portfolio and debt net flows See below Billions of US$ IMF African Department database
Net FDI Net foreign direct investment flows (FDI in the reporting economy net of direct investment abroad)
Billions of US$ IMF African Department database
Net portfolio and debt flows Net private portfolio investment and other private flows Includes equity and debt securities as well as all other net private debt creating flows
Billions of US$ IMF African Department database
Total Inflows FDI portfolio and debt inflows See below Billions of US$ IMF African Department database
FDI Inflows Foreign direct investment in the reporting economy Billions of US$ IMF African Department database
Portfolio and debt inflows Portfolio investment liabilities including equity and debt securities liabilities plus other private capital inflows Includes all other private debt creating flows (Liabilities excludes monetary authorities and government)
Billions of US$ IMF African Department database
CPIA Country Policy and Institutional Assessment Composite index based on sixteen criteria grouped in four categories (i) economic management (ii) structural policies (iii) policies for social inclusion and equity and (iv) public sector management and institutions
1 to 7 World Bank
Financial Institutions Index of capital markets development defined as the sum of four dummy variables Treasury bills treasury bonds corporate bonds and equity markets exist
0 1 2 3 4 with 0 for countries without any market to 4 for countries with all four markets present
Lukonga (forthcoming) and authors calculations
Rule of law The extent to which agents have confidence in and abide by the rules of society and in particular the quality of contract enforcement the police and the courts as well as the likelihood of crime and violence One of the six components of the Governance Indicators
-25 (lower score) to 25 for the highest score
httpinfoworldbankorggovernancewgiindexasp
South Africa and Nigeria Dummy variable 1 for South Africa and Nigeria 0 otherwise 0 1 Authors calculations
Oil exporters Dummy variable 1 for Angola Cameroon Chad Congo Rep of Equatorial Guinea Gabon and Nigeria 0 otherwise
0 1 IMF African Department database
Real GDP growth Real GDP growth Calculated as the percent change of the constant Gross domestic product in 2000 local currency units Measure of quality of macroeconomic policies
Percent IMF World Economic Outlook
Secondary enrollment Total enrolment in secondary level of education regardless of age expressed as a percentage of the population in the official age group corresponding to this level of education
Percent World Bank World Development Indicators
2000 per capita GDP Per capita GDP in constant US dollar for the year 2000 Constant 2000 US dollars IMF World Economic Outlook
Capital account openness De jure capital account openness index as the simple average of four dummy variables representing exchange rate arrangements payments restrictions on current and capital transactions and
t i ti i t f t di A l f
Index Chinn-Ito forthcoming
Trade openness Sum of exports and imports of goods and non-factor services over GDP
Percent of GDP IMF World Economic Outlook
British legal origin Dummy variable that takes the value 1 for former British colonies and 0 otherwise
0 1 La Porta et al (1999)
Ethno linguistic fragmentation
Average value of five different indices of ethno linguistic fractionalization
Index La Porta et al (1999)
Latitude Measure of the closeness to the equator Miles La Porta et al (1999)
Appendix II Variables Definitions and Sources
31
Overvaluation Residual of a simple panel regression between the nominal exchange rate (local currency per US dollar) Vs the PPP valuation of the exchange rate The regression includes 182 countries The overvaluation measure in normalized to be 1 for the world
Deviation from equilibrium between PPP and market rate with 1 defined as the norm
IMF African Department database
GDP in dollars GDP in dollars (Converted at the nominal market exchange rate) Billions of US$ IMF World Economic Outlook
Per capita GDP in dollars Per capita GDP (constant 2000 US dollar) Constant 2000 US dollars IMF World Economic Outlook
Inflation Headline consumer price index (Average annual percent change) Percent IMF World Economic Outlook
Government balance General government balance excluding grants Percent of GDP IMF World Economic OutlookCredit Total credit to the private sector in percent of GDP Percent of GDP IMF International Financial StatisticsCurrent account Current account balance excluding grants Percent of GDP IMF African Department databaseREER Real effective exchange rate weighted index using total trade
(exports and imports composition for 1999 to 2001) and consumer price indices
Percent IMF Information Notice System
NEER Nominal effective exchange rate weighted index using total trade (exports and imports composition for 1999 to 2001)
IMF Information Notice System
US Tbill rate United States Treasury bill rate Percent IMF International Financial StatisticsTerms of trade Terms of trade (Exports prices to import prices goods and services) Percent IMF World Economic Outlook
Rest of the world real GDP Rest of the world real GDP growth (Weighted by country exports) Percent IMF World Economic Outlook
Oil prices Price of oil Simple average of Texas Dubai and Brent prices deflated by the manufacturing unit cost index
Percent IMF World Economic Outlook
Domestic savings Total domestic savings Percent of GDP IMF World Economic OutlookInvestment Total private investment Percent of GDP IMF World Economic Outlook
Reserves Stock of international reserves (US dollar billions) Billions of US$ IMF World Economic Outlook
Non-fuel commodity prices Real non-fuel commodity price (Weighted by country specific exports deflated by the manufacturing unit price)
Percent IMF World Economic Outlook
Population Population Millions IMF World Economic OutlookContract enforcement Efficiency of contract enforcement by following the evolution of a
sale of goods dispute and tracking the time cost and number of procedures involved from the moment the plaintiff files the lawsuit until actual payment
Number of procedures httpwwwdoingbusinessorg
Constraint on the executive Index that ranks from 1 (unlimited authority to the executive) to 7 (Executive parity or subordination) as decribed in the Freedom House Index
1 to 7 httpwwwfreedomhoseorg and Polity IV Databse at wwwsystemicpeaceorg politypolity4htm
ICRG ranking International Country Risk Guide rank for each country is based on three components of risk analysis Political financial and economic components The higher the rating the lower the risk for that particular country The index covers 140 countries
0 to 100 wwwprsgroupcom
Appendix II Variables Definitions and Sources (Contd)
32
Appendix III Determinants of Capital Flows Descriptive Statistics and Correlations
Total inflows FDI inflows Portf amp debt Share of FDI Total inflows FDI inflows Portf amp debt Total inflows FDI inflows Portf amp debt
Financial Institutions 031 033 026 008 002 -005 019 -012 -011 -006004 003 009 062 088 074 022 044 050 070
Rule of Law -021 -029 -015 003 013 005 027 -007 -009 000018 006 034 083 042 077 007 065 058 099
Market size 087 093 074 000 005 -003 021 -006 -004 -005000 000 000 099 077 084 019 069 079 074
Oil exporter 010 043 -004 045 019 027 -005 034 054 -019052 000 078 000 023 008 075 003 000 022
Real GDP growth 012 039 000 034 028 041 -010 055 070 -005043 001 099 003 007 001 052 000 000 077
Secondary enrollment 036 019 039 003 060 044 081 009 011 000002 023 001 083 000 000 000 057 050 099
Log 2000 GDP per capita 027 020 026 027 063 052 070 011 026 -020008 019 009 008 000 000 000 049 009 020
Capital account openness -007 -005 -007 -004 012 006 022 007 001 011066 073 068 079 046 072 016 066 094 049
Trade openness -017 -017 -015 011 014 015 008 013 017 -003027 027 034 050 036 033 059 042 027 086
UKleg 027 028 023 016 -010 -011 -005 -010 -004 -011008 007 014 031 052 048 076 053 078 047
Ethling 015 021 011 012 006 004 009 -005 001 -010033 018 048 044 069 080 055 077 094 053
LAT -011 -012 -009 039 -004 -006 002 -015 -005 -020050 046 057 001 080 068 088 032 073 020
Pop_dens 000 -003 002 -047 -004 -005 -002 004 -023 037099 085 093 000 080 075 089 081 018 003
Note pairwise correlation coefficient reported in first row significance level reported in second row Source Authors calculations
Appendix Table III2 Bivariate Correlations of Capital Flows with Independent Variables
(US$ mn) (per capita) (in percent of GDP)
1 Dependent variables Observations Minimum Maximum Mean MedianStandard Deviation
Total inflows 43 63 162106 8265 2339 25410FDI inflows 43 00 42371 3598 909 8027Portfolio and debt inflows 43 00 130724 4666 1021 19786Total inflows per capita 43 35 16250 1291 255 3078FDI inflows per capita 43 00 11653 826 105 2325Portfolio and debt inflows pc 43 00 5906 465 147 1038Total inflows to GDP 43 11 307 81 62 65FDI inflows to GDP 43 00 290 42 24 53Portfolio and debt inflows to GDP 43 00 187 39 32 36
2 Explanatory variablesFinancial institutions 43 00 40 18 10 16Rule of law 43 -18 08 -07 -07 06Market size 43 00 10 00 00 02Oil exporter 43 00 10 02 00 04Real GDP growth 43 -04 201 48 42 36Secondary enrollment 42 82 1079 342 283 226Log of 2000 GDP per capita 43 45 90 61 58 11Capital account openness 43 -16 25 -05 -11 13Trade openness 43 369 1559 818 789 3043 Alternative measures of institutions and instrumentsCPIA 42 18 43 32 32 06Doing Business Index 43 303 1760 1321 1487 410ICRG ranking 28 483 808 614 605 73Legal rights 43 10 80 40 35 16Property rights 41 14 45 30 30 06Constraint on the executive 40 17 70 41 43 16British legal origin 43 00 10 03 00 05Ethnolinguistic fragmentation 42 00 10 06 07 03Population density in 1500 36 01 250 38 20 55Latitude 43 00 07 01 01 01Source Authors calculations
Appendix Table III1 Descriptive Statistics for Regression Variables
33
Fin Instit Rule of Law Market size Oil exporter Real GDP growth Second Enr Log 2000 GDP pc Capital open Trade openTotal inflows
Financial Institutions 100
Rule of Law 042 100000
Market size 032 -023 100004 015
Oil exporter -022 -034 020 100016 002 019
Real GDP growth 008 001 012 047 100060 095 044 000
Secondary enrollment 040 049 027 -008 -012 100001 000 008 063 044
Log 2000 GDP per capita 034 039 018 024 000 083 100002 001 025 012 098 000
Capital account openness 034 019 -006 -020 -005 031 020 100003 021 071 021 074 005 030
Trade openness -015 -008 -022 003 -010 008 010 -001 100035 061 017 085 054 061 060 096
Note Pairwise correlation coefficients reported in first row significance level reported below Source Authors calculations
Appendix Table III3 Bivariate Correlations of Baseline Regression Variables
Financial inst CPIA indexDoing
Business ICRG ranking Legal rightsRule of
law Property rightsConstraint on the executive
British legal origen
Ethnoling fragmentation Latitude
Population density
Financial institutions 100
4300
CPIA index 063 100000
4200 4200
Doing Business index -060 -044 100000 000
4300 4200 4300
ICRG ranking 029 040 -069 100013 003 000
2800 2800 2800 2800
Legal rights 061 046 -061 020 100000 000 000 030
4300 4200 4300 2800 4300
Rule of Law 042 063 -069 082 034 100000 000 000 000 003
4300 4200 4300 2800 4300 4300
Property rights 057 081 -064 070 046 081 100000 000 000 000 000 000
4100 4100 4100 2700 4100 4100 4100
Constraint on the executive 044 041 -051 016 042 049 055 100000 001 000 043 001 000 000
4000 3900 4000 2800 4000 4000 3800 4000
British legal origin 059 040 -055 031 069 021 036 028 100000 001 000 011 000 018 002 008
4300 4200 4300 2800 4300 4300 4100 4000 4300
Ethnolinguistic fragmentation 017 -015 005 -032 014 -029 -018 002 011 100027 036 074 010 038 006 028 093 050
4200 4100 4200 2800 4200 4200 4000 3900 4200 4200
Latitude 009 016 -028 037 013 030 029 019 011 001 100058 032 007 006 041 005 007 025 049 094
4300 4200 4300 2800 4300 4300 4100 4000 4300 4200 4300
Population density -014 -002 021 -025 -045 -023 -011 -018 -018 -043 -037 100042 090 022 022 001 017 052 031 028 001 003
3600 3600 3600 2500 3600 3600 3600 3500 3600 3500 3600 3600Note Pairwise correlation coefficients reported in first row significance level reported in the second row and number of observation in the third row Source Authors calculations
Appendix Table III4 Bivariate Correlations of Measures of Institutions and Instruments
34
Appendix IV Private Capital Flows and Growth
Variable Number of
observations MeanStandard deviation Min Max
Real GDP growth 43 48 36 -04 201Initial per capita GDP 43 61 11 45 90Net total flowsGDP 43 37 74 -109 271Net total flows per capita 43 547 2782 -5006 12323Total inflowsGDP 43 77 57 10 282Total inflows per capita 43 1311 3139 35 16450Overvaluation 43 11 03 07 17Domestic savings 42 122 200 -247 813Investment 42 216 87 87 469Contract enforcement 43 1014 66 826 1133Source Authors calculations
Appendix Table IV1 Private Capital Flows and Growth Summary Statistics for Multivariate Regression
Rea
l GD
P gr
owth
Initi
al p
er
capi
ta G
DP
Net
flow
sG
DP
Net
flow
s pe
r ca
pita
Inflo
ws
GD
P
Inflo
ws
per
capi
ta
Ove
rval
uatio
n
Dom
estic
sa
ving
s
Inve
stm
ent
Con
tract
en
forc
emen
t
Real GDP growth 100
Initial per capita GDP 000 100
NetflowsGDP 038 -013 100
Netflows per capita 037 028 067 100
InflowsGDP 049 016 076 066 100
Inflows per capita 028 063 042 087 061 100
Overvaluation -032 -021 -011 -003 -024 -016 100
Domestic savings 048 058 013 029 028 048 -036 100
Investment 045 045 014 039 045 051 -026 042 100
Contract enforcement 018 -007 -024 -018 -017 -013 -015 010 -012 100Note indicates significant at 10 percentSource Authors calculations
Appendix Table IV2 Private Capital Flows and Growth Pairwise Correlations for Multivariate Regression
35
References
Acemoglu D and S Johnson 2005 ldquoUnbundling Institutionsrdquo Journal of Political
Economy Vol 113 No 5 pp 949995 Acemoglu D Johnson S and D Robinson 2002 ldquoReversal of Fortune Geography and
Institutions in the Making of the Making of the Modern World Income Distributionrdquo Quarterly Journal of Economics pp 12311294
Albuquerque R 2003 ldquoThe Composition of International Capital Flows Risk Sharing
Through Foreign Direct Investmentrdquo Journal of International Economics Vol 61 pp 353ndash383
Alfaro L and A Charlton 2007 ldquoInternational Financial Integration and Entrepreneurial
Firm Activityrdquo NBER Working Paper No 13118 (Cambridge Massachusetts National Bureau of Economic Research)
mdashmdashmdash S Kalemli-Ozcan and V Volosovych 2005a ldquoCapital Flows in a Globalized
World The Role of Policies and InstitutionsrdquoNBER Working Paper No 11696 (Cambridge Massachusetts National Bureau of Economic Research)
mdashmdashmdash 2005b ldquoWhy Doesnrsquot Capital Flow from Rich to Poor Countries An Empirical
Investigationrdquo NBER Working Paper Series No 11901 (Cambridge Massachusetts National Bureau of Economic Research)
Auty R M ed 2001 Resource abundance and Economic Development Improving the
Performance of Resource-Rich Countries (Oxford Oxford University Press) mdashmdashmdash and A Gelb 2001 ldquoPolitical Economy of Resource-Abundant Statesrdquo in Resource
abundance and Economic Development Improving the Performance of Resource-Rich Countries ed by R M Auty (Oxford Oxford University Press)
Becker T O Jeanne P Mauro J D Ostry and R Ranciegravere 2007 Country InsurancemdashThe Role of Domestic Policies IMF Occasional Paper No
254 (Washington International Monetary Fund) Bekaert G Campbell R H and C Lundblad 2005 ldquoDoes Financial Liberalization Spur
Growthrdquo Journal of Financial Economics Vol 77 (July) Chinn MD and H Ito 2007 ldquoA New Measure of Financial Opennessrdquo Available via the
Internet at wwwsscwiscedu7Emchinnresearchhtml
36
Chinn MD and H Ito 2006 ldquoWhat Matters for Financial Development Capital Controls Institutions and Interactionsrdquo Journal of Development Economics Vol 81 (October) pp 163ndash92
Chinn MD Ito H 2002 ldquoCapital Account Liberalization Institutions and Financial
Development Cross-Country Evidencerdquo NBER Working Paper Series No 8967 (Cambridge Massachusetts National Bureau of Economic Research)
DellAriccia G Di Giovanni J Faria A Kose M A Mauro P Schindler M Terrones M and J D Ostry 2008 ldquoReaping the Benefits of Financial Globalizationrdquo IMF Occasional Paper No 264 (Washington International Monetary Fund)
Dorsey T E Tadesse H Singh S and Z Brixiova 2008 ldquoThe Landscape of Capital
Flows to Low-Income Countriesrdquo IMF Working Paper 0851 (Washington International Monetary Fund)
Edison H Klein M W Ricci L A and T Slok 2004 ldquoCapital Account Liberalization
and Economic Performance Survey and Synthesisrdquo IMF Staff Papers Vol 51 No 2 pp 220256
Faria A and P Mauro 2004 ldquoInstitutions and the External Capital Structure of Countriesrdquo
IMF Working Paper 04236 (Washington International Monetary Fund) mdashmdashmdash Minnoni M and AZaklan 2006 ldquoThe External Financing of Emerging Market
Countries Evidence from Two Waves of Financial Globalizationrdquo IMF Working Paper 06205 (Washington International Monetary Fund)
Glaeser E L and A Shleifer 2002 ldquoLegal Originsrdquo Quarterly Journal of Economics
Vol117 pp 1193ndash1229 Gourinchas P-O and O Jeanne 2007 ldquoCapital Flows to Developing Countries The
Allocation Puzzlerdquo NBER Working Paper No 13602 (Cambridge Massachusetts National Bureau of Economic Research)
International Monetary Fund 2007 Global Financial Stability Report (Washington
October) mdashmdashmdash 2008 Regional Economic Outlook Sub-Saharan Africa (Washington September) Ju J and S-J Wei 2007 ldquoDomestic Institutions and the Bypass Effect of Financial
Globalizationrdquo NBER Working Paper No 13148 (Cambridge Massachusetts National Bureau of Economic Research)
37
mdashmdashmdash 2006 ldquoA Solution to Two Paradoxes of International Capital Flowsrdquo NBER Working Paper No 12668 (Cambridge Massachusetts National Bureau of
Economic Research) Karl T L 1997 The Paradox of Plenty Oil Booms and Petro-States (Berkeley University
of California Press) Kaufmann D Kray A and M Mastruzzi 2008 ldquoGovernance Matters VII Aggregate and
Individual Governance Indicators 1996-2007rdquo Policy Research Working Paper No 4654 (Washington DC World Bank Group)
Klein MW 2005 ldquoCapital Account Liberalization Institutional Quality and Economic
Growth Theory and Evidencerdquo NBER Working Paper No 11112 (Cambridge Massachusetts National Bureau of Economic Research)
Kose M A Prasad E Wei S-J and K Rogoff 2006 ldquoFinancial Globalization A
Reappraisalrdquo IMF Working Paper 06189 (Washington DC International Monetary Fund)
Lane P R 2004 ldquoEmpirical Perspectives on Long-Term External Debtrdquo Topics in Macroeconomics Vol 4 No 1 httpwwwbepresscombejmtopicsvol4iss1art1 La Porta R F Lopez-de-Silanes A Shleifer and R W Vishny 1999 ldquoThe Quality of
Governmentrdquo Journal of Law Economics and Organization Vol 15 pp 222ndash79 Lukonga forthcoming ldquoFinancial Market Development Survey of Sub-Saharan African
Countriesrdquo mimeo Mauro P Minnoni M and AZaklan 2006 ldquoThe External Financing of Emerging Market
Countries Evidence from Two Waves of Financial Globalizationrdquo IMF Working Paper 06205 (Washington International Monetary Fund)
Miniane J 2004 ldquoA New Set of Measures on Capital Account Restrictionsrdquo IMF Staff Papers Vol 51 No 2 pp 276ndash308 Mishkin F S 2006 The Next Great Globalization How Disadvantaged Nations can
Harness their Financial Systems to Get Rich (Princeton NJ Princeton University Press)
Obstfeld M and A M Taylor 2004 Global Capital Markets Integration Crisis and Growth Cambridge University Press (2004) Portes R and H Rey 2005 ldquoThe Determinants of Cross-Border Equity Flowsrdquo Journal of
International Economics Vol 64 pp269-296 Prasad Eswar S Raghuram G Rajan and Arvind Subramanian 2007 ldquoForeign Capital and Economic Growthrdquo Brookings Papers on Economic Activity 1 Brookings
38
Quinn D P 1997 ldquoThe Correlates of Change in International Financial Regulationrdquo
American Political Science Review Vol 91 (September) pp 531ndash51 mdashmdashmdash and A Maria Toyoda forthcoming ldquoDoes Capital Account Liberalization Lead to
Economic Growthrdquo Review of Financial Studies Rodrick D 2007 ldquoThe Real Exchange Rate and Economic Growth Theory and Evidencerdquo
Harvard University Working Paper httpksghomeharvardedu~drodrikRER20and20growthpdf
mdashmdashmdash and A Subramanian 2008 ldquoWhy did Financial Globalization Disappointrdquo IMF
Staff Papers Vol 56 No 1 (Washington International Monetary Fund) Schindler M 2009 ldquoMeasuring Financial Integration A New Datasetrdquo IMF Staff Papers
Vol 56 No 1 (Washington International Monetary Fund) Schularick M 2006 ldquoA Tale of Two Globalizations Capital Flows from Rich to Poor in
Two Eras of Global Financerdquo International Journal of Finance and Economics Vol11 pp339-354
Schularick M Steger T 2008 ldquoThe Lucas Paradox and the Quality of Institutions Then
and Nowrdquo Berlin University Working Paper N20083 Stone M R Shimizu S Nordstrom A and H J Ferhani 2008 ldquoDeveloping Essential
Financial Markets in Smaller Economies Stylized Facts and Policy Optionsrdquo IMF Occasional Paper No 265 (Washington International Monetary Fund)
World Bank 2007 Global Development Finance The Globalization of Corporate Finance in Developing Countries (Washington World Bank Group)

15
bull Following Acemoglu and Johnson (2005) we use British legal origin as the instrument for financial market development taken from La Porta et al (1999) Acemoglu Johnson and Robinson 2002 Glaeser and Schleifer 2002 and La Porta et al1999 show that in the case of former European colonies legal origin is a valid instrument for contracting institutionsfinancial market development and property rights respectively Legal origin is shown to be positively and significantly associated with financial institutions with civil law countries exhibiting lower financial development than common law countries (Glaeser and Schleifer 2002 La Porta et al 1999)
bull The instruments for property rights institutions are the degree of ethno linguistic fragmentation and the countryrsquos latitude taken from La Porta et al (1999) which have been found to be associated with worse property rights and regulations7 Acemoglu and Johnson 2005 Acemoglu Johnson and Richardson (2002) Faria et al 2006 and Faria and Mauro 2004 use settler mortality in 1500 or population density in 1500 and show that they are valid instruments for property rights institutions For sub-Saharan African countries however settler mortality and population density in 1500 are available only for a subset of countries (Acemoglu and Johnson 2002)8 Given the better country coverage we have chosen to proceed with ethno linguistic fragmentation and latitude
bull A dummy variable to control for oil-exporting countries (the dummy variable takes the value of 1 if the country is an oil exporter) Oil-exporting countries attract more FDI other things equal
bull A dummy variable to control for market size (the dummy variable takes the value of 1 if the country is South Africa or Nigeria) Larger and more sophisticated economies attract more capital flows
Similar studies also include a number of additional explanatory variables though it is more difficult both to argue that they are exogenous and to find valid instruments for them We use these variables in our baseline regression
bull Human capital proxied by the share of secondary school enrollment in the population from the WDI This variable features in explanations of the Lucas Paradox that focus on missing factors of production (Alfaro et al 2005a 2005b) The expected impact of higher human capital on capital flows is expected to be positive
Robinson (2002) use average protection against expropriation risk and constraint on the executive as measures of property rights but these measures are not available for a sufficiently large number of our sample countries 7 La Porta et al (1999) however note that the adverse effects of ethno linguistic fractionalization on government performance tend to disappear when controlling for per capita income and latitude except for public good provision and state-owned enterprises This can be interpreted as countries with a large public enterprises sector tend to have less regard for private enterprises and private property rights 8 Robustness checks using population density in 1500 as an instrument yield results that are consistent with those obtained with ethno linguistic fragmentation (results not shown)
16
bull A measures of de jure capital account openness proxied by the Chinn-Ito measure of capital account openness based on the IMFrsquos AREAER (Chinn and Ito 2007) We use the average value of the Chinn-Ito variable for sub-Saharan African countries over 1999-20059 The effect of capital account openness on capital flows is expected to be positive
bull A measure of trade openness proxied by the sum of exports and imports over GDP Particularly at an initial stage capital mobility develops around greater openness to trade flows Arguably countries that are more open to trade may also be politically more open to greater integration with the rest of the world
bull Macroeconomic performance proxied here by the real GDP growth rate In a panel study of 47 industrial and emerging countries IMF (2007) find that expected macroeconomic performance proxied by lagged real GDP growth is a significant determinant of private capital inflows IMF (2008) similarly finds that real GDP growth and lower fiscal deficits are significantly correlated with higher private capital inflows Alfaro (2005b) uses inflation volatility as a proxy for macroeconomic performance However it is difficult to establish causality as inflows directly affect macroeconomic outcomes (also see below) Further macroeconomic outcomes have been shown to be shaped by institutions making it difficult to study the independent effect of institutional development on capital flows
Correlations Appendix Table III2 shows pairwise correlations between different measures of capital flows while Appendix Table III3 shows the pairwise correlations corresponding to the baseline regressions and Appendix Table III4 focuses on the pairwise correlations of the institutional variables and the instruments
Appendix Table III2 indicates that for our sample the choice of scaling variable affects the pairwise correlations of the inflows with the independent variables This confirms the impression from Figure 5 above that the picture of the allocation of private capital inflows across sub-Saharan countries is very different whether one looks at overall volume of inflows or at the size of the inflows relative to a countryrsquos population or GDP Whereas total inflows as a share of population or GDP will be the variable of interest when studying the economic impact of the inflows on individual countries (see Section IV below) the investigation of the factors determining the allocation of private capital flows to sub-Saharan Africa across the
9 Unlike many other studies that use the simple average of the four dummy variables or the dummy on capital account restrictions (Alfaro et al 2005a 2005b IMF 2007b) the Chinn-Ito measure attempts to capture the intensity of the capital controls by incorporating all the restrictions in the index using a principal components approach Whereas the other restrictions are not directly related to capital account restrictions they are taken as indicative of the overall restrictiveness of the regime The advantage of this measure over other more detailed indices that capture the intensity of capital controls (Quinn 1997 2003 Miniane 2004 Schindler 2009) is its near universal country and extended time coverage 181 countries between 1970 and 2005
17
continent should focus on the total volume of inflows A simple explanation is that private investors are more likely to decide on allocating specific amounts of money to various markets or projects than to fix investment limits relative to a countryrsquos population or GDP Therefore for the remainder of this section the variable of interest will be the log of private capital inflows and their components FDI on the one hand and portfolio and debt flows on the other averaged over 2000-2007 for each sub-Saharan African country excluding Somalia and Zimbabwe Looking at the potential determinants of private capital flows to SSA and their composition in Appendix Table III2 (columns 1-4) overall inflows as well as portfolio and debt inflows are correlated with the index of financial sector development secondary school enrollment the market size dummy variable and the log of initial GDP per capita There are however interesting variations for the determinants of FDI flows to which GDP per capita and secondary school enrollment are not significantly correlated but the proxy for property rights and the dummy for oil producers are The measure of trade openness and the Chinn-Ito capital openness variable are never significantly correlated with private inflows or their components However capital account openness is correlated with the degree of financial sector development as in Chinn and Ito (2005) and with secondary school enrollment
Appendix Table III3 illustrates the challenges associated with finding truly exogenous determinants of private capital flows and their composition as a number of potential explanatory variables are correlated with each other In particular the measure of financial market development is highly correlated with the proxies for property rights institutions as discussed above Further educational achievement is significantly correlated with the institutional quality variables and economic development This is not surprising as it can be understood as an outcome of good institutions and higher degree of economic development This strong degree of endogeneity and the fact that we are interested in disentangling the impact of institutions on capital inflows argues that like the variables capturing macroeconomic performance it is probably not a useful explanatory variable given our focus on the impact of institutions per se on capital inflows The same holds true for the proxy for economic development log of GDP per capita in 2000 (Alfaro et al 2005b show that log real GDP per capita has no additional explanatory power once a measure of institutional quality is introduced)
The pairwise correlations of the potential instrumentsmdashBritish legal origin population density in 1500 and ethno linguistic fragmentationmdashwith the institutional variables and with the capital flows variables are encouraging for the instrumental variables approach (Appendix Table III4) The potential instruments for property rights institutions are uncorrelated with the inflows variables but are significantly correlated with the property rights proxies Although British legal origin is significantly correlated with total inflows in addition to financial institutions it is not correlated with property rights nor its potential instruments
18
Regression results
Table 3 presents the results of simple OLS estimations of various specifications of equation (1) as a benchmark The coefficient on the financial market development index is positive and significant and robust across all specifications For portfolio and debt flows it is even the only variable that is significant maybe highlighting the particular importance of capital market development for non-FDI flows The coefficient on property rights institutions (rule of law score) is never significant and has the wrong sign The coefficients on the controls for country size and oil exporters are large and generally significant but while oil exporters do receive more FDI than other countries they do not have any particular advantage with portfolio and debt inflows Real GDP growth is the only other variable that is significant for total inflows and FDI However as discussed earlier real GDP growth is not exogenous and to study the impact of institutions further we use the specification in column (3) as our baseline The log of real GDP per capita in 2000 secondary enrollment and capital account and trade openness are never significant10 The results obtained are similar when breaking the sample into two sub-periods capturing the period before and after the acceleration of private capital inflows This is not surprising considering that the determinants of inflows are fairly slowly-moving country characteristics They are also robust to excluding South Africa and Nigeria indicating that the results are not driven by the two largest recipients and to excluding all oil exporters (Results available upon request) Indeed the impact of financial market development on inflows is even larger in both cases
(1) (2) (3) (4) (5) (6) (7) (8) (1) (2) (3) (4) (1) (2) (3) (4)Financial Institutions 050 056 052 055 056 058 056 057 067 063 055 057 055
(-346) (586) (548) (544) (565) (527) (603) (536) (499) (343) (348) (322)Rule of Law -021 -033 -041 -027 -028 -033 -037 -003 -010 -020 -018 -052 -058
(-056) (-114) (-136) (-070) (-085) (-112) (-129) (-008) (-025) (052) (-046) (-124) (-131)South Africa and Nigeria 185 187 198 189 179 158 135 137 211 212
(168) (170) (121) (160) (161) (137) (134) (137) (160 (160)Oil Exporters 161 101 162 168 160 164 267 194 051 012
(314) (190) (304) (276) (308) (306) (441) (367) (078) (014)Real GDP growth
011 014 007(326) (304) (127)
Secondary Enrollment -000
(-028)Log 2000 per capita GDP -05
(-032)Capital Account Openness -06
(-06)Trade Openness
-001(-202)
Constant 447 522 379 335 392 413 374 441 342 442 268 216 345 430 288 260(-125) (2317) (1146) (966) (836) (398) (1015) (867) (713) (1956) (635) (477) (900) (1361) (482) (410)
Observations 43 43 43 43 42 43 43 43 43 43 43 43 43 43 43 43R-squared 026 001 057 062 057 057 058 059 022 000 055 059 025 000 042 044F-Statistic 1196 031 1200 1581 878 946 941 1532 1197 001 1289 1406 1176 021 545 493
Source Authors calculations
Note and indicate significant at 1 5and 10 percent t-Statistics are reported in parentheses Robust standard errors
Table 3 Baseline OLS Estimation ResultsTotal Inflows FDI Inflows Portfolio amp Debt Inflows
10 A recent study finds that as is the case for low-income countries de jure financial integration is fairly low for sub-Saharan Africa compared to other regions Capital control regulations tend to be complex and nontransparent and limited capacity to monitor capital flows can lead to inconsistent implementation Inconsistencies between different regulations have also made capital controls easy to circumvent This may explain the difficulties in establishing an empirical relation between capital controls and capital flows in the region (IMF 2008)
19
Table 4 presents the results of the 2SLS estimation The first stage equations are shown in Panel A and the second stage in Panel B Columns (1) and (2) report results using Ethno linguistic fractionalization as the instrument for property rights institutions and columns (3) and (4) using latitude Given the very low R-squared obtained in the latter case corresponding results are not shown for the components of the inflows Starting with the first-stage regressions British legal origin is shown to have a strong positive and significant impact on financial development but not on the rule of law while the instrument for property rights has a stronger and mostly significant impact on property rights (greater ethno linguistic fragmentation has a negative impact on rule of law as does closeness to the Equator) than on financial institutions Market size has a positive and significant impact on capital market development and oil exporting status has a negative and significant impact However market size is negatively related to rule of lawalthough this is likely to be mainly because of the relatively low ratings of Nigeria and South Africa regarding property rights protection Oil exporting status is also negatively related to rule of law a result attributed to the rent-seeking culture that appears to take hold in resource-rich countries (Auty 2001 Auty and Gelb 2001 Karl 1999 1997)
(1) (2) (3) (4) (1) (2) (1) (2) (1) (2)
Financial Institutions042 022 061 062 061 051 032 001 006 011(200) (097) (211) (134) (264) (214) (137) (004) (148) (259)
Rule of Law -101 -035 -225 -231 -096 025 -043 -020 -009 010(-092) (-028) (-198) (-160) (-082) (020) (-034) (-012) (-047) -041
South Africa and Nigeria 277 076 196 380 -037
(205) (039) (149) (241) (-195)Oil Exporters 115 067 265 -060 054
(157) (090 (298) (-006) (332)Constant 396 443 275 255 272 318 359 414 032 030
(430) (448) (233) (157) (287) (379) (348) (334) (188) (170)Observations 42 42 43 43 42 42 42 42 42 42R-squared 028 047 005 007 025 053 024 024 NA 012
British Legal Origin 181 148 188 155 181 148 181 148 181 148(408) (291) (419) (295) (408) (291) (408) (291) (408) (291)
Instrument for Rule of Law1 060 069 031 084 060 069 060 069 060 069
(097) (107) (024) 063) (097) (107) (097) (107) (097) (107)South Africa and Nigeria 145 158 145 145 145
(260) (295) (260) (260) (260)Oil Exporters -085 -074 -085 -085 -085
(-210) (-193) (-210) (-210) (-210)Constant 078 092 106 116 078 092 078 092 078 092
(188) (229) (394) (423) (188) (229) (188) (229) (188) (229)Adj R-squared 032 034 031 033 032 034 032 034 032 034
British Legal Origin 031 034 023 023 031 034 031 034 031 034(166) (161) (121) (121) (166) (161) (166) (161) (166) (161)
Instrument for Rule of Law1 -068 -053 143 148 -068 -053 -068 -053 -068 -053
(-211) (-157) (122) -163 (-211) (-157) (-211) (-157) (-211) (-157)South Africa and Nigeria -065 -058 -065 -065 -065
(-336) (-278) (-336) (-336) (-336)Oil Exporters -033 -048 -033 -033 -033
(-183) (-225) (-183) (-183) (-183)Constant -036 -038 -096 -086 -036 -038 -036 -038 -036 -038
(-150) (-154) (-591) (-514) (-150) (-154) (-150) (-154) (-150) (-154)Adj R-squared 010 017 008 019 010 017 010 017 010 017
Source Authors calculations
Financial Institutions Financial Institutions Financial Institutions
Table 4 Instrumental Variables Estimation ResultsPortfolio Inflows
Panel A Second-Stage Regressions
Panel B First-Stage Regressions
Rule of Law
Note and indicate significant at 1 5and 10 percent t-Statistics are reported in parentheses Robust standard 1 In columns (1) and (2) the instrument for rule of law is ethnolinguistic fractionalization In columns (3) and (4) the instrument is latitude
Total Inflows FDI Inflows
Rule of Law Rule of Law
Share of FDI
Financial Institutions
Rule of Law
20
Comparing the second-stage equations with the OLS estimates the impact of financial institutions is overall weaker (smaller coefficients) but remains strong and significant for total inflows and FDI inflows as well as the share of FDI in total inflows Interestingly the property rights variable is never significant and continues to have the ldquowrongrdquo sign in most cases except for FDI inflows and the share of FDI (column 2) perhaps indicating that non-FDI investors believe property rights are not critical for their relatively liquid investments Oil resources is a strong determinant of FDI inflows but not other types of flows whereas it is market size that seems to matter for portfolio and debt inflows When excluding South Africa and Nigeria or oil-rich countries from the estimation results are broadly similar with the coefficient on financial institutions larger particularly in the FDI regressions This indicates that in non-oil sub-Saharan African countries excluding South Africa FDI inflows are significantly larger the more financial markets are developed Perhaps surprisingly property rights protection is insignificant This may be explained by the fact that as FDI is harder to expropriate even countries with poor property rights protection receive FDI Alternatively for these relatively small countries it may be possible for foreign investors to effectively negotiate greater property rights for their FDI than is generally available in the country for other investors Given the small sample size the results must be interpreted with caution but overall they support the importance of unbundling institutions and measuring them more precisely Results also support the notion that for capital flows financial institutions as proxied by capital markets development matter more than basic property rights institutions capital including in the form of FDI will flow less to countries with less developed financial markets against the view presented in Albuquerque (2003) that FDI should flow more to financially constrained countries
IV DO PRIVATE CAPITAL FLOWS HAVE AN IMPACT ON GROWTH IN SSA This section undertakes a preliminary analysis of the relationship between capital inflows and growth in sub-Saharan Africa Significant capital flows to African countries are a relatively recent phenomenon and as noted above have so far been restricted to a limited number of markets Given the general inconclusiveness of the empirical evidence on the links between growth and capital flows from emerging markets that have been on the radar of international investors much longer than most African markets it is perhaps too early to expect robust econometric results with the particular sample in this paper While it is easy to make a theoretical case for the positive impact of capital flows on growth the empirical verification of this impact has proved much more challenging11 Alternate
11 See Edison and others 2004 Kose and others 2006 DellrsquoAricia and others 2008 and Prasad Rajan and Subramanian 2007 for comprehensive reviews of the empirical literature on the impact of capital flows Though evidence from empirical studies using aggregate data is inconclusive studies that use measures of de facto
(continuedhellip)
21
explanations to this empirical puzzle have predicated the gains from capital flows on the threshold development of certain domestic institutions andor proposed that such flows generate certain indirect or collateral benefits even when their direct impact on growth is difficult to gauge Klein (2005) finds support for a model in which institutional quality intermediates the impact of capital account liberalization on growth by affecting the extent to which savings are protected from expropriation and the premium borrowers pay for funds from abroad In countries with better institutions capital account openness has a significant positive impact on growth Bekaert Harvey and Lundblad (2005) find that the largest growth response to equity market liberalizations accrues to countries with better legal systems above-average financial development and better-quality institutions in terms of investor protection and accounting standards Using industry-level data Prasad Rajan and Subramanian (2007) indicate that for countries that have above-median levels of financial development foreign capital aids the relative growth of those industries dependent on finance But for countries below the median for financial development the effect of foreign capital inflows is diametrically opposite Using firm-level data Alfaro and Charlton (2007) find a significant relationship between entrepreneurial activity and both de jure and de facto international capital integration Their results suggest that foreign capital may improve access to capital either directly or through improved domestic financial intermediation
Recent evidence however indicates that countries that grow more rapidly are those that rely less and not more on foreign capital and in turn foreign capital tends to flow to countries that experience not high but low productivity growth (Prasad Rajan and Subramanian (2007) Gourinchas and Jeanne (2007)) One possible explanation for this puzzle is trade fast-growing countries also are the ones that experienced a takeoff in their export sector (Gourinchas and Jeanne 2007) If capital inflows lead to higher prices for nontraded goods owing to absorptive capacity constraints and thus to overvaluation they will have a negative impact on exports and hence growth (Kose and others 2006 Prasad Rajan and Subramanian 2007) Another explanation is that inflows from abroad that supplement domestic savings will have a limited impact in an economy where the binding constraint is the scarcity of viable investment opportunities (Rodrik and Subramanian 2009)
We estimate the gains from financial globalization using the same cross-section sample of average flows for the 2000-07 period as in the preceding section However in this section we also make use of data on net flows For most African countries the differences between net and total capital flows are not often vast nevertheless the economic impact of such flows depends on the actual infusion of foreign capital rather than gross flows Also we scale net flows to the size of the economy by alternatively dividing them by population or GDP
integration or finer measures of de jure integration tend to find more positive results Studies using micro data are also better able to find growth and productivity gains from financial integration
22
A Correlation Analysis
We begin the correlation analysis with a simple mapping between economic growth and capital flows in sub-Saharan Africa while not drawing any inferences about the direction of causation
12 The scatter plots indicate a generally positive correlation between growth and capital flows in our sample13 Consistent with the findings in the literature the relationship is more pronounced when only FDI flows are considered
Figure 7 Sub-Saharan Africa Capital Flows and Real GDP Growth
Capital Flows and Real Growth(net total flows to population)
-600
-500
-400
-300
-200
-100
0
100
200
300
-2 0 2 4 6 8 10 12 14
Capital Flows and Real Growth(net total flows to GDP)
-15
-10
-5
0
5
10
15
20
25
30
-5 0 5 10 15 20 25
FDI and Real Growth(net FDI to population)
0
20
40
60
80
100
120
140
160
180
-2 0 2 4 6 8 10 12 14
FDI and Real Growth(net FDI to GDP)
-5
0
5
10
15
20
25
30
-5 0 5 10 15 20 25
Note All variables are the average value of the 2000-07 period Where normalized over population the charts exclude the outliers Equatorial Guinea and Seychelles Table 5 provides further evidence of the positive significant correlation between capital flows to sub-Saharan Africa and real GDP growth in the recipient countries This relationship however does not hold when capital flows are disaggregatedmdashwhile FDI is positively correlated with growth portfolio and debt-creating flows are generally inversely related to growth though
12 As mentioned in the previous section in analyzing the relationship between growth and capital flows the latter are normalized over either the population or GDP of the recipient country All variables are considered at their average values over the 2000-07 period to deal with annual volatility 13 This is in contrast with Rodrick and Subramanian (2008) who in a sample of 110 developing countries running through 2004 do not find any relationship between financial globalization (measured as the sum of foreign assets and liabilities as a share of GDP) and growth
23
not significantly so This finding is also consistent with evidence from other studies(DellrsquoAricia and others 2008)
B Testing channels of transmission of private capital flows on growth Another approach to gauging the likely impact on capital inflows on growth is to test the various channels described in the literature on financial globalization and growth Three broad channels are identified as linking capital inflows and growth
bull Overvaluation to the extent that capital inflows cause currency appreciation they hurt exports and thus dampen growth This channel is well-documented in Rodrick (2007) but also discussed in Prasad et al (2007)
bull Savings and investment where foreign capital supplements domestic savings it fosters growth However this would only be true for economies where the main constraint on growth is a lack of savings Where the main hindrance to economic growth is the scarcity of viable investment opportunities additional foreign capital will only add to domestic distortions (Gourinchas and Jeanne 2007 Rodrick and Subramanian 2009)
bull Institutional development a number of studies argue that capital inflows carry indirect (collateral) benefits for recipient countries via the development of domestic institutions (Becker and others 2007 Kose and others 2006) or more particularly financial sector institutions (Mishkin 2006)
The testing methodology employed here utilizes correlations as well via bivariate regressions In the first stage the bivariate model regresses capital flows on the channel of interest If the first stage results indicate that the channel is significantly correlated with capital flows then in the second stage the model regresses the predicted value of the channel
Real GDP Growth
Net Total FlowsGDP
FDI FlowsGDP
Debt FlowsGDP
Portfolio FlowsGDP
Real GDP Growth 100Net Total FlowsGDP 038 100FDI FlowsGDP 066 054 100Debt FlowsGDP -002 072 -007 100Portfolio FlowsGDP -006 031 -010 002 100
Real GDP Growth
Net Total Flows per
capitaFDI Flows per capita
Debt Flows per capita
Portfolio Flows per capita
Real GDP Growth 100Net Total Flows per capita 037 100FDI Flows per capita 044 089 100Debt Flows per capita 008 053 022 100Portfolio Flows per capita -007 025 -001 -006 100Note indicates significant at 10 percentSource Authors calculations
Table 5 Correlations Net Capital Flows and Real Growth
24
from the first regression ie that part of the channel variable correlated with capital flows on growth If the coefficient in the second regression is significant and with the expected sign it implies that the channel is likely to be operational for this particular sample of countries Evidence that a particular channel could be at work is not sufficient to demonstrate the impact of private capital flows on growth but it is a necessary first step Thus Yi = α1 + β Ki + u1 (1) gi = α 2 + η Ŷi + u2 (2) Where Yi is the channel variable of interest Ki are capital flows normalized over GDP or population gi is the real GDP growth rate and Ŷi is the predicted value of the channel variable of interest derived from the first regression All variables are in their level values so that sign and significance of β and η are of greater interest than their magnitude The results are presented in Table 6 below
Overvaluation InvestmentDomestic
Savings InstitutionsNet flowsGDP -0004 0164 0337 -0214Net flows per capita -000003 0012 0021 -00042Note and indicate significant at 1 and 5 percent respectivellySource Authors calculations
Table 6 Channels of Transmission Between Capital Flows and Growth
The findings indicate that in most instances capital flows are not significantly correlated with the channel variables in our sample Except when capital flows are scaled to the size of the recipient countryrsquos population mdash both savings and investment are positively and significantly related to capital flows in this instance14 This implies that for SSA countries the impact of private capital flows on growth could be partly intermediated through the impact of net capital flows on domestic savings and investment Another implication would also be that African economies are not necessarily investment-constrained15 14 As expected the impact of the predicted values of investment and domestic savings in the second stage regressions is positive
15 Rodrik and Subramanian (2009) define an economy to be savings-constrained when private investment is low despite the existence of many privately profitable projects because credit is either not available or too costly and to be investment-constrained when credit is available but there is a lack of profitable investment opportunities (p12) In savings-constrained economies foreign capital will supplement scarce domestic savings (evidenced by high real interest rates) and lead to increased investment In investment-constrained economies real interest rates will be low and additional capital flows will finance consumption rather than investment
25
In an unexpected outcome the institutional variable is negatively related to growth a result that holds even when oil-exporters are excluded from the sample (not shown)
C How do Private Capital Flows Affect Growth Going beyond bivariate correlations we first present a simple cross-country multivariate regression model making use of a averages for the 2000-07 period 16 Although this method is not without shortcomings the limited time coverage of our dataset and year-on-year volatility dampens the usefulness of panel estimation However our analysis is subject to the considerable limitations of the ordinary least squares estimator in growth models mdash especially those arising from endogenous variables We fit a simple ordinary least squares specification to estimate the relationship between capital flows and growth gi = α + β Ki + η Xi + ui Where gi is real GDP growth Ki are capital flows normalized over GDP or population Xi is a set of control variables and ui is an independent error term In our choice of control variables we are guided by the ldquochannelsrdquo analysis from the preceding section since our interest in primarily in the impact of capital flows on growth Thus our multivariate model is essentially a simultaneous test of the correlations between of the various channel variables (plus capital flows directly) and growth As discussed above other factors shown in the literature on financial globalization to influence growth include savings and investment exchange rate overvaluation and institutions The exchange rate overvaluation measure is constructed as the ratio of the nominal exchange rate to the purchasing power parity exchange rate17 The measure of institutions used here is the number of procedures to enforce a contract (Contracts) from the World Bankrsquos Doing Business database We also control for level of economic development by including the log of initial per capita real GDP growth The results are documented in Table 7
16 See Appendix Table IV1 and Appendix Table IV2 for summary statistics and correlations for the variables included here 17 More precisely the variable is the residual of a simple panel regression between the nominal exchange rate (local currency per US dollar) versus the PPP valuation of the exchange rate The regression was run for all countries in the world and the variable is normalized to be 1 for the world as a whole
26
[1] [2] [3] [4]Initial per capita GDP (log) -153 -186 -167 -216
(-311) (-403) (-362) (-415)Overvaluation -082 -153 -068 -125
(-045) (-084) (-038) (-068)Domestic savings 009 010 009 010
(339) (359) (361) (362)Investment 018 016 015 017
(333) (293) (258) (297)Contract enforcement 011 009 009 008
(164) (142) (153) (123)Net total flowsGDP 011
-194Net total flows per capita 0003
205Total inflowsGDP 018
(227)Total inflows per capita 0003
(147)Constant -106 412 054 629
(-013) (054) (007) (080)
Adjusted R2 051 052 053 057Number of observations 42 42 42 42Note and indicate significant at 1 5 and 10 percent respectivelly t-statistics in parenthesis
Table 7 Estimation Results Linear Growth Model with Capital Flows
The results indicate that capital flows are positively and significantly (in all but one instance) associated with growth Initial per capita GDP comes in with a negative and significant coefficient in all specifications indicating support for growth convergence Domestic savings and investment are the other significant right-hand side variables that also come in with the expected sign Contract enforcement the proxy for institutional development is not significant in any of the specifications Overvaluation has the expected sign but is never significant Estimating the equation with measures of net FDI instead of total net private capital yields similar results with an even stronger association between the FDI variable and growth Aside from the positive correlations and partial evidence of a possible through the savings-investment channel our analysis is rendered incomplete by the short time period since these inflows began While the limited number of observations in our sample required us to focus on average growth and inflows over the period 2000-2007 most of the inflows came late in this period This is an issue which requires further study as additional observations (years) become available As described in Section II the observed rise in private capital flows and growth during the sample period is an important necessary condition in particular because other studies even fail to uncover such an association for different country groups andor sample periods However it is also far from sufficient for making inferences about causality
27
V CONCLUSION
As a result of the global financial crisis and recession private capital flows to all regions of the world have declined Even when the international economy recovers and financial markets return to health it is likely that investors will remain for some time more risk-averse than they were previously At the same time donor flows to low-income countries including those in sub-Saharan Africa are likely to be adversely impacted by these global developments Our results were inconclusive regarding the impact of private capital flows on growth in SSA countries Additional research will be needed before a definitive statement can be made in this regard once additional observations are available However most SSA countries are likely to remain dependant on financial inflows in some form to help finance current account deficitsmdashdeficits that will be the counterpart of development-oriented investments in these economies As donor flows are likely to be restricted in the coming years due to the fiscal problems the traditional donor countries find themselves confronting SSA countries will need private capital flows to finance these current account deficits The alternative would require smaller or no current account deficits meaning reduced development-oriented investments in infrastructure and other key areas with adverse consequences for growth potential All this means that policy makers in SSA will need to pay increasing attention to efforts to attract private capital to their countries Our results indicate that one of the most important things policy makers can do to attract private capital is to strengthen domestic capital markets Deep and well-functioning money foreign exchange equity and (where relevant) derivative markets are key to attracting private capital Governments in SSA countries would be well-advised to redouble their efforts to develop and strengthen these markets to put their countries in a position to attract private capital in the future At the same time an important of the current financial crisis should also be to put in place strong monitoring regulatory and supervisory frameworks to avoid a buildup of balance-sheet vulnerabilities
28
Appendix I Capital Flows Data The information on private capital flows is based on detailed balance of payments data obtained from AFR country desk economists in late 2007 for 44 sub-Saharan African countries Data for 2000-2006 are actual and data for 2007 are preliminary estimates The data distinguishes between FDI portfolio (debt and equity) and private debt-creating flows and between inflows and outflows The definition of capital inflows adopted for this study differs from other papers using balance of payments data as a measure of capital flows (see Appendix Box I1 for precise definitions used in the paper) Appendix Box I1 Balance of payments recording of capital flows
From the perspective of the financial account one usually thinks of changes in liabilities as positive (inflows) and changes in assets as negative (outflows) In practice both changes in liabilities and assets are reported as net of any disinvestment and consequently both can have any sign In the BOP accounts an increase (decrease) in liabilities to nonresidents is entered as positive (negative) while an increase (decrease) in net foreign assets held by residents is entered as negative (positive) If a resident sells an asset held abroad the transaction is recorded as a reduction in net foreign assets held by residents bringing an inflow of capital For this study capital inflows (outflows) are taken to be the sum of increases (decreases) in liabilities to non-residents and of decreases (increases) in net foreign assets held by residents in a year This allows to capture all transactions that give rise to a inflow of capital into a country on the liability and asset side and avoids negative ldquoinflowsrdquo Net flows of capital are calculated as the sum of the inflows (positive sign) and outflows (negative sign)
This data differs from other published data sources with respect to its timeliness coverage and level of detail bull The 2000-2007 period covers the most recent episode of private capital inflows to
sub-Saharan Africa which took off around 2005-2006
bull It covers 43 sub-Saharan African countries
bull It allows to distinguish between different types of private capital flows (FDI portfolio flows and debt-creating flows) In contrast with other studies (eg Faria and Mauro 2004) that add together FDI and portfolio equity flows we keep them separate and group portfolio debt and equity (either category is too small to stand on its own) We are interested in the determinants of various types of flows particularly as regards the development of financial markets and straight FDI doesnrsquot require any particular type of financial market infrastructure However portfolio debt and equity investment require the existence of bond and equity markets
Other data sources that cover all sub-Saharan African countries include the IMFrsquos WEO IFS Balance of payments data and the World Bankrsquos global development finance data Another
29
widely used data base is the Lane-Milesi-Ferretti data but the most recent updated version goes until 2005 and covers only a sub-set SSA countries Another group of studies use current account data as a proxy for capital flows (Prasad et al 2007 Gourinchas and Jeanne 2007) ndash which have the advantage of providing wide coverage in terms of years and countries but make it impossible to disaggregate between official and private transfers and different types of capital flows The Fundrsquos World Economic Outlook (WEO) database and the World Bankrsquos Global Development Finance (GDF) database provide the most comprehensive coverage of capital flows to sub-Saharan countries These data sets have few missing countries and few missing observations for the countries that are in the data sets However the comprehensiveness of the WEO and the GDF databases is achieved at a price as each data set relies on Fund and Bank staff estimates to fill in the lacunae left from official statistics (Dorsey et al 2008) Other data sets such as the Fundrsquos International Financial Statistics and the Balance of Payments Statistics databases rely on official reporting without the use of staff estimates to fill in the gaps The more detailed and comprehensive coverage of the international transactions at the country level is available in the Balance of Payment Statistics published once a year by the IMF Although information for most of the sub-Saharan African countries is included in the publication the most recent database shows a complete set of annual data for just 18 out of 44 countries in the region mostly the middle-income countries two oil-exporters and the largest low-income economies among them The other countries have missing data either for the capital flows components or some years specially at the end of the period covered in the study which is crucial for the econometric analysis The work of the country desk economists was essentially to make sure that all series were available and the components were consistent with the main aggregates We checked also consistency across the different published databases finding discrepancies mostly in the last few years of the sample and few revisions to historical numbers in the early 2000rsquos for the countries with data in the various publications Looking into the World Economic Outlook database there is a full coverage of the countries in the region but it is difficult to separate actual figures from the forecasted ones or estimates (specially for countries with lags in reporting official data from the authorities) and programs with the Fund requiring accurate estimates on the missing BOP data embedded in the Program We used the WEO data which are also reported by country desk economist in the Fund as a starting point and asked the desk economists to look into the details and components that are normally not used in the aggregated analysis of the external accounts offered in the WEO studies and data In brief we have not created a separate database but rather taken the available information and refined it in a way that allows us to cover as many countries in the region as possible regardless of the size of the country and the level of development weighing properly in the model those countries with no capital flows (reporting zeros) and including those null figures as information in the dependent variable
30
Appendix II Variables Definitions and Sources
Variable Description Units Source
Net total flows FDI portfolio and debt net flows See below Billions of US$ IMF African Department database
Net FDI Net foreign direct investment flows (FDI in the reporting economy net of direct investment abroad)
Billions of US$ IMF African Department database
Net portfolio and debt flows Net private portfolio investment and other private flows Includes equity and debt securities as well as all other net private debt creating flows
Billions of US$ IMF African Department database
Total Inflows FDI portfolio and debt inflows See below Billions of US$ IMF African Department database
FDI Inflows Foreign direct investment in the reporting economy Billions of US$ IMF African Department database
Portfolio and debt inflows Portfolio investment liabilities including equity and debt securities liabilities plus other private capital inflows Includes all other private debt creating flows (Liabilities excludes monetary authorities and government)
Billions of US$ IMF African Department database
CPIA Country Policy and Institutional Assessment Composite index based on sixteen criteria grouped in four categories (i) economic management (ii) structural policies (iii) policies for social inclusion and equity and (iv) public sector management and institutions
1 to 7 World Bank
Financial Institutions Index of capital markets development defined as the sum of four dummy variables Treasury bills treasury bonds corporate bonds and equity markets exist
0 1 2 3 4 with 0 for countries without any market to 4 for countries with all four markets present
Lukonga (forthcoming) and authors calculations
Rule of law The extent to which agents have confidence in and abide by the rules of society and in particular the quality of contract enforcement the police and the courts as well as the likelihood of crime and violence One of the six components of the Governance Indicators
-25 (lower score) to 25 for the highest score
httpinfoworldbankorggovernancewgiindexasp
South Africa and Nigeria Dummy variable 1 for South Africa and Nigeria 0 otherwise 0 1 Authors calculations
Oil exporters Dummy variable 1 for Angola Cameroon Chad Congo Rep of Equatorial Guinea Gabon and Nigeria 0 otherwise
0 1 IMF African Department database
Real GDP growth Real GDP growth Calculated as the percent change of the constant Gross domestic product in 2000 local currency units Measure of quality of macroeconomic policies
Percent IMF World Economic Outlook
Secondary enrollment Total enrolment in secondary level of education regardless of age expressed as a percentage of the population in the official age group corresponding to this level of education
Percent World Bank World Development Indicators
2000 per capita GDP Per capita GDP in constant US dollar for the year 2000 Constant 2000 US dollars IMF World Economic Outlook
Capital account openness De jure capital account openness index as the simple average of four dummy variables representing exchange rate arrangements payments restrictions on current and capital transactions and
t i ti i t f t di A l f
Index Chinn-Ito forthcoming
Trade openness Sum of exports and imports of goods and non-factor services over GDP
Percent of GDP IMF World Economic Outlook
British legal origin Dummy variable that takes the value 1 for former British colonies and 0 otherwise
0 1 La Porta et al (1999)
Ethno linguistic fragmentation
Average value of five different indices of ethno linguistic fractionalization
Index La Porta et al (1999)
Latitude Measure of the closeness to the equator Miles La Porta et al (1999)
Appendix II Variables Definitions and Sources
31
Overvaluation Residual of a simple panel regression between the nominal exchange rate (local currency per US dollar) Vs the PPP valuation of the exchange rate The regression includes 182 countries The overvaluation measure in normalized to be 1 for the world
Deviation from equilibrium between PPP and market rate with 1 defined as the norm
IMF African Department database
GDP in dollars GDP in dollars (Converted at the nominal market exchange rate) Billions of US$ IMF World Economic Outlook
Per capita GDP in dollars Per capita GDP (constant 2000 US dollar) Constant 2000 US dollars IMF World Economic Outlook
Inflation Headline consumer price index (Average annual percent change) Percent IMF World Economic Outlook
Government balance General government balance excluding grants Percent of GDP IMF World Economic OutlookCredit Total credit to the private sector in percent of GDP Percent of GDP IMF International Financial StatisticsCurrent account Current account balance excluding grants Percent of GDP IMF African Department databaseREER Real effective exchange rate weighted index using total trade
(exports and imports composition for 1999 to 2001) and consumer price indices
Percent IMF Information Notice System
NEER Nominal effective exchange rate weighted index using total trade (exports and imports composition for 1999 to 2001)
IMF Information Notice System
US Tbill rate United States Treasury bill rate Percent IMF International Financial StatisticsTerms of trade Terms of trade (Exports prices to import prices goods and services) Percent IMF World Economic Outlook
Rest of the world real GDP Rest of the world real GDP growth (Weighted by country exports) Percent IMF World Economic Outlook
Oil prices Price of oil Simple average of Texas Dubai and Brent prices deflated by the manufacturing unit cost index
Percent IMF World Economic Outlook
Domestic savings Total domestic savings Percent of GDP IMF World Economic OutlookInvestment Total private investment Percent of GDP IMF World Economic Outlook
Reserves Stock of international reserves (US dollar billions) Billions of US$ IMF World Economic Outlook
Non-fuel commodity prices Real non-fuel commodity price (Weighted by country specific exports deflated by the manufacturing unit price)
Percent IMF World Economic Outlook
Population Population Millions IMF World Economic OutlookContract enforcement Efficiency of contract enforcement by following the evolution of a
sale of goods dispute and tracking the time cost and number of procedures involved from the moment the plaintiff files the lawsuit until actual payment
Number of procedures httpwwwdoingbusinessorg
Constraint on the executive Index that ranks from 1 (unlimited authority to the executive) to 7 (Executive parity or subordination) as decribed in the Freedom House Index
1 to 7 httpwwwfreedomhoseorg and Polity IV Databse at wwwsystemicpeaceorg politypolity4htm
ICRG ranking International Country Risk Guide rank for each country is based on three components of risk analysis Political financial and economic components The higher the rating the lower the risk for that particular country The index covers 140 countries
0 to 100 wwwprsgroupcom
Appendix II Variables Definitions and Sources (Contd)
32
Appendix III Determinants of Capital Flows Descriptive Statistics and Correlations
Total inflows FDI inflows Portf amp debt Share of FDI Total inflows FDI inflows Portf amp debt Total inflows FDI inflows Portf amp debt
Financial Institutions 031 033 026 008 002 -005 019 -012 -011 -006004 003 009 062 088 074 022 044 050 070
Rule of Law -021 -029 -015 003 013 005 027 -007 -009 000018 006 034 083 042 077 007 065 058 099
Market size 087 093 074 000 005 -003 021 -006 -004 -005000 000 000 099 077 084 019 069 079 074
Oil exporter 010 043 -004 045 019 027 -005 034 054 -019052 000 078 000 023 008 075 003 000 022
Real GDP growth 012 039 000 034 028 041 -010 055 070 -005043 001 099 003 007 001 052 000 000 077
Secondary enrollment 036 019 039 003 060 044 081 009 011 000002 023 001 083 000 000 000 057 050 099
Log 2000 GDP per capita 027 020 026 027 063 052 070 011 026 -020008 019 009 008 000 000 000 049 009 020
Capital account openness -007 -005 -007 -004 012 006 022 007 001 011066 073 068 079 046 072 016 066 094 049
Trade openness -017 -017 -015 011 014 015 008 013 017 -003027 027 034 050 036 033 059 042 027 086
UKleg 027 028 023 016 -010 -011 -005 -010 -004 -011008 007 014 031 052 048 076 053 078 047
Ethling 015 021 011 012 006 004 009 -005 001 -010033 018 048 044 069 080 055 077 094 053
LAT -011 -012 -009 039 -004 -006 002 -015 -005 -020050 046 057 001 080 068 088 032 073 020
Pop_dens 000 -003 002 -047 -004 -005 -002 004 -023 037099 085 093 000 080 075 089 081 018 003
Note pairwise correlation coefficient reported in first row significance level reported in second row Source Authors calculations
Appendix Table III2 Bivariate Correlations of Capital Flows with Independent Variables
(US$ mn) (per capita) (in percent of GDP)
1 Dependent variables Observations Minimum Maximum Mean MedianStandard Deviation
Total inflows 43 63 162106 8265 2339 25410FDI inflows 43 00 42371 3598 909 8027Portfolio and debt inflows 43 00 130724 4666 1021 19786Total inflows per capita 43 35 16250 1291 255 3078FDI inflows per capita 43 00 11653 826 105 2325Portfolio and debt inflows pc 43 00 5906 465 147 1038Total inflows to GDP 43 11 307 81 62 65FDI inflows to GDP 43 00 290 42 24 53Portfolio and debt inflows to GDP 43 00 187 39 32 36
2 Explanatory variablesFinancial institutions 43 00 40 18 10 16Rule of law 43 -18 08 -07 -07 06Market size 43 00 10 00 00 02Oil exporter 43 00 10 02 00 04Real GDP growth 43 -04 201 48 42 36Secondary enrollment 42 82 1079 342 283 226Log of 2000 GDP per capita 43 45 90 61 58 11Capital account openness 43 -16 25 -05 -11 13Trade openness 43 369 1559 818 789 3043 Alternative measures of institutions and instrumentsCPIA 42 18 43 32 32 06Doing Business Index 43 303 1760 1321 1487 410ICRG ranking 28 483 808 614 605 73Legal rights 43 10 80 40 35 16Property rights 41 14 45 30 30 06Constraint on the executive 40 17 70 41 43 16British legal origin 43 00 10 03 00 05Ethnolinguistic fragmentation 42 00 10 06 07 03Population density in 1500 36 01 250 38 20 55Latitude 43 00 07 01 01 01Source Authors calculations
Appendix Table III1 Descriptive Statistics for Regression Variables
33
Fin Instit Rule of Law Market size Oil exporter Real GDP growth Second Enr Log 2000 GDP pc Capital open Trade openTotal inflows
Financial Institutions 100
Rule of Law 042 100000
Market size 032 -023 100004 015
Oil exporter -022 -034 020 100016 002 019
Real GDP growth 008 001 012 047 100060 095 044 000
Secondary enrollment 040 049 027 -008 -012 100001 000 008 063 044
Log 2000 GDP per capita 034 039 018 024 000 083 100002 001 025 012 098 000
Capital account openness 034 019 -006 -020 -005 031 020 100003 021 071 021 074 005 030
Trade openness -015 -008 -022 003 -010 008 010 -001 100035 061 017 085 054 061 060 096
Note Pairwise correlation coefficients reported in first row significance level reported below Source Authors calculations
Appendix Table III3 Bivariate Correlations of Baseline Regression Variables
Financial inst CPIA indexDoing
Business ICRG ranking Legal rightsRule of
law Property rightsConstraint on the executive
British legal origen
Ethnoling fragmentation Latitude
Population density
Financial institutions 100
4300
CPIA index 063 100000
4200 4200
Doing Business index -060 -044 100000 000
4300 4200 4300
ICRG ranking 029 040 -069 100013 003 000
2800 2800 2800 2800
Legal rights 061 046 -061 020 100000 000 000 030
4300 4200 4300 2800 4300
Rule of Law 042 063 -069 082 034 100000 000 000 000 003
4300 4200 4300 2800 4300 4300
Property rights 057 081 -064 070 046 081 100000 000 000 000 000 000
4100 4100 4100 2700 4100 4100 4100
Constraint on the executive 044 041 -051 016 042 049 055 100000 001 000 043 001 000 000
4000 3900 4000 2800 4000 4000 3800 4000
British legal origin 059 040 -055 031 069 021 036 028 100000 001 000 011 000 018 002 008
4300 4200 4300 2800 4300 4300 4100 4000 4300
Ethnolinguistic fragmentation 017 -015 005 -032 014 -029 -018 002 011 100027 036 074 010 038 006 028 093 050
4200 4100 4200 2800 4200 4200 4000 3900 4200 4200
Latitude 009 016 -028 037 013 030 029 019 011 001 100058 032 007 006 041 005 007 025 049 094
4300 4200 4300 2800 4300 4300 4100 4000 4300 4200 4300
Population density -014 -002 021 -025 -045 -023 -011 -018 -018 -043 -037 100042 090 022 022 001 017 052 031 028 001 003
3600 3600 3600 2500 3600 3600 3600 3500 3600 3500 3600 3600Note Pairwise correlation coefficients reported in first row significance level reported in the second row and number of observation in the third row Source Authors calculations
Appendix Table III4 Bivariate Correlations of Measures of Institutions and Instruments
34
Appendix IV Private Capital Flows and Growth
Variable Number of
observations MeanStandard deviation Min Max
Real GDP growth 43 48 36 -04 201Initial per capita GDP 43 61 11 45 90Net total flowsGDP 43 37 74 -109 271Net total flows per capita 43 547 2782 -5006 12323Total inflowsGDP 43 77 57 10 282Total inflows per capita 43 1311 3139 35 16450Overvaluation 43 11 03 07 17Domestic savings 42 122 200 -247 813Investment 42 216 87 87 469Contract enforcement 43 1014 66 826 1133Source Authors calculations
Appendix Table IV1 Private Capital Flows and Growth Summary Statistics for Multivariate Regression
Rea
l GD
P gr
owth
Initi
al p
er
capi
ta G
DP
Net
flow
sG
DP
Net
flow
s pe
r ca
pita
Inflo
ws
GD
P
Inflo
ws
per
capi
ta
Ove
rval
uatio
n
Dom
estic
sa
ving
s
Inve
stm
ent
Con
tract
en
forc
emen
t
Real GDP growth 100
Initial per capita GDP 000 100
NetflowsGDP 038 -013 100
Netflows per capita 037 028 067 100
InflowsGDP 049 016 076 066 100
Inflows per capita 028 063 042 087 061 100
Overvaluation -032 -021 -011 -003 -024 -016 100
Domestic savings 048 058 013 029 028 048 -036 100
Investment 045 045 014 039 045 051 -026 042 100
Contract enforcement 018 -007 -024 -018 -017 -013 -015 010 -012 100Note indicates significant at 10 percentSource Authors calculations
Appendix Table IV2 Private Capital Flows and Growth Pairwise Correlations for Multivariate Regression
35
References
Acemoglu D and S Johnson 2005 ldquoUnbundling Institutionsrdquo Journal of Political
Economy Vol 113 No 5 pp 949995 Acemoglu D Johnson S and D Robinson 2002 ldquoReversal of Fortune Geography and
Institutions in the Making of the Making of the Modern World Income Distributionrdquo Quarterly Journal of Economics pp 12311294
Albuquerque R 2003 ldquoThe Composition of International Capital Flows Risk Sharing
Through Foreign Direct Investmentrdquo Journal of International Economics Vol 61 pp 353ndash383
Alfaro L and A Charlton 2007 ldquoInternational Financial Integration and Entrepreneurial
Firm Activityrdquo NBER Working Paper No 13118 (Cambridge Massachusetts National Bureau of Economic Research)
mdashmdashmdash S Kalemli-Ozcan and V Volosovych 2005a ldquoCapital Flows in a Globalized
World The Role of Policies and InstitutionsrdquoNBER Working Paper No 11696 (Cambridge Massachusetts National Bureau of Economic Research)
mdashmdashmdash 2005b ldquoWhy Doesnrsquot Capital Flow from Rich to Poor Countries An Empirical
Investigationrdquo NBER Working Paper Series No 11901 (Cambridge Massachusetts National Bureau of Economic Research)
Auty R M ed 2001 Resource abundance and Economic Development Improving the
Performance of Resource-Rich Countries (Oxford Oxford University Press) mdashmdashmdash and A Gelb 2001 ldquoPolitical Economy of Resource-Abundant Statesrdquo in Resource
abundance and Economic Development Improving the Performance of Resource-Rich Countries ed by R M Auty (Oxford Oxford University Press)
Becker T O Jeanne P Mauro J D Ostry and R Ranciegravere 2007 Country InsurancemdashThe Role of Domestic Policies IMF Occasional Paper No
254 (Washington International Monetary Fund) Bekaert G Campbell R H and C Lundblad 2005 ldquoDoes Financial Liberalization Spur
Growthrdquo Journal of Financial Economics Vol 77 (July) Chinn MD and H Ito 2007 ldquoA New Measure of Financial Opennessrdquo Available via the
Internet at wwwsscwiscedu7Emchinnresearchhtml
36
Chinn MD and H Ito 2006 ldquoWhat Matters for Financial Development Capital Controls Institutions and Interactionsrdquo Journal of Development Economics Vol 81 (October) pp 163ndash92
Chinn MD Ito H 2002 ldquoCapital Account Liberalization Institutions and Financial
Development Cross-Country Evidencerdquo NBER Working Paper Series No 8967 (Cambridge Massachusetts National Bureau of Economic Research)
DellAriccia G Di Giovanni J Faria A Kose M A Mauro P Schindler M Terrones M and J D Ostry 2008 ldquoReaping the Benefits of Financial Globalizationrdquo IMF Occasional Paper No 264 (Washington International Monetary Fund)
Dorsey T E Tadesse H Singh S and Z Brixiova 2008 ldquoThe Landscape of Capital
Flows to Low-Income Countriesrdquo IMF Working Paper 0851 (Washington International Monetary Fund)
Edison H Klein M W Ricci L A and T Slok 2004 ldquoCapital Account Liberalization
and Economic Performance Survey and Synthesisrdquo IMF Staff Papers Vol 51 No 2 pp 220256
Faria A and P Mauro 2004 ldquoInstitutions and the External Capital Structure of Countriesrdquo
IMF Working Paper 04236 (Washington International Monetary Fund) mdashmdashmdash Minnoni M and AZaklan 2006 ldquoThe External Financing of Emerging Market
Countries Evidence from Two Waves of Financial Globalizationrdquo IMF Working Paper 06205 (Washington International Monetary Fund)
Glaeser E L and A Shleifer 2002 ldquoLegal Originsrdquo Quarterly Journal of Economics
Vol117 pp 1193ndash1229 Gourinchas P-O and O Jeanne 2007 ldquoCapital Flows to Developing Countries The
Allocation Puzzlerdquo NBER Working Paper No 13602 (Cambridge Massachusetts National Bureau of Economic Research)
International Monetary Fund 2007 Global Financial Stability Report (Washington
October) mdashmdashmdash 2008 Regional Economic Outlook Sub-Saharan Africa (Washington September) Ju J and S-J Wei 2007 ldquoDomestic Institutions and the Bypass Effect of Financial
Globalizationrdquo NBER Working Paper No 13148 (Cambridge Massachusetts National Bureau of Economic Research)
37
mdashmdashmdash 2006 ldquoA Solution to Two Paradoxes of International Capital Flowsrdquo NBER Working Paper No 12668 (Cambridge Massachusetts National Bureau of
Economic Research) Karl T L 1997 The Paradox of Plenty Oil Booms and Petro-States (Berkeley University
of California Press) Kaufmann D Kray A and M Mastruzzi 2008 ldquoGovernance Matters VII Aggregate and
Individual Governance Indicators 1996-2007rdquo Policy Research Working Paper No 4654 (Washington DC World Bank Group)
Klein MW 2005 ldquoCapital Account Liberalization Institutional Quality and Economic
Growth Theory and Evidencerdquo NBER Working Paper No 11112 (Cambridge Massachusetts National Bureau of Economic Research)
Kose M A Prasad E Wei S-J and K Rogoff 2006 ldquoFinancial Globalization A
Reappraisalrdquo IMF Working Paper 06189 (Washington DC International Monetary Fund)
Lane P R 2004 ldquoEmpirical Perspectives on Long-Term External Debtrdquo Topics in Macroeconomics Vol 4 No 1 httpwwwbepresscombejmtopicsvol4iss1art1 La Porta R F Lopez-de-Silanes A Shleifer and R W Vishny 1999 ldquoThe Quality of
Governmentrdquo Journal of Law Economics and Organization Vol 15 pp 222ndash79 Lukonga forthcoming ldquoFinancial Market Development Survey of Sub-Saharan African
Countriesrdquo mimeo Mauro P Minnoni M and AZaklan 2006 ldquoThe External Financing of Emerging Market
Countries Evidence from Two Waves of Financial Globalizationrdquo IMF Working Paper 06205 (Washington International Monetary Fund)
Miniane J 2004 ldquoA New Set of Measures on Capital Account Restrictionsrdquo IMF Staff Papers Vol 51 No 2 pp 276ndash308 Mishkin F S 2006 The Next Great Globalization How Disadvantaged Nations can
Harness their Financial Systems to Get Rich (Princeton NJ Princeton University Press)
Obstfeld M and A M Taylor 2004 Global Capital Markets Integration Crisis and Growth Cambridge University Press (2004) Portes R and H Rey 2005 ldquoThe Determinants of Cross-Border Equity Flowsrdquo Journal of
International Economics Vol 64 pp269-296 Prasad Eswar S Raghuram G Rajan and Arvind Subramanian 2007 ldquoForeign Capital and Economic Growthrdquo Brookings Papers on Economic Activity 1 Brookings
38
Quinn D P 1997 ldquoThe Correlates of Change in International Financial Regulationrdquo
American Political Science Review Vol 91 (September) pp 531ndash51 mdashmdashmdash and A Maria Toyoda forthcoming ldquoDoes Capital Account Liberalization Lead to
Economic Growthrdquo Review of Financial Studies Rodrick D 2007 ldquoThe Real Exchange Rate and Economic Growth Theory and Evidencerdquo
Harvard University Working Paper httpksghomeharvardedu~drodrikRER20and20growthpdf
mdashmdashmdash and A Subramanian 2008 ldquoWhy did Financial Globalization Disappointrdquo IMF
Staff Papers Vol 56 No 1 (Washington International Monetary Fund) Schindler M 2009 ldquoMeasuring Financial Integration A New Datasetrdquo IMF Staff Papers
Vol 56 No 1 (Washington International Monetary Fund) Schularick M 2006 ldquoA Tale of Two Globalizations Capital Flows from Rich to Poor in
Two Eras of Global Financerdquo International Journal of Finance and Economics Vol11 pp339-354
Schularick M Steger T 2008 ldquoThe Lucas Paradox and the Quality of Institutions Then
and Nowrdquo Berlin University Working Paper N20083 Stone M R Shimizu S Nordstrom A and H J Ferhani 2008 ldquoDeveloping Essential
Financial Markets in Smaller Economies Stylized Facts and Policy Optionsrdquo IMF Occasional Paper No 265 (Washington International Monetary Fund)
World Bank 2007 Global Development Finance The Globalization of Corporate Finance in Developing Countries (Washington World Bank Group)

20
Comparing the second-stage equations with the OLS estimates the impact of financial institutions is overall weaker (smaller coefficients) but remains strong and significant for total inflows and FDI inflows as well as the share of FDI in total inflows Interestingly the property rights variable is never significant and continues to have the ldquowrongrdquo sign in most cases except for FDI inflows and the share of FDI (column 2) perhaps indicating that non-FDI investors believe property rights are not critical for their relatively liquid investments Oil resources is a strong determinant of FDI inflows but not other types of flows whereas it is market size that seems to matter for portfolio and debt inflows When excluding South Africa and Nigeria or oil-rich countries from the estimation results are broadly similar with the coefficient on financial institutions larger particularly in the FDI regressions This indicates that in non-oil sub-Saharan African countries excluding South Africa FDI inflows are significantly larger the more financial markets are developed Perhaps surprisingly property rights protection is insignificant This may be explained by the fact that as FDI is harder to expropriate even countries with poor property rights protection receive FDI Alternatively for these relatively small countries it may be possible for foreign investors to effectively negotiate greater property rights for their FDI than is generally available in the country for other investors Given the small sample size the results must be interpreted with caution but overall they support the importance of unbundling institutions and measuring them more precisely Results also support the notion that for capital flows financial institutions as proxied by capital markets development matter more than basic property rights institutions capital including in the form of FDI will flow less to countries with less developed financial markets against the view presented in Albuquerque (2003) that FDI should flow more to financially constrained countries
IV DO PRIVATE CAPITAL FLOWS HAVE AN IMPACT ON GROWTH IN SSA This section undertakes a preliminary analysis of the relationship between capital inflows and growth in sub-Saharan Africa Significant capital flows to African countries are a relatively recent phenomenon and as noted above have so far been restricted to a limited number of markets Given the general inconclusiveness of the empirical evidence on the links between growth and capital flows from emerging markets that have been on the radar of international investors much longer than most African markets it is perhaps too early to expect robust econometric results with the particular sample in this paper While it is easy to make a theoretical case for the positive impact of capital flows on growth the empirical verification of this impact has proved much more challenging11 Alternate
11 See Edison and others 2004 Kose and others 2006 DellrsquoAricia and others 2008 and Prasad Rajan and Subramanian 2007 for comprehensive reviews of the empirical literature on the impact of capital flows Though evidence from empirical studies using aggregate data is inconclusive studies that use measures of de facto
(continuedhellip)
21
explanations to this empirical puzzle have predicated the gains from capital flows on the threshold development of certain domestic institutions andor proposed that such flows generate certain indirect or collateral benefits even when their direct impact on growth is difficult to gauge Klein (2005) finds support for a model in which institutional quality intermediates the impact of capital account liberalization on growth by affecting the extent to which savings are protected from expropriation and the premium borrowers pay for funds from abroad In countries with better institutions capital account openness has a significant positive impact on growth Bekaert Harvey and Lundblad (2005) find that the largest growth response to equity market liberalizations accrues to countries with better legal systems above-average financial development and better-quality institutions in terms of investor protection and accounting standards Using industry-level data Prasad Rajan and Subramanian (2007) indicate that for countries that have above-median levels of financial development foreign capital aids the relative growth of those industries dependent on finance But for countries below the median for financial development the effect of foreign capital inflows is diametrically opposite Using firm-level data Alfaro and Charlton (2007) find a significant relationship between entrepreneurial activity and both de jure and de facto international capital integration Their results suggest that foreign capital may improve access to capital either directly or through improved domestic financial intermediation
Recent evidence however indicates that countries that grow more rapidly are those that rely less and not more on foreign capital and in turn foreign capital tends to flow to countries that experience not high but low productivity growth (Prasad Rajan and Subramanian (2007) Gourinchas and Jeanne (2007)) One possible explanation for this puzzle is trade fast-growing countries also are the ones that experienced a takeoff in their export sector (Gourinchas and Jeanne 2007) If capital inflows lead to higher prices for nontraded goods owing to absorptive capacity constraints and thus to overvaluation they will have a negative impact on exports and hence growth (Kose and others 2006 Prasad Rajan and Subramanian 2007) Another explanation is that inflows from abroad that supplement domestic savings will have a limited impact in an economy where the binding constraint is the scarcity of viable investment opportunities (Rodrik and Subramanian 2009)
We estimate the gains from financial globalization using the same cross-section sample of average flows for the 2000-07 period as in the preceding section However in this section we also make use of data on net flows For most African countries the differences between net and total capital flows are not often vast nevertheless the economic impact of such flows depends on the actual infusion of foreign capital rather than gross flows Also we scale net flows to the size of the economy by alternatively dividing them by population or GDP
integration or finer measures of de jure integration tend to find more positive results Studies using micro data are also better able to find growth and productivity gains from financial integration
22
A Correlation Analysis
We begin the correlation analysis with a simple mapping between economic growth and capital flows in sub-Saharan Africa while not drawing any inferences about the direction of causation
12 The scatter plots indicate a generally positive correlation between growth and capital flows in our sample13 Consistent with the findings in the literature the relationship is more pronounced when only FDI flows are considered
Figure 7 Sub-Saharan Africa Capital Flows and Real GDP Growth
Capital Flows and Real Growth(net total flows to population)
-600
-500
-400
-300
-200
-100
0
100
200
300
-2 0 2 4 6 8 10 12 14
Capital Flows and Real Growth(net total flows to GDP)
-15
-10
-5
0
5
10
15
20
25
30
-5 0 5 10 15 20 25
FDI and Real Growth(net FDI to population)
0
20
40
60
80
100
120
140
160
180
-2 0 2 4 6 8 10 12 14
FDI and Real Growth(net FDI to GDP)
-5
0
5
10
15
20
25
30
-5 0 5 10 15 20 25
Note All variables are the average value of the 2000-07 period Where normalized over population the charts exclude the outliers Equatorial Guinea and Seychelles Table 5 provides further evidence of the positive significant correlation between capital flows to sub-Saharan Africa and real GDP growth in the recipient countries This relationship however does not hold when capital flows are disaggregatedmdashwhile FDI is positively correlated with growth portfolio and debt-creating flows are generally inversely related to growth though
12 As mentioned in the previous section in analyzing the relationship between growth and capital flows the latter are normalized over either the population or GDP of the recipient country All variables are considered at their average values over the 2000-07 period to deal with annual volatility 13 This is in contrast with Rodrick and Subramanian (2008) who in a sample of 110 developing countries running through 2004 do not find any relationship between financial globalization (measured as the sum of foreign assets and liabilities as a share of GDP) and growth
23
not significantly so This finding is also consistent with evidence from other studies(DellrsquoAricia and others 2008)
B Testing channels of transmission of private capital flows on growth Another approach to gauging the likely impact on capital inflows on growth is to test the various channels described in the literature on financial globalization and growth Three broad channels are identified as linking capital inflows and growth
bull Overvaluation to the extent that capital inflows cause currency appreciation they hurt exports and thus dampen growth This channel is well-documented in Rodrick (2007) but also discussed in Prasad et al (2007)
bull Savings and investment where foreign capital supplements domestic savings it fosters growth However this would only be true for economies where the main constraint on growth is a lack of savings Where the main hindrance to economic growth is the scarcity of viable investment opportunities additional foreign capital will only add to domestic distortions (Gourinchas and Jeanne 2007 Rodrick and Subramanian 2009)
bull Institutional development a number of studies argue that capital inflows carry indirect (collateral) benefits for recipient countries via the development of domestic institutions (Becker and others 2007 Kose and others 2006) or more particularly financial sector institutions (Mishkin 2006)
The testing methodology employed here utilizes correlations as well via bivariate regressions In the first stage the bivariate model regresses capital flows on the channel of interest If the first stage results indicate that the channel is significantly correlated with capital flows then in the second stage the model regresses the predicted value of the channel
Real GDP Growth
Net Total FlowsGDP
FDI FlowsGDP
Debt FlowsGDP
Portfolio FlowsGDP
Real GDP Growth 100Net Total FlowsGDP 038 100FDI FlowsGDP 066 054 100Debt FlowsGDP -002 072 -007 100Portfolio FlowsGDP -006 031 -010 002 100
Real GDP Growth
Net Total Flows per
capitaFDI Flows per capita
Debt Flows per capita
Portfolio Flows per capita
Real GDP Growth 100Net Total Flows per capita 037 100FDI Flows per capita 044 089 100Debt Flows per capita 008 053 022 100Portfolio Flows per capita -007 025 -001 -006 100Note indicates significant at 10 percentSource Authors calculations
Table 5 Correlations Net Capital Flows and Real Growth
24
from the first regression ie that part of the channel variable correlated with capital flows on growth If the coefficient in the second regression is significant and with the expected sign it implies that the channel is likely to be operational for this particular sample of countries Evidence that a particular channel could be at work is not sufficient to demonstrate the impact of private capital flows on growth but it is a necessary first step Thus Yi = α1 + β Ki + u1 (1) gi = α 2 + η Ŷi + u2 (2) Where Yi is the channel variable of interest Ki are capital flows normalized over GDP or population gi is the real GDP growth rate and Ŷi is the predicted value of the channel variable of interest derived from the first regression All variables are in their level values so that sign and significance of β and η are of greater interest than their magnitude The results are presented in Table 6 below
Overvaluation InvestmentDomestic
Savings InstitutionsNet flowsGDP -0004 0164 0337 -0214Net flows per capita -000003 0012 0021 -00042Note and indicate significant at 1 and 5 percent respectivellySource Authors calculations
Table 6 Channels of Transmission Between Capital Flows and Growth
The findings indicate that in most instances capital flows are not significantly correlated with the channel variables in our sample Except when capital flows are scaled to the size of the recipient countryrsquos population mdash both savings and investment are positively and significantly related to capital flows in this instance14 This implies that for SSA countries the impact of private capital flows on growth could be partly intermediated through the impact of net capital flows on domestic savings and investment Another implication would also be that African economies are not necessarily investment-constrained15 14 As expected the impact of the predicted values of investment and domestic savings in the second stage regressions is positive
15 Rodrik and Subramanian (2009) define an economy to be savings-constrained when private investment is low despite the existence of many privately profitable projects because credit is either not available or too costly and to be investment-constrained when credit is available but there is a lack of profitable investment opportunities (p12) In savings-constrained economies foreign capital will supplement scarce domestic savings (evidenced by high real interest rates) and lead to increased investment In investment-constrained economies real interest rates will be low and additional capital flows will finance consumption rather than investment
25
In an unexpected outcome the institutional variable is negatively related to growth a result that holds even when oil-exporters are excluded from the sample (not shown)
C How do Private Capital Flows Affect Growth Going beyond bivariate correlations we first present a simple cross-country multivariate regression model making use of a averages for the 2000-07 period 16 Although this method is not without shortcomings the limited time coverage of our dataset and year-on-year volatility dampens the usefulness of panel estimation However our analysis is subject to the considerable limitations of the ordinary least squares estimator in growth models mdash especially those arising from endogenous variables We fit a simple ordinary least squares specification to estimate the relationship between capital flows and growth gi = α + β Ki + η Xi + ui Where gi is real GDP growth Ki are capital flows normalized over GDP or population Xi is a set of control variables and ui is an independent error term In our choice of control variables we are guided by the ldquochannelsrdquo analysis from the preceding section since our interest in primarily in the impact of capital flows on growth Thus our multivariate model is essentially a simultaneous test of the correlations between of the various channel variables (plus capital flows directly) and growth As discussed above other factors shown in the literature on financial globalization to influence growth include savings and investment exchange rate overvaluation and institutions The exchange rate overvaluation measure is constructed as the ratio of the nominal exchange rate to the purchasing power parity exchange rate17 The measure of institutions used here is the number of procedures to enforce a contract (Contracts) from the World Bankrsquos Doing Business database We also control for level of economic development by including the log of initial per capita real GDP growth The results are documented in Table 7
16 See Appendix Table IV1 and Appendix Table IV2 for summary statistics and correlations for the variables included here 17 More precisely the variable is the residual of a simple panel regression between the nominal exchange rate (local currency per US dollar) versus the PPP valuation of the exchange rate The regression was run for all countries in the world and the variable is normalized to be 1 for the world as a whole
26
[1] [2] [3] [4]Initial per capita GDP (log) -153 -186 -167 -216
(-311) (-403) (-362) (-415)Overvaluation -082 -153 -068 -125
(-045) (-084) (-038) (-068)Domestic savings 009 010 009 010
(339) (359) (361) (362)Investment 018 016 015 017
(333) (293) (258) (297)Contract enforcement 011 009 009 008
(164) (142) (153) (123)Net total flowsGDP 011
-194Net total flows per capita 0003
205Total inflowsGDP 018
(227)Total inflows per capita 0003
(147)Constant -106 412 054 629
(-013) (054) (007) (080)
Adjusted R2 051 052 053 057Number of observations 42 42 42 42Note and indicate significant at 1 5 and 10 percent respectivelly t-statistics in parenthesis
Table 7 Estimation Results Linear Growth Model with Capital Flows
The results indicate that capital flows are positively and significantly (in all but one instance) associated with growth Initial per capita GDP comes in with a negative and significant coefficient in all specifications indicating support for growth convergence Domestic savings and investment are the other significant right-hand side variables that also come in with the expected sign Contract enforcement the proxy for institutional development is not significant in any of the specifications Overvaluation has the expected sign but is never significant Estimating the equation with measures of net FDI instead of total net private capital yields similar results with an even stronger association between the FDI variable and growth Aside from the positive correlations and partial evidence of a possible through the savings-investment channel our analysis is rendered incomplete by the short time period since these inflows began While the limited number of observations in our sample required us to focus on average growth and inflows over the period 2000-2007 most of the inflows came late in this period This is an issue which requires further study as additional observations (years) become available As described in Section II the observed rise in private capital flows and growth during the sample period is an important necessary condition in particular because other studies even fail to uncover such an association for different country groups andor sample periods However it is also far from sufficient for making inferences about causality
27
V CONCLUSION
As a result of the global financial crisis and recession private capital flows to all regions of the world have declined Even when the international economy recovers and financial markets return to health it is likely that investors will remain for some time more risk-averse than they were previously At the same time donor flows to low-income countries including those in sub-Saharan Africa are likely to be adversely impacted by these global developments Our results were inconclusive regarding the impact of private capital flows on growth in SSA countries Additional research will be needed before a definitive statement can be made in this regard once additional observations are available However most SSA countries are likely to remain dependant on financial inflows in some form to help finance current account deficitsmdashdeficits that will be the counterpart of development-oriented investments in these economies As donor flows are likely to be restricted in the coming years due to the fiscal problems the traditional donor countries find themselves confronting SSA countries will need private capital flows to finance these current account deficits The alternative would require smaller or no current account deficits meaning reduced development-oriented investments in infrastructure and other key areas with adverse consequences for growth potential All this means that policy makers in SSA will need to pay increasing attention to efforts to attract private capital to their countries Our results indicate that one of the most important things policy makers can do to attract private capital is to strengthen domestic capital markets Deep and well-functioning money foreign exchange equity and (where relevant) derivative markets are key to attracting private capital Governments in SSA countries would be well-advised to redouble their efforts to develop and strengthen these markets to put their countries in a position to attract private capital in the future At the same time an important of the current financial crisis should also be to put in place strong monitoring regulatory and supervisory frameworks to avoid a buildup of balance-sheet vulnerabilities
28
Appendix I Capital Flows Data The information on private capital flows is based on detailed balance of payments data obtained from AFR country desk economists in late 2007 for 44 sub-Saharan African countries Data for 2000-2006 are actual and data for 2007 are preliminary estimates The data distinguishes between FDI portfolio (debt and equity) and private debt-creating flows and between inflows and outflows The definition of capital inflows adopted for this study differs from other papers using balance of payments data as a measure of capital flows (see Appendix Box I1 for precise definitions used in the paper) Appendix Box I1 Balance of payments recording of capital flows
From the perspective of the financial account one usually thinks of changes in liabilities as positive (inflows) and changes in assets as negative (outflows) In practice both changes in liabilities and assets are reported as net of any disinvestment and consequently both can have any sign In the BOP accounts an increase (decrease) in liabilities to nonresidents is entered as positive (negative) while an increase (decrease) in net foreign assets held by residents is entered as negative (positive) If a resident sells an asset held abroad the transaction is recorded as a reduction in net foreign assets held by residents bringing an inflow of capital For this study capital inflows (outflows) are taken to be the sum of increases (decreases) in liabilities to non-residents and of decreases (increases) in net foreign assets held by residents in a year This allows to capture all transactions that give rise to a inflow of capital into a country on the liability and asset side and avoids negative ldquoinflowsrdquo Net flows of capital are calculated as the sum of the inflows (positive sign) and outflows (negative sign)
This data differs from other published data sources with respect to its timeliness coverage and level of detail bull The 2000-2007 period covers the most recent episode of private capital inflows to
sub-Saharan Africa which took off around 2005-2006
bull It covers 43 sub-Saharan African countries
bull It allows to distinguish between different types of private capital flows (FDI portfolio flows and debt-creating flows) In contrast with other studies (eg Faria and Mauro 2004) that add together FDI and portfolio equity flows we keep them separate and group portfolio debt and equity (either category is too small to stand on its own) We are interested in the determinants of various types of flows particularly as regards the development of financial markets and straight FDI doesnrsquot require any particular type of financial market infrastructure However portfolio debt and equity investment require the existence of bond and equity markets
Other data sources that cover all sub-Saharan African countries include the IMFrsquos WEO IFS Balance of payments data and the World Bankrsquos global development finance data Another
29
widely used data base is the Lane-Milesi-Ferretti data but the most recent updated version goes until 2005 and covers only a sub-set SSA countries Another group of studies use current account data as a proxy for capital flows (Prasad et al 2007 Gourinchas and Jeanne 2007) ndash which have the advantage of providing wide coverage in terms of years and countries but make it impossible to disaggregate between official and private transfers and different types of capital flows The Fundrsquos World Economic Outlook (WEO) database and the World Bankrsquos Global Development Finance (GDF) database provide the most comprehensive coverage of capital flows to sub-Saharan countries These data sets have few missing countries and few missing observations for the countries that are in the data sets However the comprehensiveness of the WEO and the GDF databases is achieved at a price as each data set relies on Fund and Bank staff estimates to fill in the lacunae left from official statistics (Dorsey et al 2008) Other data sets such as the Fundrsquos International Financial Statistics and the Balance of Payments Statistics databases rely on official reporting without the use of staff estimates to fill in the gaps The more detailed and comprehensive coverage of the international transactions at the country level is available in the Balance of Payment Statistics published once a year by the IMF Although information for most of the sub-Saharan African countries is included in the publication the most recent database shows a complete set of annual data for just 18 out of 44 countries in the region mostly the middle-income countries two oil-exporters and the largest low-income economies among them The other countries have missing data either for the capital flows components or some years specially at the end of the period covered in the study which is crucial for the econometric analysis The work of the country desk economists was essentially to make sure that all series were available and the components were consistent with the main aggregates We checked also consistency across the different published databases finding discrepancies mostly in the last few years of the sample and few revisions to historical numbers in the early 2000rsquos for the countries with data in the various publications Looking into the World Economic Outlook database there is a full coverage of the countries in the region but it is difficult to separate actual figures from the forecasted ones or estimates (specially for countries with lags in reporting official data from the authorities) and programs with the Fund requiring accurate estimates on the missing BOP data embedded in the Program We used the WEO data which are also reported by country desk economist in the Fund as a starting point and asked the desk economists to look into the details and components that are normally not used in the aggregated analysis of the external accounts offered in the WEO studies and data In brief we have not created a separate database but rather taken the available information and refined it in a way that allows us to cover as many countries in the region as possible regardless of the size of the country and the level of development weighing properly in the model those countries with no capital flows (reporting zeros) and including those null figures as information in the dependent variable
30
Appendix II Variables Definitions and Sources
Variable Description Units Source
Net total flows FDI portfolio and debt net flows See below Billions of US$ IMF African Department database
Net FDI Net foreign direct investment flows (FDI in the reporting economy net of direct investment abroad)
Billions of US$ IMF African Department database
Net portfolio and debt flows Net private portfolio investment and other private flows Includes equity and debt securities as well as all other net private debt creating flows
Billions of US$ IMF African Department database
Total Inflows FDI portfolio and debt inflows See below Billions of US$ IMF African Department database
FDI Inflows Foreign direct investment in the reporting economy Billions of US$ IMF African Department database
Portfolio and debt inflows Portfolio investment liabilities including equity and debt securities liabilities plus other private capital inflows Includes all other private debt creating flows (Liabilities excludes monetary authorities and government)
Billions of US$ IMF African Department database
CPIA Country Policy and Institutional Assessment Composite index based on sixteen criteria grouped in four categories (i) economic management (ii) structural policies (iii) policies for social inclusion and equity and (iv) public sector management and institutions
1 to 7 World Bank
Financial Institutions Index of capital markets development defined as the sum of four dummy variables Treasury bills treasury bonds corporate bonds and equity markets exist
0 1 2 3 4 with 0 for countries without any market to 4 for countries with all four markets present
Lukonga (forthcoming) and authors calculations
Rule of law The extent to which agents have confidence in and abide by the rules of society and in particular the quality of contract enforcement the police and the courts as well as the likelihood of crime and violence One of the six components of the Governance Indicators
-25 (lower score) to 25 for the highest score
httpinfoworldbankorggovernancewgiindexasp
South Africa and Nigeria Dummy variable 1 for South Africa and Nigeria 0 otherwise 0 1 Authors calculations
Oil exporters Dummy variable 1 for Angola Cameroon Chad Congo Rep of Equatorial Guinea Gabon and Nigeria 0 otherwise
0 1 IMF African Department database
Real GDP growth Real GDP growth Calculated as the percent change of the constant Gross domestic product in 2000 local currency units Measure of quality of macroeconomic policies
Percent IMF World Economic Outlook
Secondary enrollment Total enrolment in secondary level of education regardless of age expressed as a percentage of the population in the official age group corresponding to this level of education
Percent World Bank World Development Indicators
2000 per capita GDP Per capita GDP in constant US dollar for the year 2000 Constant 2000 US dollars IMF World Economic Outlook
Capital account openness De jure capital account openness index as the simple average of four dummy variables representing exchange rate arrangements payments restrictions on current and capital transactions and
t i ti i t f t di A l f
Index Chinn-Ito forthcoming
Trade openness Sum of exports and imports of goods and non-factor services over GDP
Percent of GDP IMF World Economic Outlook
British legal origin Dummy variable that takes the value 1 for former British colonies and 0 otherwise
0 1 La Porta et al (1999)
Ethno linguistic fragmentation
Average value of five different indices of ethno linguistic fractionalization
Index La Porta et al (1999)
Latitude Measure of the closeness to the equator Miles La Porta et al (1999)
Appendix II Variables Definitions and Sources
31
Overvaluation Residual of a simple panel regression between the nominal exchange rate (local currency per US dollar) Vs the PPP valuation of the exchange rate The regression includes 182 countries The overvaluation measure in normalized to be 1 for the world
Deviation from equilibrium between PPP and market rate with 1 defined as the norm
IMF African Department database
GDP in dollars GDP in dollars (Converted at the nominal market exchange rate) Billions of US$ IMF World Economic Outlook
Per capita GDP in dollars Per capita GDP (constant 2000 US dollar) Constant 2000 US dollars IMF World Economic Outlook
Inflation Headline consumer price index (Average annual percent change) Percent IMF World Economic Outlook
Government balance General government balance excluding grants Percent of GDP IMF World Economic OutlookCredit Total credit to the private sector in percent of GDP Percent of GDP IMF International Financial StatisticsCurrent account Current account balance excluding grants Percent of GDP IMF African Department databaseREER Real effective exchange rate weighted index using total trade
(exports and imports composition for 1999 to 2001) and consumer price indices
Percent IMF Information Notice System
NEER Nominal effective exchange rate weighted index using total trade (exports and imports composition for 1999 to 2001)
IMF Information Notice System
US Tbill rate United States Treasury bill rate Percent IMF International Financial StatisticsTerms of trade Terms of trade (Exports prices to import prices goods and services) Percent IMF World Economic Outlook
Rest of the world real GDP Rest of the world real GDP growth (Weighted by country exports) Percent IMF World Economic Outlook
Oil prices Price of oil Simple average of Texas Dubai and Brent prices deflated by the manufacturing unit cost index
Percent IMF World Economic Outlook
Domestic savings Total domestic savings Percent of GDP IMF World Economic OutlookInvestment Total private investment Percent of GDP IMF World Economic Outlook
Reserves Stock of international reserves (US dollar billions) Billions of US$ IMF World Economic Outlook
Non-fuel commodity prices Real non-fuel commodity price (Weighted by country specific exports deflated by the manufacturing unit price)
Percent IMF World Economic Outlook
Population Population Millions IMF World Economic OutlookContract enforcement Efficiency of contract enforcement by following the evolution of a
sale of goods dispute and tracking the time cost and number of procedures involved from the moment the plaintiff files the lawsuit until actual payment
Number of procedures httpwwwdoingbusinessorg
Constraint on the executive Index that ranks from 1 (unlimited authority to the executive) to 7 (Executive parity or subordination) as decribed in the Freedom House Index
1 to 7 httpwwwfreedomhoseorg and Polity IV Databse at wwwsystemicpeaceorg politypolity4htm
ICRG ranking International Country Risk Guide rank for each country is based on three components of risk analysis Political financial and economic components The higher the rating the lower the risk for that particular country The index covers 140 countries
0 to 100 wwwprsgroupcom
Appendix II Variables Definitions and Sources (Contd)
32
Appendix III Determinants of Capital Flows Descriptive Statistics and Correlations
Total inflows FDI inflows Portf amp debt Share of FDI Total inflows FDI inflows Portf amp debt Total inflows FDI inflows Portf amp debt
Financial Institutions 031 033 026 008 002 -005 019 -012 -011 -006004 003 009 062 088 074 022 044 050 070
Rule of Law -021 -029 -015 003 013 005 027 -007 -009 000018 006 034 083 042 077 007 065 058 099
Market size 087 093 074 000 005 -003 021 -006 -004 -005000 000 000 099 077 084 019 069 079 074
Oil exporter 010 043 -004 045 019 027 -005 034 054 -019052 000 078 000 023 008 075 003 000 022
Real GDP growth 012 039 000 034 028 041 -010 055 070 -005043 001 099 003 007 001 052 000 000 077
Secondary enrollment 036 019 039 003 060 044 081 009 011 000002 023 001 083 000 000 000 057 050 099
Log 2000 GDP per capita 027 020 026 027 063 052 070 011 026 -020008 019 009 008 000 000 000 049 009 020
Capital account openness -007 -005 -007 -004 012 006 022 007 001 011066 073 068 079 046 072 016 066 094 049
Trade openness -017 -017 -015 011 014 015 008 013 017 -003027 027 034 050 036 033 059 042 027 086
UKleg 027 028 023 016 -010 -011 -005 -010 -004 -011008 007 014 031 052 048 076 053 078 047
Ethling 015 021 011 012 006 004 009 -005 001 -010033 018 048 044 069 080 055 077 094 053
LAT -011 -012 -009 039 -004 -006 002 -015 -005 -020050 046 057 001 080 068 088 032 073 020
Pop_dens 000 -003 002 -047 -004 -005 -002 004 -023 037099 085 093 000 080 075 089 081 018 003
Note pairwise correlation coefficient reported in first row significance level reported in second row Source Authors calculations
Appendix Table III2 Bivariate Correlations of Capital Flows with Independent Variables
(US$ mn) (per capita) (in percent of GDP)
1 Dependent variables Observations Minimum Maximum Mean MedianStandard Deviation
Total inflows 43 63 162106 8265 2339 25410FDI inflows 43 00 42371 3598 909 8027Portfolio and debt inflows 43 00 130724 4666 1021 19786Total inflows per capita 43 35 16250 1291 255 3078FDI inflows per capita 43 00 11653 826 105 2325Portfolio and debt inflows pc 43 00 5906 465 147 1038Total inflows to GDP 43 11 307 81 62 65FDI inflows to GDP 43 00 290 42 24 53Portfolio and debt inflows to GDP 43 00 187 39 32 36
2 Explanatory variablesFinancial institutions 43 00 40 18 10 16Rule of law 43 -18 08 -07 -07 06Market size 43 00 10 00 00 02Oil exporter 43 00 10 02 00 04Real GDP growth 43 -04 201 48 42 36Secondary enrollment 42 82 1079 342 283 226Log of 2000 GDP per capita 43 45 90 61 58 11Capital account openness 43 -16 25 -05 -11 13Trade openness 43 369 1559 818 789 3043 Alternative measures of institutions and instrumentsCPIA 42 18 43 32 32 06Doing Business Index 43 303 1760 1321 1487 410ICRG ranking 28 483 808 614 605 73Legal rights 43 10 80 40 35 16Property rights 41 14 45 30 30 06Constraint on the executive 40 17 70 41 43 16British legal origin 43 00 10 03 00 05Ethnolinguistic fragmentation 42 00 10 06 07 03Population density in 1500 36 01 250 38 20 55Latitude 43 00 07 01 01 01Source Authors calculations
Appendix Table III1 Descriptive Statistics for Regression Variables
33
Fin Instit Rule of Law Market size Oil exporter Real GDP growth Second Enr Log 2000 GDP pc Capital open Trade openTotal inflows
Financial Institutions 100
Rule of Law 042 100000
Market size 032 -023 100004 015
Oil exporter -022 -034 020 100016 002 019
Real GDP growth 008 001 012 047 100060 095 044 000
Secondary enrollment 040 049 027 -008 -012 100001 000 008 063 044
Log 2000 GDP per capita 034 039 018 024 000 083 100002 001 025 012 098 000
Capital account openness 034 019 -006 -020 -005 031 020 100003 021 071 021 074 005 030
Trade openness -015 -008 -022 003 -010 008 010 -001 100035 061 017 085 054 061 060 096
Note Pairwise correlation coefficients reported in first row significance level reported below Source Authors calculations
Appendix Table III3 Bivariate Correlations of Baseline Regression Variables
Financial inst CPIA indexDoing
Business ICRG ranking Legal rightsRule of
law Property rightsConstraint on the executive
British legal origen
Ethnoling fragmentation Latitude
Population density
Financial institutions 100
4300
CPIA index 063 100000
4200 4200
Doing Business index -060 -044 100000 000
4300 4200 4300
ICRG ranking 029 040 -069 100013 003 000
2800 2800 2800 2800
Legal rights 061 046 -061 020 100000 000 000 030
4300 4200 4300 2800 4300
Rule of Law 042 063 -069 082 034 100000 000 000 000 003
4300 4200 4300 2800 4300 4300
Property rights 057 081 -064 070 046 081 100000 000 000 000 000 000
4100 4100 4100 2700 4100 4100 4100
Constraint on the executive 044 041 -051 016 042 049 055 100000 001 000 043 001 000 000
4000 3900 4000 2800 4000 4000 3800 4000
British legal origin 059 040 -055 031 069 021 036 028 100000 001 000 011 000 018 002 008
4300 4200 4300 2800 4300 4300 4100 4000 4300
Ethnolinguistic fragmentation 017 -015 005 -032 014 -029 -018 002 011 100027 036 074 010 038 006 028 093 050
4200 4100 4200 2800 4200 4200 4000 3900 4200 4200
Latitude 009 016 -028 037 013 030 029 019 011 001 100058 032 007 006 041 005 007 025 049 094
4300 4200 4300 2800 4300 4300 4100 4000 4300 4200 4300
Population density -014 -002 021 -025 -045 -023 -011 -018 -018 -043 -037 100042 090 022 022 001 017 052 031 028 001 003
3600 3600 3600 2500 3600 3600 3600 3500 3600 3500 3600 3600Note Pairwise correlation coefficients reported in first row significance level reported in the second row and number of observation in the third row Source Authors calculations
Appendix Table III4 Bivariate Correlations of Measures of Institutions and Instruments
34
Appendix IV Private Capital Flows and Growth
Variable Number of
observations MeanStandard deviation Min Max
Real GDP growth 43 48 36 -04 201Initial per capita GDP 43 61 11 45 90Net total flowsGDP 43 37 74 -109 271Net total flows per capita 43 547 2782 -5006 12323Total inflowsGDP 43 77 57 10 282Total inflows per capita 43 1311 3139 35 16450Overvaluation 43 11 03 07 17Domestic savings 42 122 200 -247 813Investment 42 216 87 87 469Contract enforcement 43 1014 66 826 1133Source Authors calculations
Appendix Table IV1 Private Capital Flows and Growth Summary Statistics for Multivariate Regression
Rea
l GD
P gr
owth
Initi
al p
er
capi
ta G
DP
Net
flow
sG
DP
Net
flow
s pe
r ca
pita
Inflo
ws
GD
P
Inflo
ws
per
capi
ta
Ove
rval
uatio
n
Dom
estic
sa
ving
s
Inve
stm
ent
Con
tract
en
forc
emen
t
Real GDP growth 100
Initial per capita GDP 000 100
NetflowsGDP 038 -013 100
Netflows per capita 037 028 067 100
InflowsGDP 049 016 076 066 100
Inflows per capita 028 063 042 087 061 100
Overvaluation -032 -021 -011 -003 -024 -016 100
Domestic savings 048 058 013 029 028 048 -036 100
Investment 045 045 014 039 045 051 -026 042 100
Contract enforcement 018 -007 -024 -018 -017 -013 -015 010 -012 100Note indicates significant at 10 percentSource Authors calculations
Appendix Table IV2 Private Capital Flows and Growth Pairwise Correlations for Multivariate Regression
35
References
Acemoglu D and S Johnson 2005 ldquoUnbundling Institutionsrdquo Journal of Political
Economy Vol 113 No 5 pp 949995 Acemoglu D Johnson S and D Robinson 2002 ldquoReversal of Fortune Geography and
Institutions in the Making of the Making of the Modern World Income Distributionrdquo Quarterly Journal of Economics pp 12311294
Albuquerque R 2003 ldquoThe Composition of International Capital Flows Risk Sharing
Through Foreign Direct Investmentrdquo Journal of International Economics Vol 61 pp 353ndash383
Alfaro L and A Charlton 2007 ldquoInternational Financial Integration and Entrepreneurial
Firm Activityrdquo NBER Working Paper No 13118 (Cambridge Massachusetts National Bureau of Economic Research)
mdashmdashmdash S Kalemli-Ozcan and V Volosovych 2005a ldquoCapital Flows in a Globalized
World The Role of Policies and InstitutionsrdquoNBER Working Paper No 11696 (Cambridge Massachusetts National Bureau of Economic Research)
mdashmdashmdash 2005b ldquoWhy Doesnrsquot Capital Flow from Rich to Poor Countries An Empirical
Investigationrdquo NBER Working Paper Series No 11901 (Cambridge Massachusetts National Bureau of Economic Research)
Auty R M ed 2001 Resource abundance and Economic Development Improving the
Performance of Resource-Rich Countries (Oxford Oxford University Press) mdashmdashmdash and A Gelb 2001 ldquoPolitical Economy of Resource-Abundant Statesrdquo in Resource
abundance and Economic Development Improving the Performance of Resource-Rich Countries ed by R M Auty (Oxford Oxford University Press)
Becker T O Jeanne P Mauro J D Ostry and R Ranciegravere 2007 Country InsurancemdashThe Role of Domestic Policies IMF Occasional Paper No
254 (Washington International Monetary Fund) Bekaert G Campbell R H and C Lundblad 2005 ldquoDoes Financial Liberalization Spur
Growthrdquo Journal of Financial Economics Vol 77 (July) Chinn MD and H Ito 2007 ldquoA New Measure of Financial Opennessrdquo Available via the
Internet at wwwsscwiscedu7Emchinnresearchhtml
36
Chinn MD and H Ito 2006 ldquoWhat Matters for Financial Development Capital Controls Institutions and Interactionsrdquo Journal of Development Economics Vol 81 (October) pp 163ndash92
Chinn MD Ito H 2002 ldquoCapital Account Liberalization Institutions and Financial
Development Cross-Country Evidencerdquo NBER Working Paper Series No 8967 (Cambridge Massachusetts National Bureau of Economic Research)
DellAriccia G Di Giovanni J Faria A Kose M A Mauro P Schindler M Terrones M and J D Ostry 2008 ldquoReaping the Benefits of Financial Globalizationrdquo IMF Occasional Paper No 264 (Washington International Monetary Fund)
Dorsey T E Tadesse H Singh S and Z Brixiova 2008 ldquoThe Landscape of Capital
Flows to Low-Income Countriesrdquo IMF Working Paper 0851 (Washington International Monetary Fund)
Edison H Klein M W Ricci L A and T Slok 2004 ldquoCapital Account Liberalization
and Economic Performance Survey and Synthesisrdquo IMF Staff Papers Vol 51 No 2 pp 220256
Faria A and P Mauro 2004 ldquoInstitutions and the External Capital Structure of Countriesrdquo
IMF Working Paper 04236 (Washington International Monetary Fund) mdashmdashmdash Minnoni M and AZaklan 2006 ldquoThe External Financing of Emerging Market
Countries Evidence from Two Waves of Financial Globalizationrdquo IMF Working Paper 06205 (Washington International Monetary Fund)
Glaeser E L and A Shleifer 2002 ldquoLegal Originsrdquo Quarterly Journal of Economics
Vol117 pp 1193ndash1229 Gourinchas P-O and O Jeanne 2007 ldquoCapital Flows to Developing Countries The
Allocation Puzzlerdquo NBER Working Paper No 13602 (Cambridge Massachusetts National Bureau of Economic Research)
International Monetary Fund 2007 Global Financial Stability Report (Washington
October) mdashmdashmdash 2008 Regional Economic Outlook Sub-Saharan Africa (Washington September) Ju J and S-J Wei 2007 ldquoDomestic Institutions and the Bypass Effect of Financial
Globalizationrdquo NBER Working Paper No 13148 (Cambridge Massachusetts National Bureau of Economic Research)
37
mdashmdashmdash 2006 ldquoA Solution to Two Paradoxes of International Capital Flowsrdquo NBER Working Paper No 12668 (Cambridge Massachusetts National Bureau of
Economic Research) Karl T L 1997 The Paradox of Plenty Oil Booms and Petro-States (Berkeley University
of California Press) Kaufmann D Kray A and M Mastruzzi 2008 ldquoGovernance Matters VII Aggregate and
Individual Governance Indicators 1996-2007rdquo Policy Research Working Paper No 4654 (Washington DC World Bank Group)
Klein MW 2005 ldquoCapital Account Liberalization Institutional Quality and Economic
Growth Theory and Evidencerdquo NBER Working Paper No 11112 (Cambridge Massachusetts National Bureau of Economic Research)
Kose M A Prasad E Wei S-J and K Rogoff 2006 ldquoFinancial Globalization A
Reappraisalrdquo IMF Working Paper 06189 (Washington DC International Monetary Fund)
Lane P R 2004 ldquoEmpirical Perspectives on Long-Term External Debtrdquo Topics in Macroeconomics Vol 4 No 1 httpwwwbepresscombejmtopicsvol4iss1art1 La Porta R F Lopez-de-Silanes A Shleifer and R W Vishny 1999 ldquoThe Quality of
Governmentrdquo Journal of Law Economics and Organization Vol 15 pp 222ndash79 Lukonga forthcoming ldquoFinancial Market Development Survey of Sub-Saharan African
Countriesrdquo mimeo Mauro P Minnoni M and AZaklan 2006 ldquoThe External Financing of Emerging Market
Countries Evidence from Two Waves of Financial Globalizationrdquo IMF Working Paper 06205 (Washington International Monetary Fund)
Miniane J 2004 ldquoA New Set of Measures on Capital Account Restrictionsrdquo IMF Staff Papers Vol 51 No 2 pp 276ndash308 Mishkin F S 2006 The Next Great Globalization How Disadvantaged Nations can
Harness their Financial Systems to Get Rich (Princeton NJ Princeton University Press)
Obstfeld M and A M Taylor 2004 Global Capital Markets Integration Crisis and Growth Cambridge University Press (2004) Portes R and H Rey 2005 ldquoThe Determinants of Cross-Border Equity Flowsrdquo Journal of
International Economics Vol 64 pp269-296 Prasad Eswar S Raghuram G Rajan and Arvind Subramanian 2007 ldquoForeign Capital and Economic Growthrdquo Brookings Papers on Economic Activity 1 Brookings
38
Quinn D P 1997 ldquoThe Correlates of Change in International Financial Regulationrdquo
American Political Science Review Vol 91 (September) pp 531ndash51 mdashmdashmdash and A Maria Toyoda forthcoming ldquoDoes Capital Account Liberalization Lead to
Economic Growthrdquo Review of Financial Studies Rodrick D 2007 ldquoThe Real Exchange Rate and Economic Growth Theory and Evidencerdquo
Harvard University Working Paper httpksghomeharvardedu~drodrikRER20and20growthpdf
mdashmdashmdash and A Subramanian 2008 ldquoWhy did Financial Globalization Disappointrdquo IMF
Staff Papers Vol 56 No 1 (Washington International Monetary Fund) Schindler M 2009 ldquoMeasuring Financial Integration A New Datasetrdquo IMF Staff Papers
Vol 56 No 1 (Washington International Monetary Fund) Schularick M 2006 ldquoA Tale of Two Globalizations Capital Flows from Rich to Poor in
Two Eras of Global Financerdquo International Journal of Finance and Economics Vol11 pp339-354
Schularick M Steger T 2008 ldquoThe Lucas Paradox and the Quality of Institutions Then
and Nowrdquo Berlin University Working Paper N20083 Stone M R Shimizu S Nordstrom A and H J Ferhani 2008 ldquoDeveloping Essential
Financial Markets in Smaller Economies Stylized Facts and Policy Optionsrdquo IMF Occasional Paper No 265 (Washington International Monetary Fund)
World Bank 2007 Global Development Finance The Globalization of Corporate Finance in Developing Countries (Washington World Bank Group)
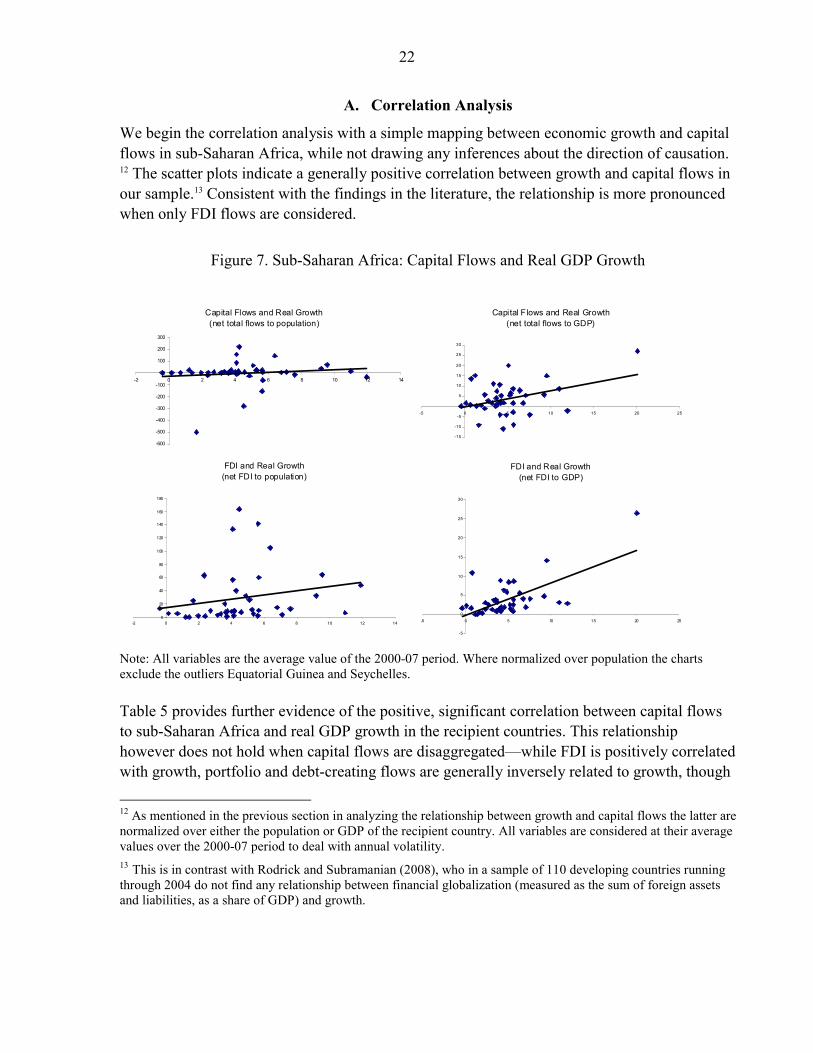
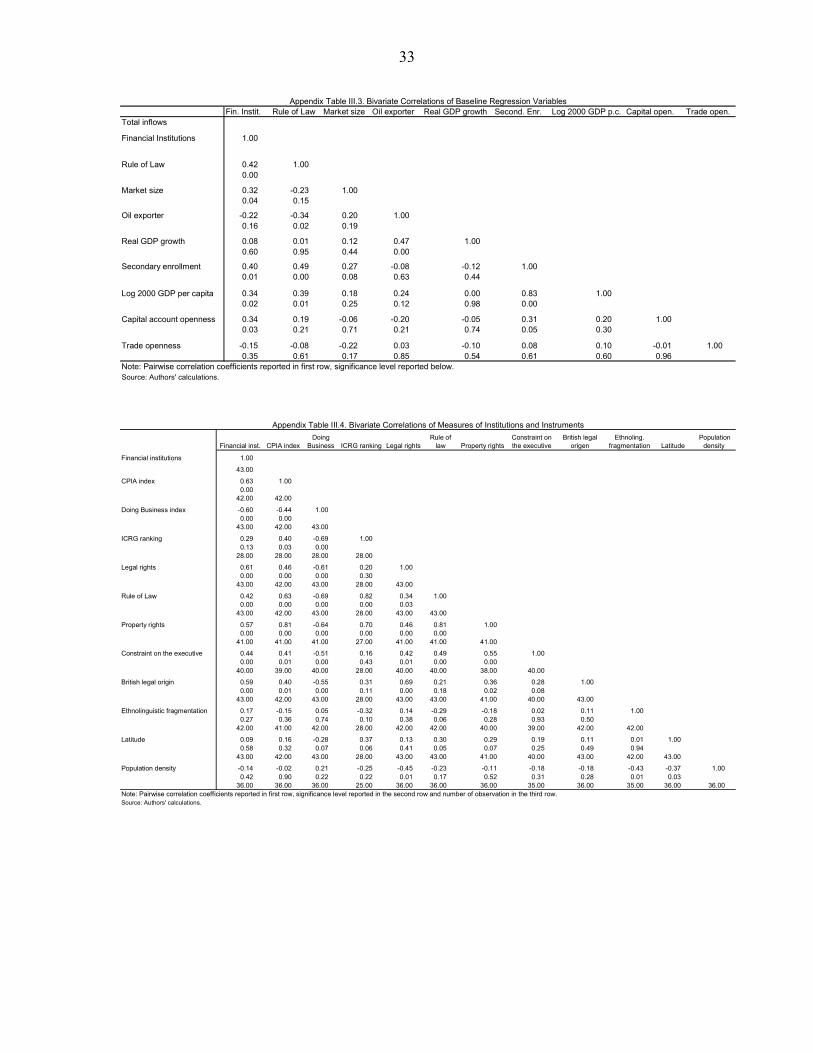