sudhir borra and sudeep sarkarsarkar/pdfs/borra.pdfsudhir borra and sudeep sarkar abstract—we...
TRANSCRIPT

1306 IEEE TRANSACTIONS ON PATTERN ANALYSIS AND MACHINE INTELLIGENCE, VOL. 19, NO. 11, NOVEMBER 1997
A Framework for PerformanceCharacterization of Intermediate-Level
Grouping Modules
Sudhir Borra and Sudeep Sarkar
Abstract —We present five performance measures to evaluategrouping modules in the context of constrained search and indexingbased object recognition. Using these measures, we demonstrate asound experimental framework, based on statistical ANOVA tests, tocompare and contrast three edge based organization modules,namely, those of Etemadi et al., Jacobs, and Sarkar-Boyer in thedomain of aerial objects using 50 images. With adapted parameters,the Jacobs module performs overall the best for constraint basedrecognition. For fixed parameters, the Sarkar-Boyer module is the bestin terms of recognition accuracy and indexing speedup. Etemadi etal.’s module performs equally well with fixed and adapted parameterswhile the Jacobs module is most sensitive to fixed and adaptedparameter choices. The overall performance ranking of the modules isJacobs, Sarkar-Boyer, and Etemadi et al.
Index Terms —Perceptual organization, performance evaluation,analysis of variance, ANOVA, experimental vision, intermediate levelcomputer vision, feature grouping, performance characterization.
———————— ✦ ————————
1 INTRODUCTION
PERCEPTUAL organization or feature grouping is primarily a bot-tom-up process which clusters image features that are most likelyto come from a single object. Grimson [4] has shown that the com-binatorics of the recognition process in cluttered environmentsusing constrained search reduces from an exponential to a loworder polynomial if we use an intermediate grouping processwhich need not be perfect. The importance of grouping is also truefor indexing based recognition strategies. Clemens and Jacobs [5]have shown that recognition by “indexing is of very limited bene-fit unless accompanied by a grouping process.”
In response to the importance of low-level feature grouping,various types of perceptual organization modules have been pro-posed [3], [6], [2], [1]. These modules not only use different un-derlying computational techniques but also compute differenttypes of organizations such as parallels, rectangles, ellipses, con-vex groups, and ribbons. However, we are not aware of any gen-eral methodology to evaluate such a variety of intermediate levelgrouping modules. Although there is a continuing debate on theperformance characterization of vision algorithms [7] at all levels,most of the demonstrations of the methodologies have been forlow level vision modules [8], [9], [10], [11]. Evaluation of completevision systems has been few [12].
One obvious way to compare organization modules would beto treat grouping as an end in itself and measure its true detectionand false alarm rates. However, these measures require the enun-ciation of ground truth in terms of “true” groups “seen” in theimage. For example, one would have to enumerate all possibleparallel lines found in an image, preferably, with significancemeasures. Not only is this task tedious but it is also ill defined.
Consider a set of multiple parallel lines. Does one enumerate allpossible pairs of parallels or just the set of “nearest” parallel lines?Clearly, the choice depends on what we are going to use the par-allel lines for. Thus, drawing from recent work [7], [8], we believethat performance characterization needs to be done:
1) in the context of a visual task (e.g., object recognition),2) in a specified domain (e.g., aerial), and3) it should be done with respect to some ground truth data.
Ideally, one would like to evaluate a grouping module bybuilding a complete object recognition system. However, an artifi-cial recognition system for real domains is still elusive. So, to fa-cilitate the evaluation of grouping modules without building a fullrecognition system we present five performance measures. Thesemeasures can be used to directly predict performance of con-strained search based or indexing based recognition. The perform-ance measures are also independent of the organization types andcan be used to compare modules producing dissimilar groupings.
Using the performance measures, we evaluate three recentfeature grouping modules, namely, the Etemadi et al. [1], Jacobs[2], and Sarkar-Boyer [3] organization modules1 on 50 aerial im-ages. We use Analysis of Variance (ANOVA) to guide the experi-mental design and to statistically analyze the data. ANOVA hasbeen well studied in statistics [13] and used in other experimentalfields but its use in computer vision has been limited.
2 PERFORMANCE MEASURES
In constructing the performance measures, we consider two objectrecognition strategies: constrained search and indexing. In con-strained search we match image features with (2D or 3D) modelfeatures under geometric consistency constraints. One way of con-ducting a constrained search is using a search tree of interpreta-tions. At each level of the tree, we add one new match which isconsistent with the matches postulated so far. We conduct a back-tracking depth-first search until we completely or at least partiallyexplain the image data. In indexing, a look-up table of model fea-tures sets is created off line. At run-time, we simply index into thislook-up table using groups of image features, thus, trading spacefor time.
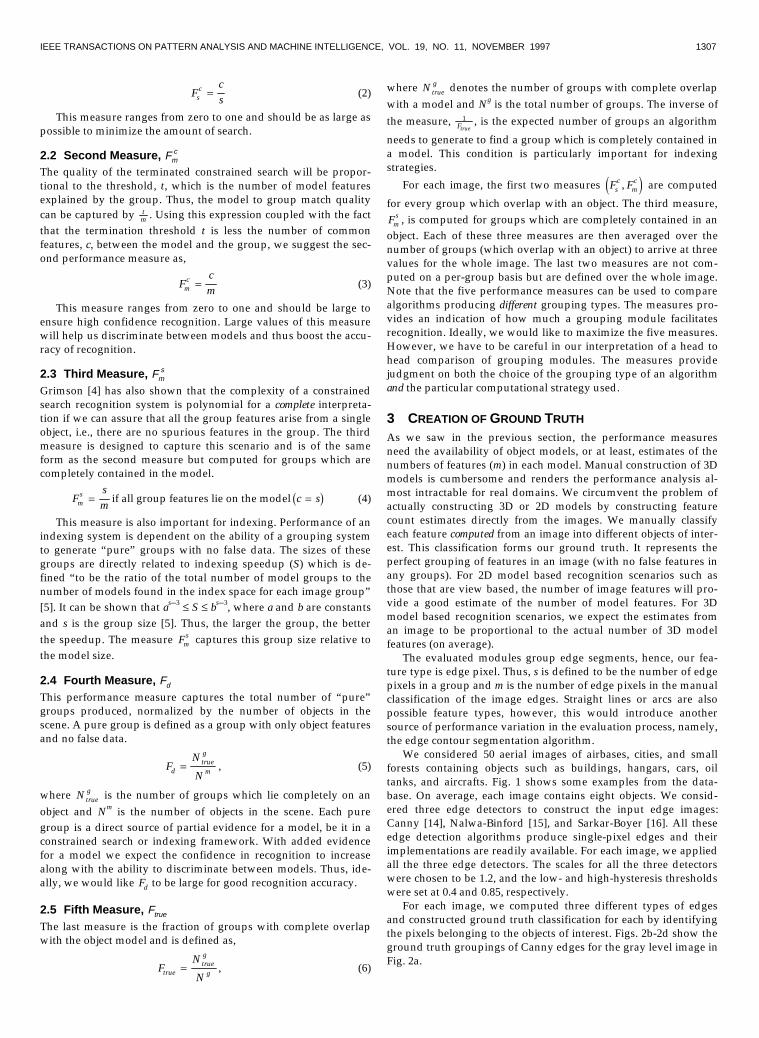
2.1 First Measure, Fsc
We motivate the first measure from a constrained search recogni-tion point of view. Grimson [4] has derived expressions for thecomplexity of object recognition using imperfect groups in thepresence of clutter. As per Grimson’s notation [4], s denotes thenumber of features in a group, m denotes the number of modelfeatures, and c denotes the number of group features which lie onthe object or model. The expected search is essentially polynomialif we terminate when the number of matched features equal somepredetermined threshold, t. The exact expression is given by [4]:
mssc
W mtssc m
smterm
s m
� � �
�
��
�
���
���
��
�
12 2
212
N
N
N/1 6
(1)
The constant N is small and is typically equal to 0 2. PD where P
is the total perimeter of the object and D is the image dimension. Ifsm
DP
� 502
2 , then the search is essentially quartic. In the worst case,
P < D and the requirement for quartic complexity is essentially s �50 m, a very liberal bound. The term in (1) which depends on thequality of the group is the ratio s
c . This constitutes the first per-formance measure.
1. All the modules are freely available on the internet. We did not“tweak” the codes of these modules for this work.
0162-8828/97/$10.00 © 1997 IEEE
¥¥¥¥¥¥¥¥¥¥¥¥¥¥¥¥
• The authors are with the Department of Computer Science and Engineering,4202 E. Fowler Ave., ENB 118, University of South Florida, Tampa, FL 33620.
E-mail: {borra, sarkar}@csee.usf.edu.
Manuscript received 2 Aug. 1996; revised 28 Aug. 1997. Recommended for accep-tance by V. Nalwa.For information on obtaining reprints of this article, please send e-mail to:[email protected], and reference IEEECS Log Number 105706.
IEEE TRANSACTIONS ON PATTERN ANALYSIS AND MACHINE INTELLIGENCE, VOL. 19, NO. 11, NOVEMBER 1997 1307
Fcss
c (2)
This measure ranges from zero to one and should be as large aspossible to minimize the amount of search.
2.2 Second Measure, Fmc
The quality of the terminated constrained search will be propor-tional to the threshold, t, which is the number of model featuresexplained by the group. Thus, the model to group match qualitycan be captured by t
m . Using this expression coupled with the factthat the termination threshold t is less the number of commonfeatures, c, between the model and the group, we suggest the sec-ond performance measure as,
Fcmm
c (3)
This measure ranges from zero to one and should be large toensure high confidence recognition. Large values of this measurewill help us discriminate between models and thus boost the accu-racy of recognition.
2.3 Third Measure, Fms
Grimson [4] has also shown that the complexity of a constrainedsearch recognition system is polynomial for a complete interpreta-tion if we can assure that all the group features arise from a singleobject, i.e., there are no spurious features in the group. The thirdmeasure is designed to capture this scenario and is of the sameform as the second measure but computed for groups which arecompletely contained in the model.
Fsm
c sms if all group features lie on the model 1 6 (4)
This measure is also important for indexing. Performance of anindexing system is dependent on the ability of a grouping systemto generate “pure” groups with no false data. The sizes of thesegroups are directly related to indexing speedup (S) which is de-fined “to be the ratio of the total number of model groups to thenumber of models found in the index space for each image group”[5]. It can be shown that as�3 � S � bs�3, where a and b are constantsand s is the group size [5]. Thus, the larger the group, the betterthe speedup. The measure Fm
s captures this group size relative tothe model size.
2.4 Fourth Measure, Fd
This performance measure captures the total number of “pure”groups produced, normalized by the number of objects in thescene. A pure group is defined as a group with only object featuresand no false data.
FN
Ndtrueg
m , (5)
where Ntrueg is the number of groups which lie completely on an
object and Nm is the number of objects in the scene. Each puregroup is a direct source of partial evidence for a model, be it in aconstrained search or indexing framework. With added evidencefor a model we expect the confidence in recognition to increasealong with the ability to discriminate between models. Thus, ide-ally, we would like Fd to be large for good recognition accuracy.
2.5 Fifth Measure, Ftrue
The last measure is the fraction of groups with complete overlapwith the object model and is defined as,
FN
Ntruetrueg
g , (6)
where Ntrueg denotes the number of groups with complete overlap
with a model and Ng is the total number of groups. The inverse of
the measure, 1Ftrue
, is the expected number of groups an algorithm
needs to generate to find a group which is completely contained ina model. This condition is particularly important for indexingstrategies.
For each image, the first two measures F Fsc
mc,4 9 are computed
for every group which overlap with an object. The third measure,Fm
s , is computed for groups which are completely contained in anobject. Each of these three measures are then averaged over thenumber of groups (which overlap with an object) to arrive at threevalues for the whole image. The last two measures are not com-puted on a per-group basis but are defined over the whole image.Note that the five performance measures can be used to comparealgorithms producing different grouping types. The measures pro-vides an indication of how much a grouping module facilitatesrecognition. Ideally, we would like to maximize the five measures.However, we have to be careful in our interpretation of a head tohead comparison of grouping modules. The measures providejudgment on both the choice of the grouping type of an algorithmand the particular computational strategy used.
3 CREATION OF GROUND TRUTH
As we saw in the previous section, the performance measuresneed the availability of object models, or at least, estimates of thenumbers of features (m) in each model. Manual construction of 3Dmodels is cumbersome and renders the performance analysis al-most intractable for real domains. We circumvent the problem ofactually constructing 3D or 2D models by constructing featurecount estimates directly from the images. We manually classifyeach feature computed from an image into different objects of inter-est. This classification forms our ground truth. It represents theperfect grouping of features in an image (with no false features inany groups). For 2D model based recognition scenarios such asthose that are view based, the number of image features will pro-vide a good estimate of the number of model features. For 3Dmodel based recognition scenarios, we expect the estimates froman image to be proportional to the actual number of 3D modelfeatures (on average).
The evaluated modules group edge segments, hence, our fea-ture type is edge pixel. Thus, s is defined to be the number of edgepixels in a group and m is the number of edge pixels in the manualclassification of the image edges. Straight lines or arcs are alsopossible feature types, however, this would introduce anothersource of performance variation in the evaluation process, namely,the edge contour segmentation algorithm.
We considered 50 aerial images of airbases, cities, and smallforests containing objects such as buildings, hangars, cars, oiltanks, and aircrafts. Fig. 1 shows some examples from the data-base. On average, each image contains eight objects. We consid-ered three edge detectors to construct the input edge images:Canny [14], Nalwa-Binford [15], and Sarkar-Boyer [16]. All theseedge detection algorithms produce single-pixel edges and theirimplementations are readily available. For each image, we appliedall the three edge detectors. The scales for all the three detectorswere chosen to be 1.2, and the low- and high-hysteresis thresholdswere set at 0.4 and 0.85, respectively.
For each image, we computed three different types of edgesand constructed ground truth classification for each by identifyingthe pixels belonging to the objects of interest. Figs. 2b-2d show theground truth groupings of Canny edges for the gray level image inFig. 2a.

1308 IEEE TRANSACTIONS ON PATTERN ANALYSIS AND MACHINE INTELLIGENCE, VOL. 19, NO. 11, NOVEMBER 1997
Fig. 1. Some example images from the database of 50 images.
(a) (b) (c) (d)Fig. 2. (a) An image from the image set. Ground truth groupings of the edge segments found using the Canny edge detector are shown in (b), (c),and (d).
In selecting the edge pixels belonging to an object, we choseedges caused by shadows, depth discontinuity, and significanttexture. By significant texture, we mean regular patterns whichclearly help in recognizing the object. For example, the stripes of azebra. Of course, there is always the ambiguity of delineatingbuildings which are large and complex. Do we have differentmodels for different wings of a building or do we treat the wholebuilding as one? In the present study, we treat such a building asone object. Except for few of these ambiguities, we found it is easyto demarcate the objects of interest.
4 MODULES COMPARED
The input to Etemadi et al.’s grouping algorithm [1] is a singlepixel edge image. This algorithm first extracts straight lines andthen groups them into collinear lines, overlapping parallel lines,non-overlapping parallel lines, T-junctions, V-junctions, L-junctions, O-junctions, triplets of connected segments, Y and T-Lambda Corners, N-Sided Closed Polygons. Each grouping is
associated with a quality factor which captures its significance.This algorithm has four parameters that need to be chosen: theminimum quality tolerance, and the three search pruning pa-rameters, viz., maximum width over height, minimum line length,and minimum GT.
Jacobs [2] proposed an algorithm that locates salient convexcollections of line segments in an image. The algorithm finds allconvex sets of straight line segments such that the length of thegaps between the consecutive segments is smaller than some fixedproportion of the perimeter. The salient convex groups are foundusing a constrained backtracking search. The constraint used is aglobal convexity metric which makes the output of the algorithmreliable and stable. The parameter of choice is one: the saliencythreshold k.
The Sarkar-Boyer organization module [3] takes edge images asinput, computes constant curvature edge segments, and producesgroupings which exhibit parallelogram, ribbon, quadrilateral, tri-angle, circle, and ellipse relationships among them. The Sarkar-
IEEE TRANSACTIONS ON PATTERN ANALYSIS AND MACHINE INTELLIGENCE, VOL. 19, NO. 11, NOVEMBER 1997 1309
Boyer algorithm has seven parameters that need to be chosen.They are the center distance, line distance, closure, proximity, ori-entation and curvature tolerances, and the acceptance distance.These parameters represent the various tolerances that are used togroup edge features.
5 PARAMETER SELECTION
Each organization module has a set of parameters that need to bechosen. The Etemadi et al. module has four parameters of choice.The Jacobs convex grouper has one parameter. And the Sarkar-Boyer organization modules has seven parameters that can betuned. We selected a set of 15 parameter combinations for eachmodule in the following manner. For the Etemadi et al. and theSarkar-Boyer modules we first selected 50 parameter combinationsdistributed over a reasonable range of parameter values as sug-gested in the implementation and based on our own experimenta-tion. We applied the modules on five out of the 50 images andnoted the subjective performance on a scale of �1 to 1 (definitelynot acceptable, acceptable, and surely acceptable). We selected asubset of 15 parameters from this 50 parameter combination set soas to maximize the set of highly acceptable ratings under the con-straint that the chosen subset has at least one highly acceptablerating for each of the five images. For the Jacobs module, we se-lected 15 values of the only parameter over the range experi-mented with in the paper [2]. For computational reasons we alsorestricted the maximum number of Jacobs convex groups consid-ered to be 500 per image, a liberal choice given that on average wehave eight objects per image.
6 THE VALIDITY OF THE EXPERIMENTAL SETUP
We first ask if the experimental design is valid? Do the parameterchoices adequately sample the parameter space? Are the images inthe data set sufficiently different from each other. To answer these,we computed the five performance measures for every combina-tion of images (50), parameter choices (15), edge detectors (3), andorganization modules (3). In all, we had 2,250 runs of each algo-rithm. We then conducted a statistical ANOVA analysis of theresults to interpret the effect of different factors.
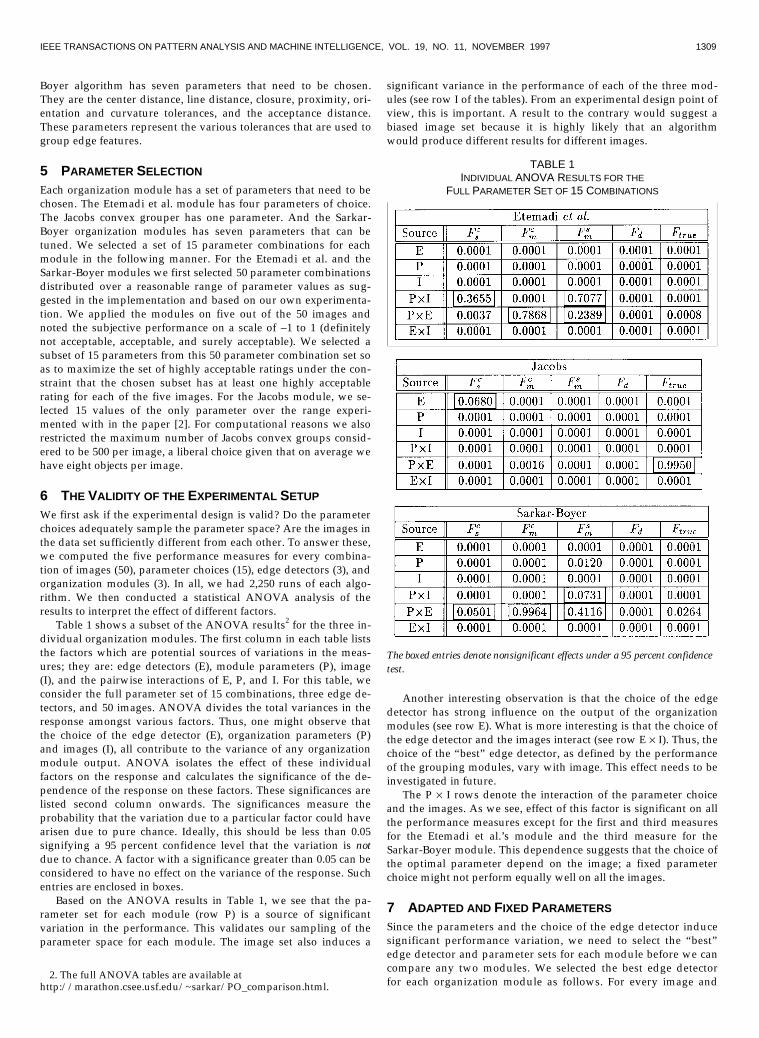
Table 1 shows a subset of the ANOVA results2 for the three in-dividual organization modules. The first column in each table liststhe factors which are potential sources of variations in the meas-ures; they are: edge detectors (E), module parameters (P), image(I), and the pairwise interactions of E, P, and I. For this table, weconsider the full parameter set of 15 combinations, three edge de-tectors, and 50 images. ANOVA divides the total variances in theresponse amongst various factors. Thus, one might observe thatthe choice of the edge detector (E), organization parameters (P)and images (I), all contribute to the variance of any organizationmodule output. ANOVA isolates the effect of these individualfactors on the response and calculates the significance of the de-pendence of the response on these factors. These significances arelisted second column onwards. The significances measure theprobability that the variation due to a particular factor could havearisen due to pure chance. Ideally, this should be less than 0.05signifying a 95 percent confidence level that the variation is notdue to chance. A factor with a significance greater than 0.05 can beconsidered to have no effect on the variance of the response. Suchentries are enclosed in boxes.
Based on the ANOVA results in Table 1, we see that the pa-rameter set for each module (row P) is a source of significantvariation in the performance. This validates our sampling of theparameter space for each module. The image set also induces a
2. The full ANOVA tables are available athttp://marathon.csee.usf.edu/~sarkar/PO_comparison.html.
significant variance in the performance of each of the three mod-ules (see row I of the tables). From an experimental design point ofview, this is important. A result to the contrary would suggest abiased image set because it is highly likely that an algorithmwould produce different results for different images.
TABLE 1INDIVIDUAL ANOVA RESULTS FOR THE
FULL PARAMETER SET OF 15 COMBINATIONS
The boxed entries denote nonsignificant effects under a 95 percent confidencetest.
Another interesting observation is that the choice of the edgedetector has strong influence on the output of the organizationmodules (see row E). What is more interesting is that the choice ofthe edge detector and the images interact (see row E ��I). Thus, thechoice of the “best” edge detector, as defined by the performanceof the grouping modules, vary with image. This effect needs to beinvestigated in future.
The P �� I rows denote the interaction of the parameter choiceand the images. As we see, effect of this factor is significant on allthe performance measures except for the first and third measuresfor the Etemadi et al.’s module and the third measure for theSarkar-Boyer module. This dependence suggests that the choice ofthe optimal parameter depend on the image; a fixed parameterchoice might not perform equally well on all the images.
7 ADAPTED AND FIXED PARAMETERS
Since the parameters and the choice of the edge detector inducesignificant performance variation, we need to select the “best”edge detector and parameter sets for each module before we cancompare any two modules. We selected the best edge detectorfor each organization module as follows. For every image and

1310 IEEE TRANSACTIONS ON PATTERN ANALYSIS AND MACHINE INTELLIGENCE, VOL. 19, NO. 11, NOVEMBER 1997
parameter combination, we ranked the three edge detectors ac-cording to each of the performance measures (separately). Foreach detector, we then summed the ranks over all the image andparameter combinations to arrive at five summed ranks corre-sponding to the five measures. The edge detector with the small-est sum of these five ranks was chosen as the “best” detector forthe organization module. Best results for the Sarkar-Boyer andthe Etemadi et al. modules were with the Sarkar-Boyer edgedetector. And the Jacobs module performed the best with theCanny detector.
With the chosen edge detector, we then decided on a parameterset for each organization module. There are two possible ways ofchoosing the optimal parameter set for a module. We can eitheradapt the parameters on a per image basis (adapted parameter) orchoose the parameter combination which results in the best per-formance over all the images (fixed parameters). We consideredboth of these. The fixed parameter set for each module was chosenas follows. For each image we ranked the parameter combinationsaccording to each of the five measures (separately). We thensummed the ranks over all the images to arrive at five summedranks for the five measures. The parameter combination withsmallest sum of these five ranks is the fixed parameter of choice.The adapted parameter set (one for each image) maximizes the per-formance on each individual image. For each image, we rankedthe 15 parameter values based on each of the five measures. Wethen summed the five ranks and considered the parameter combi-nation with the best summed rank as the adapted parameter set ofchoice for that image.
8 PERFORMANCE COMPARISON
Table 2 shows the distributions of the five performance meas-ures for fixed and adapted parameter sets (with “best” edgedetector choices). The columns list the mean values, the 95 per-cent confidence interval of the means, and the standard devia-tion of the performance measures. We can use this table of re-sults to compare two modules and also to study the perform-ance of each module with fixed and adapted parameters. How-ever, we have to first establish the statistical significance of thedifferences.
We conducted ANOVA on each module separately to studythe difference between adapted and fixed parameter choices.Partial results are shown in Table 3. Since we fixed the choice ofthe edge detector for each module, there are just two sources ofvariation in this study: the image (I) and the parameter choices(P), adapted or fixed. Only the significances for the parametervariable is shown. Images remained to be a significant source ofvariation for all measures for all modules. As we see in Table 3,the difference in performance between adapted and fixed pa-rameter choices is not significant for only the Etemadi et al.module.
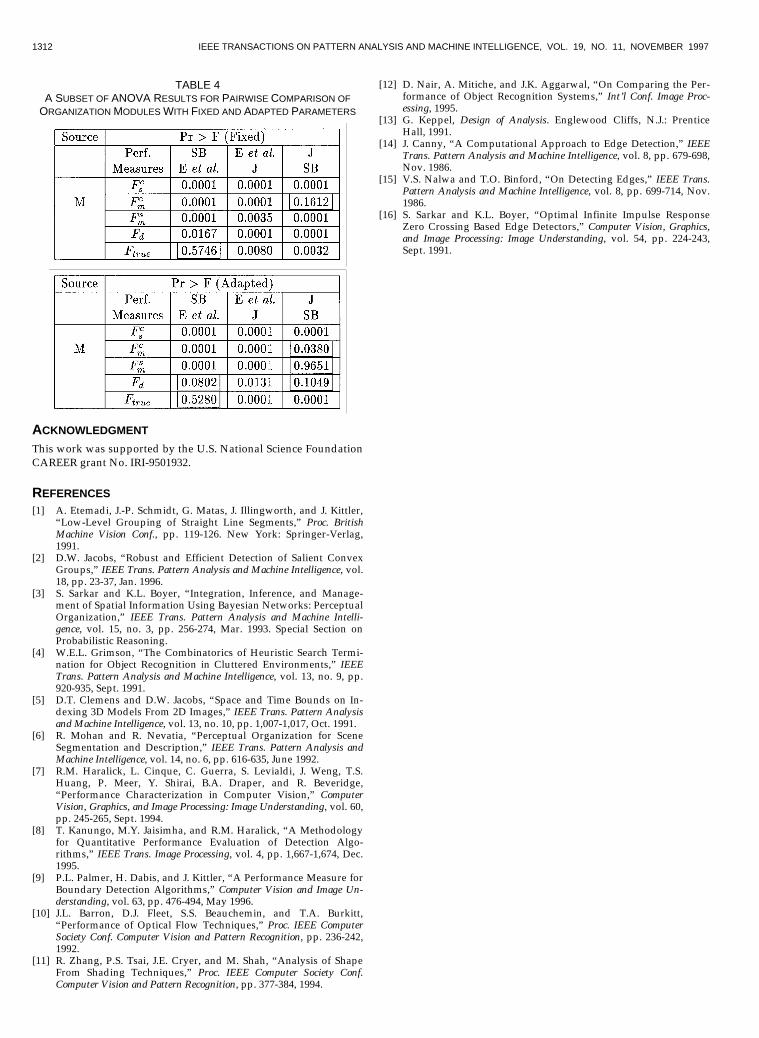
To establish the significance of the observed differences be-tween modules we conducted pairwise ANOVA between all pairsof organization modules. Table 4 lists the significance of thevariation due to the modules (row M). (The other factor is image(I) which is omitted for lack of space.) The columns represent themodule pairs. Note that the significances are computed byANOVA after accounting for variation due to images. However,we must be cautious when interpreting the significance valuessince we are performing multiple comparisons. We have tochoose the proper significance thresholds. We use the modifiedform of the Bonferroni test [13]. The threshold significance val-
ues for pairwise test, Dp, is related to overall significance, D, by
DD
n
1 61 6 , where DF is the degree of freedom and n is the
number of comparisons. In our case DF is two, the number of
organization modules minus one, and n is three. So, to establishan overall significance of 0.05 (95 percent confidence), we have
to test for significance with Dp = 0.033.We notice that for fixed parameters all pairs of modules have
significant differences with respect to all but two measures. TheSarkar-Boyer and Jacobs modules do not differ significantly with
respect to the second measure Fmc4 9 . And the Etemadi et al. and
Sarkar-Boyer modules do not differ with respect to the fifth meas-ure Ftrue2 7 . However, for adapted parameters, the Jacobs and the
Sarkar-Boyer module do not differ with respect to three measures
F F Fmc
ms
d, , and4 9. Also, the differences in Fd and Ftrue between the
Sarkar-Boyer and Etemadi modules are not significant for adaptedparameters. With this in consideration and using the measure es-timates listed in Table 2, we can make the observations below.
8.1 Observation 1The Etemadi et al. module does not have significant performancedifference between adapted and fixed parameters (Table 3). Thisreliability is particularly important in practice. It is certainly easierto work with a fixed parameter set than to adapt the parameters ofan algorithm on a per-image basis.
The greatest variation between adapted and fixed parameters isfor the Jacobs module. This is surprising, especially since the Ja-cobs module has just one parameter to choose when compared toseven for Sarkar-Boyer and four for Etemadi et al. Although weare not sure exactly why this happens, we feel that it might bebecause of the nature of the groups generated. For small values ofthe parameter k, Jacobs includes groups with large gaps on theboundary, however, a number of these groups have a large num-ber of common edge segments between them. The essential differ-ence between two groups being sometimes a small segment withsize less than the gap being bridged. If this small segment is a partof an object, then its omission from the group will result in lowerperformance. We need to augment the Jacobs grouper with a postprocessing step to generate convex groups with the least amountof overlap among them.
8.2 Observation 2The Jacobs module with adapted parameters is the best choice for
search based recognition in terms of speed Fsc4 9 and accuracy
F Fmc
dand4 9 . However for fixed parameters, although the Jacobs
module has the highest Fsc4 9 , Sarkar-Boyer has a better Fd . The
difference in Fmc between Sarkar-Boyer and Jacobs modules for
fixed parameters is not significant. Thus the confidence in the rec-ognition output with Sarkar-Boyer groups will be the better thanJacobs for fixed parameters.
8.3 Observation 3For fixed-parameter choices, the Sarkar-Boyer module shows themost promise as a good front end for indexing algorithms since it
has the best potential speedup Fms4 9 . However, on adapting the
parameters the performance between the Jacobs and Sarkar-Boyermodule is indistinguishable.
From the measure Ftrue , we can infer that on average the Jacobsmodule is more likely to generate groups which lie completely onthe object than the Sarkar-Boyer module, both for fixed andadapted parameters.

IEEE TRANSACTIONS ON PATTERN ANALYSIS AND MACHINE INTELLIGENCE, VOL. 19, NO. 11, NOVEMBER 1997 1311
TABLE 2PERFORMANCE MEASURES FOR THE THREE ORGANIZATION MODULES WITH FIXED AND ADAPTED PARAMETER COMBINATIONS
TABLE 3ANOVA SIGNIFICANCES OF THE DIFFERENCES BETWEEN ADAPTED
AND FIXED PARAMETER CHOICES FOR EACH MODULE
8.4 Observation 4The overall performance ranking of the modules is Jacobs, Sarkar-Boyer, and Etemadi et al. This was obtained by ranking the mod-ules with respect to each measure. For non-significant differencesbetween two modules, both the modules were assigned average oftwo consecutive ranks. We then summed the ranks of each moduleover the five measures. For fixed parameters, the total ranks forJacobs, Sarkar-Boyer, and Etemadi et al. were 8.5, 10, and 11.5,respectively. For adapted parameters, the total ranks for Jacobs,Sarkar-Boyer, and Etemadi et al. were 8, 10, and 12, respectively.
9 CONCLUSIONS
In this paper, we proposed five measures and a general experi-
mental framework to characterize perceptual organization or fea-ture grouping modules in the context of object recognition. Al-though we used these measures to compare three edge based or-ganization modules in the domain of aerial objects, we believe thatthe methodology is generalizable to groupings of other types offeatures in different domains. We would also like to draw atten-tion to ANOVA which, as we showed, can provide interestinginsights into the performance of a module.
From a grouping module design point of view, in future weneed to consider the following. First, is the incorporation of moreglobal cues in the grouping process like that done in the Jacobsconvex grouper. This is evidenced by the fact that Etemadi et al.performs worse than Jacobs with respect to Fs
c , even though theformer includes groupings of small sizes such parallels and junc-tions. One might expect that larger fraction of a small group willoverlap with an object. However, that is clearly not the case. TheSarkar-Boyer grouper which also has a low performance with re-spect to Fs
c is essentially dependent on local search to build thegeometric forms. Second, we need to look at more general com-plex grouping types, e.g., symmetric arrangement of lines, insteadof just simple parallel and junction based groupings. The secondmeasure, Fm
c show that all the three algorithms produce groupswhich cover about 10 percent to 20 percent of the object; there ismuch room for improvement.
1312 IEEE TRANSACTIONS ON PATTERN ANALYSIS AND MACHINE INTELLIGENCE, VOL. 19, NO. 11, NOVEMBER 1997
TABLE 4A SUBSET OF ANOVA RESULTS FOR PAIRWISE COMPARISON OF
ORGANIZATION MODULES WITH FIXED AND ADAPTED PARAMETERS
ACKNOWLEDGMENT
This work was supported by the U.S. National Science FoundationCAREER grant No. IRI-9501932.
REFERENCES[1] A. Etemadi, J.-P. Schmidt, G. Matas, J. Illingworth, and J. Kittler,
“Low-Level Grouping of Straight Line Segments,” Proc. BritishMachine Vision Conf., pp. 119-126. New York: Springer-Verlag,1991.
[2] D.W. Jacobs, “Robust and Efficient Detection of Salient ConvexGroups,” IEEE Trans. Pattern Analysis and Machine Intelligence, vol.18, pp. 23-37, Jan. 1996.
[3] S. Sarkar and K.L. Boyer, “Integration, Inference, and Manage-ment of Spatial Information Using Bayesian Networks: PerceptualOrganization,” IEEE Trans. Pattern Analysis and Machine Intelli-gence, vol. 15, no. 3, pp. 256-274, Mar. 1993. Special Section onProbabilistic Reasoning.
[4] W.E.L. Grimson, “The Combinatorics of Heuristic Search Termi-nation for Object Recognition in Cluttered Environments,” IEEETrans. Pattern Analysis and Machine Intelligence, vol. 13, no. 9, pp.920-935, Sept. 1991.
[5] D.T. Clemens and D.W. Jacobs, “Space and Time Bounds on In-dexing 3D Models From 2D Images,” IEEE Trans. Pattern Analysisand Machine Intelligence, vol. 13, no. 10, pp. 1,007-1,017, Oct. 1991.
[6] R. Mohan and R. Nevatia, “Perceptual Organization for SceneSegmentation and Description,” IEEE Trans. Pattern Analysis andMachine Intelligence, vol. 14, no. 6, pp. 616-635, June 1992.
[7] R.M. Haralick, L. Cinque, C. Guerra, S. Levialdi, J. Weng, T.S.Huang, P. Meer, Y. Shirai, B.A. Draper, and R. Beveridge,“Performance Characterization in Computer Vision,” ComputerVision, Graphics, and Image Processing: Image Understanding, vol. 60,pp. 245-265, Sept. 1994.
[8] T. Kanungo, M.Y. Jaisimha, and R.M. Haralick, “A Methodologyfor Quantitative Performance Evaluation of Detection Algo-rithms,” IEEE Trans. Image Processing, vol. 4, pp. 1,667-1,674, Dec.1995.
[9] P.L. Palmer, H. Dabis, and J. Kittler, “A Performance Measure forBoundary Detection Algorithms,” Computer Vision and Image Un-derstanding, vol. 63, pp. 476-494, May 1996.
[10] J.L. Barron, D.J. Fleet, S.S. Beauchemin, and T.A. Burkitt,“Performance of Optical Flow Techniques,” Proc. IEEE ComputerSociety Conf. Computer Vision and Pattern Recognition, pp. 236-242,1992.
[11] R. Zhang, P.S. Tsai, J.E. Cryer, and M. Shah, “Analysis of ShapeFrom Shading Techniques,” Proc. IEEE Computer Society Conf.Computer Vision and Pattern Recognition, pp. 377-384, 1994.
[12] D. Nair, A. Mitiche, and J.K. Aggarwal, “On Comparing the Per-formance of Object Recognition Systems,” Int’l Conf. Image Proc-essing, 1995.
[13] G. Keppel, Design of Analysis. Englewood Cliffs, N.J.: PrenticeHall, 1991.
[14] J. Canny, “A Computational Approach to Edge Detection,” IEEETrans. Pattern Analysis and Machine Intelligence, vol. 8, pp. 679-698,Nov. 1986.
[15] V.S. Nalwa and T.O. Binford, “On Detecting Edges,” IEEE Trans.Pattern Analysis and Machine Intelligence, vol. 8, pp. 699-714, Nov.1986.
[16] S. Sarkar and K.L. Boyer, “Optimal Infinite Impulse ResponseZero Crossing Based Edge Detectors,” Computer Vision, Graphics,and Image Processing: Image Understanding, vol. 54, pp. 224-243,Sept. 1991.