summary of travel trends · reports are available to doe employees, doe contractors, energy...
TRANSCRIPT

Summary of Travel Trends
Pat S. Hu Center for Transportation Analysis
Oak Ridge National Laboratory And
Timothy R. Reuscher MacroSys Research and Technology
2001 National Household Travel Survey
U. S. Department of Transportation Federal Highway Administration
December 2004

DOCUMENT AVAILABILITY
Reports produced after January 1, 1996, are generally available free via the U.S. Department of Energy (DOE) Information Bridge.
Web site http://www.osti.gov/bridge Reports produced before January 1, 1996, may be purchased by members of the public from the following source.
National Technical Information Service 5285 Port Royal Road Springfield, VA 22161 Telephone 703-605-6000 (1-800-553-6847) TDD 703-487-4639 Fax 703-605-6900 E-mail [email protected] Web site http://www.ntis.gov/support/ordernowabout.htm
Reports are available to DOE employees, DOE contractors, Energy Technology Data Exchange (ETDE) representatives, and International Nuclear Information System (INIS) representatives from the following source.
Office of Scientific and Technical Information P.O. Box 62 Oak Ridge, TN 37831 Telephone 865-576-8401 Fax 865-576-5728 E-mail [email protected] Web site http://www.osti.gov/contact.html
This report was prepared as an account of work sponsored by an agency of the United States Government. Neither the United States government nor any agency thereof, nor any of their employees, makes any warranty, express or implied, or assumes any legal liability or responsibility for the accuracy, completeness, or usefulness of any information, apparatus, product, or process disclosed, or represents that its use would not infringe privately owned rights. Reference herein to any specific commercial product, process, or service by trade name, trademark, manufacturer, or otherwise, does not necessarily constitute or imply its endorsement, recommendation, or favoring by the United States Government or any agency thereof. The views and opinions of authors expressed herein do not necessarily state or reflect those of the United States Government or any agency thereof.

Summary of Travel Trends2001 National Household Travel Survey
December 2004
Prepared forU.S. Department of TransportationFederal Highway Administration
Washington, D.C.
Prepared by
Patricia S. HuCenter for Transportation Analysis
Oak Ridge National Laboratory
and
Timothy R. ReuscherMacroSys Research and Technology


2001 NHTS Summary of Travel Trends Table of Contents
v
TABLE OF CONTENTS
LIST OF TABLES . . . . . . . . . . . . . . . . . . . . . . . . . . . . . . . . . . . . . . . . . . . . . . . . . . . . . . . . . . . vii
LIST OF FIGURES . . . . . . . . . . . . . . . . . . . . . . . . . . . . . . . . . . . . . . . . . . . . . . . . . . . . . . . . . . . xi
INTRODUCTION . . . . . . . . . . . . . . . . . . . . . . . . . . . . . . . . . . . . . . . . . . . . . . . . . . . . . . . . . . . . . 1
PROFILE OF THE 2001 NHTS . . . . . . . . . . . . . . . . . . . . . . . . . . . . . . . . . . . . . . . . . . . . . . . . . . 2
IMPROVEMENTS IN THE NPTS/NHTS SERIES . . . . . . . . . . . . . . . . . . . . . . . . . . . . . . . . . . . 4
REPORT ORGANIZATION . . . . . . . . . . . . . . . . . . . . . . . . . . . . . . . . . . . . . . . . . . . . . . . . . . . . . 5
TRAVEL AND DEMOGRAPHIC SUMMARY . . . . . . . . . . . . . . . . . . . . . . . . . . . . . . . . . . . . . 9
HOUSEHOLD TRAVEL . . . . . . . . . . . . . . . . . . . . . . . . . . . . . . . . . . . . . . . . . . . . . . . . . . . . . . 15
PERSON TRAVEL . . . . . . . . . . . . . . . . . . . . . . . . . . . . . . . . . . . . . . . . . . . . . . . . . . . . . . . . . . . 19
PRIVATE VEHICLE TRAVEL . . . . . . . . . . . . . . . . . . . . . . . . . . . . . . . . . . . . . . . . . . . . . . . . . 30
VEHICLE AVAILABILITY AND UTILIZATION . . . . . . . . . . . . . . . . . . . . . . . . . . . . . . . . . . 32
COMMUTE TRAVEL PATTERNS . . . . . . . . . . . . . . . . . . . . . . . . . . . . . . . . . . . . . . . . . . . . . . 42
TEMPORAL DISTRIBUTION . . . . . . . . . . . . . . . . . . . . . . . . . . . . . . . . . . . . . . . . . . . . . . . . . . 49
TRAVEL BEHAVIOR OF SUB-POPULATIONS . . . . . . . . . . . . . . . . . . . . . . . . . . . . . . . . . . . 52
TRAVEL CONCEPTS AND GLOSSARY OF TERMS . . . . . . . . . . . . . . . . . . . . . . . . . . . . G-1
APPENDIX 1. SELECTED TABLES INCLUDING TRAVEL OF INDIVIDUALS 0 to 4 YEAR-OLDS . . . . . . . . . . . . . . . . . . . . . . . . . . . . . . . . . . . . . . . . . . . . . . . . . . A1-1
APPENDIX 2. KEY CHANGES IN THE 2001 NHTS SURVEY METHODOLOGYAND CONTENT . . . . . . . . . . . . . . . . . . . . . . . . . . . . . . . . . . . . . . . . . . . . . . . . . . . . A2-1
APPENDIX 3. ADJUSTMENT OF 1990 TRAVEL DATA . . . . . . . . . . . . . . . . . . . . . . . . A3-1
APPENDIX 4. SELECTED STANDARD ERROR TABLES . . . . . . . . . . . . . . . . . . . . . . . A4-1

Table of Contents 2001 NHTS Summary of Travel Trends
vi
APPENDIX 5. DIFFERENCES IN METROPOLITAN AREA DEFINITIONSBETWEEN 1983 AND 1990 NPTS . . . . . . . . . . . . . . . . . . . . . . . . . . . . . . . . . . . . . A5-1

2001 NHTS Summary of Travel Trends List of Tables
vii
LIST OF TABLES
Travel and Demographic Summary
Table 1. Summary Statistics on Demographic Characteristics and Total Travel,1969, 1977, 1983, 1990, and 1995 NPTS, and 2001 NHTS . . . . . . . . . . . . . . . . . . . . 9
Table 2 Summary of Demographic Trends, 1969, 1977, 1983, 1990, and 1995 NPTS, and 2001 NHTS . . . . . . . . . . . . . . . . . . . . . . . . . . . . . . . . . . . . . . . 11
Table 3. Summary of Travel Trends, 1969, 1977, 1983, 1990, and 1995 NPTS, and 2001 NHTS . . . . . . . . . . . . . . . . . . . . . . . . . . . . . . . . . . . . . . . 12
Table 4. Comparison of Survey Variables with Other Sources . . . . . . . . . . . . . . . . . . . . . . . . 14
Household Travel
Table 5. Average Annual PMT, Person Trips and Trip Length by Trip Purpose,1983, 1990, and 1995 NPTS, and 2001 NHTS . . . . . . . . . . . . . . . . . . . . . . . . . . . . . 15
Table 6. Average Annual VMT, Vehicle Trips and Trip Length by Selected Trip Purposes,1969, 1977, 1983, 1990, and 1995 NPTS, and 2001 NHTS . . . . . . . . . . . . . . . . . . . 16
Table 7. Average Annual Person Trips per Household by Mode of Transportation and MSA Size, 1977, 1983, 1990, and 1995 NPTS, and 2001 NHTS . . . . . . . . . . . 17
Table 8. Person Trips per Household by Household Income, 1983, 1990, and 1995 NPTS, and 2001 NHTS . . . . . . . . . . . . . . . . . . . . . . . . . . . . . . . . . . . . . . . 18
Person Travel
Table 9. Total Person Trips by Mode of Transportation and Trip Purpose, Adjusted 1990 and 1995 NPTS, and 2001 NHTS . . . . . . . . . . . . . . . . . . . . . . . . . . 19
Table 10. Person Trips per Person by Trip Purpose and Gender, Adjusted 1990 and 1995 NPTS, and 2001 NHTS . . . . . . . . . . . . . . . . . . . . . . . . . . 20
Table 11. Daily Trip Rates per Person by Trip Purpose, 1977, 1983, 1990, and 1995 NPTS, and 2001 NHTS . . . . . . . . . . . . . . . . . . . . . . . . . . . . . . . . . . . . . . . 22
Table 12. Distribution of Daily Person Miles of Travel per Person by Mode of Transportation and Trip Purpose, Adjusted 1990 and 1995 NPTS, and 2001 NHTS 23
Table 13. Average Daily Person Trips per Person by Age and Gender,1983, 1990, and 1995 NPTS, and 2001 NHTS . . . . . . . . . . . . . . . . . . . . . . . . . . . . . 24

List of Tables 2001 NHTS Summary of Travel Trends
viii
Table 14. Average Daily Person Miles of Travel per Person by Age and Gender,1983, 1990, and 1995 NPTS, and 2001 NHTS . . . . . . . . . . . . . . . . . . . . . . . . . . . . . 26
Private Vehicle Travel
Table 15. Average Time Spent Driving a Private Vehicle in a Typical Day by MSA Size,Adjusted 1990 and 1995 NPTS, and 2001 NHTS . . . . . . . . . . . . . . . . . . . . . . . . . . . 30
Table 16. Average Vehicle Occupancy for Selected Trip Purposes, 1977, 1983, 1990, and 1995 NPTS, and 2001 NHTS . . . . . . . . . . . . . . . . . . . . . . . . 31
Vehicle Availability and Utilization
Table 17. Availability of Household Vehicles, 1969, 1977, 1983, 1990, and 1995 NPTS, and 2001 NHTS . . . . . . . . . . . . . . . . . . . . . . . . . . . . . . . . . . . . . . . 32
Table 18. Distribution of Households by Household Vehicle Availability and Population Density, 1990 and 1995 NPTS, and 2001 NHTS . . . . . . . . . . . . . . . . . . 34
Table 19. Percent of Households Without a Vehicle Within MSA Size Group,1977, 1983, 1990 and 1995 NPTS, and 2001 NHTS . . . . . . . . . . . . . . . . . . . . . . . . . 36
Table 20. Vehicle Distribution and Average Vehicle Age by Vehicle Type,1977, 1983, 1990, and 1995 NPTS, and 2001 NHTS . . . . . . . . . . . . . . . . . . . . . . . . 37
Table 21. Distribution of Vehicles by Vehicle Age and Vehicle Type, 1969, 1977, 1983, 1990, and 1995 NPTS, and 2001 NHTS . . . . . . . . . . . . . . . . . . . 38
Table 22. Average Annual Miles per Vehicle by Vehicle Age,1969, 1977, 1983, 1990, and 1995 NPTS, and 2001 NHTS . . . . . . . . . . . . . . . . . . . 40
Table 23. Average Annual Miles per Licensed Driver by Driver Age and Gender,1969, 1977, 1983, 1990, and 1995 NPTS, and 2001 NHTS . . . . . . . . . . . . . . . . . . . 41
Commute Travel Patterns
Table 24. Commute VMT and Total VMT By Year, 1969, 1977, 1983, 1990, and 1995 NPTS, and 2001 NHTS . . . . . . . . . . . . . . . . . . . . . . . . . . . . . 42Table 25. Distribution of Workers by Usual Mode, 1969, 1977, 1983, 1990,
and 1995 NPTS, and 2001 NHTS . . . . . . . . . . . . . . . . . . . . . . . . . . . . . . . . . . . . . . . 44Table 26. General Commute Patterns by Mode of Transportation, 1983, 1990,
and 1995 NPTS, and 2001 NHTS . . . . . . . . . . . . . . . . . . . . . . . . . . . . . . . . . . . . . . . 45

2001 NHTS Summary of Travel Trends List of Tables
ix
Table 27. Average Commute Speed by MSA Size, 1983, 1990, and 1995 NPTS, and 2001NHTS . . . . . . . . . . . . . . . . . . . . . . . . . . . . . . . . . . . . . . . . . . . . . . . . . . . . . . . . . . . . . 47
Temporal Distribution
Table 28. Distribution of Person Trips by Start Time of Trip, 1983, 1990, and 1995 NPTS, and 2001 NHTS . . . . . . . . . . . . . . . . . . . . . . . . . . . . . . . . . . . . . . . 49
Table 29. Daily Travel Statistics by Weekday vs Weekend, Adjusted 1990 and 1995 NPTS, and 2001 NHTS . . . . . . . . . . . . . . . . . . . . . . . . . . . . . . . . . . . . . . . 51
Travel Behavior of Sub-Populations
Table 30. Daily Travel Statistics of People 65 and Older, 1983, 1990, and 1995 NPTS, and 2001 NHTS . . . . . . . . . . . . . . . . . . . . . . . . . . . . . . . . . . . . . . . . . . . . . . . . . . . . . . . . 52
Table 31. Daily Person Trips of Adult Women by Household Composition,1983, 1990, and 1995 NPTS, and 2001 NHTS . . . . . . . . . . . . . . . . . . . . . . . . . . . . . 53
Table 32. Daily Person Trips per Person for Low Income Households by Trip Purpose,1983, 1990, and 1995 NPTS, and 2001 NHTS . . . . . . . . . . . . . . . . . . . . . . . . . . . . . 54
Table 33. Daily Person Trips per Person by Vehicle Ownership Status and MSA Size,Adjusted 1990 and 1995 NPTS, and 2001 NHTS . . . . . . . . . . . . . . . . . . . . . . . . . . . 55

List of Tables 2001 NHTS Summary of Travel Trends
x
This page intentionally left blank.

2001 NHTS Summary of Travel Trends List of Figures
xi
LIST OF FIGURES
Travel and Demographic Summary
Figure 1. Changes in Summary Demographics, 1969, 1977, 1983, 1990, 1995 NPTS, and 2001 NHTS . . . . . . . . . . . . . . . . . . . . . . . . . . . . . . . . . . . . . . . . . . . . . . . . . . . . 10
Person Travel
Figure 2. Distribution of Person Trips per Person by Gender and Trip Purpose,1995 NPTS and 2001 NHTS . . . . . . . . . . . . . . . . . . . . . . . . . . . . . . . . . . . . . . . . . . . 21
Figure 3. Average Daily Person Trips by Age and Gender From 1995 to 2001 . . . . . . . . . . . . 25Figure 4. Average Daily Person Miles of Travel per Person by Gender, 1995 NPTS
and 2001 NHTS . . . . . . . . . . . . . . . . . . . . . . . . . . . . . . . . . . . . . . . . . . . . . . . . . . . . . 27Figure 5. Average Time Spent in Vehicle (Minutes) by Age, 2001 NHTS . . . . . . . . . . . . . . . 28Figure 6. Average Time Spent in Vehicle and Miles Traveled, 1995 NPTS and 2001 NHTS . 29
Vehicle Availability and Utilization
Figure 7. Household Distribution by Household Income and Vehicle to Driver Ratio,2001 NHTS . . . . . . . . . . . . . . . . . . . . . . . . . . . . . . . . . . . . . . . . . . . . . . . . . . . . . . . . 33
Figure 8. Vehicle Ownership and Demographic Statistics by Population Density, 2001NHTS . . . . . . . . . . . . . . . . . . . . . . . . . . . . . . . . . . . . . . . . . . . . . . . . . . . . . . . . . . . . . 35
Figure 9. Distribution of Vehicles by Vehicle Age 1977, 1983, 1990, 1995 NPTS, and2001 NHTS . . . . . . . . . . . . . . . . . . . . . . . . . . . . . . . . . . . . . . . . . . . . . . . . . . . . . . . . 39

List of Figures 2001 NHTS Summary of Travel Trends
xii
Commute Travel Patterns
Figure 10. Distribution of Workers by Usual Mode, 1995 NPTS and 2001 NHTS . . . . . . . . . . 43Figure 11. Average Commute Time in Privately-Owned Vehicles and MSA Size, 1995 NPTS
and 2001 NHTS . . . . . . . . . . . . . . . . . . . . . . . . . . . . . . . . . . . . . . . . . . . . . . . . . . . . . 46Figure 12. Average Commute Speed for Selected Time of Day by MSA Size,
2001 NHTS . . . . . . . . . . . . . . . . . . . . . . . . . . . . . . . . . . . . . . . . . . . . . . . . . . . . . . . . 48
Temporal Distribution
Figure 13. Distribution of Person Trips by Trip Purpose and Start Time of Trip,2001 NHTS . . . . . . . . . . . . . . . . . . . . . . . . . . . . . . . . . . . . . . . . . . . . . . . . . . . . . . . . 50
Travel Behavior of Sub-Populations
Figure 14. Mode Distribution of Person Trips Taken by Zero-Vehicle Households,2001 NHTS . . . . . . . . . . . . . . . . . . . . . . . . . . . . . . . . . . . . . . . . . . . . . . . . . . . . . . . . 56

xiii
Summary of Travel Trends
2001 National Household Travel Survey

This page intentionally left blank.

2001 NHTS Summary of Travel Trends Introduction
1
Summary of Travel Trends2001 National Household Travel Survey
INTRODUCTION
Policymakers rely on transportation statistics, including data on personal travel behavior, to
formulate strategic transportation policies and to improve the safety and efficiency of the U.S.
transportation system. Data on personal travel trends are needed to examine the reliability,
efficiency, capacity, safety, and flexibility of the nation’s transportation system to meet current
demands and accommodate future demands; to assess the feasibility and efficiency of alternative
congestion alleviating technologies (e.g., high-speed rail, magnetically levitated trains, intelligent
vehicle and highway systems); to evaluate the merits of alternative transportation investment
programs; and to assess the energy-use and air-quality impacts of various policies.
To address these data needs, the U. S. Department of Transportation (USDOT) initiated an
effort in 1969 to collect detailed data on personal travel. The 1969 survey was the first Nationwide
Personal Transportation Survey (NPTS). The survey was conducted again in 1977, 1983, 1990, and
1995. In 2001, the survey was expanded by integrating the Federal Highway Administration-
managed NPTS and the Bureau of Transportation Statistics-sponsored American Travel Survey
(ATS). The survey was re-named to the National Household Travel Survey (NHTS).
The 2001 NHTS is the nation’s inventory of daily and long-distance travel. The survey
includes demographic characteristics of households, people, vehicles, and detailed information on
daily and longer-distance travel for all purposes by all modes. NHTS survey data are collected from
a sample of U.S. households and expanded to provide national estimates of trips and miles by travel
mode, trip purpose, and a host of household attributes. When combined with historical data from
1969 through 1995, the 2001 NHTS survey data provide a rich source of detailed information on

Introduction 2001 NHTS Summary of Travel Trends
2
personal travel patterns over time.
PROFILE OF THE 2001 NHTS
Coverage. The NHTS collected travel data from a national sample of the civilian, non-
institutionalized population of the United States. Sampling was done by creating a
random-digit dialing (RDD) list of telephone numbers. An eligible household
excludes telephones in motels, hotels, group quarters, such as nursing homes,
prisons, barracks, convents or monasteries and any living quarters with 10 or more
unrelated roommates.
Telephones in dorm rooms, fraternity and sorority houses were eligible for sampling,
provided that the residence had less than 11 household members sharing the same
phone line. Therefore, students who normally reside at school but were living at
home for the summer were not considered household members at their parent's home.
Household members included people who think of the sampled household as their
primary place of residence. It included persons who usually stay in the household
but were temporarily away on business, vacation, or in a hospital. It did not include
people just visiting, such as a college student who normally lives away at school.
When The 2001 NHTS for the national and New York and Wisconsin add-ons was
conducted over a period from March 2001 through May 2002. Data collection for
the remaining add-on areas extended to July 2002.
Sample Size. The sample size for the 2001 NHTS was 69,817 households comprised of:
S a national sample of 26,038 completed households, and

2001 NHTS Summary of Travel Trends Introduction
3
S 43,779 additional households collected for the use of and funded by nine add-
on areas:
Baltimore, MPO;
Des Moines, MPO;
Hawaii;
Kentucky (4 counties);
Lancaster PA, MPO;
New York State;
Oahu (Honolulu MPO);
Texas state; and
Wisconsin state.
Contents. The NHTS serves as the nation’s inventory of daily personal travel. It includes, but
is not limited to:
S household data on the relationship of household members, education level,
income, housing characteristics, and other demographic information;
S information on each household vehicle, including year, make, model, and
estimates of annual miles traveled and fuel costs;
S data about drivers, including information on travel as part of work;
S data about one-way trips taken during a designated 24-hour period (the
household's designated travel day), including the time the trip began and ended,
length of the trip, composition of the travel party, mode of transportation, purpose
of the trip, and the specific vehicle used (if a household vehicle);
S data describing round-trips taken during a four-week period (the household’s
designated travel period) where the farthest point of the trip was at least 50 miles
from home, including the farthest destination, access and egress stops and
overnight stays on the way to and from the farthest destination, mode, purpose,
and travel party information;

Introduction 2001 NHTS Summary of Travel Trends
4
S if no long-distance trips were made during the four-week travel period, data on the
most recent long-distance trip by any mode and the most recent long-distance
train trip;
S information to describe characteristics of the geographic area in which the sample
household and workplace of sample persons are located;
S data on telecommuting;
S public perceptions of the transportation system;
S data on Internet usage; and
S the typical number of transit, walk and bike trips made over a period longer than
the 24-hour travel day.
For more information on the 2001 survey methodology and procedures, please consult: “User’s
Guide for the Public Use Data Files 2001 National Household Travel Survey” available at:
http://nhts.ornl.gov/2001/usersguide/index.shtml
IMPROVEMENTS IN THE NPTS/NHTS SERIES
The US DOT continues to research and embrace improved methodologies to collect more
accurate and more complete travel data, and to increase response rates. Among the changes in the
2001 NHTS, two are especially significant. First, the 2001 survey was the first survey in the
NPTS/NHTS series that collects travel by household members younger than 5 years old. All
previous surveys had collected travel only from household members age 5 and older. To facilitate
compatible trend analysis, information about travel by individuals younger than 5 years old is
excluded in the main body of the report. However, their travel was included in a few key tables that
are presented in Appendix 1.
The second improvement in the 2001 NHTS survey was the improved, multiple prompting
for walk and bike trips. This has significantly increased the number of walk and bike trips recorded.

2001 NHTS Summary of Travel Trends Introduction
5
A complete comparison between the 1995 and 2001 survey methods is summarized in Appendix 2.
While improvements to the survey process are encouraged, changes in the 1995 survey
method brought about significant data compatibility issues. To address these issues, the 1990 survey
data were adjusted to allow comparison to the 1995 survey. In this report, both the original 1990
data and the adjusted 1990 data are reported to facilitate trends analysis. The reader is advised to
compare the 1969-1983 survey results to the unadjusted 1990 data, and the 1995 and 2001 survey
results to the adjusted 1990 data. The method used to adjust the 1990 travel data is described in
Appendix 3.
REPORT ORGANIZATION
This report highlights important travel trends in tabular and graphic format. Statistics are
categorized by topic. The report begins with a summary of travel and demographic changes. Next,
travel changes are examined from an individual household perspective, then from an individual
person perspective. This report concludes with trip-making statistics of sub-populations such as
women, households without vehicles, low-income households, and the elderly. No attempt is made
in this report to present all of the data or to analyze and discuss the data in any depth. Standard error
estimates for key statistics are presented in Appendix 4.

Introduction 2001 NHTS Summary of Travel Trends
6
Notes to Users of 2001 NHTS Data
Data Version
Tables in this publication, the 2001 National Household Travel Survey (NHTS) Summary ofTravel Trends, were prepared using the January 2004 release of the NHTS data. This versionof the data includes data from all of the nine add-on areas.
Travel of 0-4 year-olds
In 2001, the travel of 0 to 4 year-olds was measured for the first time. In order to make the2001 data comparable to that of the previous surveys, the 2001 data reported in all tablesexclude travel of this group of individuals unless explicitly stated otherwise (for example,Tables 1 and 3). Note that inclusion of travel taken by individuals 0 to 4 year-olds does notaffect the statistics on vehicle trips, or vehicle miles of travel (VMT) because such measuresare derived based on travel taken by the driver of the trip.
To- and From-Work Trips
The number of trips taken to, or from, work dropped substantially from 1995 to 2001. Giventhe historical trends between 1990 and 2001, this decrease in the number of work trips couldbe attributable to the overestimated work travel in the 1995 survey data.
Data Source Work Trips(000,000s)
Workers(000s)
Work Tripsper Worker
Daily Work Tripsper Worker
1990 NPTS 50,314 118,343 425 1.16
1995 NPTS 66,901 131,697 508 1.39
2001 NHTS 60,690 145,272 418 1.14
Walk Trips
Respondents to the 2001 NHTS were specifically prompted to report walk trips. Since this wasnot done in the previous surveys, the increases in the number of walk trips can be explained,at least in part, by this change in methodology.

2001 NHTS Summary of Travel Trends Introduction
7
Notes to Users (Continued)
Nonresponse Weighting
In the 2001 NHTS, special care was given to nonresponse adjustments in the weighting of thesurvey data. This was done to make the weighted survey results more representative of the U.S.population. For example, these adjustments increase the weighted survey results of low-incomehouseholds, thereby help compensate for the low response rate of these households. Theimproved weighting for nonresponse may account for part of the reduction, from 1995 to 2001,in the average number of trips taken by a low-income household.

Introduction 2001 NHTS Summary of Travel Trends
8
This page intentionally left blank.

2001 NHTS Summary of Travel Trends Travel and Demographic Summary
9
Table 1Summary Statistics on Demographic Characteristics and Total Travel
1969, 1977, 1983, 1990, and 1995 NPTS, and 2001 NHTS
1969 1977 1983 1990 1990Adj. 1995 2001
2001(includes
0-4)
Percent Change 69-90
Percent Change90 (adj.)-01
Comp.Annual
TotalChange
Comp.Annual
TotalChange
Households (000) All 62,504 75,412 85,371 93,347 - 98,990 107,365 - 1.9 49 1.3 15 1 person 10,980 16,214 19,354 22,999 - 24,732 27,718 - 3.6 109 1.7 21 2 persons 18,448 22,925 27,169 30,114 - 31,834 35,032 - 2.4 63 1.4 16 3 persons 10,746 13,046 14,756 16,128 - 16,827 17,749 - 2.0 50 0.9 10 4+ persons 22,330 23,227 24,092 24,106 - 25,597 26,867 - 0.4 8 1.0 11 Persons (000) All 197,213 213,141 229,453 239,416 - 259,994 277,203 - 0.9 21 1.3 16 Under 16 60,100 54,958 53,682 54,303 - 61,411 64,612 - -0.5 -10 1.6 19 16-19 14,598 16,552 15,268 13,851 - 14,074 14,296 - -0.2 -5 0.3 3 20-34 40,060 52,252 60,788 59,517 - 59,494 57,680 - 1.9 49 -0.3 -3 35-64 62,982 66,988 75,353 82,480 - 93,766 103,296 - 1.3 31 2.1 25 65+ 19,473 22,391 24,362 26,955 - 31,249 32,884 - 1.6 38 1.8 22 All 16+ 137,113 158,183 175,771 182,803 198,583 208,155 1.4 33 1.2 14 All Male 94,465 102,521 111,514 114,441 - 126,553 135,276 - 0.8 21 1.5 18 All Male -16+
66,652 74,542 83,645 86,432 - 95,627 100,308 - 1.1 30 1.4 16
All Female 102,748 110,620 117,939 124,975 - 133,441 141,910 - 0.8 22 1.2 14 All Female -16+
73,526 83,721 92,080 96,371 - 102,956 107,847 - 1.1 31 1.0 12
All - 5+ NA 198,434 212,932 222,101 - 241,675 257,576 - 0.6 12 1.2 14 All Male 5+ NA 95,050 102,633 106,209 - 117,636 125,321 - 0.6 12 1.4 16 All Fem. 5+ NA 103,384 110,299 115,892 - 124,039 132,239 - 0.6 13 1.0 12 Licensed Drivers (000) All 102,986 127,552 147,015 163,025 - 176,330 190,425 - 2.2 58 1.4 17 Male 57,981 66,199 75,639 80,289 - 88,480 94,651 - 1.6 38 1.5 18 Female 45,005 61,353 71,376 82,707 - 87,851 95,773 - 2.9 84 1.3 16 Workers (000) All 75,758 93,019 103,244 118,343 - 131,697 145,272 - 2.1 56 1.9 23 Male 48,487 55,625 58,849 63,996 - 71,105 78,264 - 1.3 32 1.8 22 Female 27,271 37,394 44,395 54,334 - 60,593 67,007 - 3.3 99 1.9 23 Household Vehicles (000)
72,500 120,098 143,714 165,221 - 176,067 202,586 - 4.0 128 1.9 23 Household Vehicle Trips (000,000)
87,284 108,826 126,874 158,927 193,916 229,745 233,040 - 2.9 82 1.7 20 Household VMT (000,000)
775,940 907,603 1,002,139 1,409,600 1,695,290 2,068,368 2,274,797 - 2.9 82 2.7 34 Person Trips (000,000)
145,146 211,778 224,385 249,562 304,471 378,930 384,484 407,262 2.6 72 2.0 24 Person Miles of Travel (000,000)
1,404,137 1,879,215 1,946,662 2,315,300 2,829,936 3,411,122 3,783,975 3,972,749 2.4 65 2.5 32Note:• All tables reporting totals could include some unreported characteristics.• Travel statistics for surveys prior to 2001 do not include those by 0-4 year olds. Note that the inclusion of 0-4 year olds in the "2001 (includes 0-4)" column does not affect vehicle
trips or VMT, since such measures are reported by the driver of the trip. Also note that respondents whose age is unknown are included in the "All 5+," "All Male 5+," and "All Female5+," categories.
• In expanding (weighting) the sample to the total population, slightly different approaches were used in 1990 and 1995. Thus, the growth in the under 16 age group is probably overstated.Other age groups track closer to Census data.
• Note that only the 1990 data have been adjusted to make them more comparable with the 1995 and 2001 data. Thus, there are limits on the conclusions that can be drawn in comparingtravel with surveys conducted prior to 1990. The adjustments to 1990 data affect only person trips, vehicle trips, person miles of travel (PMT) and vehicle miles of travel (VMT).

Travel and Demographic Summary 2001 NHTS Summary of Travel Trends
1 The 1969 NPTS survey did not include trucks as household vehicles. For comparabilityacross surveys, the number of household vehicles in 1969 was estimated based on statisticsreported in Highway Statistics. It was assumed that fifty percent of all 2-axle 4-tire vehiclesin 1969 were used for personal purposes, resulting in a total estimate 95,876,000 householdvehicles [=89,173,502 + 50% × 13,405,772].
10
1
1.2
1.4
1.6
1.8
2
2.2
1969 1977 1983 1990 1995 2001
(Ind
exed
to 1
969
(196
9=1)
)
VehiclesDriversWorkersHouseholdsPopulation
Figure 1Changes in Summary Demographics
19691, 1977, 1983, 1990, 1995 NPTS, and 2001 NHTS
During the past three decades, the number of vehicles increased at a steeper rate than most
other demographic indicators. For example, it increased at an annual rate that was almost one
and one-half times that of the total number of licensed drivers.

2001 NHTS Summary of Travel Trends Travel and Demographic Summary
11
Table 2Summary of Demographic Trends
1969, 1977, 1983, 1990, 1995 NPTS, and 2001 NHTS
1969 1977 1983 1990 1995 2001
Persons per household 3.16 2.83 2.69 2.56 2.63 2.58
Vehicles per household 1.16 1.59 1.68 1.77 1.78 1.89
Licensed drivers per household 1.65 1.69 1.72 1.75 1.78 1.77
Vehicles per licensed driver 0.70 0.94 0.98 1.01 1.00 1.06
Workers per household 1.21 1.23 1.21 1.27 1.33 1.35
Vehicles per worker 0.96 1.29 1.39 1.40 1.34 1.39
Note:• The 1969 survey does not include pickups and other light trucks as household vehicles.
The typical American household continues to own more vehicles. The percentage of
households who own 3 or more vehicles increased from 19% in 1995 to 23% in 2001 (Table
17). The number of workers per household increased slightly, probably reflecting the trend in
which retirees return to the labor market.

Travel and Demographic Summary 2001 NHTS Summary of Travel Trends
12
Table 3Summary of Travel Statistics
1969, 1977, 1983, 1990, 1995 NPTS, and 2001 NHTS
1969 1977 1983 19901990Adj. 1995 2001
2001(includes trips bychildren youngerthan 4 year olds)
Per PersonDaily Person Trips 2.02 2.92 2.89 3.08 3.76 4.30 3.74 4.03Daily PMT 19.51 25.95 25.05 28.56 34.91 38.67 36.89 39.26
Per DriverDaily Vehicle Trips 2.32 2.34 2.36 2.67 3.26 3.57 3.35 -Daily VMT 20.64 19.49 18.68 23.69 28.49 32.14 32.73 -
Per HouseholdDaily Person Trips 6.36 7.69 7.20 7.32 8.94 10.49 9.66 10.39Daily PMT 61.55 68.27 62.47 67.95 83.06 94.41 95.24 101.38Daily Vehicle Trips 3.83 3.95 4.07 4.66 5.69 6.36 5.95 -Daily VMT 34.01 32.97 32.16 41.37 49.76 57.25 58.05 -
Per TripAverage person triplength (miles) 9.67 8.87 8.68 9.45 9.47 9.13 10.04 9.94Average vehicle triplength (miles) 8.89 8.34 7.90 8.98 8.85 9.06 9.87 -
Note: • Average vehicle trip length for 1990, 1995, and 2001 is calculated using only those records with trip mileage information present.• Note that inclusion of the 0-4 year olds in travel measures does not change vehicle trips or VMT, since such measures are taken
from the driver of the trip.• The 1969 survey does not include pickups and other light trucks as household vehicles.• Note that only the 1990 data have been adjusted to make them more comparable with the 1995 and 2001 data. Thus, there are
limits on the conclusions that can be drawn in comparing travel with earlier survey years. The adjustments to 1990 data affectonly person trips, vehicle trips, person miles of travel (PMT) and vehicle miles of travel (VMT).
Despite the improvement in the 2001 survey where particular attention was given to accurately
record walking trips, Americans took fewer trips in 2001 than in 1995. However, this by no
means suggests that Americans became less mobile. Although fewer trips were taken, the trips
were longer in 2001 than in previous years.

2001 NHTS Summary of Travel Trends Travel and Demographic Summary
13
Table 4 compares data from the NPTS and NHTS, and those from other data sources. Givenits project-specific goals, each data source has its own scope in terms of data collectionmethod, target population, and data validation and estimation procedures. Therefore,comparison of NPTS/NHTS data to data from other sources is at best informative but notconclusive.
Data on the total number of households for year 2001 were estimated by the Bureau of Censusof the U.S. Department of Commerce as reported in the Current Population Survey Report(March 2001 edition, from Census Bureau Web page, http://www.census.gov). Data on 2001population were obtained from the Census Bureau Web page, http://www.census.gov. TheNPTS estimated household population; the Bureau of Census measured resident and civilianpopulation. The Bureau of Census’ estimates are for July 1 of each year.
Data on the number of licensed drivers are reported by the Federal Highway Administration(FHWA) of the U.S. Department of Transportation (US DOT) in its annual Highway Statistics(Table DL-22 of the 2001 report). Note that Highway Statistics shows the cumulative numberof driver’s licenses issued, while the NPTS estimates the number of people who hold a driver’sl i c e n s e . ( T h e H i g h w a y S t a t i s t i c s s e r i e s c a n b e f o u n d a t :www.fhwa.dot.gov/ohim/ohimstat.htm.)
The NPTS’s and NHTS’s estimate on vehicles includes all household-based vehicles butexcludes most fleet vehicles, whereas Highway Statistics reports all vehicles (personal andcommercial) categorized by vehicle type (e.g., automobiles, 2-axle, 4-tire trucks, etc.). Toestimate comparable “household-based” vehicles from Highway Statistics, all of theautomobiles, motorcycles, and a percentage of the 2-axle 4-tire trucks are assumed to behousehold-based vehicles. The percent 2-axle 4-tire trucks used for personal purposes isestimated from the Truck Inventory and Use Surveys (TIUS) and varies by year:
1977: 63.21% trucks, from 1977 TIUS
1983: 64.20% trucks, from 1982 TIUS
1990: 72.38% trucks, from 1990 TIUS
1995: 73.90% trucks, from 1992 TIUS
2001: 74.85% trucks, from 1997 TIUS

Travel and Demographic Summary 2001 NHTS Summary of Travel Trends
14
Table 4Comparison of Survey Variables with Other Sources
(thousands)
Households PopulationLicensedDrivers Vehicles
1969
Other Sources 61,806 199,145 108,306 89,174
NPTS 62,504 197,213 102,986 72,500
1977
Other Sources 74,142 218,106 138,121 132,155
NPTS 75,412 213,141 127,552 120,098
1983
Other Sources 83,918 232,086 154,389 152,070
NPTS 85,371 229,453 147,015 143,714
1990
Other Sources 91,947 247,826 167,015 172,902
NPTS 93,347 239,416 163,025 165,221
1995
Other Sources 97,386 261,538 176,628 180,735
NPTS 98,990 259,994 176,330 176,067
2001
Other Sources 108,209 285,318 191,276 205,551
NHTS 107,365 277,203 190,425 202,586
Note:• See the previous page for details on sources for other years.• The 1969 NPTS survey includes only automobiles, station wagons, and
van buses/minibuses as household vehicles.

2001 NHTS Summary of Travel Trends Household Travel
15
Table 5Average Annual PMT, Person Trips and Trip Length by Trip Purpose
1983, 1990, 1995 NPTS, and 2001 NHTS
Trip Purpose 1983 1990 1990 Adjusted 1995 2001
Average Annual PMT per HouseholdAll Purposes 22,802 24,803 30,316 34,459 35,244To/From Work 4,586 5,637 5,637 7,740 6,706Work Related Business 1,354 1,043 1,043 1,987 2,987Shopping 2,567 2,674 3,343 4,659 4,887All Other Fam/Per Business 3,311 5,083 7,167 7,381 6,671School/Church 1,522 1,599 1,599 1,973 2,060Social and Recreational 8,964 8,567 11,308 10,571 10,586Other 500 195 214 131 1,216
Average Annual Person Trips per HouseholdAll Purposes 2,628 2,673 3,262 3,828 3,581To/From Work 537 539 539 676 565Work Related Business 62 38 38 100 109Shopping 474 504 630 775 707All Other Fam/Per Business 456 606 854 981 863School/Church 310 304 304 337 351Social and Recreational 728 662 874 953 952Other 61 20 22 6 30
Average Person Trip Length (miles)All Purposes 8.68 9.45 9.47 9.13 10.03To/From Work 8.54 10.65 10.65 11.63 12.11Work Related Business 21.77 28.20 28.20 20.28 28.26Shopping 5.41 5.38 5.38 6.08 7.02All Other Fam/Per Business 7.27 8.55 8.55 7.63 7.84School/Church 4.90 5.39 5.39 5.98 6.00Social and Recreational 12.31 13.19 13.19 11.27 11.36Other 8.22 10.30 10.30 22.83 43.08
Note: • 1995 VMT and vehicle trips with “To or From Work” as a trip purpose are believed to be overstated.• Average person trip length for 1990, 1995, and 2001 is calculated using only those records with trip mileage information present.• All tables reporting totals could include some unreported characteristics.• Note that only the 1990 data have been adjusted to make them more comparable with the 1995 and 2001 data. Thus, there are limits on the
conclusions that can be drawn in comparing travel with earlier survey years. The adjustments to 1990 data affect only person trips, vehicletrips, person miles of travel (PMT) and vehicle miles of travel (VMT).
• See Appendix for 2001 figures including 0 to 4 year-olds.
Compared to 1995, a typical household traveled slightly more miles in 2001. This increase
took the form of fewer, but generally longer trips. The average distance for commuting to
work continued to increase.

Household Travel 2001 NHTS Summary of Travel Trends
16
Table 6Average Annual VMT, Vehicle Trips and Trip Length by Selected Trip Purposes
1969, 1977, 1983, 1990, 1995 NPTS, and 2001 NHTS
Trip Purpose 1969 1977 1983 19901990
Adjusted1995 2001
Average Annual VMT per HouseholdAll Purposes 12,423 12,036 11,739 15,100 18,161 20,895 21,187To or From Work 4,183 3,815 3,538 4,853 4,853 6,492 5,724Shopping 929 1,336 1,567 1,743 2,178 2,807 3,062Other Fam & Personal Business 1,270 1,444 1,816 3,014 4,250 4,307 3,956Social and Recreational 4,094 3,286 3,534 4,060 5,359 4,764 5,186
Average Annual Vehicle Trips per HouseholdAll Purposes 1,396 1,442 1,486 1,702 2,077 2,321 2,171To or From Work 445 423 414 448 448 553 479Shopping 213 268 297 345 431 501 459Other Fam. & Personal Business 195 215 272 411 579 626 537Social and Recreational 312 320 335 349 460 427 441
Average Vehicle Trip Length (miles)All Purposes 8.90 8.35 7.90 8.98 8.85 9.06 9.87To or From Work 9.40 9.02 8.55 10.97 10.97 11.80 12.08Shopping 4.36 4.99 5.28 5.10 5.10 5.64 6.74Other Fam. & Personal Business 6.51 6.72 6.68 7.43 7.43 6.93 7.45Social and Recreational 13.12 10.27 10.55 11.80 11.80 11.24 11.91
Note: C 1995 VMT and vehicle trips with “To or From Work” as a trip purpose are believed to be overstated.C Average vehicle trip length for 1990, 1995, and 2001 is calculated using only those records with trip mileage information present.C All purposes includes other purposes not shown above, such as trips to school, church, doctor, dentist, and work-related business
trips.C All tables reporting totals could include some unreported characteristics.C Note that only the 1990 data have been adjusted to make them more comparable with the 1995 and 2001 data. Thus, there are
limits on the conclusions that can be drawn in comparing travel with earlier survey years. The adjustments to 1990 data affectonly person trips, vehicle trips, person miles of travel (PMT) and vehicle miles of travel (VMT).
Similar to what was observed in the 1995 survey, commuting had the largest share of vehicle
travel. In the past, social and recreational trips had the longest average driving distance among
all trips. However, this pattern has changed since 1995, with commuting trips becoming the
longest.

2001 NHTS Summary of Travel Trends Household Travel
17
Table 7Average Annual Person Trips per Household
by Mode of Transportation and MSA Size1977, 1983, 1990, 1995 NPTS, and 2001 NHTS
Mode of TransportationSMSA or MSA Size 1977 1983 1990 1990 Adjusted 1995 2001
PrivateALL 2,351 2,152 2,329 2,861 3,307 3,090Not in (S)MSA 2,436 2,322 2,306 2,837 3,492 3,076Less than 250,000 2,517 2,375 2,508 3,090 3,503 3,304250,000 - 499,999 2,574 2,443 2,461 3,014 3,472 3,251500,000 - 999,999 2,628 2,140 2,413 2,957 3,509 3,3481,000,000 - 2,999,999 2,366 2,031 2,430 2,986 3,354 3,1743,000,000 and above 1,785 1,691 2,160 2,649 3,075 2,911
PublicTransitALL 73 60 52 58 67 58Not in (S)MSA 22 11 13 14 9 6Less than 250,000 47 17 27 30 23 12250,000 - 499,999 44 23 19 22 18 18500,000 - 999,999 58 48 28 33 33 111,000,000 - 2,999,999 86 67 46 52 37 363,000,000 and above 189 181 112 124 137 128
WalkALL 261 226 193 234 205 309Not in (S)MSA 199 211 146 175 134 221Less than 250,000 241 280 172 212 138 248250,000 - 499,999 206 199 165 203 152 251500,000 - 999,999 256 184 132 161 138 2241,000,000 - 2,999,999 295 179 170 207 162 2753,000,000 and above 396 330 278 337 301 423
ALL MODESALL 2,808 2,628 2,673 3,262 3,828 3,581Not in (S)MSA 2,800 2,766 2,580 3,151 3,878 3,435Less than 250,000 2,944 2,889 2,816 3,450 3,926 3,678250,000 - 499,999 2,945 2,891 2,741 3,340 3,894 3,645500,000 - 999,999 3,049 2,542 2,667 3,252 3,916 3,6921,000,000 - 2,999,999 2,861 2,463 2,737 3,344 3,795 3,6023,000,000 and above 2,459 2,326 2,641 3,213 3,765 3,593Note:C Increases in Walk trips in 2001 are due, at least in part, to respondents being explicitly asked to include walk trips, which was not the case in prior surveys.C The population size groups for 1977 - 1983 NPTS are SMSA Size Groups and 1990 - 2001 are MSA Size Groups.C In 2001, the mode “Bus” was divided into “Local Public Transit Bus,” “Commuter Bus,” “Charter/tour bus,” and “City to city bus.” Only “Local Public Transit
Bus” and “Commuter Bus” are included in public transit calculations.C All modes includes other modes not specified such as bike, school bus, taxi and other.C All tables reporting totals could include some unreported characteristics. Of particular interest, trips with an unreported mode dropped from 126 per household
in 1995 to 2 in 2001.C Note that only the 1990 data have been adjusted to make them more comparable with the 1995 and 2001 data. Thus, there are limits on the conclusions that
can be drawn in comparing travel with earlier survey years. The adjustments to 1990 data affect only person trips, vehicle trips, person miles of travel (PMT)and vehicle miles of travel (VMT).
C See Appendix for 2001 figures including 0 to 4 year-olds.

Household Travel 2001 NHTS Summary of Travel Trends
18
Table 8Person Trips per Household by Household Income
1983, 1990, and 1995 NPTS and 2001 NHTS
Income 1983 1990 1990 Adjusted 1995 2001
AnnualCompounded
Rate,1990-2001
ALL 2,628 2,673 3,262 3,828 3,581 0.9%< $10,000 1,407 1,710 2,098 2,137 2,046 -0.2%$10 to $20,000 1,927 1,968 2,412 2,790 2,542 0.5%$20 to $30,000 2,376 2,455 3,008 3,522 3,065 0.2%$30 to $40,000 2,739 2,802 3,431 3,980 3,535 0.3%$40 to $50,000 3,037 3,101 3,791 4,298 3,905 0.3%$50 to $60,000 3,284 3,391 4,138 4,539 4,348 0.5%$60 to $70,000 3,485 3,660 4,458 4,726 4,545 0.2%$70 to $80,000 3,635 3,832 4,659 4,855 4,867 0.4%$80,000+ 3,602 3,747 4,570 4,829 4,934 0.7%Unreported 2,090 2,536 3,424 2,431 -0.4%
Note:C Incomes for 1983, 1990, adjusted 1990, and 1995 have been adjusted to 2001 dollars.C All tables reporting totals could include some unreported characteristics.C Note that only the 1990 person trip data have been adjusted to make them more comparable with the 1995 and 2001 data. Thus, there are limits
on the conclusions that can be drawn in comparing travel with earlier survey years. The adjustments to 1990 data affect only person trips, vehicletrips, person miles of travel (PMT) and vehicle miles of travel (VMT).
C See Appendix for 2001 figures including 0 to 4 year-olds.
Since the NHTS sample excluded households without telephones, care should be taken in
interpreting results that might be affected by telephone ownership (which is related to family
income). For example, estimates of survey data categorized by family income could
underestimate trips made by low-income households and, therefore, not adequately represent the
population as a whole. Travel by more affluent households continued to grow, widening the gap
between low-income and high-income households.

2001 NHTS Summary of Travel Trends Person Travel
19
Table 9Total Person Trips by Mode of Transportation and Trip Purpose
Adjusted 1990 and 1995 NPTS, and 2001 NHTS(millions)
Total To/ FromWork
Work-RelatedBusiness
Family/PersonalBusiness
School orChurch
Social andRecreational Other
Private
1990 Adj 267,029(87.8%)
45,856(91.2%)
3,178(90.3%)
128,368(92.7%)
17,545(61.9%)
70,382(86.3%)
1,629(81.4%)
1995 327,400(89.3%)
60,740(92.8%)
8,835(91.9%)
156,065(92.6%)
22,436(69.6%)
78,809(87.6%)
470(83.2%)
2001 331,791(86.3%)
56,054(92.4%)
10,648(91.2%)
153,270(90.9%)
26,861(71.3%)
82,437(80.7%)
2,147(67.2%)
Public Transit
1990 Adj 5,460(1.8%)
1,992(4.0%)
92(2.6%)
1,318(1.0%)
1,076(3.8%)
946(1.2%)
35(1.7%)
1995 6,638(1.8%)
2,328(3.6%)
123(1.3%)
2,000(1.2%)
826(2.6%)
1,350(1.5%)
11(1.9%)
2001 6,202(1.6%)
2,271(3.7%)
213(1.8%)
1,776(1.1%)
800(2.1%)
989(1.0%)
134(4.2%)
Walk
1990 Adj 21,879(7.2%)
1,999(4.0%)
154(4.4%)
7,722(5.6%)
3,649(12.8%)
8,090(9.9%)
265(13.2%)
1995 20,325(5.4%)
1,510(2.3%)
240(2.4%)
8,756(5.0%)
2,925(8.8%)
6,845(7.3%)
47(7.6%)
2001 33,145(8.6%)
1,715(2.8%)
487(4.2%)
11,936(7.1%)
3,630(9.6%)
14,824(14.5%)
507(15.9%)
Other
1990 Adj 9,867(3.2%)
428(0.8%)
95(2.7%)
1,087(0.8%)
6,086(21.4%)
2,098(2.6%)
73(3.6%)
1995 12,099(3.2%)
887(1.3%)
417(4.2%)
1,768(1.0%)
6,035(18.1%)
2,954(3.1%)
37(6.0%)
2001 12.975(3.4%)
584(1.0%)
317(2.7%)
1,468(0.9%)
6,351(16.9%)
3,829(3.7%)
394(12.3%)
TOTAL
1990 Adj 304,471(100%)
50,314(100%)
3,529(100%)
138,559(100%)
28,397(100%)
81,575(100%)
2,014(100%)
1995 378,930(100%)
66,901(100%)
9,860(100%)
173,764(100%)
33,355(100%)
94,362(100%)
623(100%)
2001 384,484(100%)
60,690(100%)
11,676(100%)
168,560(100%)
37,671(100%)
102,165(100%)
3,198(100%)
Note:C All tables reporting totals could include some unreported characteristics.C 1995 VMT and vehicle trips with “To or From Work” as a trip purpose are believed to be overstated.C Increases in Walk trips in 2001 are due, at least in part, to respondents being explicitly asked to include walk trips, which was not the case in prior surveys.C In 2001, the mode “Bus” was divided into “Local Public Transit Bus,” “Commuter Bus,” “Charter/tour bus,” and “City to city bus.” Only “Local Public Transit Bus”
and “Commuter Bus” are included in public transit calculations.C Note that only the 1990 data have been adjusted to make them more comparable with the 1995 and 2001 data. Thus, there are limits on the conclusions that can be
drawn in comparing travel with earlier survey years. The adjustments to 1990 data affect only person trips, vehicle trips, person miles of travel (PMT) and vehiclemiles of travel (VMT).
C See Appendix for 2001 figures including 0 to 4 year-olds.

Person Travel 2001 NHTS Summary of Travel Trends
20
Table 10Person Trips per Person by Trip Purpose and Gender
Adjusted 1990 and 1995 NPTS, and 2001 NHTS
Women Men1990 Adj 1995 2001 1990 Adj 1995 2001
Total 1,401(100%)
1,558(100%)
1,494(100%)
1,339(100%)
1,579(100%)
1,491(100%)
To or From Work 197(14.1%)
229(14.7%)
200(13.4%)
259(19.3%)
327(20.7%)
273(18.3%)
Work Related Business 11(0.8%)
23(1.5%)
25(1.7%)
21(1.6%)
60(3.8%)
66(4.5%)
Family and Personal Business 693(49.4%)
786(50.5%)
715(47.9%)
549(41.0%)
648(41.1%)
590(39.6%)
School/Church 132(9.4%)
141(9.1%)
151(10.1%)
123(9.2%)
134(8.5%)
141(9.5%)
Social and Recreational 358(25.6%)
375(24.1%)
389(26.0%)
377(28.2%)
406(25.7%)
405(27.2%)
Other 9(0.6%)
3(0.2%)
12(0.8%)
9(0.7%)
2(0.1%)
13(0.9%)
Note:C Note that 2001 data excludes persons aged 0 to 4 since travel by such persons were not included in the 1990 and 1995
surveys.C 1995 VMT and vehicle trips with “To or From Work” as a trip purpose are believed to be overstated.C Note that only the 1990 data have been adjusted to make them more comparable with the 1995 and 2001 data. Thus,
there are limits on the conclusions that can be drawn in comparing travel with earlier survey years. The adjustmentsto 1990 data affect only person trips, vehicle trips, person miles of travel (PMT) and vehicle miles of travel (VMT).
C All tables reporting totals could include some unreported characteristics.
Although both men and women took fewer trips, on average, in 2001 than in 1995, travel by
men decreased at a greater rate than that by women. By 2001, women were equally mobile as
men, in terms of the number of trips per person. Trips for family and personal business
continued to dominate women’s travel.

2001 NHTS Summary of Travel Trends Person Travel
21
Figure 2Distribution of Person Trips per Person by Gender and Trip Purpose
1995 NPTS and 2001 NHTS
The most striking gender difference in travel is non-work travel. About half of women’s travel
is for family and personal business (e.g., groceries shopping, taking children to school, or
organized sports.) The comparable rate for men is less than 40%.

Person Travel 2001 NHTS Summary of Travel Trends
22
Table 11 Daily Trip Rates per Person by Trip Purpose
1977, 1983, 1990, 1995 NPTS, and 2001 NHTS
1977 1983 1990 Adjusted 1990 1995 2001Person Trips per Day
Total 2.92 2.89 3.08 3.76 4.30 4.09
To or From Work 0.57 0.59 0.62 0.62 0.76 0.65
Family/Personal Business 0.91 1.02 1.28 1.71 1.97 1.79
School/Church 0.35 0.34 0.35 0.35 0.38 0.40
Social and Recreational 0.71 0.80 0.76 1.01 1.07 1.09Other 0.38 0.14 0.06 0.06 0.12 0.16
Person Miles of Travel per Day
Total 25.95 25.05 28.56 34.91 38.67 40.25
To or From Work 5.16 5.04 6.49 6.49 8.69 7.66
Family/Personal Business 5.68 6.46 8.93 12.10 13.51 13.20
School/Church 1.61 1.67 1.84 1.84 2.21 2.35
Social and Recreational 7.81 9.85 9.86 13.02 11.86 12.09
Other 5.68 2.04 1.43 1.46 2.39 4.80
Note:C All tables reporting totals could include some unreported characteristics.C Note that 2001 data excludes persons aged 0 to 4 since such persons were not included in the 1990 and 1995 surveys.C The 1995 “To or From Work” person trips and person miles are believed to be overstated.C “Other” trip purpose includes trips for work-related business.C Note that only the 1990 data have been adjusted to make them more comparable with the 1995 and 2001 data. Thus, there
are limits on the conclusions that can be drawn in comparing travel with earlier survey years. The adjustments to 1990 dataaffect only person trips, vehicle trips, person miles of travel (PMT) and vehicle miles of travel (VMT).
In 2001, a typical American household took fewer, but longer trips than in the previous years.
On a per individual basis, the number of person trips per day decreased for the first time since
1977. This decrease might reflect the increase in the number of multi-person households which
reduced the need for members in the household to make the same type of trip. On average, a
person 5 years or older took about 4 trips a day, representing a 5% decrease from five years ago.
Almost one-half of these trips were for family and personal business.

2001 NHTS Summary of Travel Trends Person Travel
23
Table 12Distribution of Daily Person Miles of Travel per Person
by Mode of Transportation and Trip PurposeAdjusted 1990 and 1995 NPTS, 2001 NHTS
Private Public Transit Other TOTAL
Adjusted 1990 1995 2001
Adjusted1990 1995 2001
Adjusted1990 1995 2001
Adjusted1990 1995 2001
TOTAL 30.85(88.4%)
35.26(92.1%)
35.49(88.2%)
0.74(2.1%)
0.82(2.1%)
0.47(1.2%)
3.31(9.5%)
2.20(5.7%)
4.10(10.2%)
34.91(100%)
38.67(100%)
40.25(100%)
To or From Work
6.15(17.6%)
8.09(20.9%)
7.11(17.7%)
0.27(0.8%)
0.30(0.8%)
0.24(0.6%)
0.06(0.2%)
0.22(0.6%)
0.30(0.7%)
6.49(18.6%)
8.69(22.5%)
7.66(19.0%)
Work Related Business
0.63(1.8%)
1.85(4.8%)
2.27(5.6%)
0.01(0.0%)
0.02(0.1%)
0.01(0.0%)
0.56(1.6%)
0.34(0.9%)
1.12(2.8%)
1.20(3.4%)
2.23(5.8%)
3.41(8.5%)
Family/Personal Business
11.39(32.6%)
12.70(32.8%)
12.77(31.7%)
0.14(0.4%)
0.19(0.5%)
0.10(0.3%)
0.57(1.6%)
0.49(1.3%)
0.32(0.8%)
12.10(34.7%)
13.51(34.9%)
13.20(32.8%)
School/ Church
1.32(3.8%)
1.68(4.3%)
1.87(4.6%)
0.12(0.3%)
0.07(0.2%)
0.04(0.1%)
0.40(1.1%)
0.44(1.1%)
0.44(1.1%)
1.84(5.3%)
2.21(5.7%)
2.35(5.8%)
Social and Recreational
11.12(31.9%)
10.83(28.0%)
11.01(27.3%)
0.18(0.5%)
0.24(0.6%)
0.07(0.2%)
1.71(4.9%)
0.66(1.7%)
1.01(2.5%)
13.02(37.3%)
11.86(30.7%)
12.09(30.0%)
Other 0.23(0.7%)
0.10(0.3%)
0.36(0.9%)
0.01(0.0%)
0.00(0.0%)
0.00(0.0%)
0.01(0.0%)
0.05(0.1%)
0.87(2.2%)
0.25(0.7%)
0.15(0.4%)
1.39(3.5%)
Note:C All tables reporting totals could include some unreported characteristics.C Note that 2001 data excludes persons aged 0 to 4 since such persons were not included in the 1990 and 1995
surveys.C In 2001, the mode “Bus” was divided into “Local Public Transit Bus,” “Commuter Bus,” “Charter/tour bus,” and
“City to city bus.” Only “Local Public Transit Bus” and “Commuter Bus” are included in public transitcalculations.
C Note that only the 1990 data have been adjusted to make them more comparable with the 1995 and 2001 data. Thus, there are limits on the conclusions that can be drawn in comparing travel with earlier survey years. Theadjustments to 1990 data affect only person trips, vehicle trips, person miles of travel (PMT) and vehicle miles oftravel (VMT).
C Numbers in parenthesis are a percentage of total daily person miles of travel.
Although taking fewer trips, an individual traveled, on average, slightly more miles per day in
2001 than in 1995. The decreases in daily travel for work and for family and personal business
were offset somewhat by the increases in miles traveled for work-related business and for social
and recreational trips.

Person Travel 2001 NHTS Summary of Travel Trends
24
Table 13Average Daily Person Trips per Person by Age and Gender
1983, 1990, 1995 NPTS, and 2001 NHTS
AgeTOTAL Men Women
1983 1990 1990Adj 1995 2001 1983 1990 1990
Adj 1995 2001 1983 1990 1990Adj 1995 2001
Total 2.9 3.1 3.8 4.3 4.1 2.9 3.0 3.7 4.3 4.1 2.9 3.1 3.8 4.3 4.1Under 16 2.3 2.6 3.1 3.7 3.4 2.3 2.6 3.0 3.7 3.5 2.3 2.6 3.1 3.8 3.416 to 20 3.3 3.5 4.2 4.6 4.1 3.2 3.5 4.2 4.6 4.0 3.4 3.5 4.2 4.7 4.221 to 35 3.5 3.6 4.4 4.6 4.3 3.4 3.5 4.2 4.5 4.2 3.5 3.7 4.6 4.8 4.536 to 65 2.9 3.2 3.9 4.6 4.5 2.9 3.1 3.7 4.6 4.4 3.0 3.3 4.1 4.6 4.5Over 65 1.8 1.9 2.4 3.4 3.4 2.2 2.2 2.8 3.9 3.8 1.5 1.7 2.2 3.0 3.1
Note:C All tables reporting totals could include some unreported characteristics.C Note that 2001 data excludes persons aged 0 to 4 since such persons were not included in the 1990 and 1995
surveys.C Note that only the 1990 data have been adjusted to make them more comparable with the 1995 and 2001 data.
Thus, there are limits on the conclusions that can be drawn in comparing travel with earlier survey years. Theadjustments to 1990 data affect only person trips, vehicle trips, person miles of travel (PMT) and vehicle miles oftravel (VMT).

2001 NHTS Summary of Travel Trends Person Travel
25
Figure 3Average Daily Person Trips by Age and Gender
From 1995 to 2001
As a group, both men and women decreased their travel slightly from five years ago. By 2001,
men and women took, on average, an equal number of trips per day (Table 13). The most
striking gender difference in travel was among individuals 65 years or older. Women 65 years
or older took about 20% fewer trips than did older men. Between the ages 16 and 65, women
took an equal number or more trips than men. This pattern was true for both 1995 and 2001.

Person Travel 2001 NHTS Summary of Travel Trends
26
Table 14Average Daily Person Miles of Travel per Person by Age and Gender
1983, 1990, 1995 NPTS, and 2001 NHTS
Age
TOTAL Men Women
1983 1990 1990Adj 1995 2001 1983 1990 1990
Adj 1995 2001 1983 1990 1990Adj 1995 2001
Total 25.1 28.6 34.9 38.7 40.2 27.7 31.6 38.0 43.9 45.0 22.6 25.8 32.1 33.8 35.7Under 16 16.2 16.2 20.1 25.0 24.5 16.8 16.3 20.3 23.7 24.6 15.4 16.1 19.9 26.2 24.4
16 to 20 22.2 28.1 34.4 36.4 38.1 23.0 30.1 36.9 37.6 34.1 21.5 26.2 32.2 35.0 42.5
21 to 35 31.1 36.5 44.3 46.0 45.6 32.8 40.4 48.2 51.3 49.8 29.5 32.9 40.7 40.8 41.5
36 to 65 29.2 33.0 40.1 45.1 48.8 33.6 36.5 43.4 53.2 57.7 25.2 29.7 37.0 37.5 40.4
Over 65 12.0 14.2 18.4 24.4 27.5 14.8 17.4 22.5 31.7 32.9 10.2 11.8 15.3 19.2 23.5
Note:C All tables reporting totals could include some unreported characteristics.C Note that 2001 data excludes persons aged 0 to 4 since such persons were not included in the 1990 and 1995
surveys.C Note that only the 1990 data have been adjusted to make them more comparable with the 1995 and 2001 data.
Thus, there are limits on the conclusions that can be drawn in comparing travel with earlier survey years. Theadjustments to 1990 data affect only person trips, vehicle trips, person miles of travel (PMT) and vehicle miles oftravel (VMT).
On average, an individual traveled 40 miles per day, with men traveling 10 miles more, on
average, than women. As evident in Table 14 and Figure 4, there were significant travel
differences between men and women by age. The difference in miles traveled is particularly
telling given the fact that men and women took about an equal number of trips per day (Table
13). Women's trips were notably shorter than men's trips.

2001 NHTS Summary of Travel Trends Person Travel
27
Figure 4Average Daily Person Miles of Travel per Person by Gender
1995 NPTS and 2001 NHTS

Person Travel 2001 NHTS Summary of Travel Trends
28
Figure 5.Average Time Spent in Vehicle (Minutes) by Age
2001 NHTS
The average amount of time we spent in a vehicle (as a driver or a passenger) in 2001 was
slightly more than an hour and varied greatly by an individual’s age. Children younger than 5
years old spent three-quarters of an hour a day in vehicles. Compared to 1995, Americans spent
about 10% more time in their vehicles but traveled about the same number of miles (Figure 6).

2001 NHTS Summary of Travel Trends Person Travel
29
Figure 6Average Time Spent in Vehicle and Miles Traveled
1995 NPTS and 2001 NHTS

Private Vehicle Travel 2001 NHTS Summary of Travel Trends
30
Table 15Average Time Spent Driving a Private Vehicle in a Typical Day by MSA Size
Adjusted 1990 and 1995 NPTS, and 2001 NHTS (in Minutes)
All Drivers Only Persons Who Drove on Their Travel Day
MSA Size 1990 Adj 1995 2001 1990 Adj 1995 2001ALL 49.35 56.28 62.32 71.88 73.24 81.35Not in MSA 48.85 56.47 61.83 69.20 72.96 81.74< 250,000 48.36 53.98 60.22 67.94 69.35 76.40250,000 to 499,999 47.82 55.96 59.63 71.66 71.72 76.50500,000 to 999,999 50.20 56.91 62.59 72.42 73.35 79.341 to 2.9 million 50.61 56.48 62.89 74.38 72.19 79.553+ million 49.38 56.49 63.29 71.08 75.02 85.12
Note:C For 1990 and 1995, average time spent driving does not include any driving done in a segmented trip. Also excludes
driving done as an "essential part of work."C Note that only the 1990 data have been adjusted to make them more comparable with the 1995 and 2001 data. Thus,
there are limits on the conclusions that can be drawn in comparing travel with earlier survey years. The adjustmentsto 1990 data affect only person trips, vehicle trips, person miles of travel (PMT) and vehicle miles of travel (VMT).
The average time spent driving a private vehicle was calculated using two different methods:
1) by including all drivers, even those who did not drive a private vehicle on the designated
travel day, and 2) by excluding any drivers who did not drive on the designated travel day. Note
the 1990 data reported here are different from those published in the 1990 Nationwide Personal
Transportation Survey Databook, Volume II (Tables 5-66 to 5-68), due to the fact that adjusted
data were used for 1990. In 2001, a driver spent on average more than one hour behind the
wheel, an increase of 6 minutes from 1995. People living in smaller cities generally spent
slightly less time driving than those living in large areas.

2001 NHTS Summary of Travel Trends Private Vehicle Travel
31
Table 16Average Vehicle Occupancy for Selected Trip Purposes
1977, 1983, 1990, 1995 NPTS, and 2001 NHTS(person miles per vehicle mile)
Trip Purpose1977 1983 1990 1995 2001
Percent Change (77-01)
Total ChangeTo or From Work 1.3 1.29 1.14 1.14 1.14 -12.31%
Shopping 2.1 1.79 1.71 1.74 1.79 -14.76%Other Family or Personal Business 2.0 1.81 1.84 1.78 1.83 -8.50%
Social and Recreational 2.4 2.12 2.08 2.04 2.03 -15.42%
All Purposes 1.9 1.75 1.64 1.59 1.63 -14.21%
Note:C All Purposes includes other trip purposes not shown, such as trips to school, church, doctor, dentist, and
work-related business trips.
The trend of declining average vehicle occupancy, measured as person miles per vehicle mile,
was reversed in 2001. The difference between 1995 and 2001 is statistically significant at 95%
confidence. This trend probably reflects the gasoline price increases. In general, people are
less likely to carpool for commutes to and from work, but more likely to share rides for social
and recreational trips.

Vehicle Availability and Utilization 2001 NHTS Summary of Travel Trends
32
Table 17Availability of Household Vehicles
1969, 1977, 1983, 1990, 1995 NPTS, and 2001 NHTS(thousands)
Households with -- 1969 1977 1983 1990 1995 2001
No Vehicle 12,876(20.6%)
11,538(15.3%)
11,548(13.5%)
8,573(9.2%)
7,989(8.1%)
8,716(8.1%)
One Vehicle 30,252(48.4%)
26,092(34.6%)
28,780(33.7%)
30,654(32.8%)
32,064(32.4%)
33,757(31.4%)
Two Vehicles 16,501(26.4%)
25,942(34.4%)
28,632(33.5%)
35,872(38.4%)
40,024(40.4%)
39,938(37.2%)
Three or MoreVehicles
2,875(4.6%)
11,840(15.7%)
16,411(19.2%)
18,248(19.6%)
18,914(19.1%)
24,955(23.2%)
ALL 62,504(100.0%)
75,412(100.0%)
85,371(100.0%)
93,347(100.0%)
98,990(100.0%)
107,365(100.0%)
Vehicles PerHousehold 1.16 1.59 1.68 1.77 1.78 1.89
Note:C The 1969 survey does not include pickups or other light trucks as household vehicles.
More than 60% of all households had 2 or more vehicles in 2001. Furthermore, not only were
there more multi-vehicle households in 2001 than in 1995, they also owned more vehicles.
There was a shift in 2001 from 1- to 2-vehicle households to 3+ vehicle households.
Households that owned at least one vehicle owned an average of 2.05 vehicles in 2001,
compared to 1.93 in 1995. The percentage of households without a vehicle remained at the
1995 level, though the number of households without a vehicle increased - from 8 million
households in 1995 to more than 8.7 million in 2001.

2001 NHTS Summary of Travel Trends Vehicle Availability and Utilization
2 Only includes households that reported income information.
33
Figure 7Household Distribution2 by Household Income and Vehicle to Driver Ratio
2001 NHTS
There were significantly more households in 2001 than in 1995 who owned a greater number
of vehicles than there were drivers in the household. More than eighty percent of the
households had at least one vehicle for each of their drivers in 2001. It is clear that income
affects vehicle ownership and availability. Three out of every four low-income families did not
own a vehicle, while one in two families with household income more than $55,000 had more
vehicles than licensed drivers in their households.

Vehicle Availability and Utilization 2001 NHTS Summary of Travel Trends
34
Table 18Distribution of Households by Household Vehicle Availability and Population Density
1990 and 1995 NPTS and 2001 NHTS
Household VehicleAvailability
Population Density (Persons per Square Mile)
Less than 2,000 2,000 to 4,000 4,000 to 10,000 10,000 or more
1990 1995 2001 1990 1995 2001 1990 1995 2001 1990 1995 2001
ALL 100% 100% 100% 100% 100% 100% 100% 100% 100% 100% 100% 100%
No Vehicle 6.1% 3.9% 4.2% 7.6% 6.2% 5.9% 10.9% 8.5% 8.7% 35.1% 31.0% 28.1%
One Vehicle 30.4% 27.3% 26.2% 33.4% 33.8% 34.1% 38.2% 38.6% 37.0% 40.0% 41.7% 39.9%
Two Vehicles 41.0% 44.5% 40.1% 41.5% 42.3% 38.6% 34.9% 38.6% 36.5% 18.4% 21.3% 23.1%
Three or MoreVehicles 22.5% 24.3% 29.5% 17.5% 17.7% 21.4% 16.0% 14.4% 17.7% 6.5% 6.0% 8.9%
Population density seems to have little or no impact on households’ decisions to own a vehicle,
except in highly-populated areas with more than ten thousand persons per square mile. Almost
thirty percent of the households in areas with a population density greater than 10,000 per square
mile did not own a vehicle. On the other hand, almost 70% of the households in the least
densely-populated areas owned more than two vehicles.

2001 NHTS Summary of Travel Trends Vehicle Availability and Utilization
35
Figure 8Vehicle Ownership and Demographic Statistics by Population Density
2001 NHTS

Vehicle Availability and Utilization 2001 NHTS Summary of Travel Trends
36
Table 19Percent of Households Without a Vehicle Within MSA Size Group
1977, 1983, 1990, 1995 NPTS, and 2001 NHTS
(S)MSA Size% Households Within An Area Without a Vehicle
1977 1983 1990 1995 2001 % Change1977-2001
Not in (S)MSA 12.2 10.5 7.7 5.3 5.8 -52%
< 250,000 13.7 10.1 8.6 4.8 5.8 -58%
250,000 to 499,999 12.2 8.1 5.7 7.3 5.2 -57%
500,000 to 999,999 14.0 14.3 8.4 6.3 7.0 -50%
1 to 2.9 million 14.2 12.1 8.2 6.9 6.4 -55%
3+ million 26.1 25.4 12.4 11.2 11.9 -54%
ALL 15.3 13.5 9.2 8.1 8.1 -47%
Note:C The population size groups for 1977 - 1983 NPTS are SMSA Size Groups and 1990 - 2001 are MSA Size Groups.C All tables reporting totals could include some unreported characteristics.
The percentage of households not owning a vehicle increases with increasing area size. In
2001, about 6% of the households in non-MSA areas or in small cities (< 250,000) were without
a vehicle, representing a slight increase from 1995. The comparable percentage for areas with
more than 3 million people was close to 12%. In large cities, such as New York, some zero-
vehicle households are by choice due to the high cost and the inconvenience of owning a
vehicle, and the availability of other modes. About 6 to 7 percent of the households in medium-
size cities (with 500,000 to 3 million people) did not have a vehicle.

2001 NHTS Summary of Travel Trends Vehicle Availability and Utilization
37
Table 20Vehicle Distribution and Average Vehicle Age by Vehicle Type
1977, 1983, 1990, 1995 NPTS, and 2001 NHTS
1977 1983 1990 1995 2001Distribution of Vehicles
TOTAL 100.0 100.0 100.0 100.0 100.0 Auto 79.6 75.9 74.7 64.3 56.8 Van 2.8 3.6 5.5 7.8 9.0 Sport Utility NA NA NA 6.9 12.1 Pickup 12.8 15.2 17.2 17.7 18.4 Other Truck 1.3 1.5 0.6 0.4 0.5 RV/Motor Home 0.4 0.5 0.5 0.5 0.7 Motorcycle 2.7 2.5 1.3 0.9 2.1 Moped 0.2 0.6 0.1 NA NA Other 0.2 0.2 0.1 0.1 0.5
Average Vehicle Age TOTAL 6.6 7.60 7.71 8.33 8.87 Auto 6.4 7.20 7.61 8.24 8.98 Van 5.5 8.45 5.88 6.68 7.56 Sport Utility NA NA NA 6.56 6.44 Pickup 7.3 8.54 8.43 9.65 10.05 Other Truck 11.6 12.39 14.48 14.93 17.72 RV/Motor Home 4.5 10.69 10.44 13.21 13.49
Note:C The 1977, 1983, and 1990 surveys do not include a separate category for sports utility vehicles, while
the 1995 and 2001 surveys do. In 1990 survey, most SUVs were classified as automobiles. The 1995and 2001 surveys do not include a separate category for mopeds.
C Motorcycle, moped, and other pov are excluded from the calculation of vehicle age.C All tables reporting totals could include some unreported characteristics.
Automobiles continued to lose their market share of private vehicles, from 80% in 1977 to less
than 60% in 2001. In the meantime, the market share for sport utility vehicles (SUVs) doubled
between 1995 and 2001. Except for SUVs, the average age of vehicles in 2001 was greater
than in the past.

Vehicle Availability and Utilization 2001 NHTS Summary of Travel Trends
38
Table 21Distribution of Vehicles by Vehicle Age and Vehicle Type
1977, 1983, 1990, 1995 NPTS, and 2001 NHTS(percentage)
1977 1983 1990 1995 2001
Vehicle Age Auto Truck/Van
All Auto Truck/Van
All Auto Truck/Van
All Auto Truck/Van
All Auto Truck/Van
All
0 to 2 years 27.3 29.9 27.8 20.0 16.6 19.2 15.6 19.7 16.6 14.9 19.2 16.2 13.27 18.59 15.41
3 to 5 years 30.4 25.6 29.6 28.0 26.6 27.6 27.7 27.2 27.5 21.7 21.6 21.5 20.37 23.47 21.51
6 to 9 years 26.7 21.1 25.7 27.4 25.0 26.9 26.8 20.9 25.3 30.3 25.5 28.5 25.45 22.59 24.08
10 or more years 15.6 23.4 16.9 24.6 31.8 26.3 29.9 32.2 30.6 33.1 33.7 33.8 40.91 35.36 39.00
Total 100.0 100.0 100.0 100.0 100.0 100.0 100.0 100.0 100.0 100.0 100.0 100.0 100.0 100.0 100.0
Average Age 5.5 6.4 5.6 6.7 7.8 6.9 7.6 8.0 7.7 8.2 8.3 8.3 9.0 8.5 8.9
Note:C The 1969 survey does not include pickups and other light trucks as household vehicles.C Totals do not include any unreported vehicle ages, but do include vehicle types such as motorcycle, RV, etc. that are
not shown.
In 2001, household vehicles remained in operation significantly longer than those in 1977. In
1977, automobiles averaged 5.5 years of age while automobiles in 2001 averaged 9 years of age
– an increase of almost 3.5 years. In 2001, two out of every five vehicles were at least 10 years
old. In the past, trucks and vans tended to be in operation longer than automobiles. However,
this trend was no longer true by 2001.

2001 NHTS Summary of Travel Trends Vehicle Availability and Utilization
39
Figure 9Distribution of Vehicles by Vehicle Age
1977, 1983, 1990 and 1995 NPTS and 2001 NHTS

Vehicle Availability and Utilization 2001 NHTS Summary of Travel Trends
40
Table 22Average Annual Miles per Vehicle by Vehicle Age
(Vehicle Owner’s Estimate)1969, 1977, 1983, 1990, 1995 NPTS, and 2001 NHTS
Percent Change Annual
RateTotal
Change Vehicle Age 1969 1977 1983 1990 1995 2001 69-01 69-01 0 to 2 years 15,700 14,460 15,292 16,811 16,092 14,892 -0.16% -5.15%
3 to 5 years 11,200 11,074 11,902 13,706 14,004 13,230 0.52% 18.13%
6 to 9 years 9,700 9,199 9,253 12,554 12,608 11,603 0.56% 19.62%
10 or more years 6,500 6,755 7,023 9,176 8,758 7,863 0.60% 20.97%
ALL 11,600 10,679 10,315 12,458 12,226 11,078 -0.14% -4.50%
Note:C The 1969 survey does not include pickups and other light trucks as household vehicles.C All tables reporting totals could include some unreported characteristics.
Based on vehicle owners’ estimates, a vehicle was driven, on average, slightly more than11,000 miles a year in 2001, a decrease of 9% from 1995. Regardless of vehicle age, vehicleswere driven less in 2001, on average, than in 1995 or in 1990. Given the trend of more thanone vehicle per licensed driver, it is plausible that individual vehicles are being driven less thanin previous years.

2001 NHTS Summary of Travel Trends Vehicle Availability and Utilization
41
Table 23Average Annual Miles per Licensed Driver by Driver Age and Gender
(Driver’s Self Estimate)1969, 1977, 1983, 1990, 1995 NPTS, and 2001 NHTS
Driver Age 1969 1977 1983 1990 1995 2001Percent Change
Annual Rate Total Change69-01 69-01
ALL16 to 19 4,633 5,662 4,986 8,485 7,624 7,331 1.44% 58.23%20 to 34 9,348 11,063 11,531 14,776 15,098 15,650 1.62% 67.42%35 to 54 9,771 11,539 12,627 14,836 15,291 15,627 1.48% 59.93%55 to 64 8,611 9,196 9,611 11,436 11,972 13,177 1.34% 53.03%65+ 5,171 5,475 5,386 7,084 7,646 7,684 1.25% 48.60%ALL 8,685 10,006 10,536 13,125 13,476 13,785 1.45% 58.72%
Men16 to 19 5,461 7,045 5,908 9,543 8,206 8,228 1.29% 50.67%20 to 34 13,133 15,222 15,844 18,310 17,976 18,634 1.10% 41.89%35 to 54 12,841 16,097 17,808 18,871 18,858 19,287 1.28% 50.20%55 to 64 10,696 12,455 13,431 15,224 15,859 16,883 1.44% 57.84%65+ 5,919 6,795 7,198 9,162 10,304 10,163 1.70% 71.70%ALL 11,352 13,397 13,962 16,536 16,550 16,920 1.26% 49.05%
Women16 to 19 3,586 4,036 3,874 7,387 6,873 6,106 1.68% 70.27%20 to 34 5,512 6,571 7,121 11,174 12,004 12,266 2.53% 122.53%35 to 54 6,003 6,534 7,347 10,539 11,464 11,590 2.08% 93.07%55 to 64 5,375 5,097 5,432 7,211 7,780 8,795 1.55% 63.63%65+ 3,664 3,572 3,308 4,750 4,785 4,803 0.85% 31.09%ALL 5,411 5,940 6,382 9,528 10,142 10,233 2.01% 89.11%
Note:C All tables reporting totals could include some unreported characteristics.C In 1995, some drivers indicating that they drove 'no miles' for their average annual miles were changed to 'miles not reported.'
The number of miles driven per licensed driver continued to increase. On average, drivers in
2001 drove 3,000 miles more per year than those in 1995. This increase was primarily due to
the increased driving in 2001 by drivers between 55 and 65 years old compared to the amount
of driving by those of similar ages in 1995. The level of teen driving by girls decreased
significantly from the 1995 level.

Commute Travel Patterns 2001 NHTS Summary of Travel Trends
42
Table 24Commute VMT and Total VMT By Year
1969, 1977, 1983, 1990, 1995 NPTS, and 2001 NHTS
1969 1977 1983 1990 1990 adj 1995 2001
Commute Vehicle Trips (000,000) 27,844 31,886 35,271 41,792 41,792 54,782 51,395
Commute VMT (000,000) 260,716 287,710 301,644 453,042 453,042 642,610 614,548
Total VMT (000,000) 775,940 907,603 1,002,139 1,409,600 1,695,290 2,068,368 2,274,797
% Commute VMT of Total VMT 33.60% 31.70% 30.10% 32.14% 26.72% 31.07% 27.02%
Workers (000) 75,758 93,019 103,244 118,343 118,343 131,697 145,272
Annual Commute VehicleTrips per Worker 368 343 342 353 353 416 354
Note:C 1995 VMT and vehicle trips with “To or From Work” as a trip purpose are believed to be overstated.C Caution should be used when comparing the number of workers or the number of commute trips between the
1990 and 1995 NPTS. Slightly different approaches were used in defining workers and commute trips betweenthe 1990 and 1995 NPTS.

2001 NHTS Summary of Travel Trends Commute Travel Patterns
43
Figure 10Distribution of Workers by Usual Mode
1995 NPTS and 2001 NHTS(percentage)

Commute Travel Patterns 2001 NHTS Summary of Travel Trends
44
Table 25
Distribution of Workers by Usual Mode1969, 1977, 1983, 1990, 1995 NPTS, and 2001 NHTS
(percentage)
Mode of Transportation 1969 1977 1983 1990 1995 2001All Modes 100.0 100.0 100.0 100.0 100.0 100.0Auto, Truck, Van, or Utility Vehicle 90.8 87.0 88.6 87.8 91.0 90.8Public Transit 8.4 6.0 5.3 5.3 5.1 5.1Walk N/A 4.1 4.3 4.0 2.6 2.8Other 0.8 2.9 1.8 2.9 1.3 1.3
Note:C Usual mode is defined as the means of transportation usually used to go to work during the week before the
interview. Data in this table are derived from the person file.C The 1969 survey excludes walk trips.C All modes does not include workers who worked at home or any unreported modes.C Other includes other modes not shown above such as RV, motorcycle, other POV, Amtrak, airplane, taxi, bike,
school bus, and other.
Workers in the U.S. predominately traveled to work in privately-owned vehicles. About 5%of the commuters reported public transit as their usual mode to work. This percentage hasremained at about this level since 1983.

2001 NHTS Summary of Travel Trends Commute Travel Patterns
45
Table 26General Commute Patterns by Mode of Transportation
1983, 1990, 1995 NPTS, and 2001 NHTS
1983 1990 1995 2001 1983 1990 1995 2001 1983 1990 1995 2001 1983 1990 1995 2001ALL MODES Private Public Transit Walk
Average Commute Trip Length (miles)
8.54 10.65 11.63 12.11 8.86 11.02 11.84 12.10 11.81 12.75 12.88 11.73 0.32 0.83 0.74 0.91
Average Commute Travel Time (minutes)18.20 19.60 20.65 23.32 17.62 19.05 20.10 22.49 39.77 41.10 41.95 47.89 8.58 9.79 10.86 14.06
Average Commute Speed (miles per hour)
28.28 33.35 34.67 32.23 30.28 34.70 35.18 32.27 17.96 17.90 19.57 - 2.21 3.25 3.58 3.18
Note:C All Public Transit trips in 2001 had an access or egress recorded, which is equivalent to a 1990 or 1995
segmented trip. For this reason, average commute speed for these trips was not computed, and averagecommute travel time information may not be comparable to that of previous years.
C All trip miles and travel times were calculated using actual trips to and from work as reported in the travel day file.C Average Commute Speed was calculated using only those trips with both trip mileage and travel time information
present.C Average commute trip length for 1990, 1995, and 2001 was calculated using only those records with trip mileage
information present.C Average commute travel time does not include time spent waiting for transportation. In the 2001 NHTS, this
involved subtracting the number of minutes waiting for public transit (TRWAITTM) from the number of minutesto complete entire trip (TRVL_MIN).
C Average commute speed for 1990 and 1995 NPTS does not include any segmented trips because a change in themode of transportation during the trip would cause the calculation of average commute speed to be meaningless.
C In 2001, the mode “Bus” was divided into “Local Public Transit Bus,” “Commuter Bus,” “Charter/tour bus,” and“City to city bus.” Only “Local Public Transit Bus” and “Commuter Bus” are included in public transit calculations.
C All tables reporting totals could include some unreported characteristics. Air, taxi, bicycle, school bus, “Other”, andunreported vehicle types are excluded from the listed categories but included in “ALL MODES” totals for all years.From 1990, Amtrak is also included in totals but excluded from listed categories. In 2001, several new vehicledefinitions are also omitted from listed categories but included in totals: charter bus, city to city bus, ship/cruise,passenger line/ferry, sailboat/motorboat/yacht, limousine, and hotel/airport shuttle.

Commute Travel Patterns 2001 NHTS Summary of Travel Trends
46
Figure 11Average Commute Time in Privately-Owned Vehicles and MSA Size
1995 NPTS and 2001 NHTS
The average distance for commutes in privately-owned vehicles has remained relatively constantsince 1995. However, the average commute time increased by more than 10% from 1995 to2001, reflecting slower commute speeds and greater congestion (Tables 26 and 27). This wastrue regardless of where people lived (Figure 11). Compared to 1995, the commute distancesby public transit in 2001were shorter, but took more time.

2001 NHTS Summary of Travel Trends Commute Travel Patterns
47
Table 27Average Commute Speed by MSA Size
1983, 1990, 1995 NPTS, and 2001 NHTS(miles per hour)
MSA SizeNot in
(S)MSALess than250,000
250,000 to499,999
500,000 to999,999
1 to 2.9million
3 million andover
POV1983 33.44 28.28 30.14 29.91 30.00 28.371990 39.07 34.39 34.77 35.60 33.33 32.811995 39.53 36.55 35.21 35.36 34.11 33.432001 38.18 33.31 32.02 33.45 31.22 29.69
ALL MODES (INCLUDING POV)1983 32.23 27.26 30.08 28.52 28.09 24.511990 37.82 33.66 34.14 34.60 32.35 30.921995 38.90 35.85 35.98 35.25 34.62 32.412001 37.69 32.78 31.46 33.70 30.84 30.24
Note:• Average Commute Speed is calculated using only those trips with both trip mileage and travel time information
present• All trip miles and travel times were calculated using actual trips to and from work as reported in the travel day file.• Average commute speed for 1990 and 1995 NPTS does not include any segmented trips because a change in the
mode of transportation during the trip would cause the calculation of average commute speed to be meaningless.• Trips involving an access to or egress from public transit in 2001 were excluded.• The population size groups for 1977 - 1983 NPTS are SMSA Size Groups and 1990 - 2001 are MSA Size Groups.

Commute Travel Patterns 2001 NHTS Summary of Travel Trends
48
Not a MSA
500,000-999,999 people
1 - 2.9 million people
< 250,000 people
250,000-499,999 people
> 3 million people
Figure 12Average Commute Speed for Selected Time of Day by MSA Size
2001 NHTS(miles per hour)
In almost all areas, average commute speeds have decreased since 1995 (Table 27). Generally,
as the population of an area increases, commute speeds decrease. Depending on the time of day
and location, average commute speeds ranged widely. In larger areas, commute speeds start
to decline in mid-afternoon and continue to decline well into the early evening.

2001 NHTS Summary of Travel Trends Temporal Distribution
49
Table 28Distribution of Person Trips by Start Time of Trip
1983, 1990, 1995 NPTS, and 2001 NHTS
Time of Day 1983 19901990 Adj
1995 2001
10 pm - 1 am 4.0 4.0 4.1 3.5 2.9
1 - 6 am 3.3 1.9 1.8 1.7 1.8
6 - 9 am 14.4 13.9 12.5 13.8 14.4
9 am - 1 pm 23.4 20.1 20.6 24.2 24.6
1 - 4 pm 20.8 20.4 20.7 22.1 22.1
4 - 7 pm 21.2 22.8 22.9 23.0 22.3
7 - 10 pm 12.3 12.8 13.2 11.8 11.7
ALL 100.0 100.0 100.0 100.0 100.0
Note:• All tables reporting totals could include some unreported characteristics.• Note that only the 1990 data have been adjusted to make them more comparable with the 1995 and 2001 data. Thus,
there are limits on the conclusions that can be drawn in comparing travel with earlier survey years. The adjustmentsto 1990 data affect only person trips, vehicle trips, person miles of travel (PMT) and vehicle miles of travel (VMT).
• See Appendix for 2001 figures including 0 to 4 year-olds.
The temporal distribution of personal trips remained the same during the past decade – more
than two-fifths of the trips started between 9 o’clock in the morning and 4 o’clock in the
afternoon. However, this distribution varies somewhat by trip purpose (see Figure 13). As
expected, commuting to and from work began predominately between 6 and 9 o’clock in the
morning and between 4 and 7 o’clock in the afternoon while more than half of work-related
trips started between 9 am and 4 pm.

Temporal Distribution 2001 NHTS Summary of Travel Trends
50
Figure 13Distribution of Person Trips by Trip Purpose and Start Time of Trip
2001 NHTS

2001 NHTS Summary of Travel Trends Temporal Distribution
51
Table 29Daily Travel Statistics by Weekday vs Weekend
Adjusted 1990, 1995 NPTS, and 2001 NHTS
Daily Travel Statistics 1990 Adjusted 1995 2001
Weekday Weekend Weekday Weekend Weekday Weekend
Vehicle Trips per Driver 3.41 2.89 3.81 2.99 3.56 2.85
% work trips 27.8% 9.7% 31.9% 12.5% 31.2% 10.6%
% non-work trips 72.2% 90.3% 68.1% 87.5% 68.8% 89.4%
VMT per Driver 28.54 28.36 33.46 28.87 34.35 28.70
Average Vehicle TripLength
8.47 9.96 8.85 9.73 9.75 10.22
Average Time SpentDriving (in minutes)
50.68 46.07 59.48 48.05 64.79 52.39
Person Trips per Person 3.82 3.60 4.43 3.96 4.18 3.86
PMT per Person 32.6 40.64 37.68 41.14 39.41 42.31
Average Person TripLength
9.47 11.51 8.63 10.53 9.60 11.18
Note:• Average time spent driving includes all drivers, even those who did not drive a private vehicle on the day in which
the household was interviewed. It does not include any driving done in a segmented trip. Also excludes driving doneas an "essential part of work."
• Average trip length is calculated using only those records with trip mileage information present.• Note that only the 1990 data have been adjusted to make them more comparable with the 1995 and 2001 data. Thus,
there are limits on the conclusions that can be drawn in comparing travel with earlier survey years. The adjustmentsto 1990 data affect only person trips, vehicle trips, person miles of travel (PMT) and vehicle miles of travel (VMT).
• For Tables 28 and 29, “% Work Trips” also includes Work-Related Business
Although travel was less frequent on weekends than on weekdays, weekend trips were on average
longer than weekday trips. This has been true since 1990. Compared to 1995, the average time
spent driving in 2001 was longer regardless of weekdays or weekends.

Travel Behavior of Sub-Populations 2001 NHTS Summary of Travel Trends
52
Table 30Daily Travel Statistics of People 65 and Older
1983, 1990, 1995 NPTS, and 2001 NHTS
Daily Travel Statistics 1983 1990 1990Adjusted
1995 2001
Vehicle Trips per Driver 1.66 1.78 2.27 2.94 2.84
% work trips 10.2% 6.2% 4.8% 8.5% 6.2%
% non-work trips 89.8% 93.8% 95.2% 91.5% 93.8%
VMT per Driver 9.80 11.50 14.83 19.56 21.13
Average Vehicle Trip Length 5.92 6.55 6.61 6.69 7.51
Average Time Spent Driving(in minutes)
NA 24.02 30.83 42.89 49.11
Person Trips per Person 1.82 1.95 2.49 3.43 3.42
PMT per Person 12.21 15.33 19.85 25.24 28.04
Average Person Trip Length 6.70 7.99 8.12 7.46 8.35
Note:C Average time spent driving includes all drivers, even those who did not drive a private vehicle on the day in which
the household was interviewed. It does not include any driving done in a segmented trip. Also excludes driving doneas an "essential part of work."
C Average trip length is calculated using only those records with trip mileage information present.C Note that only the 1990 data have been adjusted to make them more comparable with the 1995 and 2001 data. Thus,
there are limits on the conclusions that can be drawn in comparing travel with earlier survey years. The adjustmentsto 1990 data affect only person trips, vehicle trips, person miles of travel (PMT) and vehicle miles of travel (VMT).
C For Tables 29 and 30, “% Work Trips” also includes Work-Related Business.
On a daily basis, individuals 65 and older took fewer but longer trips in 2001 than in 1995. On
average, an elderly driver spent almost fifty minutes a day behind the wheel, representing an
increase of 14% from 1995. Work trips became less common in 2001.

2001 NHTS Summary of Travel Trends Travel Behavior of Sub-Populations
53
Table 31Daily Person Trips of Adult Women by Household Composition
1983, 1990, 1995 NPTS, and 2001 NHTS
Household Composition 1983 1990 Adjusted1990 1995 2001
ALL 2.95 3.23 4.00 4.36 4.25
% work trips 17.6% 17.7% 14.3% 15.8% 17.8%
Single Adult, No Child 2.60 3.32 4.07 4.19 4.26
2 or > Adult, No Child 2.85 3.29 4.01 4.19 4.15
Single Adult, Child<6 2.65 3.59 4.48 4.80 4.68
2 or > Adult, Child<6 3.32 3.51 4.41 4.74 4.55
Single Adult, Child 6-15 3.73 4.17 5.17 5.35 5.18
2 or > Adult, Child 6-15 3.59 3.85 4.78 5.24 4.87
Single Adult, Child 16-21 2.59 3.41 4.17 4.56 4.67
2 or > Adult, Child 16-21 2.84 3.40 4.13 4.54 4.43
Single Adult, Retired 1.49 1.79 2.30 3.06 3.26
2 or > Adult, Retired 1.97 2.17 2.75 3.48 3.50
Note:C All tables reporting totals could include some unreported characteristics.C In 1983, adult women were defined as all females 16 or older. In 1990, 1995, and 2001, adult women were defined
as females 18 or older.C Note that only the 1990 data have been adjusted to make them more comparable with the 1995 and 2001 data. Thus,
there are limits on the conclusions that can be drawn in comparing travel with earlier survey years. The adjustmentsto 1990 data affect only person trips, vehicle trips, person miles of travel (PMT) and vehicle miles of travel (VMT).
Regardless of household demographic composition, women took more trips in 1995 than in 2001.
Single women with children between the ages 6 and 15 averaged more than 5 trips per day. The
proportion of work trips women took increased two percentage points from 1995 to 2001.

Travel Behavior of Sub-Populations 2001 NHTS Summary of Travel Trends
54
Table 32Daily Person Trips per Person for Low Income Households by Trip Purpose
1983, 1990, and 1995 NPTS
Trip Purpose
Low-Income Households(Less than $25,000 of 2001 dollars)
OtherHouseholds
1983 1990 Adjusted1990 1995 2001 1995 2001
ALL 2.44(100.0%)
2.77(100.0%)
3.40(100.0%)
3.79(100.0%)
3.52(100.0%)
4.57(100.0%)
4.32(100.0%)
To/From Work 0.46(18.7%)
0.48(17.5%)
0.49(14.3%)
0.57(15.1%)
0.46(13.0%)
0.85(18.7%)
0.72(16.6%)
Work Related Business 0.06(2.4%)
0.02(0.9%)
0.03(0.8%)
0.06(1.6%)
0.07(2.1%)
0.14(3.0%)
0.14(3.3%)
Family/Personal Business 0.89(36.3%)
1.20(43.3%)
1.60(47.1%)
1.84(48.5%)
1.67(47.3%)
2.05(44.8%)
1.86(42.9%)
School/Church 0.29(12.0%)
0.35(12.6%)
0.35(10.3%)
0.35(9.3%)
0.41(11.5%)
0.39(8.5%)
0.41(9.3%)
Social & Recreational 0.69(28.2%)
0.69(24.9%)
0.91(26.8%)
0.96(25.3%)
0.89(25.3%)
1.13(24.7%)
1.16(26.8%)
Other 0.06(2.4%)
0.02(0.8%)
0.02(0.7%)
0.00(0.1%)
0.02(0.7%)
0.01(0.2%)
0.04(0.9%)
Note:C Incomes for 1983, 1990, and 1995 have been adjusted to 2001 dollars.C Low income households are defined as a household earning $25,000 or less in a year.C All tables reporting totals could include some unreported characteristics.C Note that only the 1990 data have been adjusted to make them more comparable with the 1995 and 2001 data. Thus,
there are limits on the conclusions that can be drawn in comparing travel with earlier survey years. The adjustmentsto 1990 data affect only person trips, vehicle trips, person miles of travel (PMT) and vehicle miles of travel (VMT).
Similar to those in higher income households, individuals with low income took fewer trips in
2001 than in 1995. However, individuals in low-income households continued to be less mobile
and took fewer trips to, or related to, work when compared to those in higher income
households.

2001 NHTS Summary of Travel Trends Travel Behavior of Sub-Populations
55
Table 33Daily Person Trips per Person
by Vehicle Ownership Status and MSA SizeAdjusted 1990, 1995 NPTS, and 2001 NHTS
MSA Size1990 Adjusted 1995 2001
WithoutVehicle
WithVehicles
WithoutVehicle
WithVehicles
WithoutVehicle
WithVehicles
ALL 2.28 3.86 3.04 4.38 2.79 4.16 Not in MSA 1.81 3.80 2.92 4.43 2.61 4.06 < 250,000 2.87 4.11 2.43 4.54 2.51 4.45 250,000 to 499,999 1.92 3.95 3.17 4.47 2.56 4.21 500,000 to 999,999 1.80 3.98 2.69 4.45 2.69 4.28 1 to 2.9 million 2.23 3.91 3.00 4.41 2.57 4.24 3 million + 2.50 3.72 3.13 4.26 2.93 4.07
Note:C Note that only the 1990 data have been adjusted to make them more comparable with the 1995 and 2001 data.
Thus, there are limits on the conclusions that can be drawn in comparing travel with earlier survey years. Theadjustments to 1990 data affect only person trips, vehicle trips, person miles of travel (PMT) and vehicle milesof travel (VMT).
In 2001, people in households without a vehicle averaged 1.3 fewer trips per day than those in
households with vehicles. The impact of owning a vehicle on mobility was the least for those
who lived in large cities. As depicted in Figure 14, almost three-quarters of the trips taken by
those who lived in the largest metropolitan areas and who were without a vehicle were by walk,
bike or public transit. In general, those without access to a privately-owned vehicle met many
of their transportation needs by riding as a passenger in a privately-owned vehicle, or by
walking or bicycling (Figure 14).

Travel Behavior of Sub-Populations 2001 NHTS Summary of Travel Trends
56
Figure 14Mode Distribution of Person Trips Taken by Zero-Vehicle Households
2001 NHTS
Note:C Other includes other modes not shown above such as RV, motorcycle, other POV, Amtrak, airplane, taxi, bike,
school bus, and other.

2001 NHTS Summary of Travel Trends Glossary
G-1
TRAVEL CONCEPTS AND GLOSSARY OF TERMS

Glossary 2001 NHTS Summary of Travel Trends
G-2
This page intentionally left blank.

2001 NHTS Summary of Travel Trends Glossary
G-3
TRAVEL CONCEPTS
PERSON TRIP DEFINITION -A trip by one person in any mode of transportation. This is the most basic and universal measure of personal travel. Eachrecord in the Travel Day and Travel Period files in the NHTS datasetrepresents one person trip.
EXAMPLES - Two household members traveling together in one carare counted as two person trips. Three household members walking tothe store together are counted as three person trips.
PERSONMILES OFTRAVEL (PMT)
DEFINITION - The number of miles traveled by each person on a trip.
EXAMPLES - If two people traveling together take a six-mile subwaytrip to the airport, that trip results in 12 person miles of travel. A four-mile van trip with a driver and three passengers counts as 16 personmiles of travel (4 people times 4 miles).

Glossary 2001 NHTS Summary of Travel Trends
G-4
VEHICLETRIPS
DEFINITION - A trip by a single privately operated vehicle (POV)regardless of the number of persons in the vehicle.
EXAMPLES - Two people traveling together in a car would be countedas one vehicle trip. Four people going to a restaurant in a van isconsidered one vehicle trip.
NPTS MODE RESTRICTIONS - To be considered a vehicle trip inNHTS, the trip must have been made in a POV, namely a household-based car, van, sport utility vehicle, pickup truck, other truck,recreational vehicle, motorcycle or other POV. The vehicle does notneed to belong to the household.
Trips made in other highway vehicles, such as buses, streetcars, taxis,and school buses are collected in the NHTS, but these are shown asperson trips by those modes. The design of the NHTS is such that itdoes not serve as a source for vehicle trips in modes such as buses,because there is no way to trace the movement of the bus fleetthroughout the day. Those interested in vehicle trips by buses, taxis, etc.need to use a data source that relies on reports from the fleet operators ofthose vehicles. The National Transit Database of the Federal TransitAdministration is one such source.
VEHICLEMILES OFTRAVEL (VMT)
DEFINITION - One vehicle mile of travel is the movement of oneprivately operated vehicle (POV) for one mile, regardless of the numberof people in the vehicle.
EXAMPLES - When one person drives her car 12 miles to work, 12vehicle miles of travel have been made. If two people travel three milesby pickup, three vehicle miles of travel have been made.
SAME MODE RESTRICTIONS - For NHTS data, vehicle miles arerestricted to the same privately-operated vehicles as vehicle trips(seeabove), that is a household-based car, van, sport utility vehicle, pickuptruck, other truck, recreational vehicle, or other POV.

2001 NHTS Summary of Travel Trends Glossary
G-5
VEHICLEOCCUPANCY
DEFINITION - For NHTS data, vehicle occupancy is generallycomputed as person miles of travel per vehicle mile (referred to as thetravel method). Note that the other commonly-used definition of vehicleoccupancy is persons per vehicle trip (referred to as the trip method) .
COMMENTS - Because longer trips often have higher occupancies, thetravel method generally yields a higher rate than the trip method. Thecalculation of the travel method requires that trip miles be reported, thusit is calculated on a slightly smaller number of trips than the trip method.

Glossary 2001 NHTS Summary of Travel Trends
G-6
GLOSSARY
This glossary provides the most common terms used in the NHTS and definitions ofthose terms. These definitions are provided to assist the user in the interpretation of the NHTSdata.
Adult For NHTS, this is defined as a person 18 years or older.
Block Group A subdivision of a Census tract that averages 1000 to 1100 people, andapproximately 400-500 housing units. The source used for the 2001NHTS was GDT Dynamap 2000 (from Census 2000 TIGER/Line files).

2001 NHTS Summary of Travel Trends Glossary
G-7
Census Regionand Division
The Census Bureau divides the states into four regions and nine divisions. Note that the divisions are wholly contained within a region, i.e., region linesdo not split division lines. The regions and their component divisions are:
Northeast Region:1. New England Division: Connecticut, Maine, Massachusetts,
New Hampshire, Rhode Island, Vermont2. Middle Atlantic Division: New Jersey, New York, Pennsylvania
North Central Region:1. East North Central Division: Illinois, Indiana, Michigan, Ohio,
Wisconsin2. West North Central Division: Iowa, Kansas, Minnesota,
Missouri, Nebraska, North Dakota, South DakotaSouth Region
1. South Atlantic Division: Delaware, Florida, Georgia, Maryland,North Carolina, South Carolina, Virginia, West Virginia
2. East South Central Division: Alabama, Kentucky, Mississippi,Tennessee
3. West South Central Division: Arkansas, Louisiana, Oklahoma,Texas
West Region1. Mountain Division: Arizona, Colorado, Idaho, Montana,
Nevada, New Mexico, Utah, Wyoming2. Pacific Division: Alaska, California, Hawaii, Oregon,
WashingtonPuerto Rico
For the 2001 NHTS the source used for the 2000 Census Region was:http://www.census.gov/geo/www/cob/rg2000.htmlThe source used for the 2000 Census Division was:http://www.census.gov/geo/www/cob/dv2000.html
Census Tract A small subdivision of a county, containing approximately 4,000 persons. Tracts can range in population from 2,500 to 8,000. The geographic size of thetract may vary considerably, depending on population density. Tracts weredesigned to be homogeneous in regard to population characteristics, economicstatus and living conditions when they were first delineated. Since the firsttracts were delineated for the 1890 Census, today’s tracts may be far fromhomogeneous. The source used for the 2001 NHTS was GDT Dynamap 2000(from Census 2000 TIGER/Line files).

Glossary 2001 NHTS Summary of Travel Trends
G-8
ConsolidatedMetropolitanStatistical Area(CMSA)
A large metropolitan complex of 1 million or more population, containing twoor more identifiable component parts designated as Primary MetropolitanStatistical Areas (PMSAs). For example, the Boston CMSA is composed of sixPMSAs.
Destination For travel day trips, the destination is the point at which there is a break intravel, except if the break is only to change vehicles or means of transport. Fortravel period trips, the destination is the farthest point of travel.
Driver A driver is a person who operates a motorized vehicle. If more than one persondrives on a single trip, the person who drives the most miles is classified as theprincipal driver.
Employed A person is considered employed if (s)he worked for pay, either full time orpart time, during the week before the interview.
Education Level The number of years of regular schooling completed in graded public, private,or parochial schools, or in colleges, universities, or professional schools,whether day school or night school. Regular schooling advances a persontoward an elementary or high school diploma, or a college, university, orprofessional school degree.
Household A group of persons whose usual place of residence is a specific housing unit;these persons may or may not be related to each other. The total of all U.S.households represents the total civilian non-institutionalized population. Ahousehold does not include group quarters (i.e., 10 or more persons livingtogether, none of whom are related).

2001 NHTS Summary of Travel Trends Glossary
G-9
Household Income Household income is the money earned by all family members in a household,including those temporarily absent. Annual income consisted of the incomeearned 12 months preceding the interview. Household income includes moniesfrom all sources, such as wages and salary, commissions, tips, cash bonuses,income from a business or farm, pensions, dividends, interest, unemploymentor workmen’s compensation, social security, veterans’ payments, rent receivedfrom owned property (minus the operating costs), public assistance payments,regular gifts of money from friends or relatives not living in the household,alimony, child support, and other kinds of periodic money income other thanearnings. Household income excludes in-kind income such as room and board,insurance payments, lump-sum inheritances, occasional gifts of money frompersons not living in the same household, withdrawal of savings from banks,tax refunds, and the proceeds of the sale of one’s house, car, or other personalproperty.
HouseholdMembers
Household members include all people, whether present or temporarily absent,whose usual place of residence is in the sample unit. Household members alsoinclude people staying in the sample unit who have no other usual place ofresidence elsewhere.
Household Vehicle A household vehicle is a motorized vehicle that is owned, leased, rented orcompany-owned and available to be used regularly by household members. Household vehicles include vehicles used solely for business purposes orbusiness-owned vehicles, so long as they are driven home and can be used forthe home to work trip, (e.g., taxicabs, police cars, etc.). Household vehiclesinclude all vehicles that were owned or available for use by members of thehousehold during the travel period, even though a vehicle may have been soldbefore the interview. Vehicles excluded from household vehicles are those thatwere not working and were not expected to be working, and vehicles that werepurchased or received after the designated travel day.

Glossary 2001 NHTS Summary of Travel Trends
G-10
Means ofTransportation
A mode of travel used for going from one place (origin) to another(destination). A means of transportation includes private and public modes, aswell as walking.
The following transportation modes, grouped by major mode, are included inthe NHTS data.
Private Vehicle
1. Car – A privately owned and/or operated licensed motorized vehicleincluding cars and station wagons. Leased and rented cars are included ifthey are privately operated and not used for picking up passengers inreturn for fare.
2. Van – privately owned and/or operated van or minivan designed to carry5 to 13 passengers, or to haul cargo.
3. Sport Utility Vehicle – A privately owned and/or operated vehicle that isa hybrid of design elements from a van, a pickup truck and a stationwagon. Examples include a Chevrolet Blazer, Ford Bronco, JeepCherokee, or Nissan Pathfinder.
4. Pickup Truck – A pickup truck is a motorized vehicle, privately ownedand/or operated, with an enclosed cab that usually accommodates 2-3passengers, and an open cargo area in the rear. Later model pickupsoften have a back seat that allows for total seating of 4 -6 passengers. Pickup trucks usually have the same size of wheel-base as a full-sizestation wagon. This category also includes pickups with campers.
5. Other Truck – This category consists of all trucks other than pickuptrucks (i.e., dump trucks, trailer trucks, etc.).
6. RV or Motor Home – An RV or motor home includes a self-poweredrecreational vehicle that is operated as a unit without being towed byanother vehicle (e.g., a Winnebago motor home).
7. Motorcycle – This category includes large, medium, and smallmotorcycles and mopeds.
8. Other POV – A vehicle that cannot be classified into one of thecategories above.

2001 NHTS Summary of Travel Trends Glossary
G-11
Public Transportation
1. Bus – The bus category includes:
a. city to city buses (buses that run from one urban center to the other), b. mass transit systems (buses that are available to the general public),c. school buses, and d. charter/tour buses (private bus operating on a fixed schedule
between population centers).
2. Train – This category includes:
a. Amtrak and intercity train (heavy passenger rail that runs form oneurban center to another),
b. Subway and elevated rail (also know as rail rapid transit is a highcapacity system operated on a fixed rail or guide way system on aprivate right of way), and
c. Trolley/streetcars (vehicles that run on a fixed rail system poweredby electricity obtained from an overhead power distribution system),and commuter trains and passenger trains.
Other Modes
1. Airplane – Airplanes include commercial airplanes and smaller planesthat are available for use by the general public in exchange for a fare. Private and corporate planes and helicopters are also included.
2. Ship – This includes travel by ships, cruise ships, passenger lines andferries, sailboats, motorboats and yachts.
3. Taxi – Taxis include the use of a taxicab by a passenger for fare. Thetaxi category does not include rental cars if they are privately operated.
4. Limousine – Includes the use of a limousine by passenger for fare. Thelimousine category does not include rental cars if they are privatelyoperated.
5. Hotel/Airport Shuttle – This includes privately operated shuttle buses thatare operated between a limited number of points for a fare.
6. Bicycle – This category includes bicycles of all speeds and sizes that donot have a motor.
7. Walk. – This category includes walking and jogging.

Glossary 2001 NHTS Summary of Travel Trends
G-12
8. Other – Includes any types of transportation not previously listed, e.g.skate boards.
MetropolitanStatistical Area(MSA)
Except in the New England States, a Metropolitan Statistical Area is a countyor group of contiguous counties which contains at least one city of 50,000inhabitants or more, or “twin cities” with a combined population of at least50,000. In addition, contiguous counties are included in an MSA if, accordingto certain criteria, they are socially and economically integrated with the centralcity. In the New England States, MSA’s consist of towns and cities instead ofcounties. The source used for the 2001 NHTS was 1999 Metropolitan Areas:Cartographic Boundary Files. File ma99_99.shp fromhttp://www.census.gov/geo/www/cob/ma1999.html.
MotorizedVehicle
Motorized vehicles are all vehicles that are licensed for highway driving.
Occupancy Occupancy is the number of persons, including driver and passenger(s)in a vehicle. NHTS occupancy rates are generally calculated as personmiles divided by vehicle miles.
Origin Origin is the starting point of a trip.
Overlap Trip A travel period trip that occurs on travel day, and is thus collected inboth portions of the NHTS questionnaire. To ensure that this trip is notcounted twice, eliminate overlap trips from travel day data when travelday and travel period data will be added together.
Passenger For a specific trip, a passenger is any occupant of a motorized vehicle,other than the driver.
Person Miles ofTravel (PMT)
PMT is a primary measure of person travel. When one person travelsone mile, one person mile of travel results. Where 2 or more personstravel together in the same vehicle, each person makes the same numberof person miles as the vehicle miles. Therefore, four persons traveling 5miles in the same vehicle results in 20 person miles (4 x 5 = 20).

2001 NHTS Summary of Travel Trends Glossary
G-13
Person Trip A person trip is a trip by one or more persons in any mode oftransportation. Each person is considered as making one person trip. For example, four persons traveling together in one auto are counted asfour person trips.
POV A privately-owned vehicle or privately-operated vehicle. Either way, theintent here is that this is not a vehicle available to the public for a fee,such as a bus, subway, taxi, etc.
Travel Day A travel day is a 24-hour period from 4:00 a.m. to 3:59 a.m. designatedas the reference period for studying trips and travel by members of asampled household.
Travel Period A travel period consists of a four-week period ending with the travelday.
Travel Day Trip A travel day trip is defined as any time the respondent went from oneaddress to another by private motor vehicle, public transportation,bicycle, walking, or other means. However, a separate trip is notcounted in two instances:
1. When the sole purpose for the trip is to get to another vehicle ormode of transportation in order to continue to the destination.
2. Travel within a shopping center, mall or shopping areas of 4-5blocks is to be considered as travel to one destination.
Travel PeriodTrip
A travel period trip is a trip where the farthest destination is at least 50miles from home. The outgoing portion of this trip can take place at anytime, but the return must be within the four-week travel period. Thefour-week travel period ends on and includes the assigned travel day.
Travel Day TripPurpose
A trip purpose is the main reason that motivates a trip. There are 36travel day trip purposes used in the 2001 NHTS.

Glossary 2001 NHTS Summary of Travel Trends
G-14
For the 2001 Survey, trip purposes were collected using a From-Toapproach. For each trip, the origin and destination are on the file ingeneric terms, e.g. from work to shopping. The 36 trip reasons aredefined as follows, and shown with their coded trip purpose number.
1. To Home – Travel to home after leaving for some reason.
11. Go to Work – The first trip to the work location on travel day.
12. Return to Work – A trip to work that is not the first trip to work onthe travel day.
13. Attend Business Meeting/Trip – A work related trip whose purposeis to attend a business meeting.
14 Other Work Related – A work related trip whose purpose is notspecifically to attend a business meeting.
20. Other School/Religious Activity – School and religious activitiesnot covered by categories 21 through 23 below.
21. Go to School as a Student – A trip whose purpose is to go to schoolas a student.
22. Go to Religious Activity – A trip whose purpose is to go to a placeto attend a religious activity.
23. Go to Library, School Related – A trip whose purpose is to go tothe library as part of a school related activity.
24. Go to Daycare – A trip whose purpose is to attend day care.
30. Medical/Dental Services – A trip made for medical, dental, ormental health treatment, or other related professional services.
40. Shopping/Errands – Shopping/errand trips not covered bycategories 41 through 43 below.
41. Buy Goods, (e.g., groceries/clothing/hardware store) – A shoppingtrip whose purpose is to purchase commodities for use orconsumption elsewhere. This purpose also includes window-shopping and trip made to shop even if nothing is purchased.
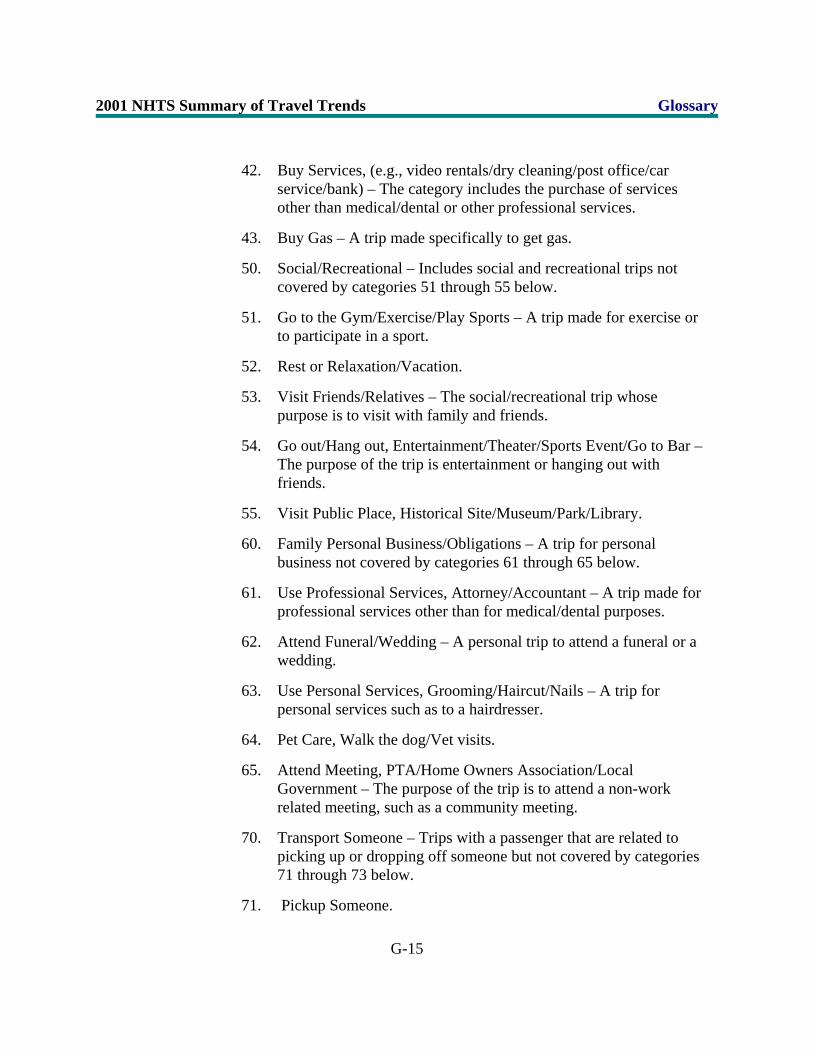
2001 NHTS Summary of Travel Trends Glossary
G-15
42. Buy Services, (e.g., video rentals/dry cleaning/post office/carservice/bank) – The category includes the purchase of servicesother than medical/dental or other professional services.
43. Buy Gas – A trip made specifically to get gas.
50. Social/Recreational – Includes social and recreational trips notcovered by categories 51 through 55 below.
51. Go to the Gym/Exercise/Play Sports – A trip made for exercise orto participate in a sport.
52. Rest or Relaxation/Vacation.
53. Visit Friends/Relatives – The social/recreational trip whosepurpose is to visit with family and friends.
54. Go out/Hang out, Entertainment/Theater/Sports Event/Go to Bar – The purpose of the trip is entertainment or hanging out withfriends.
55. Visit Public Place, Historical Site/Museum/Park/Library.
60. Family Personal Business/Obligations – A trip for personalbusiness not covered by categories 61 through 65 below.
61. Use Professional Services, Attorney/Accountant – A trip made forprofessional services other than for medical/dental purposes.
62. Attend Funeral/Wedding – A personal trip to attend a funeral or awedding.
63. Use Personal Services, Grooming/Haircut/Nails – A trip forpersonal services such as to a hairdresser.
64. Pet Care, Walk the dog/Vet visits.
65. Attend Meeting, PTA/Home Owners Association/LocalGovernment – The purpose of the trip is to attend a non-workrelated meeting, such as a community meeting.
70. Transport Someone – Trips with a passenger that are related topicking up or dropping off someone but not covered by categories71 through 73 below.
71. Pickup Someone.

Glossary 2001 NHTS Summary of Travel Trends
G-16
72. Take and Wait – A trip made to take someone to a destination andthen wait with them at the destination and return together.
73. Drop Someone Off.
80. Meals – A trip whose purpose is to eat or get a meal but notcovered by categories 81 through 83 below.
81. Social Event – A trip whose purpose is to eat a meal at a socialevent.
82. Get/Eat Meal – A trip whose purpose is to get and eat a meal butnot at a social event.
83. Coffee/Ice Cream/Snacks – A trip whose purpose is to get/eat asnack or drink, something less than a meal.
91. Other – A trip purpose not covered by categories above.
Travel PeriodTrip Purpose
A trip purpose is the main reason that motivates a trip. There were 18travel period trip purposes in the 2001 NHTS. The main reason and allother reasons for the trip were collected.
Urbanized Area An urbanized area consists of the built up area surrounding a central core(or central city), with a population density of at least 1,000 persons persquare mile. Urbanized areas do not follow jurisdictional boundariesthus it is common for the urbanized area boundary to divide a county.
For the 2001 NHTS, Urban Areas were calculated two ways.
1. Variable URBAN uses the 2000 Urbanized Areas: CartographicBoundary Files. File ua00_d00.shp fromhttp://www.census.gov/geo/www/cob/ua2000.html. Two codes areused: 0 = Not in Urban Area, 1 = in Urban Area.
2. Variable URBAN1 uses the 2000 Urbanized Areas: CartographicBoundary Files. File ua00_d00.shp fromhttp://www.census.gov/geo/www/cob/ua2000.html. Three codesare used: 0 = Not in Urban Area, 1 = in Urban Cluster, 2 = inUrban Area, 3 = in area surrounded by urban areas.
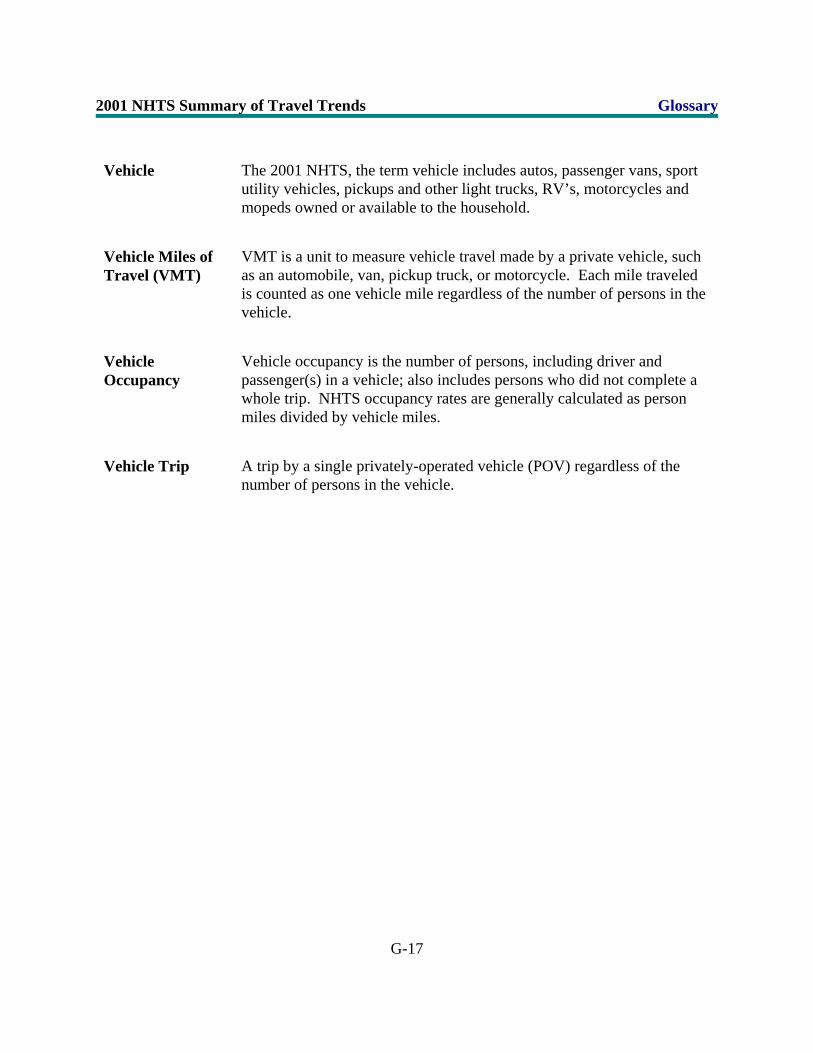
2001 NHTS Summary of Travel Trends Glossary
G-17
Vehicle The 2001 NHTS, the term vehicle includes autos, passenger vans, sportutility vehicles, pickups and other light trucks, RV’s, motorcycles andmopeds owned or available to the household.
Vehicle Miles ofTravel (VMT)
VMT is a unit to measure vehicle travel made by a private vehicle, suchas an automobile, van, pickup truck, or motorcycle. Each mile traveledis counted as one vehicle mile regardless of the number of persons in thevehicle.
VehicleOccupancy
Vehicle occupancy is the number of persons, including driver and passenger(s) in a vehicle; also includes persons who did not complete awhole trip. NHTS occupancy rates are generally calculated as personmiles divided by vehicle miles.
Vehicle Trip A trip by a single privately-operated vehicle (POV) regardless of thenumber of persons in the vehicle.

Glossary 2001 NHTS Summary of Travel Trends
G-18
Vehicle Type For purposes of the 2001 NHTS, one of the following:
1. Automobile (including station wagon)
2. Van
3. Sport Utility Vehicle
4. Pickup Truck (including pickup with camper)
5. Other Truck
6. RV or Motor Home
7. Motorcycle
8. Other

2001 NHTS Summary of Travel Trends Appendix 1
A1-1
APPENDIX 1
SELECTED TABLES INCLUDING TRAVEL OFINDIVIDUALS 0 to 4 YEAR-OLDS

Appendix 1 2001 NHTS Summary of Travel Trends
A1-2
This page intentionally left blank.

2001 NHTS Summary of Travel Trends Appendix 1
A1-3
Table 5Average Annual PMT, Person Trips and Trip Length by Trip Purpose
1983, 1990, 1995 NPTS, and 2001 NHTS(2001 NHTS contains 0 to 4 year-olds)
Trip Purpose 1983 1990 1990 Adjusted 1995 2001
Average Annual PMT per HouseholdAll Purposes 22,802 24,803 30,316 34,459 37,002To/From Work 4,586 5,637 5,637 7,740 6,706Work Related Business 1,354 1,043 1,043 1,987 2,987Shopping 2,567 2,674 3,343 4,659 5,188All Other Fam/Per Business 3,311 5,083 7,167 7,381 7,245School/Church 1,522 1,599 1,599 1,973 2,198Social and Recreational 8,964 8,567 11,308 10,571 11,281Other 500 195 214 131 1,262
Average Annual Person Trips per HouseholdAll Purposes 2,628 2,673 3,262 3,828 3,793To/From Work 537 539 539 676 565Work Related Business 62 38 38 100 109Shopping 474 504 630 775 749All Other Fam/Per Business 456 606 854 981 938School/Church 310 304 304 337 373Social and Recreational 728 662 874 953 1,022Other 61 20 22 6 32
Average Person Trip Length (miles)All Purposes 8.68 9.45 9.47 9.13 9.94To/From Work 8.54 10.65 10.65 11.63 12.11Work Related Business 21.77 28.20 28.20 20.28 28.26Shopping 5.41 5.38 5.38 6.08 7.03All Other Fam/Per Business 7.27 8.55 8.55 7.63 7.85School/Church 4.90 5.39 5.39 5.98 6.02Social and Recreational 12.31 13.19 13.19 11.27 11.27Other 8.22 10.30 10.30 22.83 41.52
Note: • Average person trip length for 199, 1995, and 2001 is calculated using only those records with trip mileage information present.• All tables reporting totals could include some unreported characteristics.• Note that only the 1990 data have been adjusted to make them more comparable with the 1995 and 2001 data. Thus, there are
limits on the conclusions that can be drawn in comparing travel with earlier survey years. The adjustments to 1990 data affectonly person trips, vehicle trips, person miles of travel (PMT) and vehicle miles of travel (VMT).

Appendix 1 2001 NHTS Summary of Travel Trends
A1-4
Table 7Average Annual Person Trips per Household
by Mode of Transportation and MSA Size1977, 1983, 1990, 1995 NPTS, and 2001 NHTS
(2001 NHTS contains 0 to 4 year-olds)
Mode of TransportationSMSA or MSA Size 1977 1983 1990 1990 Adjusted 1995 2001
PrivateALL 2,351 2,152 2,329 2,861 3,307 3,276Not in (S)MSA 2,436 2,322 2,306 2,837 3,492 3,251Less than 250,000 2,517 2,375 2,508 3,090 3,503 3,481250,000 - 499,999 2,574 2,443 2,461 3,014 3,472 3,425500,000 - 999,999 2,628 2,140 2,413 2,957 3,509 3,5191,000,000 - 2,999,999 2,366 2,031 2,430 2,986 3,354 3,3623,000,000 and above 1,785 1,691 2,160 2,649 3,075 3,108
PublicTransitALL 73 60 52 58 67 60Not in (S)MSA 22 11 13 14 9 6Less than 250,000 47 17 27 30 23 12250,000 - 499,999 44 23 19 22 18 22500,000 - 999,999 58 48 28 33 33 121,000,000 - 2,999,999 86 67 46 52 37 383,000,000 and above 189 181 112 124 137 134
WalkALL 261 226 193 234 205 329Not in (S)MSA 199 211 146 175 134 232Less than 250,000 241 280 172 212 138 262250,000 - 499,999 206 199 165 203 152 267500,000 - 999,999 256 184 132 161 138 2381,000,000 - 2,999,999 295 179 170 207 162 2923,000,000 and above 396 330 278 337 301 455
ALL MODESALL 2,808 2,628 2,673 3,262 3,828 3,793Not in (S)MSA 2,800 2,766 2,580 3,151 3,878 3,624Less than 250,000 2,944 2,889 2,816 3,450 3,926 3,872250,000 - 499,999 2,945 2,891 2,741 3,340 3,894 3,842500,000 - 999,999 3,049 2,542 2,667 3,252 3,916 3,8811,000,000 - 2,999,999 2,861 2,463 2,737 3,344 3,795 3,8143,000,000 and above 2,459 2,326 2,641 3,213 3,765 3,830
Note:C The population size groups for 1977 - 1983 NPTS are SMSA Size Groups and 1990 - 2001 are MSA Size Groups.C In 2001, the mode “Bus” was divided into “Local Public Transit Bus,” “Commuter Bus,” “Charter/tour bus,” and “City to city bus.” Only “Local
Public Transit Bus” and “Commuter Bus” are included in public transit calculations.C All modes includes other modes not specified such as bike, school bus, taxi and other.C All tables reporting totals could include some unreported characteristics.C Note that only the 1990 data have been adjusted to make them more comparable with the 1995 and 2001 data. Thus, there are limits on the
conclusions that can be drawn in comparing travel with earlier survey years. The adjustments to 1990 data affect only person trips, vehicle trips,person miles of travel (PMT) and vehicle miles of travel (VMT).

2001 NHTS Summary of Travel Trends Appendix 1
A1-5
Table 8Person Trips per Household by Household Income
1983, 1990, and 1995 NPTS and 2001 NHTS
Income 1983 1990 1990 Adjusted 1995 2001
AnnualCompounded
Rate,1990-2001
ALL 2,628 2,673 3,262 3,828 3,793 1.4%< $10,000 1,407 1,710 2,098 2,137 2,196 0.4%$10 to $20,000 1,927 1,968 2,412 2,790 2,689 1.0%$20 to $30,000 2,376 2,455 3,008 3,522 3,248 0.7%$30 to $40,000 2,739 2,802 3,431 3,980 3,730 0.8%$40 to $50,000 3,037 3,101 3,791 4,298 4,134 0.8%$50 to $60,000 3,284 3,391 4,138 4,539 4,618 1.0%$60 to $70,000 3,485 3,660 4,458 4,726 4,828 0.7%$70 to $80,000 3,635 3,832 4,659 4,855 5,161 0.9%$80,000+ 3,602 3,747 4,570 4,829 5,251 1.3%Unreported 2,090 2,536 3,424 2,499 -0.1%
Note:• Incomes for 1983, 1990, adjusted 1990, and 1995 have been adjusted to 2001 dollars.• All tables reporting totals could include some unreported characteristics.• Note that only the 1990 person trip data have been adjusted to make them more comparable
with the 1995 and 2001 data. Thus, there are limits on the conclusions that can be drawn incomparing travel with earlier survey years. The adjustments to 1990 data affect only persontrips, vehicle trips, person miles of travel (PMT) and vehicle miles of travel (VMT).

Appendix 1 2001 NHTS Summary of Travel Trends
A1-6
Table 9Total Person Trips by Mode of Transportation and Trip Purpose
Adjusted 1990 and 1995 NPTS, and 2001 NHTS(millions)
(2001 NHTS contains 0 to 4 year-olds)
TotalTo orFromWork
WorkRelated
Business
Family andPersonalBusiness
Schoolor
ChurchSocial and
Recreational OtherPrivate
1990 Adj 267,029(87.7%)
45,856(91.1%)
3,178(90.1%)
128,368(92.6%)
17,545(61.8%)
70,382(86.3%)
1,629(80.9%)
1995 327,400(86.4%)
60,740(90.8%)
8,835(89.6%)
156,065(89.8%)
22,436(67.3%)
78,809(83.5%)
470(75.4%)
2001 351,692(86.4%)
56,054(92.4%)
10,648(91.2%)
164,766(91.0%)
28,970(72.4%)
88,475(80.6%)
2,350(68.4%)
Public Transit
1990 Adj 5,460(1.8%)
1,992(4.0%)
92(2.6%)
1,318(1.0%)
1,076(3.8%)
946(1.2%)
35(1.7%)
1995 6,638(1.8%)
2,328(3.5%)
123(1.2%)
2,000(1.2%)
826(2.5%)
1,350(1.4%)
11(1.8%)
2001 6,475(1.6%)
2,271(3.7%)
213(1.8%)
1,954(1.1%)
825(2.1%)
1,057(1.0%)
134(3.9%)
Walk
1990 Adj 21,879(7.2%)
1,999(4.0%)
154(4.4%)
7,722(5.6%)
3,649(12.8%)
8,090(9.9%)
265(13.2%)
1995 20,325(5.4%)
1,510(2.3%)
240(2.4%)
8,756(5.0%)
2,925(8.8%)
6,845(7.3%)
47(7.6%)
2001 35,366(8.7%)
1,715(2.8%)
487(4.2%)
12,744(7.0%)
3,737(9.3%)
16,108(14.7%)
527(15.3%)
Other
1990 Adj 9,867(3.2%)
428(0.8%)
95(2.7%)
1,087(0.8%)
6,086(21.4%)
2,098(2.6%)
73(3.6%)
1995 12,099(3.2%)
887(1.3%)
417(4.2%)
1,768(1.0%)
6,035(18.1%)
2,954(3.1%)
37(6.0%)
2001 13,345(3.3%)
584(1.0%)
317(2.7%)
1,540(0.9%)
6,463(16.1%)
4,000(3.6%)
408(11.9%)
TOTAL
1990 Adj 304,471(100%)
50,314(100%)
3,529(100%)
138,559(100%)
28,397(100%)
81,575(100%)
2,014(100%)
1995 378,930(100%)
66,901(100%)
9,860(100%)
173,764(100%)
33,355(100%)
94,362(100%)
623(100%)
2001 407,262(100%)
60,690(100%)
11,676(100%)
181,119(100%)
40,026(100%)
109,732(100%)
3,434(100%)
Note:C All tables reporting totals could include some unreported characteristics.

2001 NHTS Summary of Travel Trends Appendix 1
A1-7
C In 2001, the mode “Bus” was divided into “Local Public Transit Bus,” “Commuter Bus,” “Charter/tour bus,” and“City to city bus.” Only “Local Public Transit Bus” and “Commuter Bus” are included in public transit calculations.
C Note that only the 1990 data have been adjusted to make them more comparable with the 1995 and 2001 data. Thus,there are limits on the conclusions that can be drawn in comparing travel with earlier survey years. The adjustmentsto 1990 data affect only person trips, vehicle trips, person miles of travel (PMT) and vehicle miles of travel (VMT).

Appendix 1 2001 NHTS Summary of Travel Trends
A1-8
Table 28Distribution of Person Trips by Start Time of Trip
1983, 1990, 1995 NPTS, and 2001 NHTS(2001 NHTS contains 0 to 4 year-olds)
Time of Day 1983 19901990 Adj
1995 2001
10 pm - 1 am 4.0 4.0 4.1 3.5 2.8
1 - 6 am 3.3 1.9 1.8 1.7 1.8
6 - 9 am 14.4 13.9 12.5 13.8 14.2
9 am - 1 pm 23.4 20.1 20.6 24.2 24.8
1 - 4 pm 20.8 20.4 20.7 22.1 22.2
4 - 7 pm 21.2 22.8 22.9 23.0 22.4
7 - 10 pm 12.3 12.8 13.2 11.8 11.7
ALL 100.0 100.0 100.0 100.0 100.0
• Note:• All tables reporting totals could include some unreported characteristics.• Note that only the 1990 data have been adjusted to make them more comparable with the 1995 and 2001 data. Thus,
there are limits on the conclusions that can be drawn in comparing travel with earlier survey years. The adjustmentsto 1990 data affect only person trips, vehicle trips, person miles of travel (PMT) and vehicle miles of travel (VMT).

2001 NHTS Summary of Travel Trends Appendix 2
A2-1
APPENDIX 2
KEY CHANGES IN THE 2001 NHTS SURVEYMETHODOLOGY AND CONTENT

Appendix 2 2001 NHTS Summary of Travel Trends
A2-2
This page intentionally left blank.

2001 NHTS Summary of Travel Trends Appendix 2
A2-3
APPENDIX 2
KEY CHANGES IN THE 2001 NHTS SURVEY METHODOLOGY AND CONTENT
(Source: Exhibit 3-1, 2001 NHTS User’s Guide)
TOPIC FROM TO PROBABLE IMPACTS
What iscollected?
Two separatesurveys - the NPTSand the ATS
Combined surveythat collects bothtravel day and travelperiod information
Enables analysis ofrelationship between dailyand long-distance travelcharacteristics of each person
Whichhouseholdmembers areeligible?
Household membersage 5and older
All householdmembers
More complete trip reporting
When proxyneeded?
Proxy for householdmembers 5 to 13years
Proxy for householdmembers under 16years
• Increase in number ofinterviews by proxy
• Obtain parental approvalwhen speaking with 14 and15 year olds
RespondentContact
Advance letter Advance letter with a$5 cash incentive anda brochure
• Improved response• Legitimizes the survey
with respondents
Use of adiary forlong trips
The ATS used adiary to record long-distance trips
No travel perioddiary included
Lower respondent burden andreduce the possibility ofconfusion due to the mailingof both a travel day andtravel period diary

Appendix 2 2001 NHTS Summary of Travel Trends
TOPIC FROM TO PROBABLE IMPACTS
A2-4
Travel daytripdefinition
Any stop from oneaddress to the next isa separate trip
Basically the same -stops only to changea mode oftransportationexcluded
• May improve reporting oftrips by publictransportation as subjectswere specifically remindedabout these trips
• No change mode tripswere recorded exceptwhere publictransportation wasinvolved
Walk andbike trips ontravel day
No specific mentionof walk and biketrips
Specific reminder toinclude walk, bikerides and trips thatstarted and ended inthe same place
Will increase the reporting ofwalk and bike trips
Travel daytrip purpose
There were 17 trippurpose categories
There are 36 trippurpose categories
The new categories moreaccurately capture responses
Most recentlong distancetrip
Not collected Collected Facilitate the imputation oftrips for persons with noreported long distance trips intravel period
Odometerreadings
Readings collectedby contacting therespondent by phoneor by mail
Data collectionmodes also includedthe Internet, fax, anda toll-free 800number
Improved response
Geo-coding Limited use ofmanual geo-coding
Extensive use ofmanual geo-coding
Higher geo-coding successrates and more accurate geo-coding
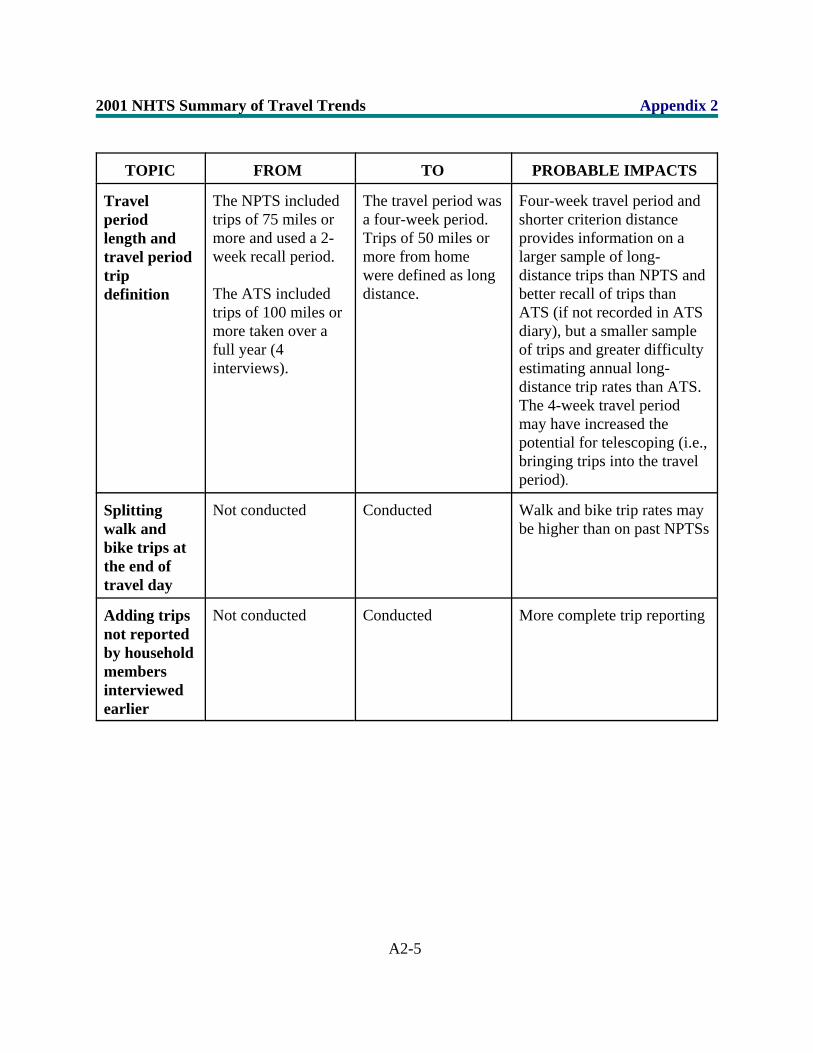
2001 NHTS Summary of Travel Trends Appendix 2
TOPIC FROM TO PROBABLE IMPACTS
A2-5
Travelperiodlength andtravel periodtripdefinition
The NPTS includedtrips of 75 miles ormore and used a 2-week recall period.
The ATS includedtrips of 100 miles ormore taken over afull year (4interviews).
The travel period wasa four-week period.Trips of 50 miles ormore from homewere defined as longdistance.
Four-week travel period andshorter criterion distanceprovides information on alarger sample of long-distance trips than NPTS andbetter recall of trips thanATS (if not recorded in ATSdiary), but a smaller sampleof trips and greater difficultyestimating annual long-distance trip rates than ATS. The 4-week travel periodmay have increased thepotential for telescoping (i.e.,bringing trips into the travelperiod).
Splittingwalk andbike trips atthe end oftravel day
Not conducted Conducted Walk and bike trip rates maybe higher than on past NPTSs
Adding tripsnot reportedby householdmembersinterviewedearlier
Not conducted Conducted More complete trip reporting

Appendix 2 2001 NHTS Summary of Travel Trends
TOPIC FROM TO PROBABLE IMPACTS
1 In raking, one adjusts estimates to agree to one set of controls (e. g., ethnicity), then adjustsestimates to a second set of controls (e. g., region), etc. This process is then repeated until allestimates are simultaneously close to the full set of controls.
A2-6
Weighting Raking to controltotals1
Several stages ofseparate nonresponseadjustment andtrimming as well asraking.
Changes to cells usedfor raking.
Presently unknown.
An evaluation is to beconducted.

2001 NHTS Summary of Travel Trends Appendix 3
A3-1
APPENDIX 3
ADJUSTMENT OF 1990 TRAVEL DATA

Appendix 3 2001 NHTS Summary of Travel Trends
A3-2
This page intentionally left blank.

2001 NHTS Summary of Travel Trends Appendix 3
A3-3
APPENDIX 3
ADJUSTMENT OF 1990 TRAVEL DATA
The 1995 Nationwide Personal Transportation Survey (NPTS) was a significant
improvement over previous surveys in the NPTS series. Different methods were used to ensure that
more complete trip reporting was obtained. Specifically,
S a travel diary was used by respondents in the 1995 survey, in lieu of memory recalling;
and
S “household rostering” was used to capture some trips that may otherwise have been
overlooked.
Although these improvements enhance the completeness and accuracy of trip reporting, they
prevent any direct comparisons between the 1990 and 1995 travel data. Any travel changes
observed between the 1990 and 1995 surveys now reflect not only actual changes in travel during
the period but also artifacts of differences in survey methodology. That is, any changes observed
between the 1990 and 1995 travel data are presumably attributable to: (1) actual changes in travel
behavior, (2) use of travel diaries, (3) use of household rostering, and (4) other improvements in
the 1995 survey method such as a better coding scheme to decipher trip purposes. The latter is
expected to have a smaller effect than the first three factors. Since no data are available to quantify
the impact of these “other” improvements, their impacts are not evaluated in this exercise.
However, the improved coding scheme in 1995 had an effect on trip recording. In 1990,
1.9 billion trips were coded as “other” trip purpose. In 1995, this number was 700 million, a
decline of 64%. These “other” trips are those that can not be classified into any of the existing trip
purpose categories. Two reasons contribute to this substantial decrease in “other” trips. First, the
information was collected in the 1995 survey on “from” where the trip was originated and “to”

Appendix 3 2001 NHTS Summary of Travel Trends
A3-4
where the trip was destined. This type of “to” and “from” information enabled the trip purposes
to be determined more accurately. As a result, the number of trips with unspecified trip purposes
decreased. Second, better schemes to code trip purposes were used both during and after the data
collection phase, significantly reducing the ambiguity in trip purposes.
The reduction in trips with unspecified trip purposes presumably increases the number of
trips categorized into the proper trip purpose categories. Ideally, one should remove all artifacts
that result from an improved method. However, data to address the effects of each of the individual
improvements are extremely limited. Our approach was developed to remove as many artifacts that
the data allow. Specifically, our approach quantified and removed the effect of the travel diary and
household trip rostering on the amount and type of trips in the 1995 NPTS.
Adjustment Approach
To more accurately reflect travel trends, the 1990 travel data were adjusted to account for
two major changes in survey methodology: (1) travel diary, and (2) household rostering. In
essence, the 1990 travel data were adjusted in such a way as if a travel diary and household
rostering were used in the 1990 survey. The theory is that more trips would have been recorded
in the 1990 survey if travel diaries were used. This theory is supported by data collected in the
1995 NPTS pre-test. Data from the 1995 NPTS pre-test showed that travel diaries led to more
complete reporting, particularly for incidental trips, such as stopping at a convenience store, which
are often forgotten and, therefore, difficult to capture in a household travel survey. Household
rostering is also expected to capture more complete trip reporting by helping remind respondents
of forgotten trips. Since data from the 1995 NPTS pre-test suggest that the impact of travel diary
varies for different trip purposes, separate adjustment factors were developed for different purposes.
Although more detailed trip purpose information was collected in the 1995 survey, for this
analysis trip purposes were grouped into four broad categories: (1) work and school, (2) shopping,

2001 NHTS Summary of Travel Trends Appendix 3
A3-5
(3) family and personal business other than shopping, and (4) social and recreational. Separating
shopping trips from trips taken for other family and personal businesses is based on the belief that
travel diaries and household rostering influence reporting on these trips differently. This appendix
describes the approach used to quantify impacts of travel diary and household rostering on the
number of person trips recorded by these purposes.
Rather than adjust travel data in all previous surveys (e.g., 1969, 1983 NPTS), only 1990
travel data were adjusted. Both original and adjusted 1990 statistics are presented in this report.
The user is warned not to compare 1995 results to those from previous NPTS. For trend analysis,
the 1995 results should only be compared to the adjusted 1990 statistics.
Impact of Travel Diary on Trip Reporting
A methodological experiment was designed as part of the 1995 NPTS pre-test to test three
different survey methods: memory recall (n=875), memory jogger (n=729), and travel diary
(n=708). Although the pre-test sample sizes are not particularly large, these pretest data provide
the only platform to quantify the impact of travel diaries on trip reporting. On an individual basis,
using a travel diary indeed captures more trips than recalling the day’s trips from the memory
(Table A3.1). It was found that the diary method averaged 0.5 trips more per person per day than
the recall, or retrospective method [1]. In addition, travel diary use has greater impact on reporting
non-work or non-school related trips than on work or school trips. Its impact is the greatest for
non-shopping types of family and personal travel, such as visiting a doctor’s office, dropping off
or picking up someone: 37% more such trips were reported by using travel diaries than by recalling
from memory.

Appendix 3 2001 NHTS Summary of Travel Trends
A3-6
Table A3.1. Annual Person Trips per Person by Survey MethodsBased on 1995 NPTS Pre-test Data
Travel Diary (1)
Recall(2)
% Different = [(1)-(2)]/(2)
Work and school 312.50 341.64 -8.5%
Shopping 273.09 226.20 20.7%
Other family and personal 317.47 231.36 37.2%
Social and recreational 293.82 244.39 20.2%
Other 8.29 7.58 9.4%
ALL 1,205.17 1,051.17 14.7%
The ratio of travel rates between those collected by travel diaries and those by recall
approximates the additional trips that would have been reported if travel diaries were used in the
1990 survey. Contrary to our assumption that travel diaries will not increase the number of work
and school trips reported, there were fewer work and school trips reported in the 1995 NPTS pre-
test when travel diaries were used rather than recall. For trip purposes other than work and school,
travel diaries capture more trips than recall (Table A3.1). Since travel diaries are not believed to
improve the reporting of non-incidental trips such as commute or school trips and since there is no
other evidence supporting a decrease in commute or school trips from 1990 to 1995, the impact of
travel diaries on reporting these trips is considered null, and no adjustment was made to the 1990
data.
Impact of Household Rostering on Trip Reports
In "household rostering," the interviewer has the benefit of trip data from all household
members who had already been interviewed. For example, suppose person #1 took a trip and
reported that persons #2 and #3 were on the trip with him. When persons #2 and #3 were
interviewed, they were asked to confirm that they were on the trip with person #1. If they were,

2001 NHTS Summary of Travel Trends Appendix 3
A3-7
the trip characteristics were “copied” from person #1’s record to those of person #2 and person #3.
If person #2 or person #3 indicated that they were not on the trip with person #1, this response was
accepted. One benefit of household rostering is that it aids the memory of the respondent and
improves trip reporting.
If household rostering had been used in the 1990 NPTS, how many more trips would have
been reported? Unfortunately, this question can not be answered directly due to the lack of data.
Instead, an indirect approach was developed. The basic idea behind this approach is simple: It is
assumed that household rostering does not increase trip reporting from 1990 to 1995 for trips where
only one household member is on the trip. Therefore, the travel trends observed between 1990 and
1995 in the “non-accompany” trips are basically due to (1) changes in travel behavior, (2) use of
travel diaries, and (3) other improvements in the 1995 survey method (these effects being relatively
inconsequential). It should be emphasized that the “non-accompany” trips are not necessarily all
single-occupant trips. Rather, they are trips where only one household member is on the trip, with
or without being accompanied by non-household members. These trips are referred hereafter as
“non-accompany trips.”
After adjusting these “non-accompany” trips in 1990 for the impact of travel diaries, the
remaining difference between the 1990 and 1995 “non-accompany” trip rates is presumably
attributable to the change in travel during the period. Now, adjusting all of the 1990 trips to reflect
the impact of trip diary and the change in travel during the five year period, the remaining
difference between the 1995 survey data and the adjusted 1990 data presumably reflects the impact
of household rostering.
Table A3.2 illustrates the steps taken to estimate the real changes in trip rates observed in
the “non-accompany” trips from 1990 to 1995. The total numbers of “non-accompany” trips
reported in the 1990 NPTS are in Column 1. The impact of using travel diaries on reporting trips

Appendix 3 2001 NHTS Summary of Travel Trends
A3-8
are listed in Column 2. Adjusting 1990 data for diary impact, Column 3 reports the estimated
number of trips by purpose that would have been collected in 1990 had travel diaries been used.
Comparing the adjusted 1990 figures (Column 3) to comparable 1995 data (Column 4), one can
calculate the percentage change in travel from 1990 to 1995 by trip purpose. The overall increase
is nearly 30%, approximately 4.5% per year for the five year period.
Table A3.2. Estimated Travel Changes from 1990 to 1995Based on trips without other household members “accompanied”
Purpose
(1) (2) (3)=(1)x[(=1+(2)] (4) (5)=[(4)-(3)]/(3)
1990 1-hhm1 trips(000)
DiaryImpact2
(%)
1990 1-hhm tripsadjusted fordiary impact
1995 1-hhm trips(000)
changein travel
(%)
Work, School 62,973,929 0 62,973,929 84,974,961 34.9Shopping 27,983,544 20.7 33,860,088 45,996,625 35.8Other Fam/Per 33,237,593 37.2 45,535,502 58,602,172 28.7Soc/Rec 33,166,604 20.2 39,799,925 46,509,286 16.9Other 1,233,007 9.4 1,343,978 356,444 -73.5TOTAL 158,594,677 182,383,879 236,439,488
1 1-household-member (1-hhm) trips = Trips where no other household members “accompanied.”2 From Table 1.
This approach suggests that Americans as a whole took approximately 35 percent more
commute and school trips from 1990 to 1995. A number of factors could contribute to this increase
in the total number of work and school trips. For example, the number of workers increased by
11% during this period. Note that the number of “other” trips decreased by 74% due to a better
trip purpose coding scheme. The lack of appropriate and sufficient data prohibits an evaluation of
the impact of this improved coding scheme. Thus, no adjustments are made to 1990 trips
categorized as “other” trip purpose. These trips are a very small proportion of all trips.

2001 NHTS Summary of Travel Trends Appendix 3
A3-9
With these calculations, the revised estimates of 1990 trips now reflect adjustments for (1)
trip diary and (2) change in travel. Presumably, the remaining difference between the 1995 survey
data and the adjusted 1990 data reflects the impact of household rostering. Table A3.3
demonstrates the steps to estimate this effect. First, the number of trips collected in the 1990 survey
was adjusted for the diary impact (e.g., 21% for shopping trips) and for the change in travel
between 1990 and 1995 (e.g., 36% for shopping trips). It can be reasonably assumed that after this
adjustment the 1990 data are almost comparable to the 1995 data except for the impact of
household rostering. The percentage difference between this adjusted 1990 data and the observed
1995 data is used to estimate the impact of household rostering (Table A3.3). Based on this
somewhat convoluted approach, we estimated that approximately 4% more shopping trips would
have been reported in the 1990 survey if household rostering had been used. Again, the number
of “other” trips decreased by 74% due to a better trip purpose coding scheme. The lack of
appropriate and sufficient data prohibits an evaluation of the impact of this improved coding
scheme. Thus, no adjustment is done to 1990 trips categorized with the “other” trip purpose.
Table A3.3. Estimated Impacts of Household Rostering by Trip Purpose
Purpose
(1) (2) (3) (4)=(1) x [(2)+(3)]/100
(5) (6)=[(5)-(4)]/(4)
1990Total Trips
(000)
DiaryImpact
(%)
changein travel
(%)
1990 trips adjustedfor diary impactand % change in
travel
1995Total Trips
(000)
impact oftrip rostering
(%)
Work, School 82,240,011 0 34.9 110,941,885 110,115,282 -0.7Shopping 47,056,740 20.7 35.8 73,643,798 76,688,225 4.1Other Fam/Per 56,551,552 37.2 28.7 93,819,025 97,075,588 3.5Soc/Rec 61,799,215 20.2 16.9 84,726,724 94,361,999 11.4Other 1,914,779 9.4 -73.5 687,406 689,270 0.3
Adjustment Factors for 1990 Travel Data
By combining the impact of travel diary (Column 2 of Table A3.3) and the impact of

Appendix 3 2001 NHTS Summary of Travel Trends
A3-10
household rostering (Column 6 of Table A3.3), the factors used to adjust 1990 travel data range
from no adjustment for work and school trips to a 41% increase for trips taken for other family and
personal business (i.e., non-shopping trips) (Table A3.4). These adjustment factors suggest that
between 1990 and 1995 the total number of person trips increased about 4.5% per year, compared
to a rate of 2.6% between 1969 and 1990. However, after taken into account the population
increases over the years, these adjustment factors suggest that a typical American increased his/her
trips by 2.7% per year (Table A3.5). This rate is comparable to the 2% increase observed between
the 1969 and 1990 surveys.
The fundamental assumption in this approach is that the changes observed in the “non-
accompany” trips reflect the changes observed in all trips. The validity of this assumption is
checked by first examining how representative the “non-accompany” trips are in both 1990 and
1995. “Non-accompany” trips in both 1990 and 1995 account for no less than 50 percent of the
total person trips (Table A3.6), suggesting that using “non-accompany” trips to estimate the
magnitude of travel changes in all trips appears to be reasonable. The validity of this assumption
is further verified by checking whether the “non-accompany” rate has changed from 1990 to 1995.
More than three quarters of work trips and school trips are not accompanied by other household
members. This percentage remains relatively stable from 1990 to 1995 (Table A3.6). Note that
dropping off and picking up children from schools are not considered “school trips” they are
categorized under “Other family and personal business.” Almost all trips remain somewhat stable
for the non-accompany rate between 1990 and 1995 except social and recreational trips. There is
a smaller percentage of social and recreational trips in 1995 that went “unaccompanied by other
households” than in 1990: 49% vs. 54%. That data seem to support the idea that using only “non-
accompany” trips to estimate travel changes between 1990 and 1995 is reasonable.

2001 NHTS Summary of Travel Trends Appendix 3
A3-11
Table A3.4. 1990 Travel Data Adjustment(Person trips in thousands)
Purpose 1990 Trips(1)
AdjustmentFactor
(2)
Adjusted1990 Trips(1) × (2)
1995 Trips AverageAnnual %Change
Work, School 82,240,011 1.00 82,240,011 110,115,282 6.01Shopping 47,056,740 1.25 58,820,925 76,688,225 5.45Other Fam/Per Bus 56,551,552 1.41 79,737,688 97,075,588 4.01Social/Recreational
61,799,215 1.32 81,574,964 94,361,999 2.96
Other 1,914,779 1.00 1,914,779 689,270 -TOTAL 249,562,297 304,288,367 378,930,363 4.49
Table A3.5. Daily Person Trips per PersonAdjusted 1990 and 1995 NPTS
1990 TripRate
Adjustment FactorDiary+Rostering
Adjusted1990
Trip Rate
1995 TripRate
Average AnnualChange Rate
(%)
Work, School 1.015 1.00 1.015 1.248 4.22Shopping 0.580 1.25 0.725 0.869 3.70Other Fam/Per Bus 0.698 1.41 0.984 1.100 2.26Social/Recreational 0.762 1.32 1.006 1.070 1.24Other 0.024 1.00 0.024 0.008 --TOTAL 3.079 - 3.754 4.296 2.73

Appendix 3 2001 NHTS Summary of Travel Trends
A3-12
Table A3.6. One-Household-Member Person Trips, Total Person Trips,and Non-Accompany Rate by Trip Purpose
1990 and 1995 NPTS (Person Trips in thousands)
Purpose
1990 NPTS 1995 NPTSHH Non-
AccompanyPerson Trips
Total PersonTrips
Non-Accompany
Rate
HH Non-AccompanyPerson Trips
TotalPersonTrips
Non-Accompany
Rate
Work, School 62,973,92927,983,54433,237,59333,166,6041,233,007
158,594,677
82,240,01147,056,74056,551,55261,799,2151,914,779
249,562,297
76.57% 84,974,96145,996,62558,602,17246,509,286
356,444236,439,488
110,115,28276,688,22597,075,58894,361,999
689,270378,930,363
77.17%Shopping 59.47% 59.98%Other Fam/Per Bus 58.77% 60.37%Social/Recreational 53.67% 49.29%Other 64.39% 51.71%TOTAL 63.55% 62.40%
This analysis was conducted using simple methods with the data available. These
calculations might raise as many questions as they have answered. Notwithstanding, this is the first
attempt to explain the differences on travel that can be attributed to the improvements in the survey
methods. Hopefully more research on the effects of different survey methods will follow.
2001 NHTS Summary of Travel Trends Appendix 4
A4-1
APPENDIX 4
SELECTED STANDARD ERROR TABLES

Appendix 4 2001 NHTS Summary of Travel Trends
A4-2
This page intentionally left blank.

2001 NHTS Summary of Travel Trends Appendix 4
A4-3
Appendix 4
SELECTED STANDARD ERROR TABLES
The final adjusted weights are used in calculating parameter estimates and their sample
variance. The standard error estimates shown in the following tables were obtained using the
replicate weight variance formula. Further information on calculating standard errors using this
method can be found in Chapter 7 of the January 2004 edition of the NHTS User’s Guide (Version
3).
The standard errors that are shown in the following tables reflect the sampling error but not
the variation in estimates due to some nonsampling errors. Sampling error is due to variability
between estimates from all other possible samples of the same size that could have been selected
using the same sample design (e.g. variation that occurred by chance because a sample was surveyed
rather than the entire household population). Estimates that were derived from any of these different
samples would differ from one another. Nonsampling error, which can sometimes be much larger
than sampling error, is not measured by the standard error.
The standard error of these estimates can be used to construct an interval around specific
estimates. This interval will include, with a given amount of confidence, the true population value.
About 68 percent of the intervals, created by subtracting one standard error and adding one standard
error to the specific estimate, will include the true population value. About 95 percent of the
intervals, created by subtracting two standard errors and adding two standard errors, will include the
true population value, and about 99.75 percent of the intervals, created by subtracting and adding
three standard errors, will include the true population value. Thus, one can state, with a given
percent of confidence (as stated above) that the computed interval will contain the true population
value.
An example of how these standard errors could be used is as follows. One may want to

Appendix 4 2001 NHTS Summary of Travel Trends
A4-4
know the annual person miles traveled per household for social and recreational purposes. The
estimate of the total number of annual person miles of travel per household for social and
recreational purposes in 2001 is 10,586. The standard error for this estimate, as found in Standard
Errors for Table 5, is 282.64. To construct an interval that would include the true population value
about 68 percent of the time, one would calculate: 10,586 ± (1)282.64. Therefore, a 68 percent
confidence interval for the true person miles traveled per household, as shown by this data, would
be included in the interval 10,303 to 10,869 person miles of travel per person. An interval that
would include the true person miles per household about 95 percent of the time would be
constructed by solving: 10,586 ± (2)282.64. Hence, a 95 percent confidence interval for the true
number of person miles of travel per household for social and recreational purposes is in the interval
from 10,021 to 11,151 person miles per household.

2001 NHTS Summary of Travel Trends Appendix 4
A4-5
Standard Errors for Table 1
Summary Statistics on Demographic Characteristics and Total Travel,2001 NHTS
Standard Errors for: HOUSEHOLDS (000) All 3 1 person 0 2 persons 2 3 persons 4 4+ persons 1 PERSONS (000) All Persons 5 or older 391 Under 16 202 16-19 336 20-34 229 35-64 106 65+ 47 All Males 5 or older 228 All Females 5 or older 263 LICENSED DRIVERS (000) All 357 Men 237 Women 287 WORKERS (000) All 524 Men 304 Women 403 HOUSEHOLD VEHICLES (000)
672 HOUSEHOLD VEHICLE TRIPS (000,000)
1,037 HOUSEHOLD VMT (000,000)
21,552 PERSON TRIPS (000,000) 5+
1,539 PERSON MILES OF TRAVEL (000,000) 5+
60,567

Appendix 4 2001 NHTS Summary of Travel Trends
A4-6
Standard Errors for Table 5
Average Annual PMT, Person Trips and Trip Length by Trip Purpose2001 NHTS
Stderr for Avg Annual PMT per HH
All Purposes 564.13To/From Work 97.89Work Related Business 263.74Shopping 105.47All Other Fam/Per Business 173.83School/Church 47.19Social and Recreational 282.64Other 266.00
Stderr for Avg Annual Person Trips per HHAll Purposes 14.33To/From Work 4.14Work Related Business 2.41Shopping 6.26All Other Fam/Per Business 7.08School/Church 4.46Social and Recreational 7.83Other 1.17
Stderr for Avg Person Trip LengthAll Purposes 0.16To/From Work 0.16Work Related Business 2.41Shopping 0.14All Other Fam/Per Business 0.19School/Church 0.11Social and Recreational 0.29Other 8.51

2001 NHTS Summary of Travel Trends Appendix 4
A4-7
Standard Errors for Table 6
Average Annual VMT, Vehicle Trips, and Trip Lengthby Selected Trip Purposes
2001 NHTS
Stderr for Avg Annual VMT per HHAll Purposes 200.79To or From Work 69.73Shopping 50.29Other Fam & Personal Business 88.60Social and Recreational 126.22
Stderr for Avg Annual Vehicle Trips per HHAll Purposes 9.66To or From Work 3.85Shopping 4.24Other Fam. & Personal Business 5.05Social and Recreational 3.95
Stderr for Avg Vehicle Trip LengthAll Purposes 0.09To or From Work 0.12Shopping 0.10Other Fam. & Personal Business 0.15Social and Recreational 0.27

Appendix 4 2001 NHTS Summary of Travel Trends
A4-8
Standard Errors for Table 9
Total Person Trips by Mode of Transportation and Trip Purpose2001 NHTS(millions)
Standard ErrorsPrivate Public Transit Walk Other Total
Total 1,562 203 482 291 1,595
To or From Work439 99 90 45 444
Work Related
Business252 34 53 48 259
Family and
Personal Business1,128 104 277 97 1,165
School/Church 434 60 140 170 474
Social and
Recreational772 72 328 141 882
Other 103 24 38 42 133

2001 NHTS Summary of Travel Trends Appendix 4
A4-9
Standard Errors for Table 16
Average Vehicle Occupancy for Selected Trip Purposes(person miles per vehicle mile)
2001 NHTS
Standard ErrorsTo or From Work 0.006
Shopping 0.020
Other Family or
Personal Business
0.019
Social and Recreational 0.029
All Purposes 0.010

Appendix 4 2001 NHTS Summary of Travel Trends
A4-10
Standard Errors for Table 17
Households by Availability of Household Vehicle2001 NHTS(thousands)
Standard Errors for Households with --
No Vehicle 181
One Vehicle 311
Two Vehicles 304
Three or More Vehicles 250
ALL 3
Vehicles Per Household 0.0063

2001 NHTS Summary of Travel Trends Appendix 4
A4-11
Standard Errors for Table 20
Number of Household Vehicles and Average Vehicle Age by Vehicle Type2001 NHTS
Standard Errors for Vehicles (000) Total 672 Auto 644 Van 248 Sport Utility 309 Pickup 358 Other Truck 67 RV/Motor Home 71 Motorcycle 151 Other 88Standard Errors for Avg Vehicle Age
Total 0.047 Auto 0.060 Van 0.082 Sport Utility 0.078 Pickup 0.096 Other Truck 1.107 RV/Motor Home 0.457
Note:
! Standard errors are generated for number of household vehicles and average vehicle age, not on percentage of
household vehicles and vehicle age.

Appendix 4 2001 NHTS Summary of Travel Trends
A4-12
Standard Errors for Table 22
Average Annual Miles per Vehicle by Vehicle Age(Vehicle Owner's Estimate)
2001 NHTS
Standard Errors for Vehicles 0 to 2 years 173.46
3 to 5 years 127.39
6 to 9 years 153.40
10 or more years 107.24
ALL 420.99

2001 NHTS Summary of Travel Trends Appendix 4
A4-13
Standard Errors for Table 23
Average Annual Miles per Licensed Driver by Driver Age and Gender(Self Estimate)
2001 NHTS
Driver Age
Stderr for ALL
16 to 19 380
20 to 34 237
35 to 54 125
55 to 64 211
65+ 119
ALL 93
Stderr for Men
16 to 19 631
20 to 34 345
35 to 54 227
55 to 64 362
65+ 174
ALL 147
Stderr for Women
16 to 19 340
20 to 34 222
35 to 54 115
55 to 64 198
65+ 110
ALL 91

Appendix 4 2001 NHTS Summary of Travel Trends
A4-14
Standard Errors for Table 25
Number of Workers by Usual Mode2001 NHTS(thousands)
Mode of Transportation StderrAll Modes 626Auto, Truck, Van, or Utility Vehicle 622Public Transit 197Walk 159Other 103
Note:
! Standard errors are generated for number of workers by usual mode, not on percentage of workers by usual mode.

2001 NHTS Summary of Travel Trends Appendix 4
A4-15
Standard Errors for Table 29
Daily Travel Statistics by Weekday vs Weekend2001 NHTS
Standard Errors for Daily Travel Statistics Weekday Weekend
Vehicle Trips per Driver 0.014 0.031
Daily Work Trips 0.009 0.008
Daily Non-Work Trips 0.015 0.028
VMT per Driver 0.381 0.492
Average Vehicle Trip Length 0.106 0.185
Average Time Spent Driving (in minutes) 0.394 0.649
Person Trips per Person 0.016 0.036
PMT per Person 0.660 1.406
Average Person Trip Length (5+) 0.158 0.340

Appendix 4 2001 NHTS Summary of Travel Trends
A4-16
This page intentionally left blank.

2001 NHTS Summary of Travel Trends Appendix 5
A5-1
APPENDIX 5
DIFFERENCES IN METROPOLITAN AREA DEFINITIONS
BETWEEN 1983 AND 1990 NPTS

Appendix 5 2001 NHTS Summary of Travel Trends
A5-2
This page intentionally left blank.

2001 NHTS Summary of Travel Trends Appendix 5
A5-3
Appendix 5
DIFFERENCES IN METROPOLITAN AREA DEFINITIONS
BETWEEN 1983 AND 1990 NPTS
Between 1983 and 1990, the United States Office of Management and Budget changed the
definition of a Metropolitan Statistical Area (MSA). This change complicates any comparisons of
metropolitan area data from the 1983 and 1990 NPTS. In 1983 all areas were divided into
combinations of counties called Standard Metropolitan Statistical Areas (SMSAs), with the
exception that SMSAs in New England consisted of cities and towns. Typically, metropolitan areas
are redefined following each census, resulting in additions or subtractions of counties, New England
towns, and central cities. Substantial changes were made following the 1980 Census because of
considerable revisions in the standards used by the Office of Management and Budget to define the
areas.
By 1990 the term "metropolitan statistical area" (MSA) replaced "standard metropolitan
statistical area" (SMSA). An optional two-tiered metropolitan structure was introduced for MSAs
of a million people or more. These MSAs could be subdivided into Primary MSAs (PMSAs) if
certain decentralization conditions were met and if the locality desired such subdivisions. If PMSA's
were defined within an MSA, then the MSA became a Consolidated MSA (CMSA).
Of the 318 preexisting SMSAs, 53 became PMSAs within 15 CMSAs, and 8 new PMSAs
were established within these CMSAs. In addition, 5 preexisting SMSAs became CMSAs which
were further subdivided into 10 PMSAs. As the result of these redefinitions, there were 20 CMSAs
with 71 component PMSAs when the 1990 NPTS was conducted. Among these 20 CMSAs, there
were ten with a population of more than 3 million. These ten CMSAs were made up of 48 PMSAs,
most of which did not by themselves have a population more than 3 million. Moreover, there was
one MSA in 1990 with a population of more than 3 million.
In the 1990 and 1995 NPTS, the variable MSASIZE was given a population size value based

Appendix 5 2001 NHTS Summary of Travel Trends
A5-4
on its MSA or CMSA size. Therefore, if a household was located in an area within a PMSA of less
than 3 million, but its CMSA had a population of more than 3 million, then the household was
categorized as being located in an MSA of 3+ million. In 1983 and all previous NPTS surveys,
however, only the SMSAs which by themselves had a population of more than 3 million were
categorized as being "3+ million." The implication of this definitional change on the NPTS data is
that many more households were estimated by the 1990 and 1995 data as being located within
metropolitan areas with a population of more than 3 million than that estimated by the previous
NPTS surveys.

U. S. Department of Transportation
Federal Highway
Administration
November 2004