supplementary figure 1 - dm5migu4zj3pb.cloudfront.net · supplementary figure 1 a b 0 10 20 30 40...
TRANSCRIPT
Supplementary Figure 1
A
B
0
10
20
30
40
Cell
No.
per
gra
m (×
10
5)
F4/80+ CD11b+
0
1000
2000
3000
0
10
20
30
40
50
(g)
(g)
**
***
C
Body weight VAT weight
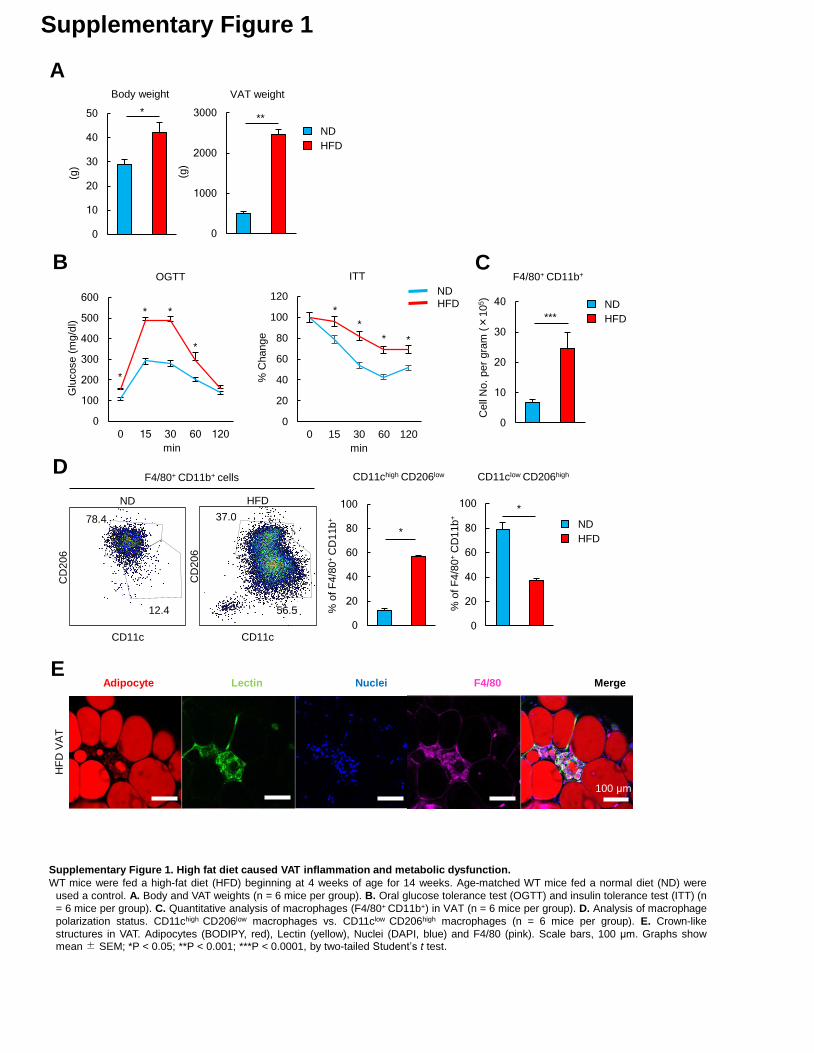
Supplementary Figure 1. High fat diet caused VAT inflammation and metabolic dysfunction.
WT mice were fed a high-fat diet (HFD) beginning at 4 weeks of age for 14 weeks. Age-matched WT mice fed a normal diet (ND) were
used a control. A. Body and VAT weights (n = 6 mice per group). B. Oral glucose tolerance test (OGTT) and insulin tolerance test (ITT) (n
= 6 mice per group). C. Quantitative analysis of macrophages (F4/80+ CD11b+) in VAT (n = 6 mice per group). D. Analysis of macrophage
polarization status. CD11chigh CD206low macrophages vs. CD11clow CD206high macrophages (n = 6 mice per group). E. Crown-like
structures in VAT. Adipocytes (BODIPY, red), Lectin (yellow), Nuclei (DAPI, blue) and F4/80 (pink). Scale bars, 100 μm. Graphs showmean± SEM; *P < 0.05; **P < 0.001; ***P < 0.0001, by two-tailed Student’s t test.
*
ND
HFD
0
100
200
300
400
500
600
0 15 30 60 120
*
0
20
40
60
80
100
120
0 15 30 60 120
HFD
ND
Glu
cose (
mg/d
l)
% C
hange
OGTT ITT
min min
* *
*
*
*
*
*
ND
HFD
F4/80+ CD11b+ cells
0
20
40
60
80
100
0
20
40
60
80
100
% o
f F
4/8
0+
CD
11b
+
% o
f F
4/8
0+
CD
11b
+
CD11c
CD
206
HFD
56.5
37.0
CD
206
CD11c
ND
12.4
78.4
D
*
*
HF
D V
AT
Adipocyte Lectin Nuclei F4/80 MergeE
CD11chigh CD206low CD11clow CD206high
ND
HFD
100 μm
Supplementary Figure 2
A
Rela
tive E
xpre
ssio
n (
AU
)
Rela
tive E
xpre
ssio
n (
AU
)
0
0.5
1
1.5
Rela
tive E
xpre
ssio
n (
AU
)
Satb1 Cebpa Eef1a1 Dusp10
n.s.
0
0.5
1
1.5
0
1
2
3
0
0.5
1
1.5
0.9 5.8
13.979.4
SA-β-gal
CD
153
CD4+ T cells
0
20
40
60B cells
IgG
in
culture
sup.
(ng/m
l)
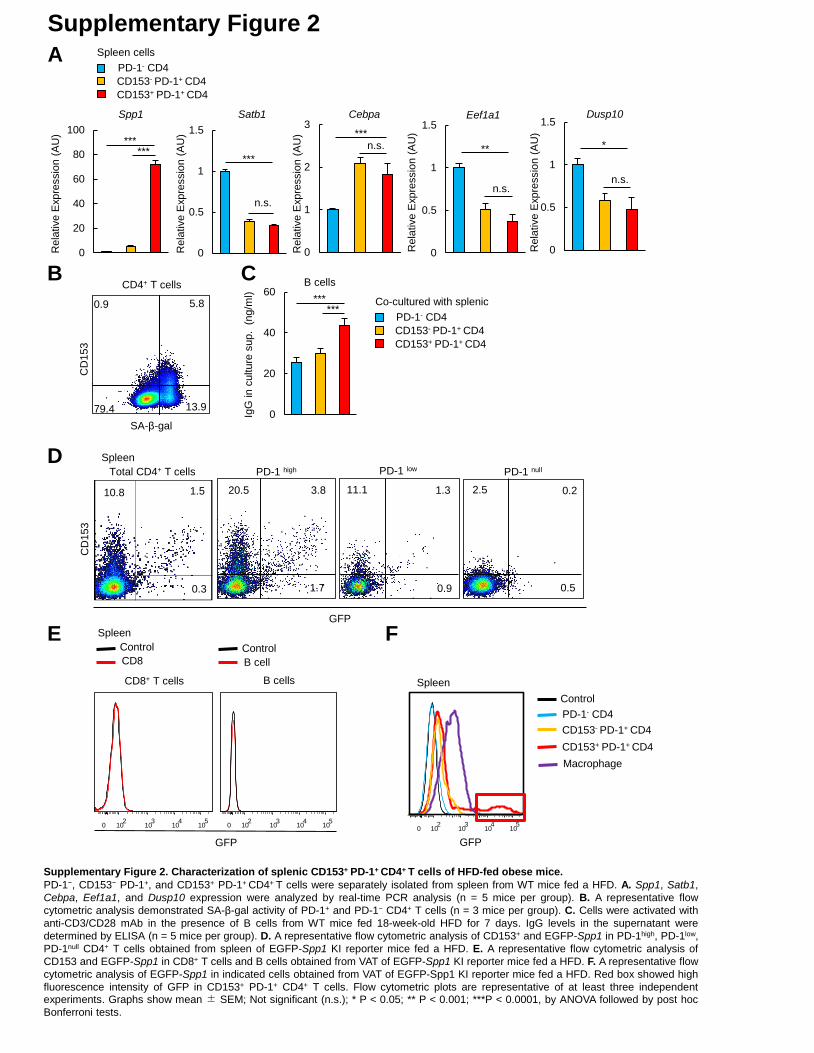
Supplementary Figure 2. Characterization of splenic CD153+ PD-1+ CD4+ T cells of HFD-fed obese mice.
PD-1−, CD153− PD-1+, and CD153+ PD-1+ CD4+ T cells were separately isolated from spleen from WT mice fed a HFD. A. Spp1, Satb1,
Cebpa, Eef1a1, and Dusp10 expression were analyzed by real-time PCR analysis (n = 5 mice per group). B. A representative flow
cytometric analysis demonstrated SA-β-gal activity of PD-1+ and PD-1− CD4+ T cells (n = 3 mice per group). C. Cells were activated with
anti-CD3/CD28 mAb in the presence of B cells from WT mice fed 18-week-old HFD for 7 days. IgG levels in the supernatant were
determined by ELISA (n = 5 mice per group). D. A representative flow cytometric analysis of CD153+ and EGFP-Spp1 in PD-1high, PD-1low,
PD-1null CD4+ T cells obtained from spleen of EGFP-Spp1 KI reporter mice fed a HFD. E. A representative flow cytometric analysis of
CD153 and EGFP-Spp1 in CD8+ T cells and B cells obtained from VAT of EGFP-Spp1 KI reporter mice fed a HFD. F. A representative flow
cytometric analysis of EGFP-Spp1 in indicated cells obtained from VAT of EGFP-Spp1 KI reporter mice fed a HFD. Red box showed high
fluorescence intensity of GFP in CD153+ PD-1+ CD4+ T cells. Flow cytometric plots are representative of at least three independentexperiments. Graphs show mean ± SEM; Not significant (n.s.); * P < 0.05; ** P < 0.001; ***P < 0.0001, by ANOVA followed by post hoc
Bonferroni tests.
***
***n.s.
Spleen cells
PD-1- CD4
CD153- PD-1+ CD4
CD153+ PD-1+ CD4
n.s.
**
Rela
tive E
xpre
ssio
n (
AU
)
n.s.
*
B C
Rela
tive E
xpre
ssio
n (
AU
)
0
20
40
60
80
100
******
Spp1
****** Co-cultured with splenic
PD-1- CD4
CD153- PD-1+ CD4
CD153+ PD-1+ CD4
10.8 1.5
0.3
Total CD4+ T cells
GFP
CD
153
PD-1 high PD-1 low PD-1 null
3.820.5
1.7
1.3
0.9
11.1 2.5 0.2
0.5
Spleen
0 102
103
104
105
CD8+ T cells
0 102
103
104
105
B cells
Control
CD8Control
B cell
GFP
Spleen
GFP
0 102
103
104
105
Control
PD-1- CD4
CD153- PD-1+ CD4
CD153+ PD-1+ CD4
Macrophage
Spleen
D
E F
Supplementary Figure 3
300 μm
Adipocyte CFSE Nuclei Merge
A B
C
D
0 102
103
104
105
CFSE
0
Count
control
Liver
VAT
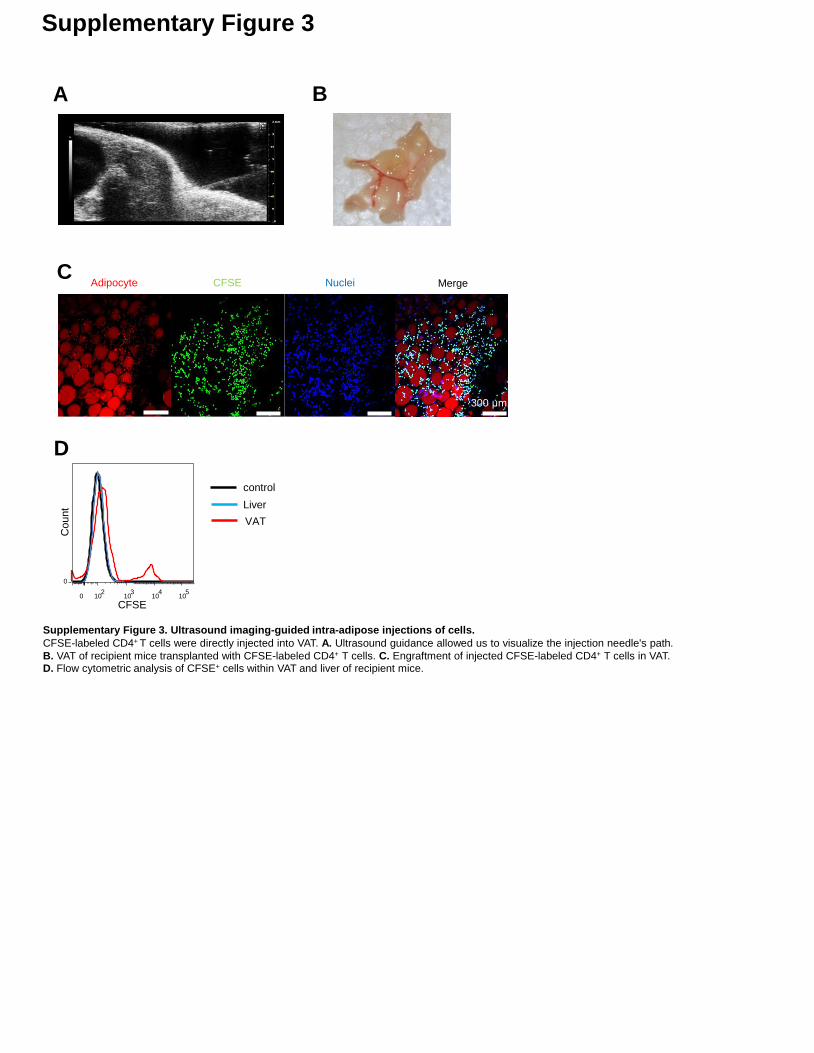
Supplementary Figure 3. Ultrasound imaging-guided intra-adipose injections of cells.
CFSE-labeled CD4+ T cells were directly injected into VAT. A. Ultrasound guidance allowed us to visualize the injection needle's path.
B. VAT of recipient mice transplanted with CFSE-labeled CD4+ T cells. C. Engraftment of injected CFSE-labeled CD4+ T cells in VAT.D. Flow cytometric analysis of CFSE+ cells within VAT and liver of recipient mice.
Supplementary Figure 4
Body w
eig
ht
(g)
0
5
10
15
20
25
30n.s.
VA
T w
eig
ht
(mg)
Fo
od in
take (
g)
0
0.5
1
1.5
2
CD153+ PD-1+ CD4
Vehicle
0
100
200
300
400
500
600 Transferred cells
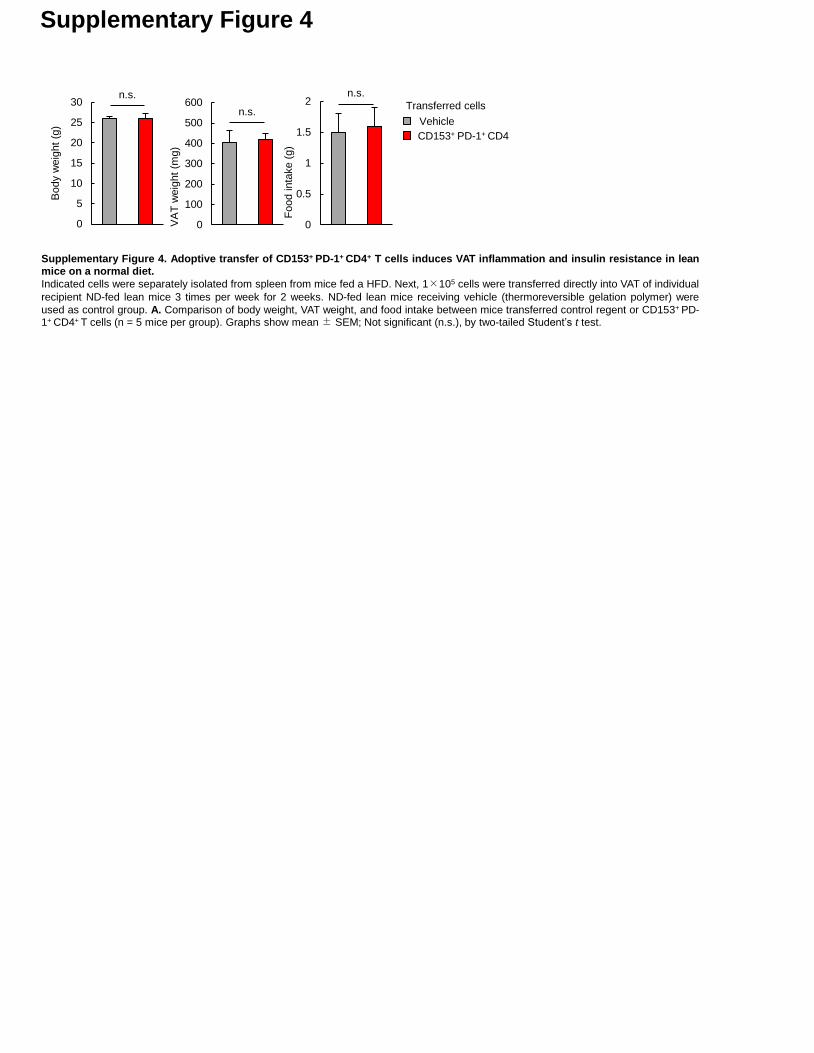
Supplementary Figure 4. Adoptive transfer of CD153+ PD-1+ CD4+ T cells induces VAT inflammation and insulin resistance in leanmice on a normal diet.
Indicated cells were separately isolated from spleen from mice fed a HFD. Next, 1×10⁵ cells were transferred directly into VAT of individual
recipient ND-fed lean mice 3 times per week for 2 weeks. ND-fed lean mice receiving vehicle (thermoreversible gelation polymer) were
used as control group. A. Comparison of body weight, VAT weight, and food intake between mice transferred control regent or CD153+ PD-1+ CD4+ T cells (n = 5 mice per group). Graphs show mean± SEM; Not significant (n.s.), by two-tailed Student’s t test.
n.s.
n.s.
Supplementary Figure 5
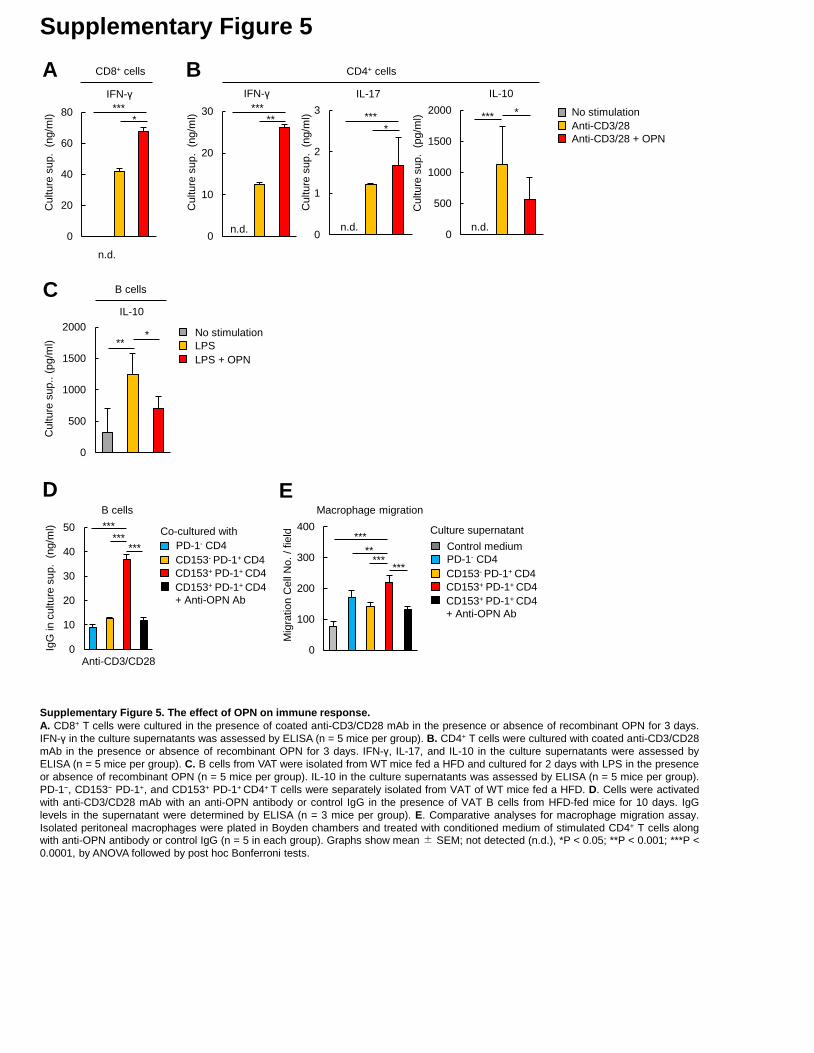
Supplementary Figure 5. The effect of OPN on immune response.
A. CD8+ T cells were cultured in the presence of coated anti-CD3/CD28 mAb in the presence or absence of recombinant OPN for 3 days.
IFN-γ in the culture supernatants was assessed by ELISA (n = 5 mice per group). B. CD4+ T cells were cultured with coated anti-CD3/CD28
mAb in the presence or absence of recombinant OPN for 3 days. IFN-γ, IL-17, and IL-10 in the culture supernatants were assessed by
ELISA (n = 5 mice per group). C. B cells from VAT were isolated from WT mice fed a HFD and cultured for 2 days with LPS in the presence
or absence of recombinant OPN (n = 5 mice per group). IL-10 in the culture supernatants was assessed by ELISA (n = 5 mice per group).
PD-1−, CD153− PD-1+, and CD153+ PD-1+ CD4+ T cells were separately isolated from VAT of WT mice fed a HFD. D. Cells were activated
with anti-CD3/CD28 mAb with an anti-OPN antibody or control IgG in the presence of VAT B cells from HFD-fed mice for 10 days. IgG
levels in the supernatant were determined by ELISA (n = 3 mice per group). E. Comparative analyses for macrophage migration assay.
Isolated peritoneal macrophages were plated in Boyden chambers and treated with conditioned medium of stimulated CD4+ T cells alongwith anti-OPN antibody or control IgG (n = 5 in each group). Graphs show mean± SEM; not detected (n.d.), *P < 0.05; **P < 0.001; ***P <
0.0001, by ANOVA followed by post hoc Bonferroni tests.
A
No stimulation
Anti-CD3/28
Anti-CD3/28 + OPN
0
20
40
60
80
Culture
sup.
(ng/m
l) ****
CD8+ cells
0
10
20
30
B
0
1
2
3
0
500
1000
1500
2000*** *
CD4+ cells
C
IFN-γ
Culture
sup.
(ng/m
l)
IFN-γ IL-17 IL-10
Culture
sup.
(ng/m
l)
Culture
sup.
(pg/m
l)
0
500
1000
1500
2000
Culture
sup..
(pg/m
l)
No stimulation
LPS
LPS + OPN
***
B cells
IL-10
n.d.
n.d. n.d. n.d.
*****
****
PD-1- CD4
CD153- PD-1+ CD4
CD153+ PD-1+ CD4
CD153+ PD-1+ CD4
+ Anti-OPN Ab
0
10
20
30
40
50
DB cells
Control medium
Mig
ratio
n C
ell
No.
/ fie
ld
0
100
200
300
400
Macrophage migration
IgG
in
culture
sup.
(ng/m
l) Co-cultured with
Anti-CD3/CD28
***
******
******
**
***
E
PD-1- CD4
CD153- PD-1+ CD4
CD153+ PD-1+ CD4
CD153+ PD-1+ CD4
+ Anti-OPN Ab
Culture supernatant
Supplementary Figure 6
B cells
8.6
GL7
SS
C
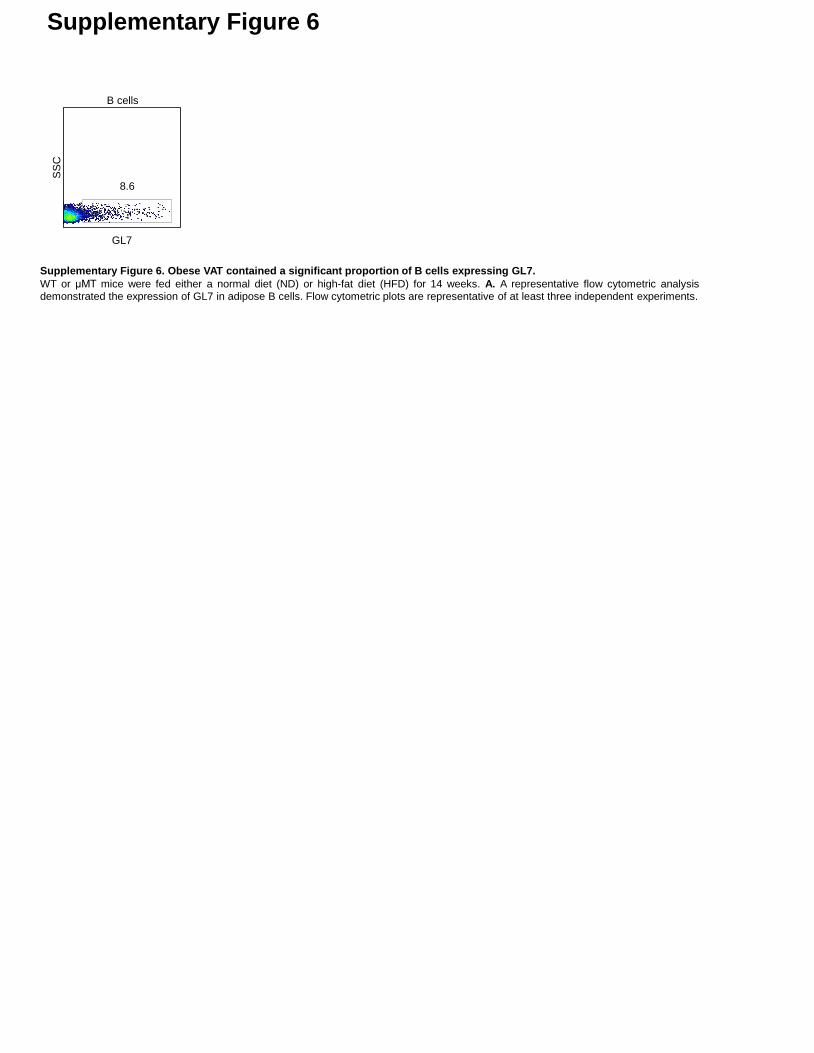
Supplementary Figure 6. Obese VAT contained a significant proportion of B cells expressing GL7.
WT or μMT mice were fed either a normal diet (ND) or high-fat diet (HFD) for 14 weeks. A. A representative flow cytometric analysisdemonstrated the expression of GL7 in adipose B cells. Flow cytometric plots are representative of at least three independent experiments.
Supplementary Figure 7
A
0 102
103
104
105
0
102
103
104
105
7-AAD0 10
210
310
410
5
0
50K
100K
150K
200K
250K
SS
C-A
0 50K 100K 150K 200K 250K
0
50K
100K
150K
200K
250K
0 50K 100K 150K 200K 250K
0
50K
100K
150K
200K
250K
0 50K 100K 150K 200K 250K
FSC-A
0
50K
100K
150K
200K
250K
SS
C-A
0 102
103
104
105
CD4
0
102
103
104
105
CD
3
0 103
104
105
CD153
0
103
104
105
PD
-1
FSC-WF
SC
-H
SS
C-H
SSC-WP
D-1
CD44
B
0 103
104
105
0
103
104
105
98.2
98.5
0 103
104
105
0
103
104
105
99.9
0 103
104
105
0
103
104
105
CD153- PD-1+
CD4+ T cells
CD153- PD-1- CD153+ PD-1+
CD153
PD
-1
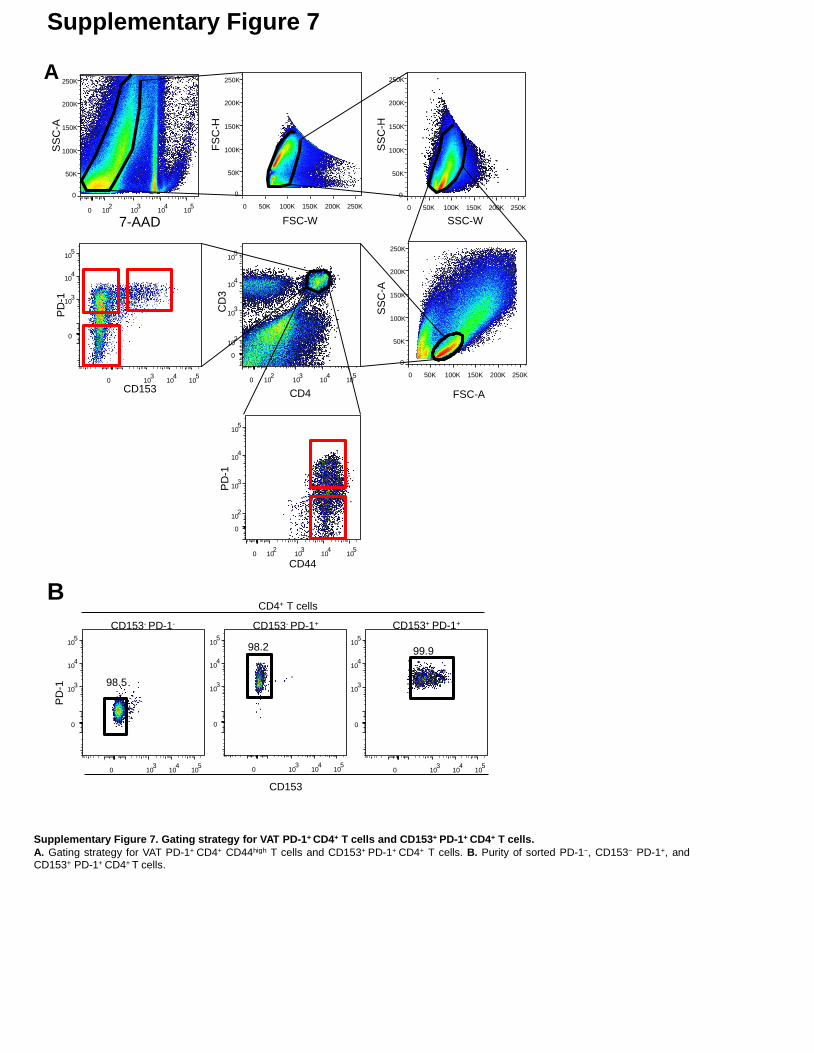
Supplementary Figure 7. Gating strategy for VAT PD-1+ CD4+ T cells and CD153+ PD-1+ CD4+ T cells.
A. Gating strategy for VAT PD-1+ CD4+ CD44high T cells and CD153+ PD-1+ CD4+ T cells. B. Purity of sorted PD-1−, CD153− PD-1+, andCD153+ PD-1+ CD4+ T cells.