supporting environmental beverage cartons
TRANSCRIPT
Supporting evidence -Environmental performance of beverage cartons
December 2020

Executive Summary
2
CONTENTS
1. Executive Summary _________________________________________________6
2. Background _______________________________________________________7
2.1. Goal and scope _______________________________________________________ 7
2.2. Methods and results ___________________________________________________ 7
3. LCA meta-analysis __________________________________________________8
4. Analysis of comparative LCA studies ___________________________________15
5. Further environmental benefits of beverage cartons ______________________16
5.1. Packaging efficiency __________________________________________________ 16
5.2. Transport efficiency ___________________________________________________ 19
5.3. Reduced plastic consumption ___________________________________________ 20
5.4. Use of biogenic resources ______________________________________________ 22
6. Conclusion _______________________________________________________24
References ___________________________________________________________26
Annex – Communication media __________________________________________29

Executive Summary
3
TABLES
Table 1: Literature for meta-analysis, studies and their results for beverage cartons ................... 9
Table 2: Literature for meta-analysis, studies and their results for PET bottles .......................... 10
Table 3: Literature for meta-analysis, studies and their results for single-use glass bottles ....... 11
Table 4: Literature for meta-analysis, studies, and their results for reusable glass bottles ......... 12
Table 5: Results of Kruskal-Wallis test for LCA meta-analysis ...................................................... 14
Table 6: Results of DSCF pairwise comparison of GWP100 values ................................................. 14
Table 7: Evaluation matrix of comparative LCA studies ................................................................ 15
Table 8: Kruskal-Wallis test for packaging efficiency results ........................................................ 18
Table 9: DSCF pairwise comparisons for packaging efficiency results .......................................... 18
Table 10: Calculation example of transport efficiency for milk in beverage cartons and alternative
packaging ....................................................................................................................................... 19

Executive Summary
4
FIGURES
Figure 1: Box plot chart for LCA meta-analysis ............................................................................. 13
Figure 3: Boxplot chart of packaging mass per liter beverage ...................................................... 17
Figure 4: Plastic consumption of PET bottles ................................................................................ 21
Figure 5: Plastic consumption of beverage cartons ...................................................................... 21
Figure 2: Extraction and growth of wood in forests of selected countries. .................................. 23

Executive Summary
5
About the authors
The section ‚Packaging and Resource Management’ of the University of Applied Science Campus
Vienna (FH Campus Wien) is offering two bachelor programs (Packaging technology, Sustainable
Resource Management) and an international master’s program (Packaging Technology and
Sustainability). The experts of the section have many years of extensive know-how in packaging
technology, life cycle assessments, as well in holistic sustainability assessments of packaging.
Circular Analytics was founded as a spin-off of the section in 2019.
https://www.fh-campuswien.ac.at/
https://circularanalytics.com/
Authors
Bernhard Wohner, MSc BEd
Section Packaging and Resource Management
University of Applied Sciences Campus Vienna (FH Campus Wien)
Dr. Manfred Tacker
Circular Analytics TK GmbH
Section Packaging and Resource Management
FH Campus Wien
Competing interests
The authors declare no conflict of interests.

Executive Summary
6
1. EXECUTIVE SUMMARY This report focuses on environmental performance of beverage cartons compared to alternative
packaging options for liquid food and beverages. The authors reviewed life cycle assessment
studies commissioned by members of ACE (‘The Alliance for Beverage Cartons and the
Environment’), as well as further studies identified by conducting a literature search carried out
for dairy products and non carbonated softdrinks such as juice covering EU or markets within the
EU.
A meta-analysis of the selected studies revealed that the global warming potential (given in gram
CO2 equivalents), on average, beverage cartons yield significantly better results (median: 83 g
CO2eq per liter) than PET bottles (median: 156 g CO2eq per liter) and single-use glass bottles
(median: 430 g CO2eq). While the median global warming potential was also lower than that of
reusable glass bottles (100 g CO2eq), the difference was not statistically different due to the small
number of LCA studies on reusable glass bottles. However, an additional evaluation of
comparative LCA studies showed that beverage cartons yielded better results than reusable glass
bottles in all three reviewed studies. Taken together with the meta-analysis, this strongly
indicates that beverage cartons indeed can have a lower global warming potential than reusable
glass bottles.
Next, the reasons for the superior global warming potential were investigated.
Firstly, a meta-analysis on packaging mass revealed that beverage cartons have a significantly
higher packaging efficiency (mass of primary packaging per liter) than single-use and reusable
glass bottles. While the median packaging efficiency of beverage cartons (31 g including caps)
was also higher than that of PET bottles (36 g including caps/sleeves/labels), the difference was
not statistically significant.
Secondly, the high packaging efficiency also leads to a higher transport efficiency, resulting in
lower emissions due to transporting goods. A truck can be loaded with 25% to 41% more milk
using beverage cartons compared to glass bottles.
Thirdly, beverage cartons are made mainly from renewable resources, reducing the strain on
fossil resources e.g. to produce plastic. Even if the entire European Union meets a 90% collection
rate of e.g. PET bottles by 2030, plastic consumption would still be higher than with beverage
cartons.
Finally, beverage cartons are made from wood sourced from sustainably managed forests. The
forests used show wood volume growth during the recent decades. In addition, beverage cartons
are made only from by-products of the production of sawn timber such as sawmill chips and
wood from thinning. Furthermore, the production of liquid packaging board for beverage cartons
primarily uses biotic resources for energy generation. However, forest growth is not considered
in the reviewed studies. A more accurate reflection of those issues in LCA methodology would
decrease the global warming potential of beverage cartons even further.

Background
7
2. BACKGROUND ACE, The Alliance for Beverage Cartons and the Environment, is a European platform of beverage
carton manufacturers and their paperboard suppliers. One of ACE’s goals is to deliver sound and
robust evidence for the environmental benefits of the beverage carton using life cycle
approaches. Over the years, ACE members commissioned several life cycle assessment (LCA)
studies, which compared their products to alternative packaging types.
2.1. Goal and scope
For the present study, Circular Analytics was asked to deliver sound and robust evidence that can
be used by ACE for messaging.
Circular Analytics analyzed LCA studies commissioned by ACE members with European scope.
Additionally, publicly accessible LCA reports commissioned by other parties were researched and
added to the analysis.
2.2. Methods and results
For the present study, the tasks accomplished can be divided into
1. Meta-analysis of global warming potential in existing LCA studies
2. Analysis of the interpretation of studies which compared beverage cartons to alternative
packaging types
3. Investigating the reasons of the global warming potential performance of beverage
cartons and identifying improvements leading to a better reflection of beverage carto
specific aspects in life cycle assessments

LCA meta-analysis
8
3. LCA META-ANALYSIS For the LCA meta-analysis, the studies commissioned by ACE and provided to Circular Analytics
were analyzed for global warming potential results of beverage cartons and results of alternative
packaging if available. To extend the scope, results of further studies were incorporated with the
criterion that the LCA study has to be reviewed, thus be either an (i) article published in a peer-
reviewed scientific journal (‘scientific literature’), (ii) be an LCA report which includes a critical
review or (iii) be an environmental product declaration (EPD).
Further, to include the study in the analysis, an individual result for the packaging (in cases where
packaging was investigated in combination with its filling good) had to be clearly indicated (or
easily derivable) and that the study had to depict the full life cycle of the packaging (including its
End-of-Life). The value taken from each study was the Global Warming Potential over 100 years
(GWP100 in g CO2eq) for 1 liter of packaging or liquid. If the studies did not provide values for 1
liter, the results for the respective volume were scaled accordingly.
For finding and selecting scientific literature, www.sciencedirect.com was used in combination
with the keywords (i) lca AND beverage carton (ii) lca AND pet bottle, and (iii) LCA AND glass
bottle. Further, snowballing (reviewing the references section of the selected literature) was
used to find additional literature missed by the initial review process. In total, 70 GWP100 values
could be obtained:
21 values for beverage cartons
25 values for PET bottles
13 values for single-use glass bottles
11 values for reusable glass bottles
In addition to the GWP100 values, information on the type of the respective filling good under
study was extracted. In some cases, studies only indicated the filling good as ‘beverage’ or
‘drinks’. Two things should be noted considered the following comparison:
not all studies indicated if the PET bottles are of mono- or multilayer nature1, while the
functional equivalence to beverage cartons is - more often than not - that of multilayer
bottles
beverage cartons cannot be filled with carbonated beverages or soda
The values extracted from the literature are listed in the following tables (Table 1-Table 4).
1 To provide high barrier properties, PET bottles for liquids other than water are often comprised of additional barrier layers, such as polyamide (PA), polyvinylidenchloride (PVDC) or plasma-coating (SiOx)

LCA meta-analysis
9
Table 1: Literature for meta-analysis, studies and their results for beverage cartons
Type of study Study Initial volume of
packaging [liter] Filling good GWP100 [g CO2eq]
Scientific literature
[1] 1 Milk 186
[2] 1 Milk 77
[3] 1 Milk 34
[3] 1 Milk (UHT) 67
[4] 1 Drinks 88
[5] 1 Milk 104
EPD [6] 1 Milk (UHT) 160
LCA report
[7] 1 Milk 83
[8] 1 Milk Redacted (Study
under NDA)
[9] 1 Milk 64
[10] 1 Juice 128
[11] 1 Juice 96
[12] Wine 139
[13] 1 Juice 52
[13] 1 Milk (UHT) 38
[13] 1 Milk 22
[14] 1 Milk (UHT)
75 (median of
investigated
packaging variations)
[15] 1 Milk (UHT) 85
[16] 1 Juice 88
Other [17] 1 Juice 86
[17] 0.97 Milk 77
Arithmetic average 87
Standard deviation 40
Median 83

LCA meta-analysis
10
Table 2: Literature for meta-analysis, studies, and their results for PET bottles
Type of study Study Initial volume of
packaging [liter] Filling good GWP100 [g CO2eq]
Scientific literature
[18] 1 Beverage 187
[19] 2 Beverage 45
[20] 0.5 Juice 224
[5] 1 Milk 165
[21] 1 Milk 169
[22] 0.5 Carbonated soft
drinks 174
[4] 1 Drinks 151
LCA report
[7] 0.5 Juice 160
[7] 1 Milk 117
[8] 1 Milk 163
[23] 1 Soda Redacted (Study
under NDA)
[9] 1 Milk (UHT) 192
[13] 1 Juice 167 (mean of
packaging variations)
[13] 1 Milk (UHT) 131
[13] 1 Milk 134
[16] 1 Non-carbonated soft
drinks 121
[15] 1 Milk (UHT) 155
[16] 1 Non-carbonated soft
drinks 145
[10] 1 Juice 156
[11] 1 Juice 154
[12] 0.75 Wine 351
[23] 1 Soda Redacted (Study
under NDA)
EPD [24] 1.5 Soda 160
[25] 1.25 Soda 294
Other [17] 1.23 Juice 106
[17] 1.33 Soda 87
Arithmetic average 161
Standard deviation 61
Median 156

LCA meta-analysis
11
Table 3: Literature for meta-analysis, studies, and their results for single-use glass bottles
Type of study Study Initial volume of
packaging [liter] Filling good GWP100 [g CO2eq]
Scientific literature
[2] 1 Milk 448
[4] 1 Drinks 176
[21] 1 Milk 430
[22] 0.75 Carbonated soft
drinks 414
[26] 0.70 Gin 714
LCA report
[7] 0.5 Juice 548
[7] 1 Milk 335
[8] 1 Milk 256
[16] 1 Non-carbonated soft
drinks 295
[12] 0.75 Wine 1173
EPD [24] 1 Soda 680
[25] 0.75 Soda 1173
Other [17] 0.34 Beer 359
Arithmetic average 529
Standard deviation 302
Median 430
LCA meta-analysis
12
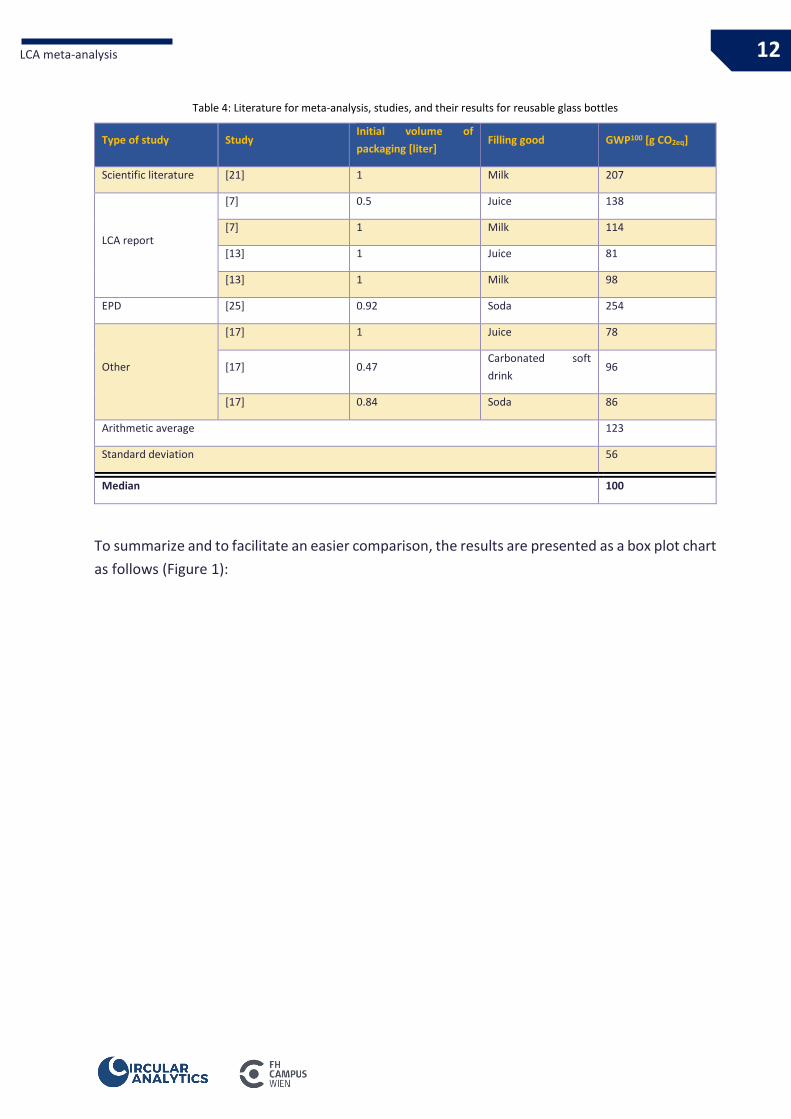
Table 4: Literature for meta-analysis, studies, and their results for reusable glass bottles
Type of study Study Initial volume of
packaging [liter] Filling good GWP100 [g CO2eq]
Scientific literature [21] 1 Milk 207
LCA report
[7] 0.5 Juice 138
[7] 1 Milk 114
[13] 1 Juice 81
[13] 1 Milk 98
EPD [25] 0.92 Soda 254
Other
[17] 1 Juice 78
[17] 0.47 Carbonated soft
drink 96
[17] 0.84 Soda 86
Arithmetic average 123
Standard deviation 56
Median 100
To summarize and to facilitate an easier comparison, the results are presented as a box plot chart
as follows (Figure 1):
LCA meta-analysis
13
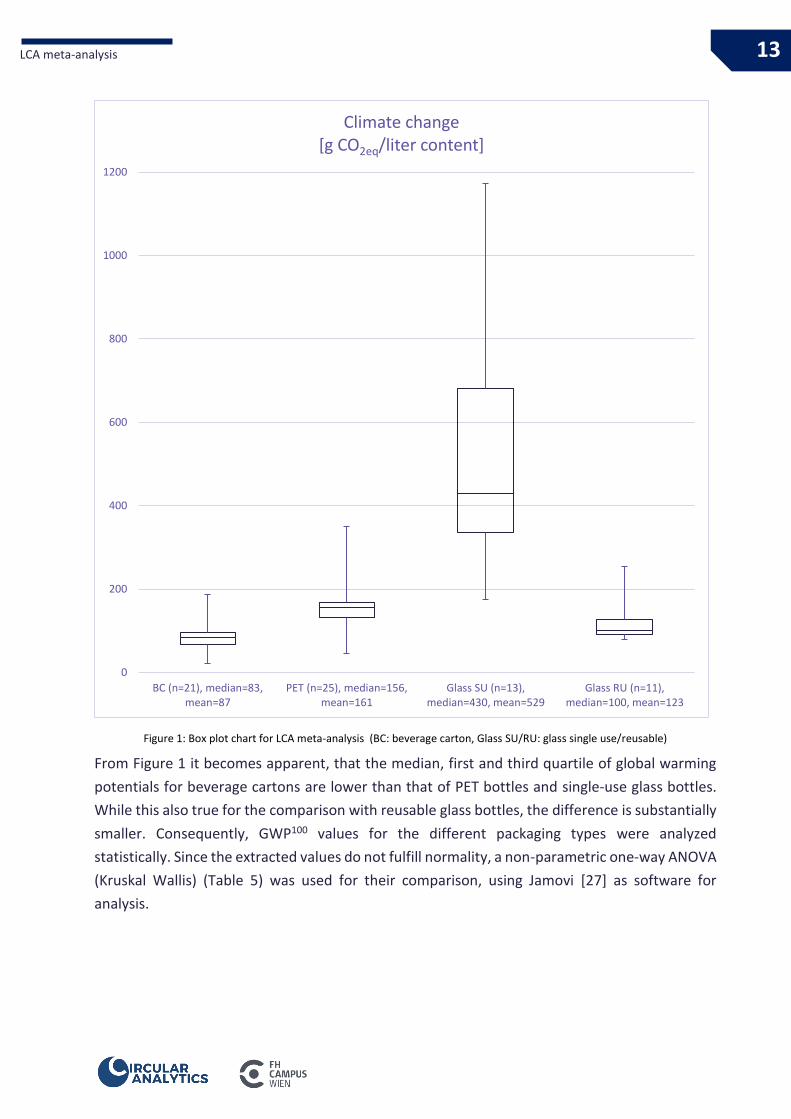
Figure 1: Box plot chart for LCA meta-analysis (BC: beverage carton, Glass SU/RU: glass single use/reusable)
From Figure 1 it becomes apparent, that the median, first and third quartile of global warming
potentials for beverage cartons are lower than that of PET bottles and single-use glass bottles.
While this also true for the comparison with reusable glass bottles, the difference is substantially
smaller. Consequently, GWP100 values for the different packaging types were analyzed
statistically. Since the extracted values do not fulfill normality, a non-parametric one-way ANOVA
(Kruskal Wallis) (Table 5) was used for their comparison, using Jamovi [27] as software for
analysis.
0
200
400
600
800
1000
1200
BC (n=21), median=83,mean=87
PET (n=25), median=156,mean=161
Glass SU (n=13),median=430, mean=529
Glass RU (n=11),median=100, mean=123
Climate change [g CO2eq/liter content]

LCA meta-analysis
14
Table 5: Results of Kruskal-Wallis test for LCA meta-analysis
Kruskal-Wallis
χ² df p ε²
GWP100 44.1 3 < .001 0.639
As post hoc test, Dwass-Steel-Critchlow-Fligner pairwise comparisons were conducted (Table 6):
Table 6: Results of DSCF pairwise comparison of GWP100 values
Pairwise comparisons - GWP100_median
W p
BC PET PET 6.13 < .001
BC GLASS_SU GLASS_SU 6.79 < .001
BC GLASS_RU GLASS_RU 3.23 0.102
PET GLASS_SU GLASS_SU 6.68 < .001
PET GLASS_RU GLASS_RU -3.42 0.073
GLASS_SU GLASS_RU GLASS_RU -5.69 < .001
From the statistical analysis (Table 6), similar conclusions to that from Figure 1 can be derived,
namely that beverage cartons have, on average, a statistically significant lower GWP100 than that
of PET bottles (median: -47%) and single-use glass bottles (median: -80%). While both mean and
median of beverage cartons are lower than that of reusable glass bottles, the difference is not
statistically significant (p=0.102), mostly resulting from the small sample size of reusable glass
bottles GWP100 values.
It should be noted that the outcome of LCA studies is highly susceptible to several parameters,
depending on the products or the scope itself (time and geographic scope, transport distances,
End-of-Life scenarios, and many more) or the personal choice of the LCA practitioner
(methodology, assumptions, and many more). Hence, while the above-mentioned results allow
the interpretation that ‘on average, the global warming potential is lower than that of single-use
PET bottles and single-use glass bottles’, this does not automatically translate to being true in
every single case. Hence, the analysis was extended with an analysis of comparative LCA studies
of beverage packaging.
Analysis of comparative LCA studies
15
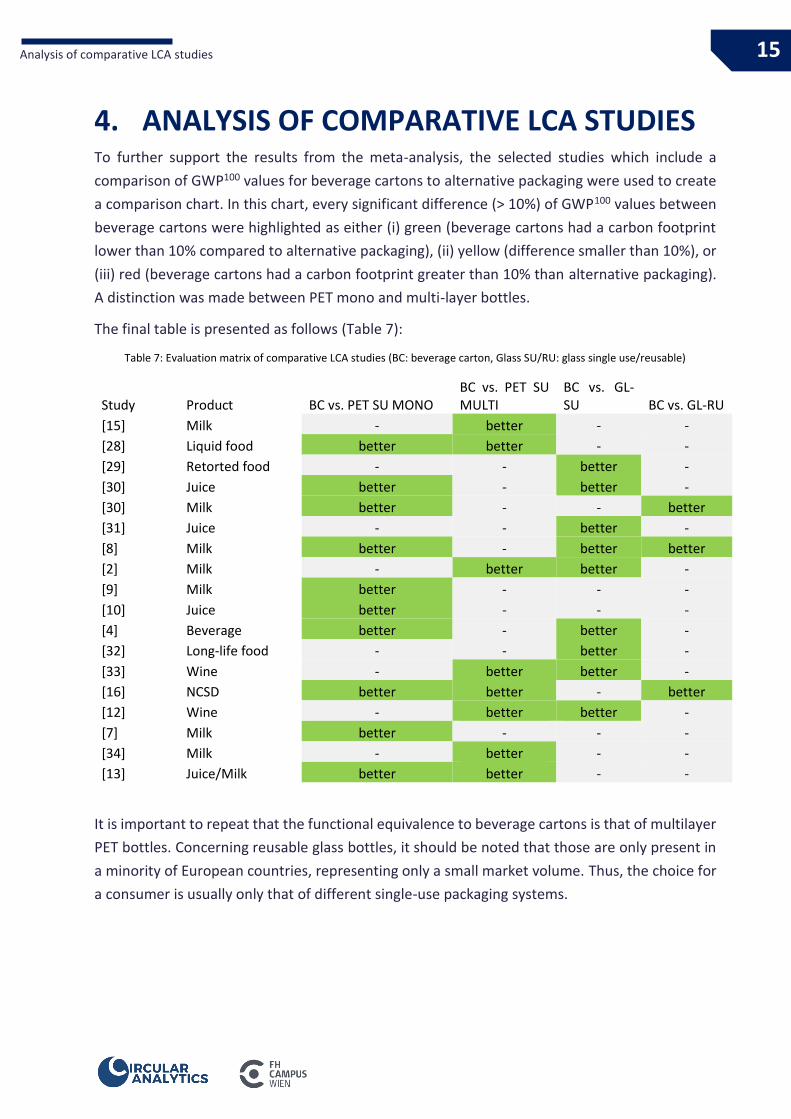
4. ANALYSIS OF COMPARATIVE LCA STUDIES To further support the results from the meta-analysis, the selected studies which include a
comparison of GWP100 values for beverage cartons to alternative packaging were used to create
a comparison chart. In this chart, every significant difference (> 10%) of GWP100 values between
beverage cartons were highlighted as either (i) green (beverage cartons had a carbon footprint
lower than 10% compared to alternative packaging), (ii) yellow (difference smaller than 10%), or
(iii) red (beverage cartons had a carbon footprint greater than 10% than alternative packaging).
A distinction was made between PET mono and multi-layer bottles.
The final table is presented as follows (Table 7):
Table 7: Evaluation matrix of comparative LCA studies (BC: beverage carton, Glass SU/RU: glass single use/reusable)
Study Product BC vs. PET SU MONO BC vs. PET SU MULTI
BC vs. GL-SU BC vs. GL-RU
[15] Milk - better - -
[28] Liquid food better better - -
[29] Retorted food - - better -
[30] Juice better - better -
[30] Milk better - - better
[31] Juice - - better -
[8] Milk better - better better
[2] Milk - better better -
[9] Milk better - - -
[10] Juice better - - -
[4] Beverage better - better -
[32] Long-life food - - better -
[33] Wine - better better -
[16] NCSD better better - better
[12] Wine - better better -
[7] Milk better - - -
[34] Milk - better - -
[13] Juice/Milk better better - -
It is important to repeat that the functional equivalence to beverage cartons is that of multilayer
PET bottles. Concerning reusable glass bottles, it should be noted that those are only present in
a minority of European countries, representing only a small market volume. Thus, the choice for
a consumer is usually only that of different single-use packaging systems.

Further environmental benefits of beverage cartons
16
5. FURTHER ENVIRONMENTAL BENEFITS OF BEVERAGE CARTONS
To better understand, why the beverage cartons has a superior environmental performance
compared to alt packaging, the following criteria can be identified.
5.1. Packaging efficiency
One of the key reasons for the low carbon footprint of the beverage carton is its high packaging
efficiency, meaning that only low quantities of packaging material are required for packing a
product. An evaluation of the amount of packaging material was To compare the packaging
efficiency between the types of packaging under study, a meta-analysis similar to the LCA meta-
analysis (section 3, p.8) was conducted. For this, packaging mass of 1-liter packaging listed in
studies in Table 1 to Table 4 were extracted.
To increase the sample size, product catalogues from glass [35,36] and PET preform/bottle
manufacturers [37–42] were used. The total mass of primary packaging per liter beverage
includes the mass of the base material, as well as that of (ii) closures, sleeves, labels, and other
packaging aids. Since the product catalogues for PET and glass bottles only gave information on
the mass of the base material, these values were complemented with the average mass of caps
and aids (median) calculated from those studies that indicated those separately.
The results are depicted as a boxplot chart in Figure 2:

Further environmental benefits of beverage cartons
17
Figure 2: Boxplot chart of packaging mass per liter beverage (BC: beverage carton, Glass SU/RU: glass single use/reusable)
0
100
200
300
400
500
600
700
800
BC (n=18), median=31,mean=32, SD=3.6
PET (n=40), median=36,mean=36, SD=6.4
Glass SU (n=69),median=466, mean=485,
SD=82.3
Glass RU (n=26),median=562, mean=555,
SD=80.379.5
Mass of primary packaging per liter [gram]

Further environmental benefits of beverage cartons
18
It is obvious from Figure 2 that beverage cartons and PET bottles have a substantially greater
packaging efficiency than glass bottles. The average (median) packaging mass of beverage
cartons with a size of 1 liter is 31 g, compared to 36 g for PET bottles, 466 g for single-use and
562 g for reusable glass bottles. To further analyze the comparison, particularly between
beverage cartons and PET bottles, the results were statistically analyzed. Since the extracted
values do not fulfill normality, a non-parametric one-way ANOVA (Kruskal Wallis) was used (Table
8):
Table 8: Kruskal-Wallis test for packaging efficiency results
Kruskal-Wallis
χ² df p
Mass 114 3 < .001
As post hoc test, Dwass-Steel-Critchlow-Fligner pairwise comparisons were conducted (Table 9):
Table 9: DSCF pairwise comparisons for packaging efficiency results
Pairwise comparisons - Mass
W p
BC PET 3.45 0.07
BC GLASS_SU 9.2 < .001
BC GLASS_RU 7.96 < .001
PET GLASS_SU 12.27 < .001
PET GLASS_RU 9.76 < .001
GLASS_SU GLASS_RU 5.04 0.002
As expected from Figure 2, the difference between all types of packaging is significant (p<0.05)
except between beverage cartons and PET bottles (p=0.07).
A low packaging to product mass ratio is not only good itself is one of the key reasons for the
environmental performance, not only leading to a reduced use of resources but only a lower
transport intensity (see section 5.2).
Further environmental benefits of beverage cartons
19
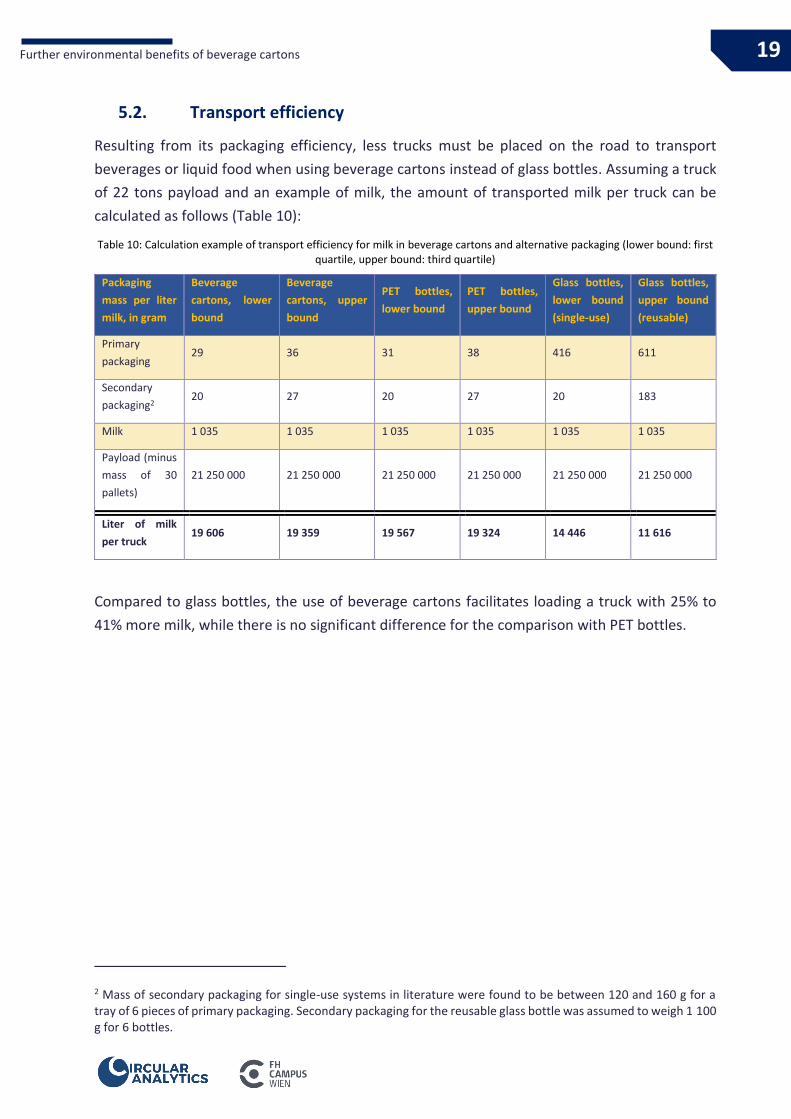
5.2. Transport efficiency
Resulting from its packaging efficiency, less trucks must be placed on the road to transport
beverages or liquid food when using beverage cartons instead of glass bottles. Assuming a truck
of 22 tons payload and an example of milk, the amount of transported milk per truck can be
calculated as follows (Table 10):
Table 10: Calculation example of transport efficiency for milk in beverage cartons and alternative packaging (lower bound: first quartile, upper bound: third quartile)
Packaging
mass per liter
milk, in gram
Beverage
cartons, lower
bound
Beverage
cartons, upper
bound
PET bottles,
lower bound
PET bottles,
upper bound
Glass bottles,
lower bound
(single-use)
Glass bottles,
upper bound
(reusable)
Primary
packaging 29 36 31 38 416 611
Secondary
packaging2 20 27 20 27 20 183
Milk 1 035 1 035 1 035 1 035 1 035 1 035
Payload (minus
mass of 30
pallets)
21 250 000 21 250 000 21 250 000 21 250 000 21 250 000 21 250 000
Liter of milk
per truck 19 606 19 359 19 567 19 324 14 446 11 616
Compared to glass bottles, the use of beverage cartons facilitates loading a truck with 25% to
41% more milk, while there is no significant difference for the comparison with PET bottles.
2 Mass of secondary packaging for single-use systems in literature were found to be between 120 and 160 g for a tray of 6 pieces of primary packaging. Secondary packaging for the reusable glass bottle was assumed to weigh 1 100 g for 6 bottles.
Further environmental benefits of beverage cartons
20
5.3. Reduced plastic consumption
An increasing number of EU member states, as well as retailers, set goals for the reduction of
plastic packaging. This led to the fact that the amount of plastic in packaging is now a key
performance indicator in several countries and sectors. While e.g. PET bottles are comprised of
100% plastic, beverage cartons are mainly made from wood fibers, requiring only a plastic liner.
In most cases, beverage cartons use a plastic cap in addition. However, the plastic liner as well as
the cap can be produced from bio-based raw materials such as sugarcane or tall oil. Thus,
beverage cartons have a high share of renewable material already and can be manufactured with
materials of 100% biogenic origin.
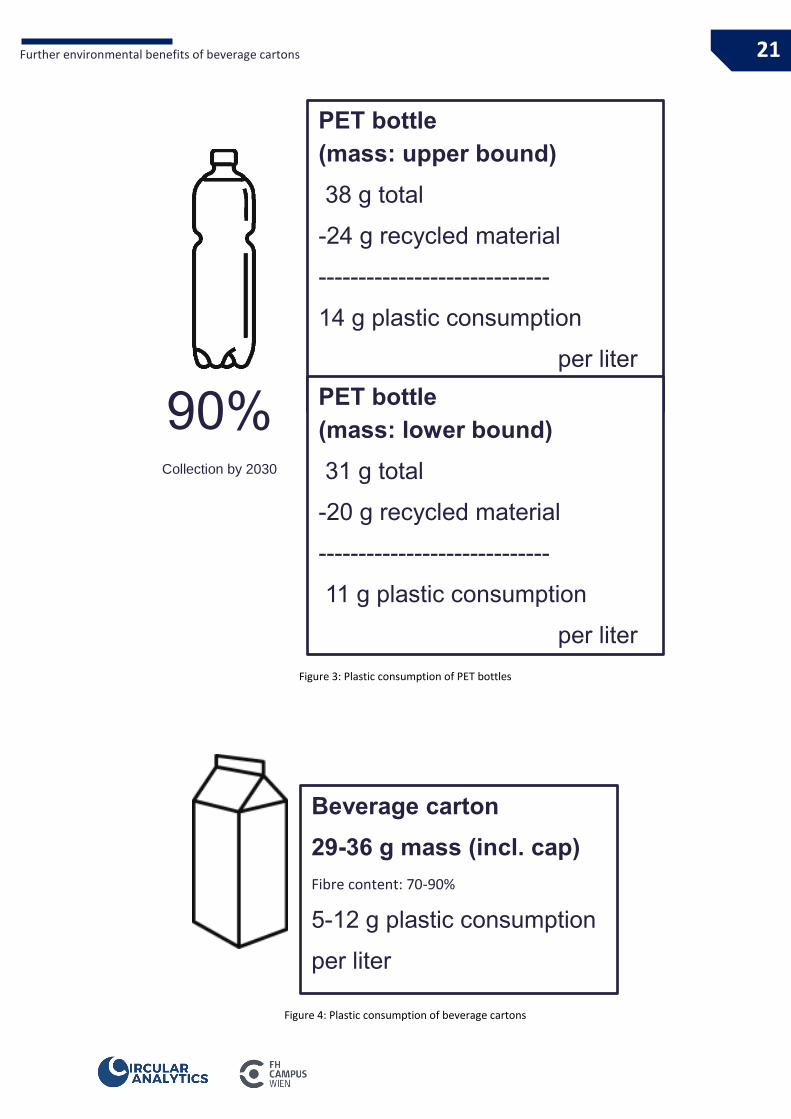
The Single Use Plastics Directive by the European Union set the mandatory goal that PET bottles
must meet a 90% collection rate by 2029 in every member state. If more bottle are recycled, then
the increased volume of recycled materials could help reduce the production of new plastic,
which could lead to a reduced plastic consumption overall. While it is not yet clear if the 90%
collection rate can be met, it is important to consider that even if 90% of all PET bottles will
eventually be collected, this would not automatically result in the production of 90% recycled
materials. According to a report by Deloitte [43], the assumption of a 90% pre-treatment and a
78% recycling efficiency by 2030 is plausible, leading to a recycling output rate of 63% for a 90%
collection rate. Depending on the mass of a PET bottle, this will result in a plastic consumption of
11 to 14 g per liter (Figure 3)3, more than beverage cartons which require between 5 and
(maximum) 12 g of plastic per liter (Figure 4).
3 Not considering a reduction of the average mass of a PET bottle by 2030
Further environmental benefits of beverage cartons
21
Figure 3: Plastic consumption of PET bottles
Figure 4: Plastic consumption of beverage cartons
90%
Collection by 2030
PET bottle
(mass: upper bound)
38 g total
-24 g recycled material
-----------------------------
14 g plastic consumption
per liter
PET bottle
(mass: lower bound)
31 g total
-20 g recycled material
-----------------------------
11 g plastic consumption
per liter
Beverage carton
29-36 g mass (incl. cap)
Fibre content: 70-90%
5-12 g plastic consumption
per liter

Further environmental benefits of beverage cartons
22
5.4. Use of biogenic resources
A typical beverage carton consists of liquid packaging board (LPB), polyethylene, and in the case
of aseptic packaging, of aluminum. Fibers for LPB are sourced from wood from sustainably
managed forests, ensuring sustained yields. Moreover, production of LPB uses pulpwood, which
is mainly gained from thinning of forests during growth period and partly by-products (chips)
from sawmills, which is supporting cascading use of wood. Yet, countries were wood products
for LPB are procured from see a growth of wood mass year after year. As a result, the storage of
carbon increases. Yet, in the majority of LCA studies on beverage cartons, an allocation of forest
land use or wood mass (meaning attributing only a share of the total land use) is omitted.
Yet, to better understand the theoretical magnitude of the use of biotic resources for beverage
cartons, official data on wood extraction and growth from FAOSTAT were combined with
(estimated) market data on beverage cartons and their recycling rate.
With the estimate of 1 million tons of beverage cartons placed on the EU-28 market (no change
of production volume over the years was known) and an average fiber content of 70%, 700 000
tons of fibers are used every year for this type of packaging. Using the value provided in Ecoinvent
of 2.85 kg wood per kg liquid packaging board4, this results in approx. 2 million tons of wood
which are required for its production. However, it should be emphasized again that this approach
heavily and arguably unfairly disadvantages beverage cartons, since LPB is made only from by-
products of the production of sawn timber (such as sawmill chips and wood from thinning the
forests).
Finally, 49% of all beverage cartons are sent to recycling plants, where around 275 000 tons of
fibers are recovered and placed on the market again.
Using the share concerning the countries of origin for wood provided by the suppliers of LPB, the
following chart (Figure 5) was derived:
4 This value seems too high and implausible; however, no other value could be found according to one supplier. Average densities of 650 kg/m³ for hard wood and 450 kg/m³ for soft wood were used for converting wood given in volume to wood mass. Carbon content of wood was assumed to be 50% for the conversion of carbon stock to wood mass.

Further environmental benefits of beverage cartons
23
Figure 5: Extraction and growth of wood in forests of selected countries. Comparison of extracted wood, extracted wood for the pulp and paper industry, the theoretical wood consumption of beverage cartons and the surplus of wood each year after
extraction
Compared to the total wood mass standing, the theoretical wood use for beverage cartons is
0.017%. Substantially more wood grows back each year than is theoretically required for liquid
packaging board, amounting to 4.3% (or 3.0% considering the recycling of beverage cartons)
compared to the wood mass which is put on top of the standing wood mass.
0
10
20
30
40
50
60
70
80
90
1999 2000 2001 2002 2003 2004 2005 2006 2007 2008 2009 2010 2011 2012 2013 2014 2015 2016 2017 2018
Values given in million metric tons of woodYearly wood increase Extracted wood, other than pulpwood
Pulpwood extraction Theoretical wood use of beverage cartons
Conclusion
24
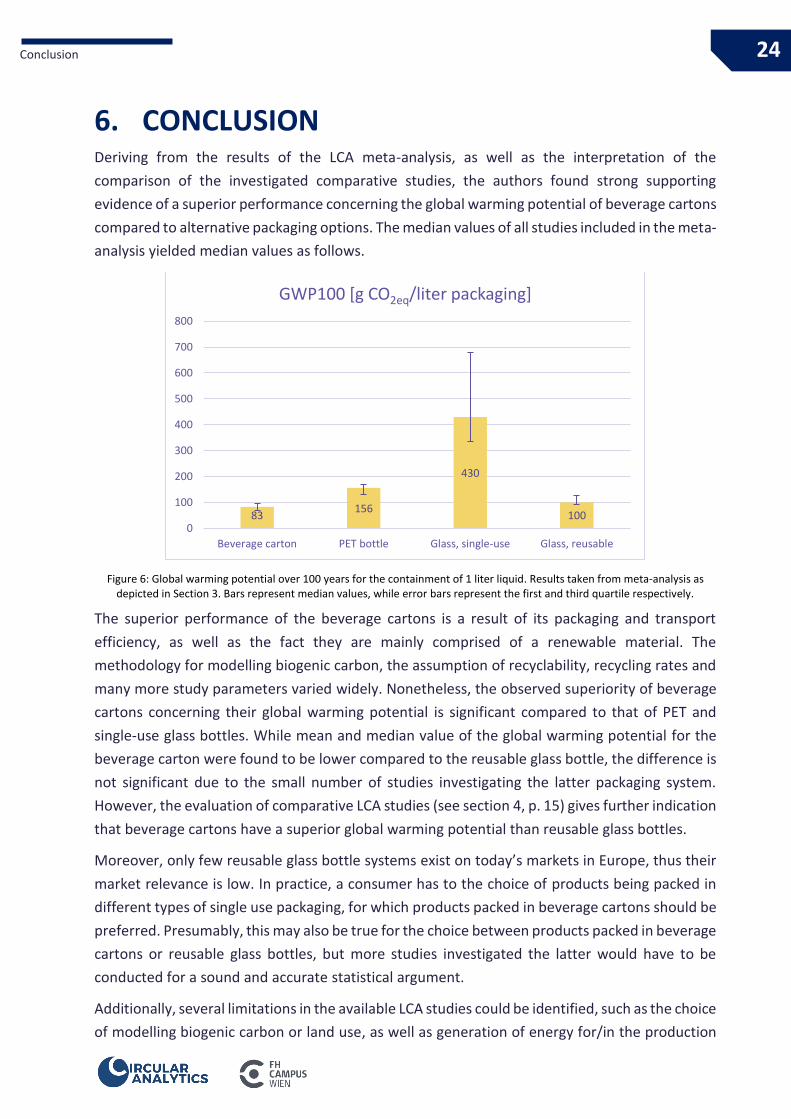
6. CONCLUSION Deriving from the results of the LCA meta-analysis, as well as the interpretation of the
comparison of the investigated comparative studies, the authors found strong supporting
evidence of a superior performance concerning the global warming potential of beverage cartons
compared to alternative packaging options. The median values of all studies included in the meta-
analysis yielded median values as follows.
Figure 6: Global warming potential over 100 years for the containment of 1 liter liquid. Results taken from meta-analysis as depicted in Section 3. Bars represent median values, while error bars represent the first and third quartile respectively.
The superior performance of the beverage cartons is a result of its packaging and transport
efficiency, as well as the fact they are mainly comprised of a renewable material. The
methodology for modelling biogenic carbon, the assumption of recyclability, recycling rates and
many more study parameters varied widely. Nonetheless, the observed superiority of beverage
cartons concerning their global warming potential is significant compared to that of PET and
single-use glass bottles. While mean and median value of the global warming potential for the
beverage carton were found to be lower compared to the reusable glass bottle, the difference is
not significant due to the small number of studies investigating the latter packaging system.
However, the evaluation of comparative LCA studies (see section 4, p. 15) gives further indication
that beverage cartons have a superior global warming potential than reusable glass bottles.
Moreover, only few reusable glass bottle systems exist on today’s markets in Europe, thus their
market relevance is low. In practice, a consumer has to the choice of products being packed in
different types of single use packaging, for which products packed in beverage cartons should be
preferred. Presumably, this may also be true for the choice between products packed in beverage
cartons or reusable glass bottles, but more studies investigated the latter would have to be
conducted for a sound and accurate statistical argument.
Additionally, several limitations in the available LCA studies could be identified, such as the choice
of modelling biogenic carbon or land use, as well as generation of energy for/in the production
83156
430
1000
100
200
300
400
500
600
700
800
Beverage carton PET bottle Glass, single-use Glass, reusable
GWP100 [g CO2eq/liter packaging]
Conclusion
25
of LPB. Concerning recommendations for future LCA studies of beverage cartons, more focus
should be put on the correct modelling of biogenic carbon and forest occupation. Further, the
high share of biogenic resources should be considered when modelling the energy consumption
of LPB production. Finally, the global warming potential of beverage cartons would improve even
further if the sourcing of wood, from either forest management practices (such as thinning) or
by-products from the timber production, were reflected more accurately in a broader range of
studies.

Conclusion
26
REFERENCES 1. Mourad, A. L., Garcia, E. E., Vilela, G. B. & Zuben, F. von. Influence of recycling rate increase
of aseptic carton for long-life milk on GWP reduction. Resources, Conservation and Recycling
52, 678–689 (2008).
2. Wohner, B., Schwarzinger, N., Gürlich, U., Heinrich, V. & Tacker, M. Technical emptiability of
dairy product packaging and its environmental implications in Austria. PeerJ 7, e7578 (2019).
3. Yokokawa, N., Kikuchi-Uehara, E., Amasawa, E., Sugiyama, H. & Hirao, M. Environmental
analysis of packaging-derived changes in food production and consumer behavior. Journal of
Industrial Ecology 23, 1253–1263 (2019).
4. Simon, B., Amor, M. B. & Földényi, R. Life cycle impact assessment of beverage packaging
systems: focus on the collection of post-consumer bottles. Journal of Cleaner Production 112,
238–248 (2016).
5. Bertolini, M., Bottani, E., Vignali, G. & Volpi, A. Comparative Life Cycle Assessment of
Packaging Systems for Extended Shelf Life Milk. Packag. Technol. Sci. 29, 525–546 (2016).
6. Granarolo. Dichiarazione Ambientale di prodotto del LATTE UHT italiano a lunga
conservazione intero, parzialmente scremato e scremato. Available at
https://gryphon4.environdec.com/system/data/files/6/14022/S-P-
01042%20Latte%20UHT%20Granarolo%202017.pdf (2017).
7. c7-consult. Ökobilanz für Gebinde aus PET und anderen Materialien. Ökobilanz für Gebinde
aus PET und anderen Materialien. Available at
https://s9e5196b075b13277.jimcontent.com/download/version/1572694052/module/793
7994756/name/ALPLA%20LCA%20Packaging%20Report%20%26%20Review%20%281.2%29
.pdf (2019).
8. Wohner, B. & Tacker, M. Vergleichende LCA Milchverpackungen (2019).
9. Meyhoff Frey, J., Hartlin, B., Wallen, E. & Aumonier, S. Life cycle assessment of example
packaging systems for milk. Available at
https://www.wrap.org.uk/sites/files/wrap/Final%20Report%20Retail%202010.pdf (2010).
10. Sapienza, S. & Spray, A. Comparative Life Cycle Assessment of an Elopak Comparative Life
Cycle Assessment of an Elopak aseptic juice carton and alternative PET bottle (2016).
11. Sapienza, S. & Spray, A. Comparative Life Cycle Assessment of an Elopak juice carton and
alternative PET bottle (2016).
12. BIO Intelligence Service. Nordic Life Cycle Assessment Wine Package Study. Final report - ISO
Compliant (2010).
13. Kauertz, B. et al. FKN Ökobilanz 2018 mit Erratum. Ökobilanzieller Vergleich von
Getränkeverbundkartons mit PET-Einweg- und Glas-Mehrwegflaschen in den
Getränkesegmenten Saft/ Nektar, H-Milch und Frischmilch (2019).
14. Wellenreuther, F., von Falkenstein, E. & Detzel, A. Comparative Life Cycle Assessment of
beverage cartons combiblocSlimline and combiblocSlimline EcoPlus for UHT milk. Final report
(2012).

Conclusion
27
15. Markwardt, S. & Wellenreuther, F. Comparative Life Cycle Assessment of packaging systems
for UHT milk on the European market. Final report (2012).
16. von Falkenstein, E., Wellenreuther, F. & Markwardt, S. Comparative life cycle assessment of
packaging systems for non-carbonated soft drinks (2010).
17. Wirtschaftskammer Österreich. Umsetzungsbericht 2020. Nachhaltigkeitsagenda für
Getränkeverpackungen. Available at
https://www.wko.at/service/netzwerke/umsetzungsbericht-nachhaltigkeitsagenda-
2019.pdf (2020).
18. Kang, D., Auras, R. & Singh, J. Life cycle assessment of non-alcoholic single-serve polyethylene
terephthalate beverage bottles in the state of California. Resources, Conservation and
Recycling 116, 45–52 (2017).
19. Saleh, Y. Comparative life cycle assessment of beverages packages in Palestine. Journal of
Cleaner Production 131, 28–42 (2016).
20. Manfredi, M. & Vignali, G. Comparative Life Cycle Assessment of hot filling and aseptic
packaging systems used for beverages. Journal of Food Engineering 147, 39–48 (2015).
21. Stefanini, R., Borghesi, G., Ronzano, A. & Vignali, G. Plastic or glass: a new environmental
assessment with a marine litter indicator for the comparison of pasteurized milk bottles. Int
J Life Cycle Assess; 10.1007/s11367-020-01804-x (2020).
22. Amienyo, D., Gujba, H., Stichnothe, H. & Azapagic, A. Life cycle environmental impacts of
carbonated soft drinks. Int J Life Cycle Assess 18, 77–92 (2013).
23. Wohner, B. & Tacker, M. Vergleichende Ökobilanz von Verpackungen für Mineralwasser
(Vöslauer) (2020).
24. Cerelia. DICHIARAZIONE AMBIENTALE DI PRODOTTO DELL’ACQUA MINERALE NATURALE
CERELIA IMBOTTIGLIATA IN PET 0,5L, PET 1,5L, VETRO A PERDERE 1L. Available at
https://gryphon4.environdec.com/system/data/files/6/16315/S-P-
00123%20Cerelia%20Mineral%20Water%20(Italian%20with%20English%20summary)%202
019%20-%20with%20Certiquality%20stamp.pdf (2019).
25. Ferrarelle. Environmental product declaration of Ferrarelle Mineral Water. Available at
https://gryphon4.environdec.com/system/data/files/6/17854/S-P-
00281%20EPD%20(English%20version)%202020.pdf (2019).
26. Leivas, R., Laso, J., Abejón, R., Margallo, M. & Aldaco, R. Environmental assessment of food
and beverage under a NEXUS Water-Energy-Climate approach: Application to the spirit
drinks. The Science of the total environment 720, 137576 (2020).
27. The jamovi project. jamovi. Available at https://www.jamovi.org/ (2019).
28. Jelse, K., Eriksson, E. & Einarson, E. Life Cycle Assessment of consumer packaging for liquid
food. LCA of Tetra Pak and alternative packaging on the Nordic market. Available at
https://assets.tetrapak.com/static/documents/lca_nordics_final_report_2009-08-25.pdf
(2009).

Conclusion
28
29. Markwardt, S. & Wellenreuther, F. Key findings of LCA study on Tetra Recart. Comparative
Life Cycle Assessment of shelf stable canned food. Available at https://www.ifeu.de/wp-
content/uploads/LCA_Tetra-Recart_extended-summary_final_added_web.pdf (2017).
30. Dinkel, F. & Kägi, T. Studie «Ökobilanz Getränkeverpackungen». Available at
https://carbotech.ch/cms/wp-content/uploads/Carbotech-LCA-Getraenkeverpackung-
2014.pdf (2014).
31. Pasqualino, J., Meneses, M. & Castells, F. The carbon footprint and energy consumption of
beverage packaging selection and disposal. Journal of Food Engineering 103, 357–365 (2011).
32. Markwardt, S. & Wellenreuther, F. Comparative Life Cycle Assessment of sterilised food
packaging systems on the European market. Final report (2013).
33. Franklin Associates. Life cycle inventory of container systems for wine. Available at
https://assets.tetrapak.com/static/documents/sustainability/lci-winecontainers-2006.pdf
(2006).
34. Meneses, M., Pasqualino, J. & Castells, F. Environmental assessment of the milk life cycle:
the effect of packaging selection and the variability of milk production data. Journal of
environmental management 107, 76–83 (2012).
35. Wiegand-Glas Holding GmbH. Gläser und Flaschen | Produktkatalog Wiegand-Glas. Available
at https://www.wiegand-glas.de/de/glas-produkte (2020).
36. Vetropack. Vetropack Katalog. Available at
https://katalog.vetropack.com/catalogue/result/global/BE#ph=1&filter_sMatAtvZirkulation
sart=MEHRWEG&filter_sMatAtvFuellvoll=330-333&filter_sMatAtvFarbe=BR (2019).
37. I.F.A.P. SpA. Catalogo prodotti bottiglie. Available at http://www.ifap.it/it/bottiglie/ (2020).
38. Frapack Packaging. Frapack Packaging is suppliers of PET bottles. Available at
https://www.frapak.com/en/bottles/pet-bottles/ (2020).
39. E-proPLAST GmbH. Flaschen aus PET | E-proPLAST GmbH. Available at http://www.e-
proplast.eu/de/produkte/flaschen/.
40. Amcor. Amcor | Product search. Available at
https://www.amcor.com/products/search?category=Beverages&productType=Plastic%20B
ottles%20and%20Jars (2020).
41. Wiegand-Glas Holding GmbH. PET-Produkte | Produktkatalog von Wiegand-Glas. Available
at https://www.wiegand-glas.de/de/pet-produkte (2020).
42. ALPLA. 28mm 1881 | ALPLA Group. Available at https://www.alpla.com/de/node/515
(2020).
43. Hestin, M., Faninger, T. & Milios, L. Increased EU Plastics Recycling Targets: Environmental,
Economic and Social Impact Assessment. Final Report. Available at https://743c8380-22c6-
4457-9895-
11872f2a708a.filesusr.com/ugd/dda42a_0409d529fc624d1fb577f469bec3b430.pdf (2015).
44. Clune, S., Crossin, E. & Verghese, K. Systematic review of greenhouse gas emissions for
different fresh food categories. Journal of Cleaner Production 140, 766–783 (2017).

Annex – Communication media
29
ANNEX – COMMUNICATION MEDIA In the course of the project, sketches were produced to illustrate a possible communication to
interested parties. These sketches could be used as a basis for graphically and verbally refined
communication media, such as presentations, folders, or websites.
Products are linked to global warming
In the manufacturing process of a product, the emission of
greenhouse gas emissions is unavoidable. Resources are
consumed, fuels are burned.
Using a method such as life cycle assessment, the footprint left
on the planet by a product can be quantified.
Less carbon
The beverage carton has a lower global warming potential in comparison to every other single
use packaging. While they are similarly as good as reusable glass bottles, they save on average5:
5 Results of LCA meta-analysis
-47% -80%
Compared to PET bottles Compared to single-use glass bottles
Annex – Communication media
30
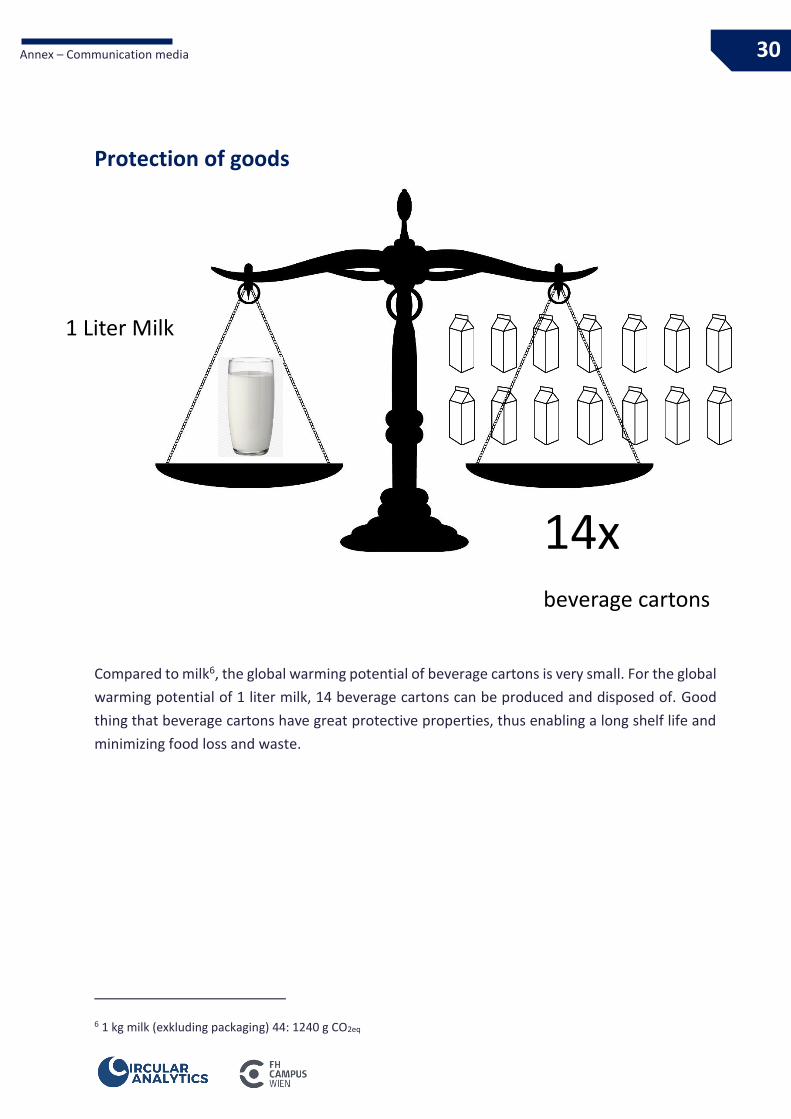
Protection of goods
Compared to milk6, the global warming potential of beverage cartons is very small. For the global
warming potential of 1 liter milk, 14 beverage cartons can be produced and disposed of. Good
thing that beverage cartons have great protective properties, thus enabling a long shelf life and
minimizing food loss and waste.
6 1 kg milk (exkluding packaging) 44: 1240 g CO2eq
1 Liter Milk
14x
beverage cartons

Annex – Communication media
31
4 REASONS FOR THE LOW GLOBAL WARMING
POTENTIAL OF BEVERAGE CARTONS
1. Packaging efficiency
The great environmental performance of beverage cartons has several reasons. For once, the
beverage carton is very efficient and requires only low amounts of packaging material.
Beverage carton PET bottles Glass bottles
GRAM PACKAGINGINCL. CLOSURE/LABELPER LITERBEVERAGE
29 – 36 g
416 - 611 g
31 – 38 g

Annex – Communication media
32
2. Plastic reduction
Beverage cartons are less dependent on plastic. Even if 90% of all PET bottles are collected
eventually, they will still consume more plastic compared to beverage cartons.
3. Transport efficiency
Resulting from its great packaging efficiency, more beverage can be loaded onto a truck using a
beverage carton, which in turn leads to a reduction of trucks on the road7.
7 Averages of upper and lower bounds
Heavy PET bottle
38 g total
-24 g recycled material
-----------------------------
14 g plastic consumption
Lightweight PET bottle
31 g total
-20 g recycled material
-----------------------------
11 g plastic consumption
Beverage carton
5-12 g plastic
consumption
19.500 liter milk per truck
using beverage cartons
13.000 liter milk per
truck using glass
bottles
90%
Collection
by 2030

Annex – Communication media
33
4. Renewability and circularity
The cardboard in beverage cartons is made from wood, a renewable resource which stores
removes carbon from the air. Furthermore, in a circular economy, focus should be put on the
cascading use of wood. This is already practice for beverage cartons since they only use residual
wood in their production.
This wood only comes for sustainably managed forests, meaning
that in the same period of time more wood grows back than has
been removed. Substantially more wood grows back each year
than is theoretically required for liquid packaging board,
amounting to 4.3% (or 3.0% considering the recycling of
beverage cartons) compared to a wood mass which is put on top
of the standing wood mass.
Compared to the total wood mass standing, the theoretical
wood consumption for beverage cartons is only a fraction.
0,02%
Wood forbeveragecartons
Wood insupplying
forests