surface and stratigraphic elemental analysis of an...
TRANSCRIPT

AnalyticalMethods
PAPER
Publ
ishe
d on
14
Sept
embe
r 20
16. D
ownl
oade
d on
14/
02/2
017
05:5
1:33
.
View Article OnlineView Journal | View Issue
Surface and strat
aNational Institute of Laser Enhanced Scienc
[email protected] of Archeology, Cairo University, Eg
Cite this: Anal. Methods, 2016, 8, 7096
Received 21st June 2016Accepted 22nd August 2016
DOI: 10.1039/c6ay01769j
www.rsc.org/methods
7096 | Anal. Methods, 2016, 8, 7096–7
igraphic elemental analysis of anancient Egyptian cartonnage using Laser-InducedBreakdown Spectroscopy (LIBS)
O. Aied Nassef,a Harby E. Ahmedb and M. A. Harith*a
An archeological Egyptian cartonnage dating back to the Greco-Roman period around the third century BC
was elementally analyzed via the sample-friendly technique, Laser-Induced Breakdown Spectroscopy
(LIBS). The unique characteristics of LIBS as being a simple and fast technique, has been exploited to
obtain surface elemental distribution and depth profiles for the investigated sample. An Nd:YAG laser
operating at the fundamental wavelength of 1064 nm has been used as the excitation source along with
an echelle spectrometer coupled to an ICCD detector for spectral dispersion and detection. Under the
experimental conditions, four distinct regions were studied as ten elements were analyzed for spatial
distribution along the surface and also for their depth profiles. Rapid and comprehensive visualization of
the investigated regions are provided. The most relevant elements i.e. carbon, calcium, silicon, oxygen
and iron suggest that the cartonnage was manufactured via the traditional method, mainly dependent on
natural pigments such as metal oxides and calcium carbonate (calcite) which is consistent with the
previous results of other conventional techniques used in the field of Archaeology. Supporting studies
obtained by both scanning electron microscopy with energy dispersive X-ray micro-analysis (SEM-EDX)
and X-ray diffraction (XRD) have been presented for comparison purposes.
1. Introduction
The perfection of the archaeological Egyptian arts and pigments isevidently proven by the fact that ancient Egyptian artifacts,manuscripts and cras made thousands of years ago are miracu-lously still clear and legible. Thus, studying the chemical compo-sition of ancient materials is oen among archaeologists' mainmeans of shedding light on all possible information that can begathered about such objects. Investigating the pigments in ancientEgyptian artifacts has been the interest of many researchers.1–6 Ithas been noted, for example, that the black pigment is mainlymade up of carbon which was obtained by mixing soot, vegetablegum and beeswax. This was frequently used as a homogeneouspaint layer or mixed with other pigments to produce darker tones.To make ink of different colors, they substituted soot with othertypes of materials such as ochre to make red ink.
The analysis of ancient Egyptian pigments is expected to giveinformation on the past technology and techniques adopted backthen and additionally assist in choosing the proper restoration/cleaningmethods. Many researchers were stimulated to study thesuitable methods of restoration of ancient Egyptian printedtextiles7 while others worked on the conservation of the ancientEgyptian manuscript “Bakai Book of the Dead” that was written
e (NILES), Cairo University, Egypt. E-mail:
ypt
106
in black ink.8 Moreover, the contribution of conventional spec-troscopic techniques such as X-ray uorescence (XRF)9 and X-raydiffraction (XRD) methods10 have been employed to provide thechemical compositions and crystal structures of ancient Egyptianmaterials, especially for characterization of pigments. Addition-ally, particle-induced X-ray emission (PIXE) implemented with anexternal microprobe has shown great ability to infer theelemental composition of ink as well as paper, papyrus andparchment.11 Thus, the investigated unique samples belonging tospecic heritage ages may be quite analyzed without visibledamage, however, such conventional techniques used to treat thehistoric objects may jeopardize them, Consequently, newapproaches of more advanced technology are required to providesafer, practical and more reliable analysis/diagnosis/cleaning/conservation techniques.12–17
Laser-Induced Breakdown Spectroscopy (LIBS) has beenapplied in the past decades as a promising technique foranalysis and characterization of the composition of a broadvariety of objects of cultural heritage including paintedartworks, icons, polychromes, pottery, sculpture, metal, glass,and stone artifacts. Its application on the elemental contentidentication and their spatial distribution for some examinedmaterial offers at appropriate spatial resolution a powerful toolin various research areas, where chemical imaging of surfacesand/or depth prole analysis, are required.18,19 LIBS hasnumerous advantages, especially being a sample-friendlyanalytical technique that implies minimal destruction of the
This journal is © The Royal Society of Chemistry 2016

Fig. 1 (a) The valley of the golden mummies located in Bawiti Qasr,the capital of Bahariya Oasis and (b) photograph of some fragments ofthe Egyptian cartonnage under investigation. (c) A close-up photo-graph showing four distinct investigated regions; assigned for spatialelemental distribution by the application of LIBS, SEM-EDX and XRD.
Paper Analytical Methods
Publ
ishe
d on
14
Sept
embe
r 20
16. D
ownl
oade
d on
14/
02/2
017
05:5
1:33
. View Article Online
sample due to the minimum ablated material (�nano gram ina typical LIBS experiment) which promotes its role for heritageexploration. Recently, its capability extended to map thecomposition of the investigated sample and obtain a spatialdistribution of a single chemical specie which eventuallyproduces information in one or two dimensions and/or inhigher dimensionality formats such as tomographic analysis.20
Besides performing elemental quantitative analyses, LIBS iscapable of obtaining molecular and structural characteristics ofthe sample using sophisticated statistical methods, spectraldatabases and chemometric processing of the LIBS spectra.21
Acknowledging that LIBS examination in the eld ofarchaeology faces a lot of challenges including the value of thearchaeological object, its size and its surface sensitivity in termsof thickness and coated pigmentation (whether stronglyadhering or not), complex spectra resulting from the presenceof individual or a mixture of pigments,., etc. The specic aimsof the present work are (i) to identify all the possible linesrepresenting the cartonnage characterizing the different inves-tigated regions (ii) to check/select sensitive analytical lines ofthe LIBS emission spectrum which are free of interference andoverlapping, (iii) to study the selected emission lines as a func-tion of the number of laser pulses providing a visualization ofboth surface and in-depth proles of the cartonnage, and (iv) toprovide supporting studies through SEM-EDX and XRD tech-niques for validation. The whole study is supposed to providespectroscopic analyses including rapid qualitative assessmentand imaging of both surface and depth proling of theelemental distribution present in this unique archeologicalEgyptian cartonnage.
2. Samples
In funerary events in ancient Egypt, masks or panels were usedto cover all or part of the mummied and wrapped body, the so-called cartonnage. It is used to form an inner coffin formummies or an envelope around the mummied body of thedeceased person before being placed inside a wooden coffin.The main periods in which the cartonnage was used in Egyptwere the Middle Kingdom (2025–1700 BC), Third IntermediatePeriod (1069–664 BC) and Ptolemaic and Early Roman Periods(330 BC–250 AD). Depending on the specic time period of theuse of cartonnage, distinct ingredients were used. It is generallycomposed of plastered layers of ber or papyrus, exibleenough to follow the irregular surfaces of the body. The plas-tered surface coated with gesso, gave an even ground forpainting motifs with various geometric designs, an assortmentof deities and inscriptions, which included verses from theBook of the Dead.
The investigated sample is part of cartonnage pieces thatwere found in the valley of the golden mummies (Fig. 1a)22
which is dated back to the Greco-Roman period around thethird century BC It was discovered in 1996 and is considered thelargest necropolis in Egypt discovered till the present day. Itincluded about 250 mummies of mostly aristocracy who lived inthe Bahariya Oasis during the Greco-Roman period. Based onthe visible distinct colored regions appearing on the surface of
This journal is © The Royal Society of Chemistry 2016
the cartonnage, we focused on each color to study both thespatial elemental distribution by the application of both LIBSand SEM-EDX and to study the constituent compoundscomprising the sample by the application of XRD. Fig. 1b displays images of some fragments of the Egyptian carton-nage showing an overall sample view, besides the investigatedselected face of one sample is shown in Fig. 1c, in which fourvisually distinct colored regions of interest are presented andlisted in Table 1.
Anal. Methods, 2016, 8, 7096–7106 | 7097

Table 1 The labeling of the ordered distinct regions considered in ourstudy which are subject to the analyses of LIBS, SEM-EDX and XRD
Region Region type
1 Reddish brown pigmentation2 Black pigmentation3 Yellowish pigmentation4 Linen
Analytical Methods Paper
Publ
ishe
d on
14
Sept
embe
r 20
16. D
ownl
oade
d on
14/
02/2
017
05:5
1:33
. View Article Online
These four mentioned regions will be subject to the presentinvestigation via LIBS, SEM-EDX and XRD.
3. Experiment and methodology
In applying the LIBS technique, a Q-switched Nd:YAG pulsedlaser (BRIO, Quantel, France), 5 ns FWHM, operating at thefundamental wavelength of 1064 nm was used as the excitationsource. A plano-convex fused silica lens with a 10 cm focallength is used to focus the laser beam onto the surface of thesample to a spot of �86 mm and produce the induced plasma.For the present experiment, the pulse energy was set to 75 mJand a repetition rate to 1 Hz which provide a laser uence of�1300 J cm�2. The samples were mounted on an X–Y trans-lational stage for controlling the irradiated position. Theemitted light from the laser-induced plasma is transferred toa 1.5 m optical ber (600 mm diameter) which is coupled to anechelle spectrometer (Mechelle 7500, Multichannel instru-ments, Sweden) provided with an ICCD camera, DiCAM-PRO(PCO computer optics, Germany) for the detection of theproduced plasma emission. The echelle spectrometer providesa constant spectral resolution of 7500 corresponding to 4 pixelsFWHM, over a wavelength range 200–1000 nm, displayable ina single spectrum. The overall linear dispersion of the Mechellespectrometer-camera system ranges from 0.0078 (at 200 nm) to0.032 nm per pixel (at 700 nm) with a high-resolution sensor of1280 � 1024 pixels (9 � 9 mm2). The obtained atomic emissionspectra are displayed on a PC where data analysis and pro-cessing are carried out using the commercial 2D- and 3D-Gram/32 soware programs (National Instruments, USA). Addition-ally, peak identication is performed using LIBS++ soware themain task of which is to compare the measured center wave-lengths and intensities to those of each element as listed ina large emission spectra database based on the National Insti-tute of Standards and Technology (NIST).23
The parameters affecting the diameter of the formed craterhave been carefully considered, thus, a proper choice of theapplied laser wavelength, beam divergence and focal length ofthe optical system was considered in order to minimize the spotdiameter of the focused laser beam. Additionally, the avail-ability of a laser source working in well-dened temporal andspatial modes (TEM00) enabled us to focus the laser to itsdiffraction limit with high precision to obtain the best lateralresolution. The lateral resolution was set to �100 mm as thecalculated waist of the crater was found to be �50 mm. Spectralacquisitions resulting in visually overlapped craters wereignored and repeated for accurate results.
7098 | Anal. Methods, 2016, 8, 7096–7106
Due to the rigorous nature of LIBS shot-to-shot signal vari-ation, the laser pulse energy was monitored and recorded,before running the experiment, using a joule meter (SCIEN-TECH, model AC5001, USA energy meter). High stability ofsuccessive laser pulses was ensured at a xed ash lamp voltageof 620 V. Additionally, the control of the detection system wasperformed using special multichannel soware and the CCDintensier high voltage was triggered optically at a typicaloptimized delay time of 1500 ns and a gate width of 2000 ns toavoid electronic interference and jitters. Moreover, to improvethe S/N ratio of the spectral intensity, line emission wasanalyzed either as it was measured under the specied experi-mental conditions (laser pulse energy, focusing geometry andgate parameters) minus the background intensity or normalizedwith respect to their total intensity which allows estimation ofthe relative abundance of the elements of interest.
Taking advantage of the inherent feature of laser-inducedplasma, its spatial localization,24 the LIBS capability to deter-mine compositional variations among different sample regionswas exploited. This was performed by analyzing the outputspectral data of line scans of sampling points covering enoughsurface and also digging deeper by successive laser pulses forinvestigating the depth proles. During each scan for eachinvestigated region of the cartonnage, we considered that themean signal represents the average concentration of a partic-ular element in the sample, while variations of the signal reectelemental distribution within the sample. Moreover, moni-toring the intensities of some elements at consecutive lasershots on the same sample position provides the depth prole atthis specic position. In our approach, two sets of data werecollected for each region; one set represents spectra acquired asthe focused laser beam irradiates fresh spots while the other setis obtained as the focused laser pulses successively hit the samespot. In other words, the application of a single laser pulse ona fresh spot, then three laser pulses on another fresh spot thenve, seven, ten, een and twenty laser pulses on fresh spotsresulted in the intensity change that corresponds to the rst setof data (regime 1). The second dataset is the application ofa single laser pulse on some position then three laser pulses onthe same position, ve, seven, ten, een and twenty laserpulses on the same position which leads to the sixty-one pulsesaccumulated in the same spot leading to a visibly deep crater(regime 2). In brief, the same series of laser pulses were appliedeither on fresh spots (regime 1) or on the same spot (regime 2).In both cases, the spectral analyses were based on the acquiredspectral data resulting from one laser pulse, three laser pulses,ve, seven, ten, een and twenty laser pulses which denitelyform different laser-produced craters as systematicallyincreased laser pulses dig deeper into the sample for bothmentioned regimes. As an example, the spectral data analyzedwhen seven consecutive laser pulses hit either a fresh spot(regime 1) or a previously produced crater (regime 2) constitutethe acquisition resulting from only such seven consecutivelaser pulses. The spatial distribution and depth characteriza-tion of the sample were performed by simultaneously moni-toring eight elements for each of the four distinct regionsshown in Fig. 1(c).
This journal is © The Royal Society of Chemistry 2016

Paper Analytical Methods
Publ
ishe
d on
14
Sept
embe
r 20
16. D
ownl
oade
d on
14/
02/2
017
05:5
1:33
. View Article Online
The investigated cartonnage was examined, imaged, andanalyzed via a scanning electron microscope (SEM) and anenergy dispersive X-ray (EDX) microanalysis unit (Model PhilipsQuanta FEG 250, Holland) along with an electron probe micro-analyzer with an accelerating voltage of 20 kV. The samples weremounted on a holder and were investigated directly without anysurface coating. The special design of the vacuum system allowsa working pressure up to approximately 60 Pa. SEM-EDX anal-yses were applied to the samples to examine the surfacemorphology, the samples' composition, and elements'concentration.
A complementary analytical technique, X-ray diffraction(XRD) which is well known for the analysis of pigments andminerals is applied for the analysis of the most probable exist-ing compounds in the sample. In applying this technique, wewere faced by a substantial difficulty that the sample needs to beground to form a powder. XRD analysis was carried out using anEmpyrean-PANanalytical X-ray diffractometer equipped witha variety of different sample holders including a rotating one.The X-ray source is comprised of a Cu radiation tube of wave-length 1.54 A at 45 kV, 40 mA, 0.004� sec�1 with a beta lternickel. Measurements were performed on both bulk andminute amounts of the powdered sample using a PIXcel 3Ddetector, in the range 0� < 2q < 100� with a step of 0.013�.
4. Results and discussion4.1 LIBS analysis
In laser-induced plasma, the spectral emission lines of anelement are ideally proportional to its concentration. However,this depends on the optical thickness of the plasma which iscommonly related to a complex interaction mechanism
Fig. 2 LIBS spectra when single laser pulse (low intensity) and five laseSome spectral emission lines of the most common elements are identifi
This journal is © The Royal Society of Chemistry 2016
between the laser, the ablated species and the emitted radia-tion, which could suffer immediate re-absorption by the coldabsorbing atoms in the periphery of the plasma. Thus, the laser-induced plasma can be optically thick for some particularwavelengths, especially the most intense lines (resonance lines)of elements present at concentrations greater than approxi-mately 0.1%.25 It can also become thick for less intense lines athigher elemental concentrations. This leads to lower intensitiesof the self-absorbed lines and hence incorrectly indicatesa lower concentration of the element. Consequently, the spec-tral emission lines were carefully chosen to be representative ofthe actual sample constituents. As an example, two calciumemission resonance lines Ca II 393.366 nm and Ca II396.847 nm that suffer self-absorption were avoided whenanalysis was performed. Fig. 2 shows an example of LIBS spectrafor Region (2) (black pigmentation), when single and ve laserpulses hit two fresh spots, respectively. The characteristicspectral emission lines are identied and listed in Table 2. Forthe four investigated regions, twelve spectral emission lineswere chosen to represent the rst eight elements, shown inTable 2. Such spatially distributed elements whether on thesurface or deep into the layers of the sample are examined andanalyzed to construct the elemental proles for the investigatedEgyptian cartonnage.
Under constant experimental conditions, the laser irradi-ance plays the main role that will affect both the averagedablation rate and depth resolution. The experiment was carriedout at xed parameters, namely the laser wavelength (1064 nm),laser pulse width (5 ns), and the experiment geometry. Thesynchronization of the laser pulses with the spectra acquisitionwas set automatically while the lateral sample positioning wasperformed manually considering that the distance travelled
r pulses (high intensity) are focused on region 2 (black pigmentation).ed.
Anal. Methods, 2016, 8, 7096–7106 | 7099
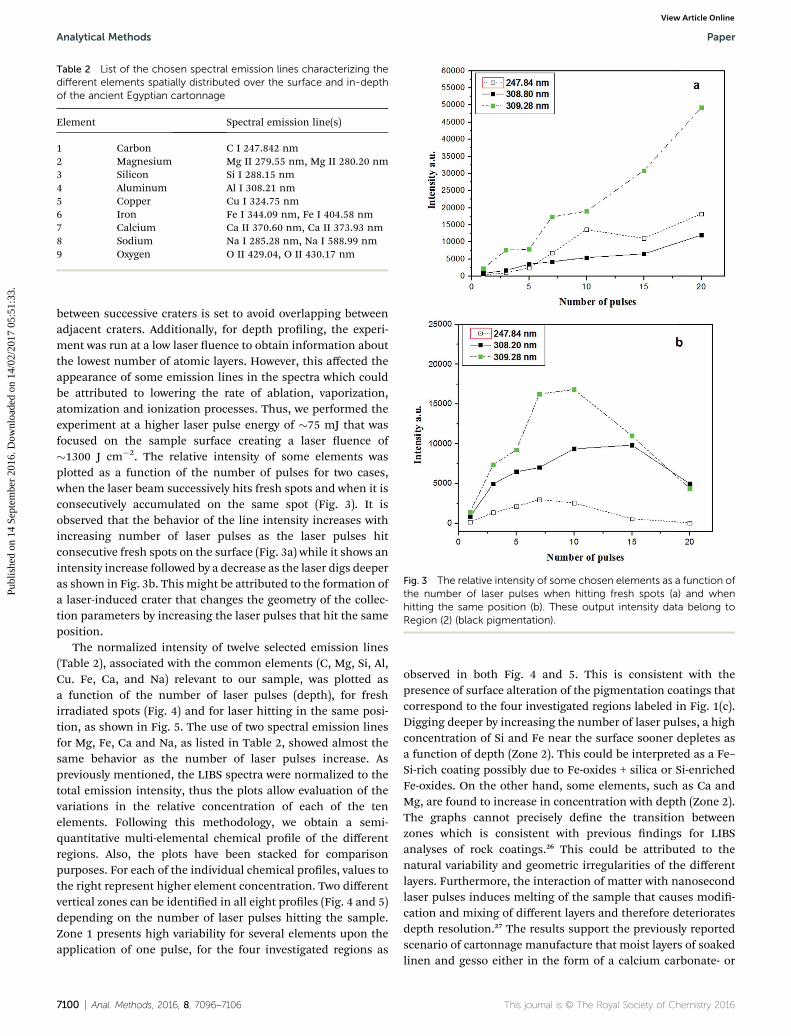
Fig. 3 The relative intensity of some chosen elements as a function ofthe number of laser pulses when hitting fresh spots (a) and whenhitting the same position (b). These output intensity data belong toRegion (2) (black pigmentation).
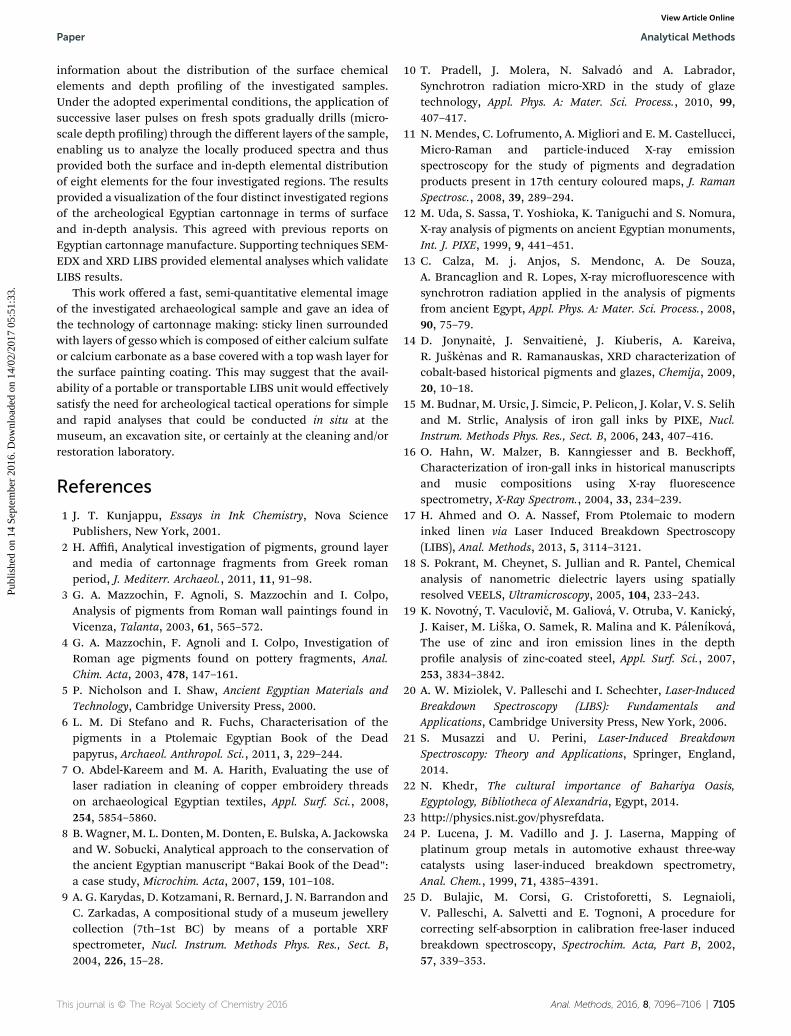
Table 2 List of the chosen spectral emission lines characterizing thedifferent elements spatially distributed over the surface and in-depthof the ancient Egyptian cartonnage
Element Spectral emission line(s)
1 Carbon C I 247.842 nm2 Magnesium Mg II 279.55 nm, Mg II 280.20 nm3 Silicon Si I 288.15 nm4 Aluminum Al I 308.21 nm5 Copper Cu I 324.75 nm6 Iron Fe I 344.09 nm, Fe I 404.58 nm7 Calcium Ca II 370.60 nm, Ca II 373.93 nm8 Sodium Na I 285.28 nm, Na I 588.99 nm9 Oxygen O II 429.04, O II 430.17 nm
Analytical Methods Paper
Publ
ishe
d on
14
Sept
embe
r 20
16. D
ownl
oade
d on
14/
02/2
017
05:5
1:33
. View Article Online
between successive craters is set to avoid overlapping betweenadjacent craters. Additionally, for depth proling, the experi-ment was run at a low laser uence to obtain information aboutthe lowest number of atomic layers. However, this affected theappearance of some emission lines in the spectra which couldbe attributed to lowering the rate of ablation, vaporization,atomization and ionization processes. Thus, we performed theexperiment at a higher laser pulse energy of �75 mJ that wasfocused on the sample surface creating a laser uence of�1300 J cm�2. The relative intensity of some elements wasplotted as a function of the number of pulses for two cases,when the laser beam successively hits fresh spots and when it isconsecutively accumulated on the same spot (Fig. 3). It isobserved that the behavior of the line intensity increases withincreasing number of laser pulses as the laser pulses hitconsecutive fresh spots on the surface (Fig. 3a) while it shows anintensity increase followed by a decrease as the laser digs deeperas shown in Fig. 3b. This might be attributed to the formation ofa laser-induced crater that changes the geometry of the collec-tion parameters by increasing the laser pulses that hit the sameposition.
The normalized intensity of twelve selected emission lines(Table 2), associated with the common elements (C, Mg, Si, Al,Cu. Fe, Ca, and Na) relevant to our sample, was plotted asa function of the number of laser pulses (depth), for freshirradiated spots (Fig. 4) and for laser hitting in the same posi-tion, as shown in Fig. 5. The use of two spectral emission linesfor Mg, Fe, Ca and Na, as listed in Table 2, showed almost thesame behavior as the number of laser pulses increase. Aspreviously mentioned, the LIBS spectra were normalized to thetotal emission intensity, thus the plots allow evaluation of thevariations in the relative concentration of each of the tenelements. Following this methodology, we obtain a semi-quantitative multi-elemental chemical prole of the differentregions. Also, the plots have been stacked for comparisonpurposes. For each of the individual chemical proles, values tothe right represent higher element concentration. Two differentvertical zones can be identied in all eight proles (Fig. 4 and 5)depending on the number of laser pulses hitting the sample.Zone 1 presents high variability for several elements upon theapplication of one pulse, for the four investigated regions as
7100 | Anal. Methods, 2016, 8, 7096–7106
observed in both Fig. 4 and 5. This is consistent with thepresence of surface alteration of the pigmentation coatings thatcorrespond to the four investigated regions labeled in Fig. 1(c).Digging deeper by increasing the number of laser pulses, a highconcentration of Si and Fe near the surface sooner depletes asa function of depth (Zone 2). This could be interpreted as a Fe–Si-rich coating possibly due to Fe-oxides + silica or Si-enrichedFe-oxides. On the other hand, some elements, such as Ca andMg, are found to increase in concentration with depth (Zone 2).The graphs cannot precisely dene the transition betweenzones which is consistent with previous ndings for LIBSanalyses of rock coatings.26 This could be attributed to thenatural variability and geometric irregularities of the differentlayers. Furthermore, the interaction of matter with nanosecondlaser pulses induces melting of the sample that causes modi-cation and mixing of different layers and therefore deterioratesdepth resolution.27 The results support the previously reportedscenario of cartonnage manufacture that moist layers of soakedlinen and gesso either in the form of a calcium carbonate- or
This journal is © The Royal Society of Chemistry 2016

Fig. 4 The normalized intensity of some elements as a function of depth for the four investigated regions; (a) Region (1), (b) Region (2), (c) Region(3) and (d) Region (4) under the application of laser pulses on fresh spots.
Paper Analytical Methods
Publ
ishe
d on
14
Sept
embe
r 20
16. D
ownl
oade
d on
14/
02/2
017
05:5
1:33
. View Article Online
calcium sulphate-base were moulded into the mummy's bodyand aer drying, the gessoed surface was smoothed (the washlayer) before application of paint or gold leaf. A further layer ofgesso was oen applied with a brush to the underside of thecasing to give it further strength and rigidity.28–31
4.2 Scanning electron microscope SEM-EDX
The Scanning Electron Microscope (SEM) images providea characteristic surface morphology and are useful for judgingthe surface structure of the investigated sample.32–34 A combi-nation of SEM (Model Philips Quanta FEG 250, Holland) and anelectron probe micro-analyzer with an accelerating voltage of20 kV, along with an EDX microanalysis unit, was used to revealboth morphological diagnostic features for each of the carton-nage investigated regions and the corresponding qualitativeand quantitative elemental analysis. Fig. 6 displays SEM imagesof the Egyptian cartonnage where reected e-beammicrographs
This journal is © The Royal Society of Chemistry 2016
of the different assigned regions previously mentioned provideboth a front view, shown in (a) and a cross-sectional view of thesample layers, shown in (b). SEM images showed that thesurface is extremely roughened, damaged, and cracked withsmall holes and slits. The cartonnage is clearly made of severallayers; the rst layer of very thin pigmentation of less than 3 mm(which includes the different colored regions under investiga-tion) followed by a yellowish layer of thickness �0.8 to 1 mm.The thickness of the textile part ranges from 1.5 mm to 2 mm.The textile structure includes two types of weaving; one isa plain 1/1 weave which is the simplest of all weaves and it hasone-over one-under interlacing yarns. The other type is yarnstwisted in circular turns.
Scanning electronmicrographs of the areas, listed in Table 1,subject to EDX mapping, are represented in Fig. 7(a, c and e),while their corresponding EDX spectra representing theelemental composition of each region is shown in (b, d and f).The concentration results are taken as the average of three
Anal. Methods, 2016, 8, 7096–7106 | 7101

Fig. 5 The normalized intensity of some elements as a function of depth for the four investigated regions: (a) Region (1), (b) Region (2), (c) Region(3) and (d) Region (4) under the application of laser pulses on the same position.
Analytical Methods Paper
Publ
ishe
d on
14
Sept
embe
r 20
16. D
ownl
oade
d on
14/
02/2
017
05:5
1:33
. View Article Online
different concentrations of three different spots on the sample.A close-up view of all regions demonstrated a high concentra-tion of carbon (C) that exists as a major element while the
Fig. 6 SEM images of the Egyptian cartonnage. (a) Reflected e-beamassigned regions previouslymentioned. (b) A side-view showing a cross-sof constructing a cartonnage belonging to this specified period.
7102 | Anal. Methods, 2016, 8, 7096–7106
elements Si, Al, Cl and Ca have also been found throughout thesample which might be the constituent of regular formation ofthe wash layer. Evidence of Fe and K were obtained in both
micrograph of the cartonnage showing a front view of the differentection of the sample layers which agrees with the conventional method
This journal is © The Royal Society of Chemistry 2016

Fig. 7 (a) Reflected e-beam micrographs (1000�) of the four investigated regions of the cartonnage (listed in Table 1) are displayed in (a, c, eand g). Their corresponding EDX spectra representing the main elemental peaks superimposed on the background for each of the investigatedregions are displayed in (b, d, f and h).
This journal is © The Royal Society of Chemistry 2016 Anal. Methods, 2016, 8, 7096–7106 | 7103
Paper Analytical Methods
Publ
ishe
d on
14
Sept
embe
r 20
16. D
ownl
oade
d on
14/
02/2
017
05:5
1:33
. View Article Online

Table 3 The output results of the energy dispersive X-ray (EDX) analytical technique for the elements' concentration for each of the investigatedregions of the Egyptian cartonnage
Elements
Region 1 (reddish-brown) Region 2 (black) Region 3 (yellow) Region 4 (linen)
Weight% Atomic% Weight% Atomic% Weight% Atomic% Weight% Atomic%
C 28.12 38.23 58.28 66.06 23.96 34.25 44.83 54.61O 50.36 51.39 38.15 32.46 48.15 51.67 44.38 40.58Na 1.08 0.77 — — — — 0.48 0.31Mg 0.63 0.42 — — 0.81 0.57 — —Al 1.49 0.9 0.58 0.29 2.54 1.62 0.98 0.53Si 2.41 1.4 0.74 0.36 4.73 2.89 2.89 1.51S 5.13 2.61 0.5 0.21 5.46 2.92 0.68 0.31Cl 0.35 0.16 0.3 0.11 2.81 1.36 1.16 0.48K 0.26 0.11 — — 0.73 0.32 — —Ca 8.99 3.66 1.44 0.49 8.92 3.82 4.61 1.68Fe 1.7 0.54 — — 1.88 0.85 — —
Analytical Methods Paper
Publ
ishe
d on
14
Sept
embe
r 20
16. D
ownl
oade
d on
14/
02/2
017
05:5
1:33
. View Article Online
Regions 1 (reddish brown) and 3 (yellow) as minor elements.The presence of oxygen suggests that most elements are presentas oxides. Alumina was known to be added as a stiffening agent
Fig. 8 The resultant XRD spectra with qualitative identification indi-cating the existence of calcite for the powdered minute fragments (a)and Cu–Fe–S compound as the major component for the surface ofthe bulk sample (b).
7104 | Anal. Methods, 2016, 8, 7096–7106
and to prevent pigmentation from running off the surface. Theelemental EDX output is listed in Table 3 referring to elements'concentration of each element detected in surface analysis ofthe four investigated regions.
4.3 X-ray diffraction (XRD) analysis
A supporting high-tech qualitative analytical technique, X-raydiffraction (XRD) is applied in the present work that mayprovide a clearer picture of the investigated sample'scompounds. The identication of thin paint layers or layerswith very low pigment content by XRD can be simply obtainedsince the technique relies on the dual wave/particle nature of X-rays that can conclude information about the structure ofcrystalline materials. XRD is basically based on the scatteringprocess of the incident X-rays with sample particles whichresults in the formation of a diffraction pattern. A noteworthydrawback of such a technique in terms of archeologicalpurposes is that the sample should be processed and preparedin the form of powder before being exposed to XRD. However,due to the rarity of the investigated sample and the dire need forits conservation, the XRD examination was performed followingtwo regimes; the analysis of only minute powdered fragmentsand the analysis of the surface of the bulk sample. The availableresulting spectra using the aforementioned experimentalconditions are presented in Fig. 8 where the peaks are assignedand identied using PANanalytical XRD analysis soware witha typical reference database. Qualitative identication ofpowdered minute fragments of the sample indicates the exis-tence of calcite (Fig. 8a) while the detected components corre-sponding to the surface of the bulk sample show that Cu–Fe–Srepresents the major surface compound (Fig. 8b).
5. Conclusions
In the present study, Egyptian cartonnage fragments, from theValley of the Golden Mummies excavation in the BahariyaOasis, dating back to the Greek Roman period have beencharacterized by LIBS. The capability of the technique ofspatially resolved analysis from discrete points with instanta-neous detection of the plasma emission offered immediate
This journal is © The Royal Society of Chemistry 2016
Paper Analytical Methods
Publ
ishe
d on
14
Sept
embe
r 20
16. D
ownl
oade
d on
14/
02/2
017
05:5
1:33
. View Article Online
information about the distribution of the surface chemicalelements and depth proling of the investigated samples.Under the adopted experimental conditions, the application ofsuccessive laser pulses on fresh spots gradually drills (micro-scale depth proling) through the different layers of the sample,enabling us to analyze the locally produced spectra and thusprovided both the surface and in-depth elemental distributionof eight elements for the four investigated regions. The resultsprovided a visualization of the four distinct investigated regionsof the archeological Egyptian cartonnage in terms of surfaceand in-depth analysis. This agreed with previous reports onEgyptian cartonnage manufacture. Supporting techniques SEM-EDX and XRD LIBS provided elemental analyses which validateLIBS results.
This work offered a fast, semi-quantitative elemental imageof the investigated archaeological sample and gave an idea ofthe technology of cartonnage making: sticky linen surroundedwith layers of gesso which is composed of either calcium sulfateor calcium carbonate as a base covered with a top wash layer forthe surface painting coating. This may suggest that the avail-ability of a portable or transportable LIBS unit would effectivelysatisfy the need for archeological tactical operations for simpleand rapid analyses that could be conducted in situ at themuseum, an excavation site, or certainly at the cleaning and/orrestoration laboratory.
References
1 J. T. Kunjappu, Essays in Ink Chemistry, Nova SciencePublishers, New York, 2001.
2 H. Affi, Analytical investigation of pigments, ground layerand media of cartonnage fragments from Greek romanperiod, J. Mediterr. Archaeol., 2011, 11, 91–98.
3 G. A. Mazzochin, F. Agnoli, S. Mazzochin and I. Colpo,Analysis of pigments from Roman wall paintings found inVicenza, Talanta, 2003, 61, 565–572.
4 G. A. Mazzochin, F. Agnoli and I. Colpo, Investigation ofRoman age pigments found on pottery fragments, Anal.Chim. Acta, 2003, 478, 147–161.
5 P. Nicholson and I. Shaw, Ancient Egyptian Materials andTechnology, Cambridge University Press, 2000.
6 L. M. Di Stefano and R. Fuchs, Characterisation of thepigments in a Ptolemaic Egyptian Book of the Deadpapyrus, Archaeol. Anthropol. Sci., 2011, 3, 229–244.
7 O. Abdel-Kareem and M. A. Harith, Evaluating the use oflaser radiation in cleaning of copper embroidery threadson archaeological Egyptian textiles, Appl. Surf. Sci., 2008,254, 5854–5860.
8 B. Wagner, M. L. Donten, M. Donten, E. Bulska, A. Jackowskaand W. Sobucki, Analytical approach to the conservation ofthe ancient Egyptian manuscript “Bakai Book of the Dead”:a case study, Microchim. Acta, 2007, 159, 101–108.
9 A. G. Karydas, D. Kotzamani, R. Bernard, J. N. Barrandon andC. Zarkadas, A compositional study of a museum jewellerycollection (7th–1st BC) by means of a portable XRFspectrometer, Nucl. Instrum. Methods Phys. Res., Sect. B,2004, 226, 15–28.
This journal is © The Royal Society of Chemistry 2016
10 T. Pradell, J. Molera, N. Salvado and A. Labrador,Synchrotron radiation micro-XRD in the study of glazetechnology, Appl. Phys. A: Mater. Sci. Process., 2010, 99,407–417.
11 N. Mendes, C. Lofrumento, A. Migliori and E. M. Castellucci,Micro-Raman and particle-induced X-ray emissionspectroscopy for the study of pigments and degradationproducts present in 17th century coloured maps, J. RamanSpectrosc., 2008, 39, 289–294.
12 M. Uda, S. Sassa, T. Yoshioka, K. Taniguchi and S. Nomura,X-ray analysis of pigments on ancient Egyptian monuments,Int. J. PIXE, 1999, 9, 441–451.
13 C. Calza, M. j. Anjos, S. Mendonc, A. De Souza,A. Brancaglion and R. Lopes, X-ray microuorescence withsynchrotron radiation applied in the analysis of pigmentsfrom ancient Egypt, Appl. Phys. A: Mater. Sci. Process., 2008,90, 75–79.
14 D. Jonynaite, J. Senvaitiene, J. Kiuberis, A. Kareiva,R. Juskenas and R. Ramanauskas, XRD characterization ofcobalt-based historical pigments and glazes, Chemija, 2009,20, 10–18.
15 M. Budnar, M. Ursic, J. Simcic, P. Pelicon, J. Kolar, V. S. Selihand M. Strlic, Analysis of iron gall inks by PIXE, Nucl.Instrum. Methods Phys. Res., Sect. B, 2006, 243, 407–416.
16 O. Hahn, W. Malzer, B. Kanngiesser and B. Beckhoff,Characterization of iron-gall inks in historical manuscriptsand music compositions using X-ray uorescencespectrometry, X-Ray Spectrom., 2004, 33, 234–239.
17 H. Ahmed and O. A. Nassef, From Ptolemaic to moderninked linen via Laser Induced Breakdown Spectroscopy(LIBS), Anal. Methods, 2013, 5, 3114–3121.
18 S. Pokrant, M. Cheynet, S. Jullian and R. Pantel, Chemicalanalysis of nanometric dielectric layers using spatiallyresolved VEELS, Ultramicroscopy, 2005, 104, 233–243.
19 K. Novotny, T. Vaculovic, M. Galiova, V. Otruba, V. Kanicky,J. Kaiser, M. Liska, O. Samek, R. Malina and K. Palenıkova,The use of zinc and iron emission lines in the depthprole analysis of zinc-coated steel, Appl. Surf. Sci., 2007,253, 3834–3842.
20 A. W. Miziolek, V. Palleschi and I. Schechter, Laser-InducedBreakdown Spectroscopy (LIBS): Fundamentals andApplications, Cambridge University Press, New York, 2006.
21 S. Musazzi and U. Perini, Laser-Induced BreakdownSpectroscopy: Theory and Applications, Springer, England,2014.
22 N. Khedr, The cultural importance of Bahariya Oasis,Egyptology, Bibliotheca of Alexandria, Egypt, 2014.
23 http://physics.nist.gov/physrefdata.24 P. Lucena, J. M. Vadillo and J. J. Laserna, Mapping of
platinum group metals in automotive exhaust three-waycatalysts using laser-induced breakdown spectrometry,Anal. Chem., 1999, 71, 4385–4391.
25 D. Bulajic, M. Corsi, G. Cristoforetti, S. Legnaioli,V. Palleschi, A. Salvetti and E. Tognoni, A procedure forcorrecting self-absorption in calibration free-laser inducedbreakdown spectroscopy, Spectrochim. Acta, Part B, 2002,57, 339–353.
Anal. Methods, 2016, 8, 7096–7106 | 7105

Analytical Methods Paper
Publ
ishe
d on
14
Sept
embe
r 20
16. D
ownl
oade
d on
14/
02/2
017
05:5
1:33
. View Article Online
26 N. L. Lanza, S. M. Clegg, R. C. Wiens, R. E. McInroy,H. E. Newsom and M. D. Deans, Examining natural rockvarnish and weathering rinds with laser-inducedbreakdown spectroscopy for application to ChemCam onMars, Appl. Opt., 2012, 51, B74–B82.
27 V. Margetic, M. Bolshov, A. Stockhaus, K. Niemax andR. Hergenroder, Depth proling of multi-layer samplesusing femtosecond laser ablation, JAAS, 2001, 16, 616–621.
28 J. Picton, S. Quirke and P. Roberts, Living Images: EgyptianFunerary Portraits in the Petrie Museum, Walnut Creek,California, 2007.
29 A. Figueiredo, Death and burial in roman Iberia:romanisation and cultural resistance in a world of diverse
7106 | Anal. Methods, 2016, 8, 7096–7106
beliefs and practices, O Arqueologo Portugues, Serie IV,2005, vol. 23, pp. 437–449.
30 H. A. M. A and M. A. Abd El Fatah, Analytical Study ofGround Painting Layers and Conservation Processes of anEgyptian Painted Coffin, J. Life Sci., 2011, 5, 661–669.
31 H. A. M. A, Analytical investigation of pigments, groundlayer and media of cartonnage fragments from Greekroman period, J. Mediterr. Archaeol., 2011, 11, 91–98.
32 G. Nicola, The examination and conservation of tow Indiantextile, Conservator, 1993, 17, 102–111.
33 C. Jane, AHRC Research Center for Textile Conservation andTextile Studies, First Annual Conference, UK, 2004.
34 A. G. Nord and K. Tronner, A note on the analysis of gildedmetal embroidery threads, Stud. Conserv., 2000, 45, 274–279.
This journal is © The Royal Society of Chemistry 2016