survey of condition indicators for condition monitoring...
TRANSCRIPT

Survey of Condition Indicators for Condition Monitoring Systems
Junda Zhu, Tom Nostrand, Cody Spiegel, and Brogan Morton
Renewable NRG Systems, Hinesburg, Vermont, 05461, USA
ABSTRACT
Currently, the wind energy industry is swiftly changing its
maintenance strategy from schedule based maintenance to
predictive based maintenance. Condition monitoring
systems (CMS) play an important role in the predictive
maintenance cycle. As condition monitoring systems are
being adopted by more and more OEM and O&M service
providers from the wind energy industry, it is crucial to
effectively interpret the data generated by the CMS and
initiate proactive processes to efficiently reduce the risk of
potential component or system failure which often leads to
down tower repair or gearbox replacement. The majority of
CMS are designed and constructed based on vibration
analysis which has been refined over the years by
researchers and scientists. This paper provides detailed
description and mathematical interpretation of a
comprehensive selection of condition indicators for gears,
bearings and shafts. Since different condition indicators are
sensitive to different kind of failure modes, the application
for each condition indicators were also discussed. The Time
Synchronous Averaging (TSA) algorithm was applied as the
signal processing method before the extraction of condition
indicators for gears and shafts. Time Synchronous
Resampling algorithm was applied to stabilize the shaft
speed before the extraction of bearing condition indicators.
Several case studies of real world wind turbine component
failure detection using condition indicators were presented
to demonstrate the effectiveness of certain condition
indicators.
1. INTRODUCTION
As the global market of wind energy continuously grows
over the recent years, the maintenance strategy of wind
farms is evolving from schedule base maintenance to
condition based maintenance. Scientists, researcher and
engineers specialized in condition based monitoring
techniques designed and utilized condition indicators to
monitor and track the health status of the assets of interest.
Condition indicators can be extracted from various signal
sources including tradition vibration based signal from
accelerometers, acoustic emission signal, oil condition
signal and signal collected from SCADA systems. Different
condition indicators were designed for different
applications. Ideally, vibration based condition based
monitoring techniques are very capable of detecting
component fault signatures at high speed or intermediate
sections of the wind turbine while acoustic emission based
techniques are more capable of low speed or planetary
section component fault detection.
Previously, Vecer et al (2005) summarized a comprehensive
selection of condition indicators for gears along with some
typical vibration signal analysis algorithms. Also, the
National Renewable Energy Laboratory (NREL) published
a document named ‘Wind Turbine Gearbox Condition
Monitoring Round Robin Study – Vibration Analysis’ in
2012 covered detailed information regarding lots of the
common condition indicators. This paper summarized a
great amount of the information from the above mentioned
two reports. And the authors provided an industry
perspective on how to utilize different CIs including those
not only for gears but also for bearings and shafts on
machine health status monitoring.
In general, the definition of condition indicators consists of
two parts, the analysis algorithm and the statistical features.
Analysis algorithm can be narrowband analysis, residual
analysis and frequency/amplitude modulation analysis and
so on. Statistical features include root mean square (RMS),
kurtosis, crest factor, skewness, peak, peak to peak etc. A
typical condition indicator can be expressed as narrowband
kurtosis or residual RMS. Therefore, as a matter of fact,
condition indicators are designed to describe the time or
frequency domain signal waveform or analysis result from
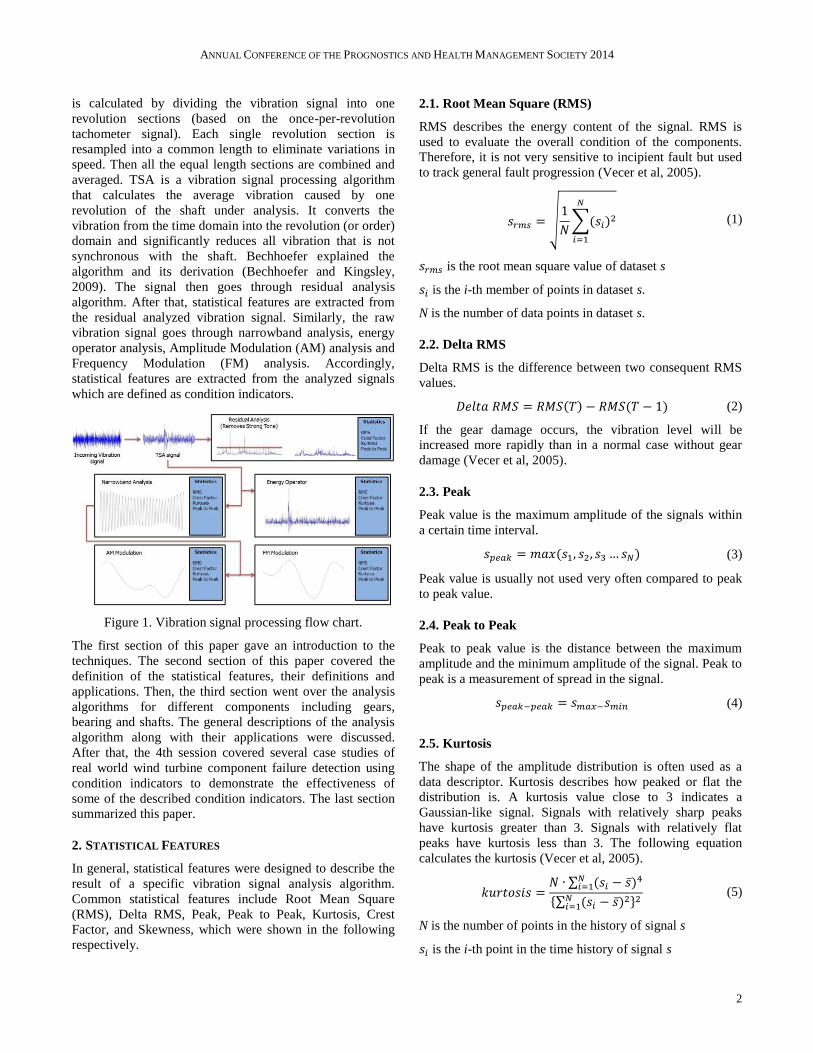
specific analysis algorithm in a statistical manner. Typical
condition monitoring system data processing flowchart for
gears is presented in Figure 1. In Figure 1, the incoming raw
vibration signal were collected from the accelerometers and
then goes into the Time Synchronous Averaging Algorithm
(TSA) to remove noises that were not synchronous with the
shaft rotating frequency. Time synchronous average signal
_____________________
Junda Zhu et al. This is an open-access article distributed under the terms of the Creative Commons Attribution 3.0 United States License, which
permits unrestricted use, distribution, and reproduction in any medium,
provided the original author and source are credited.
ANNUAL CONFERENCE OF THE PROGNOSTICS AND HEALTH MANAGEMENT SOCIETY 2014
2
is calculated by dividing the vibration signal into one
revolution sections (based on the once-per-revolution
tachometer signal). Each single revolution section is
resampled into a common length to eliminate variations in
speed. Then all the equal length sections are combined and
averaged. TSA is a vibration signal processing algorithm
that calculates the average vibration caused by one
revolution of the shaft under analysis. It converts the
vibration from the time domain into the revolution (or order)
domain and significantly reduces all vibration that is not
synchronous with the shaft. Bechhoefer explained the
algorithm and its derivation (Bechhoefer and Kingsley,
2009). The signal then goes through residual analysis
algorithm. After that, statistical features are extracted from
the residual analyzed vibration signal. Similarly, the raw
vibration signal goes through narrowband analysis, energy
operator analysis, Amplitude Modulation (AM) analysis and
Frequency Modulation (FM) analysis. Accordingly,
statistical features are extracted from the analyzed signals
which are defined as condition indicators.
Figure 1. Vibration signal processing flow chart.
The first section of this paper gave an introduction to the
techniques. The second section of this paper covered the
definition of the statistical features, their definitions and
applications. Then, the third section went over the analysis
algorithms for different components including gears,
bearing and shafts. The general descriptions of the analysis
algorithm along with their applications were discussed.
After that, the 4th session covered several case studies of
real world wind turbine component failure detection using
condition indicators to demonstrate the effectiveness of
some of the described condition indicators. The last section
summarized this paper.
2. STATISTICAL FEATURES
In general, statistical features were designed to describe the
result of a specific vibration signal analysis algorithm.
Common statistical features include Root Mean Square
(RMS), Delta RMS, Peak, Peak to Peak, Kurtosis, Crest
Factor, and Skewness, which were shown in the following
respectively.
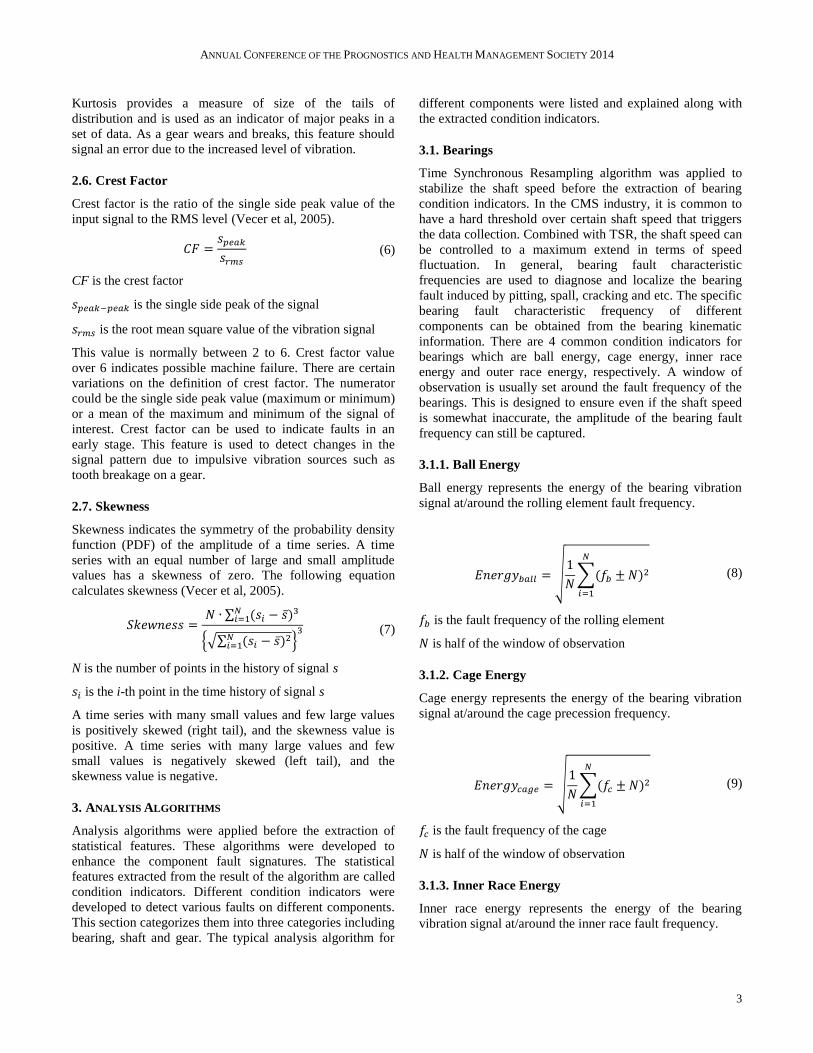
2.1. Root Mean Square (RMS)
RMS describes the energy content of the signal. RMS is
used to evaluate the overall condition of the components.
Therefore, it is not very sensitive to incipient fault but used
to track general fault progression (Vecer et al, 2005).
√
∑
(1)
is the root mean square value of dataset s
is the i-th member of points in dataset s.
N is the number of data points in dataset s.
2.2. Delta RMS
Delta RMS is the difference between two consequent RMS
values.
(2)
If the gear damage occurs, the vibration level will be
increased more rapidly than in a normal case without gear
damage (Vecer et al, 2005).
2.3. Peak
Peak value is the maximum amplitude of the signals within
a certain time interval.
(3)
Peak value is usually not used very often compared to peak
to peak value.
2.4. Peak to Peak
Peak to peak value is the distance between the maximum
amplitude and the minimum amplitude of the signal. Peak to
peak is a measurement of spread in the signal.
(4)
2.5. Kurtosis
The shape of the amplitude distribution is often used as a
data descriptor. Kurtosis describes how peaked or flat the
distribution is. A kurtosis value close to 3 indicates a
Gaussian-like signal. Signals with relatively sharp peaks
have kurtosis greater than 3. Signals with relatively flat
peaks have kurtosis less than 3. The following equation
calculates the kurtosis (Vecer et al, 2005).
∑
{∑ }
(5)
N is the number of points in the history of signal s
is the i-th point in the time history of signal s
ANNUAL CONFERENCE OF THE PROGNOSTICS AND HEALTH MANAGEMENT SOCIETY 2014
3
Kurtosis provides a measure of size of the tails of
distribution and is used as an indicator of major peaks in a
set of data. As a gear wears and breaks, this feature should
signal an error due to the increased level of vibration.
2.6. Crest Factor
Crest factor is the ratio of the single side peak value of the
input signal to the RMS level (Vecer et al, 2005).
(6)
CF is the crest factor
is the single side peak of the signal
is the root mean square value of the vibration signal
This value is normally between 2 to 6. Crest factor value
over 6 indicates possible machine failure. There are certain
variations on the definition of crest factor. The numerator
could be the single side peak value (maximum or minimum)
or a mean of the maximum and minimum of the signal of
interest. Crest factor can be used to indicate faults in an
early stage. This feature is used to detect changes in the
signal pattern due to impulsive vibration sources such as
tooth breakage on a gear.
2.7. Skewness
Skewness indicates the symmetry of the probability density
function (PDF) of the amplitude of a time series. A time
series with an equal number of large and small amplitude
values has a skewness of zero. The following equation
calculates skewness (Vecer et al, 2005).
∑
{√∑ }
(7)
N is the number of points in the history of signal s
is the i-th point in the time history of signal s
A time series with many small values and few large values
is positively skewed (right tail), and the skewness value is
positive. A time series with many large values and few
small values is negatively skewed (left tail), and the
skewness value is negative.
3. ANALYSIS ALGORITHMS
Analysis algorithms were applied before the extraction of
statistical features. These algorithms were developed to
enhance the component fault signatures. The statistical
features extracted from the result of the algorithm are called
condition indicators. Different condition indicators were
developed to detect various faults on different components.
This section categorizes them into three categories including
bearing, shaft and gear. The typical analysis algorithm for
different components were listed and explained along with
the extracted condition indicators.
3.1. Bearings
Time Synchronous Resampling algorithm was applied to
stabilize the shaft speed before the extraction of bearing
condition indicators. In the CMS industry, it is common to
have a hard threshold over certain shaft speed that triggers
the data collection. Combined with TSR, the shaft speed can
be controlled to a maximum extend in terms of speed
fluctuation. In general, bearing fault characteristic
frequencies are used to diagnose and localize the bearing
fault induced by pitting, spall, cracking and etc. The specific
bearing fault characteristic frequency of different
components can be obtained from the bearing kinematic
information. There are 4 common condition indicators for
bearings which are ball energy, cage energy, inner race
energy and outer race energy, respectively. A window of
observation is usually set around the fault frequency of the
bearings. This is designed to ensure even if the shaft speed
is somewhat inaccurate, the amplitude of the bearing fault
frequency can still be captured.
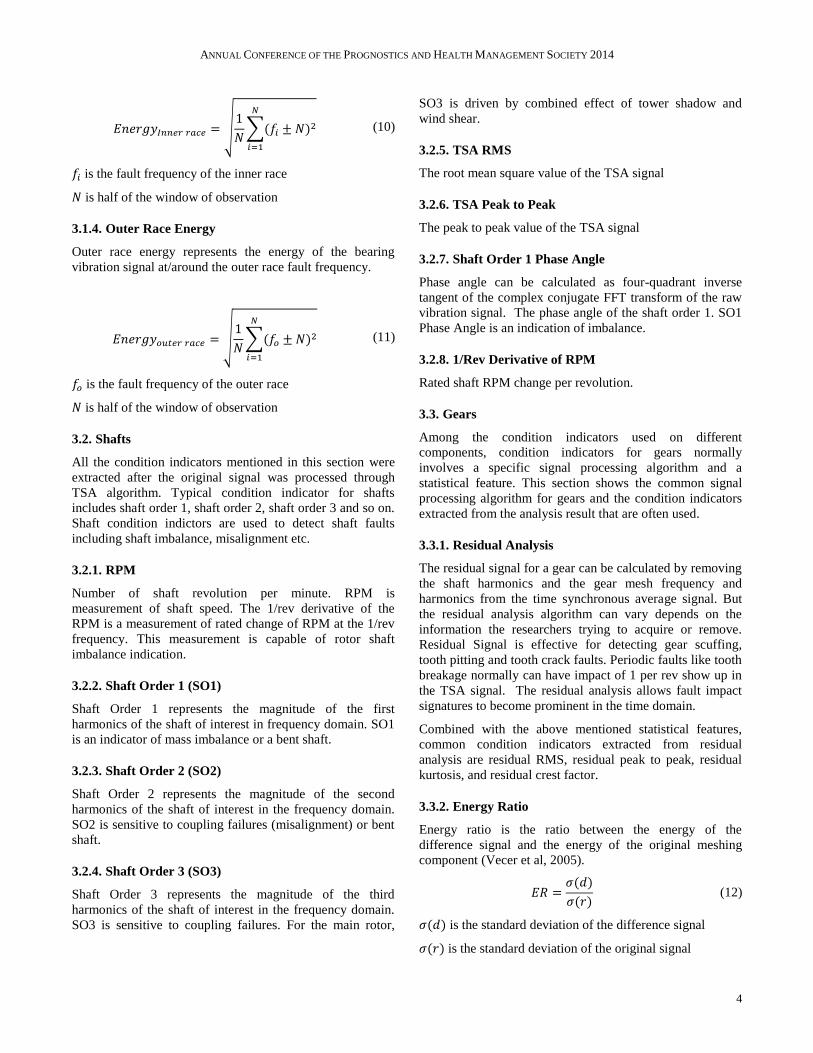
3.1.1. Ball Energy
Ball energy represents the energy of the bearing vibration
signal at/around the rolling element fault frequency.
√
∑
(8)
is the fault frequency of the rolling element
is half of the window of observation
3.1.2. Cage Energy
Cage energy represents the energy of the bearing vibration
signal at/around the cage precession frequency.
√
∑
(9)
is the fault frequency of the cage
is half of the window of observation
3.1.3. Inner Race Energy
Inner race energy represents the energy of the bearing
vibration signal at/around the inner race fault frequency.
ANNUAL CONFERENCE OF THE PROGNOSTICS AND HEALTH MANAGEMENT SOCIETY 2014
4
√
∑
(10)
is the fault frequency of the inner race
is half of the window of observation
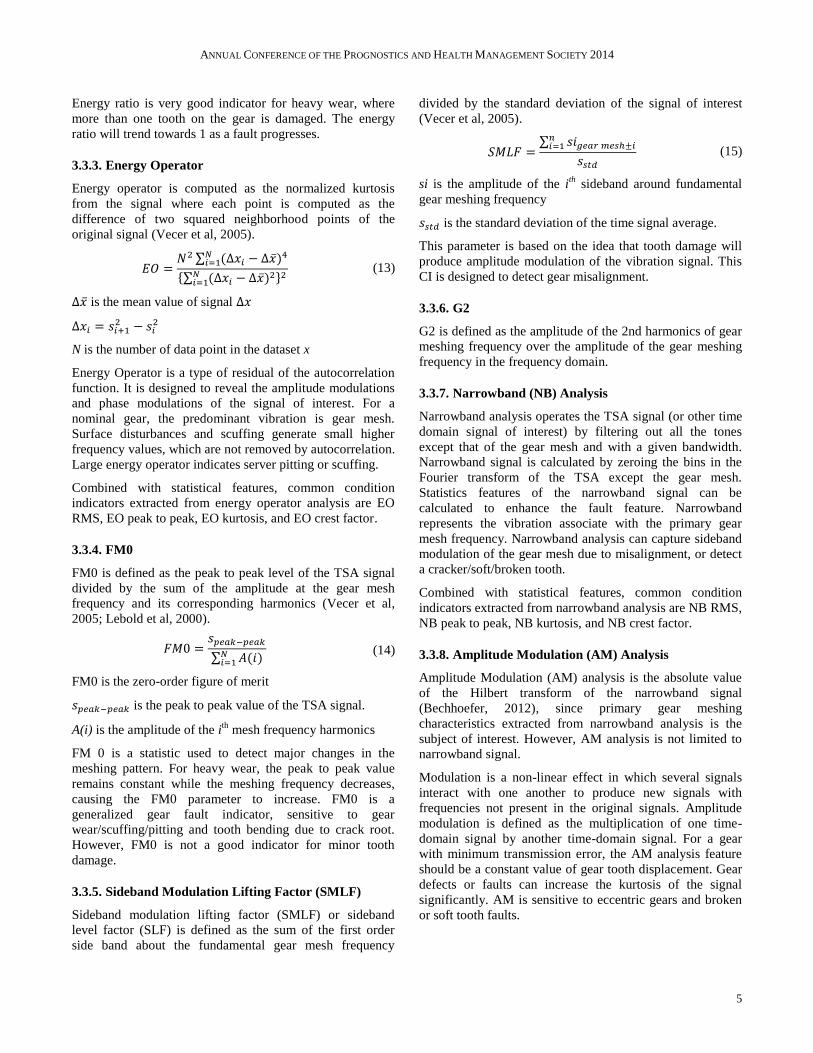
3.1.4. Outer Race Energy
Outer race energy represents the energy of the bearing
vibration signal at/around the outer race fault frequency.
√
∑
(11)
is the fault frequency of the outer race
is half of the window of observation
3.2. Shafts
All the condition indicators mentioned in this section were
extracted after the original signal was processed through
TSA algorithm. Typical condition indicator for shafts
includes shaft order 1, shaft order 2, shaft order 3 and so on.
Shaft condition indictors are used to detect shaft faults
including shaft imbalance, misalignment etc.
3.2.1. RPM
Number of shaft revolution per minute. RPM is
measurement of shaft speed. The 1/rev derivative of the
RPM is a measurement of rated change of RPM at the 1/rev
frequency. This measurement is capable of rotor shaft
imbalance indication.
3.2.2. Shaft Order 1 (SO1)
Shaft Order 1 represents the magnitude of the first
harmonics of the shaft of interest in frequency domain. SO1
is an indicator of mass imbalance or a bent shaft.
3.2.3. Shaft Order 2 (SO2)
Shaft Order 2 represents the magnitude of the second
harmonics of the shaft of interest in the frequency domain.
SO2 is sensitive to coupling failures (misalignment) or bent
shaft.
3.2.4. Shaft Order 3 (SO3)
Shaft Order 3 represents the magnitude of the third
harmonics of the shaft of interest in the frequency domain.
SO3 is sensitive to coupling failures. For the main rotor,
SO3 is driven by combined effect of tower shadow and
wind shear.
3.2.5. TSA RMS
The root mean square value of the TSA signal
3.2.6. TSA Peak to Peak
The peak to peak value of the TSA signal
3.2.7. Shaft Order 1 Phase Angle
Phase angle can be calculated as four-quadrant inverse
tangent of the complex conjugate FFT transform of the raw
vibration signal. The phase angle of the shaft order 1. SO1
Phase Angle is an indication of imbalance.
3.2.8. 1/Rev Derivative of RPM
Rated shaft RPM change per revolution.
3.3. Gears
Among the condition indicators used on different
components, condition indicators for gears normally
involves a specific signal processing algorithm and a
statistical feature. This section shows the common signal
processing algorithm for gears and the condition indicators
extracted from the analysis result that are often used.
3.3.1. Residual Analysis
The residual signal for a gear can be calculated by removing
the shaft harmonics and the gear mesh frequency and
harmonics from the time synchronous average signal. But
the residual analysis algorithm can vary depends on the
information the researchers trying to acquire or remove.
Residual Signal is effective for detecting gear scuffing,
tooth pitting and tooth crack faults. Periodic faults like tooth
breakage normally can have impact of 1 per rev show up in
the TSA signal. The residual analysis allows fault impact
signatures to become prominent in the time domain.
Combined with the above mentioned statistical features,
common condition indicators extracted from residual
analysis are residual RMS, residual peak to peak, residual
kurtosis, and residual crest factor.
3.3.2. Energy Ratio
Energy ratio is the ratio between the energy of the
difference signal and the energy of the original meshing
component (Vecer et al, 2005).
(12)
is the standard deviation of the difference signal
is the standard deviation of the original signal
ANNUAL CONFERENCE OF THE PROGNOSTICS AND HEALTH MANAGEMENT SOCIETY 2014
5
Energy ratio is very good indicator for heavy wear, where
more than one tooth on the gear is damaged. The energy
ratio will trend towards 1 as a fault progresses.
3.3.3. Energy Operator
Energy operator is computed as the normalized kurtosis
from the signal where each point is computed as the
difference of two squared neighborhood points of the
original signal (Vecer et al, 2005).
∑
{∑ }
(13)
is the mean value of signal
N is the number of data point in the dataset x
Energy Operator is a type of residual of the autocorrelation
function. It is designed to reveal the amplitude modulations
and phase modulations of the signal of interest. For a
nominal gear, the predominant vibration is gear mesh.
Surface disturbances and scuffing generate small higher
frequency values, which are not removed by autocorrelation.
Large energy operator indicates server pitting or scuffing.
Combined with statistical features, common condition
indicators extracted from energy operator analysis are EO
RMS, EO peak to peak, EO kurtosis, and EO crest factor.
3.3.4. FM0
FM0 is defined as the peak to peak level of the TSA signal
divided by the sum of the amplitude at the gear mesh
frequency and its corresponding harmonics (Vecer et al,
2005; Lebold et al, 2000).
∑
(14)
FM0 is the zero-order figure of merit
is the peak to peak value of the TSA signal.
A(i) is the amplitude of the ith
mesh frequency harmonics
FM 0 is a statistic used to detect major changes in the
meshing pattern. For heavy wear, the peak to peak value
remains constant while the meshing frequency decreases,
causing the FM0 parameter to increase. FM0 is a
generalized gear fault indicator, sensitive to gear
wear/scuffing/pitting and tooth bending due to crack root.
However, FM0 is not a good indicator for minor tooth
damage.
3.3.5. Sideband Modulation Lifting Factor (SMLF)
Sideband modulation lifting factor (SMLF) or sideband
level factor (SLF) is defined as the sum of the first order
side band about the fundamental gear mesh frequency
divided by the standard deviation of the signal of interest
(Vecer et al, 2005).
∑
(15)
si is the amplitude of the ith
sideband around fundamental
gear meshing frequency
is the standard deviation of the time signal average.
This parameter is based on the idea that tooth damage will
produce amplitude modulation of the vibration signal. This
CI is designed to detect gear misalignment.
3.3.6. G2
G2 is defined as the amplitude of the 2nd harmonics of gear
meshing frequency over the amplitude of the gear meshing
frequency in the frequency domain.
3.3.7. Narrowband (NB) Analysis
Narrowband analysis operates the TSA signal (or other time
domain signal of interest) by filtering out all the tones
except that of the gear mesh and with a given bandwidth.
Narrowband signal is calculated by zeroing the bins in the
Fourier transform of the TSA except the gear mesh.
Statistics features of the narrowband signal can be
calculated to enhance the fault feature. Narrowband
represents the vibration associate with the primary gear
mesh frequency. Narrowband analysis can capture sideband
modulation of the gear mesh due to misalignment, or detect
a cracker/soft/broken tooth.
Combined with statistical features, common condition
indicators extracted from narrowband analysis are NB RMS,
NB peak to peak, NB kurtosis, and NB crest factor.
3.3.8. Amplitude Modulation (AM) Analysis
Amplitude Modulation (AM) analysis is the absolute value
of the Hilbert transform of the narrowband signal
(Bechhoefer, 2012), since primary gear meshing
characteristics extracted from narrowband analysis is the
subject of interest. However, AM analysis is not limited to
narrowband signal.
Modulation is a non-linear effect in which several signals
interact with one another to produce new signals with
frequencies not present in the original signals. Amplitude
modulation is defined as the multiplication of one time-
domain signal by another time-domain signal. For a gear
with minimum transmission error, the AM analysis feature
should be a constant value of gear tooth displacement. Gear
defects or faults can increase the kurtosis of the signal
significantly. AM is sensitive to eccentric gears and broken
or soft tooth faults.
ANNUAL CONFERENCE OF THE PROGNOSTICS AND HEALTH MANAGEMENT SOCIETY 2014
6
Combined with statistical features, common condition
indicators extracted from AM analysis are AM RMS, AM
peak to peak, AM kurtosis, and AM crest factor.
3.3.9. DAM
DAM is defined as the derivative of the amplitude
modulation (AM) signal. DAM is sensitive to both soft and
broken gear tooth faults.
Combined with statistical features, common condition
indicators extracted from DAM analysis are DAM RMS,
DAM peak to peak, DAM kurtosis, and DAM crest factor.
3.3.10. Frequency Modulation (FM) Analysis
Frequency Modulation (FM) is the derivative of the angle of
the Hilbert transform of narrowband signal (Bechhoefer,
2012), since primary gear meshing characteristics extracted
from narrowband analysis is the subject of interest.
However, FM analysis is not limited to narrowband signal.
Modulation is a non-linear effect in which several signals
interact with one another to produce new signals with
frequencies not present in the original signals. Frequency
modulation (FM) is the varying in frequency of one signal
by the influence of another signal, usually of lower
frequency. The frequency being modulated is called the
carrier. Frequency Modulation analysis is in radians.
Frequency modulation (FM) analysis is a powerful tool
capable of detecting changes of phase due to uneven tooth
loading, characteristics of a number of fault types. For
certain gear architectures, FM analysis is more sensitive to
fault than either the narrowband or amplitude modulation
analysis.
Combined with statistical features, common condition
indicators extracted from FM analysis are FM RMS, FM
peak to peak, FM kurtosis, and FM crest factor.
3.3.11. FM4
FM4 is a simple measure if the amplitude distribution of the
difference signal is peaked or flat. The mathematical
representation is shown below. NA4 is determined by
dividing the fourth statistical moment of the residual signal
by the current run time averaged variance of the residual
signal, raised to the second power (Vecer et al, 2005;
Lebold et al, 2000).
∑
{∑ }
(16)
is the i-th point of the differential signal in the time
record
N is the total number of points in the time record
The parameter assumes that a gearbox in good condition has
a difference signal with a Gaussian amplitude distribution
(kurtosis of 3), whereas a gearbox with a major peak or a
series of major peaks results in a less peaked amplitude
distribution (kurtosis greater than 3). For single tooth defect
fault progression, the data distribution becomes peaky and
the kurtosis increases. For multiple teeth fault progression,
the data distribution becomes flat and the kurtosis value
decreases.
3.3.12. NB4
NB4 is designed from the NA4 parameter.NA4 is calculated
from the residual signal while NB4 uses the envelop of a
band-passed segment of the time synchronous averaged
signal.NB4 is determined by dividing the 4th statistical
moments of the envelop signal, raised to the 2nd power.
(Lebold et al, 2000; Lebold et al, 2000).
∑
{
∑ ∑
}
(17)
E is the envelop of the band passed signal
is the mean value of the enveloped signal.
N is the total data points in time record.
M is the current time record in the run ensemble.
| | √ (18)
| | is the envelope of the analytic signal
is an input analog signal
Is the Hilbert transform of the input signal
A few damaged gear teeth will cause transient load
fluctuations that are different from normal tooth load
fluctuations. The theory suggests these fluctuations will be
manifested in the envelop of a signal which is band-pass
filtered about the dominant meshing frequency.
3.3.13. NA4
NA4 is determined by dividing the fourth statistical moment
of the residual signal by the current run time averaged
variance of the residual signal, raised to the second power
(Vecer et al, 2005; Lebold et al, 2000).
∑
{
∑ ∑
}
(19)
is the i-th point in the time record of the residual signal.
is the i-th point in the j-th time record of the residual
signal.
j is the current time record
i is the data point number per reading
M is the current time record in the run ensemble
ANNUAL CONFERENCE OF THE PROGNOSTICS AND HEALTH MANAGEMENT SOCIETY 2014
7
N is the number of points in the time record
3.3.14. NA4*
NA4* is an enhanced version of NA4. The improvement is
achieved by normalizing the fourth statistical moment with
the residual signal variance for a gearbox in good condition
instead of the running variance, which is used for NA4
(Vecer et al, 2005; Lebold et al, 2000).
∑
(20)
is the variance of the residual signal for a
gearbox in good condition (obtained from a well-
functioning gearbox)
When gear damage progresses, the averaged variance value
increases rapidly which results in the decrease of the
parameter. To overcome this problem is developed to
be more robust when progressive damage occurs.
4. CASE STUDIES
This section presents three case studies covering gear,
bearing and shaft. All the case studies are from the wind
energy industry where there is a pressing need for condition
monitoring systems. For the next three case studies, all data
was collected and processed by TurbinePhD system.
4.1. Wind Turbine High Speed Pinion
The purpose of installing a condition monitoring systems is
to help mitigate the high financial risk of unplanned
maintenance and establish the framework for a new
predictive maintenance program. A well developed
condition monitoring systems should be capable of
monitoring every bearing, gear and shaft in the gearbox as
well as the generator and main bearing.
A condition monitoring system is designed to detect faults
early on so that wind farm operators have the longest
possible time to plan a maintenance action. This early
detection is critical in avoiding secondary damage from
catastrophic failure and the subsequent additional financial
cost. Additionally, the system uses numerous complex
algorithms to track the condition of a component, which in
turn are then normalized and combined to estimate the
overall health of the component. The result is excellent
fault discrimination, which is arguably one of the most
important aspects of a condition monitoring system. Fault
discrimination is the ability to separate out a faulted
component from good components. If the fault
discrimination is good, then the alarms the system provides
are trustworthy and actionable. On the other hand, if the
fault discrimination is poor, then the likelihood of false
alarms and missed detections increases. Finally, the system
uses a patented automated diagnostic capability to provide
the user with an easy to read display of which turbines need
attention all through a cloud-based client interface. Thus,
eliminating the need for complex data processing and
interpretation before a maintenance decision can be made.
After installation, the condition monitoring systems
gathered wind turbine fleet vibration data for two weeks at
which point alarm and warning thresholds were generated.
These thresholds are data driven values obtained by
statistically eliminating the outlying abnormal components
on each turbine that define if a component is damaged.
Once the thresholds were established, an alarm was
triggered for the High Speed Pinion (the last gear in the
gearbox before the generator) on one of the turbines.
Alarms are triggered when one or more Condition Indicators
or CIs were elevated over the generated thresholds. In this
case, several CIs were elevated while others were not.
Since different CIs are sensitive to different fault modes, the
type of fault can be estimated solely based on which CIs are
elevated and which are not. From the list of CIs that
responded to this fault, there was strong evidence that the
alarm was triggered by a broken tooth. The wind farm
operators were notified and an up tower visual inspection
revealed the cracked tooth.
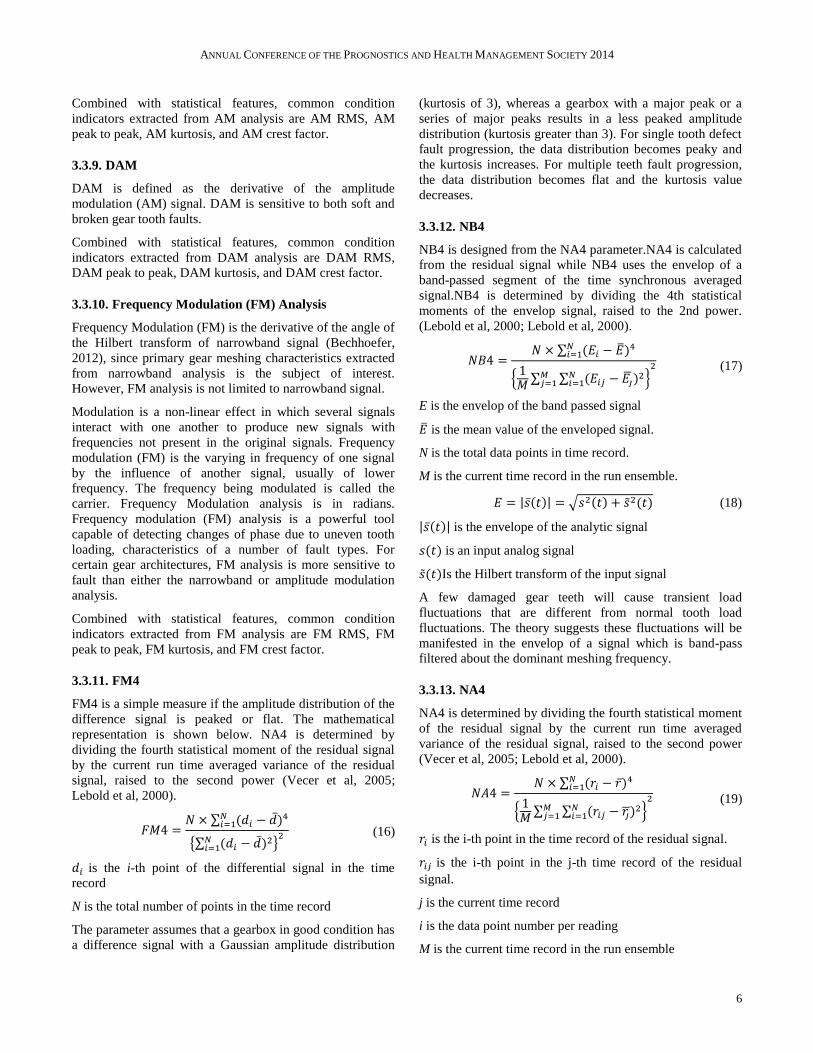
One of the Condition Indicators that is very sensitive to gear
tooth pitting, scuffing and bending is called the FM0. It
compares the general vibration level with the amplitude of
gear meshing. A high FM0 value indicates the general
vibration level is higher than normal and the gear meshing
characteristic frequency is submerged in the high noise
floor. In this case, FM0 was elevated to the point where the
fault discrimination was perfect, meaning there were
absolutely no overlapping values between the FM0 tracking
the broken pinion and the FM0 tracking normal pinions on
other turbines as seen in the following Figure 2. This means
the probability of a false alarm or missed detection was
extremely low.
Figure 2. Fault discrimination based on FM0
While the FM0 Condition Indicator contributed to the
triggered the alarm, other condition indicators were less
sensitive to the fault. As explained previously, a condition
monitoring system should offer clients the capability of
ANNUAL CONFERENCE OF THE PROGNOSTICS AND HEALTH MANAGEMENT SOCIETY 2014
8
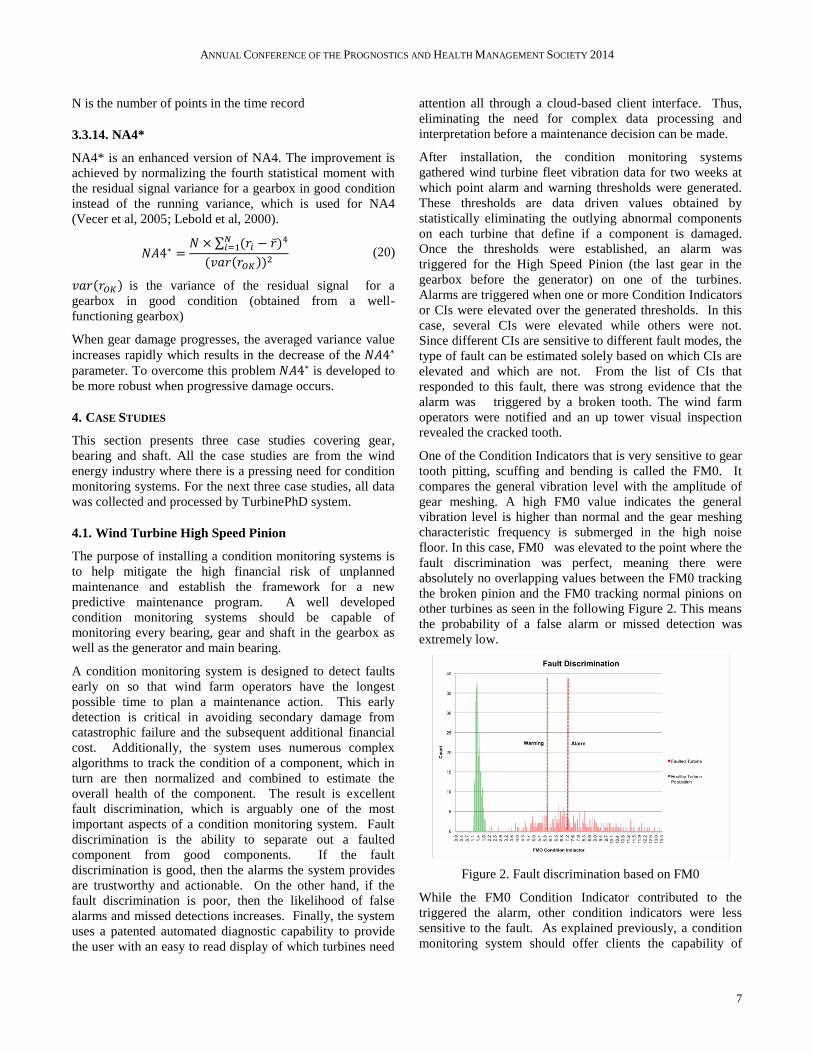
determining not only which component is not operating at a
nominal condition but also performing diagnostics. This is
critical information when it comes to cost savings, as
different fault modes require different maintenance actions.
In this case, the AM Kurtosis CI, which is a sensitive
indicator of eccentric gears but less so at capturing tooth
damage, remained at the nominal level as seen in the
following Figure 3.
Figure 3. Fault discrimination based on AM Kurtosis
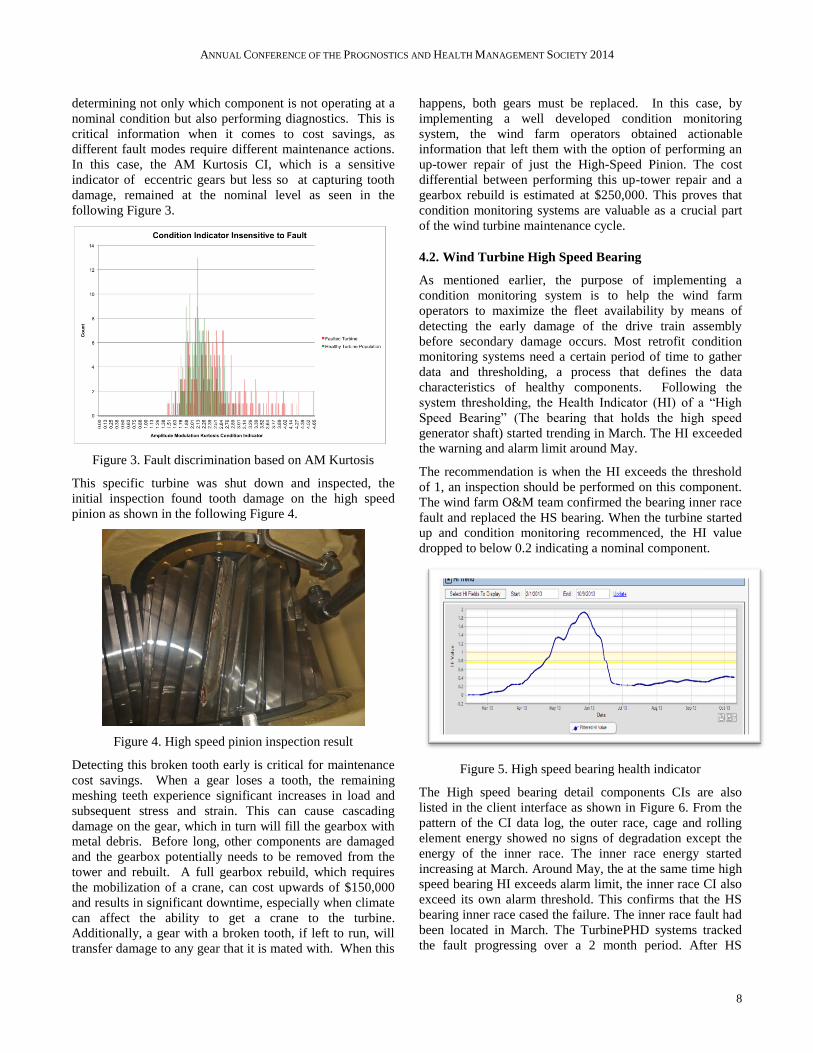
This specific turbine was shut down and inspected, the
initial inspection found tooth damage on the high speed
pinion as shown in the following Figure 4.
Figure 4. High speed pinion inspection result
Detecting this broken tooth early is critical for maintenance
cost savings. When a gear loses a tooth, the remaining
meshing teeth experience significant increases in load and
subsequent stress and strain. This can cause cascading
damage on the gear, which in turn will fill the gearbox with
metal debris. Before long, other components are damaged
and the gearbox potentially needs to be removed from the
tower and rebuilt. A full gearbox rebuild, which requires
the mobilization of a crane, can cost upwards of $150,000
and results in significant downtime, especially when climate
can affect the ability to get a crane to the turbine.
Additionally, a gear with a broken tooth, if left to run, will
transfer damage to any gear that it is mated with. When this
happens, both gears must be replaced. In this case, by
implementing a well developed condition monitoring
system, the wind farm operators obtained actionable
information that left them with the option of performing an
up-tower repair of just the High-Speed Pinion. The cost
differential between performing this up-tower repair and a
gearbox rebuild is estimated at $250,000. This proves that
condition monitoring systems are valuable as a crucial part
of the wind turbine maintenance cycle.
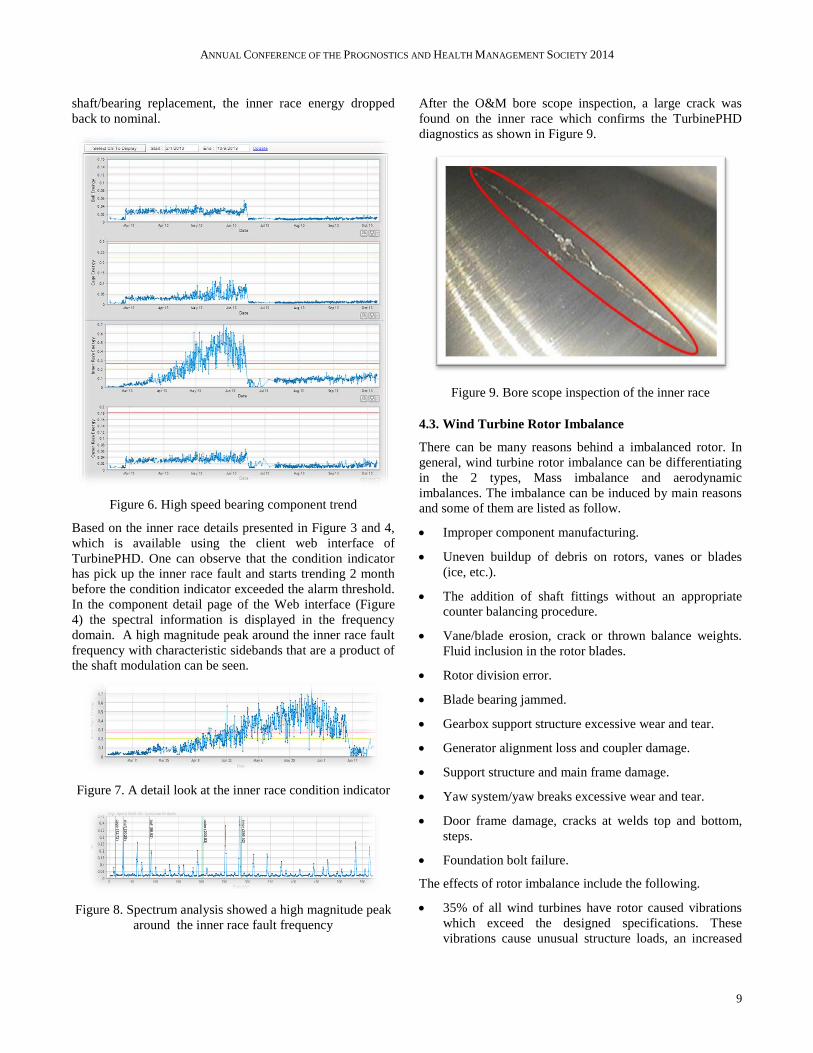
4.2. Wind Turbine High Speed Bearing
As mentioned earlier, the purpose of implementing a
condition monitoring system is to help the wind farm
operators to maximize the fleet availability by means of
detecting the early damage of the drive train assembly
before secondary damage occurs. Most retrofit condition
monitoring systems need a certain period of time to gather
data and thresholding, a process that defines the data
characteristics of healthy components. Following the
system thresholding, the Health Indicator (HI) of a “High
Speed Bearing” (The bearing that holds the high speed
generator shaft) started trending in March. The HI exceeded
the warning and alarm limit around May.
The recommendation is when the HI exceeds the threshold
of 1, an inspection should be performed on this component.
The wind farm O&M team confirmed the bearing inner race
fault and replaced the HS bearing. When the turbine started
up and condition monitoring recommenced, the HI value
dropped to below 0.2 indicating a nominal component.
Figure 5. High speed bearing health indicator
The High speed bearing detail components CIs are also
listed in the client interface as shown in Figure 6. From the
pattern of the CI data log, the outer race, cage and rolling
element energy showed no signs of degradation except the
energy of the inner race. The inner race energy started
increasing at March. Around May, the at the same time high
speed bearing HI exceeds alarm limit, the inner race CI also
exceed its own alarm threshold. This confirms that the HS
bearing inner race cased the failure. The inner race fault had
been located in March. The TurbinePHD systems tracked
the fault progressing over a 2 month period. After HS
ANNUAL CONFERENCE OF THE PROGNOSTICS AND HEALTH MANAGEMENT SOCIETY 2014
9
shaft/bearing replacement, the inner race energy dropped
back to nominal.
Figure 6. High speed bearing component trend
Based on the inner race details presented in Figure 3 and 4,
which is available using the client web interface of
TurbinePHD. One can observe that the condition indicator
has pick up the inner race fault and starts trending 2 month
before the condition indicator exceeded the alarm threshold.
In the component detail page of the Web interface (Figure
4) the spectral information is displayed in the frequency
domain. A high magnitude peak around the inner race fault
frequency with characteristic sidebands that are a product of
the shaft modulation can be seen.
Figure 7. A detail look at the inner race condition indicator
Figure 8. Spectrum analysis showed a high magnitude peak
around the inner race fault frequency
After the O&M bore scope inspection, a large crack was
found on the inner race which confirms the TurbinePHD
diagnostics as shown in Figure 9.
Figure 9. Bore scope inspection of the inner race
4.3. Wind Turbine Rotor Imbalance
There can be many reasons behind a imbalanced rotor. In
general, wind turbine rotor imbalance can be differentiating
in the 2 types, Mass imbalance and aerodynamic
imbalances. The imbalance can be induced by main reasons
and some of them are listed as follow.
Improper component manufacturing.
Uneven buildup of debris on rotors, vanes or blades
(ice, etc.).
The addition of shaft fittings without an appropriate
counter balancing procedure.
Vane/blade erosion, crack or thrown balance weights.
Fluid inclusion in the rotor blades.
Rotor division error.
Blade bearing jammed.
Gearbox support structure excessive wear and tear.
Generator alignment loss and coupler damage.
Support structure and main frame damage.
Yaw system/yaw breaks excessive wear and tear.
Door frame damage, cracks at welds top and bottom,
steps.
Foundation bolt failure.
The effects of rotor imbalance include the following.
35% of all wind turbines have rotor caused vibrations
which exceed the designed specifications. These
vibrations cause unusual structure loads, an increased
ANNUAL CONFERENCE OF THE PROGNOSTICS AND HEALTH MANAGEMENT SOCIETY 2014
10
wear, adverse startup conditions and often vibration
causing emergency turn off.
Rotational excitations cause higher dynamic load
beyond design specification on bearing which leads to
bearing failure from early fatigue. Fatigue, in a bearing,
is the result of stresses applied immediately below the
load carrying surfaces and is observed as appalling
away of surface material.
A wind turbine with an unbalanced rotor will lose some
of its low wind production capability.
High level of rotor vibration that appear as high
magnitude of 1st harmonics of shaft rotating frequency.
High levels of vibration caused by rotor imbalance
results in turbine efficiency loss.
Rotor unbalance is a leading contributor to the need for
frequent and costly maintenance action on yaw systems and
fastening hardware. The unbalanced force on the rotor
causes a reaction on the yaw system twice per revolution,
accelerating the wear on the yaw gear teeth through impact
loading and adding to the fatigue loading of the tower shell
and mounting bolts.
A Leading wind energy operator asked Renewable NRG
Systems to instrument their MW class turbine fleets with the
TurbinePHD Condition Monitoring System to help them
maximize the turbine availability by means of detecting the
early damage of the drive train assembly before any
secondary damage occurs. Following the standard
commissioning procedure, the system ran for two weeks
gathering data and was then thresholded, a process that
establishes data driven definitions of when a component is
no longer nominal. Following the system thresholding it
was immediately apparent that “Nacelle X” (a component
that watches the sway of the turbine tower) was not
“nominal”.
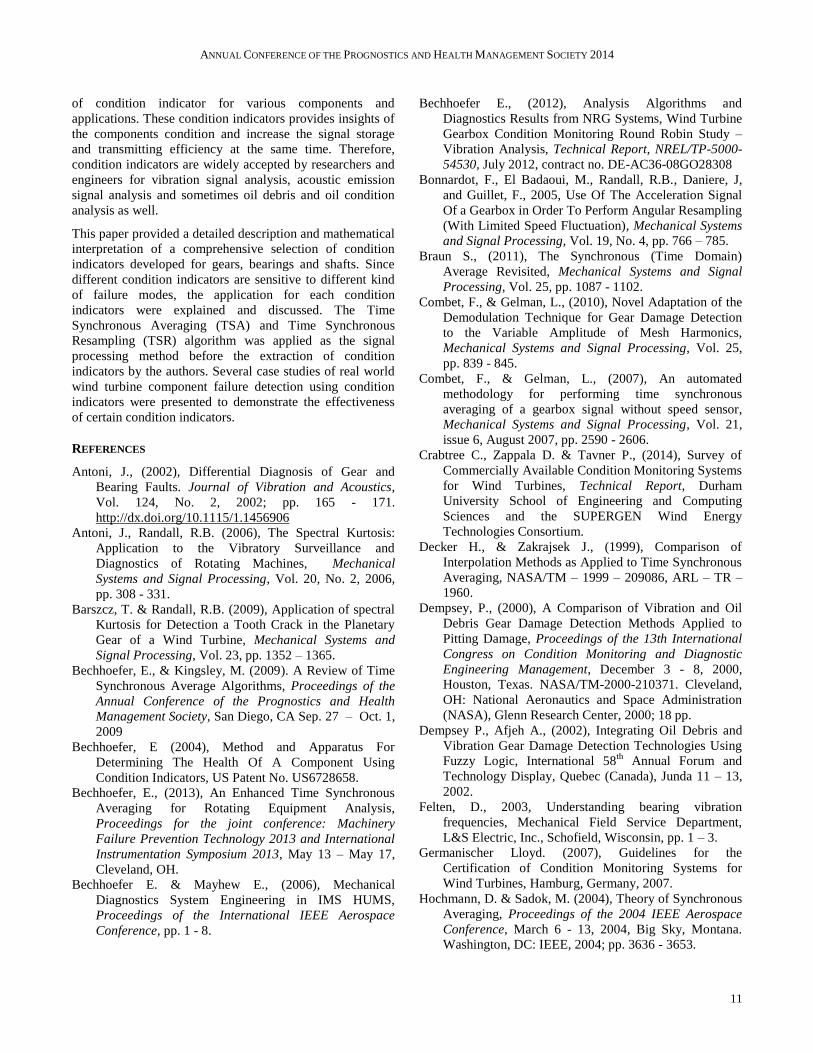
Figure 10. TurbinePHD Cloud Based Client Interface
A quick click on the red component revealed the Health
Indicator (HI) value was elevated because the tower was
swaying at the rotational frequency of the main rotor. This
condition is a typical characteristic of a heavy blade and the
subsequent imbalance (once per revolution imbalance). The
recommendation is that when the HI exceeds the threshold
of 1 an inspection needs to be performed on these
component/components. In this case the HI value was
floating around 1 between March 12th and June 13th. The
wind farm O&M team inspected the blades and found that a
heavy blade was causing the imbalance. The other turbine
blades had a weight adjustment and subsequently the HI
value dropped to nominal. After the 13th there was no data
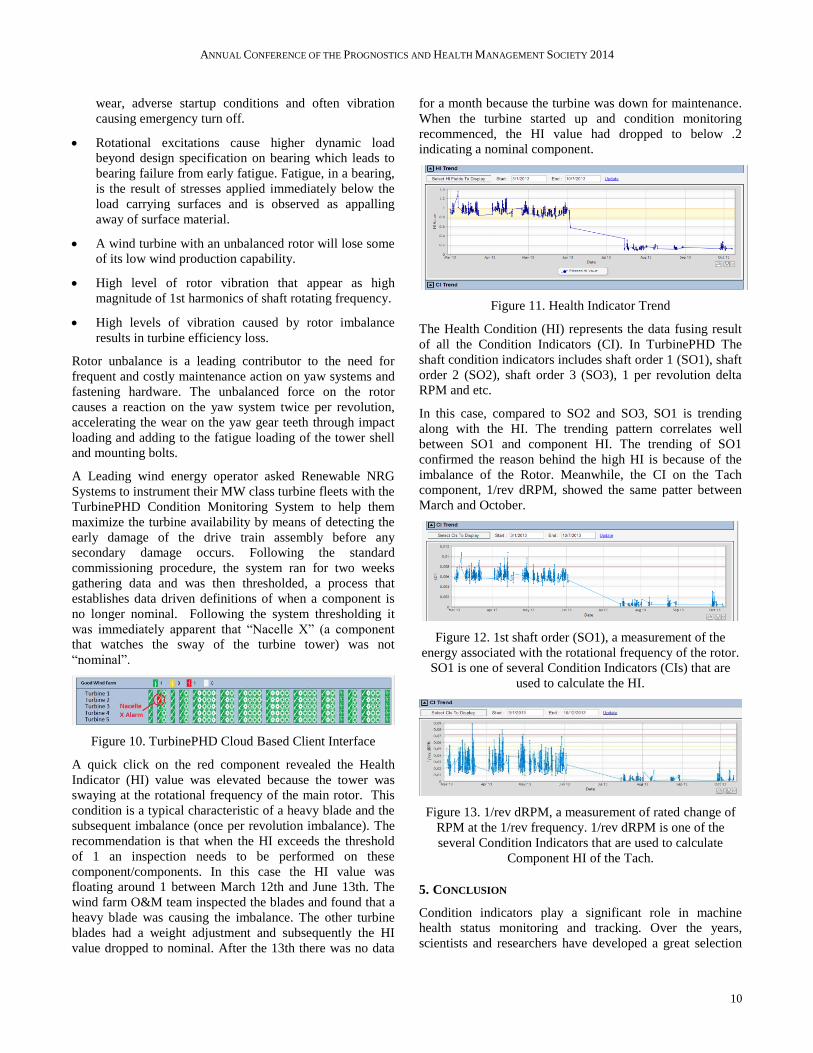
for a month because the turbine was down for maintenance.
When the turbine started up and condition monitoring
recommenced, the HI value had dropped to below .2
indicating a nominal component.
Figure 11. Health Indicator Trend
The Health Condition (HI) represents the data fusing result
of all the Condition Indicators (CI). In TurbinePHD The
shaft condition indicators includes shaft order 1 (SO1), shaft
order 2 (SO2), shaft order 3 (SO3), 1 per revolution delta
RPM and etc.
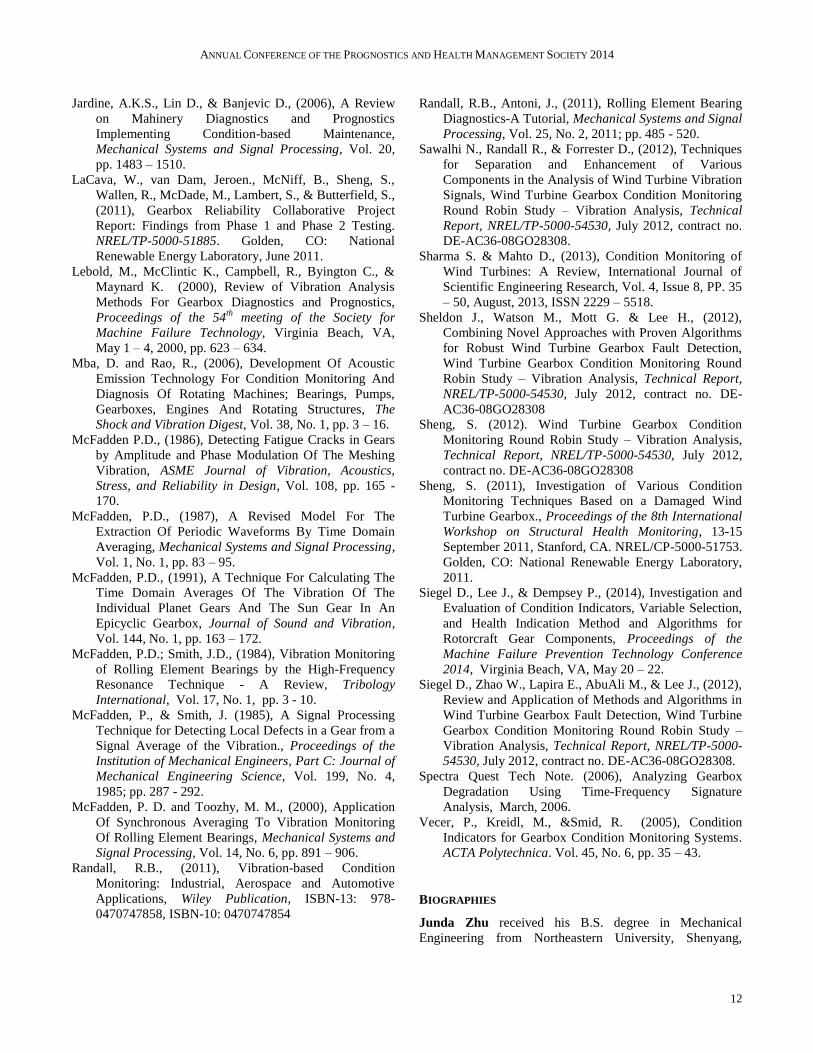
In this case, compared to SO2 and SO3, SO1 is trending
along with the HI. The trending pattern correlates well
between SO1 and component HI. The trending of SO1
confirmed the reason behind the high HI is because of the
imbalance of the Rotor. Meanwhile, the CI on the Tach
component, 1/rev dRPM, showed the same patter between
March and October.
Figure 12. 1st shaft order (SO1), a measurement of the
energy associated with the rotational frequency of the rotor.
SO1 is one of several Condition Indicators (CIs) that are
used to calculate the HI.
Figure 13. 1/rev dRPM, a measurement of rated change of
RPM at the 1/rev frequency. 1/rev dRPM is one of the
several Condition Indicators that are used to calculate
Component HI of the Tach.
5. CONCLUSION
Condition indicators play a significant role in machine
health status monitoring and tracking. Over the years,
scientists and researchers have developed a great selection
ANNUAL CONFERENCE OF THE PROGNOSTICS AND HEALTH MANAGEMENT SOCIETY 2014
11
of condition indicator for various components and
applications. These condition indicators provides insights of
the components condition and increase the signal storage
and transmitting efficiency at the same time. Therefore,
condition indicators are widely accepted by researchers and
engineers for vibration signal analysis, acoustic emission
signal analysis and sometimes oil debris and oil condition
analysis as well.
This paper provided a detailed description and mathematical
interpretation of a comprehensive selection of condition
indicators developed for gears, bearings and shafts. Since
different condition indicators are sensitive to different kind
of failure modes, the application for each condition
indicators were explained and discussed. The Time
Synchronous Averaging (TSA) and Time Synchronous
Resampling (TSR) algorithm was applied as the signal
processing method before the extraction of condition
indicators by the authors. Several case studies of real world
wind turbine component failure detection using condition
indicators were presented to demonstrate the effectiveness
of certain condition indicators.
REFERENCES
Antoni, J., (2002), Differential Diagnosis of Gear and
Bearing Faults. Journal of Vibration and Acoustics,
Vol. 124, No. 2, 2002; pp. 165 - 171.
http://dx.doi.org/10.1115/1.1456906
Antoni, J., Randall, R.B. (2006), The Spectral Kurtosis:
Application to the Vibratory Surveillance and
Diagnostics of Rotating Machines, Mechanical
Systems and Signal Processing, Vol. 20, No. 2, 2006,
pp. 308 - 331.
Barszcz, T. & Randall, R.B. (2009), Application of spectral
Kurtosis for Detection a Tooth Crack in the Planetary
Gear of a Wind Turbine, Mechanical Systems and
Signal Processing, Vol. 23, pp. 1352 – 1365.
Bechhoefer, E., & Kingsley, M. (2009). A Review of Time
Synchronous Average Algorithms, Proceedings of the
Annual Conference of the Prognostics and Health
Management Society, San Diego, CA Sep. 27 – Oct. 1,
2009
Bechhoefer, E (2004), Method and Apparatus For
Determining The Health Of A Component Using
Condition Indicators, US Patent No. US6728658.
Bechhoefer, E., (2013), An Enhanced Time Synchronous
Averaging for Rotating Equipment Analysis,
Proceedings for the joint conference: Machinery
Failure Prevention Technology 2013 and International
Instrumentation Symposium 2013, May 13 – May 17,
Cleveland, OH.
Bechhoefer E. & Mayhew E., (2006), Mechanical
Diagnostics System Engineering in IMS HUMS,
Proceedings of the International IEEE Aerospace
Conference, pp. 1 - 8.
Bechhoefer E., (2012), Analysis Algorithms and
Diagnostics Results from NRG Systems, Wind Turbine
Gearbox Condition Monitoring Round Robin Study –
Vibration Analysis, Technical Report, NREL/TP-5000-
54530, July 2012, contract no. DE-AC36-08GO28308
Bonnardot, F., El Badaoui, M., Randall, R.B., Daniere, J,
and Guillet, F., 2005, Use Of The Acceleration Signal
Of a Gearbox in Order To Perform Angular Resampling
(With Limited Speed Fluctuation), Mechanical Systems
and Signal Processing, Vol. 19, No. 4, pp. 766 – 785.
Braun S., (2011), The Synchronous (Time Domain)
Average Revisited, Mechanical Systems and Signal
Processing, Vol. 25, pp. 1087 - 1102.
Combet, F., & Gelman, L., (2010), Novel Adaptation of the
Demodulation Technique for Gear Damage Detection
to the Variable Amplitude of Mesh Harmonics,
Mechanical Systems and Signal Processing, Vol. 25,
pp. 839 - 845.
Combet, F., & Gelman, L., (2007), An automated
methodology for performing time synchronous
averaging of a gearbox signal without speed sensor,
Mechanical Systems and Signal Processing, Vol. 21,
issue 6, August 2007, pp. 2590 - 2606.
Crabtree C., Zappala D. & Tavner P., (2014), Survey of
Commercially Available Condition Monitoring Systems
for Wind Turbines, Technical Report, Durham
University School of Engineering and Computing
Sciences and the SUPERGEN Wind Energy
Technologies Consortium.
Decker H., & Zakrajsek J., (1999), Comparison of
Interpolation Methods as Applied to Time Synchronous
Averaging, NASA/TM – 1999 – 209086, ARL – TR –
1960.
Dempsey, P., (2000), A Comparison of Vibration and Oil
Debris Gear Damage Detection Methods Applied to
Pitting Damage, Proceedings of the 13th International
Congress on Condition Monitoring and Diagnostic
Engineering Management, December 3 - 8, 2000,
Houston, Texas. NASA/TM-2000-210371. Cleveland,
OH: National Aeronautics and Space Administration
(NASA), Glenn Research Center, 2000; 18 pp.
Dempsey P., Afjeh A., (2002), Integrating Oil Debris and
Vibration Gear Damage Detection Technologies Using
Fuzzy Logic, International 58th
Annual Forum and
Technology Display, Quebec (Canada), Junda 11 – 13,
2002.
Felten, D., 2003, Understanding bearing vibration
frequencies, Mechanical Field Service Department,
L&S Electric, Inc., Schofield, Wisconsin, pp. 1 – 3.
Germanischer Lloyd. (2007), Guidelines for the
Certification of Condition Monitoring Systems for
Wind Turbines, Hamburg, Germany, 2007.
Hochmann, D. & Sadok, M. (2004), Theory of Synchronous
Averaging, Proceedings of the 2004 IEEE Aerospace
Conference, March 6 - 13, 2004, Big Sky, Montana.
Washington, DC: IEEE, 2004; pp. 3636 - 3653.
ANNUAL CONFERENCE OF THE PROGNOSTICS AND HEALTH MANAGEMENT SOCIETY 2014
12
Jardine, A.K.S., Lin D., & Banjevic D., (2006), A Review
on Mahinery Diagnostics and Prognostics
Implementing Condition-based Maintenance,
Mechanical Systems and Signal Processing, Vol. 20,
pp. 1483 – 1510.
LaCava, W., van Dam, Jeroen., McNiff, B., Sheng, S.,
Wallen, R., McDade, M., Lambert, S., & Butterfield, S.,
(2011), Gearbox Reliability Collaborative Project
Report: Findings from Phase 1 and Phase 2 Testing.
NREL/TP-5000-51885. Golden, CO: National
Renewable Energy Laboratory, June 2011.
Lebold, M., McClintic K., Campbell, R., Byington C., &
Maynard K. (2000), Review of Vibration Analysis
Methods For Gearbox Diagnostics and Prognostics,
Proceedings of the 54th
meeting of the Society for
Machine Failure Technology, Virginia Beach, VA,
May 1 – 4, 2000, pp. 623 – 634.
Mba, D. and Rao, R., (2006), Development Of Acoustic
Emission Technology For Condition Monitoring And
Diagnosis Of Rotating Machines; Bearings, Pumps,
Gearboxes, Engines And Rotating Structures, The
Shock and Vibration Digest, Vol. 38, No. 1, pp. 3 – 16.
McFadden P.D., (1986), Detecting Fatigue Cracks in Gears
by Amplitude and Phase Modulation Of The Meshing
Vibration, ASME Journal of Vibration, Acoustics,
Stress, and Reliability in Design, Vol. 108, pp. 165 -
170.
McFadden, P.D., (1987), A Revised Model For The
Extraction Of Periodic Waveforms By Time Domain
Averaging, Mechanical Systems and Signal Processing,
Vol. 1, No. 1, pp. 83 – 95.
McFadden, P.D., (1991), A Technique For Calculating The
Time Domain Averages Of The Vibration Of The
Individual Planet Gears And The Sun Gear In An
Epicyclic Gearbox, Journal of Sound and Vibration,
Vol. 144, No. 1, pp. 163 – 172.
McFadden, P.D.; Smith, J.D., (1984), Vibration Monitoring
of Rolling Element Bearings by the High-Frequency
Resonance Technique - A Review, Tribology
International, Vol. 17, No. 1, pp. 3 - 10.
McFadden, P., & Smith, J. (1985), A Signal Processing
Technique for Detecting Local Defects in a Gear from a
Signal Average of the Vibration., Proceedings of the
Institution of Mechanical Engineers, Part C: Journal of
Mechanical Engineering Science, Vol. 199, No. 4,
1985; pp. 287 - 292.
McFadden, P. D. and Toozhy, M. M., (2000), Application
Of Synchronous Averaging To Vibration Monitoring
Of Rolling Element Bearings, Mechanical Systems and
Signal Processing, Vol. 14, No. 6, pp. 891 – 906.
Randall, R.B., (2011), Vibration-based Condition
Monitoring: Industrial, Aerospace and Automotive
Applications, Wiley Publication, ISBN-13: 978-
0470747858, ISBN-10: 0470747854
Randall, R.B., Antoni, J., (2011), Rolling Element Bearing
Diagnostics-A Tutorial, Mechanical Systems and Signal
Processing, Vol. 25, No. 2, 2011; pp. 485 - 520.
Sawalhi N., Randall R., & Forrester D., (2012), Techniques
for Separation and Enhancement of Various
Components in the Analysis of Wind Turbine Vibration
Signals, Wind Turbine Gearbox Condition Monitoring
Round Robin Study – Vibration Analysis, Technical
Report, NREL/TP-5000-54530, July 2012, contract no.
DE-AC36-08GO28308.
Sharma S. & Mahto D., (2013), Condition Monitoring of
Wind Turbines: A Review, International Journal of
Scientific Engineering Research, Vol. 4, Issue 8, PP. 35
– 50, August, 2013, ISSN 2229 – 5518.
Sheldon J., Watson M., Mott G. & Lee H., (2012),
Combining Novel Approaches with Proven Algorithms
for Robust Wind Turbine Gearbox Fault Detection,
Wind Turbine Gearbox Condition Monitoring Round
Robin Study – Vibration Analysis, Technical Report,
NREL/TP-5000-54530, July 2012, contract no. DE-
AC36-08GO28308
Sheng, S. (2012). Wind Turbine Gearbox Condition
Monitoring Round Robin Study – Vibration Analysis,
Technical Report, NREL/TP-5000-54530, July 2012,
contract no. DE-AC36-08GO28308
Sheng, S. (2011), Investigation of Various Condition
Monitoring Techniques Based on a Damaged Wind
Turbine Gearbox., Proceedings of the 8th International
Workshop on Structural Health Monitoring, 13-15
September 2011, Stanford, CA. NREL/CP-5000-51753.
Golden, CO: National Renewable Energy Laboratory,
2011.
Siegel D., Lee J., & Dempsey P., (2014), Investigation and
Evaluation of Condition Indicators, Variable Selection,
and Health Indication Method and Algorithms for
Rotorcraft Gear Components, Proceedings of the
Machine Failure Prevention Technology Conference
2014, Virginia Beach, VA, May 20 – 22.
Siegel D., Zhao W., Lapira E., AbuAli M., & Lee J., (2012),
Review and Application of Methods and Algorithms in
Wind Turbine Gearbox Fault Detection, Wind Turbine
Gearbox Condition Monitoring Round Robin Study –
Vibration Analysis, Technical Report, NREL/TP-5000-
54530, July 2012, contract no. DE-AC36-08GO28308.
Spectra Quest Tech Note. (2006), Analyzing Gearbox
Degradation Using Time-Frequency Signature
Analysis, March, 2006.
Vecer, P., Kreidl, M., &Smid, R. (2005), Condition
Indicators for Gearbox Condition Monitoring Systems.
ACTA Polytechnica. Vol. 45, No. 6, pp. 35 – 43.
BIOGRAPHIES
Junda Zhu received his B.S. degree in Mechanical
Engineering from Northeastern University, Shenyang,

ANNUAL CONFERENCE OF THE PROGNOSTICS AND HEALTH MANAGEMENT SOCIETY 2014
13
China, and M.S. degree in Mechanical Engineering from
The University of Illinois at Chicago in 2009, and Ph.D.
degree in Industrial Engineering and Operational Research
from The University of Illinois at Chicago in 2013. Dr.
Junda Zhu is a Systems Engineer in the Turbine Health
Monitoring Group in Renewable NRG Systems. His current
research interests include rotational machinery health
monitoring, diagnosis and prognosis with vibration or
acoustic emission based signal processing techniques,
lubrication oil condition monitoring and degradation
simulation and analysis, physics/data driven based machine
failure modeling.
Tom Nostrand received his BS in Engineering from the
University of New Hampshire. He is currently an
Engineering Manager at Renewable NRG Systems, Turbine
Products Group. He has been working in the wind power
industry for 6 years. Prior to this he spent 20 years in the
aerospace electronics field working on many different
commercial aircraft platforms and systems.
Cody Spiegel received his B.S. in Mechanical Engineering
from The University of Vermont in 2013. He began a
mechanical engineering internship at Renewable NRG
Systems in 2011 and is now an Associate Mechanical
Engineer working in the Turbine Health Monitoring Group.
His current work includes condition monitoring diagnostics
and support as well as R&D of new condition monitoring
systems.
Brogan Morton received his B.S. and M.S. in Mechanical
Engineering from The University of New Hampshire in
2000 and 2002 major in estimation and controls. He
received MBA from the Idaho State University major in
technology development and deployment. Brogan is
currently the product manager for the TurbinePHD
condition monitoring system in Renewable NRG Systems.
He is responsible for the full product life cycle of several
technologically advanced products in the wind energy
industry.