survey of consumer finances - federal reserve system
TRANSCRIPT

Changes in U.S. Family Financesfrom 2004 to 2007: Evidence from theSurvey of Consumer Finances(Errata paragraph added on March 6, 2009; see p. A56)
Brian K. Bucks, Arthur B. Kennickell, Traci L. Mach,
and Kevin B. Moore, of the Board’s Division of
Research and Statistics, prepared this article with
assistance from Gerhard Fries, Daniel J. Grodzicki,
and Richard A. Windle.
The Federal Reserve Board’s Survey of ConsumerFinances for 2007 provides insights into changes infamily income and net worth since the 2004 survey.1
The survey shows that, over the 2004–07 period, themedian value of real (inflation-adjusted) family in-come before taxes was little changed; median incomehad grown slightly in the preceding three-year period(figure 1). Across most demographic groups, thepattern of change was mixed, but a few changes standout: Income increased markedly for Hispanic ornonwhite families, while it declined substantially forfamilies living in the Northeast or the Midwest andfor families headed by a person who was retired orotherwise not working. In contrast to median income,mean income in the recent period climbed 8.5 per-cent, and the increases were spread broadly acrossdemographic groups. The increases were most strik-ing for families in the top 10 percent of the distribu-tion of net worth and for families headed by a singleparent, a person who was self-employed, or a personwho was aged 65 to 74. Over the preceding threeyears, mean income had declined broadly. Differ-ences in the rates of change in the median and meansignal a change in the distribution of income.
Unlike family income over the 2004–07 period,both median and mean net worth increased; themedian rose 17.7 percent, and the mean rose 13.0 per-cent (figure 2). The increases were fairly broadlyspread, but with a number of noteworthy exceptions,some of which entailed changes in medians and
means within demographic groups that differed sub-stantially, either in terms of relative magnitude or inthe direction of change. Median and mean net worthfor the lowest 25 percent of the distribution of networth plunged 36.8 percent and 43.8 percent, respec-tively; median net worth for the lowest 20 percent ofthe distribution of income fell 1.2 percent, but themean rose 31.8 percent. Percentage increases in
1. For a detailed discussion of the 2001 and 2004 surveys as well asreferences to earlier surveys, see Brian K. Bucks, Arthur B. Kennick-ell, and Kevin B. Moore (2006), ‘‘Recent Changes in U.S. FamilyFinances: Evidence from the 2001 and 2004 Survey of ConsumerFinances,’’ Federal Reserve Bulletin, vol. 92, pp. A1–A38,www.federalreserve.gov/pubs/bulletin/default.htm.
A1
February 2009

median and mean net worth were similar for whitenon-Hispanic families, while the increase in themedian for nonwhite or Hispanic families was onlyabout one-fifth of that for other families, and theincrease in the mean was nearly three times the sizeof that for other families. Relative to other regions,both the Northeast and the Midwest saw sizabledeclines in median net worth. The clearest gains inboth median and mean net worth were for high-net-worth families, high-income families, families headedby a person aged 65 or older, and families headed by aperson who worked for someone else or who workedin a technical, sales, or service occupation. In thepreceding three years, median net worth had increasedonly slightly (1.0 percent), while the mean had risenmore strongly (6.0 percent); over that time, the datahad shown a more complex pattern of mixed increasesand decreases in wealth.
Unrealized capital gains were a particularly impor-tant factor in the increase in net worth over the2004–07 period. The share of total assets attributableto unrealized capital gains from real estate, busi-nesses, stocks, or mutual funds rose 5.1 percentagepoints, to 35.8 percent in 2007. Although the level ofdebt owed by families rose noticeably, debt as apercentage of assets was little changed. The largestpercentage change in debt was in borrowing forresidential real estate other than a primary residence.
With median and mean debt advancing faster thanincome, payments relative to income might be ex-pected to increase substantially. In fact, total pay-ments relative to total income barely increased, andthe median of payments relative to income rose at aslower pace than it did between 2001 and 2004.Nonetheless, the share of families with high paymentsrelative to their incomes increased notably.
This article reviews these and other changes in thefinancial condition of U.S. families between 2004 and2007.2 The discussion draws on data from the FederalReserve Board’s Survey of Consumer Finances (SCF)for those years; it also uses evidence from earlieryears of the survey to place the 2004–07 changes in abroader context.
ECONOMIC BACKGROUND
Families’ finances are affected by both their owndecisions and the state of the broader economy. Overthe 2004–07 period, real gross domestic product(GDP) increased, on average, about 2.5 percent per
year. However, toward the end of 2007, the pace ofeconomic activity slowed noticeably. The unemploy-ment rate stood at 5.5 percent in mid-2004, fell to4.5 percent by late 2006, and then increased to5.0 percent at the end of 2007. The rate of inflation, asmeasured by the consumer price index for all urbanconsumers (CPI-U-RS), increased somewhat over theperiod, from an annual average of 2.7 percent in 2004to 2.9 percent in 2007; the increase was driven, inpart, by the escalation of food and energy prices.
Developments in financial markets over the three-year period were varied. The major stock marketindexes climbed over most of the period beforebeginning a decline in late 2007; from September2004 to September 2007, the Wilshire 5000 indexrose 41.7 percent. Interest rates on new consumerloans generally increased; for example, the interestrate on a new 30-year fixed-rate mortgage averaged5.75 percent in September 2004, when about one-halfof the interviews for the 2004 survey had beencompleted, and was 6.38 percent three years later.Yields also rose on liquid deposits, time deposits, andbonds; for example, the rate on a three-month certifi-cate of deposit rose from an average of 1.86 percentin September 2004 to 5.46 percent in September2007.
The national purchase-only LoanPerformanceHome Price Index, produced by First American Core-Logic, increased more than 12.4 percent betweenSeptember 2004 and September 2007. Price increasesvaried sharply across areas of the country. The largestincrease in the index was a 49.9 percent rise forHawaii. While most states saw an increase, the indexdeclined 8.0 percent for Michigan and by smalleramounts for Ohio, Rhode Island, and Massachusetts.Homeownership rates were little changed over theperiod after a long and steady increase. Nonetheless,the number of homeowners rose with populationgrowth, and subprime mortgages are generally thoughtto have played an important part in financing homepurchases.
No major tax legislation was passed during theperiod, but other important institutional changesoccurred. The Bankruptcy Abuse Prevention and Con-sumer Protection Act of April 2005 altered the rulesfor liquidation of consumers’ liabilities under bank-ruptcy. In particular, the new rules require that con-sumers with a certain level of income pay back atleast part of their outstanding debts, whereas in thepast the entire amount might have been liquidated.The law also mandated financial counseling for any-one declaring bankruptcy. Continuing innovation infinancial markets over the period supported further
2. See box ‘‘The Data Used in This Article’’ for a general descrip-tion of the data. The appendix to this article provides a summary ofkey technical aspects of the survey. See also Bucks, Kennickell, andMoore, ‘‘Recent Changes in U.S. Family Finances.’’
A2 Federal Reserve Bulletin h February 2009
proliferation of hedge funds and other sophisticatedinstruments for money management.
Several demographic shifts had important conse-quences for the structure of the population. The agingof the baby-boom population from 2004 to 2007drove a 12.5 percent increase in the population aged55 to 64. Overall population growth was about2.9 percent, and, according to figures from the U.S.Census Bureau, 37.3 percent of that growth was dueto net immigration. Also according to Census Bureauestimates, the number of households increased 2.3 per-cent—about the same pace as in the 2001–04 period—and the average number of persons per householdrose slightly, from 2.59 people in 2004 to 2.61 in2007.
Only a small fraction of the 2007 SCF interviewstook place in 2008. Thus, the survey data are largelyunaffected by the declines in economic activity in2008, the fall in the market price of corporate equi-ties, and the continued slide in house prices. Nonethe-less, readers’ views of the survey results may becolored by the knowledge that, in the first threequarters of 2008, a broad measure of the value ofcorporate equities declined more than one-third, andhouse prices overall declined approximately an addi-tional 5 percent. At a few places in the article, anattempt is made to gauge the first-order effects ofthese changes on families’ finances.
INCOME
The change in real before-tax family income between2004 and 2007 diverged from the pattern seen in thepreceding three-year period.3 While median incomedeclined slightly over the more recent period, themean rose 8.5 percent (table 1).4 Over the preceding
three-year period, the median had increased 1.7 per-cent, and the mean had declined 2.3 percent. Thechanges for both periods stand in much strongercontrast to a pattern of substantial increases in boththe median and the mean dating to the early 1990s.
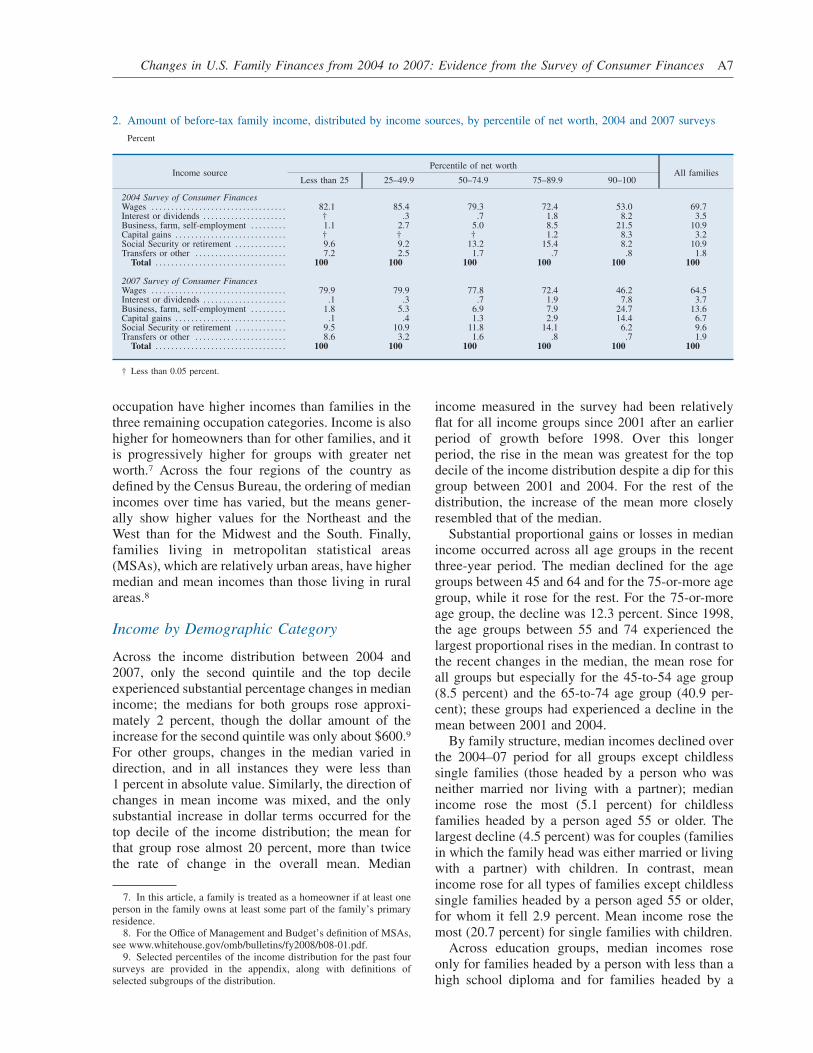
Underlying the recent change was a shift in thecomposition of income between 2004 and 2007(table 2). The share of family income attributable towages and salaries fell 5.2 percentage points over theperiod, which approximately balanced a 3.5 percent-age point rise in the share of realized capital gains anda 2.7 percentage point increase in income fromself-employment, a farm, or a business. These shiftswere seen across all wealth groups except the groupbetween the 75th and 90th percentiles. As may beseen across the years shown in the table, wage incometends to be a smaller factor for the highest wealthgroup.
Some patterns of income distribution hold gener-ally across the years of SCF data shown in table 1.5
Across age classes, median and mean incomes show alife-cycle pattern, rising to a peak in the middle agegroups and then declining for groups that are olderand increasingly more likely to be retired. Couplestend to have higher incomes than single persons, inpart because couples have more potential wage earn-ers. Income also shows a strong positive associationwith education; in particular, incomes for familiesheaded by a person who has a college degree aresubstantially higher than for those with any lesseramount of schooling. Incomes of white non-Hispanicfamilies are substantially higher than those of otherfamilies.6 Families headed by a self-employed workerconsistently have the highest median and meanincomes of all work-status groups. Families headedby a person in a managerial or professional
3. To measure income, the interviewers request information on thefamily’s cash income, before taxes, for the full calendar year preced-ing the survey. The components of income in the SCF are wages;self-employment and business income; taxable and tax-exempt inter-est; dividends; realized capital gains; food stamps and other, relatedsupport programs provided by government; pensions and withdrawalsfrom retirement accounts; Social Security; alimony and other supportpayments; and miscellaneous sources of income for all members of theprimary economic unit in the household.
4. Over the 2004–07 period, estimates of inflation-adjusted house-hold income for the previous year from the Current Population Survey(CPS) of the Census Bureau show an increase in both the median(1.4 percent) and the mean (2.7 percent). Typically, the SCF shows ahigher level of mean income than does the CPS; for 2007, the SCFyields an estimate of $84,300, while the CPS yields an estimate of$68,400. As discussed in more detail in the appendix, the two surveysdiffer in their definitions of the units of observation and in otheraspects of their methodologies. Most relevant here is the fact that aCPS household can contain more people than a corresponding SCFfamily. If the SCF measure is expanded to include income of house-hold members not included in the SCF definition of a family, themedian rises 2.7 percent (to $49,400) over the three-year period, and
the mean rises 11.0 percent (to $86,900). The substantial difference inmean levels is likely the result of the truncation of large values in theCPS data above a certain amount, which is done with the intent ofminimizing the possibility that participants in that survey might beidentifiable.
5. Tabular information from the survey beyond that presented inthis article is available at www.federalreserve.gov/pubs/oss/oss2/2007/scf2007home.html. This information includes versions of all of thenumbered tables in this article, for all of the surveys from 1989 to 2007where the underlying information is available. Mean values for thedemographic groups reported in this article are also provided. Theestimates of the means, however, are more likely to be affected bysampling error than are the estimates of the medians. In addition, somealternative versions of the tables in this article are given. For thosewho wish to make further alternative calculations, this website pro-vides a utility (‘‘tabling wizard’’) that may be used to computeestimates of customized tables based on the variables analyzed in thisarticle, as well as data files that may be used as inputs to moresophisticated statistical software.
6. See the appendix for a discussion of racial and ethnic identifica-tion in the SCF.
Changes in U.S. Family Finances from 2004 to 2007: Evidence from the Survey of Consumer Finances A3

1. Before-tax family income, percentage of families that saved, and distribution of families, by selected characteristics offamilies, 1998–2007 surveys
Thousands of 2007 dollars except as noted
Family characteristic
1998 2001
Income Percentageof familiesthat saved
Percentageof families
Income Percentageof familiesthat saved
Percentageof familiesMedian Mean Median Mean
All families . . . . . . . . . . . . . . . . . . . . . . . . . 42.6 67.7 55.9 100.0 46.7 79.5 59.2 100.0(1.0) (1.4) (.9) (2.3)
Percentile of incomeLess than 20 . . . . . . . . . . . . . . . . . . . . . . . . 10.5 10.1 32.1 20.0 12.0 11.7 30.0 20.020–39.9 . . . . . . . . . . . . . . . . . . . . . . . . . . . . . 25.8 25.7 45.5 20.0 28.5 28.2 53.4 20.040–59.9 . . . . . . . . . . . . . . . . . . . . . . . . . . . . . 42.6 43.3 56.1 20.0 46.7 47.1 61.3 20.060–79.9 . . . . . . . . . . . . . . . . . . . . . . . . . . . . . 67.8 69.1 67.9 20.0 75.8 76.2 72.0 20.080–89.9 . . . . . . . . . . . . . . . . . . . . . . . . . . . . . 100.6 101.3 73.7 10.0 115.4 114.7 74.9 10.090–100 . . . . . . . . . . . . . . . . . . . . . . . . . . . . . 166.3 279.5 82.0 10.0 198.3 354.1 84.3 10.0
Age of head (years)Less than 35 . . . . . . . . . . . . . . . . . . . . . . . . 34.9 46.0 53.0 23.3 39.1 51.7 52.9 22.735–44 . . . . . . . . . . . . . . . . . . . . . . . . . . . . . . . 53.6 76.4 57.3 23.3 60.1 90.2 62.3 22.345–54 . . . . . . . . . . . . . . . . . . . . . . . . . . . . . . . 64.5 88.9 57.8 19.2 63.7 109.0 61.7 20.655–64 . . . . . . . . . . . . . . . . . . . . . . . . . . . . . . . 49.1 91.4 61.1 12.8 52.9 101.7 62.0 13.265–74 . . . . . . . . . . . . . . . . . . . . . . . . . . . . . . . 31.0 59.5 56.3 11.2 32.5 68.0 61.8 10.775 or more . . . . . . . . . . . . . . . . . . . . . . . . . . 21.3 37.2 48.6 10.2 26.2 43.0 55.5 10.4
Family structureSingle with child(ren) . . . . . . . . . . . . . . . . 25.8 33.6 42.1 6.8 28.4 36.1 47.3 6.0Single, no child, age less than 55 . . . . . 29.7 37.6 48.3 20.4 31.5 43.5 52.5 20.4Single, no child, age 55 or more . . . . . 21.0 33.0 47.8 14.3 19.7 37.9 49.4 13.3Couple with child(ren) . . . . . . . . . . . . . . . 64.5 85.6 62.1 12.3 66.1 98.6 63.3 11.8Couple, no child . . . . . . . . . . . . . . . . . . . . . 61.4 92.0 62.1 46.2 67.1 106.8 65.3 48.5
Education of headNo high school diploma . . . . . . . . . . . . . 19.8 27.6 39.5 16.5 19.8 29.4 38.7 16.0High school diploma . . . . . . . . . . . . . . . . 37.2 47.1 53.7 31.9 39.7 52.4 56.7 31.7Some college . . . . . . . . . . . . . . . . . . . . . . . . 45.2 64.7 56.7 18.5 47.9 64.9 61.7 18.3College degree . . . . . . . . . . . . . . . . . . . . . . 70.0 109.0 65.6 33.2 79.4 136.4 70.0 34.0
Race or ethnicity of respondentWhite non-Hispanic . . . . . . . . . . . . . . . . . 48.6 75.4 60.0 76.8 52.9 90.0 63.1 75.4Nonwhite or Hispanic . . . . . . . . . . . . . . . 29.7 42.3 42.3 23.2 30.1 47.6 47.4 24.6
Current work status of headWorking for someone else . . . . . . . . . . . 51.6 68.2 59.8 59.2 55.3 78.8 61.6 60.9Self-employed . . . . . . . . . . . . . . . . . . . . . . . 67.1 139.2 61.1 11.3 74.1 161.8 70.4 11.7Retired . . . . . . . . . . . . . . . . . . . . . . . . . . . . . . 24.5 42.0 48.7 24.4 24.6 46.8 50.6 22.9Other not working . . . . . . . . . . . . . . . . . . . 14.8 27.7 33.3 5.1 19.3 42.6 42.3 4.5
Current occupation of headManagerial or professional . . . . . . . . . . . 77.5 123.1 68.4 24.2 83.2 146.4 72.4 27.1Technical, sales, or services . . . . . . . . . . 39.1 59.7 55.6 21.0 42.1 62.3 58.2 23.7Other occupation . . . . . . . . . . . . . . . . . . . . 47.8 54.2 55.6 25.3 48.1 57.3 56.6 21.8Retired or other not working . . . . . . . . . 22.6 39.7 46.1 29.5 24.2 46.1 49.2 27.4
RegionNortheast . . . . . . . . . . . . . . . . . . . . . . . . . . . 45.2 77.6 53.5 19.3 48.3 90.9 58.1 19.0Midwest . . . . . . . . . . . . . . . . . . . . . . . . . . . . 41.9 62.4 58.3 23.6 51.3 75.7 63.0 23.0South . . . . . . . . . . . . . . . . . . . . . . . . . . . . . . . 40.2 63.0 55.0 35.7 42.1 71.8 57.3 36.2West . . . . . . . . . . . . . . . . . . . . . . . . . . . . . . . . 46.1 72.7 56.9 21.3 47.6 86.6 59.5 21.8
UrbanicityMetropolitan statistical area (MSA) . . . 45.2 71.9 56.3 85.3 48.1 84.6 59.7 86.2Non-MSA . . . . . . . . . . . . . . . . . . . . . . . . . . . 35.6 43.2 53.6 14.7 35.4 47.9 56.3 13.8
Housing statusOwner . . . . . . . . . . . . . . . . . . . . . . . . . . . . . . 55.7 84.9 62.2 66.2 60.9 99.5 66.7 67.7Renter or other . . . . . . . . . . . . . . . . . . . . . . 25.8 34.0 43.4 33.8 28.9 37.7 43.6 32.3
Percentile of net worthLess than 25 . . . . . . . . . . . . . . . . . . . . . . . . 20.3 25.9 36.3 25.0 23.0 28.1 34.5 25.025–49.9 . . . . . . . . . . . . . . . . . . . . . . . . . . . . . 38.7 43.1 50.3 25.0 40.9 46.2 54.2 25.050–74.9 . . . . . . . . . . . . . . . . . . . . . . . . . . . . . 51.6 59.6 61.8 25.0 59.8 68.9 68.2 25.075–89.9 . . . . . . . . . . . . . . . . . . . . . . . . . . . . . 72.3 86.0 72.0 15.0 81.4 91.9 77.4 15.090–100 . . . . . . . . . . . . . . . . . . . . . . . . . . . . . 112.5 226.6 80.0 10.0 147.9 299.5 84.1 10.0
NOTE: For questions on income, respondents were asked to base their an-swers on the calendar year preceding the interview. For questions on saving,respondents were asked to base their answers on the 12 months preceding theinterview.
Percentage distributions may not sum to 100 because of rounding. Dollarshave been converted to 2007 values with the current-methods consumer price
index for all urban consumers (see box “The Data Used in This Article”). Seethe appendix for details on standard errors (shown in parentheses below thefirst row of data for the means and medians here and in table 4) and for defini-tions of family and family head.
A4 Federal Reserve Bulletin h February 2009
1. Before-tax family income, percentage of families that saved, and distribution of families, by selected characteristics offamilies, 1998–2007 surveys—Continued
Thousands of 2007 dollars except as noted
Family characteristic
2004 2007
Income Percentageof familiesthat saved
Percentageof families
Income Percentageof familiesthat saved
Percentageof familiesMedian Mean Median Mean
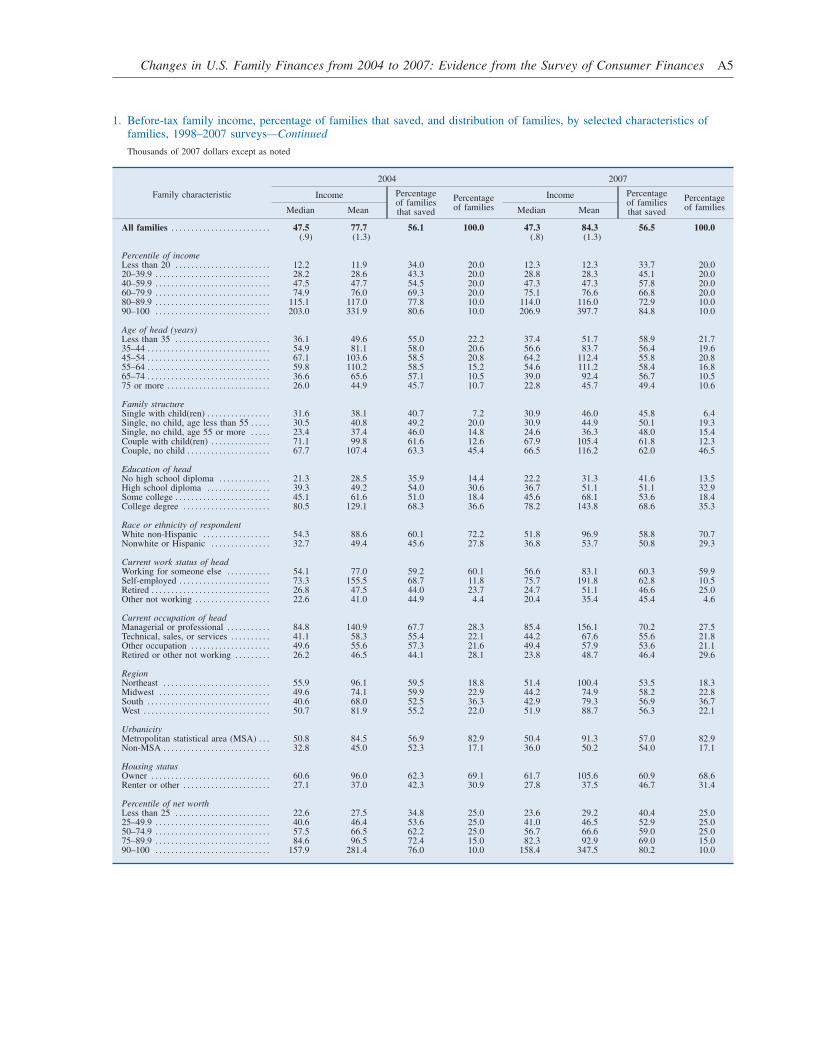
All families . . . . . . . . . . . . . . . . . . . . . . . . . 47.5 77.7 56.1 100.0 47.3 84.3 56.5 100.0(.9) (1.3) (.8) (1.3)
Percentile of incomeLess than 20 . . . . . . . . . . . . . . . . . . . . . . . . 12.2 11.9 34.0 20.0 12.3 12.3 33.7 20.020–39.9 . . . . . . . . . . . . . . . . . . . . . . . . . . . . . 28.2 28.6 43.3 20.0 28.8 28.3 45.1 20.040–59.9 . . . . . . . . . . . . . . . . . . . . . . . . . . . . . 47.5 47.7 54.5 20.0 47.3 47.3 57.8 20.060–79.9 . . . . . . . . . . . . . . . . . . . . . . . . . . . . . 74.9 76.0 69.3 20.0 75.1 76.6 66.8 20.080–89.9 . . . . . . . . . . . . . . . . . . . . . . . . . . . . . 115.1 117.0 77.8 10.0 114.0 116.0 72.9 10.090–100 . . . . . . . . . . . . . . . . . . . . . . . . . . . . . 203.0 331.9 80.6 10.0 206.9 397.7 84.8 10.0
Age of head (years)Less than 35 . . . . . . . . . . . . . . . . . . . . . . . . 36.1 49.6 55.0 22.2 37.4 51.7 58.9 21.735–44 . . . . . . . . . . . . . . . . . . . . . . . . . . . . . . . 54.9 81.1 58.0 20.6 56.6 83.7 56.4 19.645–54 . . . . . . . . . . . . . . . . . . . . . . . . . . . . . . . 67.1 103.6 58.5 20.8 64.2 112.4 55.8 20.855–64 . . . . . . . . . . . . . . . . . . . . . . . . . . . . . . . 59.8 110.2 58.5 15.2 54.6 111.2 58.4 16.865–74 . . . . . . . . . . . . . . . . . . . . . . . . . . . . . . . 36.6 65.6 57.1 10.5 39.0 92.4 56.7 10.575 or more . . . . . . . . . . . . . . . . . . . . . . . . . . 26.0 44.9 45.7 10.7 22.8 45.7 49.4 10.6
Family structureSingle with child(ren) . . . . . . . . . . . . . . . . 31.6 38.1 40.7 7.2 30.9 46.0 45.8 6.4Single, no child, age less than 55 . . . . . 30.5 40.8 49.2 20.0 30.9 44.9 50.1 19.3Single, no child, age 55 or more . . . . . 23.4 37.4 46.0 14.8 24.6 36.3 48.0 15.4Couple with child(ren) . . . . . . . . . . . . . . . 71.1 99.8 61.6 12.6 67.9 105.4 61.8 12.3Couple, no child . . . . . . . . . . . . . . . . . . . . . 67.7 107.4 63.3 45.4 66.5 116.2 62.0 46.5
Education of headNo high school diploma . . . . . . . . . . . . . 21.3 28.5 35.9 14.4 22.2 31.3 41.6 13.5High school diploma . . . . . . . . . . . . . . . . 39.3 49.2 54.0 30.6 36.7 51.1 51.1 32.9Some college . . . . . . . . . . . . . . . . . . . . . . . . 45.1 61.6 51.0 18.4 45.6 68.1 53.6 18.4College degree . . . . . . . . . . . . . . . . . . . . . . 80.5 129.1 68.3 36.6 78.2 143.8 68.6 35.3
Race or ethnicity of respondentWhite non-Hispanic . . . . . . . . . . . . . . . . . 54.3 88.6 60.1 72.2 51.8 96.9 58.8 70.7Nonwhite or Hispanic . . . . . . . . . . . . . . . 32.7 49.4 45.6 27.8 36.8 53.7 50.8 29.3
Current work status of headWorking for someone else . . . . . . . . . . . 54.1 77.0 59.2 60.1 56.6 83.1 60.3 59.9Self-employed . . . . . . . . . . . . . . . . . . . . . . . 73.3 155.5 68.7 11.8 75.7 191.8 62.8 10.5Retired . . . . . . . . . . . . . . . . . . . . . . . . . . . . . . 26.8 47.5 44.0 23.7 24.7 51.1 46.6 25.0Other not working . . . . . . . . . . . . . . . . . . . 22.6 41.0 44.9 4.4 20.4 35.4 45.4 4.6
Current occupation of headManagerial or professional . . . . . . . . . . . 84.8 140.9 67.7 28.3 85.4 156.1 70.2 27.5Technical, sales, or services . . . . . . . . . . 41.1 58.3 55.4 22.1 44.2 67.6 55.6 21.8Other occupation . . . . . . . . . . . . . . . . . . . . 49.6 55.6 57.3 21.6 49.4 57.9 53.6 21.1Retired or other not working . . . . . . . . . 26.2 46.5 44.1 28.1 23.8 48.7 46.4 29.6
RegionNortheast . . . . . . . . . . . . . . . . . . . . . . . . . . . 55.9 96.1 59.5 18.8 51.4 100.4 53.5 18.3Midwest . . . . . . . . . . . . . . . . . . . . . . . . . . . . 49.6 74.1 59.9 22.9 44.2 74.9 58.2 22.8South . . . . . . . . . . . . . . . . . . . . . . . . . . . . . . . 40.6 68.0 52.5 36.3 42.9 79.3 56.9 36.7West . . . . . . . . . . . . . . . . . . . . . . . . . . . . . . . . 50.7 81.9 55.2 22.0 51.9 88.7 56.3 22.1
UrbanicityMetropolitan statistical area (MSA) . . . 50.8 84.5 56.9 82.9 50.4 91.3 57.0 82.9Non-MSA . . . . . . . . . . . . . . . . . . . . . . . . . . . 32.8 45.0 52.3 17.1 36.0 50.2 54.0 17.1
Housing statusOwner . . . . . . . . . . . . . . . . . . . . . . . . . . . . . . 60.6 96.0 62.3 69.1 61.7 105.6 60.9 68.6Renter or other . . . . . . . . . . . . . . . . . . . . . . 27.1 37.0 42.3 30.9 27.8 37.5 46.7 31.4
Percentile of net worthLess than 25 . . . . . . . . . . . . . . . . . . . . . . . . 22.6 27.5 34.8 25.0 23.6 29.2 40.4 25.025–49.9 . . . . . . . . . . . . . . . . . . . . . . . . . . . . . 40.6 46.4 53.6 25.0 41.0 46.5 52.9 25.050–74.9 . . . . . . . . . . . . . . . . . . . . . . . . . . . . . 57.5 66.5 62.2 25.0 56.7 66.6 59.0 25.075–89.9 . . . . . . . . . . . . . . . . . . . . . . . . . . . . . 84.6 96.5 72.4 15.0 82.3 92.9 69.0 15.090–100 . . . . . . . . . . . . . . . . . . . . . . . . . . . . . 157.9 281.4 76.0 10.0 158.4 347.5 80.2 10.0
Changes in U.S. Family Finances from 2004 to 2007: Evidence from the Survey of Consumer Finances A5
The Data Used in This Article
Data from the Survey of Consumer Finances (SCF) are
the basis of the analysis presented in this article. The SCF
is a triennial interview survey of U.S. families sponsored
by the Board of Governors of the Federal Reserve System
with the cooperation of the U.S. Department of the
Treasury. Since 1992, data for the SCF have been col-
lected by NORC, a research organization at the Univer-
sity of Chicago, roughly between May and December of
each survey year.
The majority of statistics included in this article are
related to characteristics of ‘‘families.’’ As used here, this
term is more comparable with the U.S. Census Bureau
definition of ‘‘households’’ than with its use of ‘‘fami-
lies,’’ which excludes the possibility of one-person fami-
lies. The appendix provides full definitions of ‘‘family’’
for the SCF and the associated family ‘‘head.’’ The survey
collects information on families’ total income before
taxes for the calendar year preceding the survey. But the
bulk of the data cover the status of families as of the time
of the interview, including detailed information on their
balance sheets and use of financial services as well as on
their pensions, labor force participation, and demographic
characteristics. Except in a small number of instances
(see the appendix and the text for details), the survey
questionnaire has changed in only minor ways relevant to
this article since 1989, and every effort has been made to
ensure the maximum degree of comparability of the data
over time.
The need to measure financial characteristics imposes
special requirements on the sample design for the survey.
The SCF is expected to provide reliable information both
on attributes that are broadly distributed in the population
(such as homeownership) and on those that are highly
concentrated in a relatively small part of the population
(such as closely held businesses). To address this require-
ment, the SCF employs a sample design, essentially
unchanged since 1989, consisting of two parts: a stan-
dard, geographically based random sample and a special
oversample of relatively wealthy families. Weights are
used to combine information from the two samples to
make estimates for the full population. In the 2007
survey, 4,422 families were interviewed, and in the 2004
survey, 4,522 were interviewed.
This article draws principally upon the final data from
the 2007 and 2004 surveys. To provide a larger context,
some information is also included from the final versions
of earlier surveys.1 Differences between estimates from
earlier surveys as reported here and as reported in earlier
Federal Reserve Bulletin articles are attributable to addi-
tional statistical processing, correction of minor data
errors, revisions to the survey weights, conceptual changes
in the definitions of variables used in the articles, and
adjustments for inflation. In this article, all dollar amounts
from the SCF are adjusted to 2007 dollars using the
‘‘current methods’’ version of the consumer price index for
all urban consumers (CPI-U-RS). The appendix provides
additional detail on the adjustments.
The principal detailed tables describing asset and debt
holdings focus on the percentage of various groups that
have such items and the median holding for those that
have them.2 This conditional median is chosen to give a
sense of the ‘‘typical’’ holding. Generally, when one deals
with data that exhibit very large values for a relatively
small part of the population—as is the case for many of the
items considered in this article—estimates of the median
are often statistically less sensitive to such outliers than are
estimates of the mean.
One liability of using the median as a descriptive device
is that medians are not additive; that is, the sum of the
medians of two items for the same population is not
generally equal to the median of the sum (for example,
median assets less median liabilities does not equal median
net worth). In contrast, means for a common population are
additive. Where a comparable median and mean are given,
the gain of the mean relative to the median may usually be
taken as indicative of relatively greater change at the top of
the distribution; for example, when the mean increases
more rapidly than the median, it is typically taken to
indicate that the values in the top of the distribution rose
more rapidly than those in the lower part of the distribution.
To provide a measure of the significance of the develop-
ments discussed in this article, standard errors due to
sampling and imputation for missing data are given for
selected estimates. Space limits prevent the inclusion of the
standard errors for all estimates. Although we do not
directly address the statistical significance of the results, the
article highlights findings that are significant or are inter-
esting in a broader context.
1. Additional information about the survey is available atwww.federalreserve.gov/pubs/oss/oss2/2007/scf2007home.html.
2. The median of a distribution is defined as the value at which equal partsof the population considered have values larger or smaller.
A6 Federal Reserve Bulletin h February 2009
occupation have higher incomes than families in thethree remaining occupation categories. Income is alsohigher for homeowners than for other families, and itis progressively higher for groups with greater networth.7 Across the four regions of the country asdefined by the Census Bureau, the ordering of medianincomes over time has varied, but the means gener-ally show higher values for the Northeast and theWest than for the Midwest and the South. Finally,families living in metropolitan statistical areas(MSAs), which are relatively urban areas, have highermedian and mean incomes than those living in ruralareas.8
Income by Demographic Category
Across the income distribution between 2004 and2007, only the second quintile and the top decileexperienced substantial percentage changes in medianincome; the medians for both groups rose approxi-mately 2 percent, though the dollar amount of theincrease for the second quintile was only about $600.9
For other groups, changes in the median varied indirection, and in all instances they were less than1 percent in absolute value. Similarly, the direction ofchanges in mean income was mixed, and the onlysubstantial increase in dollar terms occurred for thetop decile of the income distribution; the mean forthat group rose almost 20 percent, more than twicethe rate of change in the overall mean. Median
income measured in the survey had been relativelyflat for all income groups since 2001 after an earlierperiod of growth before 1998. Over this longerperiod, the rise in the mean was greatest for the topdecile of the income distribution despite a dip for thisgroup between 2001 and 2004. For the rest of thedistribution, the increase of the mean more closelyresembled that of the median.
Substantial proportional gains or losses in medianincome occurred across all age groups in the recentthree-year period. The median declined for the agegroups between 45 and 64 and for the 75-or-more agegroup, while it rose for the rest. For the 75-or-moreage group, the decline was 12.3 percent. Since 1998,the age groups between 55 and 74 experienced thelargest proportional rises in the median. In contrast tothe recent changes in the median, the mean rose forall groups but especially for the 45-to-54 age group(8.5 percent) and the 65-to-74 age group (40.9 per-cent); these groups had experienced a decline in themean between 2001 and 2004.
By family structure, median incomes declined overthe 2004–07 period for all groups except childlesssingle families (those headed by a person who wasneither married nor living with a partner); medianincome rose the most (5.1 percent) for childlessfamilies headed by a person aged 55 or older. Thelargest decline (4.5 percent) was for couples (familiesin which the family head was either married or livingwith a partner) with children. In contrast, meanincome rose for all types of families except childlesssingle families headed by a person aged 55 or older,for whom it fell 2.9 percent. Mean income rose themost (20.7 percent) for single families with children.
Across education groups, median incomes roseonly for families headed by a person with less than ahigh school diploma and for families headed by a
7. In this article, a family is treated as a homeowner if at least oneperson in the family owns at least some part of the family’s primaryresidence.
8. For the Office of Management and Budget’s definition of MSAs,see www.whitehouse.gov/omb/bulletins/fy2008/b08-01.pdf.
9. Selected percentiles of the income distribution for the past foursurveys are provided in the appendix, along with definitions ofselected subgroups of the distribution.
2. Amount of before-tax family income, distributed by income sources, by percentile of net worth, 2004 and 2007 surveys
Percent
Income sourcePercentile of net worth
All familiesLess than 25 25–49.9 50–74.9 75–89.9 90–100
2004 Survey of Consumer FinancesWages . . . . . . . . . . . . . . . . . . . . . . . . . . . . . . . . . . 82.1 85.4 79.3 72.4 53.0 69.7Interest or dividends . . . . . . . . . . . . . . . . . . . . . † .3 .7 1.8 8.2 3.5Business, farm, self-employment . . . . . . . . . 1.1 2.7 5.0 8.5 21.5 10.9Capital gains . . . . . . . . . . . . . . . . . . . . . . . . . . . . † † † 1.2 8.3 3.2Social Security or retirement . . . . . . . . . . . . . 9.6 9.2 13.2 15.4 8.2 10.9Transfers or other . . . . . . . . . . . . . . . . . . . . . . . 7.2 2.5 1.7 .7 .8 1.8
Total . . . . . . . . . . . . . . . . . . . . . . . . . . . . . . . . . 100 100 100 100 100 100
2007 Survey of Consumer FinancesWages . . . . . . . . . . . . . . . . . . . . . . . . . . . . . . . . . . 79.9 79.9 77.8 72.4 46.2 64.5Interest or dividends . . . . . . . . . . . . . . . . . . . . . .1 .3 .7 1.9 7.8 3.7Business, farm, self-employment . . . . . . . . . 1.8 5.3 6.9 7.9 24.7 13.6Capital gains . . . . . . . . . . . . . . . . . . . . . . . . . . . . .1 .4 1.3 2.9 14.4 6.7Social Security or retirement . . . . . . . . . . . . . 9.5 10.9 11.8 14.1 6.2 9.6Transfers or other . . . . . . . . . . . . . . . . . . . . . . . 8.6 3.2 1.6 .8 .7 1.9
Total . . . . . . . . . . . . . . . . . . . . . . . . . . . . . . . . . 100 100 100 100 100 100
† Less than 0.05 percent.
Changes in U.S. Family Finances from 2004 to 2007: Evidence from the Survey of Consumer Finances A7
person with only some college education (who at-tended college but did not receive a degree); theincrease of median income was relatively strong forthe former group—4.2 percent—but that group stillhad the lowest median income of all educationgroups. Mean incomes rose substantially for all edu-cation groups after declines in the preceding three-year period. The increases were particularly pro-nounced for the groups with families headed by aperson with only some college education (10.6 per-cent) or by a person with a college degree (11.4 per-cent).
In the 2004–07 period, the median income forwhite non-Hispanic families fell 4.6 percent, and themean rose 9.4 percent. In contrast, the median fornonwhite or Hispanic families rose 12.5 percent, andthe mean rose 8.7 percent. However, both the medianand the mean values for nonwhites or Hispanics weresubstantially lower than the corresponding figures fornon-Hispanic whites. Since 1998, the total gain inmedian income for nonwhite or Hispanic familieswas 23.9 percent, whereas it was 6.6 percent for otherfamilies; the gain in the mean over this period waslarger and more similar for the two groups—27.0percent for nonwhite or Hispanic families and 28.5 per-cent for other families.10
Median income rose from 2004 to 2007 for fami-lies headed by a person who was working for some-one else (a rise of 4.6 percent) or was self-employed(a rise of 3.3 percent); the median fell for the retiredgroup (7.8 percent) and the other-not-working group(9.7 percent).11 In contrast, the mean over this periodrose for all groups except the other-not-workinggroup, for which it fell 13.7 percent. Of the increasesin the mean, the largest proportional change was the23.3 percent rise for the self-employed group—thegroup with the highest levels of median and meanincome by far. Over the previous three years, median
incomes had risen only for the retired and other-not-working groups, and the mean had risen only for theretired group.
Across occupation groups, median income rosemoderately for families headed by a person workingin a technical, sales, or service job (an increase of7.5 percent), and it fell strongly for families headedby a person who was not working (a decline of9.2 percent). For the other-occupation group, a groupthat predominantly comprises workers in traditionalblue-collar occupations, the median was barelychanged. In contrast, mean income rose for all groups,particularly for families headed by a person in amanagerial or professional position (an increase of10.8 percent) and for those headed by a person in atechnical, sales, or service position (an increase of16.0 percent), the groups with the highest meanincomes in 2007. Since 1998, the only substantialchanges in the median were the increases for themanagerial or professional group and for the techni-cal, sales, or service group. The means for the groupsshowed a general pattern of increase over the periodsince 1998.
By region, median family incomes in the Northeastand the West converged from different directions toabout the same value in 2007, and the medians in theMidwest and the South similarly converged. Themedian increased between 2004 and 2007 for familiesliving in the South and the West, and it fell for others.The 8.1 percent decline for families in the Northeastoffset only about one-half of a steep increase between2001 and 2004. The rise for the West continued theonly uninterrupted trend in the median across regionsfor the period shown. Declines in the median incomein the Midwest since 2001 erased most of the substan-tial gains between 1998 and 2001. In 2007, meanincome was highest in the Northeast, followed by theWest. In 2001, the two had been closer, but growthflattened out for the West, while it continued for theNortheast. The mean incomes in the Midwest and theSouth have been comparable with one another since1998, though the mean for the South increasedstrongly over the recent period while the mean for theMidwest fell back slightly since 2001.
In the recent three-year period, families in MSAssaw a 0.8 percent decline in median income, whilethose living in other areas saw a rise of 9.8 percent.Mean income has shown a general rise for bothgroups since 1998.
By housing status, median and mean incomes roseboth for homeowners and for other families from2004 to 2007. All the increases were modest except
10. As noted in the appendix, the questions underlying the defini-tion of race or ethnicity changed in earlier surveys. When restrictionsare placed on the definition of the variable for racial and ethnicclassification used in the tables in the article to make the series morecomparable over time, the estimates change only slightly.
11. To be included in the retired group, the family head must reportbeing retired and not currently working at any job or report being outof the labor force and over the age of 65. The other-not-working groupcomprises family heads who are unemployed and those who are out ofthe labor force but are neither retired nor over age 65; the compositionof this group shifted from 2004 to 2007 to include fewer families witha head who had a college degree, thereby reversing a change seenbetween 2001 and 2004. In 2007, 66.9 percent of the other-not-working group was unemployed, and the remainder was out of thelabor force; in 2004, 62.2 percent of the group was unemployed (datanot shown in the tables).
A8 Federal Reserve Bulletin h February 2009
the 10.0 percent increase in the mean for homeown-ers. As noted later in this article, homeownershipdeclined slightly in the recent three-year period afterrising for a number of years. Thus, changes in thecomposition of the group are likely to be smaller thanin earlier years. Nonetheless, such changes weresufficient to cause the change in the median for bothgroups to be positive at the same time that the changein the overall median was negative.
By percentile of net worth, median income rosemore than 1 percent over the recent three-year periodonly for the lowest quartile, for which the medianincreased 4.4 percent; the median declined somewhatfor the third quartile and for the group between the75th and 90th percentiles.12 The mean increased overthe period for the lowest quartile (an increase of6.2 percent), but it rose much more strongly (23.5 per-cent) for the top decile. Over the earlier years shownin the table, the most dramatic cumulative gains in themedian were clearly for the top two groups. The meanrose at least somewhat for all groups, but the changewas largest by far for the wealthiest 10 percent.
Income Variability
For a given family, income at a particular time maynot be indicative of its ‘‘usual’’ income. Unemploy-ment, a bonus, a capital loss or gain, or other factorsmay cause income to deviate temporarily from theusual amount. Although the SCF is a cross-sectionalsurvey, it does provide some information on incomevariability. In 2007, 23.7 percent of families reportedthat their income for the preceding year was unusual—9.2 percent reported it was unusually high, and14.5 percent reported it was unusually low (data notshown in the tables). For those reporting unusualincome, the median deviation of actual income fromthe usual amount was negative 17.3 percent of thenormal level. A larger fraction of families in 2004reported that their income was unusual—8.7 percentreported it was unusually high, and 19.8 percentreported it was unusually low.
Although a family’s income may vary, such vari-ability may be a well-recognized part of its financialplanning. In 2007, 31.4 percent of families reportedthat they did not have a good idea of what theirincome would be for the next year, and 27.2 percentreported that they do not even usually have a goodidea of their next year’s income. The figures for 2004were similar.
Saving
Because saving out of current income is an importantdeterminant of family net worth, the SCF asks respon-dents whether, over the preceding year, the family’sspending was less than, more than, or about equal toits income. Though only qualitative, the answers are auseful indicator of whether families are saving. Ask-ing instead for a specific dollar amount would requiremuch more time from respondents and would likelylower the rate of response to the survey.
Overall, from 2004 to 2007, the proportion offamilies that reported that they had saved in thepreceding year was about unchanged at 56.5 percent,a bit higher than the level in 1998 but still lower thanthe 2001 level. The general pattern of changes acrossdemographic groups in the recent three-year period isone of small shifts. The previous survey had shown abroad pattern of declines.
Estimates of the personal saving rate from thenational income and product accounts (NIPA) showan annual saving rate of less than 1 percent over the2004–07 period. However, the SCF and NIPA con-cepts of saving differ in some important ways. First,the underlying SCF question asks only whether thefamily’s spending has been less than, more than, orabout the same as its income over the past year. Thus,families may be saving, but those that are doing somay be saving a relatively small amount; those thatare spending more than their incomes may be spend-ing a relatively large amount. Second, the NIPAmeasure of saving relies on definitions of income andconsumption that may not be the same as those thatrespondents had in mind when answering the surveyquestions. For example, the NIPA measure of per-sonal income includes payments employers make totheir employees’ defined-benefit pension plans butnot the payments made from such plans to families,whereas the SCF measure includes only the latter.The SCF measure also includes realized capital gains,whereas the NIPA measure excludes capital gains ofall forms, realized and unrealized.
A separate question in the survey asks about fami-lies’ more typical saving habits. In 2007, 6.0 percentof families reported that their spending usually ex-ceeds their income; 16.1 percent reported that the twoare usually about the same; 35.7 percent reported thatthey typically save income ‘‘left over’’ at the end ofthe year, income of one family member, or unusualadditional income; and 42.2 percent reported that theysave regularly (data not shown in the tables). The factthat these figures are not much changed over the lastthree surveys suggests that variations in economic
12. Selected percentiles of the distribution of net worth for the pastfour surveys are provided in the appendix.
Changes in U.S. Family Finances from 2004 to 2007: Evidence from the Survey of Consumer Finances A9
conditions over this period have had little effect onthe longer-run saving plans of families.
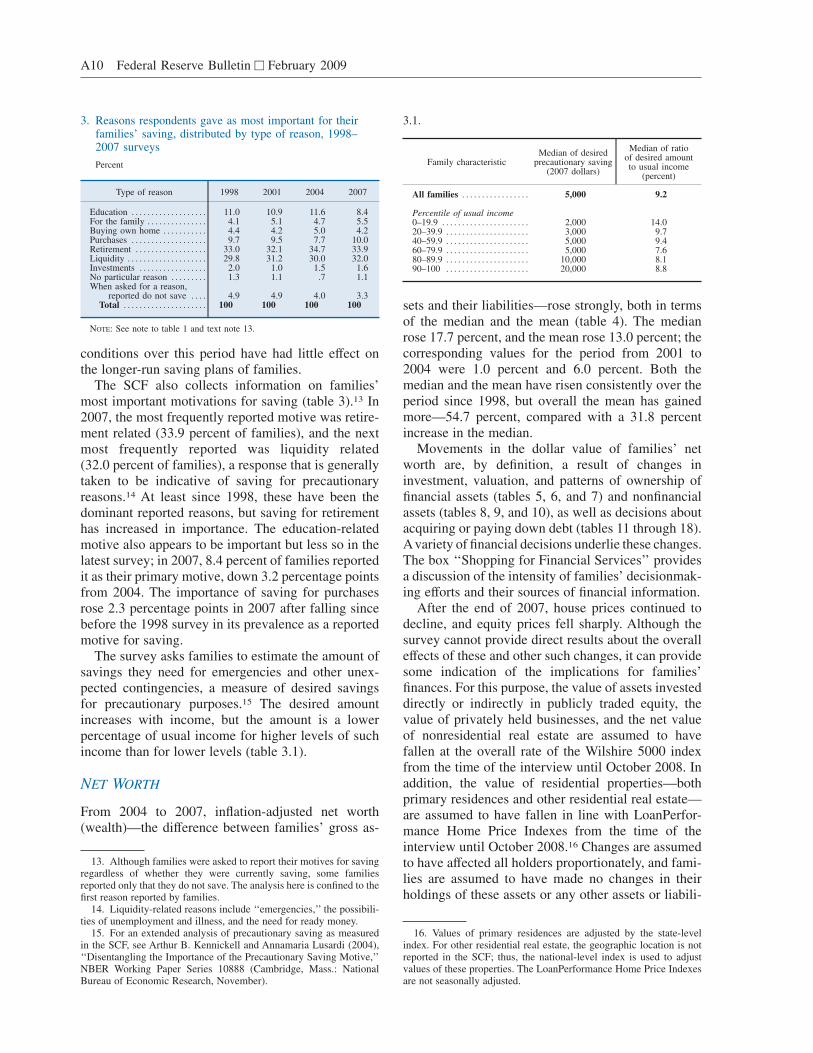
The SCF also collects information on families’most important motivations for saving (table 3).13 In2007, the most frequently reported motive was retire-ment related (33.9 percent of families), and the nextmost frequently reported was liquidity related(32.0 percent of families), a response that is generallytaken to be indicative of saving for precautionaryreasons.14 At least since 1998, these have been thedominant reported reasons, but saving for retirementhas increased in importance. The education-relatedmotive also appears to be important but less so in thelatest survey; in 2007, 8.4 percent of families reportedit as their primary motive, down 3.2 percentage pointsfrom 2004. The importance of saving for purchasesrose 2.3 percentage points in 2007 after falling sincebefore the 1998 survey in its prevalence as a reportedmotive for saving.
The survey asks families to estimate the amount ofsavings they need for emergencies and other unex-pected contingencies, a measure of desired savingsfor precautionary purposes.15 The desired amountincreases with income, but the amount is a lowerpercentage of usual income for higher levels of suchincome than for lower levels (table 3.1).
NET WORTH
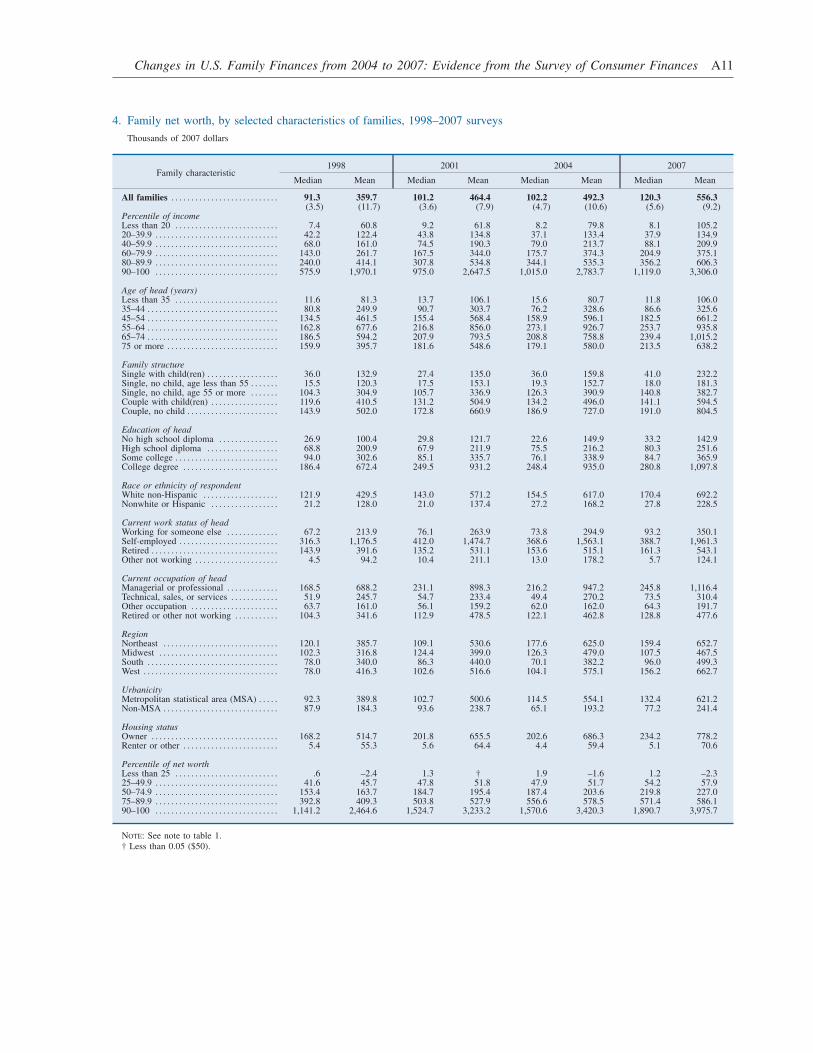
From 2004 to 2007, inflation-adjusted net worth(wealth)—the difference between families’ gross as-
sets and their liabilities—rose strongly, both in termsof the median and the mean (table 4). The medianrose 17.7 percent, and the mean rose 13.0 percent; thecorresponding values for the period from 2001 to2004 were 1.0 percent and 6.0 percent. Both themedian and the mean have risen consistently over theperiod since 1998, but overall the mean has gainedmore—54.7 percent, compared with a 31.8 percentincrease in the median.
Movements in the dollar value of families’ networth are, by definition, a result of changes ininvestment, valuation, and patterns of ownership offinancial assets (tables 5, 6, and 7) and nonfinancialassets (tables 8, 9, and 10), as well as decisions aboutacquiring or paying down debt (tables 11 through 18).Avariety of financial decisions underlie these changes.The box ‘‘Shopping for Financial Services’’ providesa discussion of the intensity of families’ decisionmak-ing efforts and their sources of financial information.
After the end of 2007, house prices continued todecline, and equity prices fell sharply. Although thesurvey cannot provide direct results about the overalleffects of these and other such changes, it can providesome indication of the implications for families’finances. For this purpose, the value of assets investeddirectly or indirectly in publicly traded equity, thevalue of privately held businesses, and the net valueof nonresidential real estate are assumed to havefallen at the overall rate of the Wilshire 5000 indexfrom the time of the interview until October 2008. Inaddition, the value of residential properties—bothprimary residences and other residential real estate—are assumed to have fallen in line with LoanPerfor-mance Home Price Indexes from the time of theinterview until October 2008.16 Changes are assumedto have affected all holders proportionately, and fami-lies are assumed to have made no changes in theirholdings of these assets or any other assets or liabili-
13. Although families were asked to report their motives for savingregardless of whether they were currently saving, some familiesreported only that they do not save. The analysis here is confined to thefirst reason reported by families.
14. Liquidity-related reasons include ‘‘emergencies,’’ the possibili-ties of unemployment and illness, and the need for ready money.
15. For an extended analysis of precautionary saving as measuredin the SCF, see Arthur B. Kennickell and Annamaria Lusardi (2004),‘‘Disentangling the Importance of the Precautionary Saving Motive,’’NBER Working Paper Series 10888 (Cambridge, Mass.: NationalBureau of Economic Research, November).
16. Values of primary residences are adjusted by the state-levelindex. For other residential real estate, the geographic location is notreported in the SCF; thus, the national-level index is used to adjustvalues of these properties. The LoanPerformance Home Price Indexesare not seasonally adjusted.
3. Reasons respondents gave as most important for theirfamilies’ saving, distributed by type of reason, 1998–2007 surveys
Percent
Type of reason 1998 2001 2004 2007
Education . . . . . . . . . . . . . . . . . . . 11.0 10.9 11.6 8.4For the family . . . . . . . . . . . . . . . 4.1 5.1 4.7 5.5Buying own home . . . . . . . . . . . 4.4 4.2 5.0 4.2Purchases . . . . . . . . . . . . . . . . . . . 9.7 9.5 7.7 10.0Retirement . . . . . . . . . . . . . . . . . . 33.0 32.1 34.7 33.9Liquidity . . . . . . . . . . . . . . . . . . . . 29.8 31.2 30.0 32.0Investments . . . . . . . . . . . . . . . . . 2.0 1.0 1.5 1.6No particular reason . . . . . . . . . 1.3 1.1 .7 1.1When asked for a reason,
reported do not save . . . . 4.9 4.9 4.0 3.3Total . . . . . . . . . . . . . . . . . . . . . 100 100 100 100
NOTE: See note to table 1 and text note 13.
3.1.
Family characteristicMedian of desired
precautionary saving(2007 dollars)
Median of ratioof desired amountto usual income
(percent)
All families . . . . . . . . . . . . . . . . . 5,000 9.2
Percentile of usual income0–19.9 . . . . . . . . . . . . . . . . . . . . . . 2,000 14.020–39.9 . . . . . . . . . . . . . . . . . . . . . 3,000 9.740–59.9 . . . . . . . . . . . . . . . . . . . . . 5,000 9.460–79.9 . . . . . . . . . . . . . . . . . . . . . 5,000 7.680–89.9 . . . . . . . . . . . . . . . . . . . . . 10,000 8.190–100 . . . . . . . . . . . . . . . . . . . . . 20,000 8.8
A10 Federal Reserve Bulletin h February 2009
4. Family net worth, by selected characteristics of families, 1998–2007 surveys
Thousands of 2007 dollars
Family characteristic1998 2001 2004 2007
Median Mean Median Mean Median Mean Median Mean
All families . . . . . . . . . . . . . . . . . . . . . . . . . . . 91.3 359.7 101.2 464.4 102.2 492.3 120.3 556.3(3.5) (11.7) (3.6) (7.9) (4.7) (10.6) (5.6) (9.2)
Percentile of incomeLess than 20 . . . . . . . . . . . . . . . . . . . . . . . . . . 7.4 60.8 9.2 61.8 8.2 79.8 8.1 105.220–39.9 . . . . . . . . . . . . . . . . . . . . . . . . . . . . . . . 42.2 122.4 43.8 134.8 37.1 133.4 37.9 134.940–59.9 . . . . . . . . . . . . . . . . . . . . . . . . . . . . . . . 68.0 161.0 74.5 190.3 79.0 213.7 88.1 209.960–79.9 . . . . . . . . . . . . . . . . . . . . . . . . . . . . . . . 143.0 261.7 167.5 344.0 175.7 374.3 204.9 375.180–89.9 . . . . . . . . . . . . . . . . . . . . . . . . . . . . . . . 240.0 414.1 307.8 534.8 344.1 535.3 356.2 606.390–100 . . . . . . . . . . . . . . . . . . . . . . . . . . . . . . . 575.9 1,970.1 975.0 2,647.5 1,015.0 2,783.7 1,119.0 3,306.0
Age of head (years)Less than 35 . . . . . . . . . . . . . . . . . . . . . . . . . . 11.6 81.3 13.7 106.1 15.6 80.7 11.8 106.035–44 . . . . . . . . . . . . . . . . . . . . . . . . . . . . . . . . . 80.8 249.9 90.7 303.7 76.2 328.6 86.6 325.645–54 . . . . . . . . . . . . . . . . . . . . . . . . . . . . . . . . . 134.5 461.5 155.4 568.4 158.9 596.1 182.5 661.255–64 . . . . . . . . . . . . . . . . . . . . . . . . . . . . . . . . . 162.8 677.6 216.8 856.0 273.1 926.7 253.7 935.865–74 . . . . . . . . . . . . . . . . . . . . . . . . . . . . . . . . . 186.5 594.2 207.9 793.5 208.8 758.8 239.4 1,015.275 or more . . . . . . . . . . . . . . . . . . . . . . . . . . . . 159.9 395.7 181.6 548.6 179.1 580.0 213.5 638.2
Family structureSingle with child(ren) . . . . . . . . . . . . . . . . . . 36.0 132.9 27.4 135.0 36.0 159.8 41.0 232.2Single, no child, age less than 55 . . . . . . . 15.5 120.3 17.5 153.1 19.3 152.7 18.0 181.3Single, no child, age 55 or more . . . . . . . 104.3 304.9 105.7 336.9 126.3 390.9 140.8 382.7Couple with child(ren) . . . . . . . . . . . . . . . . . 119.6 410.5 131.2 504.9 134.2 496.0 141.1 594.5Couple, no child . . . . . . . . . . . . . . . . . . . . . . . 143.9 502.0 172.8 660.9 186.9 727.0 191.0 804.5
Education of headNo high school diploma . . . . . . . . . . . . . . . 26.9 100.4 29.8 121.7 22.6 149.9 33.2 142.9High school diploma . . . . . . . . . . . . . . . . . . 68.8 200.9 67.9 211.9 75.5 216.2 80.3 251.6Some college . . . . . . . . . . . . . . . . . . . . . . . . . . 94.0 302.6 85.1 335.7 76.1 338.9 84.7 365.9College degree . . . . . . . . . . . . . . . . . . . . . . . . 186.4 672.4 249.5 931.2 248.4 935.0 280.8 1,097.8
Race or ethnicity of respondentWhite non-Hispanic . . . . . . . . . . . . . . . . . . . 121.9 429.5 143.0 571.2 154.5 617.0 170.4 692.2Nonwhite or Hispanic . . . . . . . . . . . . . . . . . 21.2 128.0 21.0 137.4 27.2 168.2 27.8 228.5
Current work status of headWorking for someone else . . . . . . . . . . . . . 67.2 213.9 76.1 263.9 73.8 294.9 93.2 350.1Self-employed . . . . . . . . . . . . . . . . . . . . . . . . . 316.3 1,176.5 412.0 1,474.7 368.6 1,563.1 388.7 1,961.3Retired . . . . . . . . . . . . . . . . . . . . . . . . . . . . . . . . 143.9 391.6 135.2 531.1 153.6 515.1 161.3 543.1Other not working . . . . . . . . . . . . . . . . . . . . . 4.5 94.2 10.4 211.1 13.0 178.2 5.7 124.1
Current occupation of headManagerial or professional . . . . . . . . . . . . . 168.5 688.2 231.1 898.3 216.2 947.2 245.8 1,116.4Technical, sales, or services . . . . . . . . . . . . 51.9 245.7 54.7 233.4 49.4 270.2 73.5 310.4Other occupation . . . . . . . . . . . . . . . . . . . . . . 63.7 161.0 56.1 159.2 62.0 162.0 64.3 191.7Retired or other not working . . . . . . . . . . . 104.3 341.6 112.9 478.5 122.1 462.8 128.8 477.6
RegionNortheast . . . . . . . . . . . . . . . . . . . . . . . . . . . . . 120.1 385.7 109.1 530.6 177.6 625.0 159.4 652.7Midwest . . . . . . . . . . . . . . . . . . . . . . . . . . . . . . 102.3 316.8 124.4 399.0 126.3 479.0 107.5 467.5South . . . . . . . . . . . . . . . . . . . . . . . . . . . . . . . . . 78.0 340.0 86.3 440.0 70.1 382.2 96.0 499.3West . . . . . . . . . . . . . . . . . . . . . . . . . . . . . . . . . . 78.0 416.3 102.6 516.6 104.1 575.1 156.2 662.7
UrbanicityMetropolitan statistical area (MSA) . . . . . 92.3 389.8 102.7 500.6 114.5 554.1 132.4 621.2Non-MSA . . . . . . . . . . . . . . . . . . . . . . . . . . . . . 87.9 184.3 93.6 238.7 65.1 193.2 77.2 241.4
Housing statusOwner . . . . . . . . . . . . . . . . . . . . . . . . . . . . . . . . 168.2 514.7 201.8 655.5 202.6 686.3 234.2 778.2Renter or other . . . . . . . . . . . . . . . . . . . . . . . . 5.4 55.3 5.6 64.4 4.4 59.4 5.1 70.6
Percentile of net worthLess than 25 . . . . . . . . . . . . . . . . . . . . . . . . . . .6 –2.4 1.3 † 1.9 –1.6 1.2 –2.325–49.9 . . . . . . . . . . . . . . . . . . . . . . . . . . . . . . . 41.6 45.7 47.8 51.8 47.9 51.7 54.2 57.950–74.9 . . . . . . . . . . . . . . . . . . . . . . . . . . . . . . . 153.4 163.7 184.7 195.4 187.4 203.6 219.8 227.075–89.9 . . . . . . . . . . . . . . . . . . . . . . . . . . . . . . . 392.8 409.3 503.8 527.9 556.6 578.5 571.4 586.190–100 . . . . . . . . . . . . . . . . . . . . . . . . . . . . . . . 1,141.2 2,464.6 1,524.7 3,233.2 1,570.6 3,420.3 1,890.7 3,975.7
NOTE: See note to table 1.† Less than 0.05 ($50).
Changes in U.S. Family Finances from 2004 to 2007: Evidence from the Survey of Consumer Finances A11
ties. Taken together, these assumptions imply largedrops in median and mean net worth since the 2007survey—17.8 percent and 22.7 percent, respectively.Relative to the values in the 2004 SCF, adjustedmedian net worth is 3.2 percent lower, and theadjusted mean is 12.7 percent lower.17
By age group, median and mean net worth show a‘‘hump’’ pattern that generally peaks in the 55-to-64
age group. This pattern reflects both life-cycle savingbehavior and a historical pattern of long-run growthin inflation-adjusted wages. The median and meanvalues of wealth rise in tandem with income, arelationship reflecting both income earned from assetsand a higher likelihood of saving among higher-income families. Wealth shows strong differentialsacross groups defined in terms of family structure,education, racial or ethnic background, work status,occupation, housing status, and the urbanicity andregion of residence; these differentials generally mir-ror those for income, but the wealth differences arelarger.
Net Worth by Demographic Category
Analysis by demographic group for the 2004–07period shows a pattern of gains of varying sizes in
17. Most of the projected decline in the median is a result of theadjustments to primary residences and publicly traded equity; if onlythe values of primary residences and of directly or indirectly heldequity are adjusted, median net worth as of October 2008 declines15.0 percent relative to the level observed in the 2007 survey. Incontrast, the corresponding mean of the data under the more limitedadjustment is only 12.0 percent lower than the unadjusted value, orjust more than one-half of the decline implied by the broader set ofadjustments; this result reflects the fact that the value of businesses andreal estate other than primary residences is relatively concentratedamong wealthier families.
Shopping for Financial Services
As a normal part of their financial lives, families must
make a variety of decisions to select particular invest-
ments for any savings they may have, as well as to select
the forms and terms of credit they may use. To the extent
that families devote more or less attention to such activi-
ties or that they are better or worse informed, the wealth
of otherwise comparable families may differ substantially
over time.
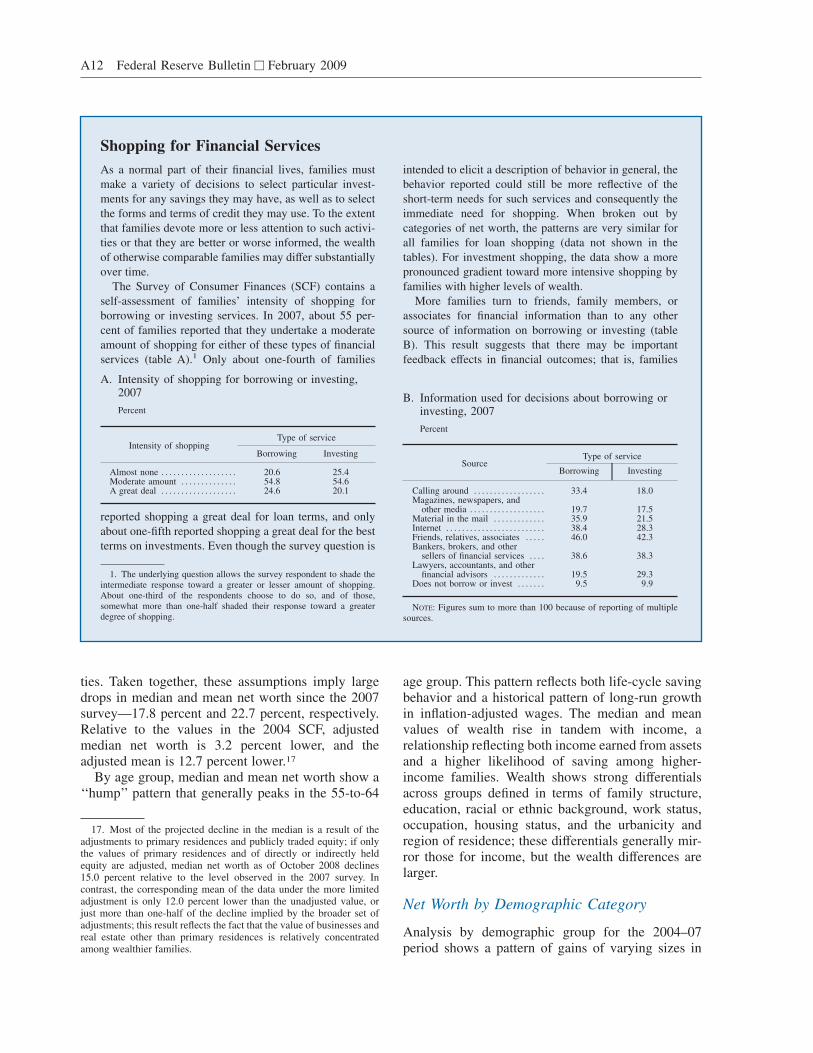
The Survey of Consumer Finances (SCF) contains a
self-assessment of families’ intensity of shopping for
borrowing or investing services. In 2007, about 55 per-
cent of families reported that they undertake a moderate
amount of shopping for either of these types of financial
services (table A).1 Only about one-fourth of families
A. Intensity of shopping for borrowing or investing,2007
Percent
Intensity of shoppingType of service
Borrowing Investing
Almost none . . . . . . . . . . . . . . . . . . . 20.6 25.4Moderate amount . . . . . . . . . . . . . . 54.8 54.6A great deal . . . . . . . . . . . . . . . . . . . 24.6 20.1
reported shopping a great deal for loan terms, and only
about one-fifth reported shopping a great deal for the best
terms on investments. Even though the survey question is
1. The underlying question allows the survey respondent to shade theintermediate response toward a greater or lesser amount of shopping.About one-third of the respondents choose to do so, and of those,somewhat more than one-half shaded their response toward a greaterdegree of shopping.
intended to elicit a description of behavior in general, the
behavior reported could still be more reflective of the
short-term needs for such services and consequently the
immediate need for shopping. When broken out by
categories of net worth, the patterns are very similar for
all families for loan shopping (data not shown in the
tables). For investment shopping, the data show a more
pronounced gradient toward more intensive shopping by
families with higher levels of wealth.
More families turn to friends, family members, or
associates for financial information than to any other
source of information on borrowing or investing (table
B). This result suggests that there may be important
feedback effects in financial outcomes; that is, families
B. Information used for decisions about borrowing orinvesting, 2007
Percent
SourceType of service
Borrowing Investing
Calling around . . . . . . . . . . . . . . . . . . 33.4 18.0Magazines, newspapers, and
other media . . . . . . . . . . . . . . . . . . . 19.7 17.5Material in the mail . . . . . . . . . . . . . 35.9 21.5Internet . . . . . . . . . . . . . . . . . . . . . . . . . 38.4 28.3Friends, relatives, associates . . . . . 46.0 42.3Bankers, brokers, and other
sellers of financial services . . . . 38.6 38.3Lawyers, accountants, and other
financial advisors . . . . . . . . . . . . . 19.5 29.3Does not borrow or invest . . . . . . . 9.5 9.9
NOTE: Figures sum to more than 100 because of reporting of multiplesources.
A12 Federal Reserve Bulletin h February 2009

median and mean net worth for most groups. But asmall number of groups experienced losses, and somehad noticeably different shifts in their median andmean net worth.
Median net worth rose for all percentile groups ofthe distribution of net worth except for families in thelowest quartile. In that group, the median fell from$1,900 to $1,200; the mean fell from negative $1,600in 2004 to negative $2,300 in 2007. For the rest of thedistribution of net worth, the median and mean overthe recent three-year period rose substantially for allother groups except the 75th-to-90th percentile group,which had seen relatively large gains over the preced-ing three years. Gains for the top wealth group wereunbroken back to at least 1998.
Over the recent period, median net worth increasedfor all income groups above the 20th percentile andespecially for families in the fourth quintile, for
which the median rose 16.6 percent; the mean for thisgroup was little changed. Families in the lowestincome quintile had the largest proportional increasein the mean—31.8 percent—a rise due, in part, to anincrease in the fraction of the group consisting ofrelatively wealthy families with incomes that arelikely to have been temporarily low (data not shownin the tables). The mean rose for the other incomegroups, and it rose most for the highest decilegroup—an 18.8 percent gain. Over the precedingyears shown, median net worth had increased for allgroups except the second income quintile; the meanhad risen for all income groups.
The survey shows some substantial movements ofnet worth by age group between 2004 and 2007.Median net worth rose most strongly—19.2 percent—for the 75-or-more age group, which had seen rela-tively modest change over the previous three-year
who know relatively well-informed people may obtain
better services. Sellers of financial services—bankers,
brokers, and so on—are the second most frequently cited
source of information for borrowing or investing. The
Internet was reported by 38.4 percent of families as a
source for information on borrowing and by 28.3 percent
for information on investing. Although the Internet, in
principle, makes an enormous amount of information
available to a family, interpretation of the information
may still be an important consideration. However, the
proliferation of financial planning tools may mitigate this
concern. When viewed across categories of net worth, the
data show similar patterns of use of sources of informa-
tion by all groups (data not shown in the tables).
In addition to serving as a source of information, the
Internet can also be a medium for obtaining financial
services. In 2007, 49.4 percent of families reported using
the Internet to access at least some type of service at one
of the financial institutions they used (data not shown in
the tables). If accessing information and using services
are combined, the Internet played a part in the financial
life of 59.7 percent of all families (table C). This figure is
up sharply from 46.5 percent in 2004 and 32.5 percent in
2001. The proportion of such users rises strongly over net
worth groups: Among the least wealthy 25 percent of
families, 50.3 percent made such use of the Internet,
whereas the figure was 75.6 percent for the wealthiest
10 percent (data not shown in the tables). More striking is
the variation over age groups. Among families headed by
a person younger than 35, 71.9 percent reported using the
C. Use of the Internet for financial information orfinancial services, by age of head, 2007
Percent
Family characteristic Percentages of families
All families . . . . . . . . . . . . . . . . . . . . . 59.7
Age of head (years)Less than 35 . . . . . . . . . . . . . . . . . . . . 71.935–44 . . . . . . . . . . . . . . . . . . . . . . . . . . 70.845–54 . . . . . . . . . . . . . . . . . . . . . . . . . . 69.155–64 . . . . . . . . . . . . . . . . . . . . . . . . . . 59.165–74 . . . . . . . . . . . . . . . . . . . . . . . . . . 40.375 or more . . . . . . . . . . . . . . . . . . . . . 16.5
MEMO
All families, 2004 . . . . . . . . . . . . . . . 46.5All families, 2001 . . . . . . . . . . . . . . . 32.5
Internet for financial information or services, whereas the
figure for families with a head aged 75 or older was only
16.5 percent. If the relatively greater expression of such
behavior by younger families persists as they age, and if
succeeding cohorts follow their example, Internet-based
financial services may become even more important in
the future.2
2. For a discussion of the definition of local banking markets, seeDean F. Amel, Arthur B. Kennickell, and Kevin B. Moore (2008),‘‘Banking Market Definition: Evidence from the Survey of ConsumerFinances,’’ Finance and Economics Discussion Series 2008-35 (Wash-ington: Board of Governors of the Federal Reserve System, October),www.federalreserve.gov/pubs/feds/2008/200835/200835pap.pdf.
Changes in U.S. Family Finances from 2004 to 2007: Evidence from the Survey of Consumer Finances A13
period. The less-than-35 age group saw a large declinein the median—24.4 percent—over the more recentperiod; at the same time, median wealth fell 7.1 per-cent for the 55-to-64 age group. Mean wealth rosejust more than 10 percent for families in the 45-to-54and 75-or-more age groups, and it increased morethan 30 percent for families in the less-than-35 and65-to-74 age groups; mean wealth declined, however,for the 35-to-44 group and was about unchanged forthe 55-to-64 group. Many of the changes observedcontrast in size or direction with the changes in thepreceding three-year period.
By family structure, single families with childrenhad the largest increases from 2004 to 2007 in bothmedian and mean net worth—13.9 percent and45.3 percent, respectively—but these families had thesecond-lowest level of net worth (after younger singlefamilies without children). Median net worth in-creased for all family-structure groups except youngersingle families without children, and the mean in-creased for all except older single families withoutchildren.
From 2004 to 2007, median net worth increased forall education groups. The change was particularlylarge—46.9 percent—for the no-high-school-diplomagroup. At the same time, this group was the only onethat did not see a rise in mean net worth; its meandeclined 4.7 percent. The shifts for this group werethe opposite of the pattern in the preceding three-yearperiod, during which the median fell and the meanrose.
The data show gains from 2004 to 2007 in medianand mean wealth for both categories of race orethnicity. Gains in the median and the mean wereroughly the same for white non-Hispanic families—10.3 percent and 12.2 percent, respectively. But fornonwhite or Hispanic families, the change in themedian—2.2 percent—was far smaller than that inthe mean—35.9 percent.18 In the preceding three-yearperiod, both the median and the mean for nonwhitesor Hispanics had risen more strongly than those forother families. Despite some continuing signs ofconvergence, in 2007, the median and mean of networth for white non-Hispanic families remainedmuch higher than those for nonwhite or Hispanicfamilies. In contrast to the whole group of nonwhiteor Hispanic families, the subgroup of African Ameri-can families saw a 24.1 percent decline in their
median net worth from 2004 ($22,400) to 2007($17,000), but their mean net worth rose 9.3 percent,from $121,500 to $132,800; over the 2001–04 period,the median for the group had shown virtually nochange, while the mean had risen 36.4 percent (datanot shown in the tables).
Among work-status groups, median and mean networth rose from 2004 to 2007 for all families exceptthose headed by persons who were not working forreasons other than retirement (the other-not-workinggroup), which showed substantial declines in bothmeasures. The group had the lowest levels of bothmedian and mean net worth of all work-status groups.Although the dollar amounts of the changes in medianand mean net worth for the self-employed group werefar larger than those for the other groups over theperiod from 1998 to 2007, the percentage increase inthe median for the self-employed group was belowthe rates for all other work-status categories exceptthe retired group. The percentage increase in themean for the self-employed group was just slightlyhigher than that for the working-for-someone-elsegroup.
Median and mean net worth increased for alloccupation groups in the recent three-year period, butthey did so most markedly for families headed by aworker in a technical, sales, or service occupation orby a worker in a managerial or professional occupa-tion. Over the period since 1998, the median forfamilies in the residual other-occupation categorybarely rose, and the increase in the mean was thesmallest of any occupation group. All other groupshad greater than a 20 percent increase in their medianand mean net worth over this period.
Between 2004 and 2007, median net worth fell forfamilies living in the Northeast or the Midwest, whileit rose strongly for those in the South or the West.Mean net worth for families in the Northeast or theMidwest also lagged behind that for families in theother regions. Over the longer period from 1998 to2007, median and mean net worth moved up moststrongly in the Northeast and the West; these regionsended the period with quite similar medians andmeans. The Midwest and the South also ended theperiod with fairly similar values, at levels consider-ably below those for the Northeast and the West.
By urbanicity of the place of residence, in therecent three-year period, median net worth increasedby about the same proportion in MSA and non-MSAareas, but the mean advanced by a much largerproportion in non-MSA areas. However, over thelonger period since 1998, median and mean wealthrose more rapidly for MSAs, and in 2007 both the
18. If the additional information on Hispanic or Latino ethnicidentification available in the SCF is used in the classification of the2007 results, the median net worth of nonwhites or Hispanics was$31,000, and the mean was $237,900; for other families, the medianwas $174,100, and the mean was $701,800. These figures are allslightly higher than the corresponding values reported in table 4.
A14 Federal Reserve Bulletin h February 2009
median and mean net worth for families in MSAsremained substantially above that for families innon-MSAs.
By housing status, the percentage increases inmedian net worth between 2004 and 2007 were verysimilar for both groups, and the increase in the meanfor non-homeowners (hereafter, renters) was some-what higher. From 1998 to 2007—a time of risinghouse prices, on balance—the increase in median andmean net worth for homeowners far outstripped thatfor renters.
ASSETS
At 97.7 percent in 2007, the overall proportion offamilies with any asset was barely changed from2004 (first half of tables 9.A and 9.B, last column).Overall, this figure has risen 0.9 percentage pointsince 1998 (data not shown in the tables). Acrossdemographic groups, the pattern of changes in therecent three-year period is mostly one of smallincreases or decreases. Noticeable exceptions aredeclines for the following groups: the lowest quintileof the income distribution (2.4 percentage points);single families with children (1.2 percentage points);younger single families without children (1.7 percent-age points); families headed by a person whose workstatus was retired (1.6 percentage points) or who wasin the related retired-or-other-not-working category(1.2 percentage points); families headed by a personaged 75 or older (1.5 percent); and families living inthe Northeast (3.3 percentage points).19 For manygroups, the figure remained at or near 100 percent.
From 2004 to 2007, median assets for familieshaving any assets rose 16.6 percent, from $189,900 to$221,500 (second half of tables 9.A and 9.B, lastcolumn), and the mean rose 13.1 percent, from$591,300 to $668,500 (memo line). These percentagechanges closely resemble those for overall net worth,but examination of changes in median assets bydemographic groups reveals differences. Becausechanges in ownership were generally small, thesedifferences must largely represent variations in theamount of borrowing. Across net worth groups, thepercentage changes in median assets and net worthwere most similar for families in the top quartile ofthe distribution of net worth; for all except the lowestquartile of that distribution, the changes were moreroughly similar; and for the lowest quartile of thedistribution, the percentage decline in assets wasmuch larger than that for net worth. For white non-
Hispanic families, median assets rose 9.9 percent,while median net worth rose 10.3 percent; but fornonwhites or Hispanics, median assets rose 36.4 per-cent, and median net worth rose only 2.2 percent. Forhomeowners, median assets increased 8.1 percent, butmedian net worth increased 15.6 percent; for renters,median assets barely changed, but median net worthrose 15.9 percent. Percentage changes in the mediansof assets and net worth were similar across region andurbanicity of the place of residence. Over the preced-ing three-year period, median assets had risen 9.8 per-cent and mean assets had risen 8.3 percent, comparedwith corresponding figures for net worth of 1.0 per-cent and 6.0 percent.
Financial Assets
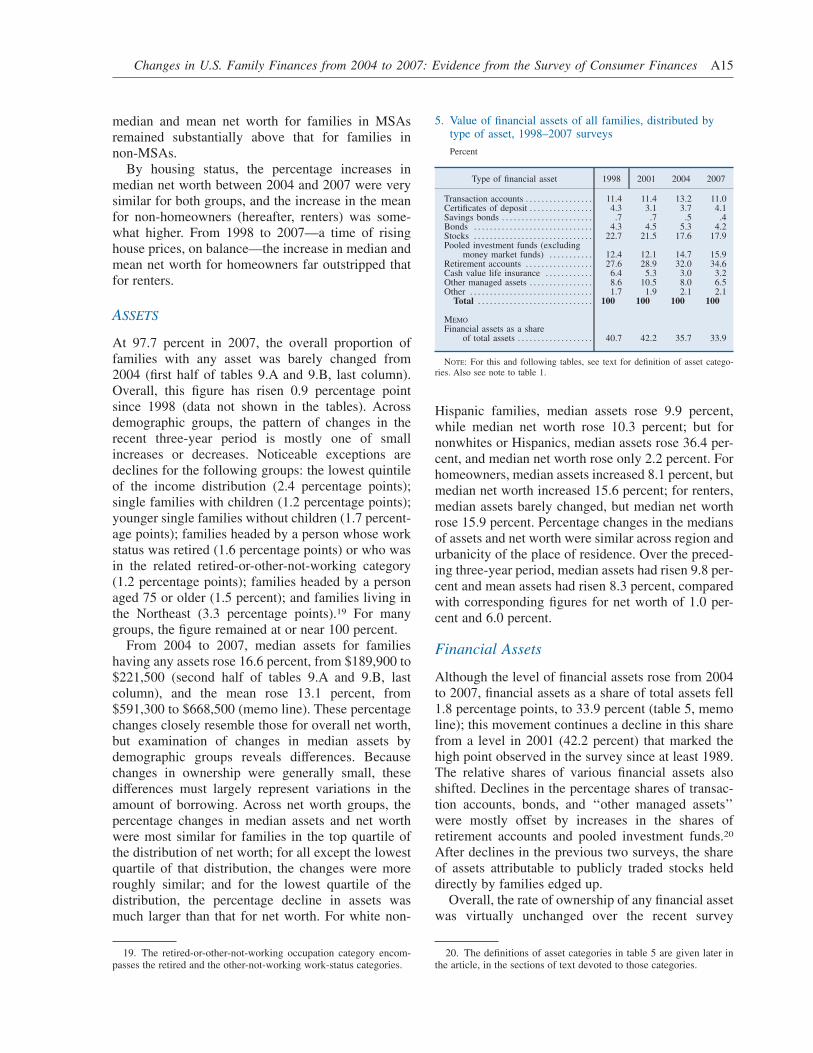
Although the level of financial assets rose from 2004to 2007, financial assets as a share of total assets fell1.8 percentage points, to 33.9 percent (table 5, memoline); this movement continues a decline in this sharefrom a level in 2001 (42.2 percent) that marked thehigh point observed in the survey since at least 1989.The relative shares of various financial assets alsoshifted. Declines in the percentage shares of transac-tion accounts, bonds, and ‘‘other managed assets’’were mostly offset by increases in the shares ofretirement accounts and pooled investment funds.20
After declines in the previous two surveys, the shareof assets attributable to publicly traded stocks helddirectly by families edged up.
Overall, the rate of ownership of any financial assetwas virtually unchanged over the recent survey
19. The retired-or-other-not-working occupation category encom-passes the retired and the other-not-working work-status categories.
20. The definitions of asset categories in table 5 are given later inthe article, in the sections of text devoted to those categories.
5. Value of financial assets of all families, distributed bytype of asset, 1998–2007 surveys
Percent
Type of financial asset 1998 2001 2004 2007
Transaction accounts . . . . . . . . . . . . . . . . . 11.4 11.4 13.2 11.0Certificates of deposit . . . . . . . . . . . . . . . . 4.3 3.1 3.7 4.1Savings bonds . . . . . . . . . . . . . . . . . . . . . . . .7 .7 .5 .4Bonds . . . . . . . . . . . . . . . . . . . . . . . . . . . . . . 4.3 4.5 5.3 4.2Stocks . . . . . . . . . . . . . . . . . . . . . . . . . . . . . . 22.7 21.5 17.6 17.9Pooled investment funds (excluding
money market funds) . . . . . . . . . . . 12.4 12.1 14.7 15.9Retirement accounts . . . . . . . . . . . . . . . . . 27.6 28.9 32.0 34.6Cash value life insurance . . . . . . . . . . . . 6.4 5.3 3.0 3.2Other managed assets . . . . . . . . . . . . . . . . 8.6 10.5 8.0 6.5Other . . . . . . . . . . . . . . . . . . . . . . . . . . . . . . . 1.7 1.9 2.1 2.1
Total . . . . . . . . . . . . . . . . . . . . . . . . . . . . . 100 100 100 100
MEMO
Financial assets as a shareof total assets . . . . . . . . . . . . . . . . . . . 40.7 42.2 35.7 33.9
NOTE: For this and following tables, see text for definition of asset catego-ries. Also see note to table 1.
Changes in U.S. Family Finances from 2004 to 2007: Evidence from the Survey of Consumer Finances A15

6. Family holdings of financial assets, by selected characteristics of families and type of asset, 2004 and 2007 surveys
A. 2004 Survey of Consumer Finances
Family characteristicTrans-action
accounts
Certifi-cates ofdeposit
Savingsbonds
Bonds Stocks
Pooledinvest-mentfunds
Retire-ment
accounts
Cashvalue lifeinsurance
Othermanaged
assetsOther
Anyfinancial
asset
Percentage of families holding asset
All families . . . . . . . . . . . . . . . . . . . . . . . . . 91.3 12.7 17.6 1.8 20.7 15.0 49.7 24.2 7.3 10.0 93.8
Percentile of incomeLess than 20 . . . . . . . . . . . . . . . . . . . . . . . . 75.5 5.0 6.2 * 5.1 3.6 10.1 14.0 3.1 7.1 80.120–39.9 . . . . . . . . . . . . . . . . . . . . . . . . . . . . . 87.3 12.7 8.8 * 8.2 7.6 29.8 19.0 4.9 9.9 91.540–59.9 . . . . . . . . . . . . . . . . . . . . . . . . . . . . . 95.9 11.8 15.4 * 16.4 12.7 53.5 24.4 7.9 9.3 98.560–79.9 . . . . . . . . . . . . . . . . . . . . . . . . . . . . . 98.4 15.0 26.5 2.1 28.1 18.6 69.7 29.7 7.8 11.2 99.180–89.9 . . . . . . . . . . . . . . . . . . . . . . . . . . . . . 99.1 16.3 32.3 2.9 35.9 26.2 81.9 29.6 12.2 11.4 99.890–100 . . . . . . . . . . . . . . . . . . . . . . . . . . . . . 100.0 21.5 29.9 8.9 55.0 39.1 88.5 38.1 13.0 13.4 100.0
Age of head (years)Less than 35 . . . . . . . . . . . . . . . . . . . . . . . . 86.4 5.6 15.3 * 13.3 8.3 40.2 11.0 2.9 11.6 90.135–44 . . . . . . . . . . . . . . . . . . . . . . . . . . . . . . . 90.8 6.7 23.3 .6 18.5 12.3 55.9 20.1 3.7 10.0 93.645–54 . . . . . . . . . . . . . . . . . . . . . . . . . . . . . . . 91.8 11.9 21.0 1.8 23.2 18.2 57.7 26.0 6.2 12.1 93.655–64 . . . . . . . . . . . . . . . . . . . . . . . . . . . . . . . 93.2 18.1 15.2 3.3 29.1 20.6 62.9 32.1 9.4 7.2 95.265–74 . . . . . . . . . . . . . . . . . . . . . . . . . . . . . . . 93.9 19.9 14.9 4.3 25.4 18.6 43.2 34.8 12.8 8.1 96.575 or more . . . . . . . . . . . . . . . . . . . . . . . . . . 96.4 25.7 11.0 3.0 18.4 16.6 29.2 34.0 16.7 8.1 97.6
Family structureSingle with child(ren) . . . . . . . . . . . . . . . . 87.2 8.8 9.4 * 9.6 7.4 34.1 19.9 3.7 13.7 91.1Single, no child, age less than 55 . . . . . 85.1 5.9 11.9 .3 12.4 10.2 37.5 14.0 2.8 13.8 88.9Single, no child, age 55 or more . . . . . 91.8 18.8 9.1 2.6 18.0 16.0 32.8 28.8 14.0 7.8 94.4Couple with child(ren) . . . . . . . . . . . . . . . 93.5 14.9 25.1 .9 23.3 11.7 61.4 24.7 6.1 7.4 96.4Couple, no child . . . . . . . . . . . . . . . . . . . . . 94.0 13.6 22.1 2.7 26.2 19.0 59.8 27.7 7.9 9.1 95.5
Education of headNo high school diploma . . . . . . . . . . . . . 72.4 5.6 4.2 * 4.7 2.3 16.2 13.7 3.0 5.2 77.4High school diploma . . . . . . . . . . . . . . . . 89.1 12.9 14.2 .4 12.4 9.2 43.6 23.0 5.4 8.4 92.9Some college . . . . . . . . . . . . . . . . . . . . . . . . 94.3 9.4 19.3 .6 17.7 12.6 47.7 23.8 6.2 14.4 96.6College degree . . . . . . . . . . . . . . . . . . . . . . 99.1 17.0 24.9 4.1 35.3 26.1 68.9 29.5 10.9 10.9 99.6
Race or ethnicity of respondentWhite non-Hispanic . . . . . . . . . . . . . . . . . 95.5 15.3 21.1 2.5 25.5 18.9 56.1 26.8 9.2 10.2 97.2Nonwhite or Hispanic . . . . . . . . . . . . . . . 80.6 6.0 8.5 * 8.0 5.0 32.9 17.4 2.1 9.4 85.0
Current work status of headWorking for someone else . . . . . . . . . . . 92.2 9.8 20.1 .8 19.6 13.5 57.1 21.8 5.4 9.5 94.5Self-employed . . . . . . . . . . . . . . . . . . . . . . . 94.4 14.2 18.7 4.3 31.6 22.3 54.6 29.8 7.6 15.1 96.1Retired . . . . . . . . . . . . . . . . . . . . . . . . . . . . . . 90.4 20.2 11.4 3.5 19.0 16.2 32.9 29.7 12.8 8.4 93.6Other not working . . . . . . . . . . . . . . . . . . . 76.2 7.9 14.5 * 14.3 10.2 24.9 10.7 * 11.5 79.6
Current occupation of headManagerial or professional . . . . . . . . . . . 98.5 14.8 25.5 3.1 32.9 24.3 68.5 27.5 8.2 13.2 99.5Technical, sales, or services . . . . . . . . . . 90.1 8.9 18.5 .3 15.6 9.7 48.5 21.9 4.9 8.6 92.9Other occupation . . . . . . . . . . . . . . . . . . . . 87.2 6.4 13.8 * 13.0 8.1 49.7 18.7 3.3 8.5 90.4Retired or other not working . . . . . . . . . 88.2 18.3 11.8 3.0 18.2 15.3 31.6 26.8 11.1 8.9 91.4
RegionNortheast . . . . . . . . . . . . . . . . . . . . . . . . . . . 94.6 15.3 21.5 1.9 27.8 18.8 57.0 24.6 7.7 8.6 96.4Midwest . . . . . . . . . . . . . . . . . . . . . . . . . . . . 94.4 14.9 23.6 1.6 23.4 15.2 57.3 30.3 11.5 10.7 96.5South . . . . . . . . . . . . . . . . . . . . . . . . . . . . . . . 86.9 11.7 12.7 2.0 15.4 12.6 41.6 24.1 4.7 9.5 90.7West . . . . . . . . . . . . . . . . . . . . . . . . . . . . . . . . 92.6 9.7 16.1 1.7 20.4 15.6 48.9 17.5 6.7 11.0 94.0
UrbanicityMetropolitan statisical area (MSA) . . . 91.6 12.3 18.4 2.0 22.6 16.4 51.8 24.6 7.8 10.4 93.9Non-MSA . . . . . . . . . . . . . . . . . . . . . . . . . . . 90.0 14.6 14.0 * 11.0 8.5 39.5 22.3 4.8 7.9 93.2
Housing statusOwner . . . . . . . . . . . . . . . . . . . . . . . . . . . . . . 96.0 15.9 21.2 2.6 25.8 19.2 60.2 30.1 9.6 9.6 97.5Renter or other . . . . . . . . . . . . . . . . . . . . . . 80.9 5.6 9.5 .2 9.1 5.7 26.2 11.0 2.0 10.9 85.5
Percentile of net worthLess than 25 . . . . . . . . . . . . . . . . . . . . . . . . 75.4 2.2 6.2 * 3.6 2.0 14.3 7.7 * 6.9 79.825–49.9 . . . . . . . . . . . . . . . . . . . . . . . . . . . . . 92.0 6.5 13.2 * 9.3 7.2 43.1 19.3 2.3 9.5 96.150–74.9 . . . . . . . . . . . . . . . . . . . . . . . . . . . . . 98.0 16.0 22.7 * 21.0 12.5 61.8 30.1 8.8 10.2 99.475–89.9 . . . . . . . . . . . . . . . . . . . . . . . . . . . . . 99.7 24.2 28.5 3.2 39.1 32.4 77.6 36.7 15.6 11.2 100.090–100 . . . . . . . . . . . . . . . . . . . . . . . . . . . . . 100.0 28.8 28.1 12.7 62.9 47.3 82.5 43.8 21.0 16.4 100.0
A16 Federal Reserve Bulletin h February 2009
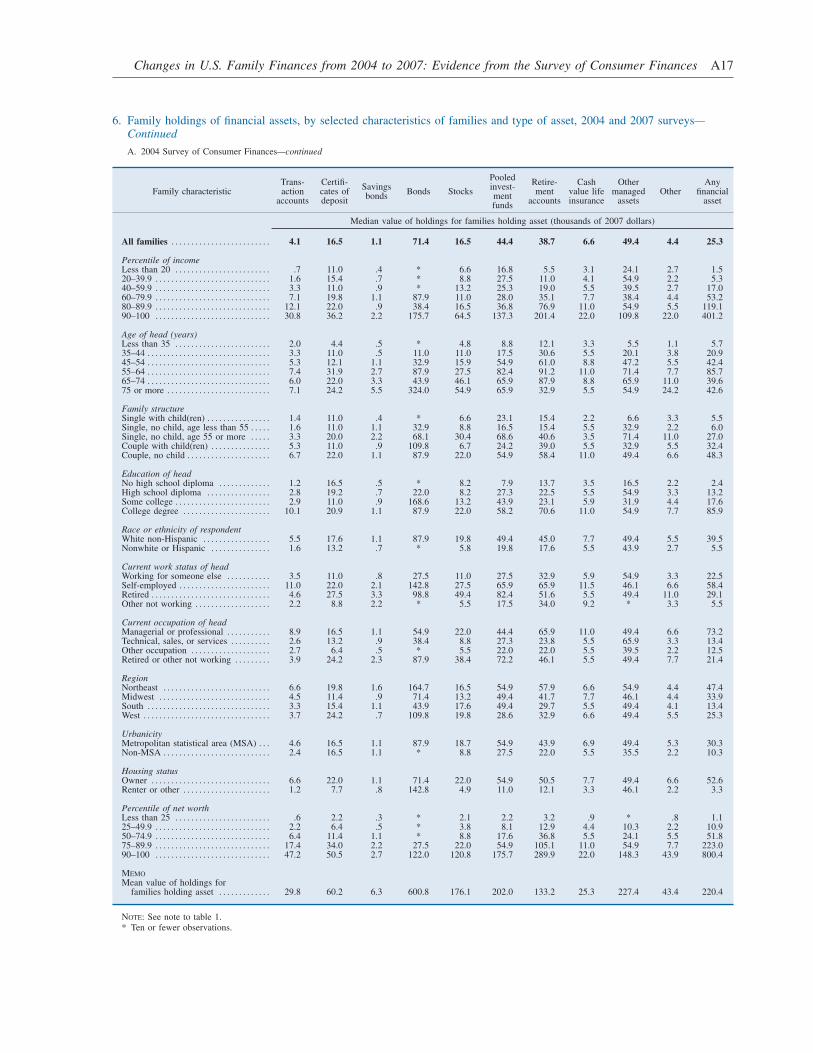
6. Family holdings of financial assets, by selected characteristics of families and type of asset, 2004 and 2007 surveys—Continued
A. 2004 Survey of Consumer Finances—continued
Family characteristicTrans-action
accounts
Certifi-cates ofdeposit
Savingsbonds
Bonds Stocks
Pooledinvest-mentfunds
Retire-ment
accounts
Cashvalue lifeinsurance
Othermanaged
assetsOther
Anyfinancial
asset
Median value of holdings for families holding asset (thousands of 2007 dollars)
All families . . . . . . . . . . . . . . . . . . . . . . . . . 4.1 16.5 1.1 71.4 16.5 44.4 38.7 6.6 49.4 4.4 25.3
Percentile of incomeLess than 20 . . . . . . . . . . . . . . . . . . . . . . . . .7 11.0 .4 * 6.6 16.8 5.5 3.1 24.1 2.7 1.520–39.9 . . . . . . . . . . . . . . . . . . . . . . . . . . . . . 1.6 15.4 .7 * 8.8 27.5 11.0 4.1 54.9 2.2 5.340–59.9 . . . . . . . . . . . . . . . . . . . . . . . . . . . . . 3.3 11.0 .9 * 13.2 25.3 19.0 5.5 39.5 2.7 17.060–79.9 . . . . . . . . . . . . . . . . . . . . . . . . . . . . . 7.1 19.8 1.1 87.9 11.0 28.0 35.1 7.7 38.4 4.4 53.280–89.9 . . . . . . . . . . . . . . . . . . . . . . . . . . . . . 12.1 22.0 .9 38.4 16.5 36.8 76.9 11.0 54.9 5.5 119.190–100 . . . . . . . . . . . . . . . . . . . . . . . . . . . . . 30.8 36.2 2.2 175.7 64.5 137.3 201.4 22.0 109.8 22.0 401.2
Age of head (years)Less than 35 . . . . . . . . . . . . . . . . . . . . . . . . 2.0 4.4 .5 * 4.8 8.8 12.1 3.3 5.5 1.1 5.735–44 . . . . . . . . . . . . . . . . . . . . . . . . . . . . . . . 3.3 11.0 .5 11.0 11.0 17.5 30.6 5.5 20.1 3.8 20.945–54 . . . . . . . . . . . . . . . . . . . . . . . . . . . . . . . 5.3 12.1 1.1 32.9 15.9 54.9 61.0 8.8 47.2 5.5 42.455–64 . . . . . . . . . . . . . . . . . . . . . . . . . . . . . . . 7.4 31.9 2.7 87.9 27.5 82.4 91.2 11.0 71.4 7.7 85.765–74 . . . . . . . . . . . . . . . . . . . . . . . . . . . . . . . 6.0 22.0 3.3 43.9 46.1 65.9 87.9 8.8 65.9 11.0 39.675 or more . . . . . . . . . . . . . . . . . . . . . . . . . . 7.1 24.2 5.5 324.0 54.9 65.9 32.9 5.5 54.9 24.2 42.6
Family structureSingle with child(ren) . . . . . . . . . . . . . . . . 1.4 11.0 .4 * 6.6 23.1 15.4 2.2 6.6 3.3 5.5Single, no child, age less than 55 . . . . . 1.6 11.0 1.1 32.9 8.8 16.5 15.4 5.5 32.9 2.2 6.0Single, no child, age 55 or more . . . . . 3.3 20.0 2.2 68.1 30.4 68.6 40.6 3.5 71.4 11.0 27.0Couple with child(ren) . . . . . . . . . . . . . . . 5.3 11.0 .9 109.8 6.7 24.2 39.0 5.5 32.9 5.5 32.4Couple, no child . . . . . . . . . . . . . . . . . . . . . 6.7 22.0 1.1 87.9 22.0 54.9 58.4 11.0 49.4 6.6 48.3
Education of headNo high school diploma . . . . . . . . . . . . . 1.2 16.5 .5 * 8.2 7.9 13.7 3.5 16.5 2.2 2.4High school diploma . . . . . . . . . . . . . . . . 2.8 19.2 .7 22.0 8.2 27.3 22.5 5.5 54.9 3.3 13.2Some college . . . . . . . . . . . . . . . . . . . . . . . . 2.9 11.0 .9 168.6 13.2 43.9 23.1 5.9 31.9 4.4 17.6College degree . . . . . . . . . . . . . . . . . . . . . . 10.1 20.9 1.1 87.9 22.0 58.2 70.6 11.0 54.9 7.7 85.9
Race or ethnicity of respondentWhite non-Hispanic . . . . . . . . . . . . . . . . . 5.5 17.6 1.1 87.9 19.8 49.4 45.0 7.7 49.4 5.5 39.5Nonwhite or Hispanic . . . . . . . . . . . . . . . 1.6 13.2 .7 * 5.8 19.8 17.6 5.5 43.9 2.7 5.5
Current work status of headWorking for someone else . . . . . . . . . . . 3.5 11.0 .8 27.5 11.0 27.5 32.9 5.9 54.9 3.3 22.5Self-employed . . . . . . . . . . . . . . . . . . . . . . . 11.0 22.0 2.1 142.8 27.5 65.9 65.9 11.5 46.1 6.6 58.4Retired . . . . . . . . . . . . . . . . . . . . . . . . . . . . . . 4.6 27.5 3.3 98.8 49.4 82.4 51.6 5.5 49.4 11.0 29.1Other not working . . . . . . . . . . . . . . . . . . . 2.2 8.8 2.2 * 5.5 17.5 34.0 9.2 * 3.3 5.5
Current occupation of headManagerial or professional . . . . . . . . . . . 8.9 16.5 1.1 54.9 22.0 44.4 65.9 11.0 49.4 6.6 73.2Technical, sales, or services . . . . . . . . . . 2.6 13.2 .9 38.4 8.8 27.3 23.8 5.5 65.9 3.3 13.4Other occupation . . . . . . . . . . . . . . . . . . . . 2.7 6.4 .5 * 5.5 22.0 22.0 5.5 39.5 2.2 12.5Retired or other not working . . . . . . . . . 3.9 24.2 2.3 87.9 38.4 72.2 46.1 5.5 49.4 7.7 21.4
RegionNortheast . . . . . . . . . . . . . . . . . . . . . . . . . . . 6.6 19.8 1.6 164.7 16.5 54.9 57.9 6.6 54.9 4.4 47.4Midwest . . . . . . . . . . . . . . . . . . . . . . . . . . . . 4.5 11.4 .9 71.4 13.2 49.4 41.7 7.7 46.1 4.4 33.9South . . . . . . . . . . . . . . . . . . . . . . . . . . . . . . . 3.3 15.4 1.1 43.9 17.6 49.4 29.7 5.5 49.4 4.1 13.4West . . . . . . . . . . . . . . . . . . . . . . . . . . . . . . . . 3.7 24.2 .7 109.8 19.8 28.6 32.9 6.6 49.4 5.5 25.3
UrbanicityMetropolitan statistical area (MSA) . . . 4.6 16.5 1.1 87.9 18.7 54.9 43.9 6.9 49.4 5.3 30.3Non-MSA . . . . . . . . . . . . . . . . . . . . . . . . . . . 2.4 16.5 1.1 * 8.8 27.5 22.0 5.5 35.5 2.2 10.3
Housing statusOwner . . . . . . . . . . . . . . . . . . . . . . . . . . . . . . 6.6 22.0 1.1 71.4 22.0 54.9 50.5 7.7 49.4 6.6 52.6Renter or other . . . . . . . . . . . . . . . . . . . . . . 1.2 7.7 .8 142.8 4.9 11.0 12.1 3.3 46.1 2.2 3.3
Percentile of net worthLess than 25 . . . . . . . . . . . . . . . . . . . . . . . . .6 2.2 .3 * 2.1 2.2 3.2 .9 * .8 1.125–49.9 . . . . . . . . . . . . . . . . . . . . . . . . . . . . . 2.2 6.4 .5 * 3.8 8.1 12.9 4.4 10.3 2.2 10.950–74.9 . . . . . . . . . . . . . . . . . . . . . . . . . . . . . 6.4 11.4 1.1 * 8.8 17.6 36.8 5.5 24.1 5.5 51.875–89.9 . . . . . . . . . . . . . . . . . . . . . . . . . . . . . 17.4 34.0 2.2 27.5 22.0 54.9 105.1 11.0 54.9 7.7 223.090–100 . . . . . . . . . . . . . . . . . . . . . . . . . . . . . 47.2 50.5 2.7 122.0 120.8 175.7 289.9 22.0 148.3 43.9 800.4
MEMO
Mean value of holdings forfamilies holding asset . . . . . . . . . . . . . 29.8 60.2 6.3 600.8 176.1 202.0 133.2 25.3 227.4 43.4 220.4
NOTE: See note to table 1.* Ten or fewer observations.
Changes in U.S. Family Finances from 2004 to 2007: Evidence from the Survey of Consumer Finances A17
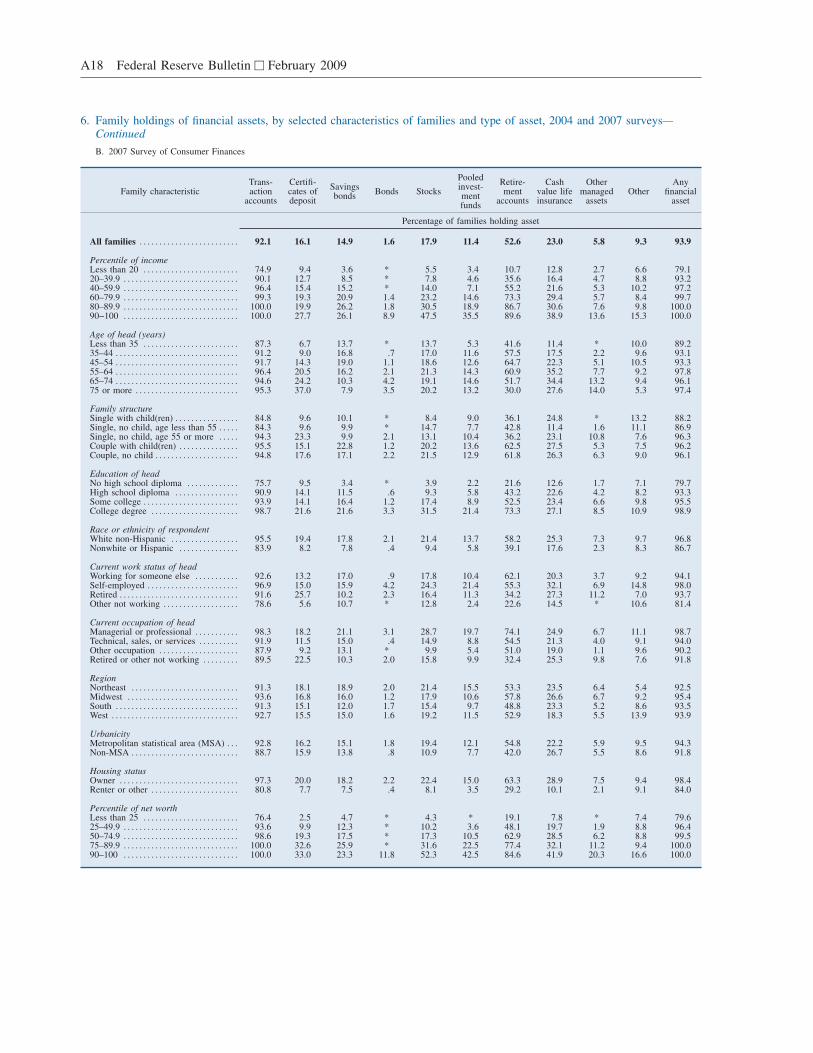
6. Family holdings of financial assets, by selected characteristics of families and type of asset, 2004 and 2007 surveys—Continued
B. 2007 Survey of Consumer Finances
Family characteristicTrans-action
accounts
Certifi-cates ofdeposit
Savingsbonds
Bonds Stocks
Pooledinvest-mentfunds
Retire-ment
accounts
Cashvalue lifeinsurance
Othermanaged
assetsOther
Anyfinancial
asset
Percentage of families holding asset
All families . . . . . . . . . . . . . . . . . . . . . . . . . 92.1 16.1 14.9 1.6 17.9 11.4 52.6 23.0 5.8 9.3 93.9
Percentile of incomeLess than 20 . . . . . . . . . . . . . . . . . . . . . . . . 74.9 9.4 3.6 * 5.5 3.4 10.7 12.8 2.7 6.6 79.120–39.9 . . . . . . . . . . . . . . . . . . . . . . . . . . . . . 90.1 12.7 8.5 * 7.8 4.6 35.6 16.4 4.7 8.8 93.240–59.9 . . . . . . . . . . . . . . . . . . . . . . . . . . . . . 96.4 15.4 15.2 * 14.0 7.1 55.2 21.6 5.3 10.2 97.260–79.9 . . . . . . . . . . . . . . . . . . . . . . . . . . . . . 99.3 19.3 20.9 1.4 23.2 14.6 73.3 29.4 5.7 8.4 99.780–89.9 . . . . . . . . . . . . . . . . . . . . . . . . . . . . . 100.0 19.9 26.2 1.8 30.5 18.9 86.7 30.6 7.6 9.8 100.090−100 . . . . . . . . . . . . . . . . . . . . . . . . . . . . . 100.0 27.7 26.1 8.9 47.5 35.5 89.6 38.9 13.6 15.3 100.0
Age of head (years)Less than 35 . . . . . . . . . . . . . . . . . . . . . . . . 87.3 6.7 13.7 * 13.7 5.3 41.6 11.4 * 10.0 89.235–44 . . . . . . . . . . . . . . . . . . . . . . . . . . . . . . . 91.2 9.0 16.8 .7 17.0 11.6 57.5 17.5 2.2 9.6 93.145–54 . . . . . . . . . . . . . . . . . . . . . . . . . . . . . . . 91.7 14.3 19.0 1.1 18.6 12.6 64.7 22.3 5.1 10.5 93.355–64 . . . . . . . . . . . . . . . . . . . . . . . . . . . . . . . 96.4 20.5 16.2 2.1 21.3 14.3 60.9 35.2 7.7 9.2 97.865–74 . . . . . . . . . . . . . . . . . . . . . . . . . . . . . . . 94.6 24.2 10.3 4.2 19.1 14.6 51.7 34.4 13.2 9.4 96.175 or more . . . . . . . . . . . . . . . . . . . . . . . . . . 95.3 37.0 7.9 3.5 20.2 13.2 30.0 27.6 14.0 5.3 97.4
Family structureSingle with child(ren) . . . . . . . . . . . . . . . . 84.8 9.6 10.1 * 8.4 9.0 36.1 24.8 * 13.2 88.2Single, no child, age less than 55 . . . . . 84.3 9.6 9.9 * 14.7 7.7 42.8 11.4 1.6 11.1 86.9Single, no child, age 55 or more . . . . . 94.3 23.3 9.9 2.1 13.1 10.4 36.2 23.1 10.8 7.6 96.3Couple with child(ren) . . . . . . . . . . . . . . . 95.5 15.1 22.8 1.2 20.2 13.6 62.5 27.5 5.3 7.5 96.2Couple, no child . . . . . . . . . . . . . . . . . . . . . 94.8 17.6 17.1 2.2 21.5 12.9 61.8 26.3 6.3 9.0 96.1
Education of headNo high school diploma . . . . . . . . . . . . . 75.7 9.5 3.4 * 3.9 2.2 21.6 12.6 1.7 7.1 79.7High school diploma . . . . . . . . . . . . . . . . 90.9 14.1 11.5 .6 9.3 5.8 43.2 22.6 4.2 8.2 93.3Some college . . . . . . . . . . . . . . . . . . . . . . . . 93.9 14.1 16.4 1.2 17.4 8.9 52.5 23.4 6.6 9.8 95.5College degree . . . . . . . . . . . . . . . . . . . . . . 98.7 21.6 21.6 3.3 31.5 21.4 73.3 27.1 8.5 10.9 98.9
Race or ethnicity of respondentWhite non-Hispanic . . . . . . . . . . . . . . . . . 95.5 19.4 17.8 2.1 21.4 13.7 58.2 25.3 7.3 9.7 96.8Nonwhite or Hispanic . . . . . . . . . . . . . . . 83.9 8.2 7.8 .4 9.4 5.8 39.1 17.6 2.3 8.3 86.7
Current work status of headWorking for someone else . . . . . . . . . . . 92.6 13.2 17.0 .9 17.8 10.4 62.1 20.3 3.7 9.2 94.1Self-employed . . . . . . . . . . . . . . . . . . . . . . . 96.9 15.0 15.9 4.2 24.3 21.4 55.3 32.1 6.9 14.8 98.0Retired . . . . . . . . . . . . . . . . . . . . . . . . . . . . . . 91.6 25.7 10.2 2.3 16.4 11.3 34.2 27.3 11.2 7.0 93.7Other not working . . . . . . . . . . . . . . . . . . . 78.6 5.6 10.7 * 12.8 2.4 22.6 14.5 * 10.6 81.4
Current occupation of headManagerial or professional . . . . . . . . . . . 98.3 18.2 21.1 3.1 28.7 19.7 74.1 24.9 6.7 11.1 98.7Technical, sales, or services . . . . . . . . . . 91.9 11.5 15.0 .4 14.9 8.8 54.5 21.3 4.0 9.1 94.0Other occupation . . . . . . . . . . . . . . . . . . . . 87.9 9.2 13.1 * 9.9 5.4 51.0 19.0 1.1 9.6 90.2Retired or other not working . . . . . . . . . 89.5 22.5 10.3 2.0 15.8 9.9 32.4 25.3 9.8 7.6 91.8
RegionNortheast . . . . . . . . . . . . . . . . . . . . . . . . . . . 91.3 18.1 18.9 2.0 21.4 15.5 53.3 23.5 6.4 5.4 92.5Midwest . . . . . . . . . . . . . . . . . . . . . . . . . . . . 93.6 16.8 16.0 1.2 17.9 10.6 57.8 26.6 6.7 9.2 95.4South . . . . . . . . . . . . . . . . . . . . . . . . . . . . . . . 91.3 15.1 12.0 1.7 15.4 9.7 48.8 23.3 5.2 8.6 93.5West . . . . . . . . . . . . . . . . . . . . . . . . . . . . . . . . 92.7 15.5 15.0 1.6 19.2 11.5 52.9 18.3 5.5 13.9 93.9
UrbanicityMetropolitan statistical area (MSA) . . . 92.8 16.2 15.1 1.8 19.4 12.1 54.8 22.2 5.9 9.5 94.3Non-MSA . . . . . . . . . . . . . . . . . . . . . . . . . . . 88.7 15.9 13.8 .8 10.9 7.7 42.0 26.7 5.5 8.6 91.8
Housing statusOwner . . . . . . . . . . . . . . . . . . . . . . . . . . . . . . 97.3 20.0 18.2 2.2 22.4 15.0 63.3 28.9 7.5 9.4 98.4Renter or other . . . . . . . . . . . . . . . . . . . . . . 80.8 7.7 7.5 .4 8.1 3.5 29.2 10.1 2.1 9.1 84.0
Percentile of net worthLess than 25 . . . . . . . . . . . . . . . . . . . . . . . . 76.4 2.5 4.7 * 4.3 * 19.1 7.8 * 7.4 79.625–49.9 . . . . . . . . . . . . . . . . . . . . . . . . . . . . . 93.6 9.9 12.3 * 10.2 3.6 48.1 19.7 1.9 8.8 96.450–74.9 . . . . . . . . . . . . . . . . . . . . . . . . . . . . . 98.6 19.3 17.5 * 17.3 10.5 62.9 28.5 6.2 8.8 99.575–89.9 . . . . . . . . . . . . . . . . . . . . . . . . . . . . . 100.0 32.6 25.9 * 31.6 22.5 77.4 32.1 11.2 9.4 100.090–100 . . . . . . . . . . . . . . . . . . . . . . . . . . . . . 100.0 33.0 23.3 11.8 52.3 42.5 84.6 41.9 20.3 16.6 100.0
A18 Federal Reserve Bulletin h February 2009
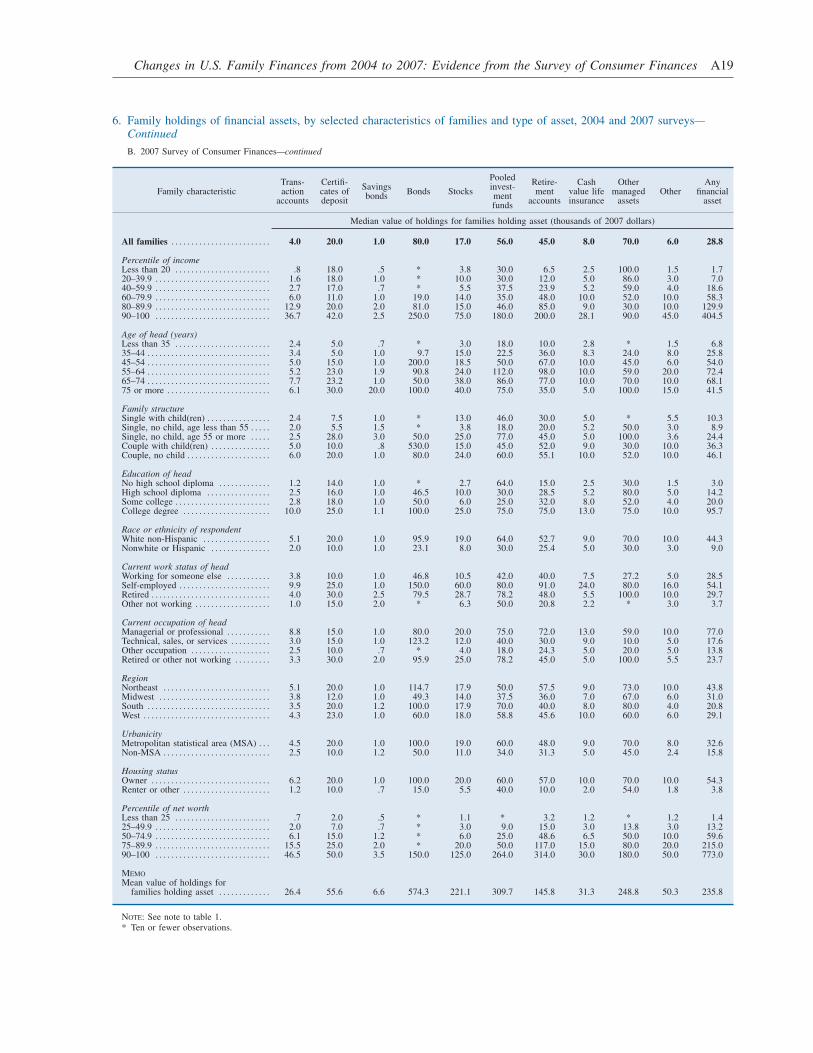
6. Family holdings of financial assets, by selected characteristics of families and type of asset, 2004 and 2007 surveys—Continued
B. 2007 Survey of Consumer Finances—continued
Family characteristicTrans-action
accounts
Certifi-cates ofdeposit
Savingsbonds
Bonds Stocks
Pooledinvest-mentfunds
Retire-ment
accounts
Cashvalue lifeinsurance
Othermanaged
assetsOther
Anyfinancial
asset
Median value of holdings for families holding asset (thousands of 2007 dollars)
All families . . . . . . . . . . . . . . . . . . . . . . . . . 4.0 20.0 1.0 80.0 17.0 56.0 45.0 8.0 70.0 6.0 28.8
Percentile of incomeLess than 20 . . . . . . . . . . . . . . . . . . . . . . . . .8 18.0 .5 * 3.8 30.0 6.5 2.5 100.0 1.5 1.720–39.9 . . . . . . . . . . . . . . . . . . . . . . . . . . . . . 1.6 18.0 1.0 * 10.0 30.0 12.0 5.0 86.0 3.0 7.040–59.9 . . . . . . . . . . . . . . . . . . . . . . . . . . . . . 2.7 17.0 .7 * 5.5 37.5 23.9 5.2 59.0 4.0 18.660–79.9 . . . . . . . . . . . . . . . . . . . . . . . . . . . . . 6.0 11.0 1.0 19.0 14.0 35.0 48.0 10.0 52.0 10.0 58.380–89.9 . . . . . . . . . . . . . . . . . . . . . . . . . . . . . 12.9 20.0 2.0 81.0 15.0 46.0 85.0 9.0 30.0 10.0 129.990–100 . . . . . . . . . . . . . . . . . . . . . . . . . . . . . 36.7 42.0 2.5 250.0 75.0 180.0 200.0 28.1 90.0 45.0 404.5
Age of head (years)Less than 35 . . . . . . . . . . . . . . . . . . . . . . . . 2.4 5.0 .7 * 3.0 18.0 10.0 2.8 * 1.5 6.835–44 . . . . . . . . . . . . . . . . . . . . . . . . . . . . . . . 3.4 5.0 1.0 9.7 15.0 22.5 36.0 8.3 24.0 8.0 25.845–54 . . . . . . . . . . . . . . . . . . . . . . . . . . . . . . . 5.0 15.0 1.0 200.0 18.5 50.0 67.0 10.0 45.0 6.0 54.055–64 . . . . . . . . . . . . . . . . . . . . . . . . . . . . . . . 5.2 23.0 1.9 90.8 24.0 112.0 98.0 10.0 59.0 20.0 72.465–74 . . . . . . . . . . . . . . . . . . . . . . . . . . . . . . . 7.7 23.2 1.0 50.0 38.0 86.0 77.0 10.0 70.0 10.0 68.175 or more . . . . . . . . . . . . . . . . . . . . . . . . . . 6.1 30.0 20.0 100.0 40.0 75.0 35.0 5.0 100.0 15.0 41.5
Family structureSingle with child(ren) . . . . . . . . . . . . . . . . 2.4 7.5 1.0 * 13.0 46.0 30.0 5.0 * 5.5 10.3Single, no child, age less than 55 . . . . . 2.0 5.5 1.5 * 3.8 18.0 20.0 5.2 50.0 3.0 8.9Single, no child, age 55 or more . . . . . 2.5 28.0 3.0 50.0 25.0 77.0 45.0 5.0 100.0 3.6 24.4Couple with child(ren) . . . . . . . . . . . . . . . 5.0 10.0 .8 530.0 15.0 45.0 52.0 9.0 30.0 10.0 36.3Couple, no child . . . . . . . . . . . . . . . . . . . . . 6.0 20.0 1.0 80.0 24.0 60.0 55.1 10.0 52.0 10.0 46.1
Education of headNo high school diploma . . . . . . . . . . . . . 1.2 14.0 1.0 * 2.7 64.0 15.0 2.5 30.0 1.5 3.0High school diploma . . . . . . . . . . . . . . . . 2.5 16.0 1.0 46.5 10.0 30.0 28.5 5.2 80.0 5.0 14.2Some college . . . . . . . . . . . . . . . . . . . . . . . . 2.8 18.0 1.0 50.0 6.0 25.0 32.0 8.0 52.0 4.0 20.0College degree . . . . . . . . . . . . . . . . . . . . . . 10.0 25.0 1.1 100.0 25.0 75.0 75.0 13.0 75.0 10.0 95.7
Race or ethnicity of respondentWhite non-Hispanic . . . . . . . . . . . . . . . . . 5.1 20.0 1.0 95.9 19.0 64.0 52.7 9.0 70.0 10.0 44.3Nonwhite or Hispanic . . . . . . . . . . . . . . . 2.0 10.0 1.0 23.1 8.0 30.0 25.4 5.0 30.0 3.0 9.0
Current work status of headWorking for someone else . . . . . . . . . . . 3.8 10.0 1.0 46.8 10.5 42.0 40.0 7.5 27.2 5.0 28.5Self-employed . . . . . . . . . . . . . . . . . . . . . . . 9.9 25.0 1.0 150.0 60.0 80.0 91.0 24.0 80.0 16.0 54.1Retired . . . . . . . . . . . . . . . . . . . . . . . . . . . . . . 4.0 30.0 2.5 79.5 28.7 78.2 48.0 5.5 100.0 10.0 29.7Other not working . . . . . . . . . . . . . . . . . . . 1.0 15.0 2.0 * 6.3 50.0 20.8 2.2 * 3.0 3.7
Current occupation of headManagerial or professional . . . . . . . . . . . 8.8 15.0 1.0 80.0 20.0 75.0 72.0 13.0 59.0 10.0 77.0Technical, sales, or services . . . . . . . . . . 3.0 15.0 1.0 123.2 12.0 40.0 30.0 9.0 10.0 5.0 17.6Other occupation . . . . . . . . . . . . . . . . . . . . 2.5 10.0 .7 * 4.0 18.0 24.3 5.0 20.0 5.0 13.8Retired or other not working . . . . . . . . . 3.3 30.0 2.0 95.9 25.0 78.2 45.0 5.0 100.0 5.5 23.7
RegionNortheast . . . . . . . . . . . . . . . . . . . . . . . . . . . 5.1 20.0 1.0 114.7 17.9 50.0 57.5 9.0 73.0 10.0 43.8Midwest . . . . . . . . . . . . . . . . . . . . . . . . . . . . 3.8 12.0 1.0 49.3 14.0 37.5 36.0 7.0 67.0 6.0 31.0South . . . . . . . . . . . . . . . . . . . . . . . . . . . . . . . 3.5 20.0 1.2 100.0 17.9 70.0 40.0 8.0 80.0 4.0 20.8West . . . . . . . . . . . . . . . . . . . . . . . . . . . . . . . . 4.3 23.0 1.0 60.0 18.0 58.8 45.6 10.0 60.0 6.0 29.1
UrbanicityMetropolitan statistical area (MSA) . . . 4.5 20.0 1.0 100.0 19.0 60.0 48.0 9.0 70.0 8.0 32.6Non-MSA . . . . . . . . . . . . . . . . . . . . . . . . . . . 2.5 10.0 1.2 50.0 11.0 34.0 31.3 5.0 45.0 2.4 15.8
Housing statusOwner . . . . . . . . . . . . . . . . . . . . . . . . . . . . . . 6.2 20.0 1.0 100.0 20.0 60.0 57.0 10.0 70.0 10.0 54.3Renter or other . . . . . . . . . . . . . . . . . . . . . . 1.2 10.0 .7 15.0 5.5 40.0 10.0 2.0 54.0 1.8 3.8
Percentile of net worthLess than 25 . . . . . . . . . . . . . . . . . . . . . . . . .7 2.0 .5 * 1.1 * 3.2 1.2 * 1.2 1.425–49.9 . . . . . . . . . . . . . . . . . . . . . . . . . . . . . 2.0 7.0 .7 * 3.0 9.0 15.0 3.0 13.8 3.0 13.250–74.9 . . . . . . . . . . . . . . . . . . . . . . . . . . . . . 6.1 15.0 1.2 * 6.0 25.0 48.6 6.5 50.0 10.0 59.675–89.9 . . . . . . . . . . . . . . . . . . . . . . . . . . . . . 15.5 25.0 2.0 * 20.0 50.0 117.0 15.0 80.0 20.0 215.090–100 . . . . . . . . . . . . . . . . . . . . . . . . . . . . . 46.5 50.0 3.5 150.0 125.0 264.0 314.0 30.0 180.0 50.0 773.0
MEMO
Mean value of holdings forfamilies holding asset . . . . . . . . . . . . . 26.4 55.6 6.6 574.3 221.1 309.7 145.8 31.3 248.8 50.3 235.8
NOTE: See note to table 1.* Ten or fewer observations.
Changes in U.S. Family Finances from 2004 to 2007: Evidence from the Survey of Consumer Finances A19
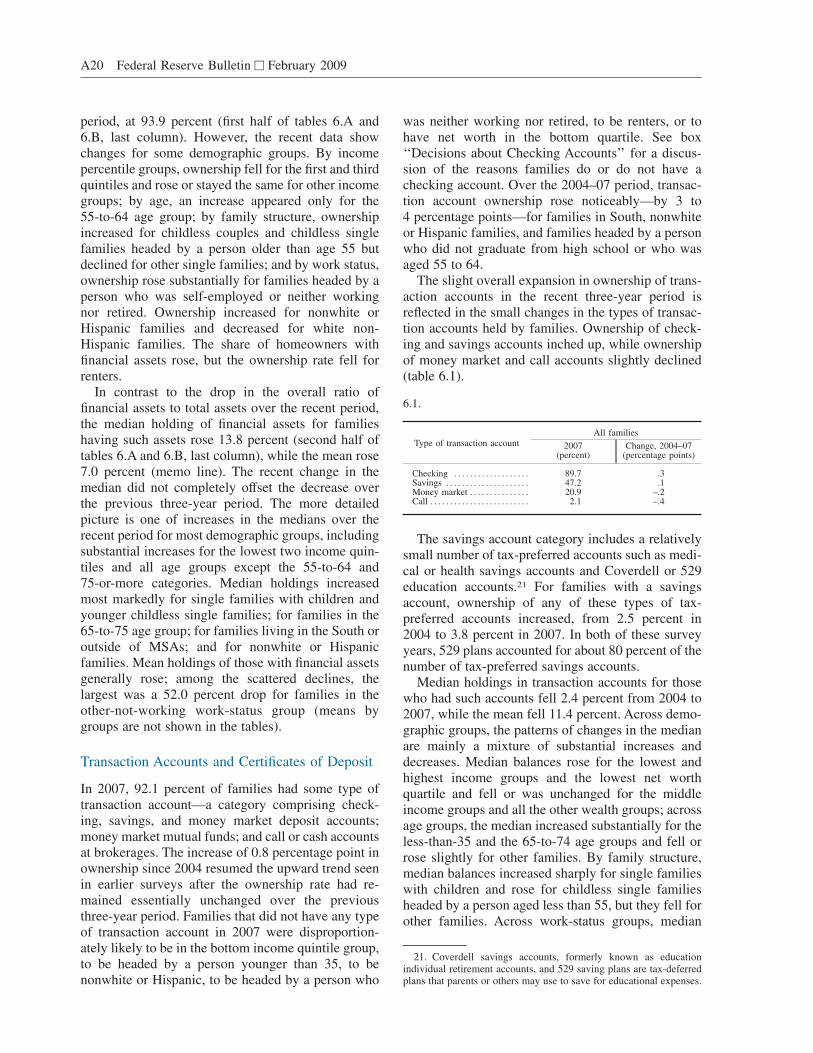
period, at 93.9 percent (first half of tables 6.A and6.B, last column). However, the recent data showchanges for some demographic groups. By incomepercentile groups, ownership fell for the first and thirdquintiles and rose or stayed the same for other incomegroups; by age, an increase appeared only for the55-to-64 age group; by family structure, ownershipincreased for childless couples and childless singlefamilies headed by a person older than age 55 butdeclined for other single families; and by work status,ownership rose substantially for families headed by aperson who was self-employed or neither workingnor retired. Ownership increased for nonwhite orHispanic families and decreased for white non-Hispanic families. The share of homeowners withfinancial assets rose, but the ownership rate fell forrenters.
In contrast to the drop in the overall ratio offinancial assets to total assets over the recent period,the median holding of financial assets for familieshaving such assets rose 13.8 percent (second half oftables 6.A and 6.B, last column), while the mean rose7.0 percent (memo line). The recent change in themedian did not completely offset the decrease overthe previous three-year period. The more detailedpicture is one of increases in the medians over therecent period for most demographic groups, includingsubstantial increases for the lowest two income quin-tiles and all age groups except the 55-to-64 and75-or-more categories. Median holdings increasedmost markedly for single families with children andyounger childless single families; for families in the65-to-75 age group; for families living in the South oroutside of MSAs; and for nonwhite or Hispanicfamilies. Mean holdings of those with financial assetsgenerally rose; among the scattered declines, thelargest was a 52.0 percent drop for families in theother-not-working work-status group (means bygroups are not shown in the tables).
Transaction Accounts and Certificates of Deposit
In 2007, 92.1 percent of families had some type oftransaction account—a category comprising check-ing, savings, and money market deposit accounts;money market mutual funds; and call or cash accountsat brokerages. The increase of 0.8 percentage point inownership since 2004 resumed the upward trend seenin earlier surveys after the ownership rate had re-mained essentially unchanged over the previousthree-year period. Families that did not have any typeof transaction account in 2007 were disproportion-ately likely to be in the bottom income quintile group,to be headed by a person younger than 35, to benonwhite or Hispanic, to be headed by a person who
was neither working nor retired, to be renters, or tohave net worth in the bottom quartile. See box‘‘Decisions about Checking Accounts’’ for a discus-sion of the reasons families do or do not have achecking account. Over the 2004–07 period, transac-tion account ownership rose noticeably—by 3 to4 percentage points—for families in South, nonwhiteor Hispanic families, and families headed by a personwho did not graduate from high school or who wasaged 55 to 64.
The slight overall expansion in ownership of trans-action accounts in the recent three-year period isreflected in the small changes in the types of transac-tion accounts held by families. Ownership of check-ing and savings accounts inched up, while ownershipof money market and call accounts slightly declined(table 6.1).
The savings account category includes a relativelysmall number of tax-preferred accounts such as medi-cal or health savings accounts and Coverdell or 529education accounts.21 For families with a savingsaccount, ownership of any of these types of tax-preferred accounts increased, from 2.5 percent in2004 to 3.8 percent in 2007. In both of these surveyyears, 529 plans accounted for about 80 percent of thenumber of tax-preferred savings accounts.
Median holdings in transaction accounts for thosewho had such accounts fell 2.4 percent from 2004 to2007, while the mean fell 11.4 percent. Across demo-graphic groups, the patterns of changes in the medianare mainly a mixture of substantial increases anddecreases. Median balances rose for the lowest andhighest income groups and the lowest net worthquartile and fell or was unchanged for the middleincome groups and all the other wealth groups; acrossage groups, the median increased substantially for theless-than-35 and the 65-to-74 age groups and fell orrose slightly for other families. By family structure,median balances increased sharply for single familieswith children and rose for childless single familiesheaded by a person aged less than 55, but they fell forother families. Across work-status groups, median
21. Coverdell savings accounts, formerly known as educationindividual retirement accounts, and 529 saving plans are tax-deferredplans that parents or others may use to save for educational expenses.
6.1.
Type of transaction accountAll families
2007(percent)
Change, 2004–07(percentage points)
Checking . . . . . . . . . . . . . . . . . . . 89.7 .3Savings . . . . . . . . . . . . . . . . . . . . . 47.2 .1Money market . . . . . . . . . . . . . . . 20.9 –.2Call . . . . . . . . . . . . . . . . . . . . . . . . . 2.1 –.4
A20 Federal Reserve Bulletin h February 2009
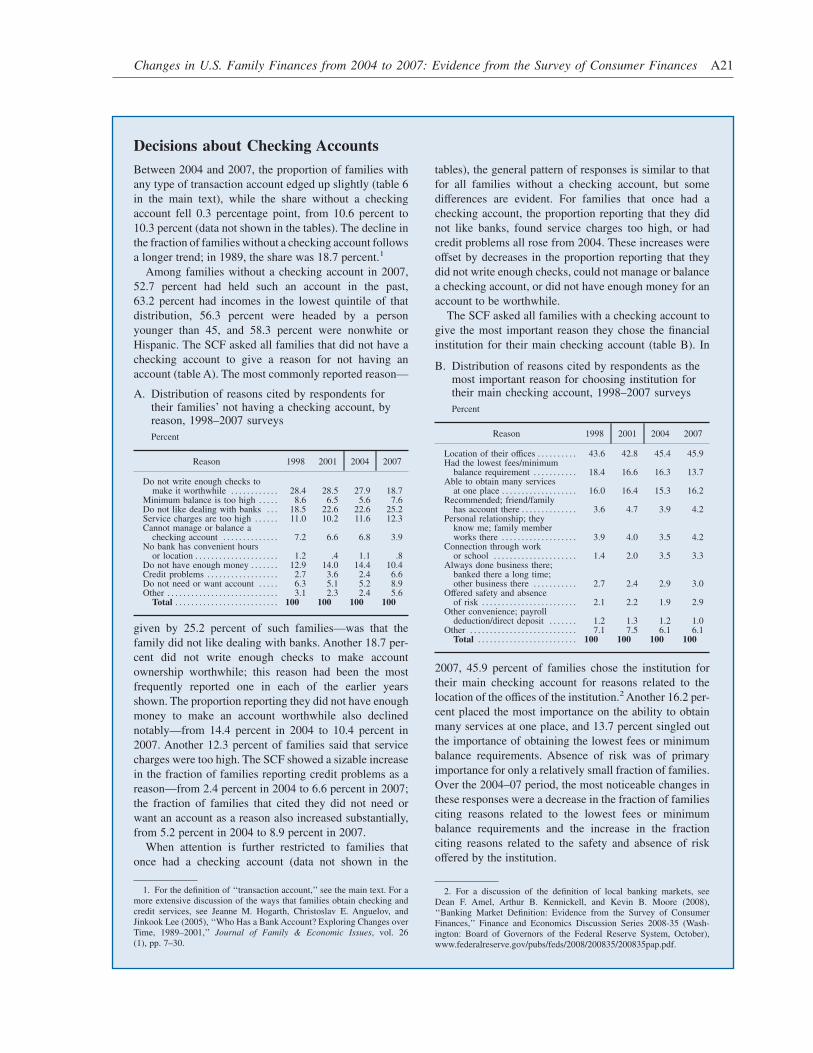
Decisions about Checking Accounts
Between 2004 and 2007, the proportion of families with
any type of transaction account edged up slightly (table 6
in the main text), while the share without a checking
account fell 0.3 percentage point, from 10.6 percent to
10.3 percent (data not shown in the tables). The decline in
the fraction of families without a checking account follows
a longer trend; in 1989, the share was 18.7 percent.1
Among families without a checking account in 2007,
52.7 percent had held such an account in the past,
63.2 percent had incomes in the lowest quintile of that
distribution, 56.3 percent were headed by a person
younger than 45, and 58.3 percent were nonwhite or
Hispanic. The SCF asked all families that did not have a
checking account to give a reason for not having an
account (table A). The most commonly reported reason—
A. Distribution of reasons cited by respondents fortheir families’ not having a checking account, byreason, 1998–2007 surveys
Percent
Reason 1998 2001 2004 2007
Do not write enough checks tomake it worthwhile . . . . . . . . . . . . 28.4 28.5 27.9 18.7
Minimum balance is too high . . . . . 8.6 6.5 5.6 7.6Do not like dealing with banks . . . 18.5 22.6 22.6 25.2Service charges are too high . . . . . . 11.0 10.2 11.6 12.3Cannot manage or balance a
checking account . . . . . . . . . . . . . . 7.2 6.6 6.8 3.9No bank has convenient hours
or location . . . . . . . . . . . . . . . . . . . . . 1.2 .4 1.1 .8Do not have enough money . . . . . . . 12.9 14.0 14.4 10.4Credit problems . . . . . . . . . . . . . . . . . . 2.7 3.6 2.4 6.6Do not need or want account . . . . . 6.3 5.1 5.2 8.9Other . . . . . . . . . . . . . . . . . . . . . . . . . . . . 3.1 2.3 2.4 5.6
Total . . . . . . . . . . . . . . . . . . . . . . . . . . 100 100 100 100
given by 25.2 percent of such families—was that the
family did not like dealing with banks. Another 18.7 per-
cent did not write enough checks to make account
ownership worthwhile; this reason had been the most
frequently reported one in each of the earlier years
shown. The proportion reporting they did not have enough
money to make an account worthwhile also declined
notably—from 14.4 percent in 2004 to 10.4 percent in
2007. Another 12.3 percent of families said that service
charges were too high. The SCF showed a sizable increase
in the fraction of families reporting credit problems as a
reason—from 2.4 percent in 2004 to 6.6 percent in 2007;
the fraction of families that cited they did not need or
want an account as a reason also increased substantially,
from 5.2 percent in 2004 to 8.9 percent in 2007.
When attention is further restricted to families that
once had a checking account (data not shown in the
1. For the definition of ‘‘transaction account,’’ see the main text. For amore extensive discussion of the ways that families obtain checking andcredit services, see Jeanne M. Hogarth, Christoslav E. Anguelov, andJinkook Lee (2005), ‘‘Who Has a Bank Account? Exploring Changes overTime, 1989–2001,’’ Journal of Family & Economic Issues, vol. 26(1), pp. 7–30.
tables), the general pattern of responses is similar to that
for all families without a checking account, but some
differences are evident. For families that once had a
checking account, the proportion reporting that they did
not like banks, found service charges too high, or had
credit problems all rose from 2004. These increases were
offset by decreases in the proportion reporting that they
did not write enough checks, could not manage or balance
a checking account, or did not have enough money for an
account to be worthwhile.
The SCF asked all families with a checking account to
give the most important reason they chose the financial
institution for their main checking account (table B). In
B. Distribution of reasons cited by respondents as themost important reason for choosing institution fortheir main checking account, 1998–2007 surveys
Percent
Reason 1998 2001 2004 2007
Location of their offices . . . . . . . . . . 43.6 42.8 45.4 45.9Had the lowest fees/minimum
balance requirement . . . . . . . . . . . 18.4 16.6 16.3 13.7Able to obtain many services
at one place . . . . . . . . . . . . . . . . . . . 16.0 16.4 15.3 16.2Recommended; friend/family
has account there . . . . . . . . . . . . . . 3.6 4.7 3.9 4.2Personal relationship; they
know me; family memberworks there . . . . . . . . . . . . . . . . . . . 3.9 4.0 3.5 4.2
Connection through workor school . . . . . . . . . . . . . . . . . . . . . 1.4 2.0 3.5 3.3
Always done business there;banked there a long time;other business there . . . . . . . . . . . 2.7 2.4 2.9 3.0
Offered safety and absenceof risk . . . . . . . . . . . . . . . . . . . . . . . . 2.1 2.2 1.9 2.9
Other convenience; payrolldeduction/direct deposit . . . . . . . 1.2 1.3 1.2 1.0
Other . . . . . . . . . . . . . . . . . . . . . . . . . . . 7.1 7.5 6.1 6.1Total . . . . . . . . . . . . . . . . . . . . . . . . . 100 100 100 100
2007, 45.9 percent of families chose the institution for
their main checking account for reasons related to the
location of the offices of the institution.2 Another 16.2 per-
cent placed the most importance on the ability to obtain
many services at one place, and 13.7 percent singled out
the importance of obtaining the lowest fees or minimum
balance requirements. Absence of risk was of primary
importance for only a relatively small fraction of families.
Over the 2004–07 period, the most noticeable changes in
these responses were a decrease in the fraction of families
citing reasons related to the lowest fees or minimum
balance requirements and the increase in the fraction
citing reasons related to the safety and absence of risk
offered by the institution.
2. For a discussion of the definition of local banking markets, seeDean F. Amel, Arthur B. Kennickell, and Kevin B. Moore (2008),‘‘Banking Market Definition: Evidence from the Survey of ConsumerFinances,’’ Finance and Economics Discussion Series 2008-35 (Wash-ington: Board of Governors of the Federal Reserve System, October),www.federalreserve.gov/pubs/feds/2008/200835/200835pap.pdf.
Changes in U.S. Family Finances from 2004 to 2007: Evidence from the Survey of Consumer Finances A21
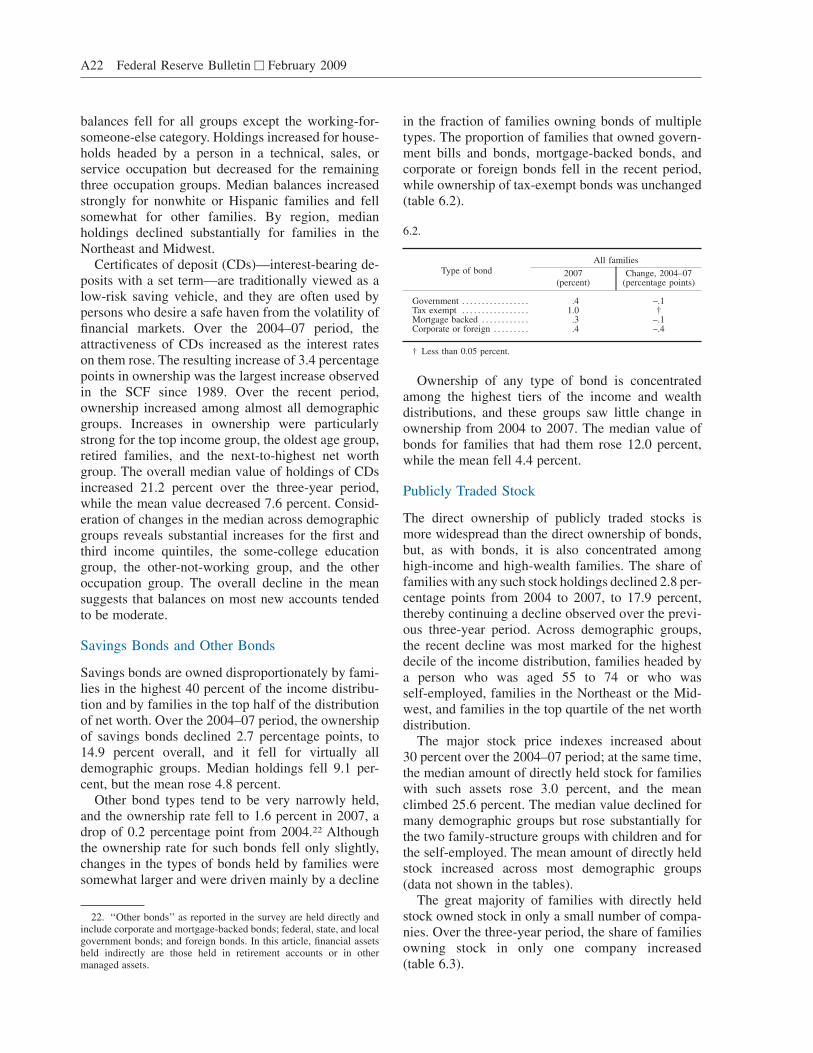
balances fell for all groups except the working-for-someone-else category. Holdings increased for house-holds headed by a person in a technical, sales, orservice occupation but decreased for the remainingthree occupation groups. Median balances increasedstrongly for nonwhite or Hispanic families and fellsomewhat for other families. By region, medianholdings declined substantially for families in theNortheast and Midwest.
Certificates of deposit (CDs)—interest-bearing de-posits with a set term—are traditionally viewed as alow-risk saving vehicle, and they are often used bypersons who desire a safe haven from the volatility offinancial markets. Over the 2004–07 period, theattractiveness of CDs increased as the interest rateson them rose. The resulting increase of 3.4 percentagepoints in ownership was the largest increase observedin the SCF since 1989. Over the recent period,ownership increased among almost all demographicgroups. Increases in ownership were particularlystrong for the top income group, the oldest age group,retired families, and the next-to-highest net worthgroup. The overall median value of holdings of CDsincreased 21.2 percent over the three-year period,while the mean value decreased 7.6 percent. Consid-eration of changes in the median across demographicgroups reveals substantial increases for the first andthird income quintiles, the some-college educationgroup, the other-not-working group, and the otheroccupation group. The overall decline in the meansuggests that balances on most new accounts tendedto be moderate.
Savings Bonds and Other Bonds
Savings bonds are owned disproportionately by fami-lies in the highest 40 percent of the income distribu-tion and by families in the top half of the distributionof net worth. Over the 2004–07 period, the ownershipof savings bonds declined 2.7 percentage points, to14.9 percent overall, and it fell for virtually alldemographic groups. Median holdings fell 9.1 per-cent, but the mean rose 4.8 percent.
Other bond types tend to be very narrowly held,and the ownership rate fell to 1.6 percent in 2007, adrop of 0.2 percentage point from 2004.22 Althoughthe ownership rate for such bonds fell only slightly,changes in the types of bonds held by families weresomewhat larger and were driven mainly by a decline
in the fraction of families owning bonds of multipletypes. The proportion of families that owned govern-ment bills and bonds, mortgage-backed bonds, andcorporate or foreign bonds fell in the recent period,while ownership of tax-exempt bonds was unchanged(table 6.2).
Ownership of any type of bond is concentratedamong the highest tiers of the income and wealthdistributions, and these groups saw little change inownership from 2004 to 2007. The median value ofbonds for families that had them rose 12.0 percent,while the mean fell 4.4 percent.
Publicly Traded Stock
The direct ownership of publicly traded stocks ismore widespread than the direct ownership of bonds,but, as with bonds, it is also concentrated amonghigh-income and high-wealth families. The share offamilies with any such stock holdings declined 2.8 per-centage points from 2004 to 2007, to 17.9 percent,thereby continuing a decline observed over the previ-ous three-year period. Across demographic groups,the recent decline was most marked for the highestdecile of the income distribution, families headed bya person who was aged 55 to 74 or who wasself-employed, families in the Northeast or the Mid-west, and families in the top quartile of the net worthdistribution.
The major stock price indexes increased about30 percent over the 2004–07 period; at the same time,the median amount of directly held stock for familieswith such assets rose 3.0 percent, and the meanclimbed 25.6 percent. The median value declined formany demographic groups but rose substantially forthe two family-structure groups with children and forthe self-employed. The mean amount of directly heldstock increased across most demographic groups(data not shown in the tables).
The great majority of families with directly heldstock owned stock in only a small number of compa-nies. Over the three-year period, the share of familiesowning stock in only one company increased(table 6.3).
22. ‘‘Other bonds’’ as reported in the survey are held directly andinclude corporate and mortgage-backed bonds; federal, state, and localgovernment bonds; and foreign bonds. In this article, financial assetsheld indirectly are those held in retirement accounts or in othermanaged assets.
6.2.
Type of bondAll families
2007(percent)
Change, 2004–07(percentage points)
Government . . . . . . . . . . . . . . . . . .4 –.1Tax exempt . . . . . . . . . . . . . . . . . 1.0 †Mortgage backed . . . . . . . . . . . . .3 –.1Corporate or foreign . . . . . . . . . .4 –.4
† Less than 0.05 percent.
A22 Federal Reserve Bulletin h February 2009
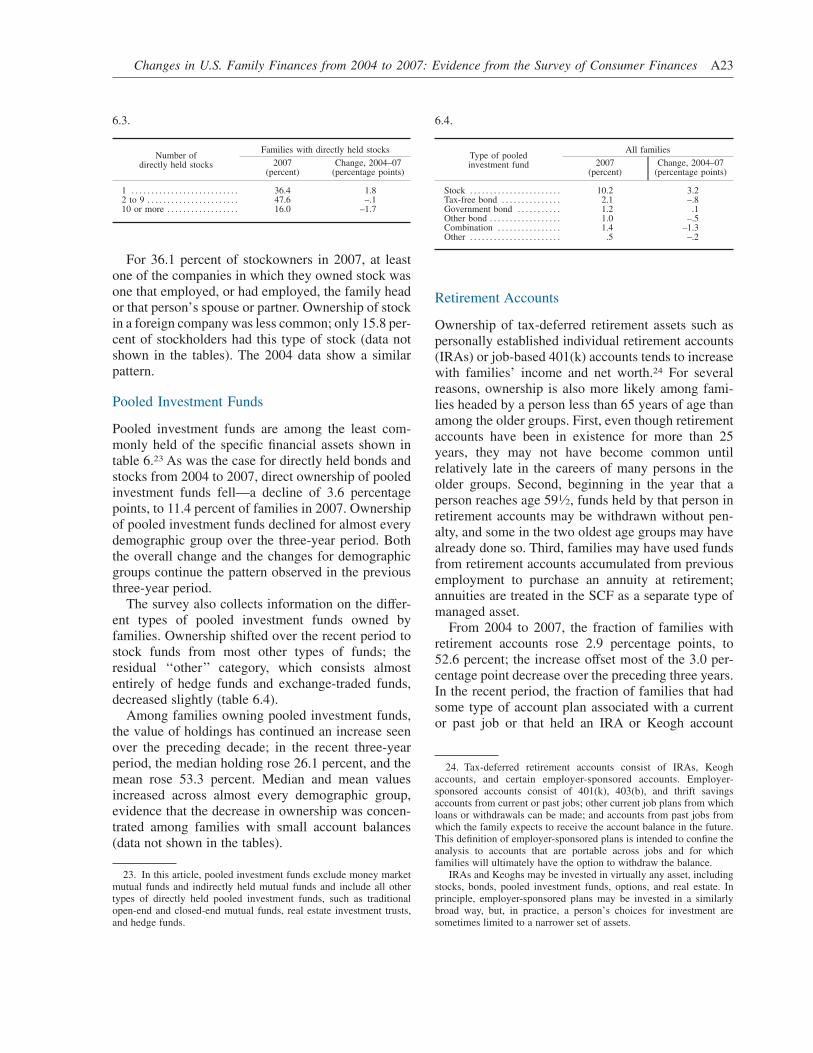
For 36.1 percent of stockowners in 2007, at leastone of the companies in which they owned stock wasone that employed, or had employed, the family heador that person’s spouse or partner. Ownership of stockin a foreign company was less common; only 15.8 per-cent of stockholders had this type of stock (data notshown in the tables). The 2004 data show a similarpattern.
Pooled Investment Funds
Pooled investment funds are among the least com-monly held of the specific financial assets shown intable 6.23 As was the case for directly held bonds andstocks from 2004 to 2007, direct ownership of pooledinvestment funds fell—a decline of 3.6 percentagepoints, to 11.4 percent of families in 2007. Ownershipof pooled investment funds declined for almost everydemographic group over the three-year period. Boththe overall change and the changes for demographicgroups continue the pattern observed in the previousthree-year period.
The survey also collects information on the differ-ent types of pooled investment funds owned byfamilies. Ownership shifted over the recent period tostock funds from most other types of funds; theresidual ‘‘other’’ category, which consists almostentirely of hedge funds and exchange-traded funds,decreased slightly (table 6.4).
Among families owning pooled investment funds,the value of holdings has continued an increase seenover the preceding decade; in the recent three-yearperiod, the median holding rose 26.1 percent, and themean rose 53.3 percent. Median and mean valuesincreased across almost every demographic group,evidence that the decrease in ownership was concen-trated among families with small account balances(data not shown in the tables).
Retirement Accounts
Ownership of tax-deferred retirement assets such aspersonally established individual retirement accounts(IRAs) or job-based 401(k) accounts tends to increasewith families’ income and net worth.24 For severalreasons, ownership is also more likely among fami-lies headed by a person less than 65 years of age thanamong the older groups. First, even though retirementaccounts have been in existence for more than 25years, they may not have become common untilrelatively late in the careers of many persons in theolder groups. Second, beginning in the year that aperson reaches age 591⁄2, funds held by that person inretirement accounts may be withdrawn without pen-alty, and some in the two oldest age groups may havealready done so. Third, families may have used fundsfrom retirement accounts accumulated from previousemployment to purchase an annuity at retirement;annuities are treated in the SCF as a separate type ofmanaged asset.
From 2004 to 2007, the fraction of families withretirement accounts rose 2.9 percentage points, to52.6 percent; the increase offset most of the 3.0 per-centage point decrease over the preceding three years.In the recent period, the fraction of families that hadsome type of account plan associated with a currentor past job or that held an IRA or Keogh account
23. In this article, pooled investment funds exclude money marketmutual funds and indirectly held mutual funds and include all othertypes of directly held pooled investment funds, such as traditionalopen-end and closed-end mutual funds, real estate investment trusts,and hedge funds.
24. Tax-deferred retirement accounts consist of IRAs, Keoghaccounts, and certain employer-sponsored accounts. Employer-sponsored accounts consist of 401(k), 403(b), and thrift savingsaccounts from current or past jobs; other current job plans from whichloans or withdrawals can be made; and accounts from past jobs fromwhich the family expects to receive the account balance in the future.This definition of employer-sponsored plans is intended to confine theanalysis to accounts that are portable across jobs and for whichfamilies will ultimately have the option to withdraw the balance.
IRAs and Keoghs may be invested in virtually any asset, includingstocks, bonds, pooled investment funds, options, and real estate. Inprinciple, employer-sponsored plans may be invested in a similarlybroad way, but, in practice, a person’s choices for investment aresometimes limited to a narrower set of assets.
6.3.
Number ofdirectly held stocks
Families with directly held stocks
2007(percent)
Change, 2004–07(percentage points)
1 . . . . . . . . . . . . . . . . . . . . . . . . . . . 36.4 1.82 to 9 . . . . . . . . . . . . . . . . . . . . . . . 47.6 –.110 or more . . . . . . . . . . . . . . . . . . 16.0 –1.7
6.4.
Type of pooledinvestment fund
All families
2007(percent)
Change, 2004–07(percentage points)
Stock . . . . . . . . . . . . . . . . . . . . . . . 10.2 3.2Tax-free bond . . . . . . . . . . . . . . . 2.1 –.8Government bond . . . . . . . . . . . 1.2 .1Other bond . . . . . . . . . . . . . . . . . . 1.0 –.5Combination . . . . . . . . . . . . . . . . 1.4 –1.3Other . . . . . . . . . . . . . . . . . . . . . . . .5 –.2
Changes in U.S. Family Finances from 2004 to 2007: Evidence from the Survey of Consumer Finances A23

increased, and the fraction that had at least oneaccount of each type rose as well (table 6.5).
Over the 2004–07 period, ownership increased fornearly all groups. Substantial increases were reportedfor families in the 45-to-54 and 65-to-74 age groups,nonwhite or Hispanic families, families living in theSouth, and families in the technical, sales, or servicesoccupation group.
In a continuation of the trend over the precedingdecade, holdings in retirement accounts increasedmarkedly in the 2004–07 period; for families havingretirement accounts, the median rose 16.3 percent,and the mean rose 9.5 percent. Gains also appeared inthe median holdings of most demographic groupsover the recent period; some of the largest increaseswere for families in the middle of the income andwealth distributions, families in the high-school-diploma and some-college education groups, singlefamilies with children, nonwhite or Hispanic families,the self-employed work-status group, families in theSouth and West, and families residing in non-MSAareas.
Although tax-deferred retirement assets are clearlyan important element in retirement planning, familiesmay hold a variety of other assets that are intended, atleast in part, to finance retirement. Such other assetsmight also be used for contingencies as necessary.Similarly, a need for liquidity might drive a family toliquidate or borrow against a tax-deferred retirementasset, even if it will be assessed a penalty for doingso.
Two common and often particularly importanttypes of retirement plans are not included in the assetsdescribed in this section: Social Security (the feder-ally funded Old-Age and Survivors’ Insurance pro-gram, or OASI) and employer-sponsored defined-benefit plans. OASI is well described elsewhere, andit covers the great majority of the population.25 Theretirement income provided by defined-benefit plans
is typically based on workers’ salaries and years ofwork with an employer, a group of employers, or aunion. Unfortunately, future income streams fromOASI and defined-benefit plans cannot be translateddirectly into a current value because valuation de-pends critically on assumptions about future eventsand conditions—work decisions, earnings, inflationrates, discount rates, mortality, and so on—and nowidely agreed-upon standards exist for making theseassumptions.26
However, the SCF does contain substantial infor-mation for family heads and their spouse or partnerregarding any defined-benefit plans or other types ofplans with some kind of account feature to which theyhave rights from a current or past job.27 In 2007,57.7 percent of families had rights to some type ofplan other than OASI through the current or pastwork of either the family head or that person’s spouseor partner, a level nearly the same as in 2004. For thisgroup of families, the fraction with a standard defined-benefit plan with an annuity payout scheme declinedover the recent period, while the fraction with a planwith at least some account feature and the fractionthat had both types of plans increased (table 6.6).
In many pension plans with account features, con-tributions may be made by the employer, the worker,or both. In some cases, these contributions represent asubstantial amount of saving, though workers mayoffset this saving by reducing their saving in otherforms. An employer’s contributions also representadditional income for the worker. In 2007, 87.1 per-cent of families with an account plan on a current job
25. For a detailed description of OASI, see Social Security Admin-istration, ‘‘Online Social Security Handbook,’’ Publication 65-008,www.ssa.gov/OP_Home/handbook/ssa-hbk.htm.
26. For one possible calculation of net worth that includes theannuity value of payments from defined-benefit pensions and OASI,see Arthur B. Kennickell and Annika E. Sunden (1997), ‘‘Pensions,Social Security, and the Distribution of Wealth,’’ Finance and Econom-ics Discussion Series 1997-55 (Washington: Board of Governors ofthe Federal Reserve System, October), www.federalreserve.gov/ pubs/feds/1997/index.html.
27. The definition of account plan used here differs slightly fromthat used in computing the survey wealth measure, which includesaccount balances only if the family has the ability to make withdrawalsfrom, or borrow against, the account. Here the only criterion used inclassification is whether any account balance exists. For example, adefined-benefit plan with a portable cash option, which would allowthe covered worker to receive a lump sum in lieu of regular paymentsin retirement, would be treated as an account plan here.
6.5.
Type of retirement accountAll families
2007(percent)
Change, 2004–07(percentage points)
Account plan from currentor past job . . . . . . . . . . . . . . . . 38.0 2.0
Individual retirement accountor Keogh . . . . . . . . . . . . . . . . . 30.6 1.6
MEMO
Both types . . . . . . . . . . . . . . . . . . 14.3 1.8
6.6.
Type of pension planFamilies with any pension plan
2007(percent)
Change, 2004–07(percentage points)
Defined benefit . . . . . . . . . . . . . . 55.8 –1.6Account plan . . . . . . . . . . . . . . . . 65.8 3.3
MEMO
Both types . . . . . . . . . . . . . . . . . . 21.6 1.8
A24 Federal Reserve Bulletin h February 2009

of either the family head or that person’s spouse orpartner had an employer that made contributions tothe plan, a decline of 1.6 percentage points from2004. In 2007, 91.4 percent of families with suchplans made contributions themselves, an increase of2.1 percentage points from 2004. The median annualcontribution by employers who contributed to suchaccounts was $2,200 in 2007, and the median contri-bution by families that contributed was $2,500; bothamounts fell slightly from 2004 levels (data notshown in the tables).
The eligibility of working heads of families toparticipate in any type of job-related pension rosefrom 54.8 percent in 2004 to 55.9 percent in 2007; ithad declined 2.4 percentage points over the precedingthree years (data not shown in the tables). Participa-tion by eligible workers is usually voluntary. In 2007,83.8 percent of family heads who were eligible toparticipate elected to do so, down slightly from84.1 percent in 2004.28 The choice to participateappears to be related strongly to income. In 2007, thefraction of eligible family heads declining to partici-pate fell as income rose, and this general pattern wasnot substantially altered from 2004 (table 6.7).
Cash Value Life Insurance
Cash value life insurance combines an investmentvehicle with insurance coverage in the form of adeath benefit.29 Some cash value life insurance poli-cies offer a high degree of choice in the way the
policy payments are invested. Investment returns onsuch policies are typically shielded from taxationuntil the money is withdrawn; if the funds remainuntapped until the policyholder dies, the beneficiaryof the policy may receive, tax-free, the death benefitor the cash value, whichever is greater. In contrast,term insurance, the other popular type of life insur-ance, offers only a death benefit. One attraction ofcash value policies for some people is that theypromote regular saving funded through the requiredpolicy premium.
Ownership of cash value life insurance is broadlyspread across demographic groups, with a tendencytoward increasing rates among families with higherlevels of income and net worth and those with olderfamily heads. Ownership of cash value policies overthe 2004–07 period continued a declining trend,decreasing 1.2 percentage points, to 23.0 percent offamilies in 2007. The decline was shared by mostdemographic groups. Over the three-year period,ownership of any type of life insurance, cash value orterm, also fell slightly—from 65.4 percent in 2004 to64.9 percent in 2007 (data not shown in the tables).Of those families with some type of life insurance, theproportion with term policies was about unchanged,while the proportion with cash value policies fell;these changes are similar to trends in the earliersurveys.
After declining over the previous three-year period,the median value of cash value life insurance forfamilies that had any such insurance rose 21.2 percentbetween 2004 and 2007, and the mean rose 23.7 per-cent. The median showed increases across mostdemographic groups, although it declined consider-ably for families in the other-not-working work-statuscategory, renter families, and families in the secondquartile of the wealth distribution.
Other Managed Assets
Ownership of other managed assets—personal annu-ities and trusts with an equity interest and managedinvestment accounts—is concentrated among fami-lies with higher levels of income and wealth andamong families headed by a person who is aged 55 orolder or who is retired.30 Ownership of these assets
28. An analysis of the March Current Population Survey (CPS)with a definition of family head that is closest to that in this articleshows an opposite trend in pension eligibility for employed familyheads, but that trend is at a similar level as in the SCF. The CPSeligibility estimate for family heads with a job in the past year was57.8 percent in 2004 and 53.9 percent in 2007. Differences in thedefinition of the relevant employment may explain some of thedifference in the levels in the two surveys. Unlike the SCF, the CPSshows a small increase in the uptake rate for such eligible workers—from 83.0 percent in 2004 to 83.3 percent in 2007.
29. The survey measures the value of such policies according totheir current cash value, not their death benefit. The cash value isincluded as an asset in this article only when the cash value at the timeof the interview was nonzero.
30. Annuities may be those in which the family has an equityinterest in the asset or in which the family possesses an entitlementonly to a stream of income. The wealth figures in this article includeonly the annuities in which the family has an equity interest. In 2007,5.5 percent of families reported having any type of annuity, and ofthese families, 81.0 percent reported having an equity interest. Thetrusts or managed investment accounts included in other managedassets are those in which families have an equity interest and for whichcomponent parts were not separately reported. Typically, such accounts
6.7.
Percentile of income
Families headed by a person whowas eligible for a work-related
retirement plan on a current job andwho declined to participate
2007(percent)
Change, 2004–07(percentage points)
Less than 20 . . . . . . . . . . . . . . . . 54.3 3.720–39.9 . . . . . . . . . . . . . . . . . . . . . 28.1 –1.640–59.9 . . . . . . . . . . . . . . . . . . . . . 18.5 .360–79.9 . . . . . . . . . . . . . . . . . . . . . 10.5 –1.580–89.9 . . . . . . . . . . . . . . . . . . . . . 10.9 2.090–100 . . . . . . . . . . . . . . . . . . . . . 6.5 1.5
Changes in U.S. Family Finances from 2004 to 2007: Evidence from the Survey of Consumer Finances A25

declined 1.5 percentage points between 2004 and2007 after a small increase over the previous threeyears. Ownership fell in the recent three-year periodfor almost every demographic group, with the largestdeclines for families in the Midwest and for thenext-to-highest income and net worth groups. Acrossall families, the fraction with an annuity declined overthe period, and the fraction with a trust or managedinvestment account inched up, while the fraction withboth categories of managed assets was essentiallyunchanged (table 6.8).
Between 2004 and 2007, the median value of othermanaged assets for families that had such assetsincreased 41.7 percent, an increase that offset thedecline in the preceding three-year period. Over themore recent period, the corresponding mean valueincreased 9.4 percent. Median holdings rose for manydemographic groups; noticeable exceptions were fami-lies in the top two income deciles and families headedby a person who was working for someone else orwho was working in a technical, sales, or service jobor a job in the other-occupation category. The rise inthe median value reflects substantial increases inannuities and modest increases in trusts or managedinvestment accounts. For families with an equityinterest in an annuity, the median holding rose23.1 percent, to $50,000 in 2007; for families with atrust or managed investment account as defined in
this article, the median holding rose 9.1 percent, to$120,000 (data not shown in the tables).
As noted in the discussion of retirement accounts,some families use settlements from retirement ac-counts to purchase an annuity. In 2007, 30.4 percentof families with annuities had done so (data notshown in the tables). Of these families, 71.7 percenthad an equity interest in their annuities.
Other Financial Assets
Ownership of other financial assets—a heterogeneouscategory including oil and gas leases, futures con-tracts, royalties, proceeds from lawsuits or estates insettlement, and loans made to others—fell 0.7 per-centage point between 2004 and 2007, to 9.3 percent.Ownership of such assets tends to be more commonamong higher income and wealth groups, youngerage groups, and families headed by a person who isself-employed. Ownership across demographic groupsgenerally declined over this period, while the medianholding for those who had such assets increased36.4 percent, to $6,000.
Holdings may be grouped into four categories:cash, which includes money owed to families byother persons; future proceeds, which include amountsto be received from a lawsuit, estate, or other type ofsettlement; business items, which include deferredcompensation, royalties, futures contracts, and deriva-tives; and other. The proportion of families holdingvarious types of other financial assets remained fairlyconstant over the three-year period, with cash beingby far the most frequently held component (table 6.9).
Some publicly traded companies offer stock op-tions to their employees as a form of compensation.31
Although stock options, when executed, may repre-sent an appreciable part of a family’s net worth, thesurvey does not specifically ask for the value of theseoptions.32 Instead, the survey asks whether the family
are those in which the ownership is complicated or the management isundertaken by a professional. In 2007, 84.8 percent of families withtrusts or managed investment accounts had an equity interest in suchan account.
The survey encourages respondents who have trusts or managedinvestment accounts that are held in relatively common investments toreport the components. Of the 3.8 percent of families that reportedhaving any kind of trust or managed investment account in 2007,47.1 percent of them reported at least one of the component assetsseparately. Of families that detailed the components in 2007, 84.8 per-cent reported some type of financial asset, 19.0 percent reported aprimary residence, 15.3 percent reported other real estate, 15.3 percentreported a business, and 2.9 percent reported another type of asset(data not shown in the tables). The fraction of these families reportingthe primary residence as a trust component increased 8.0 percentagepoints between 2004 and 2007, and the fraction reporting a businessincreased 11.7 percentage points; the fraction reporting other realestate or another type of asset was little changed.
31. See Jeffrey L. Schildkraut (2004), ‘‘Stock Options: NationalCompensation Survey Update’’ (Washington: Bureau of Labor Statis-tics, September), www.bls.gov/opub/cwc/cm20040628yb01p1.htm.
32. Because such options are typically not publicly traded or theirexecution is otherwise constrained, their value is uncertain until the
6.8.
Type of other managed assetAll families
2007(percent)
Change, 2004–07(percentage points)
Annuity . . . . . . . . . . . . . . . . . . . . . 4.5 –1.4Trust or managed investment
account . . . . . . . . . . . . . . . . . . . 1.7 .1
MEMO
Both types . . . . . . . . . . . . . . . . . . .3 †
† Less than 0.05 percent.
6.9.
Type of other financial assetAll families
2007(percent)
Change, 2004–07(percentage points)
Cash . . . . . . . . . . . . . . . . . . . . . . . . 8.1 –.8Future proceeds . . . . . . . . . . . . . .9 .1Business items . . . . . . . . . . . . . . .5 .1Other . . . . . . . . . . . . . . . . . . . . . . . † †
† Less than 0.05 percent.
A26 Federal Reserve Bulletin h February 2009

head or that person’s spouse or partner had beengiven stock options by an employer during the pre-ceding year. In 2007, 8.3 percent of families reportedhaving received stock options, a decline of 1.0 per-centage point below the level in 2004; this decreasecontinues a downward trend since the peak of 11.4 per-cent recorded in the SCF in 2001 (data not shown inthe tables).33
Direct and Indirect Holdings of Publicly TradedStocks
Families may hold stocks in publicly traded compa-nies directly or indirectly, and information about eachof these forms of ownership is collected separately inthe SCF. When direct and indirect forms are com-bined, the 2007 data show a resumption of a trend ofincreasing stock ownership (table 7). Between 2004and 2007, the fraction of families holding any suchstock rose 0.9 percentage point, to 51.1 percent, alevel still below the 2001 peak of 52.2 percent. Muchlike ownership of directly held stock, ownership ofdirect and indirect equity holdings is more commonamong higher-income groups and among familiesheaded by a person aged 35 to 64. Over the recentthree-year period, ownership increased for all incomegroups except the third quintile and top decile. Acrossage groups, ownership fell for families headed by a
person younger than 45 or aged 55 to 64; ownershiprose substantially for families headed by a personaged 45 to 54 or older than 65.
At the same time, the overall median value ofdirect and indirect stock holdings dropped 2.0 per-cent. Changes in the median value across demo-graphic groups were mixed, with declines more com-mon for groups that experienced increases inownership, an indication that most new owners hadsmall amounts. As a proportion of financial assets,holdings rose 2.0 percentage points overall, withsubstantial increases for the first and fourth incomequintiles and the oldest age group.
As noted earlier in the discussion on net worth, thestock markets have undergone sizable declines sincethe data collection for the 2007 SCF was completed.To gauge the potential effect of these changes on themedian amount of equity held by families, the equityvalues in the survey were deflated by the ratio of theaverage of the Wilshire 5000 index in October 2008to the value of the index on the day of the interview,assuming a homogeneous rate of return for all equityholders and no changes in the portfolios of familiessince the time of the survey. Under this scenario, themedian value of equity falls 35.7 percent, from the2007 value of $35,000 to $22,500 (data not shown inthe tables).
Among families that held equity, either directly orindirectly, in 2007, ownership through a tax-deferredretirement account was most common, followed bydirect holdings of stocks, direct holdings of pooledinvestment funds, and managed investment accounts
exercise date; until then, meaningful valuation would require complexassumptions about the future behavior of stock prices.
33. Data on the awarding of options have been collected in the SCFsince 1995.
7. Direct and indirect family holdings of stock, by selected characteristics of families, 1998–2007 surveys
Percent except as noted
Family characteristic
Families having stock holdings,direct or indirect
Median value among families with holdings(thousands of 2007 dollars)
Stock holdings as share ofgroup’s financial assets
1998 2001 2004 2007 1998 2001 2004 2007 1998 2001 2004 2007
All families . . . . . . . . . 48.9 52.2 50.2 51.1 31.8 40.4 35.7 35.0 54.0 56.1 51.3 53.3
Percentile of incomeLess than 20 . . . . . . . . 10.0 12.9 11.7 13.6 6.4 8.8 8.2 6.5 20.4 37.4 32.0 39.020–39.9 . . . . . . . . . . . . . 30.8 34.1 29.6 34.0 12.7 9.1 11.0 8.8 29.8 35.6 30.9 34.340–59.9 . . . . . . . . . . . . . 50.2 52.5 51.7 49.5 15.3 17.5 16.5 17.7 38.1 46.8 43.4 38.360–79.9 . . . . . . . . . . . . . 69.3 75.7 69.9 70.5 24.2 33.5 28.7 34.1 45.8 52.0 41.7 52.580–89.9 . . . . . . . . . . . . . 77.9 82.0 83.8 84.4 57.3 75.6 60.9 62.0 50.4 57.3 48.8 49.390–100 . . . . . . . . . . . . . 90.4 89.7 92.7 91.0 171.9 289.7 225.2 219.0 62.5 60.5 57.5 57.6
Age of head (years)Less than 35 . . . . . . . . 40.8 49.0 40.8 38.6 8.9 8.2 8.8 7.0 44.9 52.5 40.3 44.335–44 . . . . . . . . . . . . . . . 56.7 59.5 54.5 53.5 25.5 32.2 22.0 26.0 55.0 57.2 53.5 53.745–54 . . . . . . . . . . . . . . . 58.6 59.3 56.5 60.4 48.4 58.5 54.9 45.0 55.7 59.1 53.8 53.055–64 . . . . . . . . . . . . . . . 55.9 57.4 62.8 58.9 59.8 94.2 78.0 78.0 58.4 56.2 55.0 55.065–74 . . . . . . . . . . . . . . . 42.7 40.0 46.9 52.1 71.3 175.8 76.9 57.0 51.3 55.4 51.5 55.375 or more . . . . . . . . . . 29.4 35.7 34.8 40.1 76.4 128.7 94.3 41.0 48.7 51.8 39.3 48.1
Housing statusOwner . . . . . . . . . . . . . . 59.8 62.4 60.9 62.5 43.3 58.5 49.4 41.2 55.1 56.8 51.9 53.8Renter or other . . . . . . 27.5 30.9 26.4 26.0 9.5 8.2 9.6 8.6 40.5 46.2 39.2 45.0
NOTE: Indirect holdings are those in pooled investment trusts, retirement ac-counts, and other managed assets. See also note to table 1.
Changes in U.S. Family Finances from 2004 to 2007: Evidence from the Survey of Consumer Finances A27
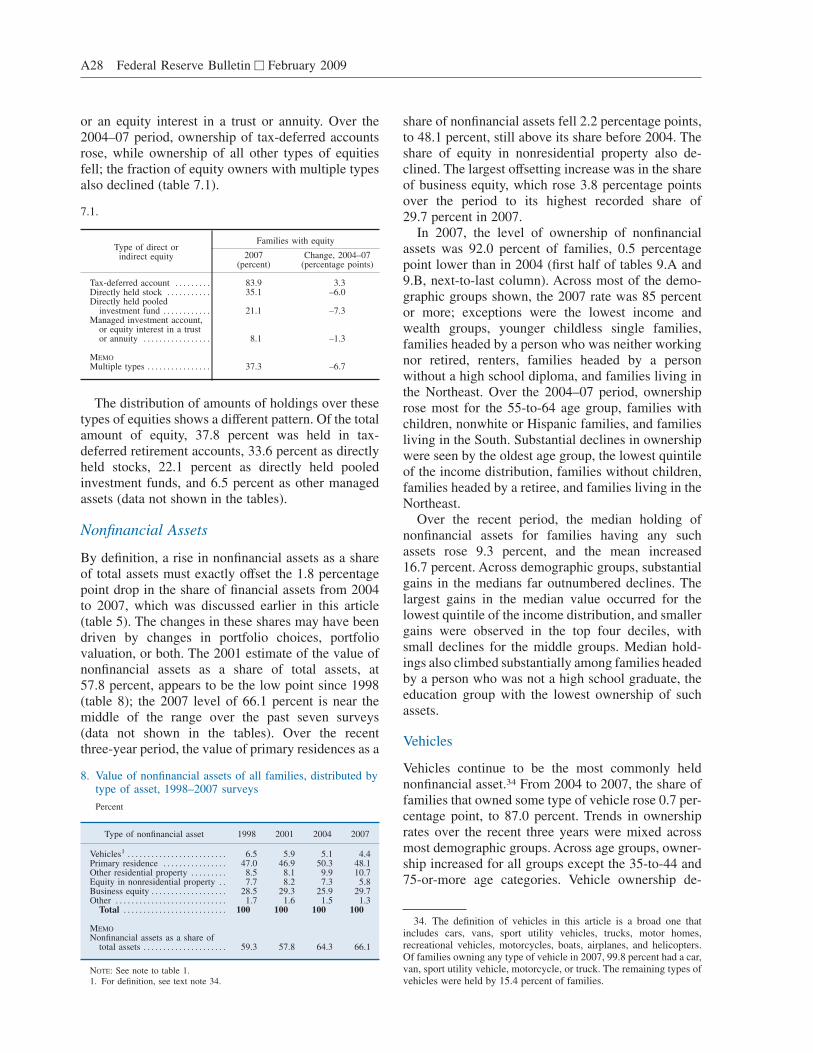
or an equity interest in a trust or annuity. Over the2004–07 period, ownership of tax-deferred accountsrose, while ownership of all other types of equitiesfell; the fraction of equity owners with multiple typesalso declined (table 7.1).
The distribution of amounts of holdings over thesetypes of equities shows a different pattern. Of the totalamount of equity, 37.8 percent was held in tax-deferred retirement accounts, 33.6 percent as directlyheld stocks, 22.1 percent as directly held pooledinvestment funds, and 6.5 percent as other managedassets (data not shown in the tables).
Nonfinancial Assets
By definition, a rise in nonfinancial assets as a shareof total assets must exactly offset the 1.8 percentagepoint drop in the share of financial assets from 2004to 2007, which was discussed earlier in this article(table 5). The changes in these shares may have beendriven by changes in portfolio choices, portfoliovaluation, or both. The 2001 estimate of the value ofnonfinancial assets as a share of total assets, at57.8 percent, appears to be the low point since 1998(table 8); the 2007 level of 66.1 percent is near themiddle of the range over the past seven surveys(data not shown in the tables). Over the recentthree-year period, the value of primary residences as a
share of nonfinancial assets fell 2.2 percentage points,to 48.1 percent, still above its share before 2004. Theshare of equity in nonresidential property also de-clined. The largest offsetting increase was in the shareof business equity, which rose 3.8 percentage pointsover the period to its highest recorded share of29.7 percent in 2007.
In 2007, the level of ownership of nonfinancialassets was 92.0 percent of families, 0.5 percentagepoint lower than in 2004 (first half of tables 9.A and9.B, next-to-last column). Across most of the demo-graphic groups shown, the 2007 rate was 85 percentor more; exceptions were the lowest income andwealth groups, younger childless single families,families headed by a person who was neither workingnor retired, renters, families headed by a personwithout a high school diploma, and families living inthe Northeast. Over the 2004–07 period, ownershiprose most for the 55-to-64 age group, families withchildren, nonwhite or Hispanic families, and familiesliving in the South. Substantial declines in ownershipwere seen by the oldest age group, the lowest quintileof the income distribution, families without children,families headed by a retiree, and families living in theNortheast.
Over the recent period, the median holding ofnonfinancial assets for families having any suchassets rose 9.3 percent, and the mean increased16.7 percent. Across demographic groups, substantialgains in the medians far outnumbered declines. Thelargest gains in the median value occurred for thelowest quintile of the income distribution, and smallergains were observed in the top four deciles, withsmall declines for the middle groups. Median hold-ings also climbed substantially among families headedby a person who was not a high school graduate, theeducation group with the lowest ownership of suchassets.
Vehicles
Vehicles continue to be the most commonly heldnonfinancial asset.34 From 2004 to 2007, the share offamilies that owned some type of vehicle rose 0.7 per-centage point, to 87.0 percent. Trends in ownershiprates over the recent three years were mixed acrossmost demographic groups. Across age groups, owner-ship increased for all groups except the 35-to-44 and75-or-more age categories. Vehicle ownership de-
34. The definition of vehicles in this article is a broad one thatincludes cars, vans, sport utility vehicles, trucks, motor homes,recreational vehicles, motorcycles, boats, airplanes, and helicopters.Of families owning any type of vehicle in 2007, 99.8 percent had a car,van, sport utility vehicle, motorcycle, or truck. The remaining types ofvehicles were held by 15.4 percent of families.
7.1.
Type of direct orindirect equity
Families with equity
2007(percent)
Change, 2004–07(percentage points)
Tax-deferred account . . . . . . . . . 83.9 3.3Directly held stock . . . . . . . . . . . 35.1 –6.0Directly held pooled
investment fund . . . . . . . . . . . . 21.1 –7.3Managed investment account,
or equity interest in a trustor annuity . . . . . . . . . . . . . . . . . 8.1 –1.3
MEMO
Multiple types . . . . . . . . . . . . . . . . 37.3 –6.7
8. Value of nonfinancial assets of all families, distributed bytype of asset, 1998–2007 surveys
Percent
Type of nonfinancial asset 1998 2001 2004 2007
Vehicles1 . . . . . . . . . . . . . . . . . . . . . . . . . 6.5 5.9 5.1 4.4Primary residence . . . . . . . . . . . . . . . . 47.0 46.9 50.3 48.1Other residential property . . . . . . . . . 8.5 8.1 9.9 10.7Equity in nonresidential property . . 7.7 8.2 7.3 5.8Business equity . . . . . . . . . . . . . . . . . . . 28.5 29.3 25.9 29.7Other . . . . . . . . . . . . . . . . . . . . . . . . . . . . 1.7 1.6 1.5 1.3
Total . . . . . . . . . . . . . . . . . . . . . . . . . . 100 100 100 100
MEMO
Nonfinancial assets as a share oftotal assets . . . . . . . . . . . . . . . . . . . . . 59.3 57.8 64.3 66.1
NOTE: See note to table 1.1. For definition, see text note 34.
A28 Federal Reserve Bulletin h February 2009
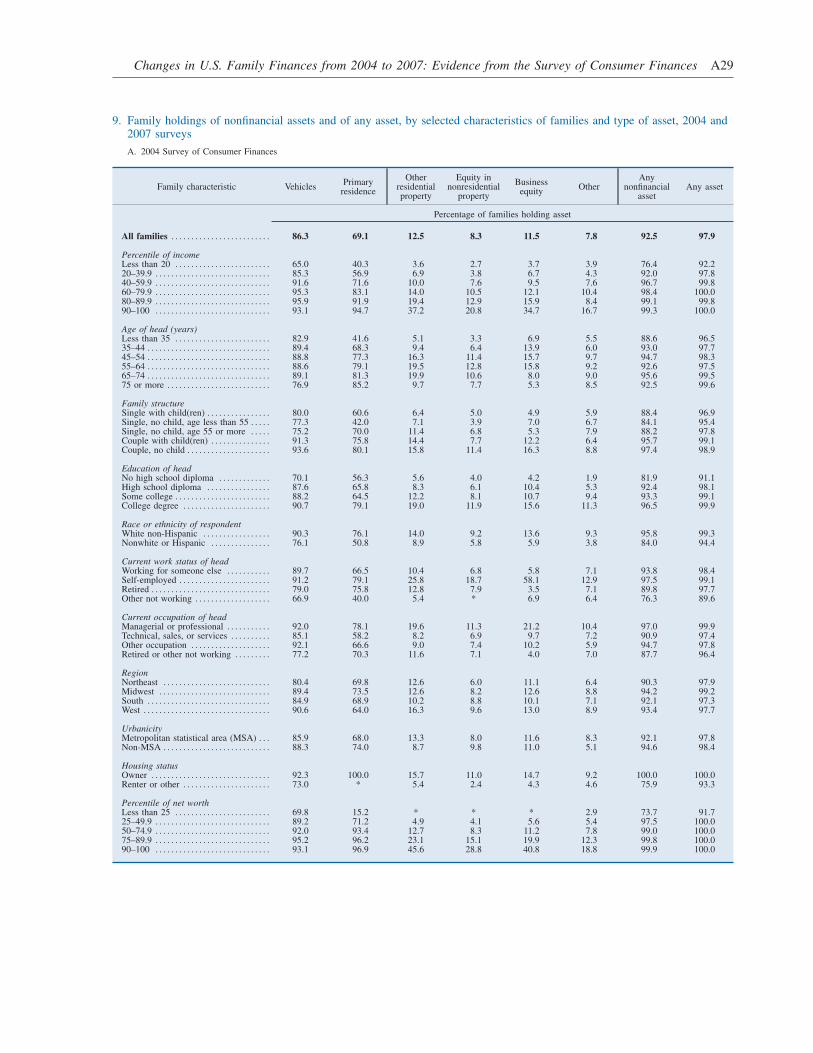
9. Family holdings of nonfinancial assets and of any asset, by selected characteristics of families and type of asset, 2004 and2007 surveys
A. 2004 Survey of Consumer Finances
Family characteristic VehiclesPrimary
residence
Otherresidentialproperty
Equity innonresidential
property
Businessequity
OtherAny
nonfinancialasset
Any asset
Percentage of families holding asset
All families . . . . . . . . . . . . . . . . . . . . . . . . . 86.3 69.1 12.5 8.3 11.5 7.8 92.5 97.9
Percentile of incomeLess than 20 . . . . . . . . . . . . . . . . . . . . . . . . 65.0 40.3 3.6 2.7 3.7 3.9 76.4 92.220–39.9 . . . . . . . . . . . . . . . . . . . . . . . . . . . . . 85.3 56.9 6.9 3.8 6.7 4.3 92.0 97.840–59.9 . . . . . . . . . . . . . . . . . . . . . . . . . . . . . 91.6 71.6 10.0 7.6 9.5 7.6 96.7 99.860–79.9 . . . . . . . . . . . . . . . . . . . . . . . . . . . . . 95.3 83.1 14.0 10.5 12.1 10.4 98.4 100.080–89.9 . . . . . . . . . . . . . . . . . . . . . . . . . . . . . 95.9 91.9 19.4 12.9 15.9 8.4 99.1 99.890–100 . . . . . . . . . . . . . . . . . . . . . . . . . . . . . 93.1 94.7 37.2 20.8 34.7 16.7 99.3 100.0
Age of head (years)Less than 35 . . . . . . . . . . . . . . . . . . . . . . . . 82.9 41.6 5.1 3.3 6.9 5.5 88.6 96.535–44 . . . . . . . . . . . . . . . . . . . . . . . . . . . . . . . 89.4 68.3 9.4 6.4 13.9 6.0 93.0 97.745–54 . . . . . . . . . . . . . . . . . . . . . . . . . . . . . . . 88.8 77.3 16.3 11.4 15.7 9.7 94.7 98.355–64 . . . . . . . . . . . . . . . . . . . . . . . . . . . . . . . 88.6 79.1 19.5 12.8 15.8 9.2 92.6 97.565–74 . . . . . . . . . . . . . . . . . . . . . . . . . . . . . . . 89.1 81.3 19.9 10.6 8.0 9.0 95.6 99.575 or more . . . . . . . . . . . . . . . . . . . . . . . . . . 76.9 85.2 9.7 7.7 5.3 8.5 92.5 99.6
Family structureSingle with child(ren) . . . . . . . . . . . . . . . . 80.0 60.6 6.4 5.0 4.9 5.9 88.4 96.9Single, no child, age less than 55 . . . . . 77.3 42.0 7.1 3.9 7.0 6.7 84.1 95.4Single, no child, age 55 or more . . . . . 75.2 70.0 11.4 6.8 5.3 7.9 88.2 97.8Couple with child(ren) . . . . . . . . . . . . . . . 91.3 75.8 14.4 7.7 12.2 6.4 95.7 99.1Couple, no child . . . . . . . . . . . . . . . . . . . . . 93.6 80.1 15.8 11.4 16.3 8.8 97.4 98.9
Education of headNo high school diploma . . . . . . . . . . . . . 70.1 56.3 5.6 4.0 4.2 1.9 81.9 91.1High school diploma . . . . . . . . . . . . . . . . 87.6 65.8 8.3 6.1 10.4 5.3 92.4 98.1Some college . . . . . . . . . . . . . . . . . . . . . . . . 88.2 64.5 12.2 8.1 10.7 9.4 93.3 99.1College degree . . . . . . . . . . . . . . . . . . . . . . 90.7 79.1 19.0 11.9 15.6 11.3 96.5 99.9
Race or ethnicity of respondentWhite non-Hispanic . . . . . . . . . . . . . . . . . 90.3 76.1 14.0 9.2 13.6 9.3 95.8 99.3Nonwhite or Hispanic . . . . . . . . . . . . . . . 76.1 50.8 8.9 5.8 5.9 3.8 84.0 94.4
Current work status of headWorking for someone else . . . . . . . . . . . 89.7 66.5 10.4 6.8 5.8 7.1 93.8 98.4Self-employed . . . . . . . . . . . . . . . . . . . . . . . 91.2 79.1 25.8 18.7 58.1 12.9 97.5 99.1Retired . . . . . . . . . . . . . . . . . . . . . . . . . . . . . . 79.0 75.8 12.8 7.9 3.5 7.1 89.8 97.7Other not working . . . . . . . . . . . . . . . . . . . 66.9 40.0 5.4 * 6.9 6.4 76.3 89.6
Current occupation of headManagerial or professional . . . . . . . . . . . 92.0 78.1 19.6 11.3 21.2 10.4 97.0 99.9Technical, sales, or services . . . . . . . . . . 85.1 58.2 8.2 6.9 9.7 7.2 90.9 97.4Other occupation . . . . . . . . . . . . . . . . . . . . 92.1 66.6 9.0 7.4 10.2 5.9 94.7 97.8Retired or other not working . . . . . . . . . 77.2 70.3 11.6 7.1 4.0 7.0 87.7 96.4
RegionNortheast . . . . . . . . . . . . . . . . . . . . . . . . . . . 80.4 69.8 12.6 6.0 11.1 6.4 90.3 97.9Midwest . . . . . . . . . . . . . . . . . . . . . . . . . . . . 89.4 73.5 12.6 8.2 12.6 8.8 94.2 99.2South . . . . . . . . . . . . . . . . . . . . . . . . . . . . . . . 84.9 68.9 10.2 8.8 10.1 7.1 92.1 97.3West . . . . . . . . . . . . . . . . . . . . . . . . . . . . . . . . 90.6 64.0 16.3 9.6 13.0 8.9 93.4 97.7
UrbanicityMetropolitan statistical area (MSA) . . . 85.9 68.0 13.3 8.0 11.6 8.3 92.1 97.8Non-MSA . . . . . . . . . . . . . . . . . . . . . . . . . . . 88.3 74.0 8.7 9.8 11.0 5.1 94.6 98.4
Housing statusOwner . . . . . . . . . . . . . . . . . . . . . . . . . . . . . . 92.3 100.0 15.7 11.0 14.7 9.2 100.0 100.0Renter or other . . . . . . . . . . . . . . . . . . . . . . 73.0 * 5.4 2.4 4.3 4.6 75.9 93.3
Percentile of net worthLess than 25 . . . . . . . . . . . . . . . . . . . . . . . . 69.8 15.2 * * * 2.9 73.7 91.725–49.9 . . . . . . . . . . . . . . . . . . . . . . . . . . . . . 89.2 71.2 4.9 4.1 5.6 5.4 97.5 100.050–74.9 . . . . . . . . . . . . . . . . . . . . . . . . . . . . . 92.0 93.4 12.7 8.3 11.2 7.8 99.0 100.075–89.9 . . . . . . . . . . . . . . . . . . . . . . . . . . . . . 95.2 96.2 23.1 15.1 19.9 12.3 99.8 100.090–100 . . . . . . . . . . . . . . . . . . . . . . . . . . . . . 93.1 96.9 45.6 28.8 40.8 18.8 99.9 100.0
Changes in U.S. Family Finances from 2004 to 2007: Evidence from the Survey of Consumer Finances A29
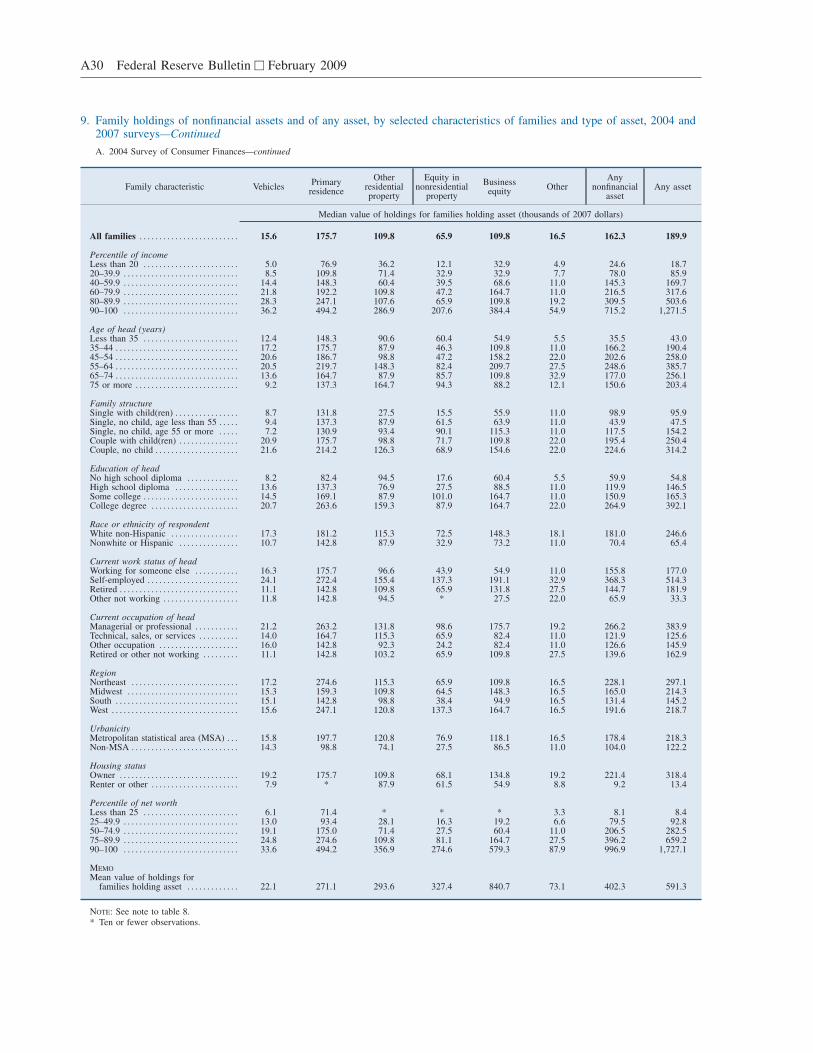
9. Family holdings of nonfinancial assets and of any asset, by selected characteristics of families and type of asset, 2004 and2007 surveys—Continued
A. 2004 Survey of Consumer Finances—continued
Family characteristic VehiclesPrimary
residence
Otherresidentialproperty
Equity innonresidential
property
Businessequity
OtherAny
nonfinancialasset
Any asset
Median value of holdings for families holding asset (thousands of 2007 dollars)
All families . . . . . . . . . . . . . . . . . . . . . . . . . 15.6 175.7 109.8 65.9 109.8 16.5 162.3 189.9
Percentile of incomeLess than 20 . . . . . . . . . . . . . . . . . . . . . . . . 5.0 76.9 36.2 12.1 32.9 4.9 24.6 18.720–39.9 . . . . . . . . . . . . . . . . . . . . . . . . . . . . . 8.5 109.8 71.4 32.9 32.9 7.7 78.0 85.940–59.9 . . . . . . . . . . . . . . . . . . . . . . . . . . . . . 14.4 148.3 60.4 39.5 68.6 11.0 145.3 169.760–79.9 . . . . . . . . . . . . . . . . . . . . . . . . . . . . . 21.8 192.2 109.8 47.2 164.7 11.0 216.5 317.680–89.9 . . . . . . . . . . . . . . . . . . . . . . . . . . . . . 28.3 247.1 107.6 65.9 109.8 19.2 309.5 503.690–100 . . . . . . . . . . . . . . . . . . . . . . . . . . . . . 36.2 494.2 286.9 207.6 384.4 54.9 715.2 1,271.5
Age of head (years)Less than 35 . . . . . . . . . . . . . . . . . . . . . . . . 12.4 148.3 90.6 60.4 54.9 5.5 35.5 43.035–44 . . . . . . . . . . . . . . . . . . . . . . . . . . . . . . . 17.2 175.7 87.9 46.3 109.8 11.0 166.2 190.445–54 . . . . . . . . . . . . . . . . . . . . . . . . . . . . . . . 20.6 186.7 98.8 47.2 158.2 22.0 202.6 258.055–64 . . . . . . . . . . . . . . . . . . . . . . . . . . . . . . . 20.5 219.7 148.3 82.4 209.7 27.5 248.6 385.765–74 . . . . . . . . . . . . . . . . . . . . . . . . . . . . . . . 13.6 164.7 87.9 85.7 109.8 32.9 177.0 256.175 or more . . . . . . . . . . . . . . . . . . . . . . . . . . 9.2 137.3 164.7 94.3 88.2 12.1 150.6 203.4
Family structureSingle with child(ren) . . . . . . . . . . . . . . . . 8.7 131.8 27.5 15.5 55.9 11.0 98.9 95.9Single, no child, age less than 55 . . . . . 9.4 137.3 87.9 61.5 63.9 11.0 43.9 47.5Single, no child, age 55 or more . . . . . 7.2 130.9 93.4 90.1 115.3 11.0 117.5 154.2Couple with child(ren) . . . . . . . . . . . . . . . 20.9 175.7 98.8 71.7 109.8 22.0 195.4 250.4Couple, no child . . . . . . . . . . . . . . . . . . . . . 21.6 214.2 126.3 68.9 154.6 22.0 224.6 314.2
Education of headNo high school diploma . . . . . . . . . . . . . 8.2 82.4 94.5 17.6 60.4 5.5 59.9 54.8High school diploma . . . . . . . . . . . . . . . . 13.6 137.3 76.9 27.5 88.5 11.0 119.9 146.5Some college . . . . . . . . . . . . . . . . . . . . . . . . 14.5 169.1 87.9 101.0 164.7 11.0 150.9 165.3College degree . . . . . . . . . . . . . . . . . . . . . . 20.7 263.6 159.3 87.9 164.7 22.0 264.9 392.1
Race or ethnicity of respondentWhite non-Hispanic . . . . . . . . . . . . . . . . . 17.3 181.2 115.3 72.5 148.3 18.1 181.0 246.6Nonwhite or Hispanic . . . . . . . . . . . . . . . 10.7 142.8 87.9 32.9 73.2 11.0 70.4 65.4
Current work status of headWorking for someone else . . . . . . . . . . . 16.3 175.7 96.6 43.9 54.9 11.0 155.8 177.0Self-employed . . . . . . . . . . . . . . . . . . . . . . . 24.1 272.4 155.4 137.3 191.1 32.9 368.3 514.3Retired . . . . . . . . . . . . . . . . . . . . . . . . . . . . . . 11.1 142.8 109.8 65.9 131.8 27.5 144.7 181.9Other not working . . . . . . . . . . . . . . . . . . . 11.8 142.8 94.5 * 27.5 22.0 65.9 33.3
Current occupation of headManagerial or professional . . . . . . . . . . . 21.2 263.2 131.8 98.6 175.7 19.2 266.2 383.9Technical, sales, or services . . . . . . . . . . 14.0 164.7 115.3 65.9 82.4 11.0 121.9 125.6Other occupation . . . . . . . . . . . . . . . . . . . . 16.0 142.8 92.3 24.2 82.4 11.0 126.6 145.9Retired or other not working . . . . . . . . . 11.1 142.8 103.2 65.9 109.8 27.5 139.6 162.9
RegionNortheast . . . . . . . . . . . . . . . . . . . . . . . . . . . 17.2 274.6 115.3 65.9 109.8 16.5 228.1 297.1Midwest . . . . . . . . . . . . . . . . . . . . . . . . . . . . 15.3 159.3 109.8 64.5 148.3 16.5 165.0 214.3South . . . . . . . . . . . . . . . . . . . . . . . . . . . . . . . 15.1 142.8 98.8 38.4 94.9 16.5 131.4 145.2West . . . . . . . . . . . . . . . . . . . . . . . . . . . . . . . . 15.6 247.1 120.8 137.3 164.7 16.5 191.6 218.7
UrbanicityMetropolitan statistical area (MSA) . . . 15.8 197.7 120.8 76.9 118.1 16.5 178.4 218.3Non-MSA . . . . . . . . . . . . . . . . . . . . . . . . . . . 14.3 98.8 74.1 27.5 86.5 11.0 104.0 122.2
Housing statusOwner . . . . . . . . . . . . . . . . . . . . . . . . . . . . . . 19.2 175.7 109.8 68.1 134.8 19.2 221.4 318.4Renter or other . . . . . . . . . . . . . . . . . . . . . . 7.9 * 87.9 61.5 54.9 8.8 9.2 13.4
Percentile of net worthLess than 25 . . . . . . . . . . . . . . . . . . . . . . . . 6.1 71.4 * * * 3.3 8.1 8.425–49.9 . . . . . . . . . . . . . . . . . . . . . . . . . . . . . 13.0 93.4 28.1 16.3 19.2 6.6 79.5 92.850–74.9 . . . . . . . . . . . . . . . . . . . . . . . . . . . . . 19.1 175.0 71.4 27.5 60.4 11.0 206.5 282.575–89.9 . . . . . . . . . . . . . . . . . . . . . . . . . . . . . 24.8 274.6 109.8 81.1 164.7 27.5 396.2 659.290–100 . . . . . . . . . . . . . . . . . . . . . . . . . . . . . 33.6 494.2 356.9 274.6 579.3 87.9 996.9 1,727.1
MEMO
Mean value of holdings forfamilies holding asset . . . . . . . . . . . . . 22.1 271.1 293.6 327.4 840.7 73.1 402.3 591.3
NOTE: See note to table 8.* Ten or fewer observations.
A30 Federal Reserve Bulletin h February 2009

9. Family holdings of nonfinancial assets and of any asset, by selected characteristics of families and type of asset, 2004 and2007 surveys—Continued
B. 2007 Survey of Consumer Finances
Family characteristic VehiclesPrimary
residence
Otherresidentialproperty
Equity innonresidential
property
Businessequity
OtherAny
nonfinancialasset
Any asset
Percentage of families holding asset
All families . . . . . . . . . . . . . . . . . . . . . . . . . 87.0 68.6 13.7 8.1 12.0 7.2 92.0 97.7
Percentile of incomeLess than 20 . . . . . . . . . . . . . . . . . . . . . . . . 64.4 41.4 5.4 2.5 3.0 3.9 73.4 89.820–39.9 . . . . . . . . . . . . . . . . . . . . . . . . . . . . . 85.9 55.2 6.5 3.9 4.5 5.7 91.2 98.940–59.9 . . . . . . . . . . . . . . . . . . . . . . . . . . . . . 94.3 69.3 9.9 7.4 9.2 7.4 97.2 100.060–79.9 . . . . . . . . . . . . . . . . . . . . . . . . . . . . . 95.4 83.9 15.4 9.4 15.9 7.2 98.5 100.080–89.9 . . . . . . . . . . . . . . . . . . . . . . . . . . . . . 95.6 92.6 21.0 13.6 17.0 9.0 99.6 100.090–100 . . . . . . . . . . . . . . . . . . . . . . . . . . . . . 94.8 94.3 42.2 21.0 37.5 14.1 99.7 100.0
Age of head (years)Less than 35 . . . . . . . . . . . . . . . . . . . . . . . . 85.4 40.7 5.6 3.2 6.8 5.9 88.2 97.135–44 . . . . . . . . . . . . . . . . . . . . . . . . . . . . . . . 87.5 66.1 12.0 7.5 16.0 5.5 91.3 96.945–54 . . . . . . . . . . . . . . . . . . . . . . . . . . . . . . . 90.3 77.3 15.7 9.5 15.2 8.7 95.0 97.655–64 . . . . . . . . . . . . . . . . . . . . . . . . . . . . . . . 92.2 81.0 20.9 11.5 16.3 8.5 95.6 99.165–74 . . . . . . . . . . . . . . . . . . . . . . . . . . . . . . . 90.6 85.5 18.9 12.3 10.1 9.1 94.5 98.475 or more . . . . . . . . . . . . . . . . . . . . . . . . . . 71.5 77.0 13.4 6.8 3.8 5.8 87.3 98.1
Family structureSingle with child(ren) . . . . . . . . . . . . . . . . 80.5 53.4 8.9 5.6 5.6 5.8 89.5 95.7Single, no child, age less than 55 . . . . . 77.0 42.6 6.2 2.9 7.5 7.0 82.5 93.7Single, no child, age 55 or more . . . . . 73.9 68.1 11.8 7.3 3.3 5.7 85.1 97.7Couple with child(ren) . . . . . . . . . . . . . . . 94.0 78.3 14.8 8.4 15.6 8.9 96.9 98.8Couple, no child . . . . . . . . . . . . . . . . . . . . . 94.6 79.2 18.0 10.8 16.6 7.4 97.3 99.4
Education of headNo high school diploma . . . . . . . . . . . . . 73.7 52.8 5.8 2.6 5.3 2.2 80.9 91.7High school diploma . . . . . . . . . . . . . . . . 87.5 68.9 10.0 7.3 8.7 5.1 92.2 97.7Some college . . . . . . . . . . . . . . . . . . . . . . . . 86.7 62.3 13.2 6.5 10.7 7.0 91.0 98.5College degree . . . . . . . . . . . . . . . . . . . . . . 91.9 77.8 20.6 11.8 18.2 11.0 96.6 99.6
Race or ethnicity of respondentWhite non-Hispanic . . . . . . . . . . . . . . . . . 89.6 75.6 15.3 9.0 13.9 8.4 94.6 98.9Nonwhite or Hispanic . . . . . . . . . . . . . . . 80.9 51.9 10.0 5.9 7.4 4.3 85.8 94.9
Current work status of headWorking for someone else . . . . . . . . . . . 91.3 67.2 11.9 7.0 6.3 7.1 94.4 98.6Self-employed . . . . . . . . . . . . . . . . . . . . . . . 90.6 82.4 26.5 17.3 68.4 11.0 97.6 99.7Retired . . . . . . . . . . . . . . . . . . . . . . . . . . . . . . 78.6 72.9 14.6 7.7 3.6 5.4 87.2 96.1Other not working . . . . . . . . . . . . . . . . . . . 69.3 33.3 3.8 4.7 3.6 8.5 74.8 90.0
Current occupation of headManagerial or professional . . . . . . . . . . . 93.1 78.2 20.7 10.8 22.0 9.9 97.2 99.8Technical, sales, or services . . . . . . . . . . 87.4 61.5 10.2 7.3 9.2 7.7 91.6 97.8Other occupation . . . . . . . . . . . . . . . . . . . . 92.6 66.3 9.6 6.7 13.6 4.9 95.2 98.5Retired or other not working . . . . . . . . . 77.1 66.7 12.9 7.2 3.6 5.9 85.2 95.2
RegionNortheast . . . . . . . . . . . . . . . . . . . . . . . . . . . 75.4 66.1 13.3 5.6 7.8 5.5 84.2 94.6Midwest . . . . . . . . . . . . . . . . . . . . . . . . . . . . 89.5 71.3 13.7 8.4 13.1 6.4 93.4 98.4South . . . . . . . . . . . . . . . . . . . . . . . . . . . . . . . 89.2 70.2 11.3 8.8 11.4 7.2 93.8 98.5West . . . . . . . . . . . . . . . . . . . . . . . . . . . . . . . . 90.5 65.4 18.3 8.7 15.3 9.3 94.1 98.4
UrbanicityMetropolitan statistical area (MSA) . . . 86.2 68.1 14.2 7.6 12.3 7.6 91.5 97.7Non-MSA . . . . . . . . . . . . . . . . . . . . . . . . . . . 90.9 71.1 11.7 10.7 10.6 5.1 94.3 97.9
Housing statusOwner . . . . . . . . . . . . . . . . . . . . . . . . . . . . . . 93.8 100.0 17.5 10.8 15.4 8.0 100.0 100.0Renter or other . . . . . . . . . . . . . . . . . . . . . . 72.3 * 5.6 2.1 4.5 5.3 74.5 92.8
Percentile of net worthLess than 25 . . . . . . . . . . . . . . . . . . . . . . . . 69.5 13.8 1.2 * 1.3 2.4 71.6 90.925–49.9 . . . . . . . . . . . . . . . . . . . . . . . . . . . . . 91.2 72.1 7.1 3.7 6.2 6.5 97.7 100.050–74.9 . . . . . . . . . . . . . . . . . . . . . . . . . . . . . 93.3 92.8 11.9 7.7 11.6 7.8 99.5 100.075–89.9 . . . . . . . . . . . . . . . . . . . . . . . . . . . . . 94.5 95.3 26.2 16.4 17.9 7.5 99.0 100.090–100 . . . . . . . . . . . . . . . . . . . . . . . . . . . . . 93.6 96.9 47.7 27.3 45.1 18.5 99.6 100.0
Changes in U.S. Family Finances from 2004 to 2007: Evidence from the Survey of Consumer Finances A31
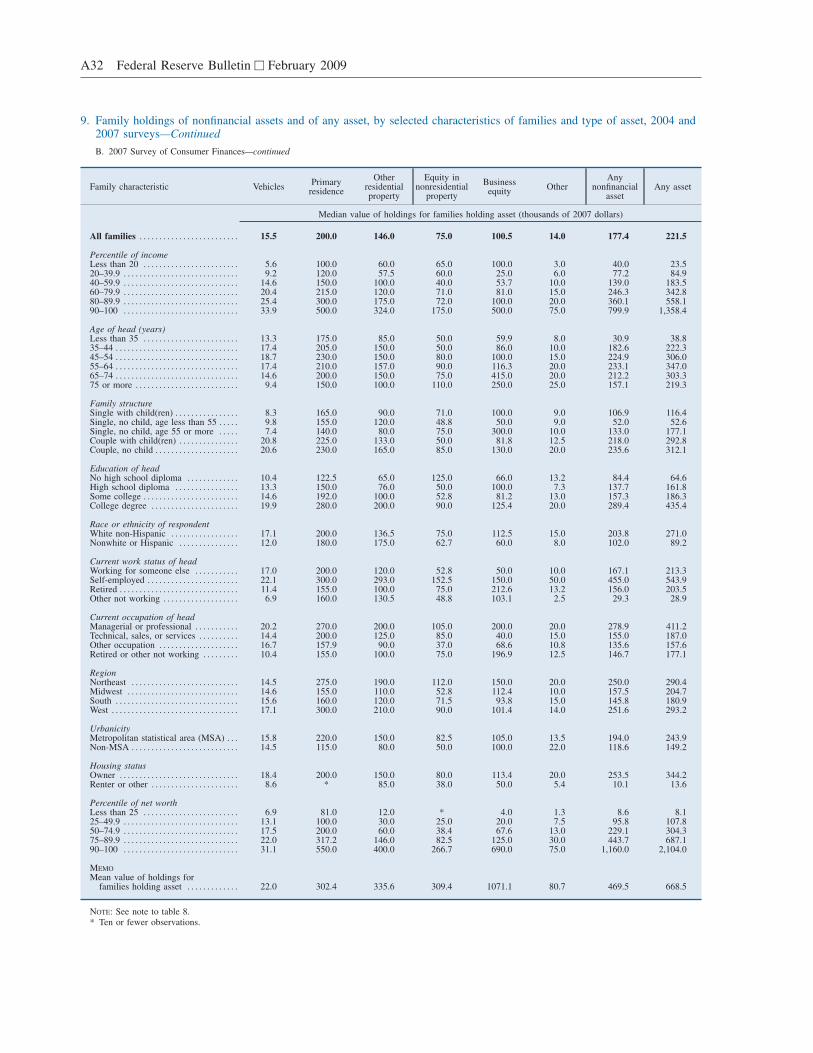
9. Family holdings of nonfinancial assets and of any asset, by selected characteristics of families and type of asset, 2004 and2007 surveys—Continued
B. 2007 Survey of Consumer Finances—continued
Family characteristic VehiclesPrimary
residence
Otherresidentialproperty
Equity innonresidential
property
Businessequity
OtherAny
nonfinancialasset
Any asset
Median value of holdings for families holding asset (thousands of 2007 dollars)
All families . . . . . . . . . . . . . . . . . . . . . . . . . 15.5 200.0 146.0 75.0 100.5 14.0 177.4 221.5
Percentile of incomeLess than 20 . . . . . . . . . . . . . . . . . . . . . . . . 5.6 100.0 60.0 65.0 100.0 3.0 40.0 23.520–39.9 . . . . . . . . . . . . . . . . . . . . . . . . . . . . . 9.2 120.0 57.5 60.0 25.0 6.0 77.2 84.940–59.9 . . . . . . . . . . . . . . . . . . . . . . . . . . . . . 14.6 150.0 100.0 40.0 53.7 10.0 139.0 183.560–79.9 . . . . . . . . . . . . . . . . . . . . . . . . . . . . . 20.4 215.0 120.0 71.0 81.0 15.0 246.3 342.880–89.9 . . . . . . . . . . . . . . . . . . . . . . . . . . . . . 25.4 300.0 175.0 72.0 100.0 20.0 360.1 558.190–100 . . . . . . . . . . . . . . . . . . . . . . . . . . . . . 33.9 500.0 324.0 175.0 500.0 75.0 799.9 1,358.4
Age of head (years)Less than 35 . . . . . . . . . . . . . . . . . . . . . . . . 13.3 175.0 85.0 50.0 59.9 8.0 30.9 38.835–44 . . . . . . . . . . . . . . . . . . . . . . . . . . . . . . . 17.4 205.0 150.0 50.0 86.0 10.0 182.6 222.345–54 . . . . . . . . . . . . . . . . . . . . . . . . . . . . . . . 18.7 230.0 150.0 80.0 100.0 15.0 224.9 306.055–64 . . . . . . . . . . . . . . . . . . . . . . . . . . . . . . . 17.4 210.0 157.0 90.0 116.3 20.0 233.1 347.065–74 . . . . . . . . . . . . . . . . . . . . . . . . . . . . . . . 14.6 200.0 150.0 75.0 415.0 20.0 212.2 303.375 or more . . . . . . . . . . . . . . . . . . . . . . . . . . 9.4 150.0 100.0 110.0 250.0 25.0 157.1 219.3
Family structureSingle with child(ren) . . . . . . . . . . . . . . . . 8.3 165.0 90.0 71.0 100.0 9.0 106.9 116.4Single, no child, age less than 55 . . . . . 9.8 155.0 120.0 48.8 50.0 9.0 52.0 52.6Single, no child, age 55 or more . . . . . 7.4 140.0 80.0 75.0 300.0 10.0 133.0 177.1Couple with child(ren) . . . . . . . . . . . . . . . 20.8 225.0 133.0 50.0 81.8 12.5 218.0 292.8Couple, no child . . . . . . . . . . . . . . . . . . . . . 20.6 230.0 165.0 85.0 130.0 20.0 235.6 312.1
Education of headNo high school diploma . . . . . . . . . . . . . 10.4 122.5 65.0 125.0 66.0 13.2 84.4 64.6High school diploma . . . . . . . . . . . . . . . . 13.3 150.0 76.0 50.0 100.0 7.3 137.7 161.8Some college . . . . . . . . . . . . . . . . . . . . . . . . 14.6 192.0 100.0 52.8 81.2 13.0 157.3 186.3College degree . . . . . . . . . . . . . . . . . . . . . . 19.9 280.0 200.0 90.0 125.4 20.0 289.4 435.4
Race or ethnicity of respondentWhite non-Hispanic . . . . . . . . . . . . . . . . . 17.1 200.0 136.5 75.0 112.5 15.0 203.8 271.0Nonwhite or Hispanic . . . . . . . . . . . . . . . 12.0 180.0 175.0 62.7 60.0 8.0 102.0 89.2
Current work status of headWorking for someone else . . . . . . . . . . . 17.0 200.0 120.0 52.8 50.0 10.0 167.1 213.3Self-employed . . . . . . . . . . . . . . . . . . . . . . . 22.1 300.0 293.0 152.5 150.0 50.0 455.0 543.9Retired . . . . . . . . . . . . . . . . . . . . . . . . . . . . . . 11.4 155.0 100.0 75.0 212.6 13.2 156.0 203.5Other not working . . . . . . . . . . . . . . . . . . . 6.9 160.0 130.5 48.8 103.1 2.5 29.3 28.9
Current occupation of headManagerial or professional . . . . . . . . . . . 20.2 270.0 200.0 105.0 200.0 20.0 278.9 411.2Technical, sales, or services . . . . . . . . . . 14.4 200.0 125.0 85.0 40.0 15.0 155.0 187.0Other occupation . . . . . . . . . . . . . . . . . . . . 16.7 157.9 90.0 37.0 68.6 10.8 135.6 157.6Retired or other not working . . . . . . . . . 10.4 155.0 100.0 75.0 196.9 12.5 146.7 177.1
RegionNortheast . . . . . . . . . . . . . . . . . . . . . . . . . . . 14.5 275.0 190.0 112.0 150.0 20.0 250.0 290.4Midwest . . . . . . . . . . . . . . . . . . . . . . . . . . . . 14.6 155.0 110.0 52.8 112.4 10.0 157.5 204.7South . . . . . . . . . . . . . . . . . . . . . . . . . . . . . . . 15.6 160.0 120.0 71.5 93.8 15.0 145.8 180.9West . . . . . . . . . . . . . . . . . . . . . . . . . . . . . . . . 17.1 300.0 210.0 90.0 101.4 14.0 251.6 293.2
UrbanicityMetropolitan statistical area (MSA) . . . 15.8 220.0 150.0 82.5 105.0 13.5 194.0 243.9Non-MSA . . . . . . . . . . . . . . . . . . . . . . . . . . . 14.5 115.0 80.0 50.0 100.0 22.0 118.6 149.2
Housing statusOwner . . . . . . . . . . . . . . . . . . . . . . . . . . . . . . 18.4 200.0 150.0 80.0 113.4 20.0 253.5 344.2Renter or other . . . . . . . . . . . . . . . . . . . . . . 8.6 * 85.0 38.0 50.0 5.4 10.1 13.6
Percentile of net worthLess than 25 . . . . . . . . . . . . . . . . . . . . . . . . 6.9 81.0 12.0 * 4.0 1.3 8.6 8.125–49.9 . . . . . . . . . . . . . . . . . . . . . . . . . . . . . 13.1 100.0 30.0 25.0 20.0 7.5 95.8 107.850–74.9 . . . . . . . . . . . . . . . . . . . . . . . . . . . . . 17.5 200.0 60.0 38.4 67.6 13.0 229.1 304.375–89.9 . . . . . . . . . . . . . . . . . . . . . . . . . . . . . 22.0 317.2 146.0 82.5 125.0 30.0 443.7 687.190–100 . . . . . . . . . . . . . . . . . . . . . . . . . . . . . 31.1 550.0 400.0 266.7 690.0 75.0 1,160.0 2,104.0
MEMO
Mean value of holdings forfamilies holding asset . . . . . . . . . . . . . 22.0 302.4 335.6 309.4 1071.1 80.7 469.5 668.5
NOTE: See note to table 8.* Ten or fewer observations.
A32 Federal Reserve Bulletin h February 2009
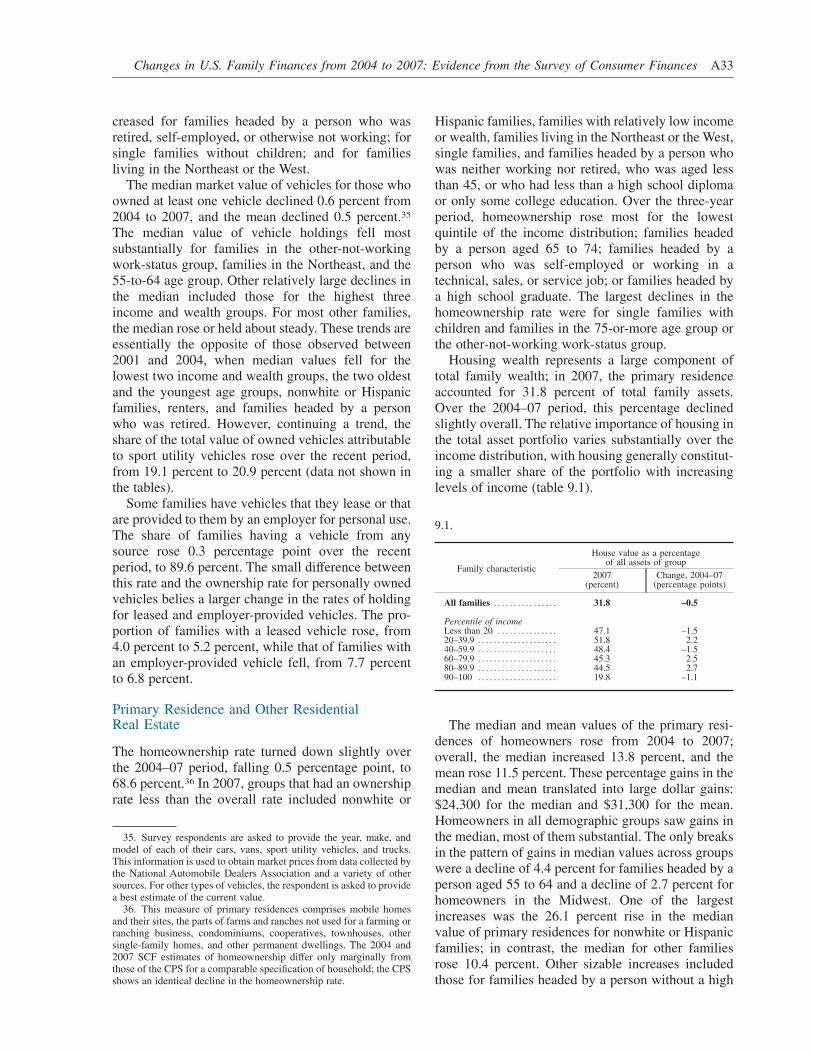
creased for families headed by a person who wasretired, self-employed, or otherwise not working; forsingle families without children; and for familiesliving in the Northeast or the West.
The median market value of vehicles for those whoowned at least one vehicle declined 0.6 percent from2004 to 2007, and the mean declined 0.5 percent.35
The median value of vehicle holdings fell mostsubstantially for families in the other-not-workingwork-status group, families in the Northeast, and the55-to-64 age group. Other relatively large declines inthe median included those for the highest threeincome and wealth groups. For most other families,the median rose or held about steady. These trends areessentially the opposite of those observed between2001 and 2004, when median values fell for thelowest two income and wealth groups, the two oldestand the youngest age groups, nonwhite or Hispanicfamilies, renters, and families headed by a personwho was retired. However, continuing a trend, theshare of the total value of owned vehicles attributableto sport utility vehicles rose over the recent period,from 19.1 percent to 20.9 percent (data not shown inthe tables).
Some families have vehicles that they lease or thatare provided to them by an employer for personal use.The share of families having a vehicle from anysource rose 0.3 percentage point over the recentperiod, to 89.6 percent. The small difference betweenthis rate and the ownership rate for personally ownedvehicles belies a larger change in the rates of holdingfor leased and employer-provided vehicles. The pro-portion of families with a leased vehicle rose, from4.0 percent to 5.2 percent, while that of families withan employer-provided vehicle fell, from 7.7 percentto 6.8 percent.
Primary Residence and Other ResidentialReal Estate
The homeownership rate turned down slightly overthe 2004–07 period, falling 0.5 percentage point, to68.6 percent.36 In 2007, groups that had an ownershiprate less than the overall rate included nonwhite or
Hispanic families, families with relatively low incomeor wealth, families living in the Northeast or the West,single families, and families headed by a person whowas neither working nor retired, who was aged lessthan 45, or who had less than a high school diplomaor only some college education. Over the three-yearperiod, homeownership rose most for the lowestquintile of the income distribution; families headedby a person aged 65 to 74; families headed by aperson who was self-employed or working in atechnical, sales, or service job; or families headed bya high school graduate. The largest declines in thehomeownership rate were for single families withchildren and families in the 75-or-more age group orthe other-not-working work-status group.
Housing wealth represents a large component oftotal family wealth; in 2007, the primary residenceaccounted for 31.8 percent of total family assets.Over the 2004–07 period, this percentage declinedslightly overall. The relative importance of housing inthe total asset portfolio varies substantially over theincome distribution, with housing generally constitut-ing a smaller share of the portfolio with increasinglevels of income (table 9.1).
The median and mean values of the primary resi-dences of homeowners rose from 2004 to 2007;overall, the median increased 13.8 percent, and themean rose 11.5 percent. These percentage gains in themedian and mean translated into large dollar gains:$24,300 for the median and $31,300 for the mean.Homeowners in all demographic groups saw gains inthe median, most of them substantial. The only breaksin the pattern of gains in median values across groupswere a decline of 4.4 percent for families headed by aperson aged 55 to 64 and a decline of 2.7 percent forhomeowners in the Midwest. One of the largestincreases was the 26.1 percent rise in the medianvalue of primary residences for nonwhite or Hispanicfamilies; in contrast, the median for other familiesrose 10.4 percent. Other sizable increases includedthose for families headed by a person without a high
35. Survey respondents are asked to provide the year, make, andmodel of each of their cars, vans, sport utility vehicles, and trucks.This information is used to obtain market prices from data collected bythe National Automobile Dealers Association and a variety of othersources. For other types of vehicles, the respondent is asked to providea best estimate of the current value.
36. This measure of primary residences comprises mobile homesand their sites, the parts of farms and ranches not used for a farming orranching business, condominiums, cooperatives, townhouses, othersingle-family homes, and other permanent dwellings. The 2004 and2007 SCF estimates of homeownership differ only marginally fromthose of the CPS for a comparable specification of household; the CPSshows an identical decline in the homeownership rate.
9.1.
Family characteristic
House value as a percentageof all assets of group
2007(percent)
Change, 2004–07(percentage points)
All families . . . . . . . . . . . . . . . . 31.8 –0.5
Percentile of incomeLess than 20 . . . . . . . . . . . . . . . 47.1 –1.520–39.9 . . . . . . . . . . . . . . . . . . . . 51.8 2.240–59.9 . . . . . . . . . . . . . . . . . . . . 48.4 –1.560–79.9 . . . . . . . . . . . . . . . . . . . . 45.3 2.580–89.9 . . . . . . . . . . . . . . . . . . . . 44.5 2.790–100 . . . . . . . . . . . . . . . . . . . . 19.8 –1.1
Changes in U.S. Family Finances from 2004 to 2007: Evidence from the Survey of Consumer Finances A33
school diploma (48.7 percent) and for families in thebottom income quintile (30.0 percent).
As discussed earlier, the national housing marketcontinued to decline after data collection for the2007 SCF had been completed. Assuming that home-ownership did not change and that changes in houseprices occurred uniformly across all homeowners in agiven state, then the state-level purchase-only Loan-Performance Home Price Index can be used toapproximate the effects of declines in house pricesfrom the time of the interview until October 2008.Under these assumptions, the median value falls from$200,000 for 2007 to $181,600, still a gain of 3.4 per-cent from 2004; the mean falls from $302,400 for2007 to $265,600 in October 2008, a decline of2.0 percent from 2004.
In 2007, 13.7 percent of families owned some formof residential real estate other than a primary resi-dence (second homes, time-shares, one- to four-family rental properties, and other types of residentialproperties), a level that is up 1.2 percentage pointsfrom the figure in 2004.37 Although the survey doesnot ask directly about ownership of second homes,such homes should largely be captured as residentialproperties that are owned 100 percent by the familyand for which no rent was collected; in 2007, 6.1 per-cent of families had at least one such property, up1.5 percentage points from 2004 (data not shown inthe tables).
Ownership of other residential real estate is muchmore common among the highest income and wealthgroups, the age groups between 45 and 74, andfamilies headed by a self-employed person, a personworking in a managerial or professional occupation,or a person who was a college graduate. The medianand mean values of other residential real estateincreased proportionately more than the median andmean values of primary residences over the recentperiod; the median rose 33.0 percent, and the meanrose 14.3 percent. Most of the demographic groupssaw substantial gains in the median. Declines inmedian values were observed for several groups,including the youngest and oldest age groups, fami-lies whose head had not attended college, and fami-lies headed by a person who was retired.
Net Equity in Nonresidential Real Estate
The ownership of nonresidential real estate fellslightly, to 8.1 percent of families in 2007.38 Owner-
ship follows approximately the same relative distribu-tion across demographic groups as does the owner-ship of other residential real estate. Changes inownership during the recent period were mixed acrossdemographic groups. Ownership increased modestlyin the top two deciles of the income distribution,while it decreased modestly in most of the lowerportion of the distribution. By educational attainment,ownership increased only among families headed bya person with a high school diploma. Overall, themedian value of such property for owners rose13.8 percent, and the mean fell 5.5 percent. Particu-larly large gains in the median value were seen forfamilies in the lowest income group, single-parentfamilies, and families headed by a person without ahigh school diploma—all groups with below-averageownership rates.
Net Equity in Privately Held Businesses
The share of families that owned a privately heldbusiness interest edged up 0.5 percentage point dur-ing the recent period, to 12.0 percent.39 The propor-
37. This measure of residential real estate also includes outstandingbalances on loans that the family may have made to finance the sale ofproperties they previously owned.
38. Nonresidential real estate comprises the following types ofproperties unless they are owned through a business: commercialproperty, rental property with five or more units, farm and ranch land,undeveloped land, and all other types of nonresidential real estate.Most often, nonresidential real estate properties are functionally morelike a business than a residential property. They may have a number ofowners, they are typically worth a considerable amount, and they oftencarry large mortgages, which appear to be paid from the revenues fromthe property, not the family’s other income. As in the case of privatelyowned businesses, the value of the property in this analysis is taken tobe the net value.
39. The forms of business in this category are sole proprietorships,limited partnerships, other types of partnerships, subchapter S corpo-rations and other types of corporations that are not publicly traded,limited liability companies, and other types of private businesses. Ifthe family surveyed lived on a farm or ranch that was used at least inpart for agricultural business, the value of that part, net of thecorresponding share of associated debts, is included with otherbusiness assets.
In the survey, self-employment status and business ownership areindependently determined. Among the 12.0 percent of families with abusiness in 2007, 70.1 percent had a family head or the spouse orpartner of the head who was self-employed; among the 12.5 percent offamilies in which either the head or the spouse or partner of the headwas self-employed, 67.5 percent owned a business (data not shown inthe tables).
The 2004 and 2007 surveys differ in the ways that businessownership was determined. In both surveys, respondents were askeddirectly about business ownership. In the 2004 and earlier surveys, ithad been noticed at the stage of data editing that some respondents hadreported themselves as self-employed and as having substantial asso-ciated business assets but had failed to report ownership of a business,perhaps as a result of some confusion about the intent of the businessownership question; where possible, the data were corrected for suchmisunderstandings. Beginning with the 2007 survey, a new follow-upquestion was asked of every person who was reported as beingself-employed but who had not been noted as working for a businessowned by the family. The question asked whether a business withsome value was associated with the self-employment. If so, thenseveral additional questions were asked about the business’s value and
A34 Federal Reserve Bulletin h February 2009
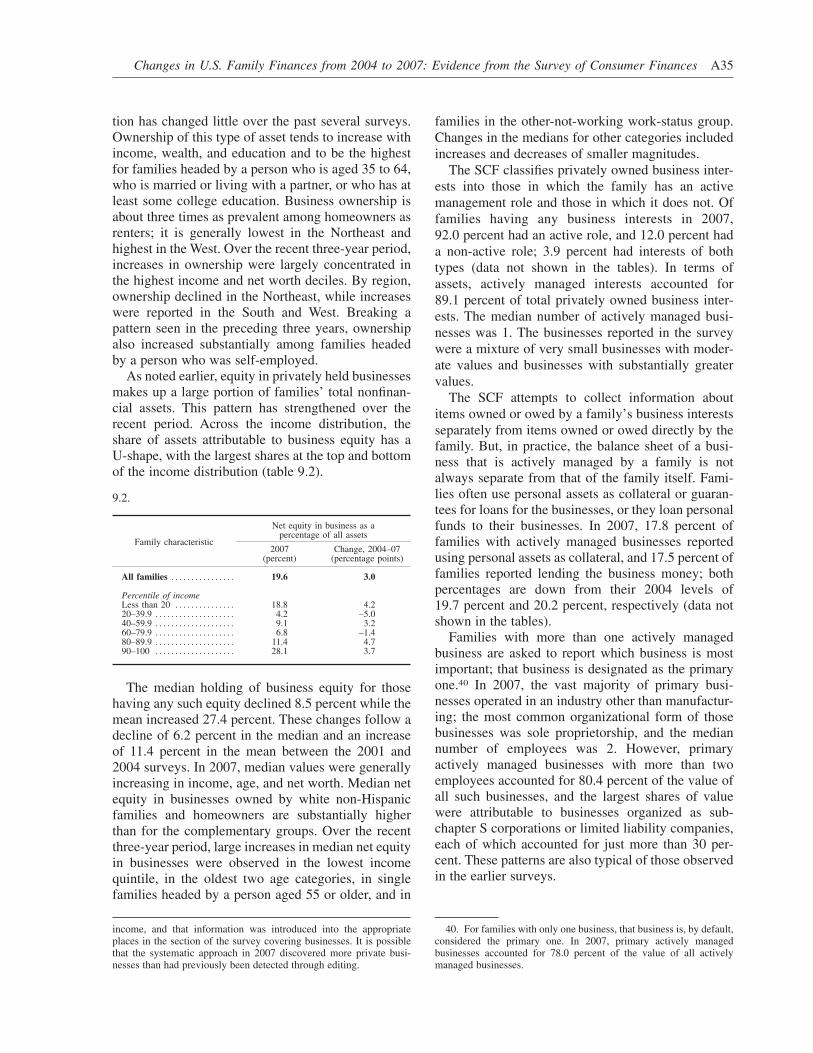
tion has changed little over the past several surveys.Ownership of this type of asset tends to increase withincome, wealth, and education and to be the highestfor families headed by a person who is aged 35 to 64,who is married or living with a partner, or who has atleast some college education. Business ownership isabout three times as prevalent among homeowners asrenters; it is generally lowest in the Northeast andhighest in the West. Over the recent three-year period,increases in ownership were largely concentrated inthe highest income and net worth deciles. By region,ownership declined in the Northeast, while increaseswere reported in the South and West. Breaking apattern seen in the preceding three years, ownershipalso increased substantially among families headedby a person who was self-employed.
As noted earlier, equity in privately held businessesmakes up a large portion of families’ total nonfinan-cial assets. This pattern has strengthened over therecent period. Across the income distribution, theshare of assets attributable to business equity has aU-shape, with the largest shares at the top and bottomof the income distribution (table 9.2).
The median holding of business equity for thosehaving any such equity declined 8.5 percent while themean increased 27.4 percent. These changes follow adecline of 6.2 percent in the median and an increaseof 11.4 percent in the mean between the 2001 and2004 surveys. In 2007, median values were generallyincreasing in income, age, and net worth. Median netequity in businesses owned by white non-Hispanicfamilies and homeowners are substantially higherthan for the complementary groups. Over the recentthree-year period, large increases in median net equityin businesses were observed in the lowest incomequintile, in the oldest two age categories, in singlefamilies headed by a person aged 55 or older, and in
families in the other-not-working work-status group.Changes in the medians for other categories includedincreases and decreases of smaller magnitudes.
The SCF classifies privately owned business inter-ests into those in which the family has an activemanagement role and those in which it does not. Offamilies having any business interests in 2007,92.0 percent had an active role, and 12.0 percent hada non-active role; 3.9 percent had interests of bothtypes (data not shown in the tables). In terms ofassets, actively managed interests accounted for89.1 percent of total privately owned business inter-ests. The median number of actively managed busi-nesses was 1. The businesses reported in the surveywere a mixture of very small businesses with moder-ate values and businesses with substantially greatervalues.
The SCF attempts to collect information aboutitems owned or owed by a family’s business interestsseparately from items owned or owed directly by thefamily. But, in practice, the balance sheet of a busi-ness that is actively managed by a family is notalways separate from that of the family itself. Fami-lies often use personal assets as collateral or guaran-tees for loans for the businesses, or they loan personalfunds to their businesses. In 2007, 17.8 percent offamilies with actively managed businesses reportedusing personal assets as collateral, and 17.5 percent offamilies reported lending the business money; bothpercentages are down from their 2004 levels of19.7 percent and 20.2 percent, respectively (data notshown in the tables).
Families with more than one actively managedbusiness are asked to report which business is mostimportant; that business is designated as the primaryone.40 In 2007, the vast majority of primary busi-nesses operated in an industry other than manufactur-ing; the most common organizational form of thosebusinesses was sole proprietorship, and the mediannumber of employees was 2. However, primaryactively managed businesses with more than twoemployees accounted for 80.4 percent of the value ofall such businesses, and the largest shares of valuewere attributable to businesses organized as sub-chapter S corporations or limited liability companies,each of which accounted for just more than 30 per-cent. These patterns are also typical of those observedin the earlier surveys.
income, and that information was introduced into the appropriateplaces in the section of the survey covering businesses. It is possiblethat the systematic approach in 2007 discovered more private busi-nesses than had previously been detected through editing.
40. For families with only one business, that business is, by default,considered the primary one. In 2007, primary actively managedbusinesses accounted for 78.0 percent of the value of all activelymanaged businesses.
9.2.
Family characteristic
Net equity in business as apercentage of all assets
2007(percent)
Change, 2004–07(percentage points)
All families . . . . . . . . . . . . . . . . 19.6 3.0
Percentile of incomeLess than 20 . . . . . . . . . . . . . . . 18.8 4.220–39.9 . . . . . . . . . . . . . . . . . . . . 4.2 –5.040–59.9 . . . . . . . . . . . . . . . . . . . . 9.1 3.260–79.9 . . . . . . . . . . . . . . . . . . . . 6.8 –1.480–89.9 . . . . . . . . . . . . . . . . . . . . 11.4 4.790–100 . . . . . . . . . . . . . . . . . . . . 28.1 3.7
Changes in U.S. Family Finances from 2004 to 2007: Evidence from the Survey of Consumer Finances A35
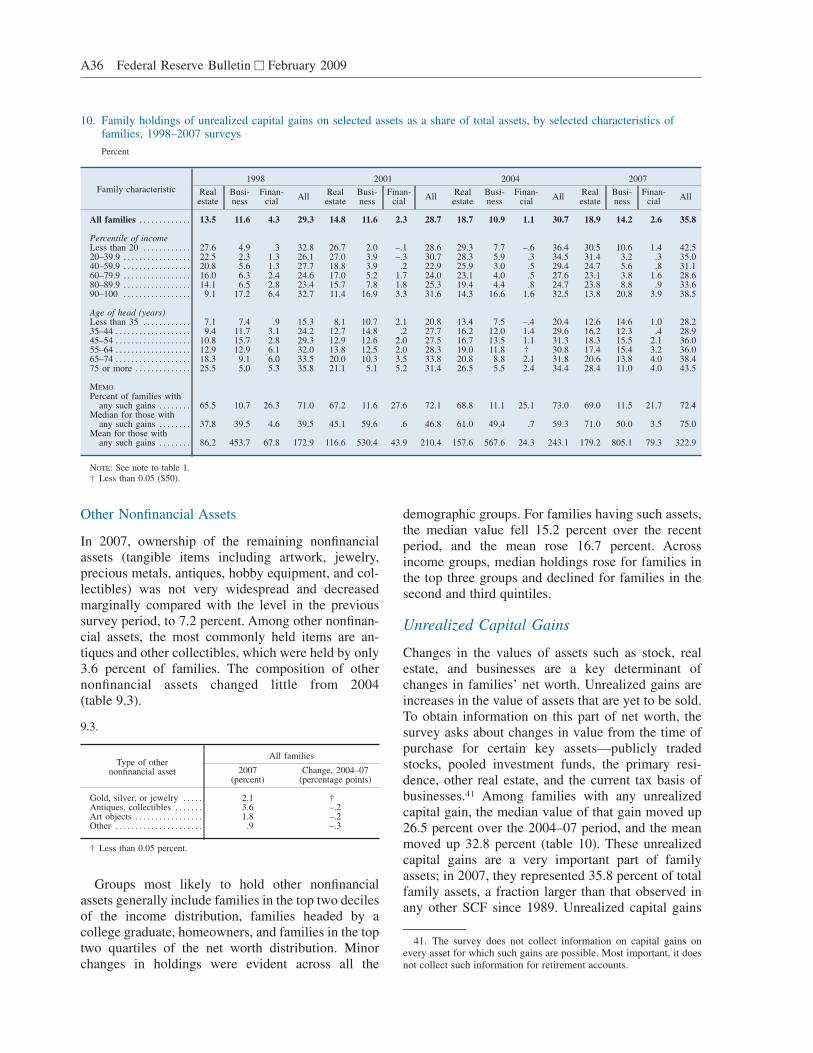
Other Nonfinancial Assets
In 2007, ownership of the remaining nonfinancialassets (tangible items including artwork, jewelry,precious metals, antiques, hobby equipment, and col-lectibles) was not very widespread and decreasedmarginally compared with the level in the previoussurvey period, to 7.2 percent. Among other nonfinan-cial assets, the most commonly held items are an-tiques and other collectibles, which were held by only3.6 percent of families. The composition of othernonfinancial assets changed little from 2004(table 9.3).
Groups most likely to hold other nonfinancialassets generally include families in the top two decilesof the income distribution, families headed by acollege graduate, homeowners, and families in the toptwo quartiles of the net worth distribution. Minorchanges in holdings were evident across all the
demographic groups. For families having such assets,the median value fell 15.2 percent over the recentperiod, and the mean rose 16.7 percent. Acrossincome groups, median holdings rose for families inthe top three groups and declined for families in thesecond and third quintiles.
Unrealized Capital Gains
Changes in the values of assets such as stock, realestate, and businesses are a key determinant ofchanges in families’ net worth. Unrealized gains areincreases in the value of assets that are yet to be sold.To obtain information on this part of net worth, thesurvey asks about changes in value from the time ofpurchase for certain key assets—publicly tradedstocks, pooled investment funds, the primary resi-dence, other real estate, and the current tax basis ofbusinesses.41 Among families with any unrealizedcapital gain, the median value of that gain moved up26.5 percent over the 2004–07 period, and the meanmoved up 32.8 percent (table 10). These unrealizedcapital gains are a very important part of familyassets; in 2007, they represented 35.8 percent of totalfamily assets, a fraction larger than that observed inany other SCF since 1989. Unrealized capital gains
41. The survey does not collect information on capital gains onevery asset for which such gains are possible. Most important, it doesnot collect such information for retirement accounts.
10. Family holdings of unrealized capital gains on selected assets as a share of total assets, by selected characteristics offamilies, 1998–2007 surveys
Percent
Family characteristic1998 2001 2004 2007
Realestate
Busi-ness
Finan-cial
AllRealestate
Busi-ness
Finan-cial
AllRealestate
Busi-ness
Finan-cial
AllRealestate
Busi-ness
Finan-cial
All
All families . . . . . . . . . . . . . 13.5 11.6 4.3 29.3 14.8 11.6 2.3 28.7 18.7 10.9 1.1 30.7 18.9 14.2 2.6 35.8
Percentile of incomeLess than 20 . . . . . . . . . . . . 27.6 4.9 .3 32.8 26.7 2.0 –.1 28.6 29.3 7.7 –.6 36.4 30.5 10.6 1.4 42.520–39.9 . . . . . . . . . . . . . . . . . 22.5 2.3 1.3 26.1 27.0 3.9 –.3 30.7 28.3 5.9 .3 34.5 31.4 3.2 .3 35.040–59.9 . . . . . . . . . . . . . . . . . 20.8 5.6 1.3 27.7 18.8 3.9 .2 22.9 25.9 3.0 .5 29.4 24.7 5.6 .8 31.160–79.9 . . . . . . . . . . . . . . . . . 16.0 6.3 2.4 24.6 17.0 5.2 1.7 24.0 23.1 4.0 .5 27.6 23.1 3.8 1.6 28.680–89.9 . . . . . . . . . . . . . . . . . 14.1 6.5 2.8 23.4 15.7 7.8 1.8 25.3 19.4 4.4 .8 24.7 23.8 8.8 .9 33.690–100 . . . . . . . . . . . . . . . . . 9.1 17.2 6.4 32.7 11.4 16.9 3.3 31.6 14.3 16.6 1.6 32.5 13.8 20.8 3.9 38.5
Age of head (years)Less than 35 . . . . . . . . . . . . 7.1 7.4 .9 15.3 8.1 10.7 2.1 20.8 13.4 7.5 –.4 20.4 12.6 14.6 1.0 28.235–44 . . . . . . . . . . . . . . . . . . . 9.4 11.7 3.1 24.2 12.7 14.8 .2 27.7 16.2 12.0 1.4 29.6 16.2 12.3 .4 28.945–54 . . . . . . . . . . . . . . . . . . . 10.8 15.7 2.8 29.3 12.9 12.6 2.0 27.5 16.7 13.5 1.1 31.3 18.3 15.5 2.1 36.055–64 . . . . . . . . . . . . . . . . . . . 12.9 12.9 6.1 32.0 13.8 12.5 2.0 28.3 19.0 11.8 † 30.8 17.4 15.4 3.2 36.065–74 . . . . . . . . . . . . . . . . . . . 18.3 9.1 6.0 33.5 20.0 10.3 3.5 33.8 20.8 8.8 2.1 31.8 20.6 13.8 4.0 38.475 or more . . . . . . . . . . . . . . 25.5 5.0 5.3 35.8 21.1 5.1 5.2 31.4 26.5 5.5 2.4 34.4 28.4 11.0 4.0 43.5
MEMO
Percent of families withany such gains . . . . . . . . 65.5 10.7 26.3 71.0 67.2 11.6 27.6 72.1 68.8 11.1 25.1 73.0 69.0 11.5 21.7 72.4
Median for those withany such gains . . . . . . . . 37.8 39.5 4.6 39.5 45.1 59.6 .6 46.8 61.0 49.4 .7 59.3 71.0 50.0 3.5 75.0
Mean for those withany such gains . . . . . . . . 86.2 453.7 67.8 172.9 116.6 530.4 43.9 210.4 157.6 567.6 24.3 243.1 179.2 805.1 79.3 322.9
NOTE: See note to table 1.† Less than 0.05 ($50).
9.3.
Type of othernonfinancial asset
All families
2007(percent)
Change, 2004–07(percentage points)
Gold, silver, or jewelry . . . . . 2.1 †Antiques, collectibles . . . . . . . 3.6 –.2Art objects . . . . . . . . . . . . . . . . . 1.8 –.2Other . . . . . . . . . . . . . . . . . . . . . . .9 –.3
† Less than 0.05 percent.
A36 Federal Reserve Bulletin h February 2009
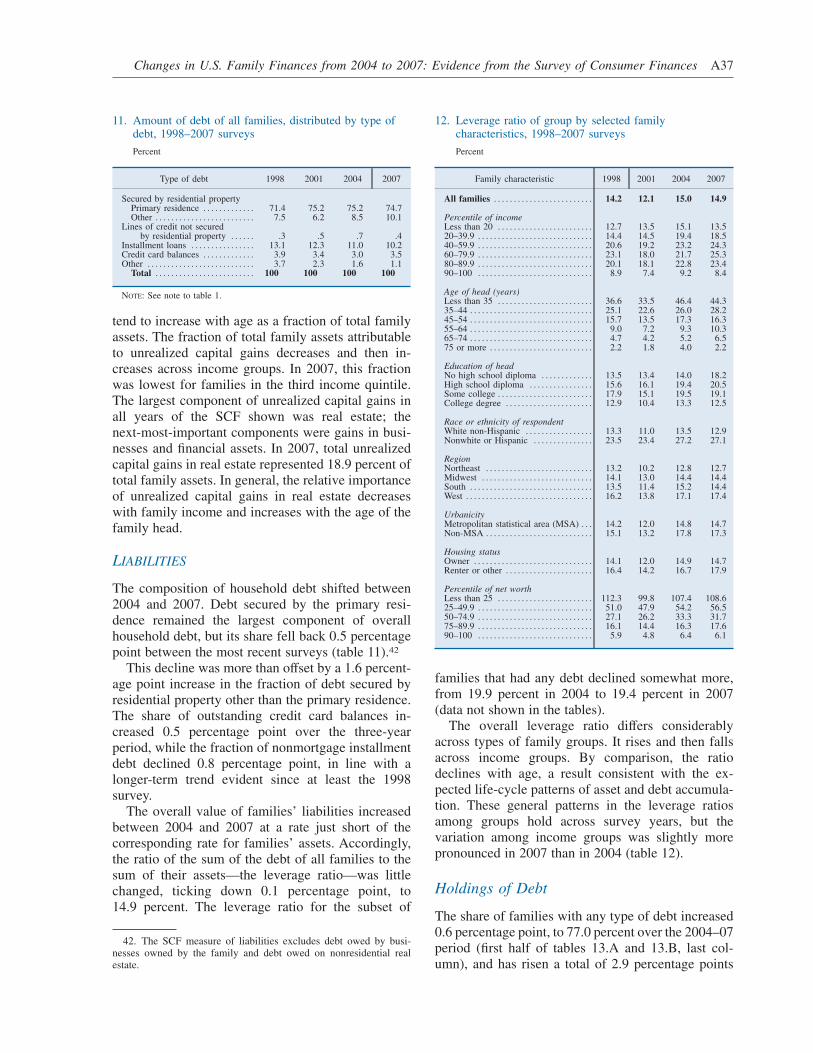
tend to increase with age as a fraction of total familyassets. The fraction of total family assets attributableto unrealized capital gains decreases and then in-creases across income groups. In 2007, this fractionwas lowest for families in the third income quintile.The largest component of unrealized capital gains inall years of the SCF shown was real estate; thenext-most-important components were gains in busi-nesses and financial assets. In 2007, total unrealizedcapital gains in real estate represented 18.9 percent oftotal family assets. In general, the relative importanceof unrealized capital gains in real estate decreaseswith family income and increases with the age of thefamily head.
LIABILITIES
The composition of household debt shifted between2004 and 2007. Debt secured by the primary resi-dence remained the largest component of overallhousehold debt, but its share fell back 0.5 percentagepoint between the most recent surveys (table 11).42
This decline was more than offset by a 1.6 percent-age point increase in the fraction of debt secured byresidential property other than the primary residence.The share of outstanding credit card balances in-creased 0.5 percentage point over the three-yearperiod, while the fraction of nonmortgage installmentdebt declined 0.8 percentage point, in line with alonger-term trend evident since at least the 1998survey.
The overall value of families’ liabilities increasedbetween 2004 and 2007 at a rate just short of thecorresponding rate for families’ assets. Accordingly,the ratio of the sum of the debt of all families to thesum of their assets—the leverage ratio—was littlechanged, ticking down 0.1 percentage point, to14.9 percent. The leverage ratio for the subset of
families that had any debt declined somewhat more,from 19.9 percent in 2004 to 19.4 percent in 2007(data not shown in the tables).
The overall leverage ratio differs considerablyacross types of family groups. It rises and then fallsacross income groups. By comparison, the ratiodeclines with age, a result consistent with the ex-pected life-cycle patterns of asset and debt accumula-tion. These general patterns in the leverage ratiosamong groups hold across survey years, but thevariation among income groups was slightly morepronounced in 2007 than in 2004 (table 12).
Holdings of Debt
The share of families with any type of debt increased0.6 percentage point, to 77.0 percent over the 2004–07period (first half of tables 13.A and 13.B, last col-umn), and has risen a total of 2.9 percentage points
42. The SCF measure of liabilities excludes debt owed by busi-nesses owned by the family and debt owed on nonresidential realestate.
11. Amount of debt of all families, distributed by type ofdebt, 1998–2007 surveys
Percent
Type of debt 1998 2001 2004 2007
Secured by residential propertyPrimary residence . . . . . . . . . . . . . 71.4 75.2 75.2 74.7Other . . . . . . . . . . . . . . . . . . . . . . . . . 7.5 6.2 8.5 10.1
Lines of credit not securedby residential property . . . . . . .3 .5 .7 .4
Installment loans . . . . . . . . . . . . . . . . 13.1 12.3 11.0 10.2Credit card balances . . . . . . . . . . . . . 3.9 3.4 3.0 3.5Other . . . . . . . . . . . . . . . . . . . . . . . . . . . 3.7 2.3 1.6 1.1
Total . . . . . . . . . . . . . . . . . . . . . . . . . 100 100 100 100
NOTE: See note to table 1.
12. Leverage ratio of group by selected familycharacteristics, 1998–2007 surveys
Percent
Family characteristic 1998 2001 2004 2007
All families . . . . . . . . . . . . . . . . . . . . . . . . . 14.2 12.1 15.0 14.9
Percentile of incomeLess than 20 . . . . . . . . . . . . . . . . . . . . . . . . 12.7 13.5 15.1 13.520–39.9 . . . . . . . . . . . . . . . . . . . . . . . . . . . . . 14.4 14.5 19.4 18.540–59.9 . . . . . . . . . . . . . . . . . . . . . . . . . . . . . 20.6 19.2 23.2 24.360–79.9 . . . . . . . . . . . . . . . . . . . . . . . . . . . . . 23.1 18.0 21.7 25.380–89.9 . . . . . . . . . . . . . . . . . . . . . . . . . . . . . 20.1 18.1 22.8 23.490–100 . . . . . . . . . . . . . . . . . . . . . . . . . . . . . 8.9 7.4 9.2 8.4
Age of head (years)Less than 35 . . . . . . . . . . . . . . . . . . . . . . . . 36.6 33.5 46.4 44.335–44 . . . . . . . . . . . . . . . . . . . . . . . . . . . . . . . 25.1 22.6 26.0 28.245–54 . . . . . . . . . . . . . . . . . . . . . . . . . . . . . . . 15.7 13.5 17.3 16.355–64 . . . . . . . . . . . . . . . . . . . . . . . . . . . . . . . 9.0 7.2 9.3 10.365–74 . . . . . . . . . . . . . . . . . . . . . . . . . . . . . . . 4.7 4.2 5.2 6.575 or more . . . . . . . . . . . . . . . . . . . . . . . . . . 2.2 1.8 4.0 2.2
Education of headNo high school diploma . . . . . . . . . . . . . 13.5 13.4 14.0 18.2High school diploma . . . . . . . . . . . . . . . . 15.6 16.1 19.4 20.5Some college . . . . . . . . . . . . . . . . . . . . . . . . 17.9 15.1 19.5 19.1College degree . . . . . . . . . . . . . . . . . . . . . . 12.9 10.4 13.3 12.5
Race or ethnicity of respondentWhite non-Hispanic . . . . . . . . . . . . . . . . . 13.3 11.0 13.5 12.9Nonwhite or Hispanic . . . . . . . . . . . . . . . 23.5 23.4 27.2 27.1
RegionNortheast . . . . . . . . . . . . . . . . . . . . . . . . . . . 13.2 10.2 12.8 12.7Midwest . . . . . . . . . . . . . . . . . . . . . . . . . . . . 14.1 13.0 14.4 14.4South . . . . . . . . . . . . . . . . . . . . . . . . . . . . . . . 13.5 11.4 15.2 14.4West . . . . . . . . . . . . . . . . . . . . . . . . . . . . . . . . 16.2 13.8 17.1 17.4
UrbanicityMetropolitan statistical area (MSA) . . . 14.2 12.0 14.8 14.7Non-MSA . . . . . . . . . . . . . . . . . . . . . . . . . . . 15.1 13.2 17.8 17.3
Housing statusOwner . . . . . . . . . . . . . . . . . . . . . . . . . . . . . . 14.1 12.0 14.9 14.7Renter or other . . . . . . . . . . . . . . . . . . . . . . 16.4 14.2 16.7 17.9
Percentile of net worthLess than 25 . . . . . . . . . . . . . . . . . . . . . . . . 112.3 99.8 107.4 108.625–49.9 . . . . . . . . . . . . . . . . . . . . . . . . . . . . . 51.0 47.9 54.2 56.550–74.9 . . . . . . . . . . . . . . . . . . . . . . . . . . . . . 27.1 26.2 33.3 31.775–89.9 . . . . . . . . . . . . . . . . . . . . . . . . . . . . . 16.1 14.4 16.3 17.690–100 . . . . . . . . . . . . . . . . . . . . . . . . . . . . . 5.9 4.8 6.4 6.1
Changes in U.S. Family Finances from 2004 to 2007: Evidence from the Survey of Consumer Finances A37
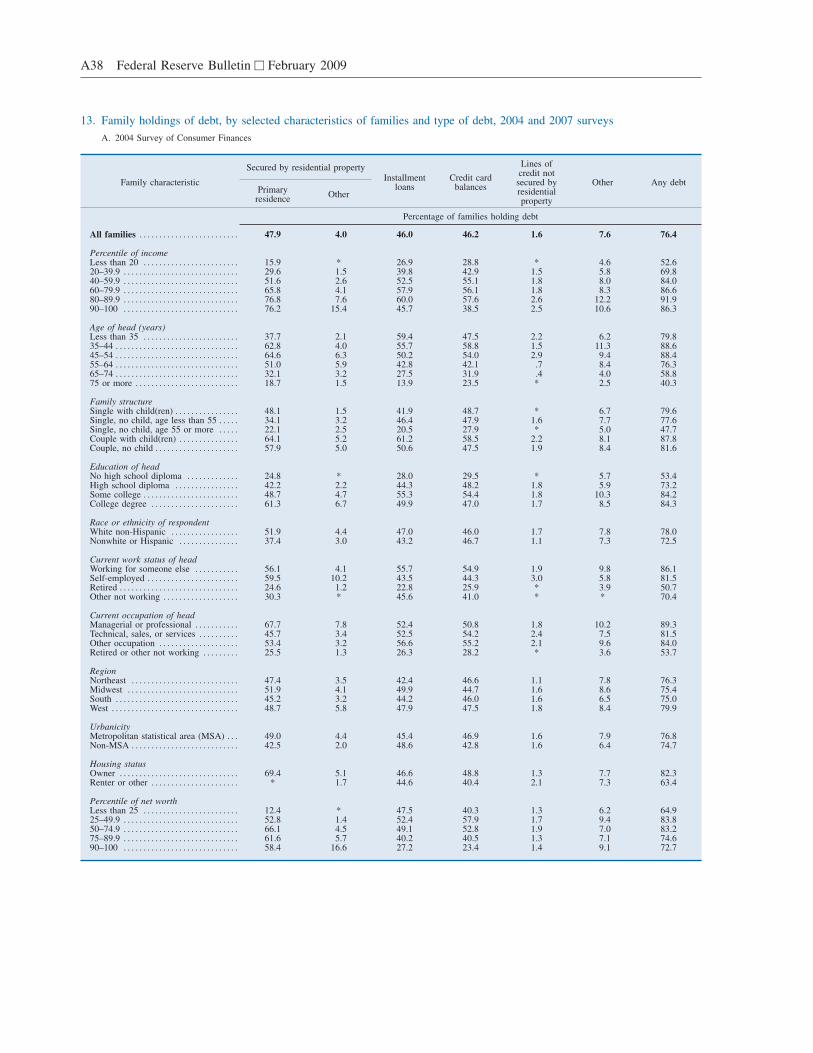
13. Family holdings of debt, by selected characteristics of families and type of debt, 2004 and 2007 surveys
A. 2004 Survey of Consumer Finances
Family characteristic
Secured by residential propertyInstallment
loansCredit card
balances
Lines ofcredit notsecured byresidentialproperty
Other Any debtPrimary
residenceOther
Percentage of families holding debt
All families . . . . . . . . . . . . . . . . . . . . . . . . . 47.9 4.0 46.0 46.2 1.6 7.6 76.4
Percentile of incomeLess than 20 . . . . . . . . . . . . . . . . . . . . . . . . 15.9 * 26.9 28.8 * 4.6 52.620–39.9 . . . . . . . . . . . . . . . . . . . . . . . . . . . . . 29.6 1.5 39.8 42.9 1.5 5.8 69.840–59.9 . . . . . . . . . . . . . . . . . . . . . . . . . . . . . 51.6 2.6 52.5 55.1 1.8 8.0 84.060–79.9 . . . . . . . . . . . . . . . . . . . . . . . . . . . . . 65.8 4.1 57.9 56.1 1.8 8.3 86.680–89.9 . . . . . . . . . . . . . . . . . . . . . . . . . . . . . 76.8 7.6 60.0 57.6 2.6 12.2 91.990–100 . . . . . . . . . . . . . . . . . . . . . . . . . . . . . 76.2 15.4 45.7 38.5 2.5 10.6 86.3
Age of head (years)Less than 35 . . . . . . . . . . . . . . . . . . . . . . . . 37.7 2.1 59.4 47.5 2.2 6.2 79.835–44 . . . . . . . . . . . . . . . . . . . . . . . . . . . . . . . 62.8 4.0 55.7 58.8 1.5 11.3 88.645–54 . . . . . . . . . . . . . . . . . . . . . . . . . . . . . . . 64.6 6.3 50.2 54.0 2.9 9.4 88.455–64 . . . . . . . . . . . . . . . . . . . . . . . . . . . . . . . 51.0 5.9 42.8 42.1 .7 8.4 76.365–74 . . . . . . . . . . . . . . . . . . . . . . . . . . . . . . . 32.1 3.2 27.5 31.9 .4 4.0 58.875 or more . . . . . . . . . . . . . . . . . . . . . . . . . . 18.7 1.5 13.9 23.5 * 2.5 40.3
Family structureSingle with child(ren) . . . . . . . . . . . . . . . . 48.1 1.5 41.9 48.7 * 6.7 79.6Single, no child, age less than 55 . . . . . 34.1 3.2 46.4 47.9 1.6 7.7 77.6Single, no child, age 55 or more . . . . . 22.1 2.5 20.5 27.9 * 5.0 47.7Couple with child(ren) . . . . . . . . . . . . . . . 64.1 5.2 61.2 58.5 2.2 8.1 87.8Couple, no child . . . . . . . . . . . . . . . . . . . . . 57.9 5.0 50.6 47.5 1.9 8.4 81.6
Education of headNo high school diploma . . . . . . . . . . . . . 24.8 * 28.0 29.5 * 5.7 53.4High school diploma . . . . . . . . . . . . . . . . 42.2 2.2 44.3 48.2 1.8 5.9 73.2Some college . . . . . . . . . . . . . . . . . . . . . . . . 48.7 4.7 55.3 54.4 1.8 10.3 84.2College degree . . . . . . . . . . . . . . . . . . . . . . 61.3 6.7 49.9 47.0 1.7 8.5 84.3
Race or ethnicity of respondentWhite non-Hispanic . . . . . . . . . . . . . . . . . 51.9 4.4 47.0 46.0 1.7 7.8 78.0Nonwhite or Hispanic . . . . . . . . . . . . . . . 37.4 3.0 43.2 46.7 1.1 7.3 72.5
Current work status of headWorking for someone else . . . . . . . . . . . 56.1 4.1 55.7 54.9 1.9 9.8 86.1Self-employed . . . . . . . . . . . . . . . . . . . . . . . 59.5 10.2 43.5 44.3 3.0 5.8 81.5Retired . . . . . . . . . . . . . . . . . . . . . . . . . . . . . . 24.6 1.2 22.8 25.9 * 3.9 50.7Other not working . . . . . . . . . . . . . . . . . . . 30.3 * 45.6 41.0 * * 70.4
Current occupation of headManagerial or professional . . . . . . . . . . . 67.7 7.8 52.4 50.8 1.8 10.2 89.3Technical, sales, or services . . . . . . . . . . 45.7 3.4 52.5 54.2 2.4 7.5 81.5Other occupation . . . . . . . . . . . . . . . . . . . . 53.4 3.2 56.6 55.2 2.1 9.6 84.0Retired or other not working . . . . . . . . . 25.5 1.3 26.3 28.2 * 3.6 53.7
RegionNortheast . . . . . . . . . . . . . . . . . . . . . . . . . . . 47.4 3.5 42.4 46.6 1.1 7.8 76.3Midwest . . . . . . . . . . . . . . . . . . . . . . . . . . . . 51.9 4.1 49.9 44.7 1.6 8.6 75.4South . . . . . . . . . . . . . . . . . . . . . . . . . . . . . . . 45.2 3.2 44.2 46.0 1.6 6.5 75.0West . . . . . . . . . . . . . . . . . . . . . . . . . . . . . . . . 48.7 5.8 47.9 47.5 1.8 8.4 79.9
UrbanicityMetropolitan statistical area (MSA) . . . 49.0 4.4 45.4 46.9 1.6 7.9 76.8Non-MSA . . . . . . . . . . . . . . . . . . . . . . . . . . . 42.5 2.0 48.6 42.8 1.6 6.4 74.7
Housing statusOwner . . . . . . . . . . . . . . . . . . . . . . . . . . . . . . 69.4 5.1 46.6 48.8 1.3 7.7 82.3Renter or other . . . . . . . . . . . . . . . . . . . . . . * 1.7 44.6 40.4 2.1 7.3 63.4
Percentile of net worthLess than 25 . . . . . . . . . . . . . . . . . . . . . . . . 12.4 * 47.5 40.3 1.3 6.2 64.925–49.9 . . . . . . . . . . . . . . . . . . . . . . . . . . . . . 52.8 1.4 52.4 57.9 1.7 9.4 83.850–74.9 . . . . . . . . . . . . . . . . . . . . . . . . . . . . . 66.1 4.5 49.1 52.8 1.9 7.0 83.275–89.9 . . . . . . . . . . . . . . . . . . . . . . . . . . . . . 61.6 5.7 40.2 40.5 1.3 7.1 74.690–100 . . . . . . . . . . . . . . . . . . . . . . . . . . . . . 58.4 16.6 27.2 23.4 1.4 9.1 72.7
A38 Federal Reserve Bulletin h February 2009

13. Family holdings of debt, by selected characteristics of families and type of debt, 2004 and 2007 surveys—Continued
A. 2004 Survey of Consumer Finances—continued
Family characteristic
Secured by residential propertyInstallment
loansCredit card
balances
Lines ofcredit notsecured byresidentialproperty
Other Any debtPrimary
residenceOther
Median value of holdings for families holding debt (thousands of 2007 dollars)
All families . . . . . . . . . . . . . . . . . . . . . . . . . 104.3 95.6 12.7 2.4 3.3 4.4 60.7
Percentile of incomeLess than 20 . . . . . . . . . . . . . . . . . . . . . . . . 40.6 * 6.1 1.1 * 2.2 7.720–39.9 . . . . . . . . . . . . . . . . . . . . . . . . . . . . . 59.3 35.7 8.8 2.0 .3 2.9 17.640–59.9 . . . . . . . . . . . . . . . . . . . . . . . . . . . . . 84.8 72.5 11.8 2.4 1.1 2.5 48.860–79.9 . . . . . . . . . . . . . . . . . . . . . . . . . . . . . 106.5 68.1 15.2 3.3 7.7 3.8 102.680–89.9 . . . . . . . . . . . . . . . . . . . . . . . . . . . . . 146.1 85.7 16.6 3.0 15.4 5.5 149.490–100 . . . . . . . . . . . . . . . . . . . . . . . . . . . . . 203.2 174.6 19.8 4.4 43.9 10.4 229.5
Age of head (years)Less than 35 . . . . . . . . . . . . . . . . . . . . . . . . 117.5 68.6 13.1 1.6 1.1 3.3 36.935–44 . . . . . . . . . . . . . . . . . . . . . . . . . . . . . . . 120.8 82.4 13.2 2.7 2.1 4.4 95.845–54 . . . . . . . . . . . . . . . . . . . . . . . . . . . . . . . 106.5 95.6 13.1 3.2 7.7 4.4 91.455–64 . . . . . . . . . . . . . . . . . . . . . . . . . . . . . . . 91.2 119.5 14.2 2.4 15.4 6.0 52.765–74 . . . . . . . . . . . . . . . . . . . . . . . . . . . . . . . 56.0 109.8 9.1 2.4 4.4 5.5 27.575 or more . . . . . . . . . . . . . . . . . . . . . . . . . . 34.0 42.8 7.4 1.1 * 2.2 16.9
Family structureSingle with child(ren) . . . . . . . . . . . . . . . . 71.4 71.4 9.3 2.4 * 2.2 44.0Single, no child, age less than 55 . . . . . 97.7 72.5 9.8 2.1 1.1 3.3 23.4Single, no child, age 55 or more . . . . . 52.7 87.9 8.8 2.0 * 2.2 18.1Couple with child(ren) . . . . . . . . . . . . . . . 104.3 153.8 14.6 3.3 4.4 4.9 97.0Couple, no child . . . . . . . . . . . . . . . . . . . . . 119.7 104.3 15.0 2.3 9.9 5.5 93.4
Education of headNo high school diploma . . . . . . . . . . . . . 48.3 * 7.7 1.3 * 4.4 13.2High school diploma . . . . . . . . . . . . . . . . 76.9 51.6 9.9 2.1 1.6 3.3 34.0Some college . . . . . . . . . . . . . . . . . . . . . . . . 94.5 82.4 13.0 2.4 3.3 3.7 49.4College degree . . . . . . . . . . . . . . . . . . . . . . 137.3 115.3 16.9 3.0 4.4 5.5 117.7
Race or ethnicity of respondentWhite non-Hispanic . . . . . . . . . . . . . . . . . 107.6 95.6 13.7 2.7 4.4 4.4 76.3Nonwhite or Hispanic . . . . . . . . . . . . . . . 91.2 72.5 10.5 1.7 .4 3.3 33.5
Current work status of headWorking for someone else . . . . . . . . . . . 109.8 91.2 13.2 2.5 4.4 3.8 78.9Self-employed . . . . . . . . . . . . . . . . . . . . . . . 131.6 109.8 16.9 3.0 2.4 7.7 102.6Retired . . . . . . . . . . . . . . . . . . . . . . . . . . . . . . 46.1 86.8 8.0 1.6 * 3.3 16.9Other not working . . . . . . . . . . . . . . . . . . . 85.7 * 8.2 2.7 * * 23.1
Current occupation of headManagerial or professional . . . . . . . . . . . 141.7 101.0 16.5 3.3 8.8 5.5 127.3Technical, sales, or services . . . . . . . . . . 97.7 115.3 12.2 2.2 1.6 3.3 47.6Other occupation . . . . . . . . . . . . . . . . . . . . 90.8 85.7 11.3 2.5 1.6 3.3 56.4Retired or other not working . . . . . . . . . 54.9 106.5 8.2 1.6 * 4.4 17.7
RegionNortheast . . . . . . . . . . . . . . . . . . . . . . . . . . . 122.5 109.8 13.0 2.7 .4 5.5 60.1Midwest . . . . . . . . . . . . . . . . . . . . . . . . . . . . 94.5 87.9 12.1 2.2 3.3 4.4 75.4South . . . . . . . . . . . . . . . . . . . . . . . . . . . . . . . 86.8 91.2 12.3 2.2 8.8 4.4 44.3West . . . . . . . . . . . . . . . . . . . . . . . . . . . . . . . . 140.7 95.6 14.1 2.7 4.4 3.3 85.2
UrbanicityMetropolitan statistical area (MSA) . . . 115.3 96.6 13.2 2.4 2.4 4.4 75.8Non-MSA . . . . . . . . . . . . . . . . . . . . . . . . . . . 54.9 69.2 10.9 2.2 22.0 4.4 28.9
Housing statusOwner . . . . . . . . . . . . . . . . . . . . . . . . . . . . . . 104.3 98.8 14.2 2.7 8.8 4.4 105.2Renter or other . . . . . . . . . . . . . . . . . . . . . . * 91.2 9.6 1.6 .5 3.3 8.6
Percentile of net worthLess than 25 . . . . . . . . . . . . . . . . . . . . . . . . 78.0 * 11.5 1.9 .3 4.4 12.525–49.9 . . . . . . . . . . . . . . . . . . . . . . . . . . . . . 82.4 28.9 10.2 2.2 1.1 2.2 48.650–74.9 . . . . . . . . . . . . . . . . . . . . . . . . . . . . . 106.5 51.6 14.6 2.7 8.8 4.4 98.975–89.9 . . . . . . . . . . . . . . . . . . . . . . . . . . . . . 126.3 108.7 14.2 3.3 24.2 5.5 121.690–100 . . . . . . . . . . . . . . . . . . . . . . . . . . . . . 204.4 162.5 19.2 3.3 54.9 22.0 209.5
MEMO
Mean value of holdings forfamilies holding asset . . . . . . . . . . . . . 136.2 183.1 20.7 5.6 40.2 18.7 113.5
NOTE: See note to table 11.* Ten or fewer observations.
Changes in U.S. Family Finances from 2004 to 2007: Evidence from the Survey of Consumer Finances A39
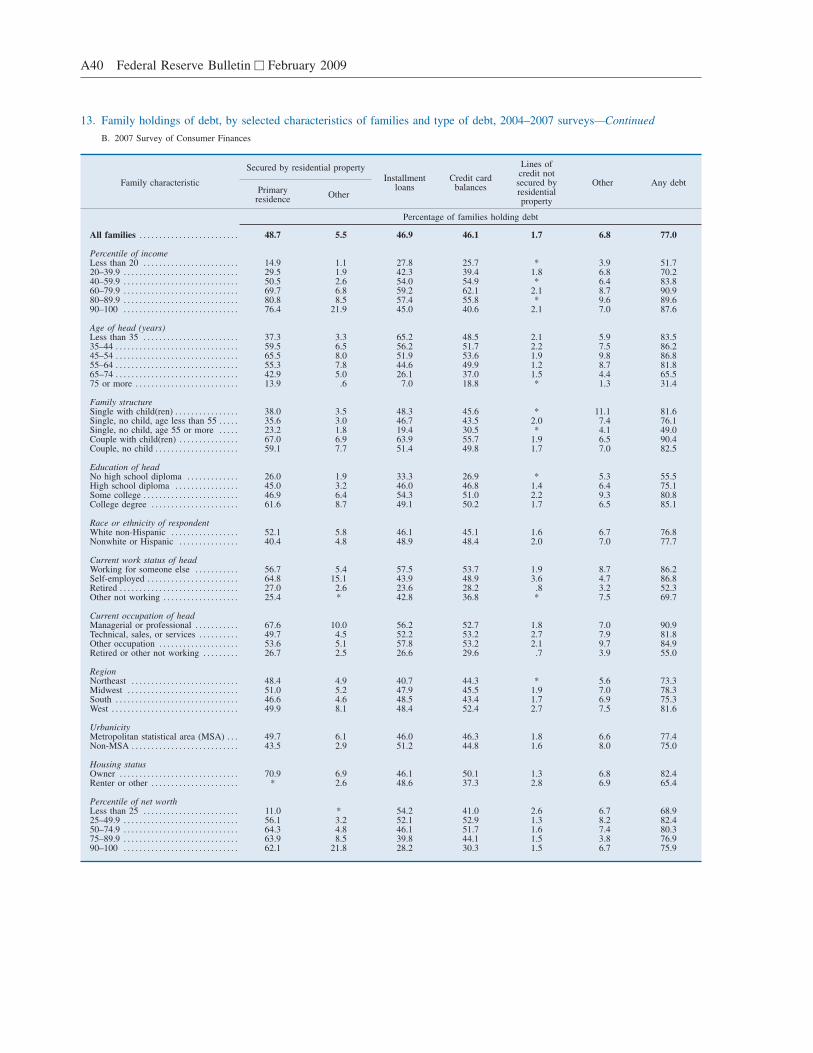
13. Family holdings of debt, by selected characteristics of families and type of debt, 2004–2007 surveys—Continued
B. 2007 Survey of Consumer Finances
Family characteristic
Secured by residential propertyInstallment
loansCredit card
balances
Lines ofcredit notsecured byresidentialproperty
Other Any debtPrimary
residenceOther
Percentage of families holding debt
All families . . . . . . . . . . . . . . . . . . . . . . . . . 48.7 5.5 46.9 46.1 1.7 6.8 77.0
Percentile of incomeLess than 20 . . . . . . . . . . . . . . . . . . . . . . . . 14.9 1.1 27.8 25.7 * 3.9 51.720–39.9 . . . . . . . . . . . . . . . . . . . . . . . . . . . . . 29.5 1.9 42.3 39.4 1.8 6.8 70.240–59.9 . . . . . . . . . . . . . . . . . . . . . . . . . . . . . 50.5 2.6 54.0 54.9 * 6.4 83.860–79.9 . . . . . . . . . . . . . . . . . . . . . . . . . . . . . 69.7 6.8 59.2 62.1 2.1 8.7 90.980–89.9 . . . . . . . . . . . . . . . . . . . . . . . . . . . . . 80.8 8.5 57.4 55.8 * 9.6 89.690–100 . . . . . . . . . . . . . . . . . . . . . . . . . . . . . 76.4 21.9 45.0 40.6 2.1 7.0 87.6
Age of head (years)Less than 35 . . . . . . . . . . . . . . . . . . . . . . . . 37.3 3.3 65.2 48.5 2.1 5.9 83.535–44 . . . . . . . . . . . . . . . . . . . . . . . . . . . . . . . 59.5 6.5 56.2 51.7 2.2 7.5 86.245–54 . . . . . . . . . . . . . . . . . . . . . . . . . . . . . . . 65.5 8.0 51.9 53.6 1.9 9.8 86.855–64 . . . . . . . . . . . . . . . . . . . . . . . . . . . . . . . 55.3 7.8 44.6 49.9 1.2 8.7 81.865–74 . . . . . . . . . . . . . . . . . . . . . . . . . . . . . . . 42.9 5.0 26.1 37.0 1.5 4.4 65.575 or more . . . . . . . . . . . . . . . . . . . . . . . . . . 13.9 .6 7.0 18.8 * 1.3 31.4
Family structureSingle with child(ren) . . . . . . . . . . . . . . . . 38.0 3.5 48.3 45.6 * 11.1 81.6Single, no child, age less than 55 . . . . . 35.6 3.0 46.7 43.5 2.0 7.4 76.1Single, no child, age 55 or more . . . . . 23.2 1.8 19.4 30.5 * 4.1 49.0Couple with child(ren) . . . . . . . . . . . . . . . 67.0 6.9 63.9 55.7 1.9 6.5 90.4Couple, no child . . . . . . . . . . . . . . . . . . . . . 59.1 7.7 51.4 49.8 1.7 7.0 82.5
Education of headNo high school diploma . . . . . . . . . . . . . 26.0 1.9 33.3 26.9 * 5.3 55.5High school diploma . . . . . . . . . . . . . . . . 45.0 3.2 46.0 46.8 1.4 6.4 75.1Some college . . . . . . . . . . . . . . . . . . . . . . . . 46.9 6.4 54.3 51.0 2.2 9.3 80.8College degree . . . . . . . . . . . . . . . . . . . . . . 61.6 8.7 49.1 50.2 1.7 6.5 85.1
Race or ethnicity of respondentWhite non-Hispanic . . . . . . . . . . . . . . . . . 52.1 5.8 46.1 45.1 1.6 6.7 76.8Nonwhite or Hispanic . . . . . . . . . . . . . . . 40.4 4.8 48.9 48.4 2.0 7.0 77.7
Current work status of headWorking for someone else . . . . . . . . . . . 56.7 5.4 57.5 53.7 1.9 8.7 86.2Self-employed . . . . . . . . . . . . . . . . . . . . . . . 64.8 15.1 43.9 48.9 3.6 4.7 86.8Retired . . . . . . . . . . . . . . . . . . . . . . . . . . . . . . 27.0 2.6 23.6 28.2 .8 3.2 52.3Other not working . . . . . . . . . . . . . . . . . . . 25.4 * 42.8 36.8 * 7.5 69.7
Current occupation of headManagerial or professional . . . . . . . . . . . 67.6 10.0 56.2 52.7 1.8 7.0 90.9Technical, sales, or services . . . . . . . . . . 49.7 4.5 52.2 53.2 2.7 7.9 81.8Other occupation . . . . . . . . . . . . . . . . . . . . 53.6 5.1 57.8 53.2 2.1 9.7 84.9Retired or other not working . . . . . . . . . 26.7 2.5 26.6 29.6 .7 3.9 55.0
RegionNortheast . . . . . . . . . . . . . . . . . . . . . . . . . . . 48.4 4.9 40.7 44.3 * 5.6 73.3Midwest . . . . . . . . . . . . . . . . . . . . . . . . . . . . 51.0 5.2 47.9 45.5 1.9 7.0 78.3South . . . . . . . . . . . . . . . . . . . . . . . . . . . . . . . 46.6 4.6 48.5 43.4 1.7 6.9 75.3West . . . . . . . . . . . . . . . . . . . . . . . . . . . . . . . . 49.9 8.1 48.4 52.4 2.7 7.5 81.6
UrbanicityMetropolitan statistical area (MSA) . . . 49.7 6.1 46.0 46.3 1.8 6.6 77.4Non-MSA . . . . . . . . . . . . . . . . . . . . . . . . . . . 43.5 2.9 51.2 44.8 1.6 8.0 75.0
Housing statusOwner . . . . . . . . . . . . . . . . . . . . . . . . . . . . . . 70.9 6.9 46.1 50.1 1.3 6.8 82.4Renter or other . . . . . . . . . . . . . . . . . . . . . . * 2.6 48.6 37.3 2.8 6.9 65.4
Percentile of net worthLess than 25 . . . . . . . . . . . . . . . . . . . . . . . . 11.0 * 54.2 41.0 2.6 6.7 68.925–49.9 . . . . . . . . . . . . . . . . . . . . . . . . . . . . . 56.1 3.2 52.1 52.9 1.3 8.2 82.450–74.9 . . . . . . . . . . . . . . . . . . . . . . . . . . . . . 64.3 4.8 46.1 51.7 1.6 7.4 80.375–89.9 . . . . . . . . . . . . . . . . . . . . . . . . . . . . . 63.9 8.5 39.8 44.1 1.5 3.8 76.990–100 . . . . . . . . . . . . . . . . . . . . . . . . . . . . . 62.1 21.8 28.2 30.3 1.5 6.7 75.9
A40 Federal Reserve Bulletin h February 2009
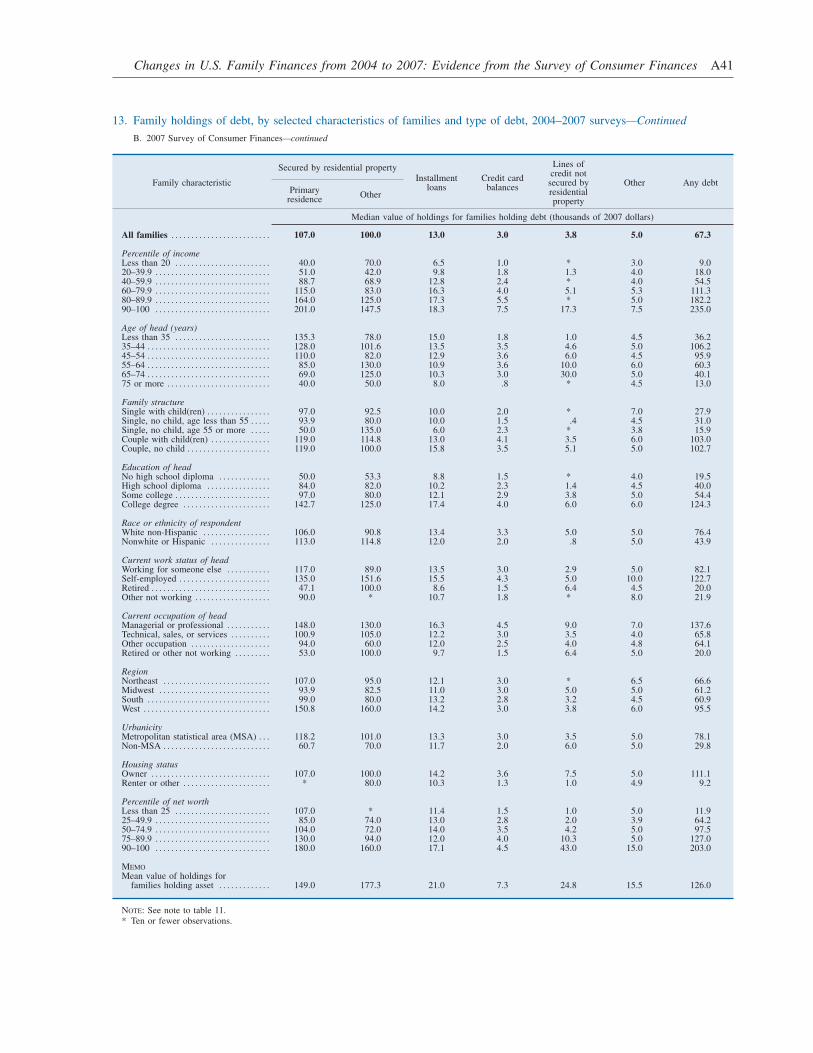
13. Family holdings of debt, by selected characteristics of families and type of debt, 2004–2007 surveys—Continued
B. 2007 Survey of Consumer Finances—continued
Family characteristic
Secured by residential propertyInstallment
loansCredit card
balances
Lines ofcredit notsecured byresidentialproperty
Other Any debtPrimary
residenceOther
Median value of holdings for families holding debt (thousands of 2007 dollars)
All families . . . . . . . . . . . . . . . . . . . . . . . . . 107.0 100.0 13.0 3.0 3.8 5.0 67.3
Percentile of incomeLess than 20 . . . . . . . . . . . . . . . . . . . . . . . . 40.0 70.0 6.5 1.0 * 3.0 9.020–39.9 . . . . . . . . . . . . . . . . . . . . . . . . . . . . . 51.0 42.0 9.8 1.8 1.3 4.0 18.040–59.9 . . . . . . . . . . . . . . . . . . . . . . . . . . . . . 88.7 68.9 12.8 2.4 * 4.0 54.560–79.9 . . . . . . . . . . . . . . . . . . . . . . . . . . . . . 115.0 83.0 16.3 4.0 5.1 5.3 111.380–89.9 . . . . . . . . . . . . . . . . . . . . . . . . . . . . . 164.0 125.0 17.3 5.5 * 5.0 182.290–100 . . . . . . . . . . . . . . . . . . . . . . . . . . . . . 201.0 147.5 18.3 7.5 17.3 7.5 235.0
Age of head (years)Less than 35 . . . . . . . . . . . . . . . . . . . . . . . . 135.3 78.0 15.0 1.8 1.0 4.5 36.235–44 . . . . . . . . . . . . . . . . . . . . . . . . . . . . . . . 128.0 101.6 13.5 3.5 4.6 5.0 106.245–54 . . . . . . . . . . . . . . . . . . . . . . . . . . . . . . . 110.0 82.0 12.9 3.6 6.0 4.5 95.955–64 . . . . . . . . . . . . . . . . . . . . . . . . . . . . . . . 85.0 130.0 10.9 3.6 10.0 6.0 60.365–74 . . . . . . . . . . . . . . . . . . . . . . . . . . . . . . . 69.0 125.0 10.3 3.0 30.0 5.0 40.175 or more . . . . . . . . . . . . . . . . . . . . . . . . . . 40.0 50.0 8.0 .8 * 4.5 13.0
Family structureSingle with child(ren) . . . . . . . . . . . . . . . . 97.0 92.5 10.0 2.0 * 7.0 27.9Single, no child, age less than 55 . . . . . 93.9 80.0 10.0 1.5 .4 4.5 31.0Single, no child, age 55 or more . . . . . 50.0 135.0 6.0 2.3 * 3.8 15.9Couple with child(ren) . . . . . . . . . . . . . . . 119.0 114.8 13.0 4.1 3.5 6.0 103.0Couple, no child . . . . . . . . . . . . . . . . . . . . . 119.0 100.0 15.8 3.5 5.1 5.0 102.7
Education of headNo high school diploma . . . . . . . . . . . . . 50.0 53.3 8.8 1.5 * 4.0 19.5High school diploma . . . . . . . . . . . . . . . . 84.0 82.0 10.2 2.3 1.4 4.5 40.0Some college . . . . . . . . . . . . . . . . . . . . . . . . 97.0 80.0 12.1 2.9 3.8 5.0 54.4College degree . . . . . . . . . . . . . . . . . . . . . . 142.7 125.0 17.4 4.0 6.0 6.0 124.3
Race or ethnicity of respondentWhite non-Hispanic . . . . . . . . . . . . . . . . . 106.0 90.8 13.4 3.3 5.0 5.0 76.4Nonwhite or Hispanic . . . . . . . . . . . . . . . 113.0 114.8 12.0 2.0 .8 5.0 43.9
Current work status of headWorking for someone else . . . . . . . . . . . 117.0 89.0 13.5 3.0 2.9 5.0 82.1Self-employed . . . . . . . . . . . . . . . . . . . . . . . 135.0 151.6 15.5 4.3 5.0 10.0 122.7Retired . . . . . . . . . . . . . . . . . . . . . . . . . . . . . . 47.1 100.0 8.6 1.5 6.4 4.5 20.0Other not working . . . . . . . . . . . . . . . . . . . 90.0 * 10.7 1.8 * 8.0 21.9
Current occupation of headManagerial or professional . . . . . . . . . . . 148.0 130.0 16.3 4.5 9.0 7.0 137.6Technical, sales, or services . . . . . . . . . . 100.9 105.0 12.2 3.0 3.5 4.0 65.8Other occupation . . . . . . . . . . . . . . . . . . . . 94.0 60.0 12.0 2.5 4.0 4.8 64.1Retired or other not working . . . . . . . . . 53.0 100.0 9.7 1.5 6.4 5.0 20.0
RegionNortheast . . . . . . . . . . . . . . . . . . . . . . . . . . . 107.0 95.0 12.1 3.0 * 6.5 66.6Midwest . . . . . . . . . . . . . . . . . . . . . . . . . . . . 93.9 82.5 11.0 3.0 5.0 5.0 61.2South . . . . . . . . . . . . . . . . . . . . . . . . . . . . . . . 99.0 80.0 13.2 2.8 3.2 4.5 60.9West . . . . . . . . . . . . . . . . . . . . . . . . . . . . . . . . 150.8 160.0 14.2 3.0 3.8 6.0 95.5
UrbanicityMetropolitan statistical area (MSA) . . . 118.2 101.0 13.3 3.0 3.5 5.0 78.1Non-MSA . . . . . . . . . . . . . . . . . . . . . . . . . . . 60.7 70.0 11.7 2.0 6.0 5.0 29.8
Housing statusOwner . . . . . . . . . . . . . . . . . . . . . . . . . . . . . . 107.0 100.0 14.2 3.6 7.5 5.0 111.1Renter or other . . . . . . . . . . . . . . . . . . . . . . * 80.0 10.3 1.3 1.0 4.9 9.2
Percentile of net worthLess than 25 . . . . . . . . . . . . . . . . . . . . . . . . 107.0 * 11.4 1.5 1.0 5.0 11.925–49.9 . . . . . . . . . . . . . . . . . . . . . . . . . . . . . 85.0 74.0 13.0 2.8 2.0 3.9 64.250–74.9 . . . . . . . . . . . . . . . . . . . . . . . . . . . . . 104.0 72.0 14.0 3.5 4.2 5.0 97.575–89.9 . . . . . . . . . . . . . . . . . . . . . . . . . . . . . 130.0 94.0 12.0 4.0 10.3 5.0 127.090–100 . . . . . . . . . . . . . . . . . . . . . . . . . . . . . 180.0 160.0 17.1 4.5 43.0 15.0 203.0
MEMO
Mean value of holdings forfamilies holding asset . . . . . . . . . . . . . 149.0 177.3 21.0 7.3 24.8 15.5 126.0
NOTE: See note to table 11.* Ten or fewer observations.
Changes in U.S. Family Finances from 2004 to 2007: Evidence from the Survey of Consumer Finances A41
since the 1998 survey (data not shown in the tables).In general, borrowing is less prevalent among child-less single families headed by a person aged 55 orolder and families headed by a person who is retiredor is 75 or older. Families in the lowest income,wealth, and education groups—which tend to havefewer economic resources—are also less likely tohave any debt. Across income groups, borrowingpeaks among families above the median. In contrast,by net worth group, debt ownership peaks amongfamilies below the median, in the second quartile.Families in the highest three income groups, coupleswith children, and families headed by a personemployed in a managerial or professional positionhave comparatively high rates of debt ownership.
Debt ownership did not rise uniformly acrosshouseholds between 2004 and 2007. The fraction offamilies with any debt fell for at least one groupwithin most of the sets of demographic categoriesshown in table 13. By age group, debt ownership rose5.5 percentage points for households in the 55-to-64age group and 6.7 percentage points for those in the65-to-74 age group, but it fell 8.9 percentage pointsfor families in the oldest age category. Similarly,changes within income and wealth groups rangedfrom declines of 2 to 3 percentage points to gains of4 percentage points or more. The percentage offamilies with debt increased just more than 5 percent-age points for nonwhite or Hispanic families as wellas for those headed by a self-employed person,whereas the fraction rose more modestly or declinedamong families in the complementary categories.
The overall median and mean values of outstand-ing debt for families that had any such debt rose about11 percent from 2004 to 2007, a slower rate ofincrease than in the previous three-year period, whenthe median and mean both rose nearly 34 percent.Median debt tends to rise with income, education, andwealth; the median by age peaks among householdsheaded by a person aged 35 to 44. The medianamount of outstanding debt is also higher for couples,homeowners, and families headed by a person whowas self-employed or who was working in a manage-rial or professional position. Over the recent three-year period, the median amount of outstanding debtrose for most demographic subgroups. The largestincreases in the median amount of debt were forfamilies headed by a person who lacked a high schooldiploma (47.7 percent) and families headed by aperson aged 65 to 74 (45.8 percent); other relativelylarge increases in the median included those forfamilies living in the South and for families headedby a person who worked in a technical, sales, or
service job. The median decreased by the greatestproportion for families in the 75-or-more age group,single families with children, and families living inthe Midwest.
Mortgages and Other Borrowing on the PrimaryResidence
The share of families with debt secured by a primaryresidence (hereafter, home-secured debt) continued totrend up, from 47.9 percent in 2004 to 48.7 percent in2007.43 The increase was driven by the rise in thefraction of homeowners with a mortgage, which rose1.5 percentage points, to 70.9 percent in 2007.
Families with higher levels of income, education,and wealth are generally more likely to have mort-gage debt, as are couples and families headed by aperson who is employed in a managerial or profes-sional job or who is self-employed. Across agegroups, the rate of borrowing peaks among families ina middle age group and declines sharply among olderage groups, a pattern also seen in earlier years.44
White non-Hispanic families are more likely to havehome-secured debt than are nonwhite or Hispanicfamilies.45 Between 2004 and 2007, the prevalence ofhome-secured debt tended to increase for familieswith higher levels of income or wealth, and it alsorose for families headed by a person who was self-employed or employed in a technical, sales, or serviceoccupation and for families headed by a person whowas aged 55 to 74; the proportion of families withhome-secured debt declined most for single-parentfamilies, the oldest age group, and families in theother-not-working category. The measure shifted com-paratively little for other demographic groups.
Overall, the median amount of home-secured debtrose 2.6 percent from 2004 to 2007, and the meanrose 9.4 percent; the median had increased 27.4 per-
43. Home-secured debt consists of first-lien and junior-lien mort-gages and home equity lines of credit secured by the primaryresidence. For purposes of this article, first- and junior-lien mortgagesconsist only of closed-end loans—that is, loans typically with aone-time extension of credit, a set frequency of repayments, and arequired repayment size that may be fixed or vary over time inaccordance with a pre-specified agreement or with changes in a givenmarket interest rate. As a type of open-ended credit, home equity linestypically allow credit extensions at the borrower’s discretion subject toa prearranged limit and allow repayments at the borrower’s discretionsubject to a prearranged minimum size and frequency.
44. Of the families that owned a home, the fraction of homeownerswith mortgage debt was highest among families in the youngest agegroup in 2007. For homeowners in the 2004 survey, ownership ofhome-secured debt peaked among families headed by a person aged 35to 44.
45. This pattern reverses, however, when only homeowners areconsidered; for example, in 2007, 68.9 percent of white non-Hispanichomeowners had a mortgage, compared with 77.7 percent of nonwhiteor Hispanic homeowners.
A42 Federal Reserve Bulletin h February 2009
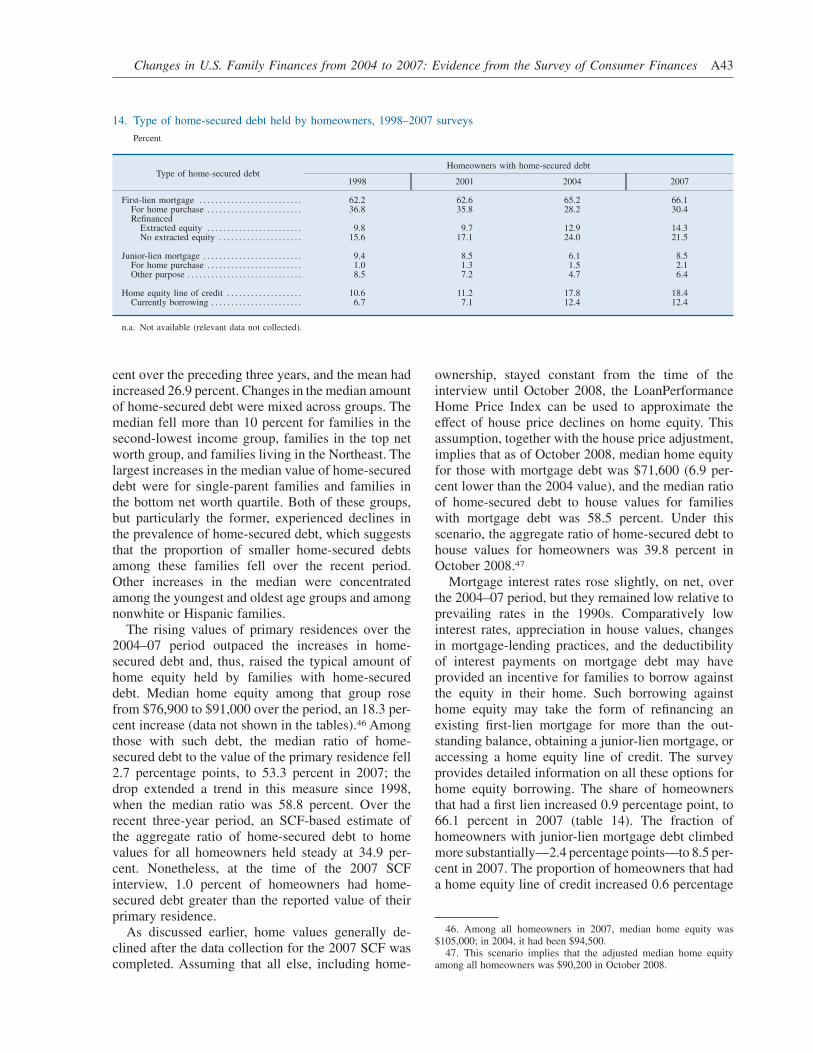
cent over the preceding three years, and the mean hadincreased 26.9 percent. Changes in the median amountof home-secured debt were mixed across groups. Themedian fell more than 10 percent for families in thesecond-lowest income group, families in the top networth group, and families living in the Northeast. Thelargest increases in the median value of home-secureddebt were for single-parent families and families inthe bottom net worth quartile. Both of these groups,but particularly the former, experienced declines inthe prevalence of home-secured debt, which suggeststhat the proportion of smaller home-secured debtsamong these families fell over the recent period.Other increases in the median were concentratedamong the youngest and oldest age groups and amongnonwhite or Hispanic families.
The rising values of primary residences over the2004–07 period outpaced the increases in home-secured debt and, thus, raised the typical amount ofhome equity held by families with home-secureddebt. Median home equity among that group rosefrom $76,900 to $91,000 over the period, an 18.3 per-cent increase (data not shown in the tables).46 Amongthose with such debt, the median ratio of home-secured debt to the value of the primary residence fell2.7 percentage points, to 53.3 percent in 2007; thedrop extended a trend in this measure since 1998,when the median ratio was 58.8 percent. Over therecent three-year period, an SCF-based estimate ofthe aggregate ratio of home-secured debt to homevalues for all homeowners held steady at 34.9 per-cent. Nonetheless, at the time of the 2007 SCFinterview, 1.0 percent of homeowners had home-secured debt greater than the reported value of theirprimary residence.
As discussed earlier, home values generally de-clined after the data collection for the 2007 SCF wascompleted. Assuming that all else, including home-
ownership, stayed constant from the time of theinterview until October 2008, the LoanPerformanceHome Price Index can be used to approximate theeffect of house price declines on home equity. Thisassumption, together with the house price adjustment,implies that as of October 2008, median home equityfor those with mortgage debt was $71,600 (6.9 per-cent lower than the 2004 value), and the median ratioof home-secured debt to house values for familieswith mortgage debt was 58.5 percent. Under thisscenario, the aggregate ratio of home-secured debt tohouse values for homeowners was 39.8 percent inOctober 2008.47
Mortgage interest rates rose slightly, on net, overthe 2004–07 period, but they remained low relative toprevailing rates in the 1990s. Comparatively lowinterest rates, appreciation in house values, changesin mortgage-lending practices, and the deductibilityof interest payments on mortgage debt may haveprovided an incentive for families to borrow againstthe equity in their home. Such borrowing againsthome equity may take the form of refinancing anexisting first-lien mortgage for more than the out-standing balance, obtaining a junior-lien mortgage, oraccessing a home equity line of credit. The surveyprovides detailed information on all these options forhome equity borrowing. The share of homeownersthat had a first lien increased 0.9 percentage point, to66.1 percent in 2007 (table 14). The fraction ofhomeowners with junior-lien mortgage debt climbedmore substantially—2.4 percentage points—to 8.5 per-cent in 2007. The proportion of homeowners that hada home equity line of credit increased 0.6 percentage
46. Among all homeowners in 2007, median home equity was$105,000; in 2004, it had been $94,500.
47. This scenario implies that the adjusted median home equityamong all homeowners was $90,200 in October 2008.
14. Type of home-secured debt held by homeowners, 1998–2007 surveys
Percent
Type of home-secured debtHomeowners with home-secured debt
1998 2001 2004 2007
First-lien mortgage . . . . . . . . . . . . . . . . . . . . . . . . . . 62.2 62.6 65.2 66.1For home purchase . . . . . . . . . . . . . . . . . . . . . . . . 36.8 35.8 28.2 30.4Refinanced
Extracted equity . . . . . . . . . . . . . . . . . . . . . . . . 9.8 9.7 12.9 14.3No extracted equity . . . . . . . . . . . . . . . . . . . . . 15.6 17.1 24.0 21.5
Junior-lien mortgage . . . . . . . . . . . . . . . . . . . . . . . . . 9.4 8.5 6.1 8.5For home purchase . . . . . . . . . . . . . . . . . . . . . . . . 1.0 1.3 1.5 2.1Other purpose . . . . . . . . . . . . . . . . . . . . . . . . . . . . . 8.5 7.2 4.7 6.4
Home equity line of credit . . . . . . . . . . . . . . . . . . . 10.6 11.2 17.8 18.4Currently borrowing . . . . . . . . . . . . . . . . . . . . . . . 6.7 7.1 12.4 12.4
n.a. Not available (relevant data not collected).
Changes in U.S. Family Finances from 2004 to 2007: Evidence from the Survey of Consumer Finances A43
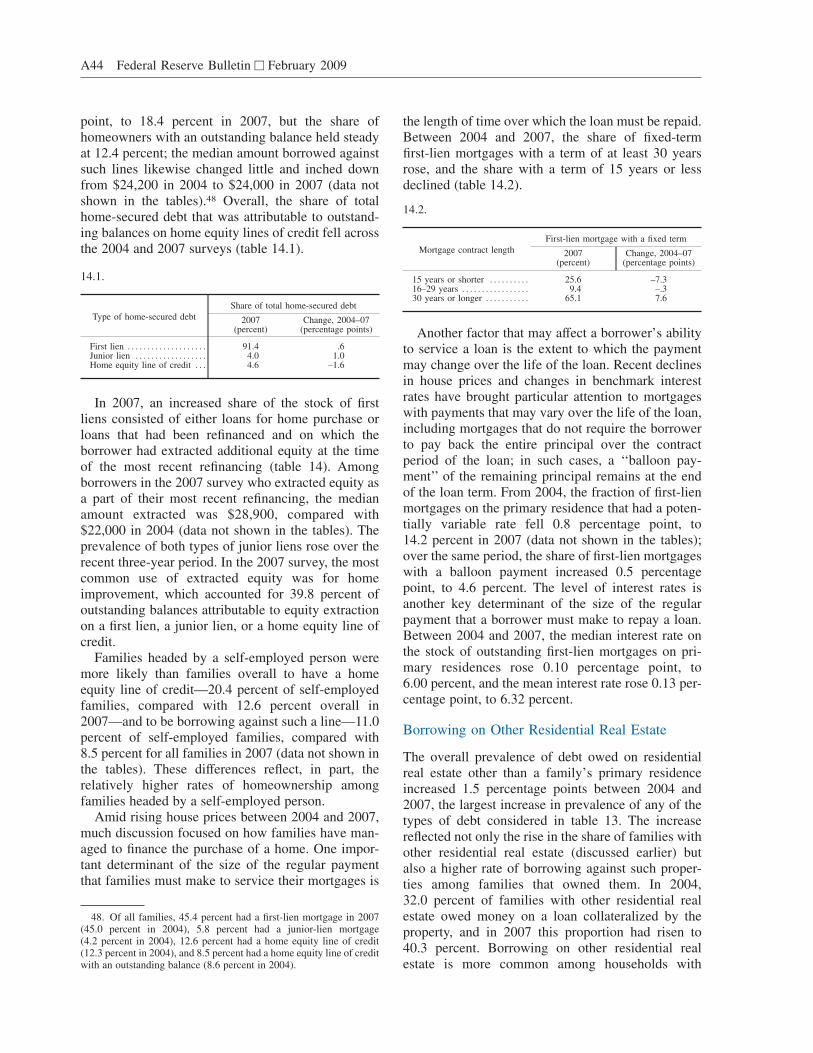
point, to 18.4 percent in 2007, but the share ofhomeowners with an outstanding balance held steadyat 12.4 percent; the median amount borrowed againstsuch lines likewise changed little and inched downfrom $24,200 in 2004 to $24,000 in 2007 (data notshown in the tables).48 Overall, the share of totalhome-secured debt that was attributable to outstand-ing balances on home equity lines of credit fell acrossthe 2004 and 2007 surveys (table 14.1).
In 2007, an increased share of the stock of firstliens consisted of either loans for home purchase orloans that had been refinanced and on which theborrower had extracted additional equity at the timeof the most recent refinancing (table 14). Amongborrowers in the 2007 survey who extracted equity asa part of their most recent refinancing, the medianamount extracted was $28,900, compared with$22,000 in 2004 (data not shown in the tables). Theprevalence of both types of junior liens rose over therecent three-year period. In the 2007 survey, the mostcommon use of extracted equity was for homeimprovement, which accounted for 39.8 percent ofoutstanding balances attributable to equity extractionon a first lien, a junior lien, or a home equity line ofcredit.
Families headed by a self-employed person weremore likely than families overall to have a homeequity line of credit—20.4 percent of self-employedfamilies, compared with 12.6 percent overall in2007—and to be borrowing against such a line—11.0percent of self-employed families, compared with8.5 percent for all families in 2007 (data not shown inthe tables). These differences reflect, in part, therelatively higher rates of homeownership amongfamilies headed by a self-employed person.
Amid rising house prices between 2004 and 2007,much discussion focused on how families have man-aged to finance the purchase of a home. One impor-tant determinant of the size of the regular paymentthat families must make to service their mortgages is
the length of time over which the loan must be repaid.Between 2004 and 2007, the share of fixed-termfirst-lien mortgages with a term of at least 30 yearsrose, and the share with a term of 15 years or lessdeclined (table 14.2).
Another factor that may affect a borrower’s abilityto service a loan is the extent to which the paymentmay change over the life of the loan. Recent declinesin house prices and changes in benchmark interestrates have brought particular attention to mortgageswith payments that may vary over the life of the loan,including mortgages that do not require the borrowerto pay back the entire principal over the contractperiod of the loan; in such cases, a ‘‘balloon pay-ment’’ of the remaining principal remains at the endof the loan term. From 2004, the fraction of first-lienmortgages on the primary residence that had a poten-tially variable rate fell 0.8 percentage point, to14.2 percent in 2007 (data not shown in the tables);over the same period, the share of first-lien mortgageswith a balloon payment increased 0.5 percentagepoint, to 4.6 percent. The level of interest rates isanother key determinant of the size of the regularpayment that a borrower must make to repay a loan.Between 2004 and 2007, the median interest rate onthe stock of outstanding first-lien mortgages on pri-mary residences rose 0.10 percentage point, to6.00 percent, and the mean interest rate rose 0.13 per-centage point, to 6.32 percent.
Borrowing on Other Residential Real Estate
The overall prevalence of debt owed on residentialreal estate other than a family’s primary residenceincreased 1.5 percentage points between 2004 and2007, the largest increase in prevalence of any of thetypes of debt considered in table 13. The increasereflected not only the rise in the share of families withother residential real estate (discussed earlier) butalso a higher rate of borrowing against such proper-ties among families that owned them. In 2004,32.0 percent of families with other residential realestate owed money on a loan collateralized by theproperty, and in 2007 this proportion had risen to40.3 percent. Borrowing on other residential realestate is more common among households with
48. Of all families, 45.4 percent had a first-lien mortgage in 2007(45.0 percent in 2004), 5.8 percent had a junior-lien mortgage(4.2 percent in 2004), 12.6 percent had a home equity line of credit(12.3 percent in 2004), and 8.5 percent had a home equity line of creditwith an outstanding balance (8.6 percent in 2004).
14.1.
Type of home-secured debt
Share of total home-secured debt
2007(percent)
Change, 2004–07(percentage points)
First lien . . . . . . . . . . . . . . . . . . . . 91.4 .6Junior lien . . . . . . . . . . . . . . . . . . 4.0 1.0Home equity line of credit . . . 4.6 –1.6
14.2.
Mortgage contract length
First-lien mortgage with a fixed term
2007(percent)
Change, 2004–07(percentage points)
15 years or shorter . . . . . . . . . . 25.6 –7.316–29 years . . . . . . . . . . . . . . . . . 9.4 –.330 years or longer . . . . . . . . . . . 65.1 7.6
A44 Federal Reserve Bulletin h February 2009
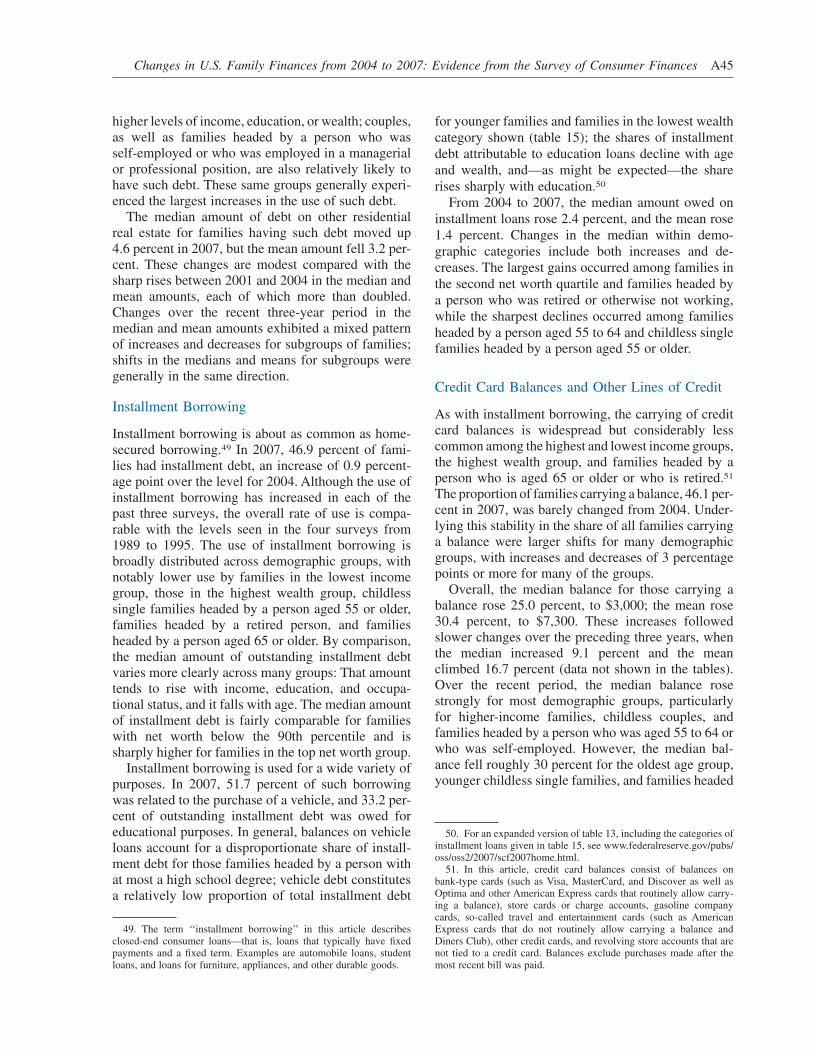
higher levels of income, education, or wealth; couples,as well as families headed by a person who wasself-employed or who was employed in a managerialor professional position, are also relatively likely tohave such debt. These same groups generally experi-enced the largest increases in the use of such debt.
The median amount of debt on other residentialreal estate for families having such debt moved up4.6 percent in 2007, but the mean amount fell 3.2 per-cent. These changes are modest compared with thesharp rises between 2001 and 2004 in the median andmean amounts, each of which more than doubled.Changes over the recent three-year period in themedian and mean amounts exhibited a mixed patternof increases and decreases for subgroups of families;shifts in the medians and means for subgroups weregenerally in the same direction.
Installment Borrowing
Installment borrowing is about as common as home-secured borrowing.49 In 2007, 46.9 percent of fami-lies had installment debt, an increase of 0.9 percent-age point over the level for 2004. Although the use ofinstallment borrowing has increased in each of thepast three surveys, the overall rate of use is compa-rable with the levels seen in the four surveys from1989 to 1995. The use of installment borrowing isbroadly distributed across demographic groups, withnotably lower use by families in the lowest incomegroup, those in the highest wealth group, childlesssingle families headed by a person aged 55 or older,families headed by a retired person, and familiesheaded by a person aged 65 or older. By comparison,the median amount of outstanding installment debtvaries more clearly across many groups: That amounttends to rise with income, education, and occupa-tional status, and it falls with age. The median amountof installment debt is fairly comparable for familieswith net worth below the 90th percentile and issharply higher for families in the top net worth group.
Installment borrowing is used for a wide variety ofpurposes. In 2007, 51.7 percent of such borrowingwas related to the purchase of a vehicle, and 33.2 per-cent of outstanding installment debt was owed foreducational purposes. In general, balances on vehicleloans account for a disproportionate share of install-ment debt for those families headed by a person withat most a high school degree; vehicle debt constitutesa relatively low proportion of total installment debt
for younger families and families in the lowest wealthcategory shown (table 15); the shares of installmentdebt attributable to education loans decline with ageand wealth, and—as might be expected—the sharerises sharply with education.50
From 2004 to 2007, the median amount owed oninstallment loans rose 2.4 percent, and the mean rose1.4 percent. Changes in the median within demo-graphic categories include both increases and de-creases. The largest gains occurred among families inthe second net worth quartile and families headed bya person who was retired or otherwise not working,while the sharpest declines occurred among familiesheaded by a person aged 55 to 64 and childless singlefamilies headed by a person aged 55 or older.
Credit Card Balances and Other Lines of Credit
As with installment borrowing, the carrying of creditcard balances is widespread but considerably lesscommon among the highest and lowest income groups,the highest wealth group, and families headed by aperson who is aged 65 or older or who is retired.51
The proportion of families carrying a balance, 46.1 per-cent in 2007, was barely changed from 2004. Under-lying this stability in the share of all families carryinga balance were larger shifts for many demographicgroups, with increases and decreases of 3 percentagepoints or more for many of the groups.
Overall, the median balance for those carrying abalance rose 25.0 percent, to $3,000; the mean rose30.4 percent, to $7,300. These increases followedslower changes over the preceding three years, whenthe median increased 9.1 percent and the meanclimbed 16.7 percent (data not shown in the tables).Over the recent period, the median balance rosestrongly for most demographic groups, particularlyfor higher-income families, childless couples, andfamilies headed by a person who was aged 55 to 64 orwho was self-employed. However, the median bal-ance fell roughly 30 percent for the oldest age group,younger childless single families, and families headed
49. The term ‘‘installment borrowing’’ in this article describesclosed-end consumer loans—that is, loans that typically have fixedpayments and a fixed term. Examples are automobile loans, studentloans, and loans for furniture, appliances, and other durable goods.
50. For an expanded version of table 13, including the categories ofinstallment loans given in table 15, see www.federalreserve.gov/pubs/oss/oss2/2007/scf2007home.html.
51. In this article, credit card balances consist of balances onbank-type cards (such as Visa, MasterCard, and Discover as well asOptima and other American Express cards that routinely allow carry-ing a balance), store cards or charge accounts, gasoline companycards, so-called travel and entertainment cards (such as AmericanExpress cards that do not routinely allow carrying a balance andDiners Club), other credit cards, and revolving store accounts that arenot tied to a credit card. Balances exclude purchases made after themost recent bill was paid.
Changes in U.S. Family Finances from 2004 to 2007: Evidence from the Survey of Consumer Finances A45
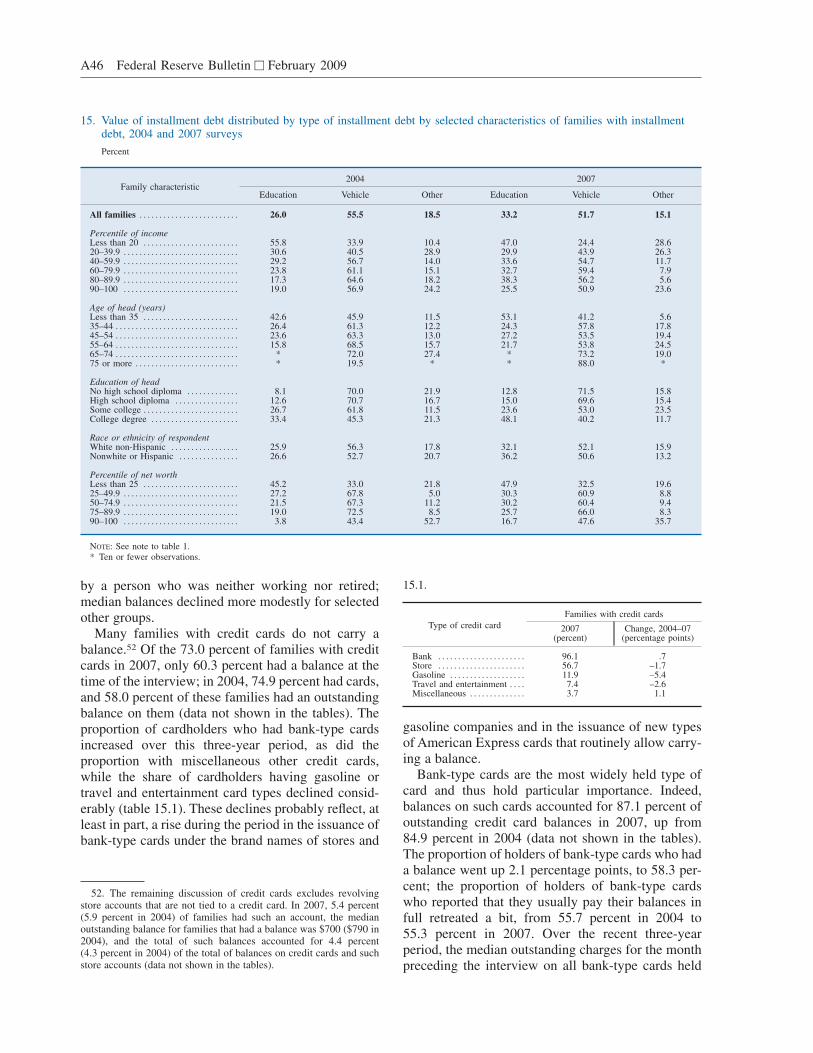
by a person who was neither working nor retired;median balances declined more modestly for selectedother groups.
Many families with credit cards do not carry abalance.52 Of the 73.0 percent of families with creditcards in 2007, only 60.3 percent had a balance at thetime of the interview; in 2004, 74.9 percent had cards,and 58.0 percent of these families had an outstandingbalance on them (data not shown in the tables). Theproportion of cardholders who had bank-type cardsincreased over this three-year period, as did theproportion with miscellaneous other credit cards,while the share of cardholders having gasoline ortravel and entertainment card types declined consid-erably (table 15.1). These declines probably reflect, atleast in part, a rise during the period in the issuance ofbank-type cards under the brand names of stores and
gasoline companies and in the issuance of new typesof American Express cards that routinely allow carry-ing a balance.
Bank-type cards are the most widely held type ofcard and thus hold particular importance. Indeed,balances on such cards accounted for 87.1 percent ofoutstanding credit card balances in 2007, up from84.9 percent in 2004 (data not shown in the tables).The proportion of holders of bank-type cards who hada balance went up 2.1 percentage points, to 58.3 per-cent; the proportion of holders of bank-type cardswho reported that they usually pay their balances infull retreated a bit, from 55.7 percent in 2004 to55.3 percent in 2007. Over the recent three-yearperiod, the median outstanding charges for the monthpreceding the interview on all bank-type cards held
52. The remaining discussion of credit cards excludes revolvingstore accounts that are not tied to a credit card. In 2007, 5.4 percent(5.9 percent in 2004) of families had such an account, the medianoutstanding balance for families that had a balance was $700 ($790 in2004), and the total of such balances accounted for 4.4 percent(4.3 percent in 2004) of the total of balances on credit cards and suchstore accounts (data not shown in the tables).
15.1.
Type of credit card
Families with credit cards
2007(percent)
Change, 2004–07(percentage points)
Bank . . . . . . . . . . . . . . . . . . . . . . 96.1 .7Store . . . . . . . . . . . . . . . . . . . . . . 56.7 –1.7Gasoline . . . . . . . . . . . . . . . . . . . 11.9 –5.4Travel and entertainment . . . . 7.4 –2.6Miscellaneous . . . . . . . . . . . . . . 3.7 1.1
15. Value of installment debt distributed by type of installment debt by selected characteristics of families with installmentdebt, 2004 and 2007 surveys
Percent
Family characteristic2004 2007
Education Vehicle Other Education Vehicle Other
All families . . . . . . . . . . . . . . . . . . . . . . . . . 26.0 55.5 18.5 33.2 51.7 15.1
Percentile of incomeLess than 20 . . . . . . . . . . . . . . . . . . . . . . . . 55.8 33.9 10.4 47.0 24.4 28.620–39.9 . . . . . . . . . . . . . . . . . . . . . . . . . . . . . 30.6 40.5 28.9 29.9 43.9 26.340–59.9 . . . . . . . . . . . . . . . . . . . . . . . . . . . . . 29.2 56.7 14.0 33.6 54.7 11.760–79.9 . . . . . . . . . . . . . . . . . . . . . . . . . . . . . 23.8 61.1 15.1 32.7 59.4 7.980–89.9 . . . . . . . . . . . . . . . . . . . . . . . . . . . . . 17.3 64.6 18.2 38.3 56.2 5.690–100 . . . . . . . . . . . . . . . . . . . . . . . . . . . . . 19.0 56.9 24.2 25.5 50.9 23.6
Age of head (years)Less than 35 . . . . . . . . . . . . . . . . . . . . . . . . 42.6 45.9 11.5 53.1 41.2 5.635–44 . . . . . . . . . . . . . . . . . . . . . . . . . . . . . . . 26.4 61.3 12.2 24.3 57.8 17.845–54 . . . . . . . . . . . . . . . . . . . . . . . . . . . . . . . 23.6 63.3 13.0 27.2 53.5 19.455–64 . . . . . . . . . . . . . . . . . . . . . . . . . . . . . . . 15.8 68.5 15.7 21.7 53.8 24.565–74 . . . . . . . . . . . . . . . . . . . . . . . . . . . . . . . * 72.0 27.4 * 73.2 19.075 or more . . . . . . . . . . . . . . . . . . . . . . . . . . * 19.5 * * 88.0 *
Education of headNo high school diploma . . . . . . . . . . . . . 8.1 70.0 21.9 12.8 71.5 15.8High school diploma . . . . . . . . . . . . . . . . 12.6 70.7 16.7 15.0 69.6 15.4Some college . . . . . . . . . . . . . . . . . . . . . . . . 26.7 61.8 11.5 23.6 53.0 23.5College degree . . . . . . . . . . . . . . . . . . . . . . 33.4 45.3 21.3 48.1 40.2 11.7
Race or ethnicity of respondentWhite non-Hispanic . . . . . . . . . . . . . . . . . 25.9 56.3 17.8 32.1 52.1 15.9Nonwhite or Hispanic . . . . . . . . . . . . . . . 26.6 52.7 20.7 36.2 50.6 13.2
Percentile of net worthLess than 25 . . . . . . . . . . . . . . . . . . . . . . . . 45.2 33.0 21.8 47.9 32.5 19.625–49.9 . . . . . . . . . . . . . . . . . . . . . . . . . . . . . 27.2 67.8 5.0 30.3 60.9 8.850–74.9 . . . . . . . . . . . . . . . . . . . . . . . . . . . . . 21.5 67.3 11.2 30.2 60.4 9.475–89.9 . . . . . . . . . . . . . . . . . . . . . . . . . . . . . 19.0 72.5 8.5 25.7 66.0 8.390–100 . . . . . . . . . . . . . . . . . . . . . . . . . . . . . 3.8 43.4 52.7 16.7 47.6 35.7
NOTE: See note to table 1.* Ten or fewer observations.
A46 Federal Reserve Bulletin h February 2009
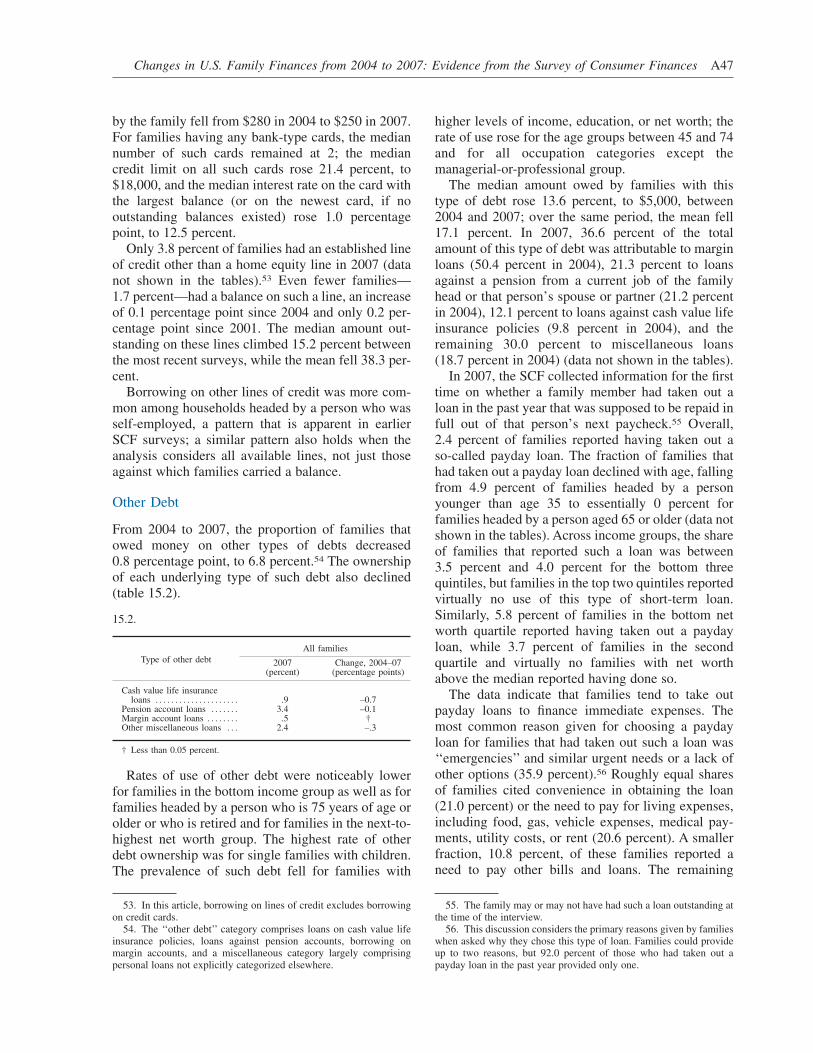
by the family fell from $280 in 2004 to $250 in 2007.For families having any bank-type cards, the mediannumber of such cards remained at 2; the mediancredit limit on all such cards rose 21.4 percent, to$18,000, and the median interest rate on the card withthe largest balance (or on the newest card, if nooutstanding balances existed) rose 1.0 percentagepoint, to 12.5 percent.
Only 3.8 percent of families had an established lineof credit other than a home equity line in 2007 (datanot shown in the tables).53 Even fewer families—1.7 percent—had a balance on such a line, an increaseof 0.1 percentage point since 2004 and only 0.2 per-centage point since 2001. The median amount out-standing on these lines climbed 15.2 percent betweenthe most recent surveys, while the mean fell 38.3 per-cent.
Borrowing on other lines of credit was more com-mon among households headed by a person who wasself-employed, a pattern that is apparent in earlierSCF surveys; a similar pattern also holds when theanalysis considers all available lines, not just thoseagainst which families carried a balance.
Other Debt
From 2004 to 2007, the proportion of families thatowed money on other types of debts decreased0.8 percentage point, to 6.8 percent.54 The ownershipof each underlying type of such debt also declined(table 15.2).
Rates of use of other debt were noticeably lowerfor families in the bottom income group as well as forfamilies headed by a person who is 75 years of age orolder or who is retired and for families in the next-to-highest net worth group. The highest rate of otherdebt ownership was for single families with children.The prevalence of such debt fell for families with
higher levels of income, education, or net worth; therate of use rose for the age groups between 45 and 74and for all occupation categories except themanagerial-or-professional group.
The median amount owed by families with thistype of debt rose 13.6 percent, to $5,000, between2004 and 2007; over the same period, the mean fell17.1 percent. In 2007, 36.6 percent of the totalamount of this type of debt was attributable to marginloans (50.4 percent in 2004), 21.3 percent to loansagainst a pension from a current job of the familyhead or that person’s spouse or partner (21.2 percentin 2004), 12.1 percent to loans against cash value lifeinsurance policies (9.8 percent in 2004), and theremaining 30.0 percent to miscellaneous loans(18.7 percent in 2004) (data not shown in the tables).
In 2007, the SCF collected information for the firsttime on whether a family member had taken out aloan in the past year that was supposed to be repaid infull out of that person’s next paycheck.55 Overall,2.4 percent of families reported having taken out aso-called payday loan. The fraction of families thathad taken out a payday loan declined with age, fallingfrom 4.9 percent of families headed by a personyounger than age 35 to essentially 0 percent forfamilies headed by a person aged 65 or older (data notshown in the tables). Across income groups, the shareof families that reported such a loan was between3.5 percent and 4.0 percent for the bottom threequintiles, but families in the top two quintiles reportedvirtually no use of this type of short-term loan.Similarly, 5.8 percent of families in the bottom networth quartile reported having taken out a paydayloan, while 3.7 percent of families in the secondquartile and virtually no families with net worthabove the median reported having done so.
The data indicate that families tend to take outpayday loans to finance immediate expenses. Themost common reason given for choosing a paydayloan for families that had taken out such a loan was‘‘emergencies’’ and similar urgent needs or a lack ofother options (35.9 percent).56 Roughly equal sharesof families cited convenience in obtaining the loan(21.0 percent) or the need to pay for living expenses,including food, gas, vehicle expenses, medical pay-ments, utility costs, or rent (20.6 percent). A smallerfraction, 10.8 percent, of these families reported aneed to pay other bills and loans. The remaining
53. In this article, borrowing on lines of credit excludes borrowingon credit cards.
54. The ‘‘other debt’’ category comprises loans on cash value lifeinsurance policies, loans against pension accounts, borrowing onmargin accounts, and a miscellaneous category largely comprisingpersonal loans not explicitly categorized elsewhere.
55. The family may or may not have had such a loan outstanding atthe time of the interview.
56. This discussion considers the primary reasons given by familieswhen asked why they chose this type of loan. Families could provideup to two reasons, but 92.0 percent of those who had taken out apayday loan in the past year provided only one.
15.2.
Type of other debt
All families
2007(percent)
Change, 2004–07(percentage points)
Cash value life insuranceloans . . . . . . . . . . . . . . . . . . . . . .9 –0.7
Pension account loans . . . . . . . 3.4 –0.1Margin account loans . . . . . . . . .5 †Other miscellaneous loans . . . 2.4 –.3
† Less than 0.05 percent.
Changes in U.S. Family Finances from 2004 to 2007: Evidence from the Survey of Consumer Finances A47
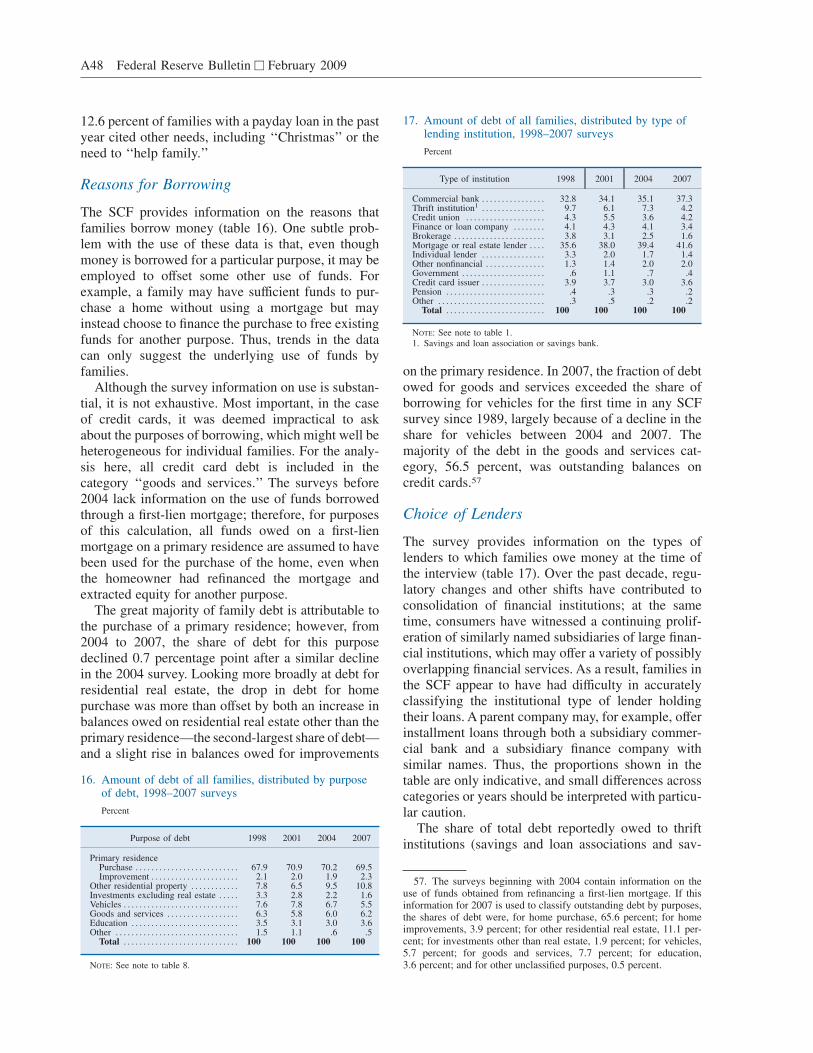
12.6 percent of families with a payday loan in the pastyear cited other needs, including ‘‘Christmas’’ or theneed to ‘‘help family.’’
Reasons for Borrowing
The SCF provides information on the reasons thatfamilies borrow money (table 16). One subtle prob-lem with the use of these data is that, even thoughmoney is borrowed for a particular purpose, it may beemployed to offset some other use of funds. Forexample, a family may have sufficient funds to pur-chase a home without using a mortgage but mayinstead choose to finance the purchase to free existingfunds for another purpose. Thus, trends in the datacan only suggest the underlying use of funds byfamilies.
Although the survey information on use is substan-tial, it is not exhaustive. Most important, in the caseof credit cards, it was deemed impractical to askabout the purposes of borrowing, which might well beheterogeneous for individual families. For the analy-sis here, all credit card debt is included in thecategory ‘‘goods and services.’’ The surveys before2004 lack information on the use of funds borrowedthrough a first-lien mortgage; therefore, for purposesof this calculation, all funds owed on a first-lienmortgage on a primary residence are assumed to havebeen used for the purchase of the home, even whenthe homeowner had refinanced the mortgage andextracted equity for another purpose.
The great majority of family debt is attributable tothe purchase of a primary residence; however, from2004 to 2007, the share of debt for this purposedeclined 0.7 percentage point after a similar declinein the 2004 survey. Looking more broadly at debt forresidential real estate, the drop in debt for homepurchase was more than offset by both an increase inbalances owed on residential real estate other than theprimary residence—the second-largest share of debt—and a slight rise in balances owed for improvements
on the primary residence. In 2007, the fraction of debtowed for goods and services exceeded the share ofborrowing for vehicles for the first time in any SCFsurvey since 1989, largely because of a decline in theshare for vehicles between 2004 and 2007. Themajority of the debt in the goods and services cat-egory, 56.5 percent, was outstanding balances oncredit cards.57
Choice of Lenders
The survey provides information on the types oflenders to which families owe money at the time ofthe interview (table 17). Over the past decade, regu-latory changes and other shifts have contributed toconsolidation of financial institutions; at the sametime, consumers have witnessed a continuing prolif-eration of similarly named subsidiaries of large finan-cial institutions, which may offer a variety of possiblyoverlapping financial services. As a result, families inthe SCF appear to have had difficulty in accuratelyclassifying the institutional type of lender holdingtheir loans. A parent company may, for example, offerinstallment loans through both a subsidiary commer-cial bank and a subsidiary finance company withsimilar names. Thus, the proportions shown in thetable are only indicative, and small differences acrosscategories or years should be interpreted with particu-lar caution.
The share of total debt reportedly owed to thriftinstitutions (savings and loan associations and sav-
57. The surveys beginning with 2004 contain information on theuse of funds obtained from refinancing a first-lien mortgage. If thisinformation for 2007 is used to classify outstanding debt by purposes,the shares of debt were, for home purchase, 65.6 percent; for homeimprovements, 3.9 percent; for other residential real estate, 11.1 per-cent; for investments other than real estate, 1.9 percent; for vehicles,5.7 percent; for goods and services, 7.7 percent; for education,3.6 percent; and for other unclassified purposes, 0.5 percent.
16. Amount of debt of all families, distributed by purposeof debt, 1998–2007 surveys
Percent
Purpose of debt 1998 2001 2004 2007
Primary residencePurchase . . . . . . . . . . . . . . . . . . . . . . . . . . 67.9 70.9 70.2 69.5Improvement . . . . . . . . . . . . . . . . . . . . . . 2.1 2.0 1.9 2.3
Other residential property . . . . . . . . . . . . 7.8 6.5 9.5 10.8Investments excluding real estate . . . . . 3.3 2.8 2.2 1.6Vehicles . . . . . . . . . . . . . . . . . . . . . . . . . . . . . 7.6 7.8 6.7 5.5Goods and services . . . . . . . . . . . . . . . . . . 6.3 5.8 6.0 6.2Education . . . . . . . . . . . . . . . . . . . . . . . . . . . 3.5 3.1 3.0 3.6Other . . . . . . . . . . . . . . . . . . . . . . . . . . . . . . . 1.5 1.1 .6 .5
Total . . . . . . . . . . . . . . . . . . . . . . . . . . . . . 100 100 100 100
NOTE: See note to table 8.
17. Amount of debt of all families, distributed by type oflending institution, 1998–2007 surveys
Percent
Type of institution 1998 2001 2004 2007
Commercial bank . . . . . . . . . . . . . . . . 32.8 34.1 35.1 37.3Thrift institution1 . . . . . . . . . . . . . . . . 9.7 6.1 7.3 4.2Credit union . . . . . . . . . . . . . . . . . . . . 4.3 5.5 3.6 4.2Finance or loan company . . . . . . . . 4.1 4.3 4.1 3.4Brokerage . . . . . . . . . . . . . . . . . . . . . . . 3.8 3.1 2.5 1.6Mortgage or real estate lender . . . . 35.6 38.0 39.4 41.6Individual lender . . . . . . . . . . . . . . . . 3.3 2.0 1.7 1.4Other nonfinancial . . . . . . . . . . . . . . . 1.3 1.4 2.0 2.0Government . . . . . . . . . . . . . . . . . . . . . .6 1.1 .7 .4Credit card issuer . . . . . . . . . . . . . . . . 3.9 3.7 3.0 3.6Pension . . . . . . . . . . . . . . . . . . . . . . . . . .4 .3 .3 .2Other . . . . . . . . . . . . . . . . . . . . . . . . . . . .3 .5 .2 .2
Total . . . . . . . . . . . . . . . . . . . . . . . . . 100 100 100 100
NOTE: See note to table 1.1. Savings and loan association or savings bank.
A48 Federal Reserve Bulletin h February 2009
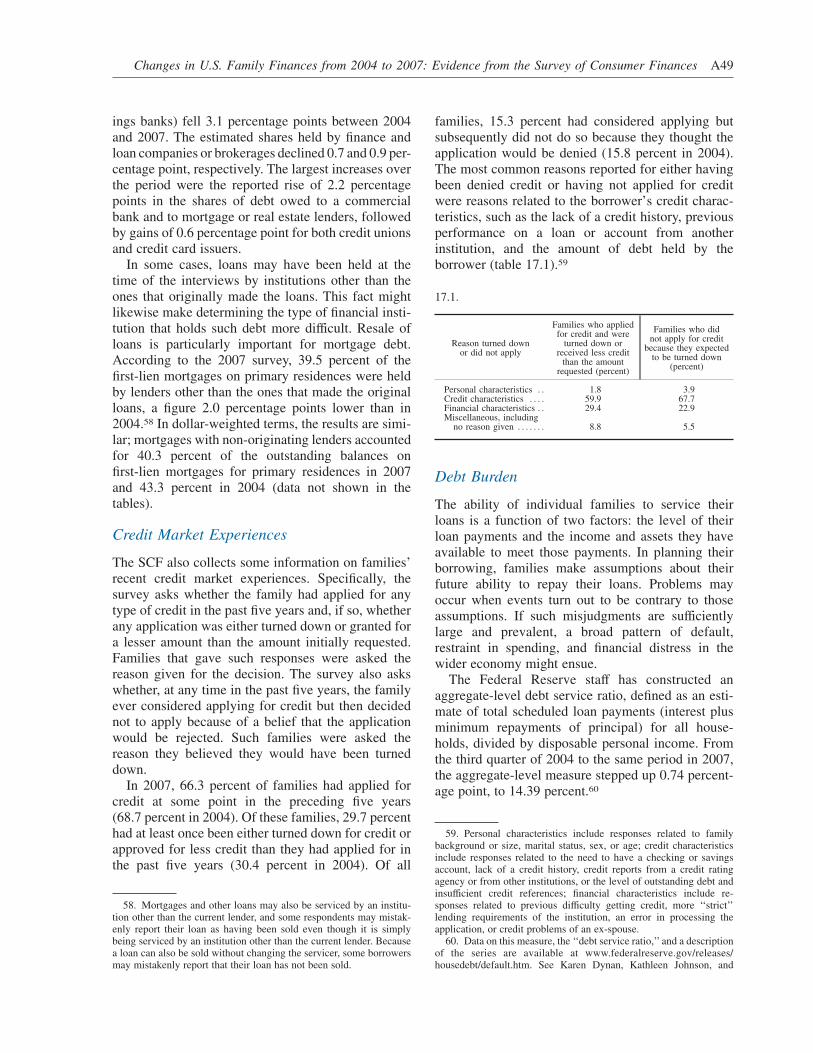
ings banks) fell 3.1 percentage points between 2004and 2007. The estimated shares held by finance andloan companies or brokerages declined 0.7 and 0.9 per-centage point, respectively. The largest increases overthe period were the reported rise of 2.2 percentagepoints in the shares of debt owed to a commercialbank and to mortgage or real estate lenders, followedby gains of 0.6 percentage point for both credit unionsand credit card issuers.
In some cases, loans may have been held at thetime of the interviews by institutions other than theones that originally made the loans. This fact mightlikewise make determining the type of financial insti-tution that holds such debt more difficult. Resale ofloans is particularly important for mortgage debt.According to the 2007 survey, 39.5 percent of thefirst-lien mortgages on primary residences were heldby lenders other than the ones that made the originalloans, a figure 2.0 percentage points lower than in2004.58 In dollar-weighted terms, the results are simi-lar; mortgages with non-originating lenders accountedfor 40.3 percent of the outstanding balances onfirst-lien mortgages for primary residences in 2007and 43.3 percent in 2004 (data not shown in thetables).
Credit Market Experiences
The SCF also collects some information on families’recent credit market experiences. Specifically, thesurvey asks whether the family had applied for anytype of credit in the past five years and, if so, whetherany application was either turned down or granted fora lesser amount than the amount initially requested.Families that gave such responses were asked thereason given for the decision. The survey also askswhether, at any time in the past five years, the familyever considered applying for credit but then decidednot to apply because of a belief that the applicationwould be rejected. Such families were asked thereason they believed they would have been turneddown.
In 2007, 66.3 percent of families had applied forcredit at some point in the preceding five years(68.7 percent in 2004). Of these families, 29.7 percenthad at least once been either turned down for credit orapproved for less credit than they had applied for inthe past five years (30.4 percent in 2004). Of all
families, 15.3 percent had considered applying butsubsequently did not do so because they thought theapplication would be denied (15.8 percent in 2004).The most common reasons reported for either havingbeen denied credit or having not applied for creditwere reasons related to the borrower’s credit charac-teristics, such as the lack of a credit history, previousperformance on a loan or account from anotherinstitution, and the amount of debt held by theborrower (table 17.1).59
Debt Burden
The ability of individual families to service theirloans is a function of two factors: the level of theirloan payments and the income and assets they haveavailable to meet those payments. In planning theirborrowing, families make assumptions about theirfuture ability to repay their loans. Problems mayoccur when events turn out to be contrary to thoseassumptions. If such misjudgments are sufficientlylarge and prevalent, a broad pattern of default,restraint in spending, and financial distress in thewider economy might ensue.
The Federal Reserve staff has constructed anaggregate-level debt service ratio, defined as an esti-mate of total scheduled loan payments (interest plusminimum repayments of principal) for all house-holds, divided by disposable personal income. Fromthe third quarter of 2004 to the same period in 2007,the aggregate-level measure stepped up 0.74 percent-age point, to 14.39 percent.60
58. Mortgages and other loans may also be serviced by an institu-tion other than the current lender, and some respondents may mistak-enly report their loan as having been sold even though it is simplybeing serviced by an institution other than the current lender. Becausea loan can also be sold without changing the servicer, some borrowersmay mistakenly report that their loan has not been sold.
59. Personal characteristics include responses related to familybackground or size, marital status, sex, or age; credit characteristicsinclude responses related to the need to have a checking or savingsaccount, lack of a credit history, credit reports from a credit ratingagency or from other institutions, or the level of outstanding debt andinsufficient credit references; financial characteristics include re-sponses related to previous difficulty getting credit, more ‘‘strict’’lending requirements of the institution, an error in processing theapplication, or credit problems of an ex-spouse.
60. Data on this measure, the ‘‘debt service ratio,’’ and a descriptionof the series are available at www.federalreserve.gov/releases/housedebt/default.htm. See Karen Dynan, Kathleen Johnson, and
17.1.
Reason turned downor did not apply
Families who appliedfor credit and were
turned down orreceived less credit
than the amountrequested (percent)
Families who didnot apply for credit
because they expectedto be turned down
(percent)
Personal characteristics . . 1.8 3.9Credit characteristics . . . . 59.9 67.7Financial characteristics . . 29.4 22.9Miscellaneous, including
no reason given . . . . . . . 8.8 5.5
Changes in U.S. Family Finances from 2004 to 2007: Evidence from the Survey of Consumer Finances A49
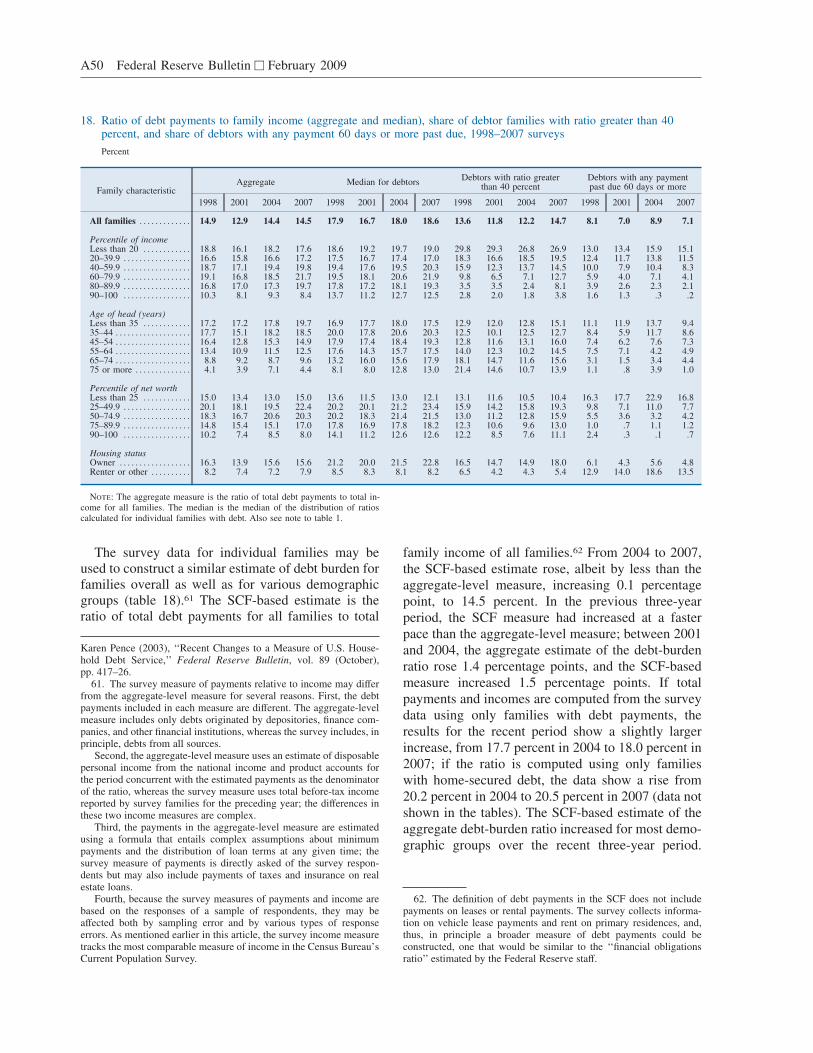
The survey data for individual families may beused to construct a similar estimate of debt burden forfamilies overall as well as for various demographicgroups (table 18).61 The SCF-based estimate is theratio of total debt payments for all families to total
family income of all families.62 From 2004 to 2007,the SCF-based estimate rose, albeit by less than theaggregate-level measure, increasing 0.1 percentagepoint, to 14.5 percent. In the previous three-yearperiod, the SCF measure had increased at a fasterpace than the aggregate-level measure; between 2001and 2004, the aggregate estimate of the debt-burdenratio rose 1.4 percentage points, and the SCF-basedmeasure increased 1.5 percentage points. If totalpayments and incomes are computed from the surveydata using only families with debt payments, theresults for the recent period show a slightly largerincrease, from 17.7 percent in 2004 to 18.0 percent in2007; if the ratio is computed using only familieswith home-secured debt, the data show a rise from20.2 percent in 2004 to 20.5 percent in 2007 (data notshown in the tables). The SCF-based estimate of theaggregate debt-burden ratio increased for most demo-graphic groups over the recent three-year period.
Karen Pence (2003), ‘‘Recent Changes to a Measure of U.S. House-hold Debt Service,’’ Federal Reserve Bulletin, vol. 89 (October),pp. 417–26.
61. The survey measure of payments relative to income may differfrom the aggregate-level measure for several reasons. First, the debtpayments included in each measure are different. The aggregate-levelmeasure includes only debts originated by depositories, finance com-panies, and other financial institutions, whereas the survey includes, inprinciple, debts from all sources.
Second, the aggregate-level measure uses an estimate of disposablepersonal income from the national income and product accounts forthe period concurrent with the estimated payments as the denominatorof the ratio, whereas the survey measure uses total before-tax incomereported by survey families for the preceding year; the differences inthese two income measures are complex.
Third, the payments in the aggregate-level measure are estimatedusing a formula that entails complex assumptions about minimumpayments and the distribution of loan terms at any given time; thesurvey measure of payments is directly asked of the survey respon-dents but may also include payments of taxes and insurance on realestate loans.
Fourth, because the survey measures of payments and income arebased on the responses of a sample of respondents, they may beaffected both by sampling error and by various types of responseerrors. As mentioned earlier in this article, the survey income measuretracks the most comparable measure of income in the Census Bureau’sCurrent Population Survey.
62. The definition of debt payments in the SCF does not includepayments on leases or rental payments. The survey collects informa-tion on vehicle lease payments and rent on primary residences, and,thus, in principle a broader measure of debt payments could beconstructed, one that would be similar to the ‘‘financial obligationsratio’’ estimated by the Federal Reserve staff.
18. Ratio of debt payments to family income (aggregate and median), share of debtor families with ratio greater than 40percent, and share of debtors with any payment 60 days or more past due, 1998–2007 surveys
Percent
Family characteristicAggregate Median for debtors
Debtors with ratio greaterthan 40 percent
Debtors with any paymentpast due 60 days or more
1998 2001 2004 2007 1998 2001 2004 2007 1998 2001 2004 2007 1998 2001 2004 2007
All families . . . . . . . . . . . . . 14.9 12.9 14.4 14.5 17.9 16.7 18.0 18.6 13.6 11.8 12.2 14.7 8.1 7.0 8.9 7.1
Percentile of incomeLess than 20 . . . . . . . . . . . . 18.8 16.1 18.2 17.6 18.6 19.2 19.7 19.0 29.8 29.3 26.8 26.9 13.0 13.4 15.9 15.120–39.9 . . . . . . . . . . . . . . . . . 16.6 15.8 16.6 17.2 17.5 16.7 17.4 17.0 18.3 16.6 18.5 19.5 12.4 11.7 13.8 11.540–59.9 . . . . . . . . . . . . . . . . . 18.7 17.1 19.4 19.8 19.4 17.6 19.5 20.3 15.9 12.3 13.7 14.5 10.0 7.9 10.4 8.360–79.9 . . . . . . . . . . . . . . . . . 19.1 16.8 18.5 21.7 19.5 18.1 20.6 21.9 9.8 6.5 7.1 12.7 5.9 4.0 7.1 4.180–89.9 . . . . . . . . . . . . . . . . . 16.8 17.0 17.3 19.7 17.8 17.2 18.1 19.3 3.5 3.5 2.4 8.1 3.9 2.6 2.3 2.190–100 . . . . . . . . . . . . . . . . . 10.3 8.1 9.3 8.4 13.7 11.2 12.7 12.5 2.8 2.0 1.8 3.8 1.6 1.3 .3 .2
Age of head (years)Less than 35 . . . . . . . . . . . . 17.2 17.2 17.8 19.7 16.9 17.7 18.0 17.5 12.9 12.0 12.8 15.1 11.1 11.9 13.7 9.435–44 . . . . . . . . . . . . . . . . . . . 17.7 15.1 18.2 18.5 20.0 17.8 20.6 20.3 12.5 10.1 12.5 12.7 8.4 5.9 11.7 8.645–54 . . . . . . . . . . . . . . . . . . . 16.4 12.8 15.3 14.9 17.9 17.4 18.4 19.3 12.8 11.6 13.1 16.0 7.4 6.2 7.6 7.355–64 . . . . . . . . . . . . . . . . . . . 13.4 10.9 11.5 12.5 17.6 14.3 15.7 17.5 14.0 12.3 10.2 14.5 7.5 7.1 4.2 4.965–74 . . . . . . . . . . . . . . . . . . . 8.8 9.2 8.7 9.6 13.2 16.0 15.6 17.9 18.1 14.7 11.6 15.6 3.1 1.5 3.4 4.475 or more . . . . . . . . . . . . . . 4.1 3.9 7.1 4.4 8.1 8.0 12.8 13.0 21.4 14.6 10.7 13.9 1.1 .8 3.9 1.0
Percentile of net worthLess than 25 . . . . . . . . . . . . 15.0 13.4 13.0 15.0 13.6 11.5 13.0 12.1 13.1 11.6 10.5 10.4 16.3 17.7 22.9 16.825–49.9 . . . . . . . . . . . . . . . . . 20.1 18.1 19.5 22.4 20.2 20.1 21.2 23.4 15.9 14.2 15.8 19.3 9.8 7.1 11.0 7.750–74.9 . . . . . . . . . . . . . . . . . 18.3 16.7 20.6 20.3 20.2 18.3 21.4 21.5 13.0 11.2 12.8 15.9 5.5 3.6 3.2 4.275–89.9 . . . . . . . . . . . . . . . . . 14.8 15.4 15.1 17.0 17.8 16.9 17.8 18.2 12.3 10.6 9.6 13.0 1.0 .7 1.1 1.290–100 . . . . . . . . . . . . . . . . . 10.2 7.4 8.5 8.0 14.1 11.2 12.6 12.6 12.2 8.5 7.6 11.1 2.4 .3 .1 .7
Housing statusOwner . . . . . . . . . . . . . . . . . . 16.3 13.9 15.6 15.6 21.2 20.0 21.5 22.8 16.5 14.7 14.9 18.0 6.1 4.3 5.6 4.8Renter or other . . . . . . . . . . 8.2 7.4 7.2 7.9 8.5 8.3 8.1 8.2 6.5 4.2 4.3 5.4 12.9 14.0 18.6 13.5
Note: The aggregate measure is the ratio of total debt payments to total in-come for all families. The median is the median of the distribution of ratioscalculated for individual families with debt. Also see note to table 1.
A50 Federal Reserve Bulletin h February 2009
The ability to look at the distribution of paymentsrelative to income at the level of families potentiallyoffers insights that are not available from any of theaggregate-level figures. In particular, the survey al-lows a detailed look at the spectrum of paymentsrelative to income across all families with debts. Overthe recent period, the median of the ratios for indi-vidual families that had any debt rose 0.6 percentagepoint, to 18.6 percent in 2007, a gain that extends aseries of increases in this measure since 1989 thatwere interrupted only by a decline between 1998 and2001. The median ratio of debt payments to incomealso rose at least slightly in the recent period for mostdemographic groups shown; the median fell for fami-lies with wealth in the lowest quartile, for familieswith income in the two lowest quintiles or the highestdecile, and for families headed by a person youngerthan 45.63
A limitation of the median ratio is that it may notbe indicative of distress because it reflects the situa-tion of only a typical family. Unless errors of judg-ment by both families and lenders are pervasive, onewould not expect to see signs of financial distress atthe median. Thus, a more compelling indicator ofdistress is the proportion of families with unusuallylarge total payments relative to their incomes. From2004 to 2007, the proportion of debtors with pay-ments exceeding 40 percent of their incomes rose2.5 percentage points, to 14.7 percent; in the preced-ing three years, the proportion had increased 0.4 per-centage point. The increase was shared by all demo-graphic groups except families in the bottom networth group, for which the share edged back 0.1 per-centage point, to 10.4 percent; in contrast, this frac-tion increased between 3.0 and 3.5 percentage pointsfor each of the other net worth groups. Comparedwith the increases for lower income groups, the shareof families with income between the 60th and 90thpercentiles who had a relatively high ratio of debtpayment to income rose especially sharply.64
Fluctuations in a family’s income away from itsusual level can have substantial effect on the family’spayment-to-income ratio. If the ratio is defined interms of families’ reported usual incomes, the frac-tion of families with a ratio exceeding 40 percent fallsto 13.6 percent. This 1.1 percentage point differencereflects two facts: (1) 2.5 percent of families with debt
had relatively high payment-to-income ratios basedon the previous year’s income but would not have ifincome had been at its usual level, and (2) 1.4 percentof families with debt had debt payments less than orequal to 40 percent of last year’s income but wouldhave had a ratio above 40 percent if income had beenat its usual level. Families may draw on assets as wellas income to meet debt payments. For all familieswith debt, 57.7 percent had transaction account bal-ances equal to at least three months of debt payments.For families with payment-to-income ratios above40 percent, however, this share falls to 25.9 percent.
Other commonly used indicators of debt-repaymentproblems are aggregate delinquency rates—that is,the percentage of delinquent accounts or the percent-age of total balances on which payments are late.Both account-based and dollar-weighted aggregatemeasures indicate that delinquencies on mortgagesrose, on net, from the third quarter of 2004 to the thirdquarter of 2007, but they began to rise more sharplythereafter. Over the 2004–07 period, the percentageof delinquent automobile loans declined, while acorresponding dollar-weighted measure rose; the frac-tion of delinquent loans leveled off in 2008, while thedollar-weighted measure continued to rise. On net, adollar-weighted delinquency measure for other closed-end loans was unchanged from the third quarter of2004 to the third quarter of 2007, while the percent-age of delinquent loans rose; over the following year,both measures rose. Delinquency measures for creditcards also differed by whether the measure was basedon dollar volume or delinquent accounts, but allpointed to comparatively small changes between thethird quarter of 2004 and the third quarter of 2007;over the following four quarters, all of these measuresshowed clear increases.65
A related measure is collected in the SCF. Familiesthat have any debt at the time of their interview areasked whether they have been behind in any of theirloan payments in the preceding year. This measurediffers conceptually from the aggregate delinquencyrates in that the survey counts multiple occasions oflate payments as one, counts families instead ofbalances or accounts, and includes all types of loans;because it counts individual families, not their bal-ances, it is closer in spirit to aggregate measuresbased on the numbers of delinquent accounts than tothose based on the amounts of delinquent balances.The survey shows a decrease from 8.9 percent in2004 to 7.1 percent in 2007 in the proportion of
63. The median of the ratio for families with home-secured debt in2007 was 25.1 percent, up from 24.2 percent in 2001 (data not shownin the tables).
64. Of families with home-secured debt, the proportion that hadtotal payments of more than 40 percent of their income was 20.1 per-cent in 2007, a level 3.0 percentage points higher than that in 2004(data not shown in the tables).
65. The most commonly used such measures are from the Consoli-dated Reports of Condition and Income (Call Report), the AmericanBankers Association, and Moody’s Investors Service.
Changes in U.S. Family Finances from 2004 to 2007: Evidence from the Survey of Consumer Finances A51
debtors who were 60 or more days late with theirpayments on any of their loans in the preceding year.This measure fell for families in each of the incomegroups but particularly for families in the middle60 percent of the income distribution; the percentagedeclined for families with net worth below themedian, and it rose for families with higher levels ofnet worth.66 The share of families with debt who wereat least 60 days late on a payment during the preced-ing year rose for families headed by a person aged 55to 74 and fell for both homeowners and, more sub-stantially, renters. For families with a payment-to-income ratio of 40 percent or more, 13.9 percentmissed a debt payment by 60 days or more; bycomparison, 6.0 percent of debtor families with lowerratios had fallen behind in debt repayment.
SUMMARY
Data from the 2004 and 2007 SCF show that medianincome barely changed, while mean income rosesubstantially, an indication that income gains weremuch greater for families in the uppermost part of thedistribution. Although overall both median and meannet worth increased strongly over this period—17.7percent and 13.0 percent, respectively—these mea-sures declined for families at the bottom of the wealthdistribution. The preceding three years had seen onlysmall changes in median and mean income and inmedian net worth but a sizable gain in mean networth.
Although the median and mean of families’ hold-ings of financial assets increased overall from 2004 to2007, financial assets declined as a share of totalassets, continuing an earlier trend. The offsettingexpansion in the share of nonfinancial assets wasmost strongly driven by greater holdings of privatebusiness equity and, to a lesser degree, of residentialreal estate other than a primary residence. The home-ownership rate, which had risen noticeably betweenthe 2001 and 2004 surveys, turned down slightly.Unrealized capital gains were an important part of theincrease in assets; in 2007, 35.8 percent of total assetswas attributable to unrealized capital gains, and thosegains were most concentrated in holdings of realestate and private business equity. In 2004, unrealizedgains accounted for 30.7 percent of assets.
Debt and assets rose in about equal proportionsover the recent three-year period. Thus, overallindebtedness as a share of assets was little changed.
Home-secured debt fell slightly as a share of totalfamily debt, but in 2007 it remained by far the largestcomponent of family debt. The share of borrowing forresidential real estate other than the primary residenceincreased appreciably. The percentage of familiesusing credit cards for borrowing changed only slightlyover the period, but the median balance on theiraccounts rose 25.0 percent, and the mean rose 30.4 per-cent.
Despite a moderate rise in typical consumer loaninterest rates from 2004 to 2007, the median ratio ofloan payments to family income for debtors, a com-mon indicator of debt burden, at 18.6 percent, barelyrose over the period; in the previous three years, thismeasure had risen more steeply. But data from therecent three-year period show an increase of 2.5 per-centage points in the proportion of debtors with loanpayments exceeding 40 percent of their income, alevel traditionally considered to be high; the share offamilies with payment ratios this high was 14.7 per-cent in 2007.
APPENDIX:SURVEY PROCEDURES AND STATISTICAL
MEASURES
Detailed documentation of the SCF methodology isavailable elsewhere.67 The 2007 data used here arederived from the final internal version of the surveyinformation. Data from this survey, suitably altered toprotect the privacy of respondents, along with addi-tional tabulations of data from the surveys beginningwith 1989, are expected to be available in February2009 on the Federal Reserve’s website at www.federalreserve.gov/pubs/oss/oss2/2007/scf2007data.html. Links to the data used in this article for earlierperiods are available on that site. Results reported inthis article for earlier surveys may differ from theresults reported in earlier articles because of addi-tional statistical processing, correction of data errors,revisions to the survey weights, conceptual changesin the definitions of variables used in the articles, andadjustments for inflation.
As a part of the general reconciliations required forthis article, the survey data were compared with manyexternal estimates, a few of which are mentioned in
66. For families with home-secured debt, the result is very similarto that for homeowners overall. The proportion with payments late 60days or more in 2007 was 4.8 percent after rising to an estimated5.7 percent in 2004 (data not shown in the tables).
67. See Arthur B. Kennickell (2000), ‘‘Wealth Measurement in theSurvey of Consumer Finances: Methodology and Directions for FutureResearch’’ (Washington: Board of Governors of the Federal ReserveSystem, May); Arthur B. Kennickell (2001), ‘‘Modeling Wealth withMultiple Observations of Income: Redesign of the Sample for the2001 Survey of Consumer Finances’’ (Washington: Board of Gover-nors of the Federal Reserve System, October), www.federalreserve.gov/pubs/oss/oss2/method.html; and references cited in these papers.
A52 Federal Reserve Bulletin h February 2009
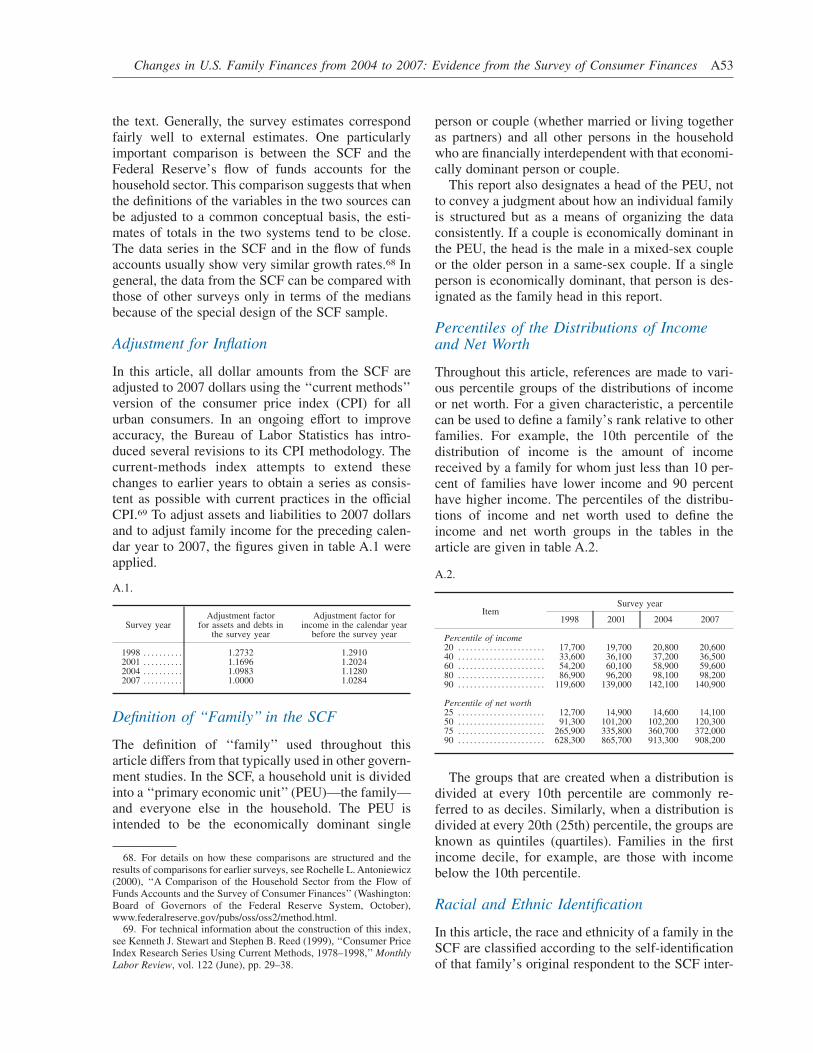
the text. Generally, the survey estimates correspondfairly well to external estimates. One particularlyimportant comparison is between the SCF and theFederal Reserve’s flow of funds accounts for thehousehold sector. This comparison suggests that whenthe definitions of the variables in the two sources canbe adjusted to a common conceptual basis, the esti-mates of totals in the two systems tend to be close.The data series in the SCF and in the flow of fundsaccounts usually show very similar growth rates.68 Ingeneral, the data from the SCF can be compared withthose of other surveys only in terms of the mediansbecause of the special design of the SCF sample.
Adjustment for Inflation
In this article, all dollar amounts from the SCF areadjusted to 2007 dollars using the ‘‘current methods’’version of the consumer price index (CPI) for allurban consumers. In an ongoing effort to improveaccuracy, the Bureau of Labor Statistics has intro-duced several revisions to its CPI methodology. Thecurrent-methods index attempts to extend thesechanges to earlier years to obtain a series as consis-tent as possible with current practices in the officialCPI.69 To adjust assets and liabilities to 2007 dollarsand to adjust family income for the preceding calen-dar year to 2007, the figures given in table A.1 wereapplied.
Definition of ‘‘Family’’ in the SCF
The definition of ‘‘family’’ used throughout thisarticle differs from that typically used in other govern-ment studies. In the SCF, a household unit is dividedinto a ‘‘primary economic unit’’ (PEU)—the family—and everyone else in the household. The PEU isintended to be the economically dominant single
person or couple (whether married or living togetheras partners) and all other persons in the householdwho are financially interdependent with that economi-cally dominant person or couple.
This report also designates a head of the PEU, notto convey a judgment about how an individual familyis structured but as a means of organizing the dataconsistently. If a couple is economically dominant inthe PEU, the head is the male in a mixed-sex coupleor the older person in a same-sex couple. If a singleperson is economically dominant, that person is des-ignated as the family head in this report.
Percentiles of the Distributions of Incomeand Net Worth
Throughout this article, references are made to vari-ous percentile groups of the distributions of incomeor net worth. For a given characteristic, a percentilecan be used to define a family’s rank relative to otherfamilies. For example, the 10th percentile of thedistribution of income is the amount of incomereceived by a family for whom just less than 10 per-cent of families have lower income and 90 percenthave higher income. The percentiles of the distribu-tions of income and net worth used to define theincome and net worth groups in the tables in thearticle are given in table A.2.
The groups that are created when a distribution isdivided at every 10th percentile are commonly re-ferred to as deciles. Similarly, when a distribution isdivided at every 20th (25th) percentile, the groups areknown as quintiles (quartiles). Families in the firstincome decile, for example, are those with incomebelow the 10th percentile.
Racial and Ethnic Identification
In this article, the race and ethnicity of a family in theSCF are classified according to the self-identificationof that family’s original respondent to the SCF inter-
68. For details on how these comparisons are structured and theresults of comparisons for earlier surveys, see Rochelle L. Antoniewicz(2000), ‘‘A Comparison of the Household Sector from the Flow ofFunds Accounts and the Survey of Consumer Finances’’ (Washington:Board of Governors of the Federal Reserve System, October),www.federalreserve.gov/pubs/oss/oss2/method.html.
69. For technical information about the construction of this index,see Kenneth J. Stewart and Stephen B. Reed (1999), ‘‘Consumer PriceIndex Research Series Using Current Methods, 1978–1998,’’ Monthly
Labor Review, vol. 122 (June), pp. 29–38.
A.1.
Survey yearAdjustment factor
for assets and debts inthe survey year
Adjustment factor forincome in the calendar year
before the survey year
1998 . . . . . . . . . . 1.2732 1.29102001 . . . . . . . . . . 1.1696 1.20242004 . . . . . . . . . . 1.0983 1.12802007 . . . . . . . . . . 1.0000 1.0284
A.2.
ItemSurvey year
1998 2001 2004 2007
Percentile of income20 . . . . . . . . . . . . . . . . . . . . . . 17,700 19,700 20,800 20,60040 . . . . . . . . . . . . . . . . . . . . . . 33,600 36,100 37,200 36,50060 . . . . . . . . . . . . . . . . . . . . . . 54,200 60,100 58,900 59,60080 . . . . . . . . . . . . . . . . . . . . . . 86,900 96,200 98,100 98,20090 . . . . . . . . . . . . . . . . . . . . . . 119,600 139,000 142,100 140,900
Percentile of net worth25 . . . . . . . . . . . . . . . . . . . . . . 12,700 14,900 14,600 14,10050 . . . . . . . . . . . . . . . . . . . . . . 91,300 101,200 102,200 120,30075 . . . . . . . . . . . . . . . . . . . . . . 265,900 335,800 360,700 372,00090 . . . . . . . . . . . . . . . . . . . . . . 628,300 865,700 913,300 908,200
Changes in U.S. Family Finances from 2004 to 2007: Evidence from the Survey of Consumer Finances A53
view. The questions underlying the method of classi-fication used in the survey were changed in both 1998and 2004. Starting in 1998, SCF respondents wereallowed to report more than one racial identification;in surveys before then, only one response was re-corded. For maximum comparability with earlierdata, respondents reporting multiple racial identifica-tions were asked to report their strongest racial iden-tification first.
Beginning with the 2004 survey, the question onracial identification is preceded by a question onwhether respondents consider themselves to be His-panic or Latino in culture or origin; previously, suchethnic identification was captured only to the extentthat it was reported as a response to the question onracial identification. The sequence of these two ques-tions in the 2004 SCF is similar to that in the CPS.When families in the March 2004 CPS are classifiedin the way most compatible with the SCF, the propor-tion of Hispanic families is 10.5 percent; the 2004 SCFestimate is 11.2 percent. Differences in these propor-tions are attributable to sampling error and possibly todifferences in the wording and context of the ques-tions.
For greater comparability with the earlier SCFdata, the data reported in this article ignore theinformation on ethnic identification available in 2007,but respondents reporting multiple racial identifica-tions in the surveys starting with 1998 are classifiedas ‘‘nonwhite or Hispanic.’’ In the 2007 SCF, 5.4 per-cent of respondents reported more than one racialidentification, up from 2.3 percent in 2004 and1.5 percent in 2001. Of those who responded affirma-tively to the question on Hispanic or Latino identifi-cation in 2007, 82.8 percent also reported ‘‘Hispanicor Latino’’ as one of their racial identifications, and74.5 percent reported it as their primary racial identi-fication. Because the question on Hispanic or Latinoethnicity precedes the one on racial identification inthe 2004 and 2007 surveys, the answer to the secondof these two questions may have been influenced bythe answer to the first.70
The Sampling Techniques
The survey is expected to provide a core set of data onfamily income, assets, and liabilities. The major
aspects of the sample design that address this require-ment have been constant since 1989. The SCF com-bines two techniques for random sampling. First, astandard multistage area-probability sample (a geo-graphically based random sample) is selected toprovide good coverage of characteristics, such ashomeownership, that are broadly distributed in thepopulation.
Second, a supplemental sample is selected to dis-proportionately include wealthy families, which holda relatively large share of such thinly held assets asnoncorporate businesses and tax-exempt bonds. Calledthe ‘‘list sample,’’ this group is drawn from a list ofstatistical records derived from tax returns. Theserecords are used under strict rules governing confi-dentiality, the rights of potential respondents to refuseparticipation in the survey, and the types of informa-tion that can be made available. Persons listed byForbes magazine as being among the wealthiest 400people in the United States are excluded from sam-pling.
Of the 4,422 interviews completed for the 2007 SCF,2,915 were from the area-probability sample, and1,507 were from the list sample; for 2004, 3,007 werefrom the area-probability sample, and 1,515 werefrom the list sample. The number of families repre-sented in the surveys considered in this article isgiven by table A.3.
The Interviews
The survey questionnaire has changed in only minorways since 1989, except in a small number ofinstances in which the structure was altered to accom-modate changes in financial behaviors, in types offinancial arrangements available to families, and inregulations covering data collection. In these casesand in all earlier ones, every effort has been made toensure the maximum degree of comparability of thedata over time. Except where noted in the article, thedata are highly comparable over time.
The generosity of families in giving their time forinterviews has been crucial to the SCF. In the2007 SCF, the median interview length was about 80minutes. However, in some particularly complicatedcases, the amount of time needed was substantiallymore than two hours. The role of the interviewers in
70. For a review of the effects of various approaches to measuringrace and ethnicity, see Clyde Tucker, Ruth McKay, Brian Kojetin,Roderick Harrison, Manuel de la Puente, Linda Stinson, and EdRobinson (1996), ‘‘Testing Methods of Collecting Racial and EthnicInformation: Results of the Current Population Survey Supplement onRace and Ethnicity,’’ BLS Statistical Notes 40, CPS Publications(Washington: Bureau of Labor Statistics, June), www.bls.census.gov/cps/racethn/1995/stat40rp.htm.
A.3.
Year Number of families represented (millions)
1998 . . . . . . . . 102.62001 . . . . . . . . 106.52004 . . . . . . . . 112.12007 . . . . . . . . 116.1
A54 Federal Reserve Bulletin h February 2009
this effort is also critical. Without their dedication andperseverance, the survey would not be possible.
The SCF interviews were conducted largely be-tween the months of May and December in eachsurvey year by NORC, a social science and surveyresearch organization at the University of Chicago.The majority of interviews were obtained in person,although interviewers were allowed to conduct tele-phone interviews if that was more convenient for therespondent. Each interviewer used a program runningon a laptop computer to administer the survey andcollect the data.
The use of computer-assisted personal interview-ing has the great advantage of enforcing systematiccollection of data across all cases. The computerprogram developed to collect the data for the SCFwas tailored to allow the collection of partial informa-tion in the form of ranges whenever a respondenteither did not know or did not want to reveal an exactdollar figure.
The response rate in the area-probability sample ismore than double that in the list sample. In both 2004and 2007, about 70 percent of households selected forthe area-probability sample actually completed inter-views. The overall response rate in the list samplewas about 30 percent; in the part of the list samplelikely containing the wealthiest families, the responserate was only about 10 percent.
Weighting
To provide a measure of the frequency with whichfamilies similar to the sample families could beexpected to be found in the population of all families,an analysis weight is computed for each case, account-ing both for the systematic properties of the sampledesign and for differential patterns of nonresponse.The SCF response rates are low by the standards ofsome other major government surveys, and analysisof the data confirms that the tendency to refuseparticipation is highly correlated with net worth.However, unlike other surveys, which also almostcertainly have differential nonresponse by wealthyhouseholds, the SCF has the means to adjust for suchnonresponse. A major part of SCF research is devotedto the evaluation of nonresponse and adjustments fornonresponse in the analysis weights of the survey.71
Sources of Error
Errors may be introduced into survey results at manystages. Sampling error—the variability expected inestimates based on a sample instead of a census—is aparticularly important source of error. Such error canbe reduced either by increasing the size of a sampleor, as is done in the SCF, by designing the sample toreduce important sources of variability. Samplingerror can be estimated, and for this article we usereplication methods to do so.
Replication methods draw samples, called repli-cates, from the set of actual respondents in a way thatincorporates the important dimensions of the originalsample design. In the SCF, weights were computedfor all the cases in each of the replicates.72 For eachstatistic for which standard errors are reported in thisarticle, the weighted statistic is estimated using thereplicate samples, and a measure of the variability ofthese estimates is combined with a measure of thevariability due to imputation for missing data to yieldthe standard error.
Other errors include those that interviewers mayintroduce by failing to follow the survey protocol ormisunderstanding a respondent’s answers. SCF inter-viewers are given lengthy, project-specific training tominimize such problems. Respondents may introduceerror by interpreting a question in a sense differentfrom that intended by the survey. For the SCF,extensive pretesting of questions and thorough reviewof the data tend to reduce this source of error.
Nonresponse—either complete nonresponse to thesurvey or nonresponse to selected items within thesurvey—may be another important source of error.As noted in more detail above, the SCF uses weight-ing to adjust for differential nonresponse to thesurvey. To address missing information on indi-vidual questions within the interview, the SCF usesstatistical methods to impute missing data; the tech-nique makes multiple estimates of missing data toallow for an estimate of the uncertainty attributableto this type of nonresponse.
71. The weights used in this article are adjusted for differentialrates of nonresponse across a number of groups. See Arthur B.Kennickell (1999), ‘‘Revisions to the SCF Weighting Methodology:Accounting for Race/Ethnicity and Homeownership’’ (Washington:
Board of Governors of the Federal Reserve System, January),www.federalreserve.gov/pubs/oss/oss2/method.html.
72. See Arthur B. Kennickell (2000), ‘‘Revisions to the VarianceEstimation Procedure for the SCF’’ (Washington: Board of Governorsof the Federal Reserve System, October), www.federalreserve.gov/pubs/oss/oss2/method.html.
Changes in U.S. Family Finances from 2004 to 2007: Evidence from the Survey of Consumer Finances A55

ERRATA
In the analysis of the SCF reported in the article,privately held businesses do not include businessesthat were reported to have a net value of zero; this factwas not made clear in the definition given in footnote39. In 2007, 12.0 percent of families had a privately
held business with a value different from zero; themedian and mean values for families having suchbusinesses were $100,500 and $1,071,100, respec-tively. If businesses with a value of zero are includedin the business definition in 2007, ownership rises to13.6 percent of families, and the median and meanvalues fall to $92,200 and $946,300, respectively.
A56 Federal Reserve Bulletin h February 2009