sustainability assessment methods and … · case study report: analysis of best practice ......
TRANSCRIPT
This project is funded by the European Union under Grant Agreement no. 636727. This work was supported by the Swiss State Secretariat for Education, Research and Innovation (SERI) under contract number 15.006. The opinions expressed and arguments employed herein do not necessarily reflect the official views of the Swiss Government.
SAMT SUSTAINABILITY ASSESSMENT METHODS AND TOOLS TO SUPPORT
DECISION-MAKING IN THE PROCESS INDUSTRIES
COORDINATION & SUPPORT ACTION
GRANT AGREEMENT NO. 636727
WWW.SPIRE2030.EU/SAMT
SAMT Deliverable 2.2 Case Study Report: Analysis of best practice solutions in comparison with currently used
techniques
Responsible authors & organisations:
Carlos Tapia, Aritz Alonso, Ales Padró, Raul Hugarte, Marco Bianchi, Arantza López (Tecnalia R&I), Hanna Pihkola, Elina Saarivuori (VTT), Michael Ritthoff (Wuppertal Institute), Peter Saling (BASF),
Kianga Schmuck (Bayer), Ywann Penru, Pascal Dauthuille (SUEZ), Alexander Martin Roeder, Martin Jenke (CEMEX), Jostein Søreide (Hydro), Annamari Enström, Sari Kuusisto (Neste)
Deliverable due date: 30 April 2016
Actual submission date: 10 June 2016
Project start date: 1 January 2015
Project duration: 24 months
Work package: WP2 - Evaluation and selection of most potential assessment methods and best practices
Work package leader: Tecnalia R&I
Organisation name of lead contractor for this deliverable: Tecnalia R&I
Dissemination level: PUBLIC

SAMT D2.2
Acknowledgements:
The Authors are thankful to all the industrial partners that have contributed to this deliverable by providing
process feedback, data, methodologies, tools and other resources. In particular, we would like to express
our gratitude to BASF, Bayer, SUEZ, CEMEX, Hydro and Neste companies for their active involvement in the
case studies.

SAMT D2.2
Abstract / Executive summary:
The aim of the SAMT project (2015-2016) is to review and make recommendations about the most potential methods for evaluating sustainability and therein the energy and resource efficiency in the process industry. SAMT will collect, evaluate and communicate the experiences of leading industrial actors from cement, oil, metal, water, waste and chemical industry and review the latest scientific developments within the field of sustainability assessment. SAMT is a coordination and support action that will promote the cross-sectorial uptake of the most promising tools by conducting case studies, organising workshops and producing recommendations for further implementation of the best practices in sustainability assessment.
The overall aim of the case studies conducted within the SAMT project is to identify best practices with respect to tools, methods and indicators for assessing sustainability and resource and energy efficiency. On a practical level, methods and tools currently applied by the industries were tested and compared with existing methods that were considered promising and powerful in order to assess either the overall sustainability, or energy and resource efficiency.
By means of the case studies presented in this report, the applicability and comparability of some of these methods is evaluated, and future research and development needs are identified. In essence, two levels of implementation were followed, each performed on a group of methods with different scopes and ambitions:
The first group focused on three environmental sustainability methods, namely Carbon Footprint (CF), Exergetic-Life Cycle Assessment (E-LCA) and Life Cycle Activity Analysis (LCAA). These methods were tested – i.e. without full implementation.
The second group focused on a total of eight sustainability assessment methods and six alternative methodologies covering environmental, economic and social aspects. All methods were fully implemented. The first study was based on two different industrial processes and examined the following methods: Life Cycle Assessment (LCA), Material Input per Service (MIPS), Life Cycle Costing (LCC), Eco-Efficiency Analysis (EEA), Green Productivity (GP) and Social-Life Cycle Assessment (S-LCA). The second study focused on the available impact assessment methods for Water Footprint (WF).
The following table provides an overview of the methods tested in this work:
Table 1: Implementation levels for the methods tested within the SAMT case studies
Selected methods
Type Level Contributing partner Main motivation Main focus
LCA LCA-based Full implementation Tecnalia, Bayer, BASF Needed as a basis for other methods Validation
MIPS LCA-based Full implementation WI, Bayer, Tecnalia, SUEZ, VTT
LCA-based. Focus on materials Validation
LCC LCA-based Full implementation Tecnalia, Bayer LCA-based. Focus on costs Validation
S-LCA LCA-based Full implementation Tecnalia, BASF New methods available Testing and comparison
EEA Integrated Full implementation Tecnalia, Bayer, BASF High interest among partners Comparison
GP Integrated Full implementation Tecnalia, Bayer High interest among partners Comparison
WF LCA-based Full implementation VTT, SUEZ LCA-based. Focus on water. High interest among partners
Validation and comparison
CF LCA-based Simulation Tecnalia, CEMEX LCA-based. Focus on energy Testing
SAMT D2.2
E-LCA LCA-based Simulation Tecnalia, Neste High relevance according to the RACER evaluation
Testing
LCAA Hybrid Simulation Tecnalia, Hydro Hybrid method Testing
Basing on this research setting, we discuss the value added of the different methods and we identify a number of barriers that potentially undermine sustainability assessment within the process industry. Building on these findings, we provide a series of recommendations for enhanced sustainability evaluation practice at the industrial level. The report is accompanied by three appendices that provide the complete case study reports.
KEY WORDS:
Process industry, Sustainability, Life Cycle Assessment (LCA), Material Input per Service (MIPS), Carbon Footprint (CF), Water Footprint (WF), Exergetic-Life Cycle Assessment (E-LCA), Life Cycle Costing (LCC), Social Impact Assessment (SIA), Social-Life Cycle Assessment (S-LCA), Eco-Efficiency Analysis (EEA), Green Productivity (GP) index, Life Cycle Activity Analysis (LCAA)

SAMT D2.2
List of abbreviations
AA: Activity Analysis
CED: Cumulative Energy Demand
CF: Carbon Footprint
EEA: Eco-Efficiency Analysis
EIA: Environmental Impact Assessment
EPD: Environmental Product Declaration
E-LCA: Exergetic Life Cycle Assessment, Exergy analysis
GP: Green Productivity
LCA: Life Cycle Assessment
LCAA: Life Cycle Activity Analysis
LCC: Life Cycle Costing
LCI: Life Cycle Inventory
LCIA: Life Cycle Impact Assessment
LCSA: Life Cycle Sustainability Assessment
MI: Material Input
MIT: Material Intensity
MIPS: Material Input Per Service
PEF: Product Environmental Footprint
SIA: Social Impact Assessment
S-LCA: Social Life Cycle Assessment
TCA: Total Cost Assessment
TCO: Total Cost of Ownership
WBCSD: World Business Council for Sustainable Development
WF: Water Footprint
WWTP: Wastewater Treatment Plant

SAMT D2.2
Contents
1 Introduction ............................................................................................................................................... 1
1.1 Background ........................................................................................................................................ 1
1.2 Some definitions ................................................................................................................................ 2
1.3 Aim of this report .............................................................................................................................. 2
2 Objectives of the case studies ................................................................................................................... 4
3 Methodology ............................................................................................................................................. 5
3.1 Implementation levels ....................................................................................................................... 5
3.2 Case study selection criteria .............................................................................................................. 6
3.3 Partner and stakeholder roles ........................................................................................................... 6
4 Overview of case studies ........................................................................................................................... 7
4.1 Succinct description of the processes analysed ................................................................................ 7
4.1.1 Integrated case study ................................................................................................................ 7
4.1.2 Water footprint case study ........................................................................................................ 7
4.1.3 Simulation case study ................................................................................................................ 7
4.2 Description of the methods tested in the case studies ..................................................................... 8
4.2.1 Integrated case study ................................................................................................................ 8
4.2.2 Water footprint case study ...................................................................................................... 10
4.2.3 Simulation case study .............................................................................................................. 11
5 Lessons learnt .......................................................................................................................................... 13
5.1 Environmental methods .................................................................................................................. 13
5.1.1 Value added ............................................................................................................................. 13
5.1.2 Existing barriers and areas for improvement .......................................................................... 14
5.2 Costing methods .............................................................................................................................. 17
5.2.1 Value added ............................................................................................................................. 17
5.2.2 Existing barriers and areas for improvement .......................................................................... 17
5.3 Social methods ................................................................................................................................ 18
5.3.1 Value added ............................................................................................................................. 18
5.3.2 Existing barriers and areas for improvement .......................................................................... 19
5.4 Integrated methods ......................................................................................................................... 20
SAMT D2.2
5.4.1 Value added ............................................................................................................................. 20
5.4.2 Existing barriers and areas for improvement .......................................................................... 21
5.5 Hybrid methods ............................................................................................................................... 22
5.5.1 Value added ............................................................................................................................. 22
5.5.2 Existing barriers and areas for improvement .......................................................................... 22
5.6 Cross cutting issues.......................................................................................................................... 23
6 Recommendations ................................................................................................................................... 27
7 Next steps ................................................................................................................................................ 31
8 References ............................................................................................................................................... 32
9 Appendices ................................................................................................................................................. 35
Specific case study reports are included as appendices to this main report. Each case study is reported in its
own report. The appendices include the following three reports:
Integrated case study – Appendix 1
Water footprint case study – Appendix 2
Simulation methods – Appendix 3

SAMT D2.2
1
1 Introduction
1.1 Background
Sustainability assessment methods are needed for various industrial sectors to support sustainable
technology development, decision-making and to evaluate the impacts of existing solutions, products and
technologies. Ideally, sustainability assessment methods should address the environmental, economic and
social aspects of technologies and cover the whole life cycle of the solutions. The assessment methods
should provide robust knowledge to support decision-making, and allow comparability of the results.
However, addressing all those aspects within one tool or assessment method is challenging, or even
impossible. While there are aspects and indicators that are common to all process industries, sector specific
methods, tools, or indicators are often required to address the specific features of each industrial sector in
a fair and transparent way.
The SPIRE Public –Private Partnership (PPP)1 brings together several sectors of process industry: cement,
ceramics, chemicals, engineering, minerals and ores, non-ferrous metals, and water. All SPIRE sectors can
be considered as resource and energy intensive and thus improving resource and energy efficiency are
urgent issues for improving the sustainability and competitiveness of the sectors. Within the Horizon 2020
work programme, the specific and common goals listed for the SPIRE sectors are:
A reduction in fossil energy intensity of up to 30% from current levels by 2030.
A reduction of up to 20% in non-renewable, primary raw material intensity compared to current
levels by 2030.
A reduction of greenhouse gas emissions by 20% below 1999 levels by 2020, with further
reductions up to 40% by 2030.
For the SPIRE sectors, sustainability assessment methods are crucial for evaluating the current state and
the achievement of the goals related to resource and energy efficiency. For evaluating the overall resource
and energy efficiency of the SPRIRE sectors as a whole, tools and indicators that are applicable for cross-
sectorial assessment are required.
At the moment, several tools, assessment methods and indicators exist, but they differ in their goal and
scope and are intended for different kind of use within companies, by consumers or by authorities to
support policy planning and evaluation. Additionally, different methods and tools are focused for different
levels of assessment: product, company, industry or society. Thus the problem is not so much the existence
of proper methods and tools but rather the lack of understanding and knowledge on how they should be
applied and in which context. Thorough understanding of the underlying mechanisms and calculation
principles incorporated in the tool in question is often required to make a trustworthy assessment.
Furthermore, it should be recognised which of the existing methods and tools are suitable for analysing
1 SPIRE stands for Sustainable Process Industry through Resource and Energy Efficiency. For more information see:
www.spire2030.eu

SAMT D2.2
2
resource and energy efficiency within the process industries and across the different sectors of the
industry.
The SAMT project will respond to the need for cross-sectorial sustainability assessment methods by
bringing together representatives of several process industry sectors, namely cement, metal, oil, water,
waste and chemical industry, and collecting and evaluating the current best practices from each industrial
sector, together with the latest research know-how related to sustainability assessment methods and
recent activities in standardisation within the field.
SAMT is funded by the Horizon 2020 work program SPIRE.2014-4: Methodologies, tools and indicators for
cross-sectorial sustainability assessment of energy and resource efficient solutions in the process industry.
1.2 Some definitions
In this report we use consequently the terms ‘method’, ‘tool’, and ‘indicator’. The definitions applied here
were first defined in the context of the first SAMT deliverable D1.1, and slightly updated for the second
SAMT deliverable D1.2. The definitions are as follows:
• Method: set of instructions describing how to calculate a set of indicators and how to asses them.
Methods include official standards.
• Tool: working and calculation platform that assists with the implementation of a method. A tool is
usually software but it could also be, for example, a paper-based check-list.
• Indicator: a quantitative or qualitative proxy that informs on performance, result, impact, etc.
without actually directly measuring it. For example, a low carbon footprint indicates a low
environmental impact for the category climate change, but it does not measure the impact, it
refers to greenhouse gas emissions, i.e. the environmental pressure.
Those definitions are by no means “official” but the ones we use in this project to avoid confusion. These
terms are indeed used differently by many stakeholders in the scientific community, in policy, in the
industry etc. For more information, please see SAMT D1.1 (Saurat et al., 2015b).
1.3 Aim of this report
The overall aim of the case studies conducted within the SAMT project is to identify best practices with
respect to tools, methods and indicators for assessing sustainability and resource and energy efficiency. On
a practical level, methods and tools currently applied by the industries were tested and compared with
existing methods that are considered interesting and potential for assessing either overall sustainability, or
energy and resource efficiency. Within the cases, the applicability and comparability of the methods is
evaluated, and future research and development needs are identified.
This report presents some findings related to the implementation of a number of sustainable assessment
methods and tools in a realistic industrial context. The focus is on the applicability of the methods and tools
SAMT D2.2
3
rather than on accuracy of data and the assessments themselves. Accordingly, the assessment does not
pursue the purpose of generating precise numbers, but the results rather have a simplified illustrative
character.
Neither this report, nor any of its sections or appendices should be used to generate any claims on the
environmental, economic or social sustainability of the industrial processes assessed in the SAMT case
studies. These evaluations shall be considered as intermediate information collected for the only purpose
of testing a group of methods – and related tools – for sustainability assessment within the process
industry.
The report is structured as follows: Section 2 presents the goals of the SAMT case studies and outlines the
objectives. Section 3 provides an overview of the criteria that drove the selection of methods. Chapter 4
describes the methodology that was followed for each one of the two implementation levels that were
applied. Section 5 provides a succinct description of the case studies, including the processes that were
assed as well as the methods that were tested. Section 6 elaborates on the added value of the different
methods, the barriers for implementation and the areas for improvement. Section 7 contains our
recommendations. Finally, Appendices 1 to 3 present the full case study reports.

SAMT D2.2
4
2 Objectives of the case studies
The main goal of the SAMT case studies is evaluate and select the best practices with respect to tools,
methods and indicators for the assessment of sustainability, resource and energy efficiency, based on the
results of the evaluation of methods performed on previous stages of the SAMT implementation.
In order to achieve this goal, a number of methodologies and practices classified as the best/most
promising – including methods, tools and indicators – were tested within a real industrial context.
Against this framework, the case studies of the SAMT project were conducted with two specific
orientations:
Validation of methods: Validation allowed understanding the added value that specific
sustainability assessment methods have for different companies, as representatives of their specific
sectors. Method validation also allowed collecting information on the performance (in terms of
potential strengths and weaknesses) of the different methods in relation to the main research
questions of the SAMT project (namely multi-sectoriality, focus on energy and material efficiency,
and life cycle orientation). Compared to previous evaluations performed within the scope of SAMT
project, the added value here is the real industrial context in which the methods were tested for a
specific practice-oriented purpose. Key issues that were analysed through the case studies included
method reliability, data needs, the possibility to assess different sustainability aspects (focusing on
resource and energy efficiency), the opportunities for decision making at different levels, the
quality of the results, and the utility for the industry, amongst other relevant aspects.
Comparison of methods: Comparison of methods was done along two strands: (i) between the
methods themselves and (ii) between the methods and the usual practice within the companies
participating in the SAMT project. At a simulation level, the comparison of methods was enabled
through a series of checklists focusing on a number of relevant aspects linked to the main goals
defined by the SAMT project. These checklists are presented as Appendices to this document.

SAMT D2.2
5
3 Methodology
3.1 Implementation levels
The SAMT case studies focus both on the implementation process and the results delivered by each
method. In order to cover both dimensions for the various types of methods included in the assessment,
the case studies were developed incrementally. This allowed finding a balance between the types and
number of methods to assess and the depth of the assessments. In essence, two levels of implementation
were applied, each of them performed on a group of methods with different scopes and ambitions:
Level 1 (simulation): On this level, three sustainability assessment methods were tested by three
companies participating in the SAMT project. Method testing was based on realistic information
derived from the simulated application of the selected methods within the three companies, but
without implementing the methods themselves – i.e. the method was not applied on a real product
or process, no calculations were done, no intermediate impacts and endpoints were obtained, no
outcomes were communicated –. The methods tested at this level were Carbon Footprint (CF),
Exergetic-Life Cycle Assessment (E-LCA) and Life Cycle Activity Analysis (LCAA). These are methods
that show particular strengths in any of the dimensions considered in the SAMT project, as
reported on Table 1 below.
At this level, the main goal was to test the methods in terms of: (i) their specific inputs and
requirements (by focusing on e.g. the data needs and its practical availability within companies,
their implementation costs, etc.), and; (ii) the nature, quality and usability of the outputs yielded
when applied under specific -and realistic- circumstances (this includes e.g. describing the nature
and scope of the information generated as well as its relevance within a business context). These
questions mainly relate to e.g. replicability and applicability when moving from one sector to
another. In order to address these issues in a comparable manner a ‘testing criteria’ based on a
common checklist are presented in Appendix 3.
Level 2 (full implementation): This level is based on a fully-fledged application of a number of specific
methods within two complete case studies that are called “Integrated” and “Water Footprint” case
studies. Both of these two comprehensive case studies mainly focus on the assessment of the
methods in terms of the potential implementation challenges, obstacles, development needs, etc.
when they are implemented along the life cycle (both upstream and downstream). Since some of
the methods are relatively new and promising approaches, a comparative framework was set up.
The methods tested were Life Cycle Assessment (LCA), Material Input per Service (MIPS), Life Cycle
Costing (LCC), Eco-Efficiency Analysis (EEA), Green Productivity (GP) and Social-Life Cycle
Assessment (S-LCA) within the integrated case study, which is presented in Appendix 1, and various
MIPS and Water Footprint (WF) methods within the water footprint case study, which is delivered
in Appendix 2. In all cases, the main research challenge was to identify strengths, weaknesses,
limitations of each method for each specific application.

SAMT D2.2
6
3.2 Case study selection criteria
The SAMT case studies were chosen according to the general goals of the SAMT project (see Section 2).
Additionally, when it came to the specific decisions on the methods to test and the products/processes to
analyse, the inputs from previous phases of SAMT project pointed the way ahead. These included, amongst
others, the following aspects:
1. Diversification of methods according to the clusters defined within SAMT D1.1 (Saurat et al.,
2015b), including (i) LCA-related methods; (ii) Hybrid methods, and; (iii) Integrated methods.
2. The cross-check analysis (pre-selection of methods) performed within D2.1 of the SAMT project
(López et al., 2015) basing on a selection of 14 out of the 52 methods considered in the overview of
methods presented in D1.1 (Saurat et al., 2015b). This analysis based on the following criteria: (i)
multi-sectoriality, or capacity of the methods to be implemented across sectors; (ii) multi-
dimensionality, informing on the methods’ ability to cover more than one sustainability spheres
(environmental, economic and social); (iii) life cycle orientation, related to the capacity of the
methods to cover more than one life cycle stages of the products or services, and; (iv) simplicity,
assessed through the availability of tools easing the implementation of methods.
3. The SAMT-RACER evaluation, also included within SAMT D2.1 (López et al., 2015). The evaluation
was based on an adapted RACER methodology, which is an evaluation framework designed by the
European Union to assess the value of scientific tools for decision-making (EC, 2009). The SAMT-
RACER evaluation was applied as a semi-quantitative assessment performed over a total of 16
criteria, grouped in 5 components: Relevance, Acceptance, Credibility, Easy (simplicity), and
Robustness.
4. The interests expressed by the SAMT partners. The selection of the methods to test within the two
case studies was a participatory process open to contributions from all the RTO and industrial
partners involved in the SAMT project. Eventually, a poll was organised. All partners had the chance
to vote for their preferred methods to be tested within the case studies.
3.3 Partner and stakeholder roles
The SAMT project is a Coordination Support Action designed to enable the participation of a large number
of stakeholders from the process industry. These stakeholders contributed to the case studies in a number
of ways. The RTOs played a supporting role, providing guidelines for the case studies and doing the follow-
up. Besides, the RTOs were responsible for most part of the analyses done. Six of the industrial partners
participating in the project, namely the BASF, BAYER, CEMEX, HYDRO, Neste and SUEZ companies, had a
direct participation in the case studies by answering the questionnaires, providing data, performing specific
analyses, checking the assessments and giving feedback for reporting. All project partners contributed to
the integration phase, mainly providing inputs to improve the general conclusions section. Other
stakeholders participated in the open workshops and got in touch with the project partners though
different channels in different phases of the project implementation, including the case studies.
SAMT D2.2
7
4 Overview of case studies
Life cycle thinking is the conceptual foundation for the environmental, economic, social, and integrated and
hybrid methods tested in the SAMT case studies. This section provides an overview of the case studies
conducted on Level 2 (full implementation), which are provided as Annexes 1 and 2 to this report, and Level
1 (simulation) delivered as Annex 3 to this report.
4.1 Succinct description of the processes analysed
4.1.1 Integrated case study
Our first case study dealt with the production, use and end of life of an industrial product. The main goal of
this case study was to test and compare a number of sustainability assessment methods focusing on the
environmental, economic and social spheres within an industrial context. The case study itself was designed
as a comparative analysis of two virtual production sites located in Spain and Germany, assuming that that
the production was entirely done either in Spain (scenario 1 – plant A) or Germany (scenario 2 – plant B),
with identical production routes ending with the same product and an identical function but with different
disposal and transportation systems, as well as asymmetric production costs and social indicators.
The case study was prepared jointly by Tecnalia, Bayer, BASF and Wuppertal Institute. This case study is
available in Appendix 1 to this report.
4.1.2 Water footprint case study
Our second comprehensive case study focused on a water footprint assessment for a wastewater
treatment plant (WWTP) located in France. The case study itself represents a service water footprint of the
WWTP that treats high organic load effluents from agri-food industry. The main goal of the case study was
to test the water footprint assessment for the WWTP by applying different available characterisation
factors for the impact assessment phase, and to consider potential benefits and challenges related to
conducting a comprehensive water footprint assessment according to ISO14046. Parallel to water footprint
assessment, another LCA-based assessment method, namely MIPS method, was applied within the case
study to consider other resource categories besides water, and to consider potential benefits and added-
value from applying these different methods together.
The case study was prepared together by VTT, SUEZ and Wuppertal Institute. The WF case study is available
in Appendix 2 to this report.
4.1.3 Simulation case study
The simulation level did not entail assessing specific processes or products. This implementation level was
mainly conducted via a series of questionnaires that were filled by the industrial partners participating in

SAMT D2.2
8
the project. Respondents answered a vast array of questions designed to describe each sustainability
assessment method across a number of relevant dimensions identified on previous steps of the SAMT
project. These dimensions are essence, scope, relevance, requirements and outcomes (see López et al.,
2015; Saurat et al., 2015b). In order to benchmark such aspects and compare the relative importance they
could have for the companies participating in the project, a preliminary questionnaire was distributed
among all the industrial partners participating in the SAMT project. This questionnaire is provided as
Appendix 3.1.
A second, more detailed, questionnaire was distributed among the three industrial partners – Neste,
HYDRO and CEMEX – that volunteered to simulate the implementation of three methods, respectively E-
LCA, LCAA and CF. The questionnaire is available in Appendix 3.3.
The questionnaires were accompanied by a detailed description of the methods. This description mirrored
the structure of the questionnaire, so that each category of analysis was supported by a detailed overview
of the method based on scientific evidence. The template that was used for the characterisation of the
simulation methods is delivered as Appendix 3.3 to this report.
This case study was prepared by Tecnalia, Hydro, CEMEX and Neste, with contributions from other
partners. All questionnaires and templates related to the case study are included in Appendix 3.
4.2 Description of the methods tested in the case studies
This section provides an overview of the methods applied within the SAMT case studies.
4.2.1 Integrated case study
An ISO-compliant environmental Life Cycle Assessment (LCA) was the core component of the sustainability
analysis within this case study. The seminal role of LCA is also reflected in the fact that there are a number
methods derived from it, such as CED, CF, WF, etc. These can be considered sub-methods of the broader
LCA (Saurat et al., 2015b).
The second environmental method applied in this case study, namely Material Input per Service (MIPS),
can also be considered a sub-method of the broader LCA. The MIPS method is an established methodology
that delivers quantitative results on material efficiency – Material Footprint – by adding the weight of a
product and the ecological rucksack of that product, also expressed in a mass unit. There are examples of
MIPS applications in most sectors, including most process industries.
Basing on the same life cycle inventory as the LCA and MIPS implementations, an economic Life Cycle
Costing (LCC) was also developed. The LCC is a costing method that takes account of all the costs incurring
during the entire life cycle of any product or process, the so-called life cycle costs, which include the
development, production and dismantling/disposal phases. In alternative to traditional accounting, LCC can
provide valuable information on the dimension and structure of costs potentially incurred by new
processes or products already during their development phase (Sell et al., 2014).

SAMT D2.2
9
Based on the results of the LCA and LCC, the environmental and economic dimensions were combined as
eco-portfolios. The eco-portfolios were produced following two alternative analytical approaches. The first
one was based on the concept of eco-efficiency, defined as the ratio of an output value to its
environmental influence. It was computed over a number of environmental dimensions, following the Eco-
Efficiency Method by BASF (Saling et al., 2002). The second one was based on the concept of Green-
productivity, defined as is the ratio of productivity of a system to its environmental impacts. It was
calculated following the Green Productivity (GP) method proposed by Hur, et al. (2004). GP integrates
environmental protection and productivity improvement, using the environmental management tools such
as LCA and Total Cost Assessment (TCA).
A simplified Social-LCA (S-LCA) was performed on top of the environmental, economic and integrated
assessments. S-LCA followed the conceptual framework proposed by the UNEP-SETAC Guidelines for Social
Impact Assessment (2009). Two specific S-LCA methods were compared, namely the Social Metrics for
Chemical Products in their Applications by the World Business Council for Sustainable Development –
WBCSD (Coërs, 2015) and the Handbook for Product Social Impact Assessment by the Roundtable for
Product Social Metrics (PRé Sustainability and Roundtable for Product Social Metrics, 2016).
Table 2: A summary of the methods, tools and impact categories applied within the integrated case study
Used tool Type of indicators Impact category Characterisation model
Standard LCA (comparison of two productions systems located in Germany and Spain)
SimaPro Environmental
Abiotic depletion
CML 2001
Acidification
Eutrophication
Global Warming 100a
Ozone layer depletion 40a
Photochemical oxidation
MIPS
OpenLCA Resource Use
Abiotic raw materials
Saurat & Ritthoff 2013
Biotic raw materials
Earth movement in agriculture and silviculture
Water
Air
LCC
Excel Economic
Development costs
Sell et al., 2014 Use costs
Disposal costs
EEA
BASF EEA tool
Environmental
Resource depletion (mineral & fossil) EU PEF 2014
Acidification EU PEF 2014
Climate change EU PEF 2014
Eutrophication (freshwater & marine)
EU PEF 2014
Human toxicity BASF 2002
Photochemical ozone formation EU PEF 2014
Economic Development costs
Total Cost of Ownership (TCO) Use costs

SAMT D2.2
10
Disposal costs
GP
Excel
Environmental
Abiotic depletion
CML 2001
Acidification
Eutrophication
Global Warming 100a
Ozone layer depletion 40a
Photochemical oxidation
Economic
Development costs
Sell et al., 2014 Use costs
Disposal costs
S-LCA
Handbook for Product Social Assessment
Social
Basic rights and needs
Roundtable for Product Social
Metrics2
Employment
Health and safety
Skills and knowledge
4.2.2 Water footprint case study
The evolution of water footprint methods and terminology has been rapid. The water footprint concept
was first introduced in 2002 by Hoekstra and the Water Footprint Network3 to quantify the total volume of
freshwater that is consumed and polluted, divided into three different water use categories (blue water,
green water, and grey water). The recent developments in LCA have however focused on measuring the
actual impacts of water use instead of the volumetric approach, and methodologies have been developed
to capture the impact of human activities on water availability (Kounina et al., 2013).
According to the recent ISO standard for water footprint (ISO14046), Water Footprint (WF) is a set of
metrics that quantifies the potential environmental impact related to water use. It provides the information
to which extent a product, service or company is affecting ecosystems and the society, through the use of
water.
According to ISO14046, the water footprint assessment is a quantitative assessment that should be based
on a life cycle approach, and it can be conducted as a stand-alone assessment, or as a part of a life cycle
assessment. This assessment includes the same four phases of LCA mentioned above.
The WF is reported as a water footprint profile that considers a range of potential environmental impacts
associated with water and consists of several impact category indicator results. The profile may be further
aggregated into a single parameter. The water footprint profile may consist of different types of water
footprints that include water scarcity footprint, water availability footprint and water degradation
footprint. All these footprints may consist of several impact categories. Although examples of potential
impact categories to be included in different types of water footprints are given, specific methods or
characterization factors that should be used for the assessment are not defined within the standard, as
available methods are in different stages of development.
2 Applied on the “mandatory” social topics within the WBCSD method.
3 http://waterfootprint.org/en/water-footprint/
SAMT D2.2
11
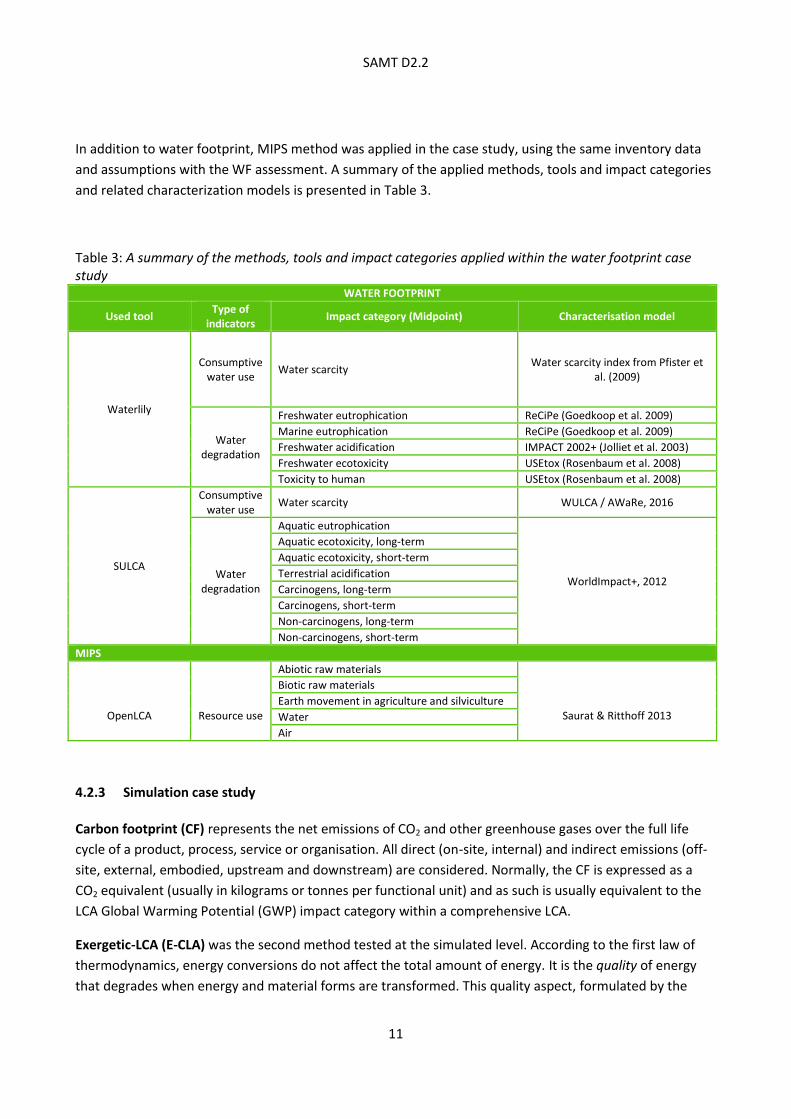
In addition to water footprint, MIPS method was applied in the case study, using the same inventory data
and assumptions with the WF assessment. A summary of the applied methods, tools and impact categories
and related characterization models is presented in Table 3.
Table 3: A summary of the methods, tools and impact categories applied within the water footprint case study
WATER FOOTPRINT
Used tool Type of
indicators Impact category (Midpoint) Characterisation model
Waterlily
Consumptive water use
Water scarcity Water scarcity index from Pfister et
al. (2009)
Water degradation
Freshwater eutrophication ReCiPe (Goedkoop et al. 2009)
Marine eutrophication ReCiPe (Goedkoop et al. 2009)
Freshwater acidification IMPACT 2002+ (Jolliet et al. 2003)
Freshwater ecotoxicity USEtox (Rosenbaum et al. 2008)
Toxicity to human USEtox (Rosenbaum et al. 2008)
SULCA
Consumptive water use
Water scarcity WULCA / AWaRe, 2016
Water degradation
Aquatic eutrophication
WorldImpact+, 2012
Aquatic ecotoxicity, long-term
Aquatic ecotoxicity, short-term
Terrestrial acidification
Carcinogens, long-term
Carcinogens, short-term
Non-carcinogens, long-term
Non-carcinogens, short-term
MIPS
OpenLCA
Resource use
Abiotic raw materials
Saurat & Ritthoff 2013
Biotic raw materials
Earth movement in agriculture and silviculture
Water
Air
4.2.3 Simulation case study
Carbon footprint (CF) represents the net emissions of CO2 and other greenhouse gases over the full life
cycle of a product, process, service or organisation. All direct (on-site, internal) and indirect emissions (off-
site, external, embodied, upstream and downstream) are considered. Normally, the CF is expressed as a
CO2 equivalent (usually in kilograms or tonnes per functional unit) and as such is usually equivalent to the
LCA Global Warming Potential (GWP) impact category within a comprehensive LCA.
Exergetic-LCA (E-CLA) was the second method tested at the simulated level. According to the first law of
thermodynamics, energy conversions do not affect the total amount of energy. It is the quality of energy
that degrades when energy and material forms are transformed. This quality aspect, formulated by the

SAMT D2.2
12
second law of thermodynamics, is what exergy reflects: It can be defined as a minimum work input
necessary to realise the reverse process (Rant 1964 cited in Szargut, 2005). Unlike energy, exergy is
consumed by processes as a fraction of the energy content becomes useless (De Meester et al., 2009). It
expresses the maximum amount of useful work the resource can provide. While the classical LCA has a
major emphasis on emissions, exergy analysis is much more resource and product -efficiency oriented
(Dewulf et al., 2008). E-LCA is to be understood as a specific implementation of LCA that combines exergy
accounting with traditional LCA to enable the analysis of cumulative consumption of resources.
Life Cycle Activity Analysis (LCAA) combines mathematical programming of Activity Analysis (AA) with the
LCA methodology providing a computable approach for economic and environmental optimisation of the
supply chain of products, processes or services. LCAA extends the LCA framework by recognising the
possible presence of alternative activities along the cradle-to-grave life cycle stages and by including
economic costs (Freire and Thore, 2002). LCAA distinguishes four types of goods: primary goods (natural
resources, material or labour), intermediate goods (outputs which serve as inputs into subsequent
activities), final goods (outputs) and environmental goods (energy consumption, emissions of pollutant and
disposal of waste)
Table 4: Methods tested at a simulation level
Simulation methods Type Main motivation
Carbon Footprint LCA-based It is a widely used method. CF is the basis for many energy efficiency assessments.
Exergetic-LCA Exergy-based method. LCA-based
High relevance according to the RACER evaluation
LCAA Hybrid method Promising method

SAMT D2.2
13
5 Lessons learnt
The interviews conducted during the SAMT project with sustainability experts working in different process
industry sectors highlighted several needs and demands related to sustainability assessment methods
applicable for wide implementation within the industries (SAMT D1.2 - Saurat et al., 2015b). From the point
of view of the SAMT case studies and method testing, three of those needs are of particular importance:
Firstly, the methods should be able to create additional value for decision making. Thus, there is a
need to argue for both internal and external stakeholders, why resources should be invested in
these types of assessments, and what is the benefit these methods can create for the company? A
quote from one of the interviews illustrates clearly this point and the challenges faced: “In the end,
LCA is an oversized tool compared to what use can be made of the results in practice in the industry:
it is like having a Ferrari and driving it at 30 km/h.”
Secondly, the methods should be applicable for different kinds of value chains and activities.
Thirdly, the results should be easily communicated both internally and externally, to non-
sustainability expert audiences.
This Section aims to reflect upon these points considering the potential benefits and drawbacks related to
each of the methods tested and the learnings from the case studies, focusing mainly on practical aspects
that should be dealt with when implementing these methods in practice.
5.1 Environmental methods
5.1.1 Value added
LCA, E-LCA, CF, WF and MIPS are environmentally oriented life cycle methods. All of them, with the possible
exception of WF, lack of predefined geographical boundaries. They cover all life cycle stages, but parts of
the life cycle can also be analysed separately. CF and WF can be conducted as stand-alone assessments, or
as a part of a LCA. The LCA can also be enlarged to adopt the MIPS and the exergetic perspectives. In
general, the main benefit of all the life cycle based methods is the ability to point out indirect impacts
within the value chain, and the ability to identify hotspots in which more attention should focused at
Amongst all of the methods, the CF method is the one with a wider diffusion among the process industry.
The CF can be calculated using the LCA standard (ISO 14064-2012) as well as other standards largely in
compliance with it, such as the GHG Protocol. Given that it only focuses on the climate change impact
category, data needs are limited to the potential sources of GHG emissions and processing is also simpler in
comparison to a full LCA. Furthermore, as impacts are quantified as CO2 equivalents the method is easier to
understand and communicate to non-experts. This makes it a method widely applied by industries and
explains why many companies have developed their own tools for calculating the CF. However,
development of own tools has also been due to the need to adapt the tools with specific needs of the
organisations (see SAMT D1.2 - Saurat et al., 2015b). With the growing relevance of climate change in

SAMT D2.2
14
global agendas, CF is a de-facto standard for environmental communication in many sectors. There also
seems to be an increasing demand of CF for Environmental Product Declarations (EPDs).
Based on the interviews conducted with the industrial experts (see Saurat et al., 2015a), WF is currently of
interest for all the sectors represented in the SAMT project and companies are looking for potential
methods and tools for conducting a comprehensive water footprint assessment. As such, water footprint
inventory (according to life cycle phases) provides useful information on the distribution of water use
between life cycle phases, and points out phases in which more attention could be given. Especially in areas
with high water scarcity indexes, pointing out indirect water consumption is important for focusing
attention on processes in which there is most reduction potential. A water scarcity footprint, together with
specific impact category results for the water degradation footprint might be quite easily added to a
comprehensive LCA. Together, these aspects already cover many useful and important aspects related to
water. However, for a comprehensive understanding of the impacts (as defined in the standard), the
assessment should be extended towards the water availability footprint, which would in most cases mean a
lot of additional data collection and analysis. However, the results of the previous steps may be used as
guidance when considering the need for this next step of the assessment.
The main value added of E-LCA relates to the intrinsic characteristics of the exergy concept. In contrast to
other environmental methods, exergy analysis can provide a unified measure for resource accounting, as it
equally accounts for materials, movements, currents or heat and the transformations between them (Laner
et al., 2015; Maes et al., 2014). Additionally, the amount of exergy destruction in a process is implicitly a
measure of efficiency, and the ratio of exergy outputs to total exergy inputs provides an indication of the
theoretical potential of future improvement for a process (Maes et al., 2014). Thus, exergy analysis
facilitates comparison of different environmental issues and it allows consistent temporal comparisons of
environmental performance (Ayres et al., 1998).
All these environmental methods have a broad scope in terms of potential application, including technical
and management process optimisation, supply chain optimisation and life cycle wide optimisation, amongst
others. All of them can be used for monitoring, reporting and decision making alike. Despite they were
developed for status quo analysis, they can also be used to produce scenarios.
5.1.2 Existing barriers and areas for improvement
Albeit all the environmental methods tested in the SAMT case studies are well established, some areas for
improvement and barriers for successful implementation remain.
LCA is the most comprehensive and robust method currently available to evaluate the environmental
impact of products over their value chain. Comprehensiveness and robustness were achieved over time by
countless methodological improvements and harmonisation initiatives since the early 1990s.
But as LCA developed it also became more complex and difficult to communicate. Complexity in LCA relates
to a number of methodological steps implicit in the methodology, such as the following aspects: (i) the
SAMT D2.2
15
system boundaries and cut/off criteria; (ii) the impact categories included; (iii) the impact methods and the
characterisation level – midpoints or endpoints –, and; (iv) the normalisation and weighting options.
This growing complexity led to a diversity of approaches that created the need for a standard (the ISO
14040 and 14044) and several international initiatives, such as the joint Life Cycle Initiative of the United
Nations Environment Program (UNEP) and the Society of Environmental Toxicology and Chemistry (SETAC;
2002), as well as the European Platform on LCA of the European Commission (European Commission,
2008), which contributed with relevant harmonisation works such as the International Reference Life Cycle
Data System - ILCD (JRC European Commission, 2010a).
However, despite all these harmonisation efforts LCA still lacks of a common, stable and univocal way of
conducting the analysis across all the possible implementations. Even when the ILCD guidelines are strictly
followed, in most cases the methodological choices and the assumptions that are usually done derive in
studies that are not comparable, even when performed on the same product or process. Therefore,
benchmarking the different industries, processes or products becomes challenging – particularly when
these have not the same function or serve the same purpose. This also holds for simplified LCA or one-
dimensional methods like CF or WF, even when the assessment is based on similar system boundaries and
cut-off criteria.
Besides, due to the fact that most assessments rely on indirect data retrieved from professional databases,
virtually all LCA-based studies lack of specific information on the geographical setting where the value chain
actors operate. This makes difficult to understand where the environmental impacts are taking place – or at
least are originated – and hampers the evaluation of the social impact of products, which to a large extent
is conditioned by local conditions where production is based. When considering geographic distribution of
the environmental impacts, an exception is the water footprint, for which characterization factors for
evaluating water scarcity even at watershed level are now available4. For both, water footprint and life
cycle assessment, ImpactWorld+5 is a new impact assessment method (still in the development phase),
which includes regionalized characterization factors for the following impact categories: respiratory effects,
human and ecosystem toxic impacts, ionizing radiations, water use, acidification, eutrophication and land
use. For these impact categories, characterization factors are available at the following spatial scales:
global, continental, country level and fine resolution (e.g. sub-watershed). These new methods are a step
towards inclusion of regionalized impacts within life cycle assessments.
The LCI results are also typically unaccompanied by information about the temporal course of the emission
or the resulting concentrations in the environment. The impacts that can be calculated under such
boundary conditions represent the sum of impacts from emissions released in the past, in the present and
even in the future, undermining the usability of these studies within an Environmental Risk Assessment
framework (Finnveden et al., 2009).
Since certain aspects of the WF are still under development, it will take some time before this method
reaches the same degree of diffusion and accomplishment of other methods such as e.g. CF. However,
4 see http://www.wulca-waterlca.org/project.html
5 http://www.impactworldplus.org/en/index.php

SAMT D2.2
16
currently available characterization factors for water footprint, together with the LCI databases that include
information on water balance and water consumption (Ecoinvent v3. & Quantis Water Database), already
enable WF assessments according to new ISO standard. Although the results might still include uncertainty,
WF assessment is already a useful method for indicating hotspots in the value chain and evaluating the
overall water balance of a product or a service (see also Boulay et al., 2015). For better diffusion of the
method within the process industries, further work and more process specific, averaged datasets with
water specific LCI data are required.
Although the WF is commonly represented aside with CF as an example of one dimensional assessment
method (focusing on water), it is important to note that these approaches include many differences,
especially when considering the complexity of the assessment and data needs. While CF consists of one
impact category (Global warming potential), the WF assessment by definition of the ISO14046 requires
assessing several impact categories that should be presented as a water footprint profile. The
comprehensive water footprint considers local (or if not available country specific or regional) aspects and
impacts whereas in CF, typically only global impacts to climate change are considered. However, while the
local aspects require more work, they potentially also increase the usability and significance of the results,
connecting the analysis to a real place where actual improvements could be identified and communicated
to a targeted audience.
According to the Joint Research Centre of the European Commission (2011), the exergy approach has some
particularities that should be acknowledged before implementation within a LCA framework. To begin with,
exergy value does not depend on the scarcity of the resource6, which makes this method inappropriate for
the characterisation certain impact categories such as resource depletion. Furthermore, the midpoint
method that is currently available, namely the Cumulative Exergy Extraction from the Natural Environment
(CEENE; Dewulf et al., 2007), does not consider the differences between the two main types of exergy
losses that are possible, namely those coming from solar energy or from the stock of minerals in the earth
(JRC European Commission, 2010b).
From a more practice-oriented perspective, the exergy method has specific requirements that make LCI
phase slightly more complicated than standard LCA. In the case of E-LCA, considering that this method
implies transforming inputs and outputs of a system into exergy units, a detailed knowledge on the exergy
content of every single operation unit is required. Similarly, the MIPS method requires that material inputs
are calculated for all elementary flows included in a given process. For some inputs this is done by using the
MIT factors. For integration in standard LCA a LCI method for Ecoinvent is available (Saurat and Ritthoff,
2013). Whenever such MIT factors or LCI-methods are not available for certain pre-treated flows, separate
life cycle modelling using the same MIPS methodology is necessary.
Compared to the S-LCA conducted as part of the integrated case study (see Appendix 1), the application of
LCA and MIPS went smoothly without significant issues. Overall, LCA and MIPS can be considered as most
mature and well-applicable methods.
6 Even if the last tonne of the resource is depleted, the exergy value remains the same.

SAMT D2.2
17
5.2 Costing methods
5.2.1 Value added
LCC is a well-established method too, as companies have the interest to understand the real structure of
costs and accurately quantify them, including those difficult to express in monetary form. There are a
number of procedures available to account for life cycle costs. Mostly, they differ on the way costs are
organised and classified. Depending on which is the purpose of the assessment, costs can for instance be
organised as (i) use, ownership and administration costs, or; (ii) engineering, manufacturing, distribution,
service, sales and refurbishment costs (Woodward, 1997). Perhaps, this aspect is the main advantage of
LCC in relation to standard accounting practice. More than unveiling hidden costs, LCC can be very useful to
understand the structure of costs over the entire value chain of a given product or process, contributing to
decision making within a management framework and helping to communicate results to a wider audience.
Costing methods are also the basis for the preparation of business cases and investment decisions.
But LCC and accounting in general have another important advantage in relation to environmental and
Social Impact Assessment (SIA) methods, namely that they only focus on one ‘impact category’. Similarly,
costing methods only rely on a single and simple to communicate – monetary – unit of measure.
Additionally, life cycle perspective is greatly enabled due to the fact that prices at any point of the value
chain already reflect the economic value generated upstream. Simply put, prices are a measure of the
accumulated value generated within previous transformations of any good, plus the original value of the
raw materials that were needed to build them. This explains why competitiveness is greatly conditioned by
the degree to which companies are able to optimise the value chain in which they operate. This single
characteristic is mostly alien to the environmental and social dimensions, which unless norms and
regulations are put in place, do not condition to the same degree the ability of companies to compete.
5.2.2 Existing barriers and areas for improvement
The empirical evidence collected in this study revealed that the two critical points in cost assessment are
the scoping phase – which costs to consider – and the evaluation of financial costs – including decisions on
the depreciation, amortisation, discount rates, etc. –.
The scoping phase is relevant in itself within a standalone LCC and also when considered in conjunction
with the environmental LCA or the S-LCA. Decisions in terms of what costs to consider are not necessarily
aligned with the decisions taken during the establishment of the system boundaries and cut-offs within an
environmental –or social – assessment. Sometimes, the inability to align these assessments is caused by the
lack of costing data for upstream processes, which may make it hardly possible to analyse certain life cycle
stages. But discrepancies can also be brought about the different relevance that specific value chain steps
and life cycle stages might have within the economic costing analysis in relation to the environmental one
or vice versa.
SAMT D2.2
18
The major challenge of the costing methods is the access to realistic value chain costs and prices. While
internal costs are usually well-known for existing products, costs and prices for up- and downstream
processes are often difficult to get hold of. This of course implies a degree of uncertainty when applying
methods like LCC. However, it is surely not unique to costing methods but rather to all methods that
consider a product’s/process’ entire life cycle. Moreover, for products in a development stage, future
investment and marketing costs have to be estimated. In general, for the appraisal of future costs, making
assumptions is inevitable and goes along with a degree of uncertainty. Another obstacle is the fact that
costs are typically subject to fluctuations, impacting in particular those results which are projected far into
the future.
Nevertheless, costing methods are per se the basis for the preparation of business cases and investment
decisions.
5.3 Social methods
5.3.1 Value added
In the last few years several international initiatives have enlarged the knowledge basis of life cycle
oriented approaches for SIA of products. These have put social well-being at the very heart of their
programs, seeking to enable socially-sustainable production and consumption by approaching the
evaluation of social sustainability with a similar outlook as environmental sustainability. Since the
publication of the Guidelines for Social Life Cycle of Products (UNEP-SETAC, 2009), S-LCA has emerged and
gained momentum as a methodology that is in line with the ISO 14040 and 14044 standards for LCA.
Both the methodologies that were tested in this case study are in line both with the UNEP-SETAC guidelines
as well as with the ISO standards for LCA. The availability of these methods is in itself a huge leap forwards
in relation to classical indicator-based SIA methods. These new LCA-compliant approaches allow for a
detailed characterisation of the social implications of all steps within the value chain of products, including
the potential positive benefits of products for consumers and local communities. Additionally, both
methods are structured in a stable but at the same time flexible way that allow for a certain degree of
freedom in terms of which type of assessment to conduct – whether quantitative or qualitative –, which
exact social dimensions to consider, and which level of aggregation of results is sought.
These methods, together with the growing availability of social databases, prove that systematically
accounting for social impacts along the value chain of products is increasingly possible, and that the
information provided by S-LCA in general can help stakeholders to effectively and efficiently engage to
improve social and socio-economic conditions of production and consumption by enabling organisations to
achieve greater knowledge on the social implications of their products.
SAMT D2.2
19
5.3.2 Existing barriers and areas for improvement
In comparison to the environmental and economic methods, S-LCA is still on its infancy. Despite the UNEP-
SETAC Guidelines for Social Life Cycle Assessment of Products (2009) represented a methodological turning
point, the practicalities of such approach have not been established yet. In this report we have assessed a
couple of initiatives that seek to advance in this direction, namely a draft version of the Social Metrics for
Chemical Products in their Applications by the World Business Council for Sustainable Development –
WBCSD (Coërs, 2015) and the Handbook for Product Social Impact Assessment by the Roundtable for
Product Social Metrics (PRé Sustainability and Roundtable for Product Social Metrics, 2016).
Although the WBCSD approach has not been published yet, it is already in a late phase of development. The
third version of the Roundtable for Product Social Metrics has been published at the beginning of 2016.
Both are data-intensive methods. In this case study we did some preliminary comparisons of both methods
and understand how S-LCA is developing in practice. Basing on this exercise, we detected several areas for
future improvement:
The main area for improvement relates to the selection of the stakeholders, impact categories and
subcategories, the social aspects to consider within each category/sub-category and the performance
indicators to be used. All these aspects seem to be a challenging issue within most implementations.
The UNEP-SETAC guidelines recognise two types of impact categories, Type 1 and 2, equivalent to the
midpoints and endpoints within an environmental LCA, respectively. But the two approaches that were
tested in this study – both of which base on the UNEP-SETAC guidelines – do not make any explicit
reference to Type 2 impact categories. This reflects on the fact that the performance indicators listed in
these approaches focus on inputs and outputs, rather than the final impacts of the product. The
delimitation of the second group of impact categories, which correspond to a model of the social impact
pathways to the impact endpoints such as e.g. human capital, cultural heritage and human well-being,
clearly seems to be an open issue for future research.
Similarly, neither of these frameworks seems to cover the exact same Type 1 impact categories mentioned
on the UNEP-SETAC guidelines, namely health and safety, human rights, working conditions, socio-
economic repercussions, cultural heritage and governance. Apparently they disregard the latter two.
However, despite including a different number of social topics, both approaches seem to be quite aligned
to each other in terms of the impact categories and sub-categories to focus on. The two methodologies
assess the same general topics, where the WBCSD guidance covers additional aspects that are of particular
relevance for the chemical sector. This is understandable if one considers that the impact categories/sub-
categories – and implicitly also the stakeholder groups – that are mostly affected by production vary across
sectors. And these two approaches mainly target the industrial sector.
Something similar occurs with the performance indicators. According to the UNEP-SETAC guidelines these
can be of any form, from quantitative, to semi-quantitative and qualitative indicators, depending of the
goal of the study and the nature of the issue at stake. The WBCSD approach relies on a semi-qualitative –
scale-based – indicator framework, whereas the Roundtable method leaves this decision up to the user,

SAMT D2.2
20
offering a scale-based assessment framework as an alternative to a quantitative analysis based on a
thorough list of performance indicators that is also provided. But as far as we are aware, all methods
foresee in general the aggregation to aggregated results but no method describes in details how to
combine different types of indicators in a single assessment yet. This is a potential drawback, considering
that social data are difficult to procure and frequently come from a variety of sources and with a variety of
formats.
All this implies that comparability across evaluations is greatly undermined by the diversity of approaches
which can be followed in the LCIA phase. If each implementation focuses on those impact categories and
subcategories with greater relevance and selects indicators being more pertinent for a given sector or
product, then the assessments will become hardly comparable.
The second area in the need of further harmonisation is the methodology used during the characterisation
phase. This refers to the step where data are aggregated from performance indicators – inventory results –
to a subcategory result and from subcategories results to an impact category result. Considering the variety
of indicators that can be used in this framework, normally some kind of scoring system based on
performance reference points is set up in order to decode the data. This is the approach proposed by the
Roundtable for Social Metrics. This step may also include some kind of weighting mechanism.
Therefore, considering that the characterisation phase involves the combination of different social aspects
into synthetic scores, the conceptual and practical limitations found are similar to those reported below for
the integrated methods. Additionally, the characterisation phase becomes even more complicated for
those products that potentially show a positive impact on any of the social topics – such as e.g.
pharmaceutical products –, in particular under a quantitative evaluation.
Altogether, there is a perceived need for further testing and harmonisation work before a common set of
characterisation mechanisms can be broadly accepted.
5.4 Integrated methods
5.4.1 Value added
Integrated methods have the intrinsic value added of combining more than one sustainability sphere
dimensions in one single assessment. These approaches allow practitioners and decision makers to
organise complex multi-dimensional information and data in a structured form. Potentially, this allows
achieving a good understanding of the environmental and/or economic and/or social negative impacts and
benefits in decision-making processes towards more sustainable products throughout their life cycle.
Furthermore, by providing a more comprehensive picture of the positive and negative impacts along the
product life cycle integrated approaches also help to clarify the trade-offs between the sustainability pillars,
life cycle stages and impacts considered in the analysis.
SAMT D2.2
21
The kind of eco-portfolios that have been produced in this study following the EEA and GP approaches can
support companies and value chain actors to identify weaknesses and effectively enable further
improvements of a product life cycle. In practice, both methods can be applied for strategic decisions,
product development, stakeholders and government engagement and marketing and customer relations,
among other purposes.
The EEA is a much consolidated approach that has been widely applied by BASF. Its goal is to quantify the
sustainability of products and processes under a sound scientific background using a modular design that
keeps arithmetic operations transparent and ensure intelligibility of the results. The method has been
updated on a regular basis since early 2000s, and the third generation will be shortly published. This new
version includes novel normalisation and weighting techniques, along with the possibility of adopting a
modular structure based on the selection of those environmental issues that contribute the most to the
overall environmental burden. Ecological and economic impacts are very simple to assign to causes under
this approach, which simplifies communication and enables customers and data suppliers to validate the
overall system. Finally, the results provide a scope for scenario assessments and discussions.
The eco-portfolio built on the concept of environmental productivity represents an alternative way of
looking at the eco-efficiency issue. The focus here is not so much on efficiency but on performance. In
comparison to eco-efficiency, total cost is replaced by productivity, which provides as a broader sense of
resource utility management than the concept of eco-efficiency, which focuses on total cost from a
customer’s point of view and ignores the potential revenues for companies. With the GP Index, companies
can compare economic and environment performance of processes at once. Since the objective of GP is
enhancing productivity and environmental performance simultaneously, it seems to be a good entry point
for the persuading companies to include the environmental perspective on their business agendas without
sacrificing the economic goals.
5.4.2 Existing barriers and areas for improvement
Simply put, integrated methods inherit all the drawbacks of the contributing methods. Additionally,
integrated methods have to deal with the intrinsic complexity of combining, synthesising and
communicating results by making use of multi-dimensional indices that, quite paradoxically, are frequently
expressed in a-dimensional units. The main criticism within this framework refers to the normalisation and
weighting steps.
The normalisation problem mainly relates to the criteria chosen to select the reference value. Two main
approaches are usually followed to decide on these reference values. One bases on the definition of a
national or international benchmark for comparison, either an average value or a target set by legislation.
This would be a compliance-oriented approach. The second one involves identifying business-oriented
reference values, these being specific targets set at the company level, product benchmarks or average
values for a given sector. This would be a performance-oriented normalisation approach.

SAMT D2.2
22
It goes without saying that each method has advantages and disadvantages. Each of them is suitable for
different applications and scopes. But, whenever different normalisation approaches or reference values
are applied, comparability across assessments is compromised.
The weighting issue is one of the most controversial points within impact assessments and multi-criteria
evaluations in general. Whenever a final multi-dimensional score is to be produced basing on aggregate
values, the mathematics implicit in its computation inevitably involves assigning weights to the contributing
sub-indices, either equal or different – if there is enough empirical basis for assigning dissimilar weights.
There are two known issues with weighting. First, as it combines performance indicators from different
natures, it is based on value choices and implicitly assumes that a decline in one category can be offset by
progress in another category, hiding potential trade-offs. Second, the structural relations established
among the different contributing sub-categories via the weighting system are normally not stable across
time and geographies, but can help systems on the other hand to be always up-to date and following
societal requirements. In particular, when weighting is done on the basis of public opinion polls or expert
knowledge, these tend to be mutable over time. This compromises backward comparability.
Although normalisation and weighting affect all methods, the limitations implicit to these techniques can
be particularly cumbersome for the methods that combine two – like the EEA and GP methods – or even
the three sustainability spheres, such as the LCSA. A combination of different systems can only be done on
the disaggregated level but enables on this basis the comparison of different weighting systems quite
easily. Communicating results for these methods can result particularly tricky, but enables readers on the
other hand a better understanding of complex sets of single results. Consequently a thorough reflection
should be done before deciding on the best way to deliver results, whether making use of synthetic scores
or delivering results in different categories, in particular in external communication.
5.5 Hybrid methods
5.5.1 Value added
Hybrid methods are a powerful tool for building scenarios and model complex and uncertain consequences
linked to technology development. By combining the LCA and an optimisation model, the LCAA method
tested in this case study is theoretically capable of representing hierarchical production and recovery
chains, their economic costs and their impact on the environment. LCAA can be thus used for e.g. a holistic
evaluation of new technologies, environmental strategies or policies. Additionally, varying the numerical
assumptions of the equilibrium model – and by varying the goals or the priorities parametrically –, LCAA
can be used to generate a set of scenarios to be presented to the decision makers (Freire and Thore, 2002).
5.5.2 Existing barriers and areas for improvement
Hybrid methods in general and the LCAA method in particular share four characteristics that potentially
undermine their usability within a business context:

SAMT D2.2
23
Firstly, most hybrid methods are based on some kind of linear programming interface that
increases their complexity – and therefore their implementation costs.
Secondly, hybrid methods and LCAA are data driven methods that cannot be easily adapted to
situations in which data availability or quality is low. Additionally, these models inherit much of the
drawbacks of their contributing methodologies. For instance, the economic analysis performed in
LCAA presumes that all the relationships between supply and demand are linear, leading to
potentially misleading assumptions on the elasticity of substitution of products. Similarly, all the
model calibration issues that are implicit in linear equilibrium models are also applicable to LCAA.
These include limitations like (i) the fact that calibration must absorb all the errors in the input
data; (ii) that the social accounting matrix is not always in equilibrium, and; (iii) that the number of
parameters defined through the calibration cannot be bigger than the number of equations in the
model.
Thirdly, many hybrid methods, such as LCAA, are purely quantitative approaches targeting the
environmental and economic dimensions, but lacking of specific social dimensions, which are not
easily covered using quantitative indicators. These include, e.g. human rights, transparency,
behavioural aspects, etc.
Fourthly, and most importantly, hybrid methods – including LCAA – are analytical frameworks that
were conceived and developed to be used at a decision level – the public sector – that is not the
one where most enterprises operate. Only the largest companies could probably feel the stimulus
to understand – and model – the potential economic-wide impacts of certain technologies or
products at sectoral or territorial levels.
5.6 Cross cutting issues
Besides the implementation challenges that are specific to each type of methods, there are a number of
cross-cutting issues that can potentially compromise the applicability of virtually all the methods tested in
our case studies. Barriers can be organised as midpoint and endpoint obstacles. The former include:
data availability and management issues;
diversity of tools (software etc.) for implementation, and;
methodological consistency of the impact assessment phase.
The latter include:
high implementation costs, and;
compatibility and comparability issues.
The critical phase of all these assessments, environmental, economic, social, and integrated and hybrid
alike is data availability. All the methods applied in our case studies rely on the collection of a large amount
of value chain data whose absence greatly compromises the overall quality of results. In this phase
collaboration from inside the company and suppliers is critical.

SAMT D2.2
24
Our experience tells that, depending on the assessment method and tool selected, sometimes the LCI
methodology does not allow to precisely trace-back data and know the exact source of information. Even
when the LCI stage is completed following a transparent and well documented protocol, for virtually all the
methods tested in this study additional work is still needed in order to harmonise the data collection
process across various implementations, in particular when it comes to accounting for the financial costs in
the LCC and the selection of performance indicators in the S-LCA.
Additionally, considering that supplier data are frequently unavailable, for a successful implementation of
most of these methods gaining access to a consistent database is an absolutely necessary step to fully
characterise the process chain. There are a number of environmental databases publicly available that can
be used to build consistent inventories. These provide a good documental basis for applying a vast range of
environmental impact assessment methods, including those tested in our case studies. Still, there seems to
be some difficulties to obtain updated datasets including targeted information, such as the mass flows and
exergy content needed to produce the inventories for MIPS and E-LCA methods.
The increased demand for water footprinting has created a need for data on water flows that traditionally
have not been available in the most common databases. Water balance and water consumption are
relevant for most water footprint assessment methods. Another inventory problem has been the need for
regionalised data and water functionality aspects such as quality. The updated version of EcoInvent (v3) is
an effort to create a comprehensive water database in LCA framework. In the new version, it is possible to
establish water balance for the unit process, and thus define water consumption needed in the water
footprint assessment. In addition, calculation of water embedded in the products has been added to all
EcoInvent products with mass. Quality issues are addressed by emission to water and resource use from
water. Another useful data source for WF assessments is the Quantis Water Database.
Costing data can also be retrieved from reliable international data repositories available for most sectors,
however, specific data and foremost those beyond a company’s gate may be difficult to access. In turn,
despite social databases are becoming growingly available (see e.g. Benoit-Norris et al., 2012), these do not
still have the same quality –i.e. level of disaggregation and accuracy – as the environmental and costing
datasets. Therefore, social data is mostly retrieved from a number of dispersed sources, which represents a
time consuming process dealing to sometimes inconsistent inventories.
Similarly, with the probable exception of standard-compliant LCA, the impact characterisation stage
continues to be an open issue for most of the methods tested in the SAMT case studies. This mostly relates
to the definition of widely accepted characterisation factors for each impact category. Additionally, in the
case of the S-LCA it also relates to the normalisation and weighting approaches followed to aggregate
results across the different stakeholder groups and social topics.
There simply seems to be a myriad of alternative impact assessment methods available to characterise
economic, social and environmental impacts, each being suitable for different goals. Although most
characterisation methods are documented and reported transparently, decisions on which method to use is
not always straightforward, in particular when different versions of the same methods exist or when more
than one seems appropriate for a specific implementation. Decisions taken at this point are crucial because

SAMT D2.2
25
they can also undermine backward comparability of the assessment in those cases when updates are
foreseen.
As mentioned, all these aspects create the need for further harmonisation work, in particular for those
methods that are less mature from a methodological perspective, particularly S-LCA. For the water
footprint assessment, (Water Use in LCA, working under the auspices of UNEP/SETAC Life Cycle Initiative)
has recently (Jan 2016), after a two-year consensus building process, made a recommendation of the
AWARE method to assess water consumption impact in LCA. These types of harmonization efforts would be
welcome for the other impact categories as well, and require participation across different industrial
sectors.
The first practical consequence of these constraints is that implementation costs may increase. This may
happen mainly for two motivations. The first one stems from the need to accomplish time-demanding
tasks, such as data collection and classification during the inventory phase – and it also includes commercial
data acquisition costs and licensing –. The second motivation reflects the fact that most of the sustainability
assessment methods, including those applied in the SAMT case studies, are complex enough to require
trained personnel – either in-house or external – to apply them, in particular during the impact assessment
phase.
The second practical consequence may arise when, as was done in these studies, a collaborative framework
for sustainability assessment is set up, including contributors from different organisations and professional
backgrounds. Such a distributed framework ensures a high degree of quality for the analyses done, for the
simple reason that more people supervise each step and each partner has to understand and validate the
work done by others in order to build his/her own contribution on a solid basis. However, these settings are
also almost inevitably linked to coordination issues that may arise while sharing inventory or impact data
across different software platforms and database versions. This challenge develops in two different strands:
Compatibility issues: Our implementation showed that the software tools that were used in the case
studies are not entirely compatible with the exchange formats available for sharing LCA datasets –
particularly with the ILCD standard, and/or some of the tools available for data exchange and
transformation did not seem to work properly. This created some degree of uncertainty on the extent to
which the analysis done by each contributor was based on the exact same data, impact methods and
assumptions. Ensuring analytical coherence across all the implementations entailed a good amount of
manual validation and extra work in comparison to centralised assessments.
Comparability issues - We identified two different types of comparability aspects to consider:
Vertical aspects: This refers to the comparability issues that emerged when different software tools
and database/model versions were used during the assessment. These issues were mostly
motivated by the use of different versions of the databases (e.g. Ecoinvent v 3 vs Ecoinvent v 2) and
impact characterisation models (e.g. CML-2001 vs CML-IA) that use slightly – sometimes drastically
– different approaches that imply different environmental burdens for each process. Vertical
comparability also refers to the hypothetical backward comparability issues that could emerge

SAMT D2.2
26
when deprecated methods or datasets are to be used in order to compare present results with
earlier assessments.
Horizontal aspects: These aspects relate to the adoption of different methodological options when
performing the sustainability analysis. For instance, this could be motivated by the way
multifunctional processes are modelled in a given database (e.g. attributional vs consequential), or
to the specific cut-off criteria that are set in each analysis.
When it comes to the non-technical aspects, perhaps the most common limitations of sustainability
assessment methods is the perceived lack of interest/demand by external stakeholders, including potential
customers and the general public alike. The information collected in our case studies, in particular within
the simulation questionnaires (see Appendix 3 to this report), shows that despite some of the companies
have invested a significant amount of resources and efforts in putting together sound sustainability
assessments and in-house tools, quite often the expectations in terms of customer acceptance for such
assessments and tools was eventually very limited. Therefore, a number of examples within the case
studies seem to suggest that some of the sustainability methods and tools have been designed with a
research perspective but are not very well aligned to the real needs of companies. This increased
perception that methods are over-dimensioned in relation to the real goals of businesses in relation to
sustainability assessment.
Joint initiatives supported by the administration and/or sectoral organizations have sometimes contributed
to fill this gap and reorient the focus to those sustainability aspects that seem more relevant for those
companies operating in a given value chain. Our case studies showed that EPDs and, more recently, Product
Environmental Footprints (PEFs) are amongst the initiatives with a largest pull in this respect. In some
sectors there are also specific tools – e.g. EPD CF calculators – that seem to be satisfying the growing need
for more fit-to-purpose analyses aimed sectoral benchmarking. Additionally, these tools are frequently less
demanding in terms of resources, including both data and expertise needed to achieve meaningful results.
Another relevant issue that has been identified in the case studies is the need for reinforced coordination
and joint action with other stakeholders active in the same value chain. This need stems from the fact that,
quite frequently, the sustainability assessments done identify potential hotspots and impacts that are
sometimes far upstream in relation to the specific stage where the company operates. This creates the
need for coordinated action along the entire value chain.
All considered, perhaps the main conclusion that can be drawn from this work is that any of the methods
evaluated within SAMT D2.1 and tested in the case studies can be considered as ”best practice” per se –
without taking into consideration other aspects related to how the method is specifically applied in
practice. In principle, all the methods applied in this study are capable of creating useful information for
different dimensions of sustainability. If the potential limitations of the methods are acknowledged and
documented, it is how the method is implemented in practice that creates the value, rather that the
theoretical and methodological characteristics of the methods themselves.

SAMT D2.2
27
6 Recommendations
This section provides some general recommendations based on the empirical evidence collected within our
case studies. These recommendations are only a first step towards the production of more consistent and
comprehensive recommendations that are envisaged for a later stage of project development (see the
following section for additional details).
The objective of this work is to support companies – in particular those in the process industry – in the
identification of “best practices” with respect to the implementation of sustainability assessment methods.
Therefore, we have organised recommendations focusing on the factors that in our experience condition a
successful implementation of the sustainability assessment methods for internal or external applications, in
particular within the process industry.
All considered, perhaps the main message to be delivered to process industries is that when deciding and
applying a sustainability assessment method they should pursue a balance between the specific needs and
the availability of resources and reliable data – at least for the key processes. Besides, industries should
also achieve a good understanding of the strengths and limitations of the different methods before
applying them.
A well-conceived goal
The most obvious – and perhaps most neglected – issue any practitioner must consider before deciding to
implement a particular sustainability assessment method is the need to define a well-conceived goal. This
not only relates to defining the expected main use for the assessment, such as to support management,
R&D, process development, marketing or product certification, but also to reflecting on the main
sustainability dimensions and environmental aspects to analyse, as well as on the possible evolution of the
sustainability aspects within each business sector, as claimed in the following point.
Work incrementally
If priorities are clear in terms of defining the aspects to be analysed and if these seem to be stable over
time, then the logical recommendation is to invest on those targeted methods that address those issues
more specifically. There are several fit-to-purpose assessment methods in place to evaluate the
sustainability on product and corporate level, respectively. Previous SAMT deliverables provide a good
overview of the existing alternatives and potential applicability of the existing methods in different contexts
(López et al., 2015; Saurat et al., 2015b).
In those situations where future sustainability priorities are unknown or strategic choices are quite broad,
the most logical choice would be to adopt a staged evaluation approach, prioritising those methods that
allow a modular implementation – e.g. full LCA + WF + MIPS –. Some of the methods tested in this study
prove that building an incremental knowledge on sustainability aspects is possible.
In most situations though, a comprehensive sustainability assessment may be required, but once the hot-
spots and reduction potentials are identified, it is usually reasonable to focus on certain aspects with most
potential or most significant impacts.

SAMT D2.2
28
Minimise risk
Another consideration relates to the resources that can be invested. Most of the methods tested in our
case studies are rather intensive in terms of their technical implications. Most of them require mastering
rather complicated concepts and causal mechanisms – either physical, like in the exergy method, financial,
like in the LCC, or social, like in the S-LCA method. Therefore, all the methods applied in our case studies
require trained personnel and a very good understanding on the process analysed. Furthermore, all the
methods entail collecting a significant amount of data.
All these factors may potentially undermine the attractiveness of these methods and have a direct impact
on implementation costs. Thus matching the technical / data requirements and the resources available for
implementation is essential for making good decisions. These aspects can be particularly challenging for
smaller companies, especially for SMEs. Whenever a reasonable compromise between the goals and the
resources available cannot be found internally, subcontracting specific parts or entire assessments should
be an option that companies could consider as the most cost-efficient choice.
Along these lines, a good practice identified in previous tasks of the SAMT project include cooperation
within the industry sector and for example organizing more thorough assessments jointly via industry
associations. Industry associations could further support companies in selecting the appropriate methods
for each application, including the interpretation and communication of results. This could for instance be
materialised in the form of harmonised industry recommendations on the sustainability dimensions to
consider, as well as the impact categories or characterisation models to be used, among other relevant
aspects.
Invest on sustainability
Our case studies help to show what sustainability means for a specific business or sector, and how to
address environmental, economic and social sustainability aspects. This is not only very valuable for
managing risks; it can also be a key factor for competitiveness.
Consider data availability
Data availability is in itself a major constraining factor. In our case study we used a number of data sources
from different origins. Like previously pointed out, there does not seem to be better alternative than using
direct data in order to characterise a given process or product over its entire life cycle (see SAMT D1.2 -
Saurat et al., 2015b). But the data issue is not just a matter of good choice. The lack of data also conditions
the feasibility of many assessments.
Although the environmental dimension can be assessed by making use of robust public databases, the
economic and especially the social dimensions cannot be properly characterised under a life cycle approach
unless direct data for all value chain actors can be accessed. This is an important aspect that should be
considered when opting for a specific sustainability method, or a combination of methods. If value chain
data cannot be retrieved from direct and indirect suppliers, comprehensive social and integrated
assessments can hardly be built.
SAMT D2.2
29
Work transparently
One of the factors that contribute the most to a successful and consistent result during the implementation
phase is transparency. Transparency should drive all the implementation stages, but in particular the
assumptions made for data acquisition during the inventory phase and the decisions made for the selection
of the characterisation methods, including the normalisation and weighting steps, should be clearly
reported. Transparency is not only important to ensure consistency of results, but – just as importantly – to
guarantee traceability and replicability across implementations. This aspect can have a paramount
importance if a given assessment is to be replicated, updated or completed by future developments.
Improve communication
Communication of results is one of the most important aspects to be accounted for when it comes to
selecting and applying sustainability assessment methods. Therefore, a relevant criterion to decide on
which method to apply should be the availability of good communication tools. These tools should make
possible to develop tailored messages to all types of audience. This is challenging, if one considers that
quite frequently the outcomes of sustainability assessment methods base on technical aspects that difficult
to communicate to non-experts. However, several of the methods applied in our case studies show that
finding innovative ways of communicating results that are both scientifically sound and understandable for
the general public is possible –but usually requires dedicated efforts. A good example is the eco-portfolio
based on the persons-day concept that can be built within the EEA method.
Involve value chain actors
Involving stakeholders, in particular value chain actors, has a very positive impact on the overall quality and
accuracy of the sustainability assessments. Involving stakeholders can be an advantage when it comes to
collecting realistic value chain data. Moreover, stakeholder involvement could also allow establishing a
shared understanding on the key sustainability challenges in the value chain. This could be a valuable basis
to foster up- and downstream partnerships and to define shared sustainability agendas.
The broader picture
So far we have reflected on some specific aspects that are potentially relevant for the direct users of the
sustainability assessment methods in order to decide on which methods to apply and how to apply them.
But the experience matured in our case studies has also provided lessons that show broader implications
for method developers and the scientific community in general. These can be summarised as follows:
Our practical experience emphasise the importance that previous harmonisation efforts like the ILCD and
PEF initiatives had for the refinement of several design aspects for a number of sustainability assessment
methods. These proved to be particularly relevant – and also successful – for the standardisation and
harmonisation of many LCA aspects. The ISO14046 for water footprint is a recent example of standard that
aims for harmonising the assessment of the water footprint.
It is thus desirable that similar initiatives that are now being carried forward for the S-CLA – UNEP-SETAC,
WBCSD, and the Roundtable for Product Social Metrics – and the more comprehensive LCSA – UNEP-SETAC

SAMT D2.2
30
– will yield similar results. Harmonisation initiatives need to be encouraged and supported by the scientific
community and the decision makers alike.
At a different level, we feel we are now in a phase where method harmonisation should reach a more
practical dimension. For example, we are convinced that there is a need for simpler and faster ways for
sharing information across the various sustainability tools that are currently available, in particular across
the different LCA platforms. In theory, this has already been achieved by means of the ILCD data exchange
formats, but in practice this is still far from being a reality.
There is also a need to place additional efforts in producing simpler but scientifically sound tools for
sustainability assessment. The experience with the numerous CF calculators that are currently available
tells that these tools can be both accurate and simple to be used. Additional resources should be invested
in delivering similar tools for other environmental, economic and social dimensions.
Similarly, it will be worthy to develop and use methods that can integrate all three dimensions for decision-
making following the principles of sustainability. But this should be done in a way that decision-makers can
use them in an easy way, making possible for non-experts as well to utilise different LCA methods assessing
different aspects of sustainability in a meaningful way.
In order to make all this happen there is clearly perceived need to improve data availability and quality for
the environmental, economic and especially for the social impact assessments. In particular, there is an
increasing need to improve aspects such as the temporal and spatial aspects within environmental
databases. Furthermore, although an initiative is already on its way, the social dimension is still lacking a
comprehensive life cycle-compliant database. These seem to be two areas where data production efforts
should be mostly placed in the years to come.

SAMT D2.2
31
7 Next steps
The analysis of the case studies, together with the results obtained from the previous tasks of the SAMT
project (in WP1 and WP2) continue in WP3, which will focus on cross-sectorial and sectorial applicability of
the methods. Additionally, the main goal of WP3 is to draft the final recommendations from the project
(based on all the previous steps and learnings), and to produce a roadmap and an implementation strategy
for developing and implementing consistent sustainability assessment methods for the process industries.
The findings from SAMT will also be reflected with the findings of the two other SPIRE 4 projects MEASURE
and STYLE. The roadmap, together with the final recommendations will be discussed at the final open
workshop that will be held together with the STYLE project in October. Gathering stakeholder input to the
produced final recommendations and roadmap is one of the goals of WP3.

SAMT D2.2
32
8 References
Ayres, R.U., Ayres, L.W., Mart??nas, K., 1998. Exergy, waste accounting, and life-cycle analysis. Energy 23, 355–363. doi:10.1016/S0360-5442(97)00076-5
Benoit-Norris, C., Cavan, D.A., Norris, G., 2012. Identifying social impacts in product supply chains: Overview and application of the social hotspot database. Sustainability 4, 1946–1965. doi:10.3390/su4091946
Boulay, A.-M., Motoshita, M., Pfister, S., Bulle, C., Muñoz, I., Franceschini, H., Margni, M., 2015. Analysis of water use impact assessment methods (part A): evaluation of modeling choices based on a quantitative comparison of scarcity and human health indicators. Int. J. Life Cycle Assess. 20, 139–160. doi:10.1007/s11367-014-0814-2
Coërs, P., 2015. Social Metrics for Chemical Products in their applications – A WBCSD guidance (draft) Report on the Project WBCSD Business Action in the Chemical Sector., in: LCM 2015 Bourdeaux. SOLVAY, Bordeaux.
De Meester, B., Dewulf, J., Verbeke, S., Janssens, A., Van Langenhove, H., 2009. Exergetic life-cycle assessment (ELCA) for resource consumption evaluation in the built environment. Build. Environ. 44, 11–17. doi:10.1016/j.buildenv.2008.01.004
Dewulf, J., Bösch, M.E., Meester, B. De, Vorst, G. Van der, Langenhove, H. Van, Hellweg, S., Huijbregts, M.A.J., 2007. Cumulative Exergy Extraction from the Natural Environment (CEENE): a comprehensive Life Cycle Impact Assessment method for resource accounting. Environ. Sci. Technol. 41, 8477–8483. doi:10.1021/es0711415
Dewulf, J., Van Langenhove, H., Muys, B., Bruers, S., Bakshi, B.R., Grubb, G.F., Paulus, D.M., Sciubba, E., 2008. Exergy: Its Potential and Limitations in Environmental Science and Technology. Environ. Sci. Technol. 42, 2221–2232. doi:10.1021/es071719a
EC, 2009. SEC(2009) 92 - Impact Assessment Guidelines.
European Commission, 2008. European Platform on Life Cycle Assessment [WWW Document]. URL http://eplca.jrc.ec.europa.eu/
Finnveden, G., Hauschild, M.Z., Ekvall, T., Guinée, J., Heijungs, R., Hellweg, S., Koehler, A., Pennington, D., Suh, S., 2009. Recent developments in Life Cycle Assessment. J. Environ. Manage. 91, 1–21. doi:10.1016/j.jenvman.2009.06.018
Freire, F., Thore, S., 2002. Life Cycle Activity Analysis: an integrated environmental and economic mathematical programming decision-support model, in: Comprehensive Economic and Spatial Bio-Energy Modeling. Serie A: Options Méditerranéenes. CIHEAM, pp. 91–101.
Hur, T., Kim, I., Yamamoto, R., 2004. Measurement of green productivity and its improvement. J. Clean. Prod. 12, 673–683. doi:10.1016/j.jclepro.2003.08.004
JRC European Commission, 2010a. General guide for Life Cycle Assessment - Detailed guidance, International Reference Life Cycle Data System (ILCD) Handbook. European Commission - Joint Research Centre - Institute for Environment and Sustainability. doi:10.2788/38479

SAMT D2.2
33
JRC European Commission, 2010b. Analysing of existing Environmental Impact Assessment methodologies for use in Life Cycle Assessment, International Reference Life Cycle Data System (ILCD) Handbook. European Commission - Joint Research Centre - Institute for Environment and Sustainability.
JRC European Commission, 2011. Recommendations for Life Cycle Impact Assessment in the European context, International Reference Life Cycle Data System (ILCD) Handbook. European Commission - Joint Research Centre - Institute for Environment and Sustainability. doi:10.278/33030
Kounina, A., Margni, M., Bayart, J.-B., Boulay, A.-M., Berger, M., Bulle, C., Frischknecht, R., Koehler, A., Milà i Canals, L., Motoshita, M., Núñez, M., Peters, G., Pfister, S., Ridoutt, B., van Zelm, R., Verones, F., Humbert, S., 2013. Review of methods addressing freshwater use in life cycle inventory and impact assessment. Int. J. Life Cycle Assess. 18, 707–721. doi:10.1007/s11367-012-0519-3
Laner, D., Rechberger, H., De Soete, W., De Meester, S., Astrup, T.F., 2015. Resource recovery from residual household waste: An application of exergy flow analysis and exergetic life cycle assessment. Waste Manag. 46, 653–667. doi:10.1016/j.wasman.2015.09.006
López, A., Mabe, L., Sanchez, B., Tapia, C., Alonso, A., 2015. Best practice solutions: Methods for sustainability assessment within the process industries. SAMT Project, Deliverable 1.1, Project report. SAMT Project. Funded by the EU under FP7-SPIRE. Grant Agreement No. 636727, Bilbao, Spain.
Maes, D., Passel, S. Van, Van Passel, S., 2014. Advantages and limitations of exergy indicators to assess sustainability of bioenergy and biobased materials. Environ. Impact Assess. Rev. 45, 19–29. doi:10.1016/j.eiar.2013.11.002
PRé Sustainability and Roundtable for Product Social Metrics, 2016. Handbook for Product Social Impact Assessment. Version 3.0. PRé Consultants and Roundtable for Product Social Metrics, Amersfoort, The Netherlands.
Saling, P., Kicherer, A., Dittrich-Krämer, B., Wittlinger, R., Zombik, W., Schmidt, I., Schrott, W., Schmidt, S., 2002. Eco-efficiency analysis by basf: the method. Int. J. Life Cycle Assess. 7, 203–218. doi:10.1007/BF02978875
Saurat, M., Ritthoff, M., 2013. Calculating MIPS 2.0. Resources 2, 581–607. doi:10.3390/resources2040581
Saurat, M., Ritthoff, M., Pihkola, H., Alonso, A., López, A., 2015a. Description of current industry practice and definition of the evaluation criteria. SAMT Project, Deliverable 1.2.
Saurat, M., Ritthoff, M., Smith, L., 2015b. Overview of existing sustainability assessment methods and tools, and of relevant standards. SAMT Project, Deliverable 1.1.
Sell, I., Ott, D., Kralisch, D., 2014. Life Cycle Cost Analysis as Decision Support Tool in Chemical Process Development. ChemBioEng Rev. 1, 50–56. doi:10.1002/cben.201300007
Szargut, J., 2005. Exergy Method: Technical and Ecological Applications, Developments in Heat Transfer (Book 18). WIT Press.
UNEP-SETAC, 2002. Life Cycle Initiative of the United Nations Environment Program (UNEP) and the Society of Environmental Toxicology and Chemistry (SETAC) [WWW Document]. URL http://www.lifecycleinitiative.org/
UNEP-SETAC, 2009. Guidelines for Social Life Cycle Assessment of Products. UNEP/SETAC Life Cycle

SAMT D2.2
34
Initiative.
Woodward, D.G., 1997. Life cycle costing-Theory, information acquisition and application. Int. J. Proj. Manag. 15, 335–344. doi:10.1016/S0263-7863(96)00089-0

SAMT D2.2
9 Appendices
Specific case study reports are included as appendices to this main report. Each case study is reported in its
own report. The appendices include the following three reports:
Integrated case study – Appendix 1
Water footprint case study – Appendix 2
Simulation methods – Appendix 3