sustainable energy using anaerobic digestion of by ... · pdf filebiomass drying. distilleries...
TRANSCRIPT

Department of Mechanical and Aerospace Engineering
Sustainable Energy using Anaerobic Digestion of
By-Products:
Islay Whisky Industry Case Study
Author: Lynsey Duguid
Supervisor: Dr. Paul Strachan
A thesis submitted in partial fulfilment for the requirement of the degree
Master of Science
Sustainable Engineering: Renewable Energy Systems and the Environment
2016

Copyright Declaration
This thesis is the result of the author’s original research. It has been composed by the
author and has not been previously submitted for examination which has led to the
award of a degree.
The copyright of this thesis belongs to the author under the terms of the United
Kingdom Copyright Acts as qualified by University of Strathclyde Regulation 3.50.
Due acknowledgement must always be made of the use of any material contained in,
or derived from, this thesis.
Signed: Date: 31st August 2016

3
Abstract
A study was conducted into the feasibility of centralised anaerobic digestion (AD)
plants creating biogas from whisky by-products on the isle of Islay. It looked at
pumping of the by-products from all 8 distilleries to the central location as an alternative
to transporting via truck to the sea discharge point. A range of scenarios were
considered, which involved a mixture of combined heat and power units and biogas
boilers. Some scenarios consider the feasibility of complementing the biogas with
biomass drying.
Distilleries have a high thermal demand and mostly use fossil fuels. The aim of the
study was to investigate what proportion of this could be offset with energy derived
from anaerobic digestion of their own by-products in order to reduce greenhouse gas
emissions, as well as provide a renewable source of energy.
A literature review was conducted and experts consulted to gather the data required for
the analyses. A range of scenarios were defined and modelled in Excel to analyse the
potential for energy savings as well as environmental and financial feasibility.
It was found that around 30% of the whisky distilleries total energy requirements can
be met with individual AD plants providing biogas for combustion in biogas boilers.
However a central AD plant opens up further opportunities to include other available
feedstocks for increase of biogas yield, as well as biomass drying which can then
provide 100% of the distilleries thermal requirements. Biomass in this case is used as
thermal energy ‘storage’ in the same way the electricity grid is used as electrical
storage, which allows supply and demand matching. In every case it was shown that
subsidies are required for financial feasibility. Without them, long payback periods
result.
The results highlight the importance of designing for a technological solution rather
than financial gain. In most if not all cases in the UK, AD plants use CHP systems as
until now, FIT has yielded the highest profits. This provides very little renewable
thermal energy, which is often what is highest in demand.
4
Acknowledgements
I would like to thank Neil Phillips and Robert Kennedy for their invaluable technical
inputs, not to mention the numerous industrial contacts they provided.
I would also like to thank all the lecturers of Renewable Energy Systems and the
Environment for delivering such an extensive course, with special thanks going to Dr.
Paul Tuohy, the course director and Dr. Paul Strachan, my supervisor for this project.
Finally, I would like to thank all of my friends and family who have encouraged me
throughout the year, helping me pursue my dreams of a sustainable future.
Especially Wendy.

5
Table of Contents
Abstract .......................................................................................................................... 3
Acknowledgements ........................................................................................................ 4
List of Figures ................................................................................................................ 7
List of tables ................................................................................................................... 8
Abbreviations ............................................................................................................... 10
1.0 Project Introduction ......................................................................................... 11
1.1 Background .................................................................................................. 11
1.2 Aim and Objectives ...................................................................................... 12
1.3 Approach ...................................................................................................... 13
2.0 Literature Review............................................................................................. 14
2.1 Anaerobic Digestion Background ................................................................ 14
2.2 The Process of Anaerobic Digestion ............................................................ 18
2.3 Suitable Feedstocks ...................................................................................... 19
2.4 Biogas .......................................................................................................... 20
2.5 Digestate ...................................................................................................... 21
2.6 Biomethane from Biogas ............................................................................. 21
2.7 Types of Digester ......................................................................................... 22
2.8 Digester Operation ....................................................................................... 23
2.9 Typical Energy Outputs ............................................................................... 26
2.10 Biomass to Complement AD ....................................................................... 27
2.11 Incentive Schemes ....................................................................................... 29
2.12 UK AD Industry Overview .......................................................................... 33
2.13 AD use in the Whisky Industry .................................................................... 35
3.0 Islay Study ....................................................................................................... 38
3.1 Islay General Info ........................................................................................ 38
3.2 Islay Whisky ................................................................................................ 39
3.3 Available Feedstocks on Islay ..................................................................... 47
3.4 AD System Selection for Islay ..................................................................... 48
3.5 Location ....................................................................................................... 49
4.0 Analysis............................................................................................................ 54
4.1 Energy Analysis Values ............................................................................... 54
4.2 Financial and Environmental Analysis Values ............................................ 58

6
4.3 Scenario 1 – Heat Only ................................................................................ 67
Technical Configuration ....................................................................................... 67
Energy Analysis and Results ................................................................................ 67
Financial and Environmental Analysis Results .................................................... 70
Discussion ............................................................................................................. 71
4.4 Scenario 2 – CHP On-Site, Heat at Distilleries ........................................... 72
Technical Configuration ....................................................................................... 72
Energy Analysis and Results ................................................................................ 72
Financial and Environmental Analysis Results .................................................... 75
Discussion ............................................................................................................. 77
4.5 Scenario 3 – Optimisation of Biomass Drying ............................................ 78
Technical Configuration ....................................................................................... 78
Energy Analysis and Results ................................................................................ 78
Financial and Environmental Analysis Results .................................................... 80
Discussion ............................................................................................................. 82
4.6 Scenario 4 – Optimised Biomass with CHP On-Site ................................... 83
Technical Configuration ....................................................................................... 83
Energy Analysis and Results ................................................................................ 83
Financial and Environmental Analysis Results .................................................... 85
Discussion ............................................................................................................. 87
4.7 Scenario 5 - Individual AD Plants ............................................................... 88
Technical Configuration ....................................................................................... 88
Energy Analysis and Results ................................................................................ 88
Financial and Environmental Analysis Results .................................................... 89
Discussion ............................................................................................................. 91
4.8 Comparison of Scenario Results .................................................................. 93
5.0 Discussions ...................................................................................................... 96
5.1. Technical ...................................................................................................... 96
5.2. Environmental .............................................................................................. 96
5.3. Financial ....................................................................................................... 97
5.4. Social ............................................................................................................ 97
5.5. Critical Evaluation ....................................................................................... 99
6.0 Conclusions .................................................................................................... 100
7.0 Further Work .................................................................................................. 101

7
References .................................................................................................................. 102
Appendices ................................................................................................................. 112
Appendix A: Energy Values .................................................................................. 112
Appendix B: By-Product Quantities ...................................................................... 114
Appendix C: Energy Analysis Calculations .......................................................... 116
List of Figures
Figure 1 – Islay Distillery Map .................................................................................... 11
Figure 2 – Sketch of AD Process ................................................................................. 18
Figure 3 – Biogas Yield Vs HRT: Draff ...................................................................... 24
Figure 4 – Biogas Yield from TS Content: Draff ........................................................ 25
Figure 5 – Example of Mesophilic Biogas Yields from Piggery Wastes .................... 25
Figure 6 – Biomass Calorific Value & Density Vs Moisture Content ........................ 28
Figure 7 – Cumulative Commissioned Installed AD Capacity UK ............................. 34
Figure 8 – UK AD Plants by Feedstock ...................................................................... 35
Figure 9 – Isle of Islay Location .................................................................................. 38
Figure 10 – Annual Whisky Production V Thermal Energy Requirements ................ 41
Figure 11 – Annual Whisky Production V Electrical Energy Requirements .............. 43
Figure 12 – Distillery Energy Demands ...................................................................... 44
Figure 13 – Annual Draff Weight V Whisky Production ............................................ 45
Figure 14 – Annual Pot Ale Volume V Whisky Production ....................................... 46
Figure 15 – Map of Distilleries and Pipe Routes ......................................................... 50
Figure 16 – Efficiencies of Edina CHP Unit ............................................................... 55
Figure 17 – Biogas Required for 500kWe CHP Unit .................................................. 56
Figure 18 – Energy Crop Energy Yield per Hectare .................................................... 58
Figure 19 – Fuel Oil Prices 2006 - 2015 ...................................................................... 59
Figure 20 – AD Plant Capital and Running Costs ....................................................... 61
Figure 21 – Scenario 1 Concept Schematic ................................................................. 67
Figure 22 – Scenario 1 Energy Outputs V Requirements ............................................ 68
Figure 23 – Scenario 1 Proposed Solution Schematic ................................................. 69
Figure 24 – Scenario 2 Concept Schematic ................................................................. 72
Figure 25 – Scenario 2: Energy Outputs V Requirements ........................................... 74

8
Figure 26 – Scenario 2 Proposed Solution Schematic ................................................. 75
Figure 27 – Scenario 3 Concept Schematic ................................................................. 78
Figure 28 – Scenario 3 Energy Required for Biomass Drying .................................... 79
Figure 29 – Scenario 4 Schematic ............................................................................... 83
Figure 30 – Scenario 4 Energy Required for Biomass Drying .................................... 84
Figure 31 – Comparison of Energy Reductions ........................................................... 93
Figure 32 – Comparison of GHG Emissions and Land Required ............................... 94
Figure 33 – Comparison of Capital and Payback Period ............................................. 95
Figure 34 – Total Energy Demand V Annual Whisky Production ............................ 112
Figure 35 – Electrical Demand V Annual Whisky Production.................................. 113
Figure 36 – Thermal Demand V Annual Whisky Production ................................... 113
Figure 37 – Draff Mass V Whisky Production .......................................................... 114
Figure 38 – Pot Ale Volume V Whisky Production .................................................. 115
List of tables
Table 1 – Outline of Scenarios ..................................................................................... 13
Table 2 – Summary of Anaerobic Digestion History .................................................. 16
Table 3 – Summary of AD Process.............................................................................. 18
Table 4 – FIT Rates...................................................................................................... 30
Table 5 – RHI Rates ..................................................................................................... 31
Table 6 – Islay Population Distribution ....................................................................... 38
Table 7 – Whisky Production ...................................................................................... 40
Table 8 – Thermal Demand Estimations: Islay Distilleries ......................................... 42
Table 9 – Boiler Capacity Requirements ..................................................................... 42
Table 10 – DECC Size of Electrical Consumer ........................................................... 44
Table 11 – Yearly Draff Weight Estimations for Islay Distilleries ............................. 45
Table 12 – Yearly Pot Ale Volume Estimations for Islay Distilleries ......................... 46
Table 13 – Distances between Distilleries to Central Location ................................... 50
Table 14 – Dry Matter of Slurry from Each Distillery ................................................ 51
Table 15 – Power and Energy Requirements for Pumping Feedstock. ....................... 53
Table 16 – Biogas Yield Summary .............................................................................. 54
Table 17 – Energy Available Summary ....................................................................... 54

9
Table 18 – Digestate Yields Summary ........................................................................ 54
Table 19 – Scenario 2 Summary (CHP outputs) .......................................................... 56
Table 20 – Consumables Costs .................................................................................... 58
Table 21 – AD Plant Costs........................................................................................... 60
Table 22 – Biogas Boiler Costs ................................................................................... 62
Table 23 – Biomass Boiler Costs ................................................................................. 62
Table 24 – CHP System Costs ..................................................................................... 63
Table 25 – Rising Main Pump System Costs............................................................... 64
Table 26 – CO2 Values used in Calculations ............................................................... 64
Table 27 – Land Area Requirement ............................................................................. 66
Table 28 – Scenario 1 Energy Output Summary ......................................................... 67
Table 29 – Scenario 1 Financial and Environmental Analysis Results ....................... 70
Table 30 – Scenario 1 Results Summary ..................................................................... 70
Table 31 – Scenario 2 Energy Output Summary ......................................................... 73
Table 32 – Scenario 2 Financial and Environmental Analysis Results ....................... 75
Table 33 – Scenario 2 Results Summary ..................................................................... 76
Table 34 – Scenario 3 Biomass Optimisation Summary ............................................. 79
Table 35 – Scenario 3 Sugar Beet Requirements ......................................................... 80
Table 36 – Scenario 3 Financial and Environmental Analysis Results ....................... 80
Table 37 – Scenario 3 Results Summary ..................................................................... 81
Table 38 – Scenario 4 Biomass Optimisation Summary ............................................. 84
Table 39 – Scenario 4 Sugar Beet Requirement .......................................................... 85
Table 40 – Scenario 4 Financial and Environmental Analysis Results ....................... 85
Table 41 – Scenario 4 Results Summary ..................................................................... 86
Table 42 – Individual AD Plant Energy Outputs (CHP) ............................................. 88
Table 43 – Percentage of Demand Met (Biogas Boilers) ............................................ 89
Table 44 – Scenario 5a Financial and Environmental Analysis Results ..................... 89
Table 45 – Scenario 5a Results Summary ................................................................... 90
Table 46 – Scenario 5b Financial and Environmental Analysis Results ..................... 90
Table 47 – Scenario 5b Results Summary ................................................................... 91
Table 48 – Scenario Key .............................................................................................. 93
Table 49 – Energy Figures from Past Study .............................................................. 112
Table 50 – Draff figures from past study ................................................................... 114
Table 51 – Pot ale figures from past study ................................................................ 115

10
Abbreviations
AD Anaerobic Digestion
ADBA Anaerobic Digestion and Bioresources Association
CCL Climate Change Levy
CH4 Methane
CHP Combined Heat and Power
CO2 Carbon Dioxide
CO2e Carbon Dioxide Equivalent
COD Chemical Oxygen Demand
CSTR Continuous-flow Stir Tank Reactor
DECC Department of Energy and Climate Change
FIT Feed-In Tariff
GHA Glasgow Housing Association
GHG Greenhouse Gas
HRT Hydraulic Retention Time
IET Islay Energy Trust
mc Moisture Content
Ofgem The Office of Gas and Electricity Markets
RHI Renewable Heat Incentive
RO Renewables Obligation
ROC Renewables Obligation Certificate
RTFC Renewable Transport Fuel Certificate
RTFO Renewable Transport Fuel Obligation
TS Total Solids
UASB Upflow Anaerobic Sludge Blanket
VFA Volatile Fatty Acid
11
1.0 Project Introduction
1.1 Background
With the continued increase in energy demand and resulting depletion of fossil fuels,
along with global commitments to reducing greenhouse gas (GHG) emissions comes
an inherent interest in the development of low carbon technologies which utilise
renewable resources such as solar, geothermal or tidal. Switching from fossil fuel to
renewable energy sources has the desired effect of cutting down GHG emissions whilst
also securing an infinite energy supply.
Energy can also be produced from waste or by-products which if left unused, may also
contribute towards GHG emissions or cause other environmental issues. For example
food waste sent to landfill decomposes and emits methane gas; this GHG is 21 times
more potent than carbon dioxide. If collected and treated with anaerobic digestion
(AD), biogas can be created for use in the same way as natural gas; to produce heat or
power, or both. Through combustion, the methane is burnt and only the remaining
carbon dioxide is therefore released to atmosphere, reducing GHG emissions,
increasing energy supply and also reducing landfill.
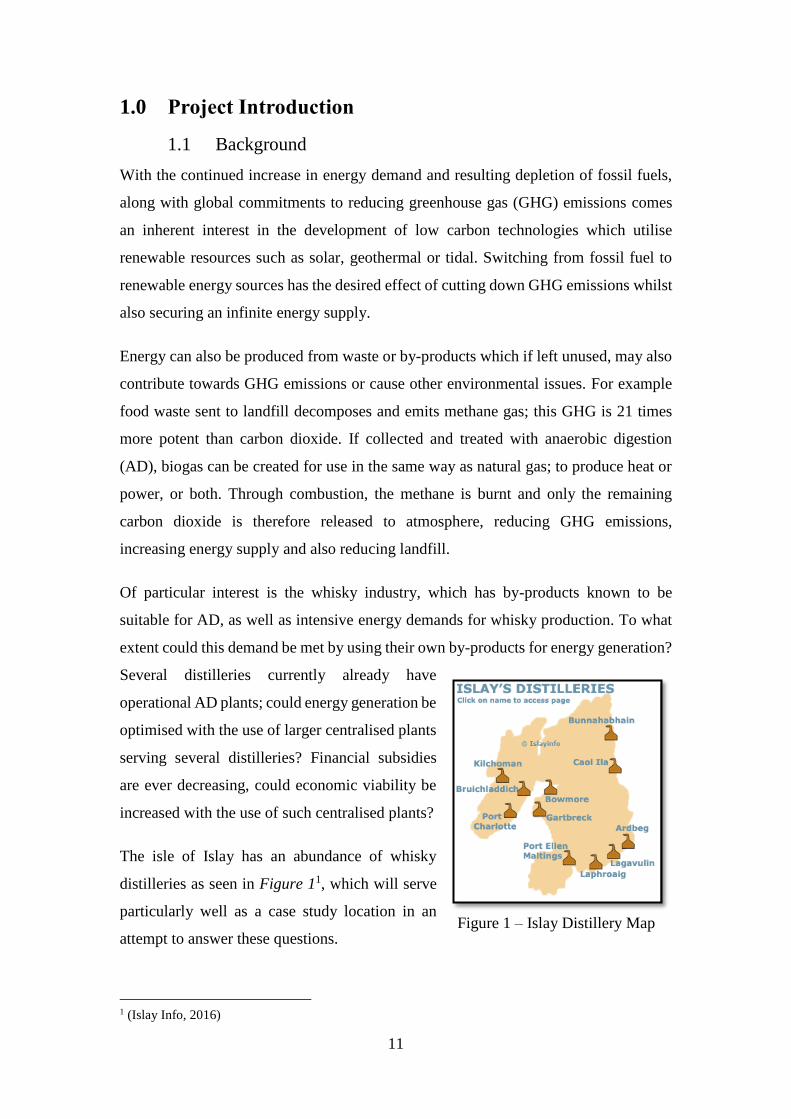
Of particular interest is the whisky industry, which has by-products known to be
suitable for AD, as well as intensive energy demands for whisky production. To what
extent could this demand be met by using their own by-products for energy generation?
Several distilleries currently already have
operational AD plants; could energy generation be
optimised with the use of larger centralised plants
serving several distilleries? Financial subsidies
are ever decreasing, could economic viability be
increased with the use of such centralised plants?
The isle of Islay has an abundance of whisky
distilleries as seen in Figure 11, which will serve
particularly well as a case study location in an
attempt to answer these questions.
1 (Islay Info, 2016)
Figure 1 – Islay Distillery Map

12
1.2 Aim and Objectives
Aim
To investigate a range of scenarios for providing sustainable energy from a central AD
plant to meet the energy demands of whisky distilleries on Islay by anaerobic digestion
of their own by-products as a base feedstock.
Objectives
To investigate
The percentage of distillery energy demand which could be met with
anaerobic digestion of their by-products;
Optimisation of biogas production with additional available feedstocks;
The potential to include a local supply of biomass as a complementary
renewable energy supply as a demand matching solution;
Environmental benefits of a range of scenarios;
Financial feasibility of a range of scenarios;
The implications of reduction in subsidies, i.e. the extent to which subsidies
are relied upon in this field.

13
1.3 Approach
1. Literature review of the topic of anaerobic digestion.
2. Review of Islay to identify key details relevant to the study.
3. Scenario investigations as outlined in Table 1. To fulfil objectives, the following
results will be analysed:
Percentage of energy provision;
GHG emissions reduction;
Percentage of land use change;
Capital investment required;
Payback period.
4. Discuss results individually as well as overall.
5. Draw conclusions in relation to the project aim.
No On-Site CHP On-Site CHP
Bio
gas
for
use
at
dis
till
erie
s Scenario 1
Heat Only
Scenario 2
CHP On-site, Heat at
Distilleries
Bio
gas
use
d
to d
ry w
ood
chip
Scenario 3
Optimisation of Biomass
Store On-site
Scenario 4
Optimised Biomass with
CHP On-site
Scenario 5 Individual AD Plants at each Distillery
Table 1 – Outline of Scenarios

14
2.0 Literature Review
2.1 Anaerobic Digestion Background2
Anaerobic Digestion is a process which occurs naturally with the decaying of organic
matter, for example in landfill sites or marshes, releasing gases to the atmosphere.
However this process can also be carefully controlled and the resulting gases (biogas)
contained in order to prevent the release to atmosphere, with the biogas being used to
generate energy; both heat and power. This is an alternative to energy production from
fossil fuels, with other benefits including landfill volume and greenhouse gas (GHG)
reduction.
The technology has been in use for many years, with the variety of uses increasing over
time as different issues become more prominent. This forces the implementation of
legislation which drives the need to find solutions, with AD proving to be viable in
many cases.
Benefits of AD
GHG reduction – Although there is still a release of carbon dioxide to the
atmosphere, the methane is captured and can be converted to useful energy
which results in an overall emissions reduction.
Waste reduction – if suitable organic waste and by-products are treated through
AD, then it will contribute towards landfill volume reduction.
Less contamination of water/soil – for example in the case of agricultural slurry
being applied directly to the land as fertiliser, this can cause contamination of
nearby water sources and the soil if it is applied in great quantities. Additionally,
this reduces unpleasant odours.
Less reliance on the grid (electricity or gas) – if on-site AD is used to generate
energy, then less energy needs to come from the grid. This has the double
benefit of adding income in the form of reduced energy bills and also payments
in the form of renewables subsidies.
2 Section 2.1 general references:
(O'Kiely, Korres, West, & Benzie, 2013)
(Williams, 2005)
(Wheatley, 1990)
(Van Brakel, 1980)
(Demuynck, 1984)
15
AD Barriers
Food Vs fuel – as with many renewable energy systems, the issue of food
versus fuel arises. If it is more financially beneficial to grow energy crops
rather than food crops then farmers may switch, potentially putting a strain on
food supplies.
Reliance on long-term contracts – If feedstock is supplied by a 3rd party then it
requires long-term contracts for security over the life of the system. This may
be hard to secure, which adds risk to potential projects.
Subsidy changes – Government subsidies change fairly regularly which
introduces further risks to projects in the planning phase. It can take up to 18
months to plan, install and commission a project and it is only at the point
after commissioning, when a physical grid connection is made, that the
operator is securely tied into the subsidy scheme at the rate at which the
financial analysis will have been made against.
General issues for smaller plants – A meeting with Glasgow Housing
Association (GHA) highlighted several other issues such as;
o Site selection – this can be made difficult due to need for space for
storage of feedstock, smells and noise.
o Logistics – if relying on many small collections of waste, it is difficult
to organise the collections and could be costly.
o There may not be a use for heat on-site which reduced the potential
benefits.
16
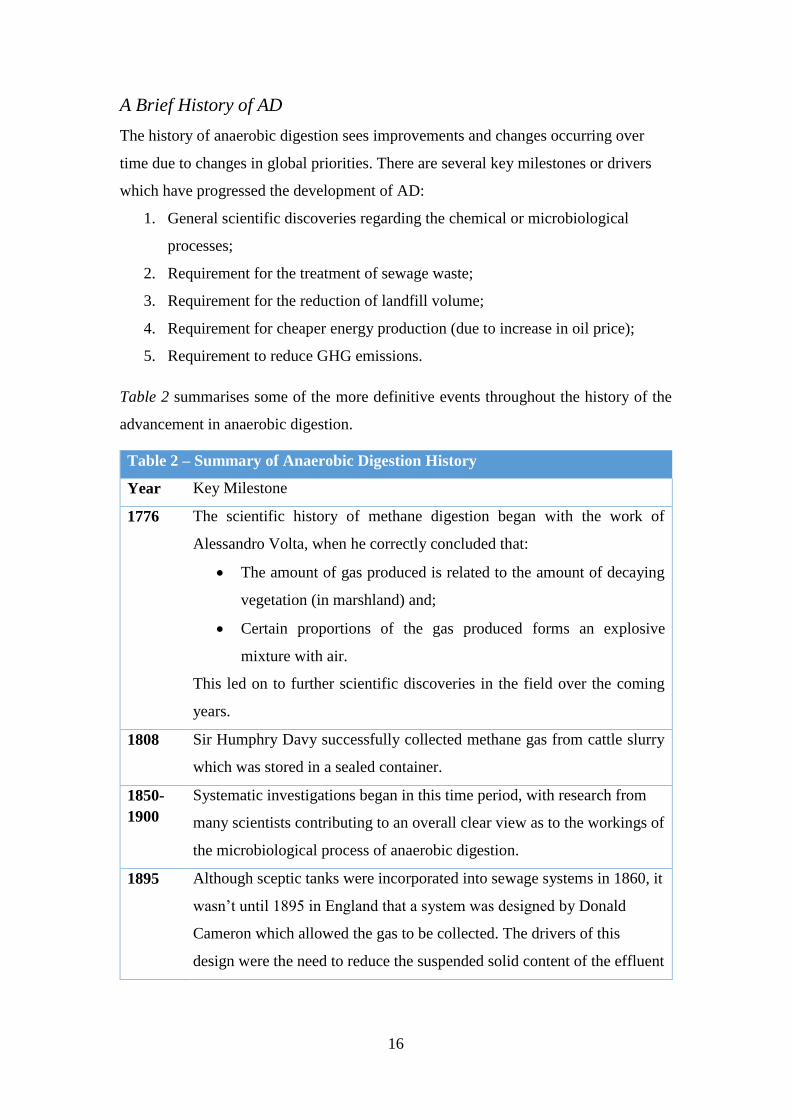
A Brief History of AD
The history of anaerobic digestion sees improvements and changes occurring over
time due to changes in global priorities. There are several key milestones or drivers
which have progressed the development of AD:
1. General scientific discoveries regarding the chemical or microbiological
processes;
2. Requirement for the treatment of sewage waste;
3. Requirement for the reduction of landfill volume;
4. Requirement for cheaper energy production (due to increase in oil price);
5. Requirement to reduce GHG emissions.
Table 2 summarises some of the more definitive events throughout the history of the
advancement in anaerobic digestion.
Table 2 – Summary of Anaerobic Digestion History
Year Key Milestone
1776 The scientific history of methane digestion began with the work of
Alessandro Volta, when he correctly concluded that:
The amount of gas produced is related to the amount of decaying
vegetation (in marshland) and;
Certain proportions of the gas produced forms an explosive
mixture with air.
This led on to further scientific discoveries in the field over the coming
years.
1808 Sir Humphry Davy successfully collected methane gas from cattle slurry
which was stored in a sealed container.
1850-
1900
Systematic investigations began in this time period, with research from
many scientists contributing to an overall clear view as to the workings of
the microbiological process of anaerobic digestion.
1895 Although sceptic tanks were incorporated into sewage systems in 1860, it
wasn’t until 1895 in England that a system was designed by Donald
Cameron which allowed the gas to be collected. The drivers of this
design were the need to reduce the suspended solid content of the effluent
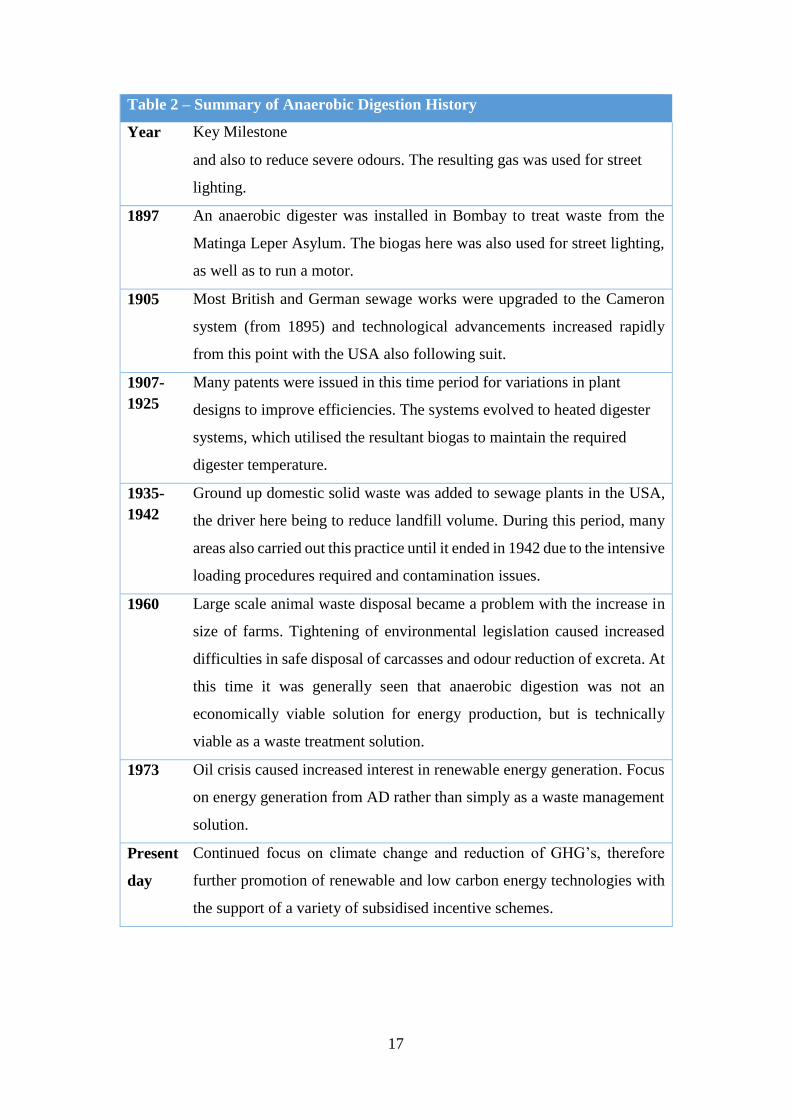
17
Table 2 – Summary of Anaerobic Digestion History
Year Key Milestone
and also to reduce severe odours. The resulting gas was used for street
lighting.
1897 An anaerobic digester was installed in Bombay to treat waste from the
Matinga Leper Asylum. The biogas here was also used for street lighting,
as well as to run a motor.
1905 Most British and German sewage works were upgraded to the Cameron
system (from 1895) and technological advancements increased rapidly
from this point with the USA also following suit.
1907-
1925
Many patents were issued in this time period for variations in plant
designs to improve efficiencies. The systems evolved to heated digester
systems, which utilised the resultant biogas to maintain the required
digester temperature.
1935-
1942
Ground up domestic solid waste was added to sewage plants in the USA,
the driver here being to reduce landfill volume. During this period, many
areas also carried out this practice until it ended in 1942 due to the intensive
loading procedures required and contamination issues.
1960 Large scale animal waste disposal became a problem with the increase in
size of farms. Tightening of environmental legislation caused increased
difficulties in safe disposal of carcasses and odour reduction of excreta. At
this time it was generally seen that anaerobic digestion was not an
economically viable solution for energy production, but is technically
viable as a waste treatment solution.
1973 Oil crisis caused increased interest in renewable energy generation. Focus
on energy generation from AD rather than simply as a waste management
solution.
Present
day
Continued focus on climate change and reduction of GHG’s, therefore
further promotion of renewable and low carbon energy technologies with
the support of a variety of subsidised incentive schemes.

18
2.2 The Process of Anaerobic Digestion3
As Figure 2 shows, organic material known as the feedstock is fed into the anaerobic
digester which is air tight so as to prevent the presence of oxygen. Within the digester,
a four stage chemical process occurs as summarised in Table 3.
Figure 2 – Sketch of AD Process
Table 3 – Summary of AD Process
Stage Stage Name Description
1 Hydrolysis This first stage sees complex polymers such as proteins,
fats, cellulose and carbohydrates broken down into
solution.
2 Acidogenesis At this stage, acidogenic bacteria further break down the
simple monomers, creating volatile fatty acids (VFAs),
ammonia, CO2 and hydrogen sulphide.
3 Acetogenesis Here, acetogens digest the products of stage two to
produce acetic acid, which releases CO2 and hydrogen.
4 Methanogenesis In the final stage of the process, methanogenes or
‘methane formers’ convert the products of the previous
three stages into biogas which is typically made up of
around 60% methane and 40% carbon dioxide.
3 Section 2.2 general references:
(NNFCC, 2009)
19
The direct outputs of this process are biogas and digestate which both have uses as
described in the following sections. It is also possible to further process biogas into
biomethane, which has its own uses again.
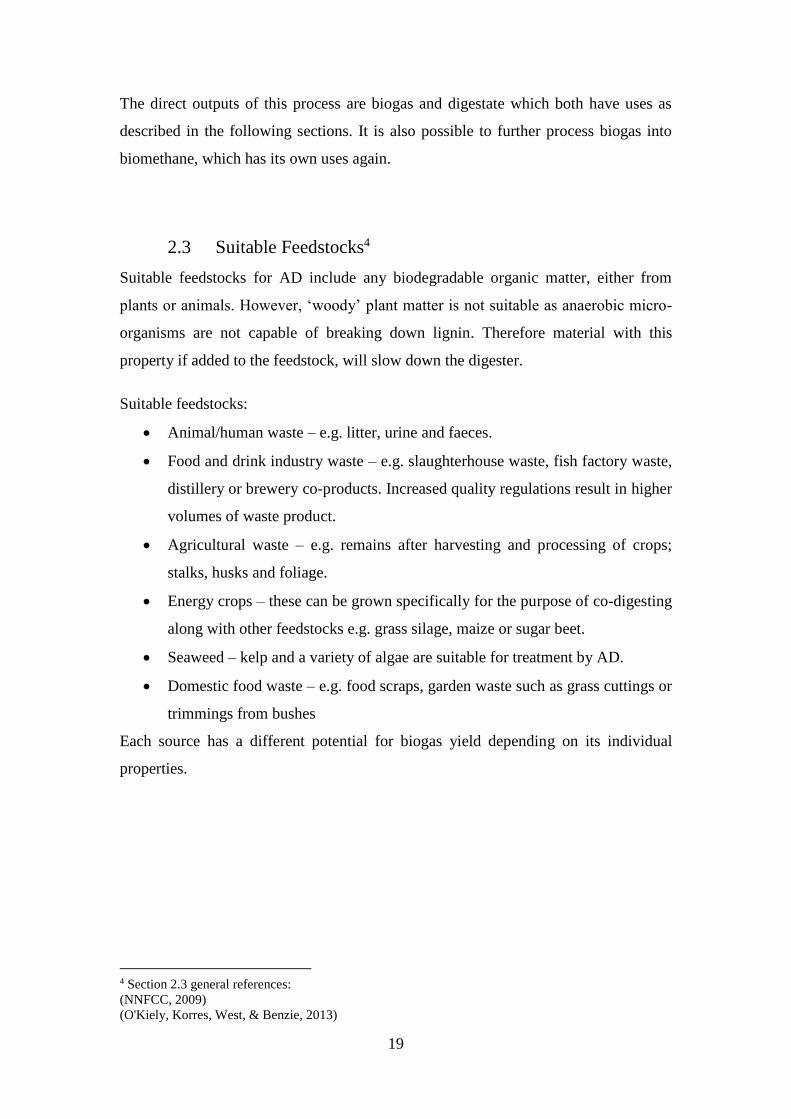
2.3 Suitable Feedstocks4
Suitable feedstocks for AD include any biodegradable organic matter, either from
plants or animals. However, ‘woody’ plant matter is not suitable as anaerobic micro-
organisms are not capable of breaking down lignin. Therefore material with this
property if added to the feedstock, will slow down the digester.
Suitable feedstocks:
Animal/human waste – e.g. litter, urine and faeces.
Food and drink industry waste – e.g. slaughterhouse waste, fish factory waste,
distillery or brewery co-products. Increased quality regulations result in higher
volumes of waste product.
Agricultural waste – e.g. remains after harvesting and processing of crops;
stalks, husks and foliage.
Energy crops – these can be grown specifically for the purpose of co-digesting
along with other feedstocks e.g. grass silage, maize or sugar beet.
Seaweed – kelp and a variety of algae are suitable for treatment by AD.
Domestic food waste – e.g. food scraps, garden waste such as grass cuttings or
trimmings from bushes
Each source has a different potential for biogas yield depending on its individual
properties.
4 Section 2.3 general references:
(NNFCC, 2009)
(O'Kiely, Korres, West, & Benzie, 2013)
20
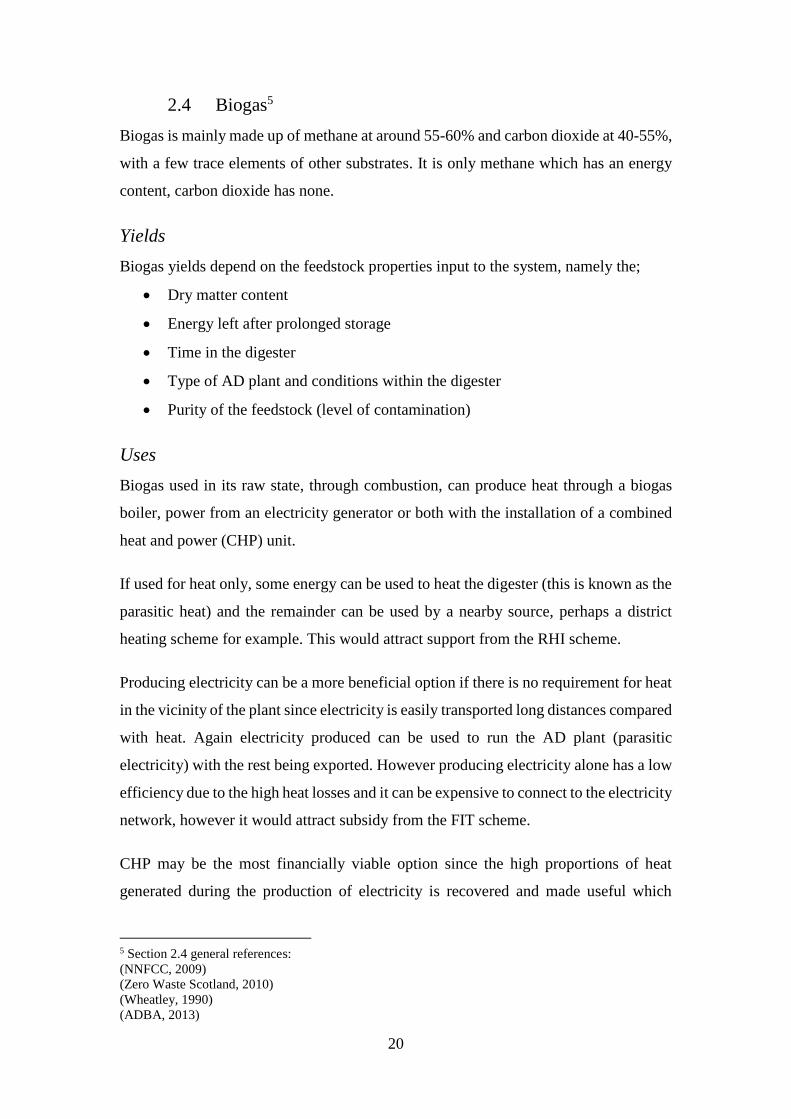
2.4 Biogas5
Biogas is mainly made up of methane at around 55-60% and carbon dioxide at 40-55%,
with a few trace elements of other substrates. It is only methane which has an energy
content, carbon dioxide has none.
Yields
Biogas yields depend on the feedstock properties input to the system, namely the;
Dry matter content
Energy left after prolonged storage
Time in the digester
Type of AD plant and conditions within the digester
Purity of the feedstock (level of contamination)
Uses
Biogas used in its raw state, through combustion, can produce heat through a biogas
boiler, power from an electricity generator or both with the installation of a combined
heat and power (CHP) unit.
If used for heat only, some energy can be used to heat the digester (this is known as the
parasitic heat) and the remainder can be used by a nearby source, perhaps a district
heating scheme for example. This would attract support from the RHI scheme.
Producing electricity can be a more beneficial option if there is no requirement for heat
in the vicinity of the plant since electricity is easily transported long distances compared
with heat. Again electricity produced can be used to run the AD plant (parasitic
electricity) with the rest being exported. However producing electricity alone has a low
efficiency due to the high heat losses and it can be expensive to connect to the electricity
network, however it would attract subsidy from the FIT scheme.
CHP may be the most financially viable option since the high proportions of heat
generated during the production of electricity is recovered and made useful which
5 Section 2.4 general references:
(NNFCC, 2009)
(Zero Waste Scotland, 2010)
(Wheatley, 1990)
(ADBA, 2013)
21
brings the overall efficiency up to around 80% or above and attracts both FIT and RHI
together. CHP is the most common use of biogas in AD plants in the UK.
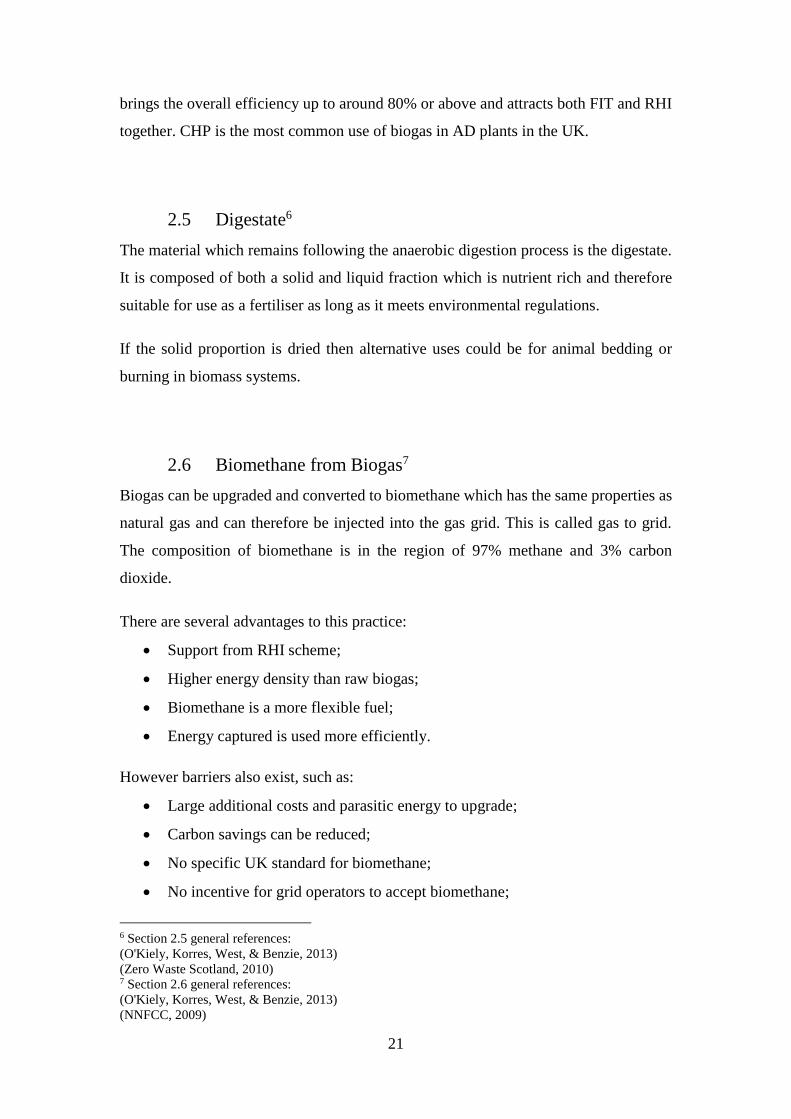
2.5 Digestate6
The material which remains following the anaerobic digestion process is the digestate.
It is composed of both a solid and liquid fraction which is nutrient rich and therefore
suitable for use as a fertiliser as long as it meets environmental regulations.
If the solid proportion is dried then alternative uses could be for animal bedding or
burning in biomass systems.
2.6 Biomethane from Biogas7
Biogas can be upgraded and converted to biomethane which has the same properties as
natural gas and can therefore be injected into the gas grid. This is called gas to grid.
The composition of biomethane is in the region of 97% methane and 3% carbon
dioxide.
There are several advantages to this practice:
Support from RHI scheme;
Higher energy density than raw biogas;
Biomethane is a more flexible fuel;
Energy captured is used more efficiently.
However barriers also exist, such as:
Large additional costs and parasitic energy to upgrade;
Carbon savings can be reduced;
No specific UK standard for biomethane;
No incentive for grid operators to accept biomethane;
6 Section 2.5 general references:
(O'Kiely, Korres, West, & Benzie, 2013)
(Zero Waste Scotland, 2010) 7 Section 2.6 general references:
(O'Kiely, Korres, West, & Benzie, 2013)
(NNFCC, 2009)
22
Gas grid may be too far away for connection.
There are several processes which biogas can go through in order to remove the high
CO2 content such as membrane separation, chemical scrubbing, water scrubbing and
pressure swing adsorption8. Rather than injecting the biomethane into the grid, in this
form it is also suitable as a form of biofuel for transportation. Both of these options
offer low carbon alternatives to fossil fuels.
2.7 Types of Digester9
There are 3 main types of digester in operation:
Batch
In a batch digester, all feedstock is added at one time together with active anaerobic
bacteria. Gas production is slow at first, eventually peaking before ceasing altogether.
At this point the digester is mostly emptied; a small amount is left in which provides
the required bacteria for the next batch.
The problem with this system is that biogas cannot be continuously supplied unless
several digesters are operated together in stages. However it is a simple system to
operate in that feedstock can be loaded with basic equipment such as tractor shovels,
rather than having a need to be continuously loaded at a set rate with controlled
equipment.
Continuous-flow Stirred Tank (CSTR)
In a continuous flow digester, a wet slurry of fresh feedstock is continually (or
frequently in smaller batches) added to the digester, with an equal proportion of biogas
being produced at the same time. The waste is stirred by gassing and thermal
convections. This is the most common type of digester found on farms.
8 (Ricardo-AEA, 2015) 9 Section 2.7 general references:
(Wheatley, 1990)
(Demuynck, 1984)

23
Upflow Anaerobic Sludge Blanket (UASB)
Also known as a ‘high rate’ digester, these can be used for feedstocks with a very low
percentage of total solids, for example waste water treatment or pot ale from a distillery.
As there is a lack of solid matter for the bacteria to settle on, filters with a large surface
area are used near the top of the tank for microbial attachment. The feedstock is passed
through the filter and thus is digested by the bacteria.
This method achieves quicker production of biogas, which means a smaller tank is
required. However the process is more temperamental so requires more control and fast
reactions to issues. It also prevents the possibility to expand the range of feedstocks in
the future.
2.8 Digester Operation10
The main factors affecting digester operation/design are as follows:
Hydraulic Retention time (HRT)
The hydraulic retention time is the average length of time which the feedstock remains
in the digester to produce optimum levels of biogas. This value is important when
deciding the digester volume. In general, a tank will be sized relating to the HRT to
obtain around 85% of the biogas yield. This is because beyond this point, only a small
amount more biogas could be gained with a much larger tank requirement due to the
extended HRT. An example is shown in Figure 3 which is a plot of biogas yield of draff
over a 31 day period11. The three plots give biogas yields in litres per kg of total
substrate weight (total starting weight of the draff sample), litres per kg of total solids
and litres per kg of organic total solids.
10 Section 2.8 general references:
(Wheatley, 1990)
(Demuynck, 1984) 11 (Schmack Biogas, 2007)

24
Figure 3 – Biogas Yield Vs HRT: Draff
The red line shows the 85% yield point at an HRT of 11 days, with the peak at around
28 days. This is almost 3 times the length of time for only 15% additional yield, which
would require a digester of three times the volume.
If the HRT used to design the digester is too low, then aside from a less economical
yield of biogas production, neither may it provide enough time to lower odours and
pathogens etc.
Total Solids (TS)/Total Organic Solids (TOS) in the Feedstock
The gas production depends on TS/TOS in the feedstock, therefore this characteristic
must also be considered when designing the digester. Figure 4 shows values which
correspond to the previous HRT graph12. It shows that in a sample of draff, 21.7% of
the original substance weight is dry matter, or total solids. It then shows that the gas
yield is 628 litres/kg of total solids after 31 days.
12 (Schmack Biogas, 2007)

25
Figure 4 – Biogas Yield from TS Content: Draff
Depending on the type of system being employed, it will have an optimum load rate in
kg of dry matter per day. This value, along with the characteristics from Figure 4 above
can be used to calculate the optimum digester size and biogas yields expected.
Temperature Range in the Digester
The process of AD is successful, with useful biogas yields across a wide temperature
range of around 15-65°C. This overall range can be split into two groups of optimum
temperature ranges, the mesophilic range (around 25-40°C) and thermophilic range
(around 50-65°C).
Figure 5 – Example of Mesophilic Biogas Yields from Piggery Wastes
At lower digester temperatures, it is possible to optimise the biogas yield by increasing
the HRT and as previously discussed, this means increasing the size of the digester. i.e.
it is the rate of production which is affected by temperature as opposed to the total
volume produced.
26
In a mesophilic digester, production will drop off above the 45°C mark, however if the
temperature is increased further then thermophilic bacteria can become established
above 50°C.
Thermophilic digestion produces gas at a higher rate due to the acceleration of the
hydrolysis phase. The benefit of a thermophilic digester is therefore that the HRT is
reduced and a smaller digester possible. The downside is that due to the increase in rate
of activity, the whole process is more sensitive to change which requires more rigorous
monitoring and control.
2.9 Typical Energy Outputs13
The energy output from biogas depends on the methane content and also the efficiency
of the system employed (i.e. electricity generation, heat or CHP etc.).
The calorific value of methane14 is typically 36MJ/m3. 1kWh is the same as 3.6MJ,
therefore 1m3 of methane contains 10kWh of energy. So from this it is possible to
calculate the total theoretical energy output from a given volume of biogas, depending
on proportion of methane within it.
Supposing the biogas is being combusted in a CHP system, since this is the most
common use, at 80% efficiency it would be expected that around 8kWh of energy will
be output from each cubic metre of methane in the form of both heat and electricity.
The specification of the CHP unit will determine the exact numbers, but typically it
would be expected that around 35-40% is converted to electricity, with 40-45% as heat
and the remainder lost to inefficiencies throughout the process.
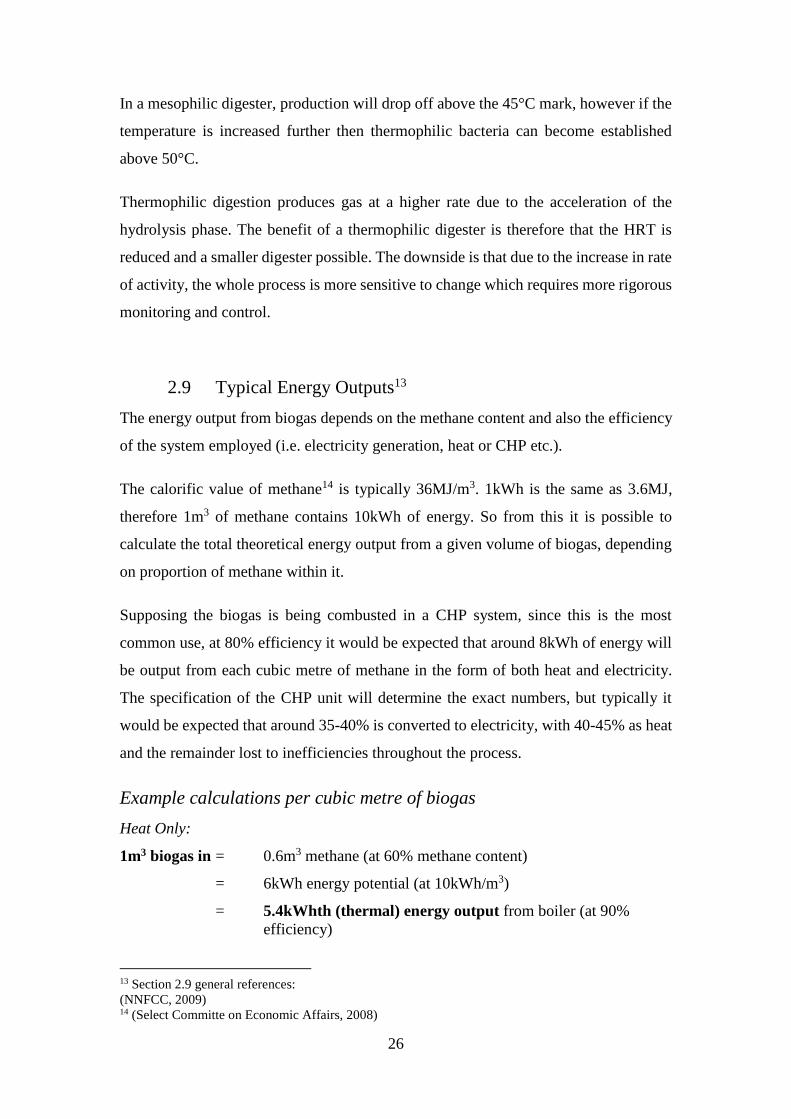
Example calculations per cubic metre of biogas
Heat Only:
1m3 biogas in = 0.6m3 methane (at 60% methane content)
= 6kWh energy potential (at 10kWh/m3)
= 5.4kWhth (thermal) energy output from boiler (at 90%
efficiency)
13 Section 2.9 general references:
(NNFCC, 2009) 14 (Select Committe on Economic Affairs, 2008)

27
Electricity Only:
1m3 biogas in = 0.6m3 methane (at 60% methane content)
= 6kWh energy potential (at 10kWh/m3)
= 2.1kWhe electrical energy output from generator (at 35%
efficiency)
CHP:
1m3 biogas in = 0.6m3 methane (at 60% methane content)
= 6kWh energy potential (at 10kWh/m3)
= 4.8kWh useful energy output from CHP (at 80% efficiency)
= 2.1kWhe and 2.7kWhth (at 35% and 45% efficiencies
respectively)
2.10 Biomass to Complement AD
As previously discussed, biogas is not easily stored so if there is not a use for heating
on site then it may not be a financially viable project. Upgrading to biomethane provides
an option, but this is expensive and feasibility would have to be investigated on an
individual basis.
An additional option could be to complement the AD system with a biomass drying
unit which would provide a use for the heat generated and also another form of
renewable energy supply which attracts RHI.
When biomass is first felled, it has around a 50% moisture content (mc), i.e. if it weighs
1000kg, then it will contain 500kg of wood and 500kg of water. To burn biomass with
such a high moisture content is very inefficient as a proportion of the energy is being
wasted in the act of evaporating the excess water. Therefore it is best practice to dry the
timber before using as a fuel. The calorific value of the wood increases linearly with
the decrease in moisture content15 as per Figure 6.
15 (Biomass Energy Centre, 2016)

28
Figure 6 – Biomass Calorific Value & Density Vs Moisture Content
In general, a moisture content of 25% is what should be aimed for to use in a biomass
boiler. It is an expensive practice to actively dry wood, therefore in the majority of cases
it is left for a season or perhaps a year until adequately dried. However if there is a
cheap source of heating then it can become profitable, for example in the case of an
anaerobic digestion plant. If the available thermal energy supply is known, then it is
possible to calculate the capacity of wood which can be dried and at what rate.
Biomass is more easily stored compared with biogas. It can also be brought on and
offline as and when heating is a requirement in contrast with biogas having to be used
as it is produced since it cannot be stored.
Short rotation coppicing is a sustainable way to produce biomass where fast growing
tree species are cut to the stump to encourage numerous new stems to grow in the
following season. It is a well-established practice in the UK, with both poplar and
willow being the principal species used. Willow is the more commonly used of the two,
due to the robustness of growth in harsh conditions as well as the dense growth per
hectare.
Willow can be harvested into rods, billets or chips. Harvesting rods involves cutting the
willow at the base, producing rods of up to 8m in length. Billet harvesting uses the same
cutting method, but proceeds to cut the rods into shorter lengths. Direct chip harvesting
uses a wood chipper which directly chips the willow rods once cut and blows it into a
trailer. Problems occur with direct chip harvesting when the wood chip is left to
0
200
400
600
800
1000
1200
0
2
4
6
8
10
12
14
16
18
20
22
0% 5% 10% 15% 20% 25% 30% 35% 40% 45% 50% 55% 60% 65%
De
nsity k
g/m
3
Ne
t ca
lorific v
alu
e G
J/t
Moisture content %
Net calorific value of biomass vs. moisture content
Wood NetCV GJ/t
Softwooddensitykg/m3
29
naturally dry. Due to the higher density, less air can flow leading to high temperatures
occurring within the pile which leads to decomposition and even combustion.
Decomposition results in reduced calorific value, with the mould produced during this
process presenting health hazards. Therefore direct chip harvesting should ideally be
force dried rather than naturally dried over a season. Studies have shown that it is not
economical in the majority of cases to actively dry woodchip unless there is an abundant
source available16.
2.11 Incentive Schemes
The following sections give a brief description of the schemes in the UK which serve
the AD industry, including any changes which have been announced over the last year
which could affect future growth.
Feed-In Tariff (FIT)
The feed-in tariff scheme pays the producer of renewable and low-carbon energy a
predefined price per kWh of energy generated. It was introduced by the government to
encourage the installation of smaller scale projects due to the high capital costs
required. It pays both a rate for electricity generated, as well as a separate rate for excess
electricity which is exported back to the grid17. In addition to these two sources of
income, energy bills are also reduced due to the lesser need to import from the grid.
Table 4 shows the current rates18 which apply to projects commissioned by 30th June
2016, as well as the proposed rates which will take effect from 2017. The proposed
rates come as a result of a government consultation on revising the FIT scheme,
proposing a cap on AD plant capacity of 500kW with degression rates for smaller plants
of 27%19.
This will have a negative impact on the growth of the industry and as ADBA state in
their July 2016 Market Report, the pipeline of applications could fill the AD cap up to
16 (Biomass Energy Centre, 2016) 17 (Ofgem, 2016) 18 (Ofgem e-serve, 2016) 19 (DECC, 2016)

30
2019 which would mean that operators will not be able to apply FIT for pre-
accreditation from 201820.
Table 4 – FIT Rates
System Size
Category
Current Rate
(p/kWh)
Proposed from 1st
Jan 2017 (p/kWh)
0 – 250kW 8.21 5.98
250 – 500kW 7.58 5.52
>500kW 7.81 0.00
Export Tariff 4.91 4.91
Renewables Heat Incentive (RHI)
The renewables heat incentive scheme is similar to the FIT but based on heat generated
rather than electricity, and there is no (efficient) way to export heat therefore the tariff
is for generation only. Eligible projects receive quarterly payments at a set rate for 20
years relative to the amount of heat generated21.
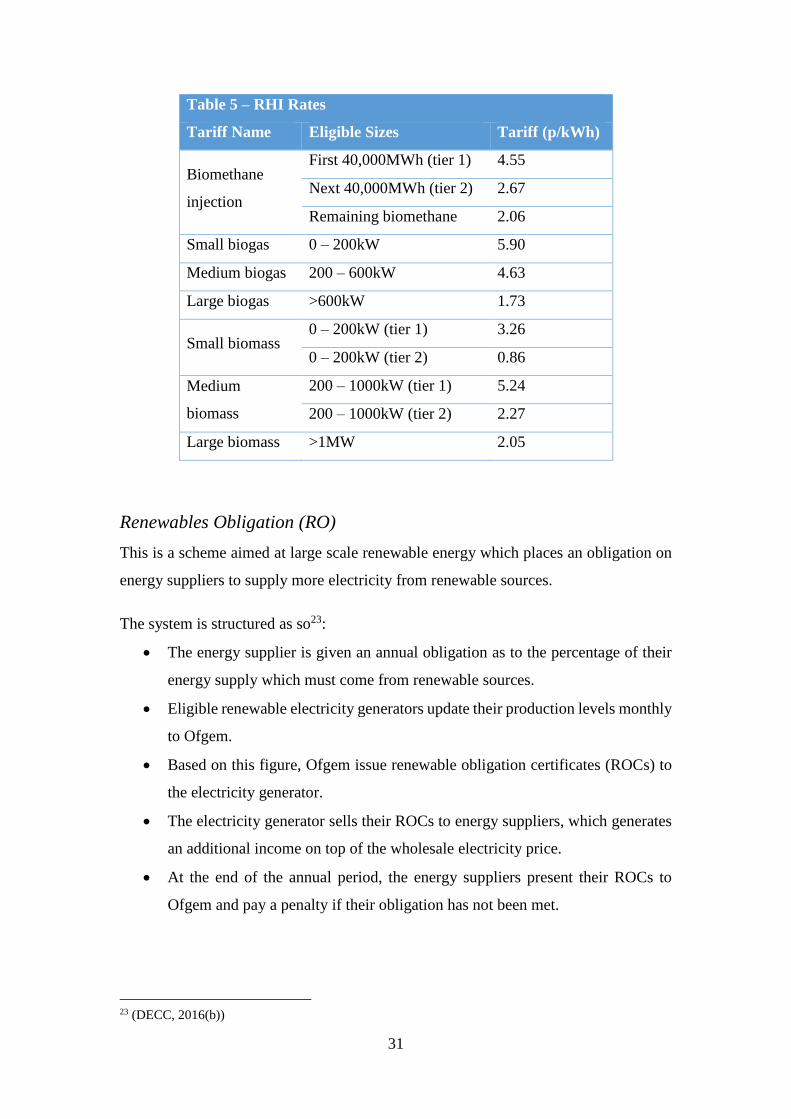
The tariffs are set by the Department of Energy and Climate Change (DECC). Table 5
lists the current rates for projects accredited on or after 1st July 201622.
These rates show a 15% degression from previous which is not nearly as high as the
FIT scheme, however could still have an effect on whether a project is financially
viable.
20 (ADBA, 2016) 21 (Ofgem, 2016(b)) 22 (Ofgem, 2016(c))
31
Table 5 – RHI Rates
Tariff Name Eligible Sizes Tariff (p/kWh)
Biomethane
injection
First 40,000MWh (tier 1) 4.55
Next 40,000MWh (tier 2) 2.67
Remaining biomethane 2.06
Small biogas 0 – 200kW 5.90
Medium biogas 200 – 600kW 4.63
Large biogas >600kW 1.73
Small biomass 0 – 200kW (tier 1) 3.26
0 – 200kW (tier 2) 0.86
Medium
biomass
200 – 1000kW (tier 1) 5.24
200 – 1000kW (tier 2) 2.27
Large biomass >1MW 2.05
Renewables Obligation (RO)
This is a scheme aimed at large scale renewable energy which places an obligation on
energy suppliers to supply more electricity from renewable sources.
The system is structured as so23:
The energy supplier is given an annual obligation as to the percentage of their
energy supply which must come from renewable sources.
Eligible renewable electricity generators update their production levels monthly
to Ofgem.
Based on this figure, Ofgem issue renewable obligation certificates (ROCs) to
the electricity generator.
The electricity generator sells their ROCs to energy suppliers, which generates
an additional income on top of the wholesale electricity price.
At the end of the annual period, the energy suppliers present their ROCs to
Ofgem and pay a penalty if their obligation has not been met.
23 (DECC, 2016(b))
32
The revenue generated from penalties is distributed to the other suppliers who
met their obligations.
However this scheme will close to all new projects on the 31st March 2017. According
to the ADBA, this creates further uncertainty for future AD projects as some
developer’s model for claiming the RO rather than FIT to serve as a worst case scenario
in case FIT is not attained. Therefore, without the scheme there is more risk involved24.
Renewable Transport Fuel Obligation (RTFO)
The RTFO is a scheme similar to the RO, but aimed at supporting the government’s
commitment to reducing GHG emissions from vehicles. Under this scheme, suppliers
of transport fuel (who supply at least 450,000 litres pa) are obliged to show that a
percentage of the fuel they supply comes from renewable sources. Producers of biofuels
of any size can register to claim Renewable Transport Fuel Certificates (RTFCs) which
can either be used as evidence of meeting their own obligation, or sold to larger
companies in order for them to meet their quota25.
ADBA state that biomethane derived from wastes and residues are eligible for double
the certificates as non-waste derived biomethane. However there is a lack of policy
support which prevents the scheme from incentivising biomethane production at this
time24.
Climate Change Levy (CCL) Exemption
This is a tax on non-domestic energy use which aims to incentivise the improvement of
energy efficiency. Renewables derived energy used to have an exemption from this tax
however this was removed on the 1st August 201526.
The ADBA state that this has cost AD electricity operators around £11m per year which
is a further strain on finances27. However this only affects large scale plants.
24 (ADBA, 2016) 25 (UK Government, 2012) 26 (Ofgem, 2016(e)) 27 (ADBA, 2016)

33
Scotland’s Zero Waste Plan
Scotland implemented the Zero Waste Plan in 2010 to encourage waste to be seen as a
resource in order to reduce landfill volume. The current targets which apply to all waste
are 70% must be recycled and a maximum of 5% sent to landfill by 202528.
This has led to the deployment of food separation schemes, where businesses who
generate at least 5kg of waste per week must separate the food waste for collection.
There are also food waste bins being rolled out across the domestic sector. This presents
some opportunity for AD plants with food waste as a feedstock in the future, however
as the ADBA point out, this service is rolling out at negligible levels which is restricting
the market29.
Manure Management Policy
ADBA point out in their July 2016 Market Report that the government provide little
incentive for agriculture to use manure for AD despite nearly 5 million tonnes of CO2e
GHG emissions per year from livestock. With the degression of tariff rates for smaller
scale AD plants, it is unlikely that there will be significant progression in manure
management29.
2.12 UK AD Industry Overview
As can be seen from the history of AD in Table 2, the process of producing biogas is
well understood and utilised across a wide range of industries including waste water,
agriculture and the food and drinks industries. The technology is well proven.
Figure 7 shows the cumulative installed capacity of AD plants in the United Kingdom
from 2010 until now30. April 2010 was when the Feed in Tariff (FIT) incentive scheme
was introduced to encourage investment in renewable energy technologies to help the
government meet their climate change targets.
28 (Scottish Government, 2013) 29 (ADBA, 2016) 30 (DECC, 2016)
34
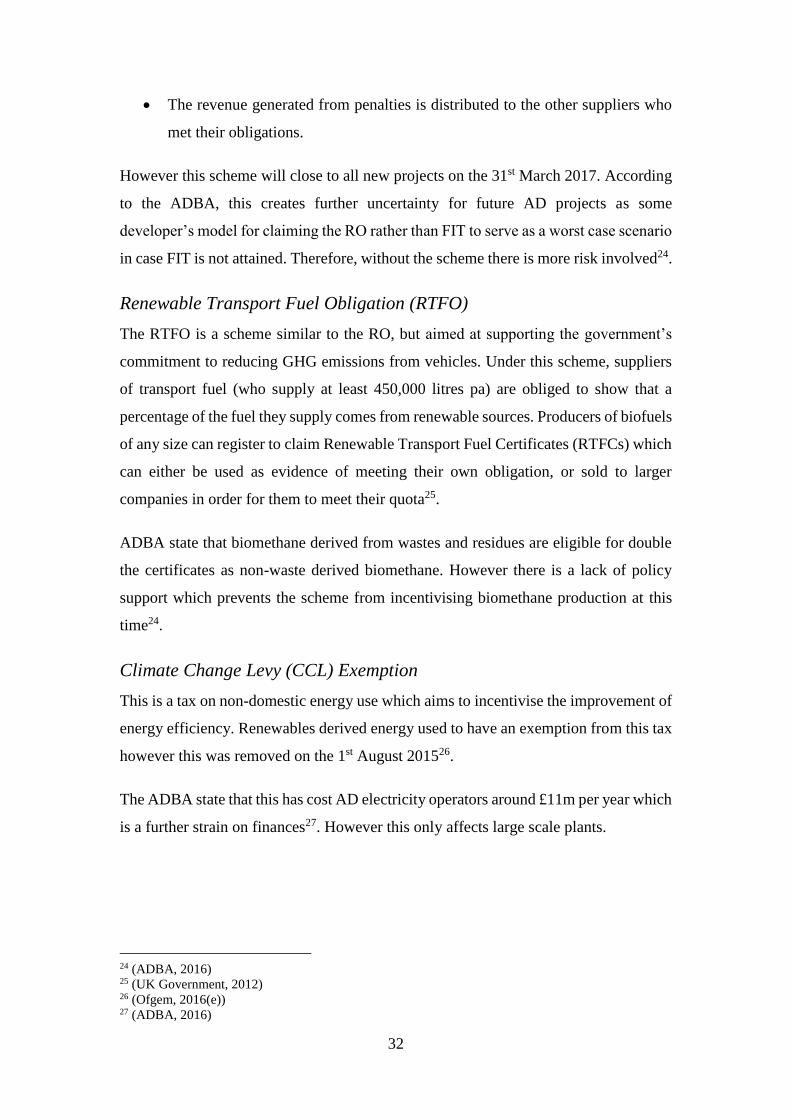
Figure 7 – Cumulative Commissioned Installed AD Capacity UK
Although this appears to show a high level of capacity, it is important to put this figure
into perspective in terms of the annual electrical demand of the UK. In 2015, the total
annual electrical demand of the UK was 360TWh31. With an installed capacity of
180MW, this provides 980GWh32 with a load factor of 62.2%, which equates to under
0.3% of the total annual demand. This only considers electricity generation, however
the biogas can also be used for thermal energy.
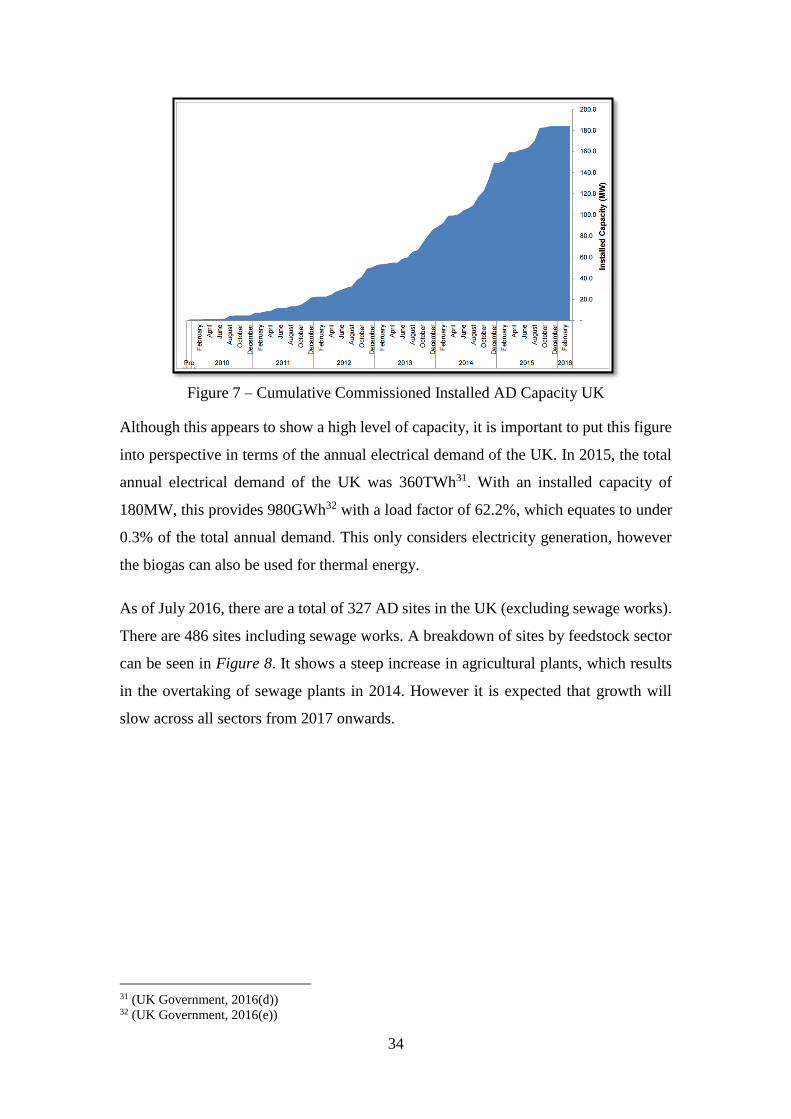
As of July 2016, there are a total of 327 AD sites in the UK (excluding sewage works).
There are 486 sites including sewage works. A breakdown of sites by feedstock sector
can be seen in Figure 8. It shows a steep increase in agricultural plants, which results
in the overtaking of sewage plants in 2014. However it is expected that growth will
slow across all sectors from 2017 onwards.
31 (UK Government, 2016(d)) 32 (UK Government, 2016(e))
35
Figure 8 – UK AD Plants by Feedstock
Excluding extensions to existing plants, there is a total of 322 approved planning
applications as well as 96 further planning applications pending approval. This could
take the total number of plants in the UK up to 745 (excluding sewage works)33.
2.13 AD use in the Whisky Industry
The by-products of whisky production are proven to be suitable for anaerobic digestion.
Due to the energy intensive process of whisky distilling and the increasing need to
lower carbon emissions, distilleries are beginning to incorporate efficiency improving
and sustainable solutions into their processes, including anaerobic digestion of by-
products. This is supported by the Scotch Whisky Association’s (SWA) goals to source
20% of their primary energy requirement from non-fossil fuels by 2020, which is then
to rise to 80% by 205034. A progress report35 highlights that in 2015 the whisky industry
GHG emissions were 756,000 tCO2e.
The following is a list of some examples of AD in distilleries in Scotland.
Roseisle
Roseisle is a Diageo owned distillery in Morayshire which was built in 2010, producing
around 11 million litres of whisky per year. It was the first new malt whisky distillery
33 (ADBA, 2016) 34 (Scotch Whisky Association, 2016) 35 (Scotch Whisky Association, 2015)

36
to be built in Scotland in 30 years, as well as the first to include an on-site renewable
energy plant. The plant uses the distillery’s dried draff in biomass boilers and treats the
pot ale and spent lees with AD for biogas, producing 50% of its energy demands from
renewable energy. The project is said to have cost £17 million in capital.
Glenfiddich
Again, a Diageo owned whisky distillery in Moray, with an AD plant in operation since
2015. Here, both the draff and liquid by-products are pumped away from the distillery
to the AD site where they are converted to biogas. It is not clear how the biogas is being
used, but the plans which were approved stated the options of either cleaning it to pump
into the mains gas grid, or using in a CHP system where the electricity would mainly
be exported to the grid and heat being used at the distillery. The residues from the
digester were planned to be sold and used as fertiliser.
Dailuaine
This is another Diageo distillery in Moray. In operation since 2013, they use high rate
digestion to treat the liquid by-products. Producing 0.5MW of biogas, this facility
provides 40% of the electrical demand through CHP and reduces the CO2 emissions by
around 250 tonnes per year. The digestate is used by farmers as a solid bio-fertiliser.
The project is said to have cost around £6 million in capital.
Glendullan
This AD plant was a follow on from the Dailuaine, using the same type of high rate
digestion system using liquid by-products. It produces about 2,000,000m3 of biogas per
year, which provides 8,000MWh of thermal energy for use at the distillery.
North British
Situated in Edinburgh, North British Distillery operate a £6 million high rate liquid by-
product processing AD plant. 24,000MWh of biogas is produced which is used in a
CHP system providing heat and power for the distillery. It has resulted in a 9000
tonne/year CO2 reduction which is the equivalent of removing 3000 cars from the road.
Cameronbridge
This is the largest distillery in Scotland, again owned by Diageo. It now incorporates a
£65 million bio-energy facility which includes biomass, AD and water recovery. It is

37
estimated to produce up to 30MW of energy which meets around 95% of the distillery’s
demands.
Girvan
The Girvan distillery, situated in South Ayrshire, is owned by William Grant & Sons.
With a £15 million capital investment, the project produces biogas from the distillery’s
liquid by-products, meeting the 4.8MW demand with a further 2MW being exported to
the electricity grid. The heat recovered from the CHP system meets around 10% of the
thermal demand. It is expected that the investment will be paid back after only 4 years.
In most of these cases, it is only the liquid by-products which are used for biogas
production. This may be due to the location of the distilleries;
First of all there may not be the space required for a larger digester which would
be needed for the digestion of draff compared to the high rate digester which
can be used for liquid feedstocks alone. Note that Glenfiddich is the only
distillery mentioned above which treats both draff and pot ale with AD and they
pump these by-products away from the distillery, to the location of the AD plant.
This could be due to space available at the distillery itself.
Another reason may also be due to the requirement for waste water treatment.
If it is not possible to discharge the pot ale to sea due to distance, then it is often
put through the energy intensive process of evaporation to convert it to pot ale
syrup, which can then be used as animal feed. Anaerobic digestion of pot ale
provides an alternative option, which creates energy rather than consuming, and
has the desired effect of reducing the Chemical Oxygen Demand (COD) enough
to allow the disposal of the resultant liquid straight into fresh water streams with
no detriment to the environment.
These may be the reasons for the majority to choose high rate digestion systems over
continuous stir digesters for both by-products. However draff also has the potential to
create biogas and if the conditions are suitable then it could be worthwhile exploiting
the additional energy.

38
3.0 Islay Study
3.1 Islay General Info
Islay is an island of the Inner Hebrides, off the West Coast of Scotland. It measures
approximately 40km by 25km and has a land area of 619.6km2.
Figure 9 – Isle of Islay Location36
As per the last census taken in 201137, the total population of the island was 3,153 with
1,442 households. This gives a population density of 5.1 people per square kilometre.
As displayed in Table 6, the areas of highest population density are the villages of Port
Ellen, Bowmore and Port Charlotte, with the rest of the population spread around the
other areas of the island.
Table 6 – Islay Population Distribution
Area Population No. of Households
Port Ellen 846 390
Bowmore 797 355
Port Charlotte 103 45
West Islay 657 312
North Islay 417 196
South Islay 333 144
The main industries on Islay include whisky, tourism and agriculture. Whisky distilling
is the predominant industry, with 8 single malt Scotch whisky distilleries on the island.
This brings in a lot of tourism directly, and holiday homes are abundant as a result.
36 (Islay Info, 2016) 37 (Scottish Government, 2011)
39
Agriculture accounts for the main land use, including both crofting and more modern
farming techniques. Dairy farming used to be common practice until the closure of the
Islay Creamery in 2000. There is now only one dairy farming remaining which sells its
products locally.
There is a mains electricity grid connection via neighbouring island Jura, which has a
connection to the mainland. However there is no gas network connection.
Islay Energy Trust (IET):
A community owned energy trust exists with the aim of developing renewable energy
projects to serve the community whilst also reducing their carbon footprint. They
operate small to medium renewable energy projects such as wind and biomass, as well
as entering into partnerships with renewable energy developers for larger scale projects.
They are currently working with ScottishPower Renewables (SPR) to develop the
10MW Sound of Islay Tidal Energy project. This is a demonstration project, which will
consist of 10 off 1MW turbines submerged on the seabed between Islay and Jura. Other
activities include carbon savings projects, which focus on energy efficiency with the
aim of reducing fuel bills38.
3.2 Islay Whisky
History
It is said that distillation techniques were brought to Islay in the early fourteenth century
by the Irish monks. The abundance of fresh water from lochs and rivers as well as peat
made the island an ideal location for the production of whisky.
In the past, most of the whisky produced was for blends, but with the increase in global
market for single malts this has seen a far greater percentage of single malt production
in more recent years. To call the produced spirit ‘whisky’, it must be matured for a
minimum of 3 years in oak casks. To call the whisky ‘Scotch whisky’, it must be made
in Scotland. This means that the global demand for mature Scotch whisky is much
higher than supply can withstand and thus increases the value considerably.
38 (IET, 2012)

40
Production
Today there are 8 operational distilleries on Islay and one maltings. Each of the
distilleries were contacted to find out their annual whisky production levels in litres per
year with the results displayed in Table 7. The total annual production on the island
exceeds 16 million litres.
Table 7 – Whisky Production
Distillery Name Annual Whisky
Production (litres)
Ardbeg 1250000
Laphroaig 2200000
Lagavulin 2400000
Bruichladdich 1350000
Bunnahabhain 1600000
Bowmore 1300000
Caol Ila 5800000
Kilchoman 175000
Total 16,075,000
Energy use
Due to the intensive energy required during evaporation, whisky distilleries have very
high thermal energy requirements.
When the distilleries were contacted, they were asked to provide annual energy use
figures, however they declined to participate in this exercise. Last year, a study39 was
conducted which draws a correlation between annual whisky production and energy
demand figures. In the absence of data specific to Islay distilleries, the results from this
study have been used to aid this conceptual study with the view that results could be
refined in the future with real data.
In last year’s study, values were obtained for total energy demand as well as electrical
demand for 9 distilleries of varying production levels. Here, the electrical demand was
removed from the total value to obtain the remaining thermal energy required as this is
the value of most interest here. The electrical energy has less of a dependence on annual
39 (Meadows, 2015)
41
production levels as this can be attributed to size of offices or any other number of
aspects. As fuel oils are used as the heating source, this is the energy which biogas will
be offsetting.
Not only will the offsetting of fuel oil benefit the environment, but it will protect the
businesses from fuel supply issues. It has been reported on a number of occasions that
there have been supply issues, with winter weather or extreme low tides causing
problems for the supply vessels delivering the fuel to the pier resulting in the island
supply running low and some of the distilleries being forced to halt production
temporarily. Although this problem could be resolved by delivery of fuel oil by road
tanker via ferry, it highlights the issues of a remote location relying on imports and the
detrimental effect these kinds of problems can have.
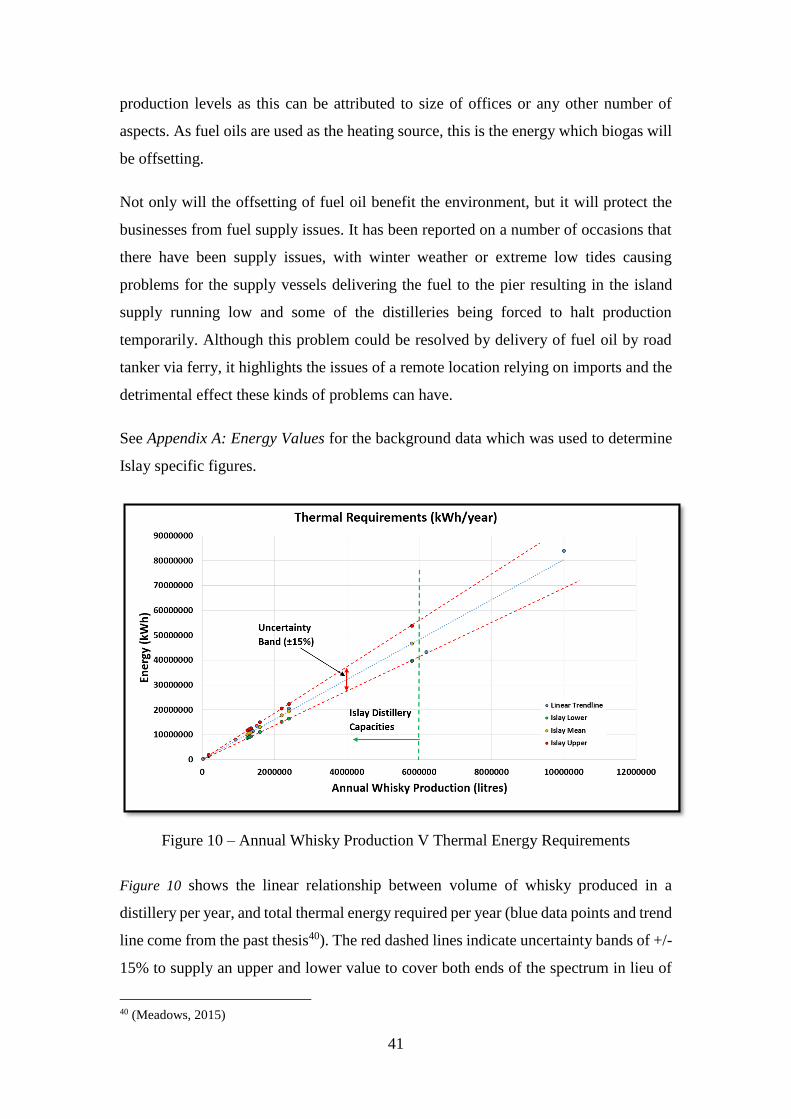
See Appendix A: Energy Values for the background data which was used to determine
Islay specific figures.
Figure 10 – Annual Whisky Production V Thermal Energy Requirements
Figure 10 shows the linear relationship between volume of whisky produced in a
distillery per year, and total thermal energy required per year (blue data points and trend
line come from the past thesis40). The red dashed lines indicate uncertainty bands of +/-
15% to supply an upper and lower value to cover both ends of the spectrum in lieu of
40 (Meadows, 2015)

42
real data. To the left of the green dashed line is the area of the graph from which Islay
distillery values will be taken. The orange data points are energy values corresponding
to the whisky production levels of the 8 Islay distilleries which lie exactly on the dashed
blue trend line, with green and red data points showing the lower and upper values
respectively.
Table 8 – Thermal Demand Estimations: Islay Distilleries
The capacity of boiler which would be required at each distillery can be calculated by
assuming a 50% load factor. It is not known what the specific load factors of the Islay
distilleries are, but information available regarding Balmenach distillery in Speyside
shows that a 4MW capacity biomass boiler provides the full requirement of
18,000MWhth per year which works out at a 51.4% load factor41.
Identifying the capacities allows the correct RHI tariff to be assigned based on the size
of boiler which would be used. Table 9 lists these results.
Table 9 – Boiler Capacity Requirements
41 (Scottish Energy News, 2013)
43
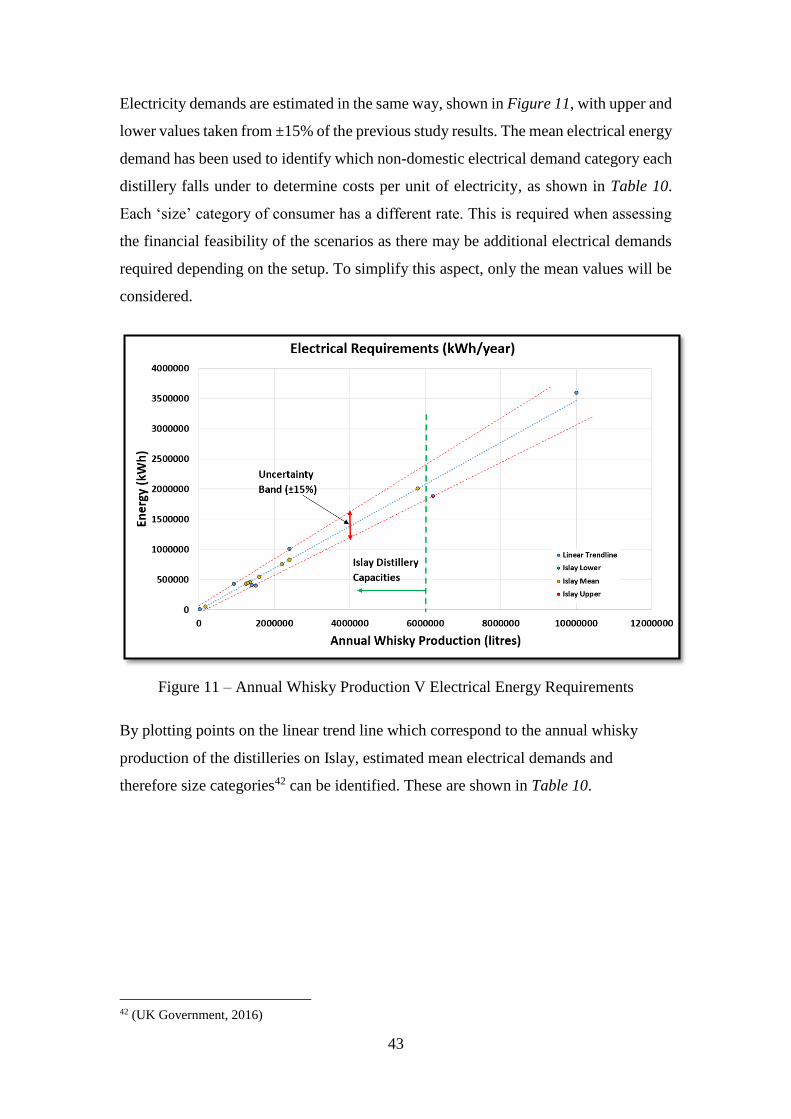
Electricity demands are estimated in the same way, shown in Figure 11, with upper and
lower values taken from ±15% of the previous study results. The mean electrical energy
demand has been used to identify which non-domestic electrical demand category each
distillery falls under to determine costs per unit of electricity, as shown in Table 10.
Each ‘size’ category of consumer has a different rate. This is required when assessing
the financial feasibility of the scenarios as there may be additional electrical demands
required depending on the setup. To simplify this aspect, only the mean values will be
considered.
Figure 11 – Annual Whisky Production V Electrical Energy Requirements
By plotting points on the linear trend line which correspond to the annual whisky
production of the distilleries on Islay, estimated mean electrical demands and
therefore size categories42 can be identified. These are shown in Table 10.
42 (UK Government, 2016)
44
Table 10 – DECC Size of Electrical Consumer
Distillery Mean Electrical Demand
(MWh/year)
Size of Consumer
Ardbeg 427 Small
Laphroaig 757 Small/Medium
Lagavulin 827 Small/Medium
Bruichladdich 462 Small
Bunnahabhain 549 Small/Medium
Bowmore 445 Small
Caol Ila 2008 Medium
Kilchoman 54 Small
These category assignments will be referred back to in the financial analyses.
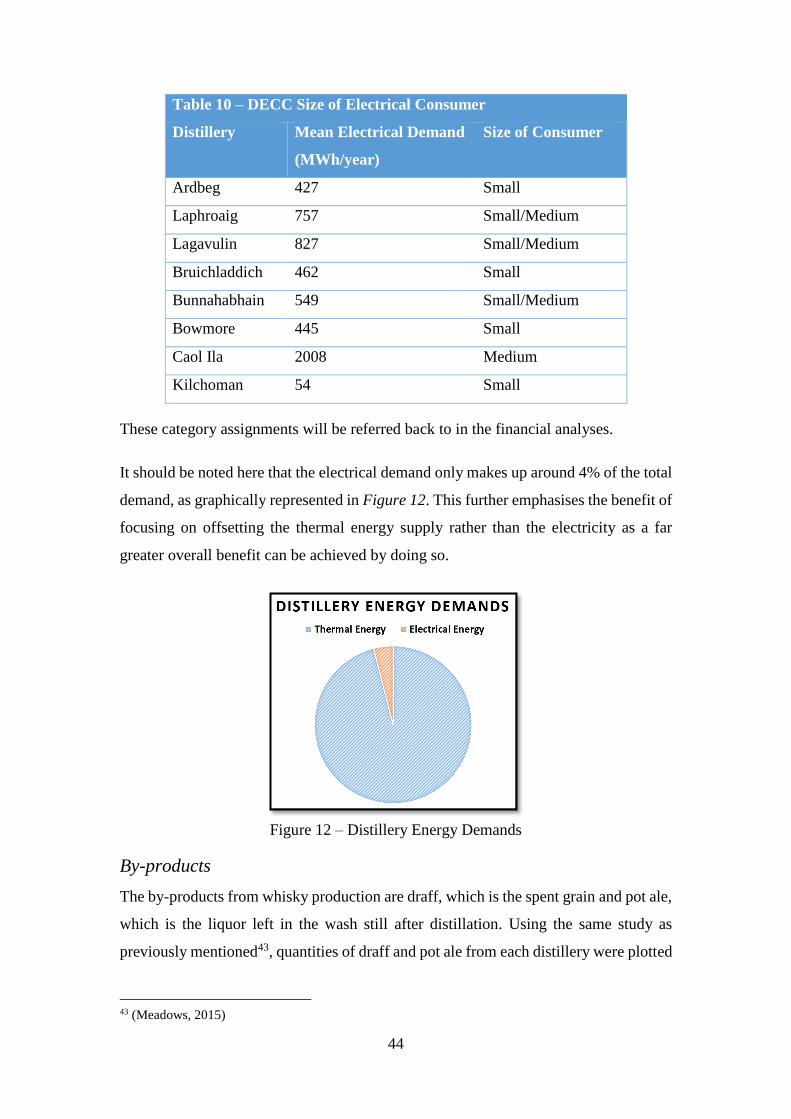
It should be noted here that the electrical demand only makes up around 4% of the total
demand, as graphically represented in Figure 12. This further emphasises the benefit of
focusing on offsetting the thermal energy supply rather than the electricity as a far
greater overall benefit can be achieved by doing so.
Figure 12 – Distillery Energy Demands
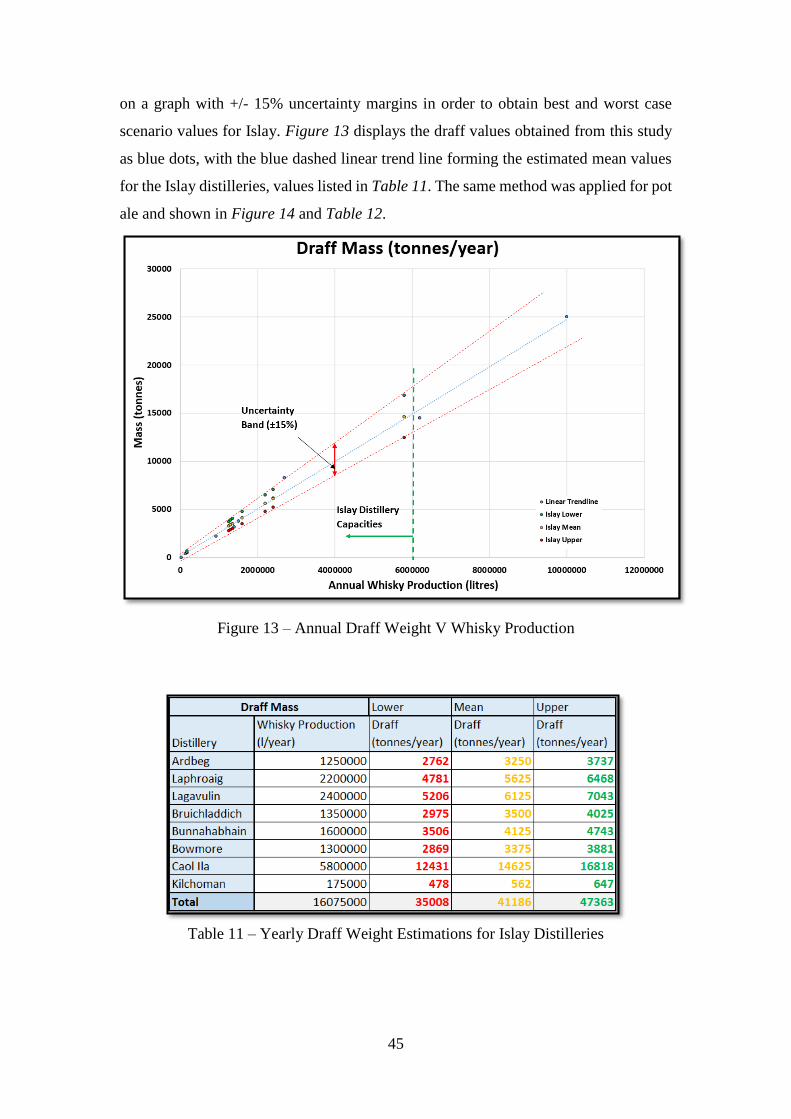
By-products
The by-products from whisky production are draff, which is the spent grain and pot ale,
which is the liquor left in the wash still after distillation. Using the same study as
previously mentioned43, quantities of draff and pot ale from each distillery were plotted
43 (Meadows, 2015)
45
on a graph with +/- 15% uncertainty margins in order to obtain best and worst case
scenario values for Islay. Figure 13 displays the draff values obtained from this study
as blue dots, with the blue dashed linear trend line forming the estimated mean values
for the Islay distilleries, values listed in Table 11. The same method was applied for pot
ale and shown in Figure 14 and Table 12.
Figure 13 – Annual Draff Weight V Whisky Production
Table 11 – Yearly Draff Weight Estimations for Islay Distilleries

46
Figure 14 – Annual Pot Ale Volume V Whisky Production
Table 12 – Yearly Pot Ale Volume Estimations for Islay Distilleries
The equivalent mass of the pot ale can be calculated by assuming the density of pot ale
is the same as that of water; ρ = 1000 kg/m3.
Out of the eight distilleries, one did respond with by-product quantities. Bowmore gave
annual by-product quantities which fall within the above estimated ranges. This gives
an element of validation to the logic employed.
47
Other general waste water is also produced in abundance during the whisky distilling
process as highlighted in last year’s study44.
Currently, the draff is sold to an animal feeds company who take responsibility of it
from the door of the distilleries. It is transported off the island via ferry and processed
into a marketable product for farmers’ livestock. These are longstanding contracts
which may cause a barrier when it comes to changing current practices to use draff as
an anaerobic digestion feedstock.
The pot ale is discharged to sea from the discharge point at Caol Ila, which is
transported to this point by road tanker from the other distilleries. The case used to be
that the pot ale was discharged straight into the sea from each of the distilleries, however
this changed due to the EU ‘Urban Waste Water Treatment’ Directive. Because of the
use of copper stills, pot ale contains trace elements of copper. For this reason, it must
be discharged in such a way that prevents the accumulation of pot ale in the sea, which
is possible by making use of naturally fast flowing currents such as the sound of Islay.
When discharged here, the water carries the pot ale far out to sea and disperses it which
prevents a build-up in any specific areas and therefore reduces the risk of pollution.
However, this is a fairly contentious point as it could be argued that the added pollution
caused by the need for high levels of continual road transport may outweigh the benefits
of this activity. Further to this, some studies suggest that the peat of the soil on Islay
helps to neutralise the negative effect of the copper and even goes as far as to suggest
that the pot ale could be environmentally beneficial. Either way, the pot ale is currently
not put to use, and therefore would be available for use as a feedstock for anaerobic
digestion.
3.3 Available Feedstocks on Islay
Whisky by-products are to be considered as the primary feedstock, with the potential
for additional sources being added to optimise the system.
First of all, there is no food waste separation and collection system on Islay. Therefore
food waste goes in the general waste bins and is sent to landfill (or composted). An
estimation can be made as to the weight of domestic food waste based on the figure of
44 (Meadows, 2015)
48
1,442 households. A study conducted by WRAP45 estimates that the average food waste
per household per year is 270kg. Of this, 170kg/year is ‘avoidable’ waste, i.e. food that
could otherwise have been eaten if managed better, with ‘unavoidable’ waste being
items such as meat bones and tea bags which could not be consumed. It is difficult to
make an estimation for Islay without conducting a specific analysis of their waste,
however for this study it is to be assumed that due to inflated prices because of the
remoteness of the location, food may be better managed than the average household
and therefore less avoidable waste will be experienced. This will also avoid overly
optimistic calculations. So it is assumed that unavoidable waste remains at
100kg/household/year and a value of 50% of the national average for avoidable waste,
equalling 85kg/household/year which gives a total of 185kg/household/year of food
waste on Islay. Therefore the yearly quantity of food waste to be used for calculations
is 267 tonnes based on there being 1442 households. This does not include any
commercial food waste which gives further confidence that the figure is not higher than
realistically expected. There are over 30 cafes, restaurants and take-aways on Islay46,
as well as 3 schools and a hospital which all contribute to food waste totals
Fishing industry waste was considered, however the vast majority is shellfish (crab,
lobster and scallop fishing). Most of this is exported, leaving no waste on site as it is
shipped live. Anything processed locally produces only shells which are used for
drainage. So there does not appear to be any potential from fishing for AD feedstock.
Farming has been difficult to quantify due to lack of contacts, however given the area
of land available, a backward calculation approach can be taken to identify the yield of
crops required to produce a specific volume of biogas.
3.4 AD System Selection for Islay
Draff and pot ale could be treated in separate digesters, with pot ale being treated in an
upflow anaerobic sludge blanket digester and the draff in a continuous flow stirred tank
digester. This would speed up the digestion process for the pot ale, allowing for a
45 (WRAP, 2008) 46 (Islay Info, 2016)

49
smaller digester to be used. However it would require higher capital costs for 2 separate
digesters and a UASB requires stricter control, with higher risk of problems occurring.
Therefore the selected digester type for Islay would be a single continuous flow stirred
tank, with the draff and pot ale mixed as a slurry and pumped directly to the site from
the distilleries. This is an additional benefit of this system, which removes the
requirement to separately transport the draff by road. It should also be noted here that
if a slurry mix has over ~8% TS, then pumping can become more difficult, therefore
this characteristic must be evaluated.
The system can be sized for the primary feedstocks, and also sized to include other
additional feedstocks as available as a comparison.
3.5 Location
The location of each distillery was mapped and a central location selected around the
area of Bridgend. This results in 3 ‘clusters’ of distilleries, where their by-products can
be accumulated and pumped together through 3 single pipes.
Using Google Maps, the distances between each distillery and the central location were
obtained, as well as the height differentials. Note that these are the distances via road
i.e. they provide conservative values due to the high agricultural area on Islay which
means shorter, more direct routes would most likely be possible. Figure 15 shows the
locations and general piping routes, with Table 13 listing the distances.

50
Figure 15 – Map of Distilleries and Pipe Routes
Table 13 – Distances between Distilleries to Central Location
It has been calculated that the draff and pot ale can be pumped together as a single
slurry. If the overall dry matter of the slurry mix is higher than 8%, then general waste
water can be added to dilute it down.
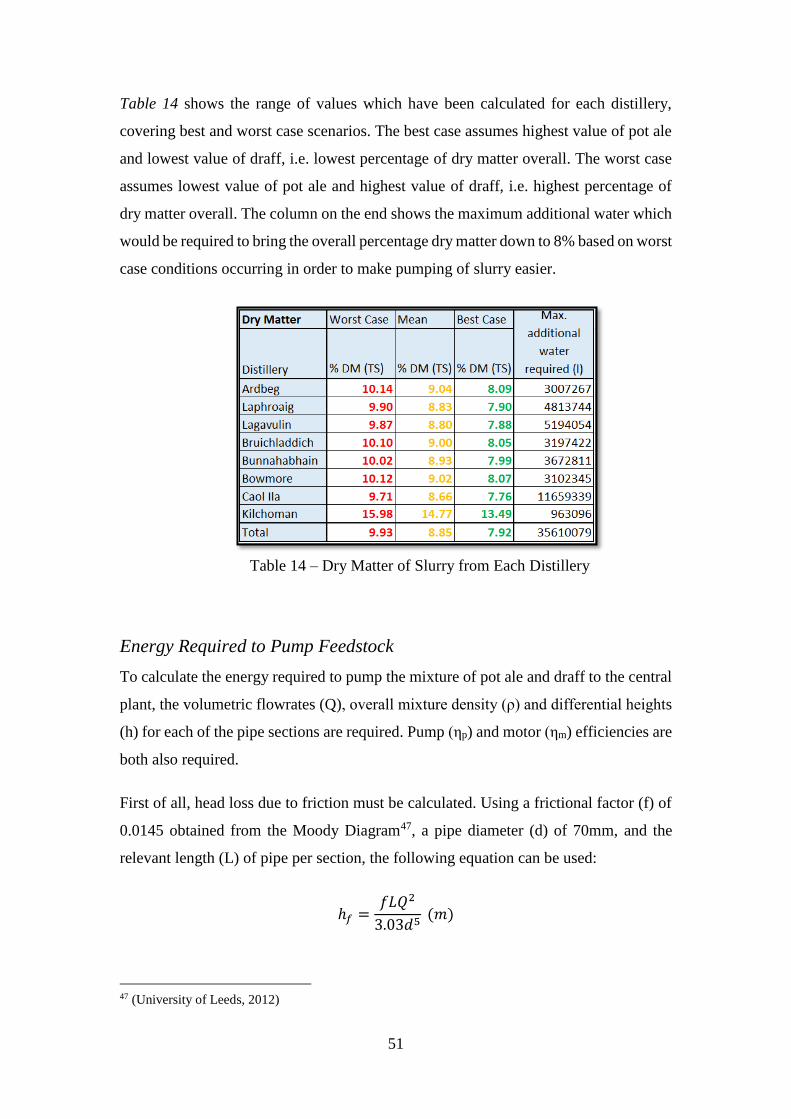
51
Table 14 shows the range of values which have been calculated for each distillery,
covering best and worst case scenarios. The best case assumes highest value of pot ale
and lowest value of draff, i.e. lowest percentage of dry matter overall. The worst case
assumes lowest value of pot ale and highest value of draff, i.e. highest percentage of
dry matter overall. The column on the end shows the maximum additional water which
would be required to bring the overall percentage dry matter down to 8% based on worst
case conditions occurring in order to make pumping of slurry easier.
Table 14 – Dry Matter of Slurry from Each Distillery
Energy Required to Pump Feedstock
To calculate the energy required to pump the mixture of pot ale and draff to the central
plant, the volumetric flowrates (Q), overall mixture density (ρ) and differential heights
(h) for each of the pipe sections are required. Pump (ηp) and motor (ηm) efficiencies are
both also required.
First of all, head loss due to friction must be calculated. Using a frictional factor (f) of
0.0145 obtained from the Moody Diagram47, a pipe diameter (d) of 70mm, and the
relevant length (L) of pipe per section, the following equation can be used:
ℎ𝑓 =𝑓𝐿𝑄2
3.03𝑑5 (𝑚)
47 (University of Leeds, 2012)
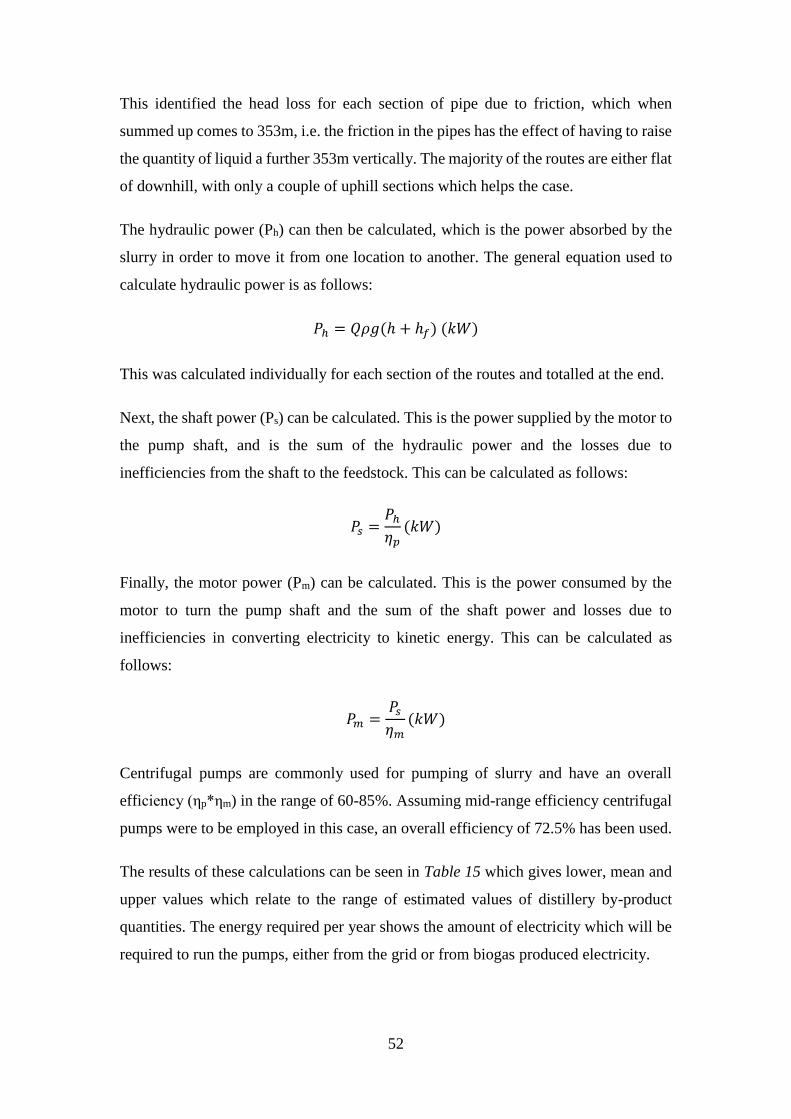
52
This identified the head loss for each section of pipe due to friction, which when
summed up comes to 353m, i.e. the friction in the pipes has the effect of having to raise
the quantity of liquid a further 353m vertically. The majority of the routes are either flat
of downhill, with only a couple of uphill sections which helps the case.
The hydraulic power (Ph) can then be calculated, which is the power absorbed by the
slurry in order to move it from one location to another. The general equation used to
calculate hydraulic power is as follows:
𝑃ℎ = 𝑄𝜌𝑔(ℎ + ℎ𝑓) (𝑘𝑊)
This was calculated individually for each section of the routes and totalled at the end.
Next, the shaft power (Ps) can be calculated. This is the power supplied by the motor to
the pump shaft, and is the sum of the hydraulic power and the losses due to
inefficiencies from the shaft to the feedstock. This can be calculated as follows:
𝑃𝑠 =𝑃ℎ
𝜂𝑝(𝑘𝑊)
Finally, the motor power (Pm) can be calculated. This is the power consumed by the
motor to turn the pump shaft and the sum of the shaft power and losses due to
inefficiencies in converting electricity to kinetic energy. This can be calculated as
follows:
𝑃𝑚 =𝑃𝑠
𝜂𝑚(𝑘𝑊)
Centrifugal pumps are commonly used for pumping of slurry and have an overall
efficiency (ηp*ηm) in the range of 60-85%. Assuming mid-range efficiency centrifugal
pumps were to be employed in this case, an overall efficiency of 72.5% has been used.
The results of these calculations can be seen in Table 15 which gives lower, mean and
upper values which relate to the range of estimated values of distillery by-product
quantities. The energy required per year shows the amount of electricity which will be
required to run the pumps, either from the grid or from biogas produced electricity.
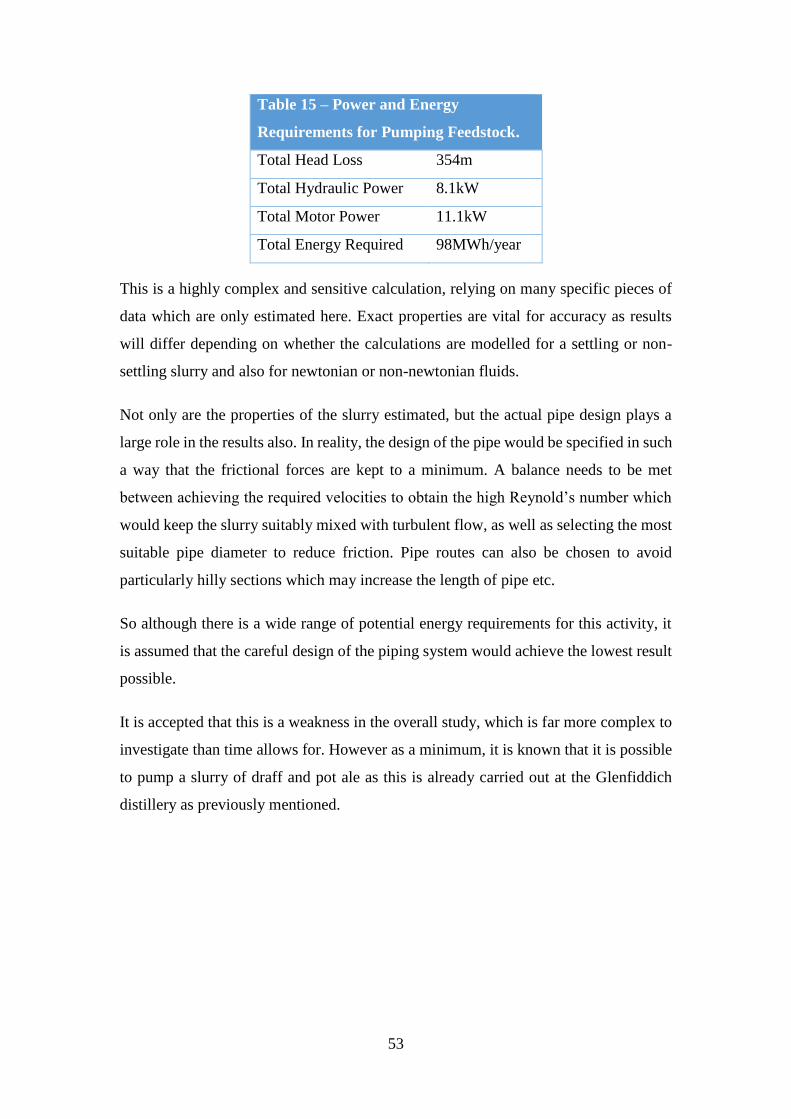
53
Table 15 – Power and Energy
Requirements for Pumping Feedstock.
Total Head Loss 354m
Total Hydraulic Power 8.1kW
Total Motor Power 11.1kW
Total Energy Required 98MWh/year
This is a highly complex and sensitive calculation, relying on many specific pieces of
data which are only estimated here. Exact properties are vital for accuracy as results
will differ depending on whether the calculations are modelled for a settling or non-
settling slurry and also for newtonian or non-newtonian fluids.
Not only are the properties of the slurry estimated, but the actual pipe design plays a
large role in the results also. In reality, the design of the pipe would be specified in such
a way that the frictional forces are kept to a minimum. A balance needs to be met
between achieving the required velocities to obtain the high Reynold’s number which
would keep the slurry suitably mixed with turbulent flow, as well as selecting the most
suitable pipe diameter to reduce friction. Pipe routes can also be chosen to avoid
particularly hilly sections which may increase the length of pipe etc.
So although there is a wide range of potential energy requirements for this activity, it
is assumed that the careful design of the piping system would achieve the lowest result
possible.
It is accepted that this is a weakness in the overall study, which is far more complex to
investigate than time allows for. However as a minimum, it is known that it is possible
to pump a slurry of draff and pot ale as this is already carried out at the Glenfiddich
distillery as previously mentioned.
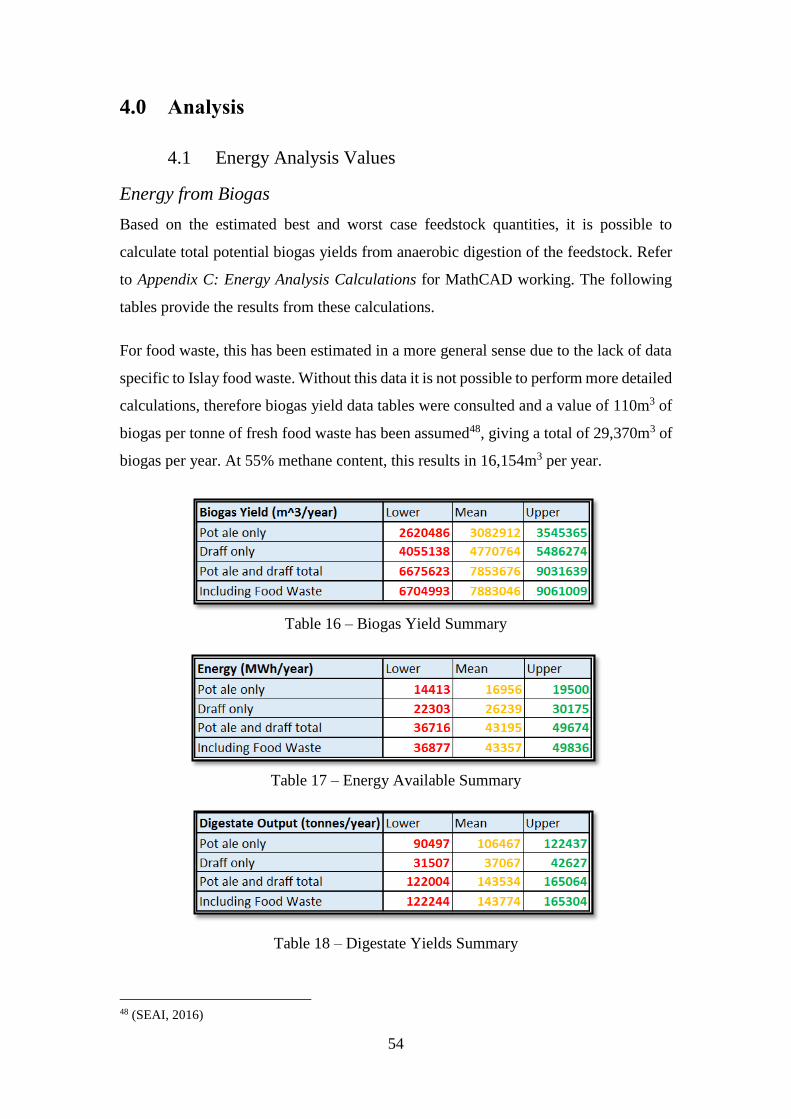
54
4.0 Analysis
4.1 Energy Analysis Values
Energy from Biogas
Based on the estimated best and worst case feedstock quantities, it is possible to
calculate total potential biogas yields from anaerobic digestion of the feedstock. Refer
to Appendix C: Energy Analysis Calculations for MathCAD working. The following
tables provide the results from these calculations.
For food waste, this has been estimated in a more general sense due to the lack of data
specific to Islay food waste. Without this data it is not possible to perform more detailed
calculations, therefore biogas yield data tables were consulted and a value of 110m3 of
biogas per tonne of fresh food waste has been assumed48, giving a total of 29,370m3 of
biogas per year. At 55% methane content, this results in 16,154m3 per year.
Table 16 – Biogas Yield Summary
Table 17 – Energy Available Summary
Table 18 – Digestate Yields Summary
48 (SEAI, 2016)

55
Note that these values do not yet account for energy required to run the AD plant. They
only represent the total theoretical energy/power yields from the quantity of feedstock
available.
Biogas and Biomass Boilers
Efficiencies of 90% and 85% are used when calculating the energy output from biogas
and biomass boilers respectively. These are general figures provided by a biogas plant
owner and biomass specialist, and are used in the analyses for all capacities of boiler.
CHP System
The FIT scheme is changing, with a cap at 500kWe capacity. Therefore no CHP system
larger than this will be considered in this study.
The biogas required to run a 500kWhe CHP unit has been calculated, along with the
expected electrical and thermal outputs. The datasheet for a 500kWe CHP unit49 has
been consulted for the purpose of using realistic efficiencies. The figures quoted have
been graphically displayed in Figure 16.
Figure 16 – Efficiencies of Edina CHP Unit
With a 90% load factor, the system will see 39.4% thermal and 41% electrical
efficiencies, giving an overall efficiency of 80.4%.
49 (Edina UK Ltd., 2013)

56
Figure 17 summarises the energy outputs from the CHP unit.
The energy content of the biogas input to the system can therefore be calculated as the
sum of each of the three outputs which is 9608 MWh.
Figure 17 – Biogas Required for 500kWe CHP Unit
The electrical and thermal energy output from the CHP unit will not all be available
for other uses as some of it will be required to run the AD plant. Discussions with an
AD plant operator highlighted some of the difficulties in predicting these values due
to the variations with location (weather most importantly) and insulation of system
etc. However as a rule of thumb, it can be assumed that 5% of the electricity
generated and 20% of the heat generated goes back into the running of the plant. The
useful thermal and electrical energy generated from a 500kWe capacity CHP unit is
stated in Table 19.
The same method and efficiencies are used for all other capacities of CHP unit.
Table 19 – Scenario 2 Summary (CHP outputs)
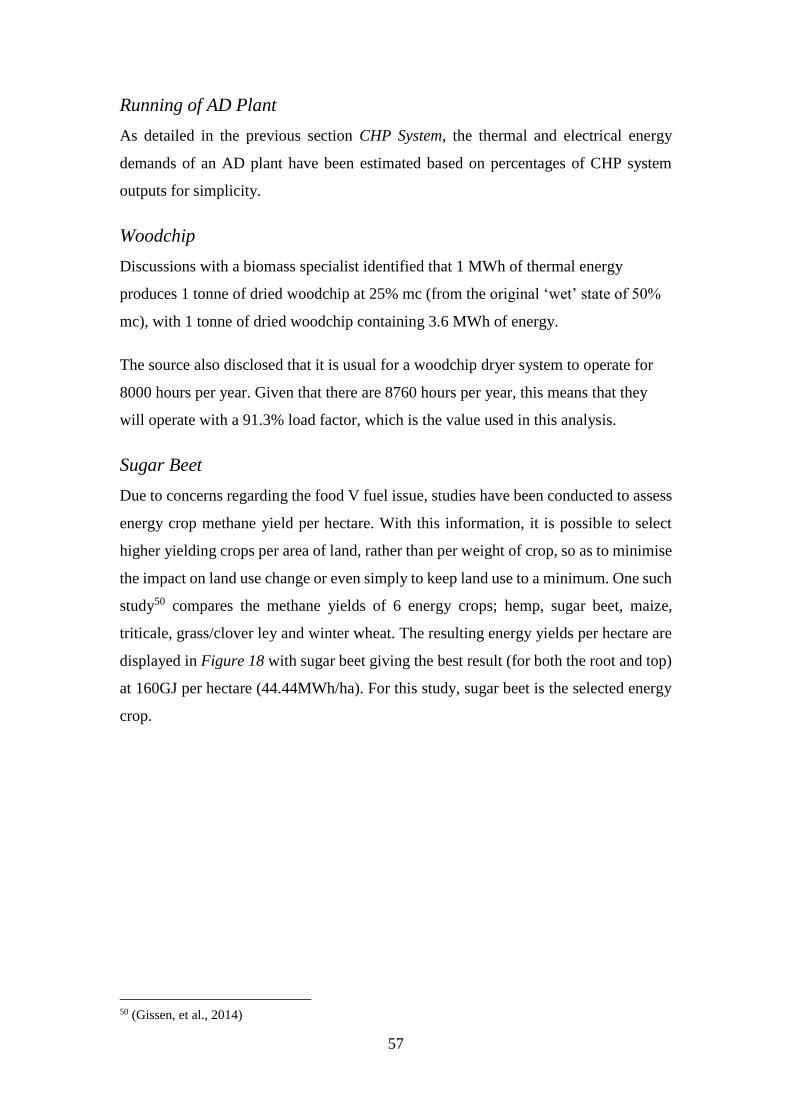
57
Running of AD Plant
As detailed in the previous section CHP System, the thermal and electrical energy
demands of an AD plant have been estimated based on percentages of CHP system
outputs for simplicity.
Woodchip
Discussions with a biomass specialist identified that 1 MWh of thermal energy
produces 1 tonne of dried woodchip at 25% mc (from the original ‘wet’ state of 50%
mc), with 1 tonne of dried woodchip containing 3.6 MWh of energy.
The source also disclosed that it is usual for a woodchip dryer system to operate for
8000 hours per year. Given that there are 8760 hours per year, this means that they
will operate with a 91.3% load factor, which is the value used in this analysis.
Sugar Beet
Due to concerns regarding the food V fuel issue, studies have been conducted to assess
energy crop methane yield per hectare. With this information, it is possible to select
higher yielding crops per area of land, rather than per weight of crop, so as to minimise
the impact on land use change or even simply to keep land use to a minimum. One such
study50 compares the methane yields of 6 energy crops; hemp, sugar beet, maize,
triticale, grass/clover ley and winter wheat. The resulting energy yields per hectare are
displayed in Figure 18 with sugar beet giving the best result (for both the root and top)
at 160GJ per hectare (44.44MWh/ha). For this study, sugar beet is the selected energy
crop.
50 (Gissen, et al., 2014)
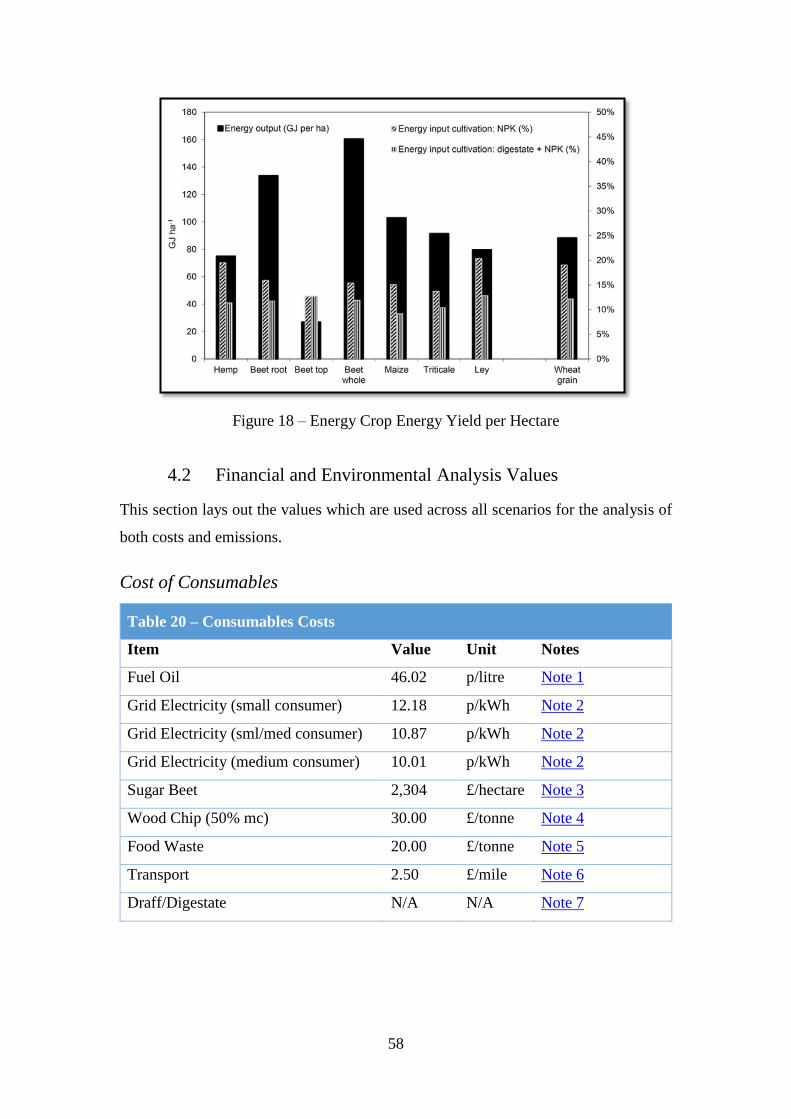
58
Figure 18 – Energy Crop Energy Yield per Hectare
4.2 Financial and Environmental Analysis Values
This section lays out the values which are used across all scenarios for the analysis of
both costs and emissions.
Cost of Consumables
Table 20 – Consumables Costs
Item Value Unit Notes
Fuel Oil 46.02 p/litre Note 1
Grid Electricity (small consumer) 12.18 p/kWh Note 2
Grid Electricity (sml/med consumer) 10.87 p/kWh Note 2
Grid Electricity (medium consumer) 10.01 p/kWh Note 2
Sugar Beet 2,304 £/hectare Note 3
Wood Chip (50% mc) 30.00 £/tonne Note 4
Food Waste 20.00 £/tonne Note 5
Transport 2.50 £/mile Note 6
Draff/Digestate N/A N/A Note 7

59
Notes:
1. This is the average cost of standard grade burning oil from 2005 – 201551 (see
Figure 19). Due to the volatility of oil fuel prices, a longer term average was
taken rather than a single month or year average.
Also note that to obtain estimates of fuel volume in litres, an energy conversion
factor of 11.35kWh/litre was used, which is the midpoint value between
medium and heavy fuel52.
Figure 19 – Fuel Oil Prices 2006 - 2015
2. The grid electricity costs are for non-domestic consumers, defined as follows53:
Small consumer: 20 – 499 MWh/year
Small/Medium consumer: 50 – 1,999 MWh/year
Medium consumer: 2,000 – 19,999 MWh/year
3. The cost of sugar beet as a feedstock for biogas takes into account production
and supply costs and results in a total cost per energy output from anaerobic
digestion54. This value has been converted to a cost per hectare of land for this
analysis.
4. Wood chip cost per tonne was supplied by a biomass professional. The cost
assumes that short rotation coppice willow is chipped on harvest and supplied
directly in ‘green’ state (50% mc).
51 (UK Government, 2016(b)) 52 (Jacobs, 2008) 53 (UK Government, 2016) 54 (Gissen, et al., 2014)
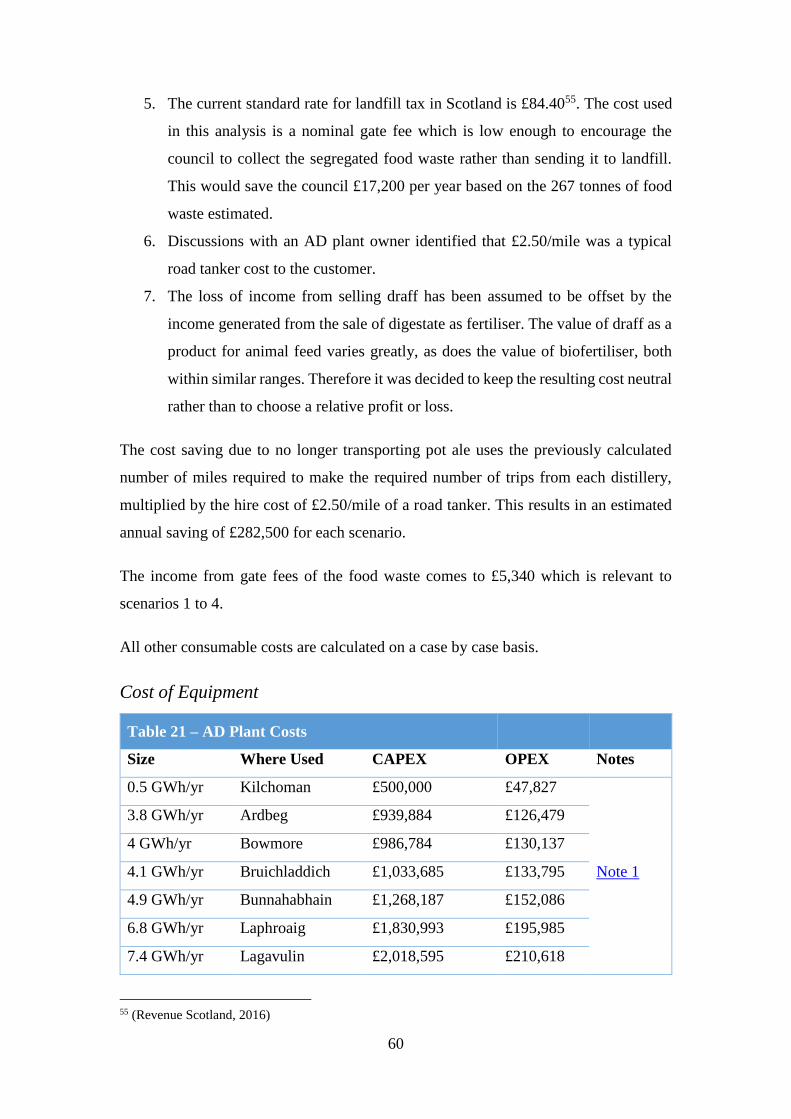
60
5. The current standard rate for landfill tax in Scotland is £84.4055. The cost used
in this analysis is a nominal gate fee which is low enough to encourage the
council to collect the segregated food waste rather than sending it to landfill.
This would save the council £17,200 per year based on the 267 tonnes of food
waste estimated.
6. Discussions with an AD plant owner identified that £2.50/mile was a typical
road tanker cost to the customer.
7. The loss of income from selling draff has been assumed to be offset by the
income generated from the sale of digestate as fertiliser. The value of draff as a
product for animal feed varies greatly, as does the value of biofertiliser, both
within similar ranges. Therefore it was decided to keep the resulting cost neutral
rather than to choose a relative profit or loss.
The cost saving due to no longer transporting pot ale uses the previously calculated
number of miles required to make the required number of trips from each distillery,
multiplied by the hire cost of £2.50/mile of a road tanker. This results in an estimated
annual saving of £282,500 for each scenario.
The income from gate fees of the food waste comes to £5,340 which is relevant to
scenarios 1 to 4.
All other consumable costs are calculated on a case by case basis.
Cost of Equipment
Table 21 – AD Plant Costs
Size Where Used CAPEX OPEX Notes
0.5 GWh/yr Kilchoman £500,000 £47,827
Note 1
3.8 GWh/yr Ardbeg £939,884 £126,479
4 GWh/yr Bowmore £986,784 £130,137
4.1 GWh/yr Bruichladdich £1,033,685 £133,795
4.9 GWh/yr Bunnahabhain £1,268,187 £152,086
6.8 GWh/yr Laphroaig £1,830,993 £195,985
7.4 GWh/yr Lagavulin £2,018,595 £210,618
55 (Revenue Scotland, 2016)

61
Table 21 – AD Plant Costs
Size Where Used CAPEX OPEX Notes
18 GWh/yr Caol Ila £5,207,829 £459,378
50 GWh/yr Scenarios 1 & 2 £14,740,141 £1,202,899
66 GWh/yr Scenario 3 £19,580,752 £1,580,466
71 GWh/yr Scenario 4 £21,086,386 £1,697,906
Note:
1. AD Plant costs have been taken from financial information provided by the
ADBA. Capital and operating costs of anaerobic digestion plants of various
sizes (based on energy value output from biogas production) were provided,
which were plotted on graphs to check for relationships, see Figure 20. In both
cases, relatively linear relationships were found and therefore was used for
estimated figures in this study.
The capital costs include feasibility studies, planning applications (including
impact assessments), land costs, civil works, feedstock pretreatment/storage
equipment, AD plant equipment such as feedstock feeding equipment, digestion
tanks and gas holders. Operational costs include staff costs (training and
salaries), plant maintenance and insurance.
Figure 20 – AD Plant Capital and Running Costs

62
Table 22 – Biogas Boiler Costs
Size Where Used CAPEX OPEX Notes
100 kW Kilchoman £58,881 £2,944
Note 2
150 kW AD plant (scenarios 1 & 2) £59,580 £2,979
800 kW Ardbeg £68,660 £3,433
850 kW Bruichladdich & Bowmore £69,359 £3,468
1050 kW Bunnahabhain £72,153 £3,608
1400 kW Laphroaig £77,042 £3,852
1550 kW Lagavulin £79,138 £3,957
1750 kW Caol Ila £81,932 £4,097
3000 kW Ardbeg (scenario 2) £99,394 £4,970
3750 kW Caol Ila £109,872 £5,494
5500 kW Laphroaig (scenario 1) £134,319 £6,716
6000 kW Lagavulin (scenarios 1 & 2) £141,304 £7,065
7000 kW Wood Chip Drying (scenario 4) £155,274 £7,764
7150 kW Wood Chip Drying and AD
Plant (scenario 3)
£157,370 £7,868
Note:
2. Biogas boiler costs have been taken from an economic tool developed by an
MSc group from the University of Strathclyde56. The tool uses costs which were
obtained from biogas boiler suppliers.
Table 23 – Biomass Boiler Costs
Size Where Used CAPEX OPEX Notes
500 kW Kilchoman (scenario 3) £95,000 £4,750
Note 3
3000 kW Bowmore (scenario 2) £570,000 £28,500
3500 kW Bowmore, Ardbeg &
Bruichladdich (scenarios 3
&4)
£665,000 £33,250
56 (Allardyce, Baster, Kirk, & Lamond, 2011)

63
Table 23 – Biomass Boiler Costs
Size Where Used CAPEX OPEX Notes
4000 kW Bunnahabhain (scenarios 3 &
4)
£760,000 £38,000
5500 kW Laphroaig (scenarios 3 & 4) £1,045,000 £52,250
6000 kW Lagavulin (scenarios 3 & 4) £1,140,000 £57,000
14500 kW Caol Ila (scenarios 3 & 4) £2,755,000 £137,750
Note:
3. Biomass boiler capital costs were assumed to be £190 per kW capacity. This is
the average value as quoted by the biomass energy centre57 which states that
above 500kW capacity, capital costs are in the range of £150-230/kW as a
general guide. The operational costs have been calculated at 5% the capital
costs, in-line with that of the biogas boiler operational cost estimates.
Table 24 – CHP System Costs
Size Where Used CAPEX OPEX Notes
50 kWe Kilchoman £430,000 £2,160
Note 4
200 kWe Ardbeg £173,000 £8,650
250 kWe Bruichladdich & Bowmore £216,000 £10,800
300 kWe Bunnahabhain £260,000 £13,000
400 kWe Laphroaig & Lagavulin £346,000 £17,300
500 kWe AD Plant (scenarios 2 & 4) and
Caol Ila
£430,000 £21,500
Note:
4. General CHP costs were obtained from an AD plant owner. It was stated that in
general, capital costs are around €1,000/kWe capacity, which has been
converted to pounds sterling here. Again, operational costs have been estimated
at 5% of the capital cost.
57 (Biomass Energy Centre, 2004)

64
Table 25 – Rising Main Pump System Costs
Size Where Used CAPEX OPEX Notes
62,280m Feedstock system (scenarios 1 - 4) £1,555,000 £77,850
Note 5 22,209m Biogas system (scenario 1) £555,222 £27,761
23,979m Biogas system (scenario 2) £599,479 £29,974
Note:
5. Ring main pump system costs came from an industrial source who stated that
£20/m was a general cost for hardware (including pumps) and installation of
this type of system. Due to the uncertainty of this figure, 25% has been added,
with £25/m being used for the estimated costs. Again, 5% of capital costs are
used for operational costs per year.
Scenario costs have been calculated on an overall basis. There are many options as to
how the systems could be financially set up which is outwith the scope of this study.
Here, total capital, operation and maintenance costs are offset against all cost savings
from income generated and energy saved etc. This provides an initial review of the
options, which can provide a basis for more detailed feasibility studies in the future.
Selling of existing equipment has not been considered in the cost calculations. For
example where a new boiler is to be installed, the calculations have not accounted for
the possible income from the sale of the existing fuel oil boiler.
Payback period method is used as a comparator between scenarios of time taken for
each project to pay for itself. Time value of money is not considered in this method.
CO2 Values
Table 26 – CO2 Values used in Calculations
Item Value Unit Notes
Fuel Oil 3.18058 kgCO2e/litre Note 1
Diesel 2.61163 kgCO2e/litre Note 1
Grid Electricity 0.41205 kgCO2e/litre Note 1
Sugar Beet 1295.9 kgCO2e/tonne Note 2
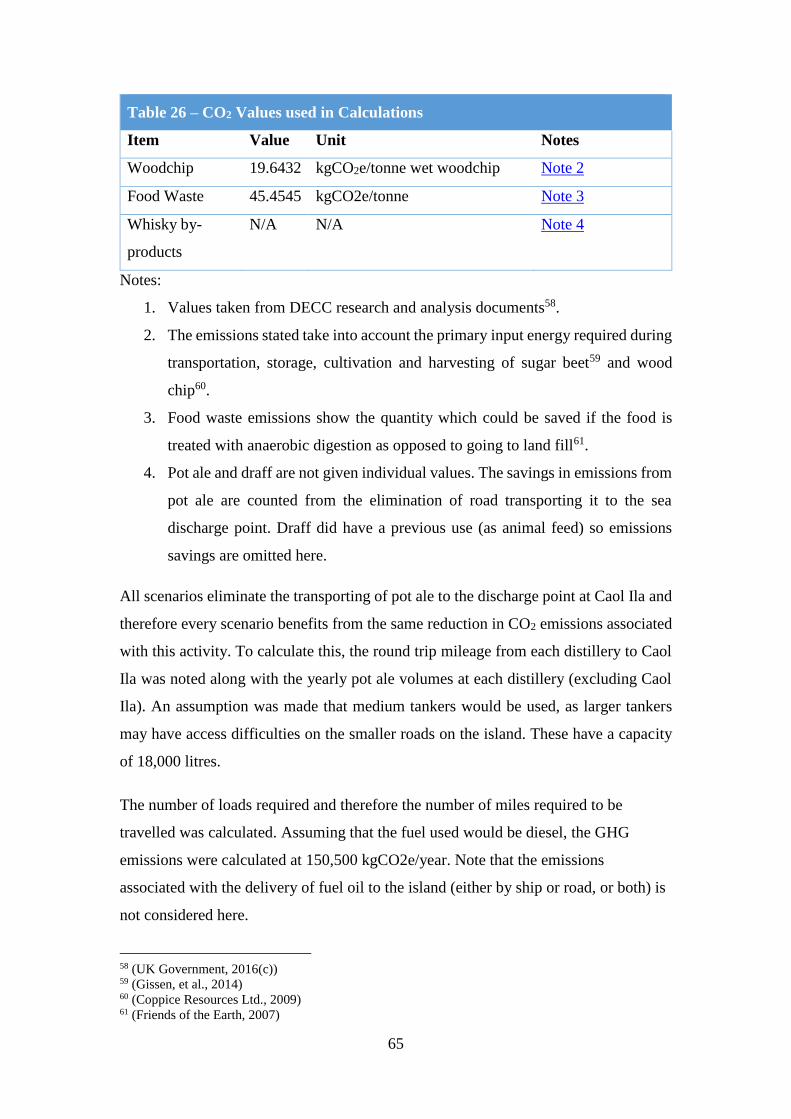
65
Table 26 – CO2 Values used in Calculations
Item Value Unit Notes
Woodchip 19.6432 kgCO2e/tonne wet woodchip Note 2
Food Waste 45.4545 kgCO2e/tonne Note 3
Whisky by-
products
N/A N/A Note 4
Notes:
1. Values taken from DECC research and analysis documents58.
2. The emissions stated take into account the primary input energy required during
transportation, storage, cultivation and harvesting of sugar beet59 and wood
chip60.
3. Food waste emissions show the quantity which could be saved if the food is
treated with anaerobic digestion as opposed to going to land fill61.
4. Pot ale and draff are not given individual values. The savings in emissions from
pot ale are counted from the elimination of road transporting it to the sea
discharge point. Draff did have a previous use (as animal feed) so emissions
savings are omitted here.
All scenarios eliminate the transporting of pot ale to the discharge point at Caol Ila and
therefore every scenario benefits from the same reduction in CO2 emissions associated
with this activity. To calculate this, the round trip mileage from each distillery to Caol
Ila was noted along with the yearly pot ale volumes at each distillery (excluding Caol
Ila). An assumption was made that medium tankers would be used, as larger tankers
may have access difficulties on the smaller roads on the island. These have a capacity
of 18,000 litres.
The number of loads required and therefore the number of miles required to be
travelled was calculated. Assuming that the fuel used would be diesel, the GHG
emissions were calculated at 150,500 kgCO2e/year. Note that the emissions
associated with the delivery of fuel oil to the island (either by ship or road, or both) is
not considered here.
58 (UK Government, 2016(c)) 59 (Gissen, et al., 2014) 60 (Coppice Resources Ltd., 2009) 61 (Friends of the Earth, 2007)

66
In scenarios 1 to 4 where it is assumed that food waste will be added to the feedstock,
the same carbon saving is seen by all. This comes to 12,100 kgCO2e/year based on
the 267 tonnes of food waste per year estimated.
All other carbon emissions are calculated on a case by case basis.
Land Use
Table 27 – Land Area Requirement
Item Value Notes
Short rotation coppice willow 15 hectares/wet tonne Note 1
Sugar beet 0.0225 hectares/MWh Note 2
AD Plant Negligible Note 3
Notes:
1. This value was provided by a biomass specialist and backed up by information
from the Biomass Energy Centre62.
2. Derived from the previously detailed sugar beet energy yield of 44.44MWh per
hectare.
3. The AD plant area required is assumed negligible as it will either be on distillery
land or for the central plant, take up land in the region of several hectares as
opposed to hundreds or thousands of hectares.
62 (Biomass Energy Centre, 2016)

67
4.3 Scenario 1 – Heat Only
Technical Configuration
The first scenario comprises a central AD plant which pumps produced biogas to the
distilleries for use in biogas boilers. CHP is not utilised. AD plant parasitic loads and
electricity to run pumps comes from on-site biogas boiler and electricity imported from
the grid. Figure 21 shows the concept idea in schematic form.
Figure 21 – Scenario 1 Concept Schematic
Energy Analysis and Results
Using values discussed in Energy Analysis Values, energy analysis calculations were
performed in Excel with the resulting thermal energy outputs shown in Table 28. Figure
22 displays these results graphically, with each bar representing the range of estimation
from lower to upper values.
Table 28 – Scenario 1 Energy Output Summary
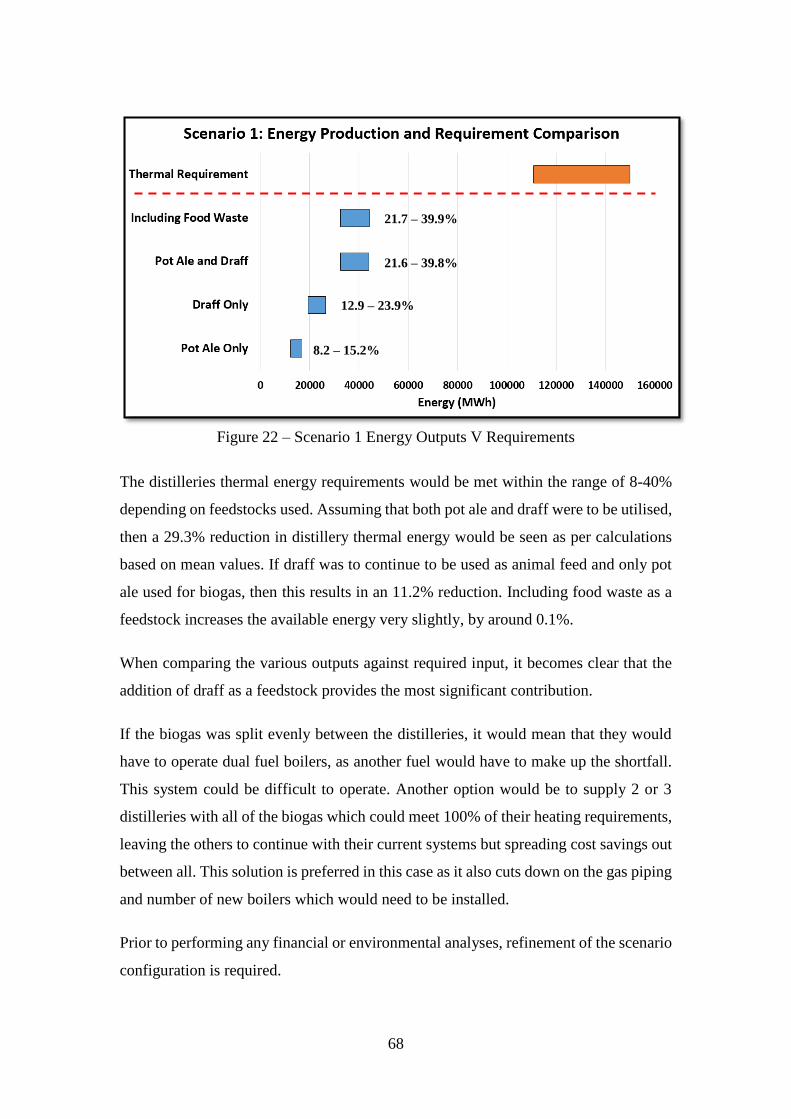
68
Figure 22 – Scenario 1 Energy Outputs V Requirements
The distilleries thermal energy requirements would be met within the range of 8-40%
depending on feedstocks used. Assuming that both pot ale and draff were to be utilised,
then a 29.3% reduction in distillery thermal energy would be seen as per calculations
based on mean values. If draff was to continue to be used as animal feed and only pot
ale used for biogas, then this results in an 11.2% reduction. Including food waste as a
feedstock increases the available energy very slightly, by around 0.1%.
When comparing the various outputs against required input, it becomes clear that the
addition of draff as a feedstock provides the most significant contribution.
If the biogas was split evenly between the distilleries, it would mean that they would
have to operate dual fuel boilers, as another fuel would have to make up the shortfall.
This system could be difficult to operate. Another option would be to supply 2 or 3
distilleries with all of the biogas which could meet 100% of their heating requirements,
leaving the others to continue with their current systems but spreading cost savings out
between all. This solution is preferred in this case as it also cuts down on the gas piping
and number of new boilers which would need to be installed.
Prior to performing any financial or environmental analyses, refinement of the scenario
configuration is required.
8.2 – 15.2%
12.9 – 23.9%
21.6 – 39.8%
21.7 – 39.9%

69
Reviewing Table 8 (Distillery Thermal Requirements) and Table 28 (Biogas Boiler
Thermal Output) allows the selection of distilleries to receive biogas for heating. By
also bearing in mind Figure 15 (Map of Islay Distilleries) and the three distinct
groupings of distilleries, a solution can be selected which keeps the gas piping
requirement to a minimum. In this case, only mean values are used for simplicity and
it is assumed that the maximum available feedstock is utilised, i.e. pot ale, draff and
food waste.
With an available thermal output from combustion of biogas in boilers of 38,340 MWh,
a group of distilleries were assessed to find a closely matching requirement. One
possibility is Laphroaig & Lagavulin, which have a joint thermal requirement of 37,241
MWh. This leaves an additional 1099 MWh of biogas as a deficit. For the purpose of
these calculations, it will be assumed that this deficit is also absorbed by the distilleries
needs, i.e. the assumed thermal energy used by the two distilleries equals that of which
is available; 38,340 MWh.
Figure 23 shows an updated schematic which represents this idea, with biogas pipes
leading to these two distilleries and original fuel oil boilers remaining at the others.
Following the same methodology as calculating the energy to pump the feedstock
slurry, the energy to pump biogas was calculated as 41 MWh/year.
Figure 23 – Scenario 1 Proposed Solution Schematic

70
Financial and Environmental Analysis Results
Using data supplied in Financial and Environmental Analysis Values, costs for scenario
1 were calculated as shown in Table 29.
Table 29 – Scenario 1 Financial and Environmental Analysis Results
Equipment CAPEX OPEX
AD plant -£14,740,141 -£1,202,899
On-site biogas boiler -£59,580 -£2,979
Feedstock and biogas rising main pump systems -£2,112,222 -£105,611
2 off distillery biogas boilers -£275,623 -£13,781
Additional Fuel Cost
Electricity imported for AD plant -£29,009
Electricity imported for feedstock pumps -£11,878
Income from food waste gate fees £5,340
Fuel Saving Cost
Fuel oil reduction of 3.4 million litres per year £1,554,534
Subsidies Income Cost
RHI from AD plant biogas boiler £44,652
RHI from two distillery biogas boilers £736,976
Others Cost
Saving from transportation of pot ale £282,534
GHG Emission Reduction Value
Saving from pot ale transportation 151 tCO2e
Saving from fuel oil reduction 10,744 tCO2e
Increase from importing of electricity -138 tCO2e
Saving from the AD of food waste 12 tCO2e
Summary of Scenario 1 Results
Table 30 – Scenario 1 Results Summary
Total Capital Investment Required -£17,187,566
Percentage of Fuel Oil Reduction 29.4%
Net Energy Reduction (electricity and fuel oil) 28.0%
Yearly GHG Emissions Saving 10,768 tCO2e
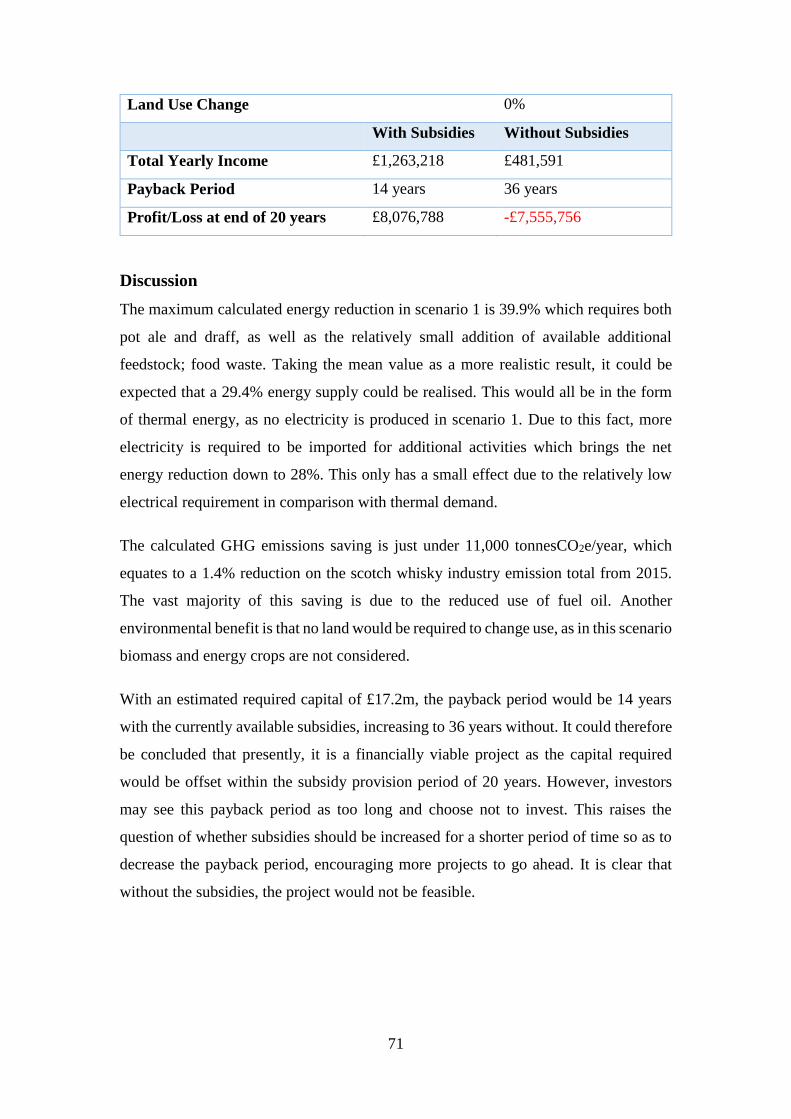
71
Land Use Change 0%
With Subsidies Without Subsidies
Total Yearly Income £1,263,218 £481,591
Payback Period 14 years 36 years
Profit/Loss at end of 20 years £8,076,788 -£7,555,756
Discussion
The maximum calculated energy reduction in scenario 1 is 39.9% which requires both
pot ale and draff, as well as the relatively small addition of available additional
feedstock; food waste. Taking the mean value as a more realistic result, it could be
expected that a 29.4% energy supply could be realised. This would all be in the form
of thermal energy, as no electricity is produced in scenario 1. Due to this fact, more
electricity is required to be imported for additional activities which brings the net
energy reduction down to 28%. This only has a small effect due to the relatively low
electrical requirement in comparison with thermal demand.
The calculated GHG emissions saving is just under 11,000 tonnesCO2e/year, which
equates to a 1.4% reduction on the scotch whisky industry emission total from 2015.
The vast majority of this saving is due to the reduced use of fuel oil. Another
environmental benefit is that no land would be required to change use, as in this scenario
biomass and energy crops are not considered.
With an estimated required capital of £17.2m, the payback period would be 14 years
with the currently available subsidies, increasing to 36 years without. It could therefore
be concluded that presently, it is a financially viable project as the capital required
would be offset within the subsidy provision period of 20 years. However, investors
may see this payback period as too long and choose not to invest. This raises the
question of whether subsidies should be increased for a shorter period of time so as to
decrease the payback period, encouraging more projects to go ahead. It is clear that
without the subsidies, the project would not be feasible.

72
4.4 Scenario 2 – CHP On-Site, Heat at Distilleries
Technical Configuration
This scenario considers the addition of a 500kWe CHP unit on-site at the central plant,
with the remaining biogas being used at distilleries in biogas boilers. The aim of this
scenario is to investigate whether the produced electricity can offset the additional
requirement to import from the grid as well as increase the financial income from FIT.
The effect on available biogas for use at the distilleries will be analysed.
There is likely to be an excess of heat available on-site due to the set thermal output
from the 500kWhe CHP unit. A use for this thermal energy in the form of biomass
drying will also be considered, which could be used as fuel at some of the distilleries to
supplement the biogas supply as illustrated in Figure 24.
Figure 24 – Scenario 2 Concept Schematic
Energy Analysis and Results
As there will be a grid connection the electricity can be easily exported and
distributed to wherever required. However there is no thermal requirement at the site
location (other than parasitic load), therefore the creation of a requirement in the form
of biomass drying has been investigated. There is 3027 MWh of thermal energy
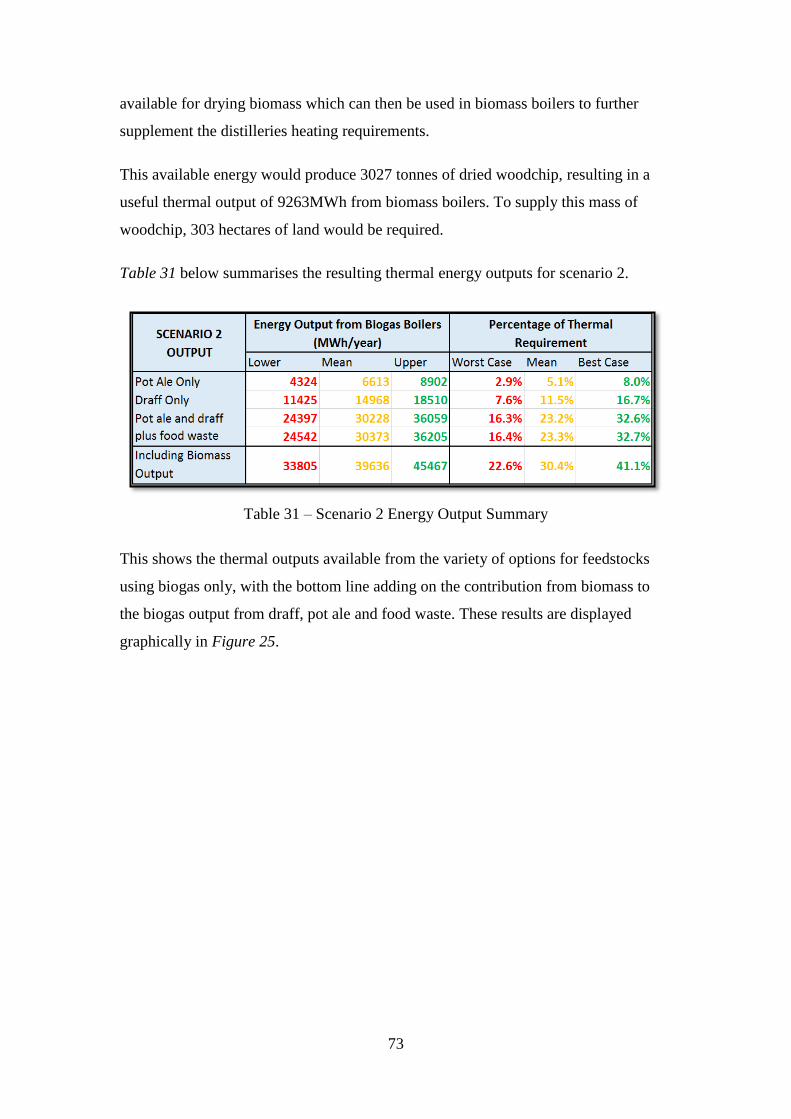
73
available for drying biomass which can then be used in biomass boilers to further
supplement the distilleries heating requirements.
This available energy would produce 3027 tonnes of dried woodchip, resulting in a
useful thermal output of 9263MWh from biomass boilers. To supply this mass of
woodchip, 303 hectares of land would be required.
Table 31 below summarises the resulting thermal energy outputs for scenario 2.
Table 31 – Scenario 2 Energy Output Summary
This shows the thermal outputs available from the variety of options for feedstocks
using biogas only, with the bottom line adding on the contribution from biomass to
the biogas output from draff, pot ale and food waste. These results are displayed
graphically in Figure 25.
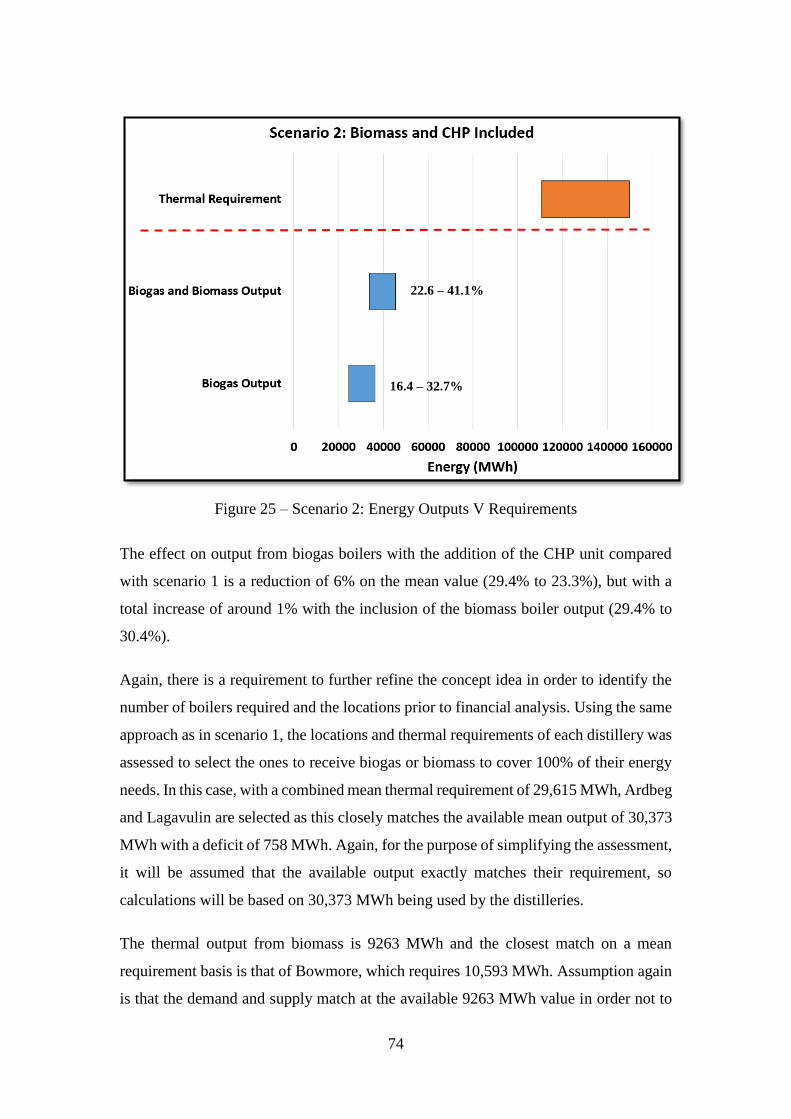
74
Figure 25 – Scenario 2: Energy Outputs V Requirements
The effect on output from biogas boilers with the addition of the CHP unit compared
with scenario 1 is a reduction of 6% on the mean value (29.4% to 23.3%), but with a
total increase of around 1% with the inclusion of the biomass boiler output (29.4% to
30.4%).
Again, there is a requirement to further refine the concept idea in order to identify the
number of boilers required and the locations prior to financial analysis. Using the same
approach as in scenario 1, the locations and thermal requirements of each distillery was
assessed to select the ones to receive biogas or biomass to cover 100% of their energy
needs. In this case, with a combined mean thermal requirement of 29,615 MWh, Ardbeg
and Lagavulin are selected as this closely matches the available mean output of 30,373
MWh with a deficit of 758 MWh. Again, for the purpose of simplifying the assessment,
it will be assumed that the available output exactly matches their requirement, so
calculations will be based on 30,373 MWh being used by the distilleries.
The thermal output from biomass is 9263 MWh and the closest match on a mean
requirement basis is that of Bowmore, which requires 10,593 MWh. Assumption again
is that the demand and supply match at the available 9263 MWh value in order not to
16.4 – 32.7%
22.6 – 41.1%
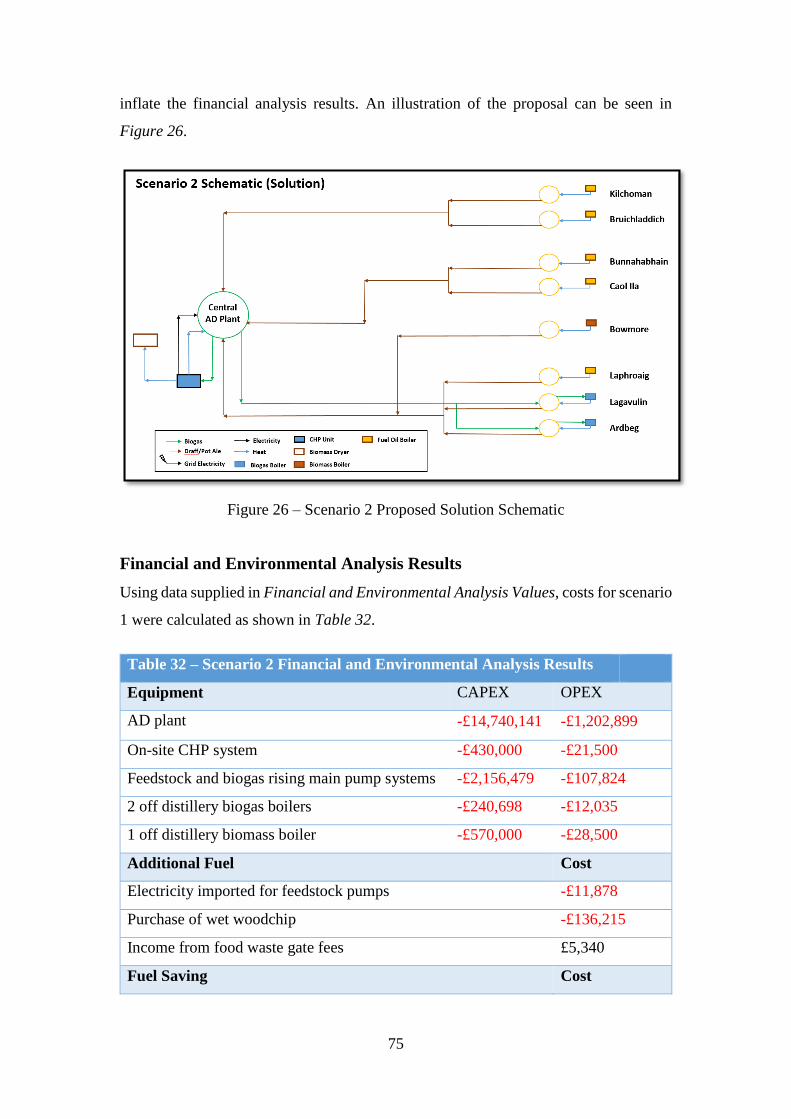
75
inflate the financial analysis results. An illustration of the proposal can be seen in
Figure 26.
Figure 26 – Scenario 2 Proposed Solution Schematic
Financial and Environmental Analysis Results
Using data supplied in Financial and Environmental Analysis Values, costs for scenario
1 were calculated as shown in Table 32.
Table 32 – Scenario 2 Financial and Environmental Analysis Results
Equipment CAPEX OPEX
AD plant -£14,740,141 -£1,202,899
On-site CHP system -£430,000 -£21,500
Feedstock and biogas rising main pump systems -£2,156,479 -£107,824
2 off distillery biogas boilers -£240,698 -£12,035
1 off distillery biomass boiler -£570,000 -£28,500
Additional Fuel Cost
Electricity imported for feedstock pumps -£11,878
Purchase of wet woodchip -£136,215
Income from food waste gate fees £5,340
Fuel Saving Cost
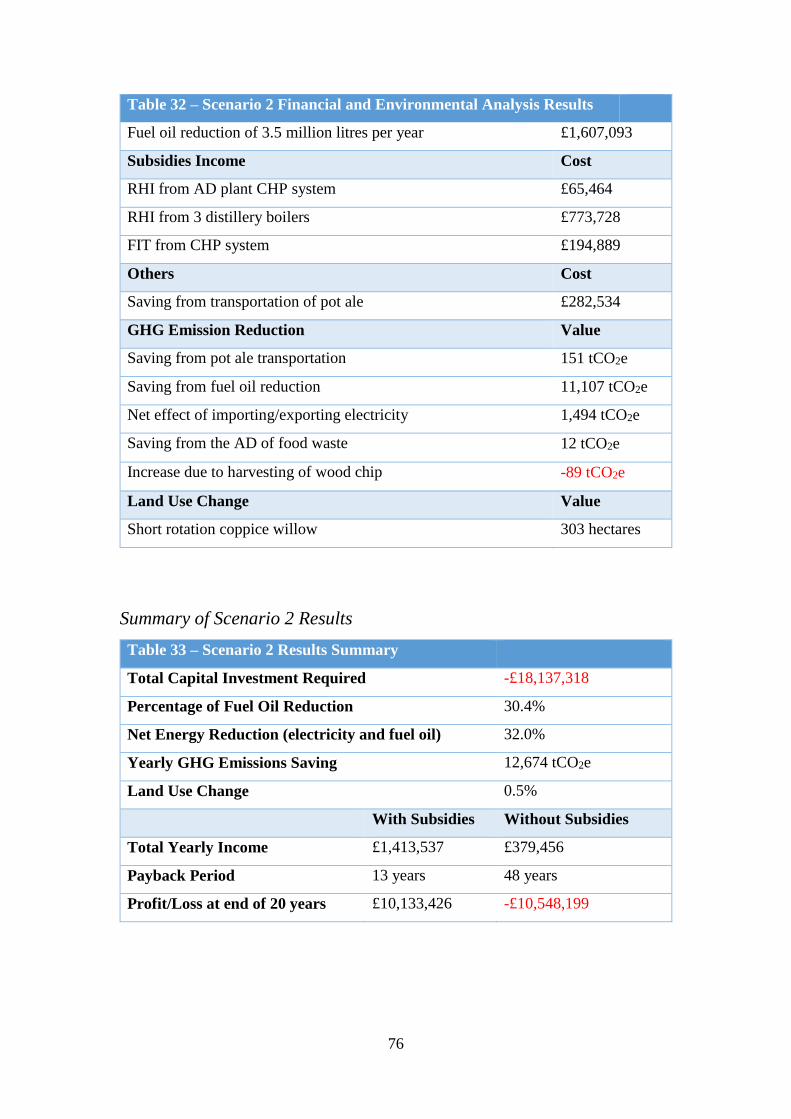
76
Table 32 – Scenario 2 Financial and Environmental Analysis Results
Fuel oil reduction of 3.5 million litres per year £1,607,093
Subsidies Income Cost
RHI from AD plant CHP system £65,464
RHI from 3 distillery boilers £773,728
FIT from CHP system £194,889
Others Cost
Saving from transportation of pot ale £282,534
GHG Emission Reduction Value
Saving from pot ale transportation 151 tCO2e
Saving from fuel oil reduction 11,107 tCO2e
Net effect of importing/exporting electricity 1,494 tCO2e
Saving from the AD of food waste 12 tCO2e
Increase due to harvesting of wood chip -89 tCO2e
Land Use Change Value
Short rotation coppice willow 303 hectares
Summary of Scenario 2 Results
Table 33 – Scenario 2 Results Summary
Total Capital Investment Required -£18,137,318
Percentage of Fuel Oil Reduction 30.4%
Net Energy Reduction (electricity and fuel oil) 32.0%
Yearly GHG Emissions Saving 12,674 tCO2e
Land Use Change 0.5%
With Subsidies Without Subsidies
Total Yearly Income £1,413,537 £379,456
Payback Period 13 years 48 years
Profit/Loss at end of 20 years £10,133,426 -£10,548,199

77
Discussion
The percentage of fuel oil reduction is estimated to be 30.4% which is only a 1%
increase on scenario 1, however there is the added benefit that electricity is produced
from the CHP unit, bringing the total energy reduction up to 32% (from 28% in
scenario 1).
GHG emissions are slightly higher at 12.6k tCO2e, which would provide a 1.7%
decrease for the whisky industry based on the 2015 total. Again, this is largely due to
the reduced use of fuel oil. As scenario 2 incorporates the drying of biomass, land is
required for the harvest of this willow supply estimated at around 300 hectares which
is 0.5% of the total land area of Islay.
With an estimated required capital of £18.1m, the payback period would be 13 years
with currently available subsidies but 48 years without. This is an improvement on
scenario 1 of a year. So it is still questionable as to whether this can be considered
financially viable given that investors would most likely prefer a shorter payback
period. However there is no question that it would not be viable in the future with no
support from incentive schemes. With further use of electricity on-site, greater
benefits would be seen with additional savings from a reduction in imported
electricity. With careful planning, perhaps the AD site could be placed near to a
suitable source of electrical demand which could make use of the excess generated
electricity.

78
4.5 Scenario 3 – Optimisation of Biomass Drying
Technical Configuration
Scenario 3 looks to optimise the biomass drying aspect from scenario 2. All distilleries
will have a biomass boiler as a replacement for their current oil system, with all biogas
being combusted at the central site through a biogas boiler to dry biomass. No CHP is
utilised. The concept is illustrated schematically in Figure 27. The quantity of biomass
required to cover 100% of the distilleries thermal requirements and the amount of
biogas and land area required to do this are calculated.
Figure 27 – Scenario 3 Concept Schematic
Energy Analysis and Results
This scenario uses a backward working method, starting with the thermal requirement
in order to identify the mass of woodchip required to meet this demand, along with the
quantity of biogas required to dry the woodchip from 50% mc to 25% mc. Results of
these calculations are summarised in Table 34. The bottom line shows the surplus or
deficit of biogas which will exist from best to worst case scenario.
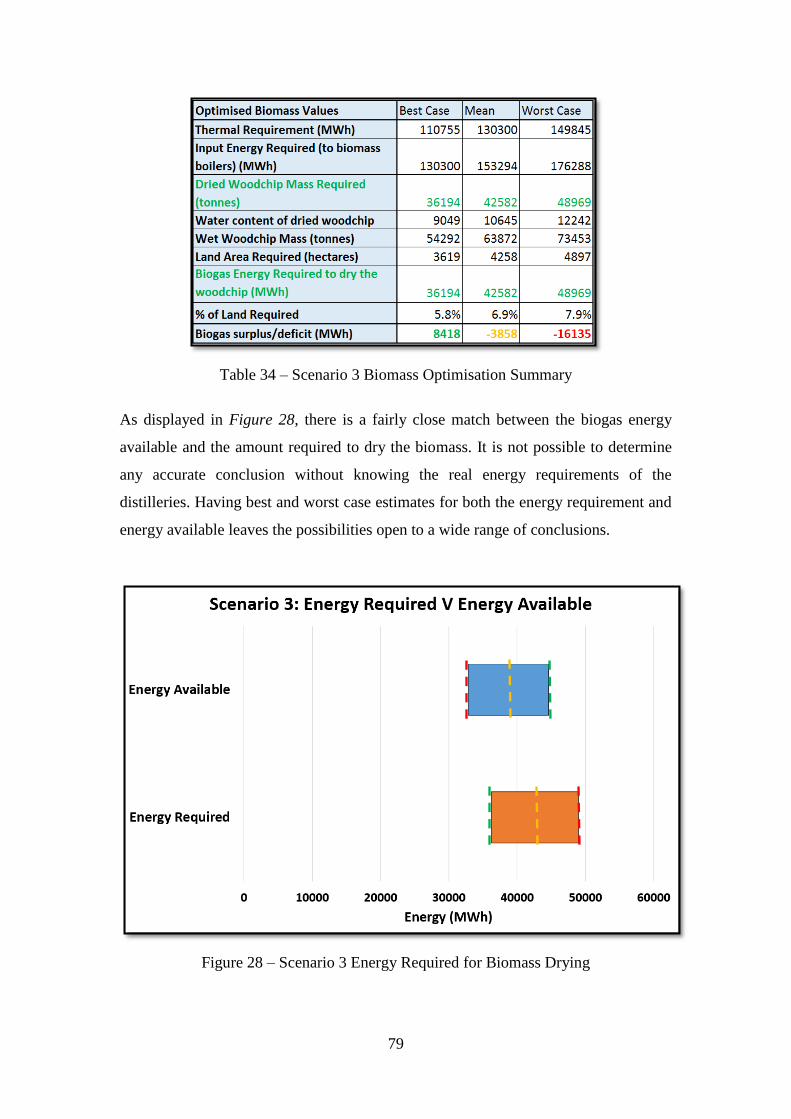
79
Table 34 – Scenario 3 Biomass Optimisation Summary
As displayed in Figure 28, there is a fairly close match between the biogas energy
available and the amount required to dry the biomass. It is not possible to determine
any accurate conclusion without knowing the real energy requirements of the
distilleries. Having best and worst case estimates for both the energy requirement and
energy available leaves the possibilities open to a wide range of conclusions.
Figure 28 – Scenario 3 Energy Required for Biomass Drying

80
The worst case scenario (as denoted by the red dashed lines) would mean that there was
a deficit of 16,135 MWh per year. The best case scenario (as denoted by the green
dashed lines) would give a surplus of 8,418 MWh per year. Although it is unlikely that
the reality of the situation would fall at either of these extreme ends of the spectrum,
without real data they must still be considered as possibilities. Going on a mean value
basis, there would be a deficit of 3,858 MWh per year.
To make up the deficit, sugar beet was selected as a high yielding feedstock for
anaerobic digestion. For each case (from best to worst), the quantity of sugar beet which
would be required has been calculated, results shown in Table 35.
Table 35 – Scenario 3 Sugar Beet Requirements
To provide the energy required for biogas drying, a 7MW biogas boiler was selected,
which will also provide heat to run the AD plant.
Financial and Environmental Analysis Results
Table 36 – Scenario 3 Financial and Environmental Analysis Results
Equipment CAPEX OPEX
AD plant -£19,580,752 -£1,580,466
On-site biogas boiler (woodchip drying and AD
plant heating) -£155,274 -£7,764
Feedstock rising main pump system -£1,557,000 -£77,850
8 off distillery biomass boilers -£7,790,000 -£389,500
Additional Fuel Cost
Electricity imported for AD plant and feedstock pumps -£35,885
Purchase of wet woodchip -£1,916,174
Purchase of sugar beet -£200,044
Income from food waste gate fees £5,340
Fuel Saving Cost

81
Table 36 – Scenario 3 Financial and Environmental Analysis Results
Fuel oil reduction of 11.5 million litres per year £5,283,171
Subsidies Income Cost
RHI from AD plant woodchip dryer £781,314
RHI from 8 distillery boilers £2,671,147
Others Cost
Saving from transportation of pot ale £282,534
GHG Emission Reduction Value
Saving from pot ale transportation 151 tCO2e
Saving from fuel oil reduction 36,514 tonnes
Increase from the importing of electricity -81 tCO2e
Saving from the AD of food waste 12 tCO2e
Increase due to harvesting of woodchip -1,443 tCO2e
Increase due to harvesting of sugar beet -113 tCO2e
Land Use Change Value
Short rotation coppice willow 4258 hectares
Sugar beet 87 hectares
Summary of Scenario 3 Results
Table 37 – Scenario 3 Results Summary
Total Capital Investment Required -£29,083,026
Percentage of Fuel Oil Reduction 100%
Net Energy Reduction (electricity and fuel oil) 95.7%
Yearly GHG Emissions Saving 35,040 tCO2e
Land Use Change 7%
With Subsidies Without Subsidies
Total Yearly Income £4,821,163 £1,368,702
Payback Period 7 years 22 years
Profit/Loss at end of 20 years £67,340,225 -£1,708,995
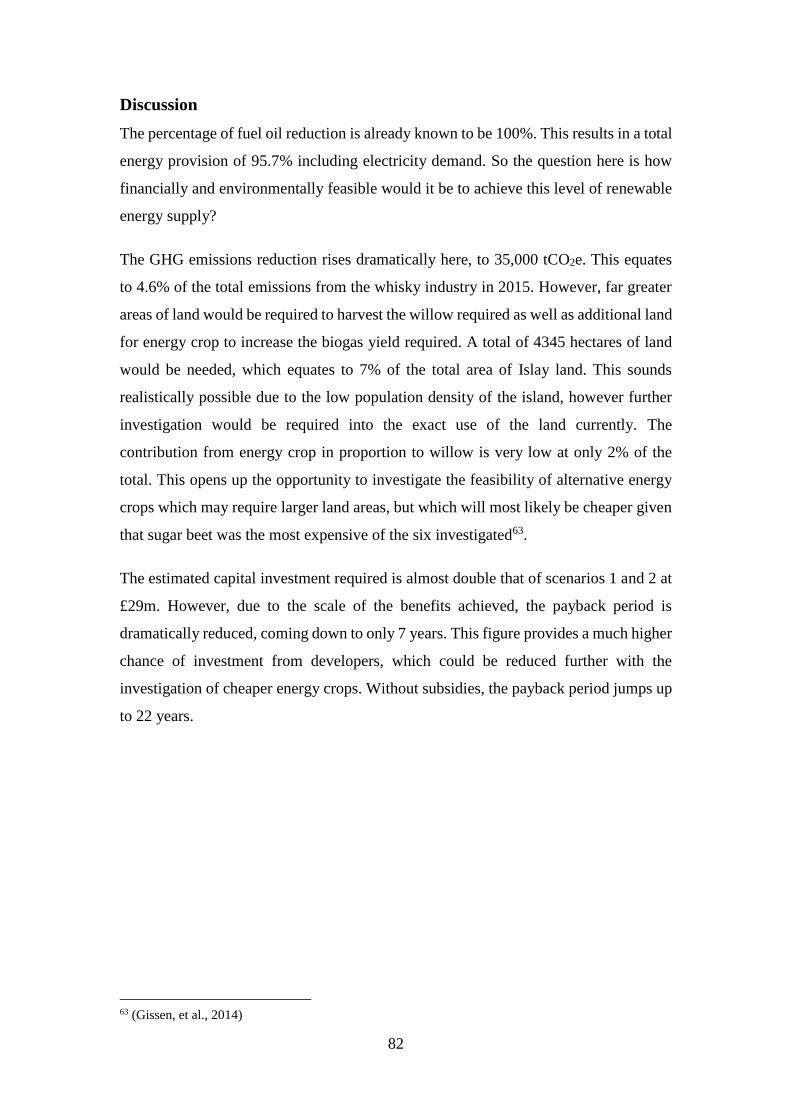
82
Discussion
The percentage of fuel oil reduction is already known to be 100%. This results in a total
energy provision of 95.7% including electricity demand. So the question here is how
financially and environmentally feasible would it be to achieve this level of renewable
energy supply?
The GHG emissions reduction rises dramatically here, to 35,000 tCO2e. This equates
to 4.6% of the total emissions from the whisky industry in 2015. However, far greater
areas of land would be required to harvest the willow required as well as additional land
for energy crop to increase the biogas yield required. A total of 4345 hectares of land
would be needed, which equates to 7% of the total area of Islay land. This sounds
realistically possible due to the low population density of the island, however further
investigation would be required into the exact use of the land currently. The
contribution from energy crop in proportion to willow is very low at only 2% of the
total. This opens up the opportunity to investigate the feasibility of alternative energy
crops which may require larger land areas, but which will most likely be cheaper given
that sugar beet was the most expensive of the six investigated63.
The estimated capital investment required is almost double that of scenarios 1 and 2 at
£29m. However, due to the scale of the benefits achieved, the payback period is
dramatically reduced, coming down to only 7 years. This figure provides a much higher
chance of investment from developers, which could be reduced further with the
investigation of cheaper energy crops. Without subsidies, the payback period jumps up
to 22 years.
63 (Gissen, et al., 2014)
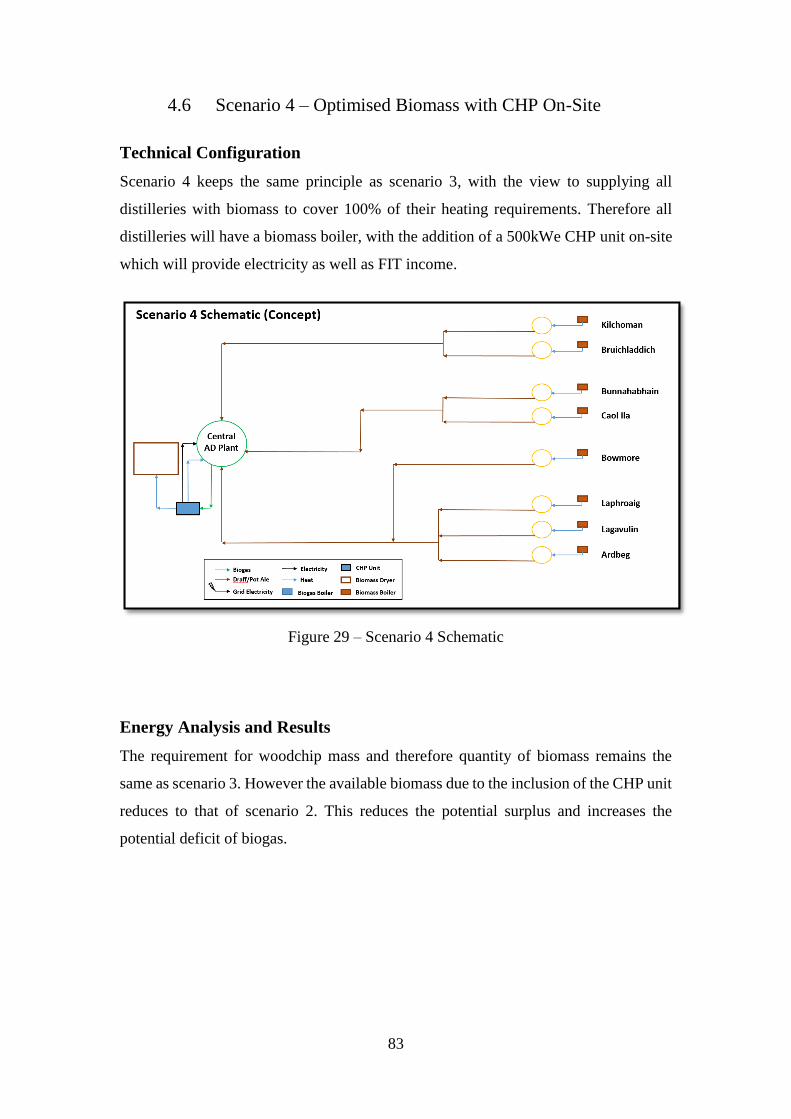
83
4.6 Scenario 4 – Optimised Biomass with CHP On-Site
Technical Configuration
Scenario 4 keeps the same principle as scenario 3, with the view to supplying all
distilleries with biomass to cover 100% of their heating requirements. Therefore all
distilleries will have a biomass boiler, with the addition of a 500kWe CHP unit on-site
which will provide electricity as well as FIT income.
Figure 29 – Scenario 4 Schematic
Energy Analysis and Results
The requirement for woodchip mass and therefore quantity of biomass remains the
same as scenario 3. However the available biomass due to the inclusion of the CHP unit
reduces to that of scenario 2. This reduces the potential surplus and increases the
potential deficit of biogas.

84
Figure 30 – Scenario 4 Energy Required for Biomass Drying
As can be seen in Figure 30, the gap has widened between energy available and energy
required. Again using a backward working method, the biogas requirement has been
calculated to meet the thermal requirements from best to worst case. Table 38 shows
these results, with the bottom line displaying the surplus/deficit quantities.
Table 38 – Scenario 4 Biomass Optimisation Summary
Using sugar beet again as the additional anaerobic digestion feedstock to make up this
deficit, the land area required would increase as outlined in Table 39.
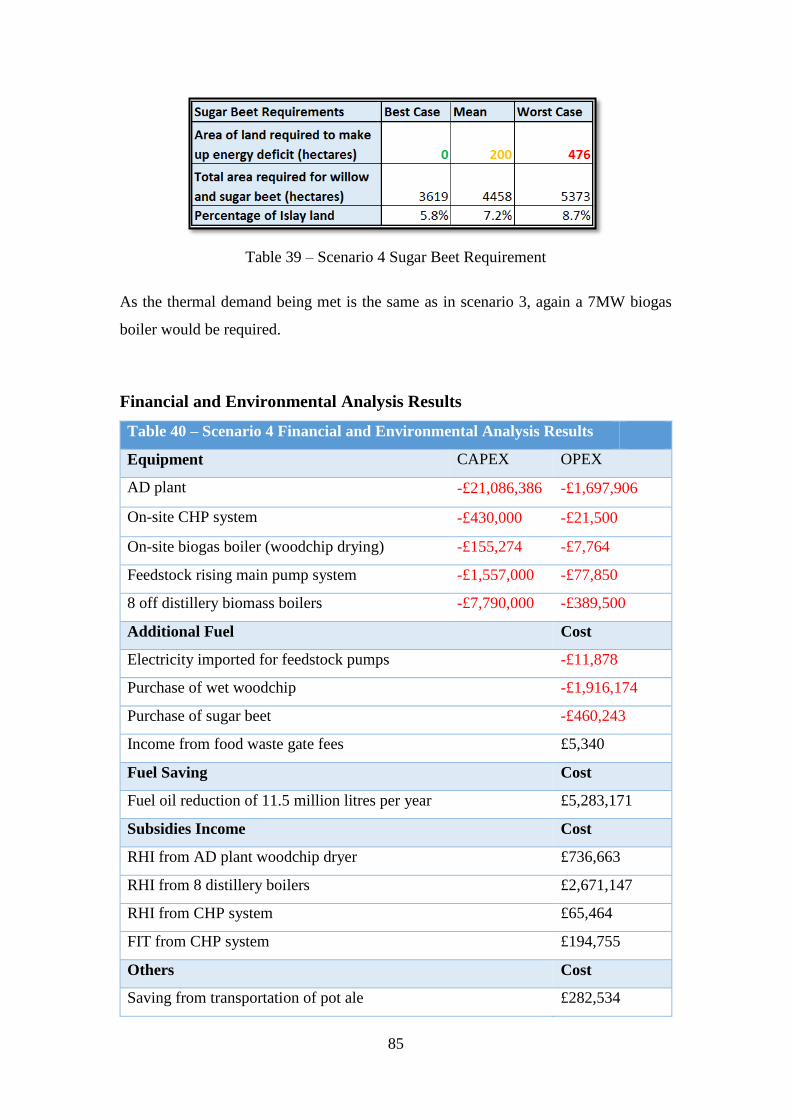
85
Table 39 – Scenario 4 Sugar Beet Requirement
As the thermal demand being met is the same as in scenario 3, again a 7MW biogas
boiler would be required.
Financial and Environmental Analysis Results
Table 40 – Scenario 4 Financial and Environmental Analysis Results
Equipment CAPEX OPEX
AD plant -£21,086,386 -£1,697,906
On-site CHP system -£430,000 -£21,500
On-site biogas boiler (woodchip drying) -£155,274 -£7,764
Feedstock rising main pump system -£1,557,000 -£77,850
8 off distillery biomass boilers -£7,790,000 -£389,500
Additional Fuel Cost
Electricity imported for feedstock pumps -£11,878
Purchase of wet woodchip -£1,916,174
Purchase of sugar beet -£460,243
Income from food waste gate fees £5,340
Fuel Saving Cost
Fuel oil reduction of 11.5 million litres per year £5,283,171
Subsidies Income Cost
RHI from AD plant woodchip dryer £736,663
RHI from 8 distillery boilers £2,671,147
RHI from CHP system £65,464
FIT from CHP system £194,755
Others Cost
Saving from transportation of pot ale £282,534
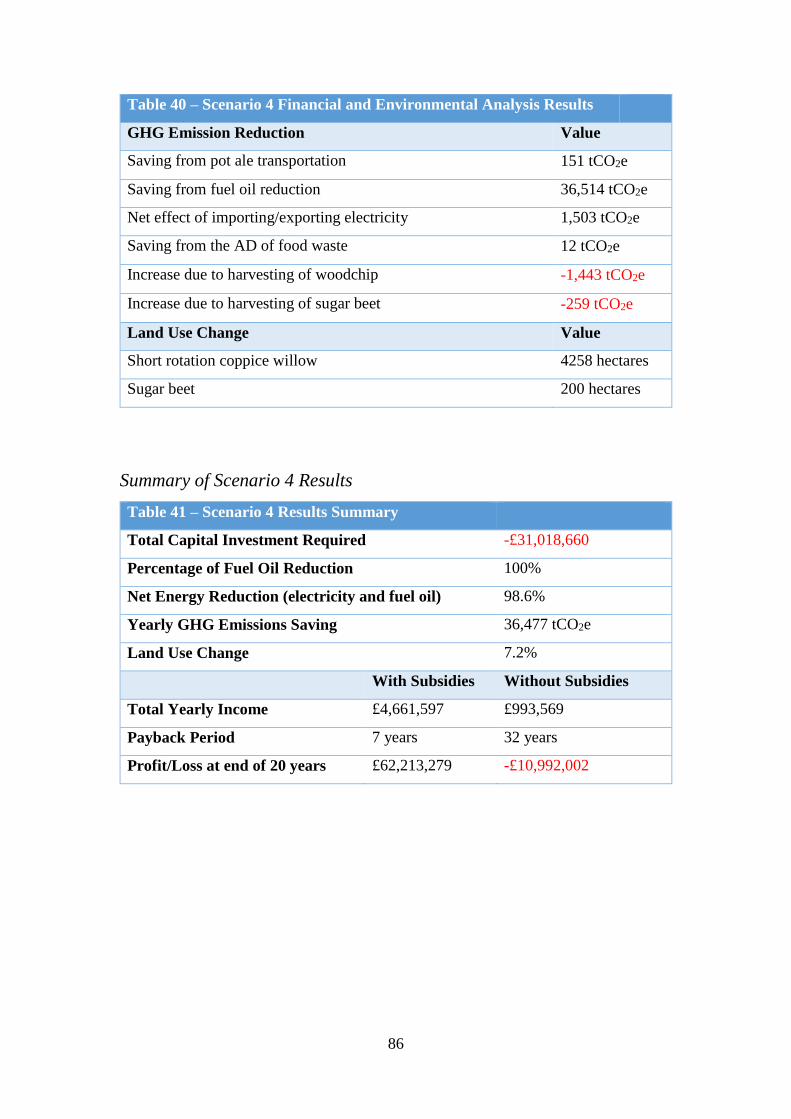
86
Table 40 – Scenario 4 Financial and Environmental Analysis Results
GHG Emission Reduction Value
Saving from pot ale transportation 151 tCO2e
Saving from fuel oil reduction 36,514 tCO2e
Net effect of importing/exporting electricity 1,503 tCO2e
Saving from the AD of food waste 12 tCO2e
Increase due to harvesting of woodchip -1,443 tCO2e
Increase due to harvesting of sugar beet -259 tCO2e
Land Use Change Value
Short rotation coppice willow 4258 hectares
Sugar beet 200 hectares
Summary of Scenario 4 Results
Table 41 – Scenario 4 Results Summary
Total Capital Investment Required -£31,018,660
Percentage of Fuel Oil Reduction 100%
Net Energy Reduction (electricity and fuel oil) 98.6%
Yearly GHG Emissions Saving 36,477 tCO2e
Land Use Change 7.2%
With Subsidies Without Subsidies
Total Yearly Income £4,661,597 £993,569
Payback Period 7 years 32 years
Profit/Loss at end of 20 years £62,213,279 -£10,992,002

87
Discussion
Again, it is known that the thermal energy supply here is 100% of the demand due to
the nature of this scenario analysis approach. However because of the addition of the
CHP system, the total energy supply increases to 98.6%. If there was no cap on CHP
unit capacity for FIT subsidies, then it is reasonable to assume that 100% of total
renewable energy supply could be achieved within a similar financial and
environmental range.
Compared with scenario 3, the GHG emission reduction is slightly improved again,
seeing a 36,500 tCO2e reduction which is 4.8% of the whisky industry emissions in
2015. The land area required is only slightly higher than scenario 3 at 7.2% on a mean
value basis which again sounds feasible but would require further investigation into
current usage.
A £31m capital investment would be required with results again estimating a 7 year
payback period. To look in more detail at whether the CHP unit improves the yearly
financial situation with the reduction in imported electricity as well as the FIT income,
the ‘total yearly income’ figure ‘with subsidies’ can be compared from Table 41 against
Table 37. This actually shows that, taking everything into account, there is a higher
yearly income in scenario 3 with no CHP unit, i.e. the income from FIT and electricity
bills savings are not enough to offset the high capital and operational costs associated
with CHP systems. Without any subsidies, the payback period jumps up to 32 years,
which is 10 years more than scenario 3 due to the CHP unit.

88
4.7 Scenario 5 - Individual AD Plants
Technical Configuration
For the purpose of comparison, a final scenario is considered where every distillery has
an individual anaerobic digestion plant sized to their own by-products, and a CHP
system and biogas boiler (if required) sized to the biogas yields of the AD plant. Using
the same values as previously calculated for energy yield from biogas for the individual
distilleries, electrical and thermal outputs were calculated assuming the same thermal
and electrical efficiencies for CHP systems with results shown in Table 42. The
individual values are totalled in order to allow a gross value comparison with the
previous scenarios.
Due to the FIT payment cap at 500kWe capacity CHP systems from 2017, it is assumed
that none of the distilleries would have a CHP system of any higher than this capacity.
The only distillery with enough energy available from biogas to support a larger CHP
system is Caol Ila, so the calculations assume a 500kWe CHP unit along with a biogas
boiler to optimise the thermal output.
Energy Analysis and Results
After parasitic energy demand has been deducted, the useful electrical and thermal
energy outputs for each distillery AD plant were calculated and shown in Table 42.
The bottom section of the table shows values for all distilleries total outputs.
Table 42 – Individual AD Plant Energy Outputs (CHP)

89
In every case, the electrical demand of the distilleries are met 100% by the electrical
output from the CHP, with surplus for exporting to the grid. The thermal energy is
enough to reduce the heating demand by 8-14%.
Totalling the electrical and thermal energy used from the CHP system together shows
an overall energy reduction of 10.4 – 19.1%. Note that this does not include the energy
exported to the grid, it only counts the actual requirement which has been provided by
the CHP output.
Alternatively, biogas boilers alone may be used in order to optimise the thermal
energy reduction specifically. This situation results in higher overall percentage
reductions, in the range of 20-37% on an overall basis as displayed in Table 43.
Table 43 – Percentage of Demand Met (Biogas Boilers)
Financial and Environmental Analysis Results
Table 44 shows the results of the analysis performed assuming a CHP unit at every
distillery, with Table 46 displaying the results assuming only biogas boilers are used
for thermal energy supply.
CHP Systems
Table 44 – Scenario 5a Financial and Environmental Analysis Results
Equipment CAPEX OPEX
8 off AD plants -£13,785,957 -£1,456,306
8 off CHP systems -£2,021,000 -£101,050
1 off biogas boiler -£81,932 -£4,097
Fuel Saving Cost
Fuel oil reduction of 1.5 million litres per year £696,384
Electricity import reduction £601,878
Subsidies Income Cost
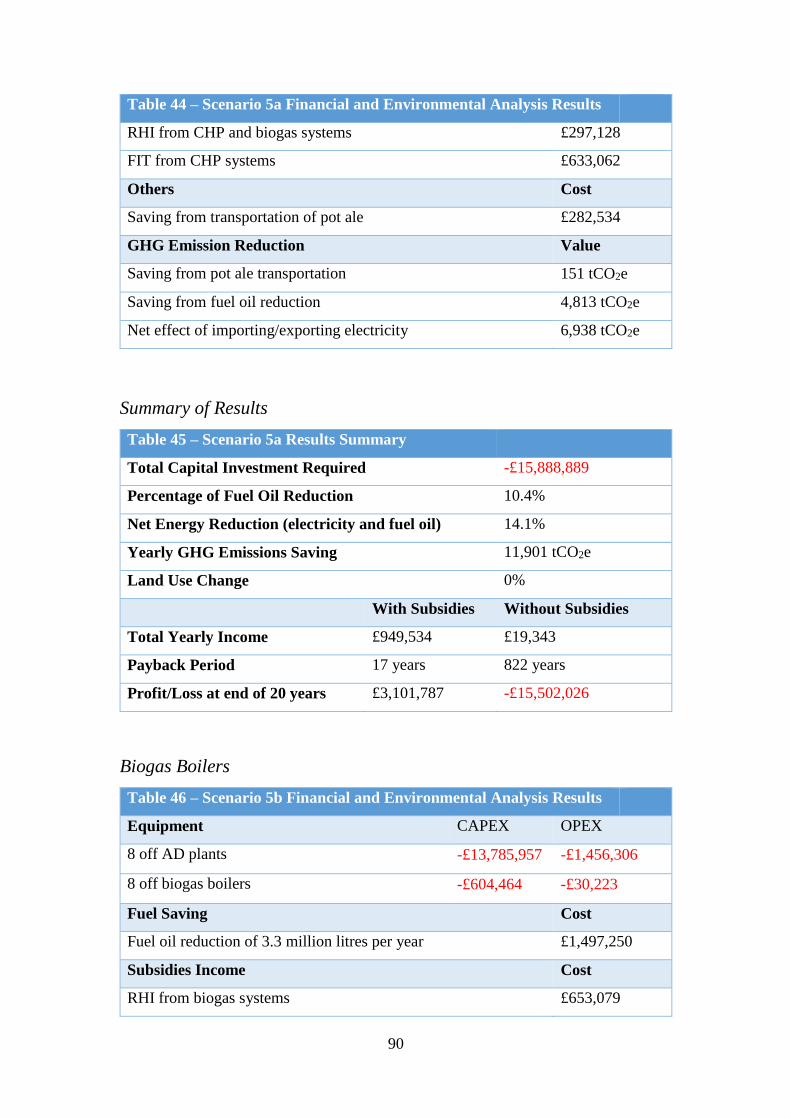
90
Table 44 – Scenario 5a Financial and Environmental Analysis Results
RHI from CHP and biogas systems £297,128
FIT from CHP systems £633,062
Others Cost
Saving from transportation of pot ale £282,534
GHG Emission Reduction Value
Saving from pot ale transportation 151 tCO2e
Saving from fuel oil reduction 4,813 tCO2e
Net effect of importing/exporting electricity 6,938 tCO2e
Summary of Results
Table 45 – Scenario 5a Results Summary
Total Capital Investment Required -£15,888,889
Percentage of Fuel Oil Reduction 10.4%
Net Energy Reduction (electricity and fuel oil) 14.1%
Yearly GHG Emissions Saving 11,901 tCO2e
Land Use Change 0%
With Subsidies Without Subsidies
Total Yearly Income £949,534 £19,343
Payback Period 17 years 822 years
Profit/Loss at end of 20 years £3,101,787 -£15,502,026
Biogas Boilers
Table 46 – Scenario 5b Financial and Environmental Analysis Results
Equipment CAPEX OPEX
8 off AD plants -£13,785,957 -£1,456,306
8 off biogas boilers -£604,464 -£30,223
Fuel Saving Cost
Fuel oil reduction of 3.3 million litres per year £1,497,250
Subsidies Income Cost
RHI from biogas systems £653,079
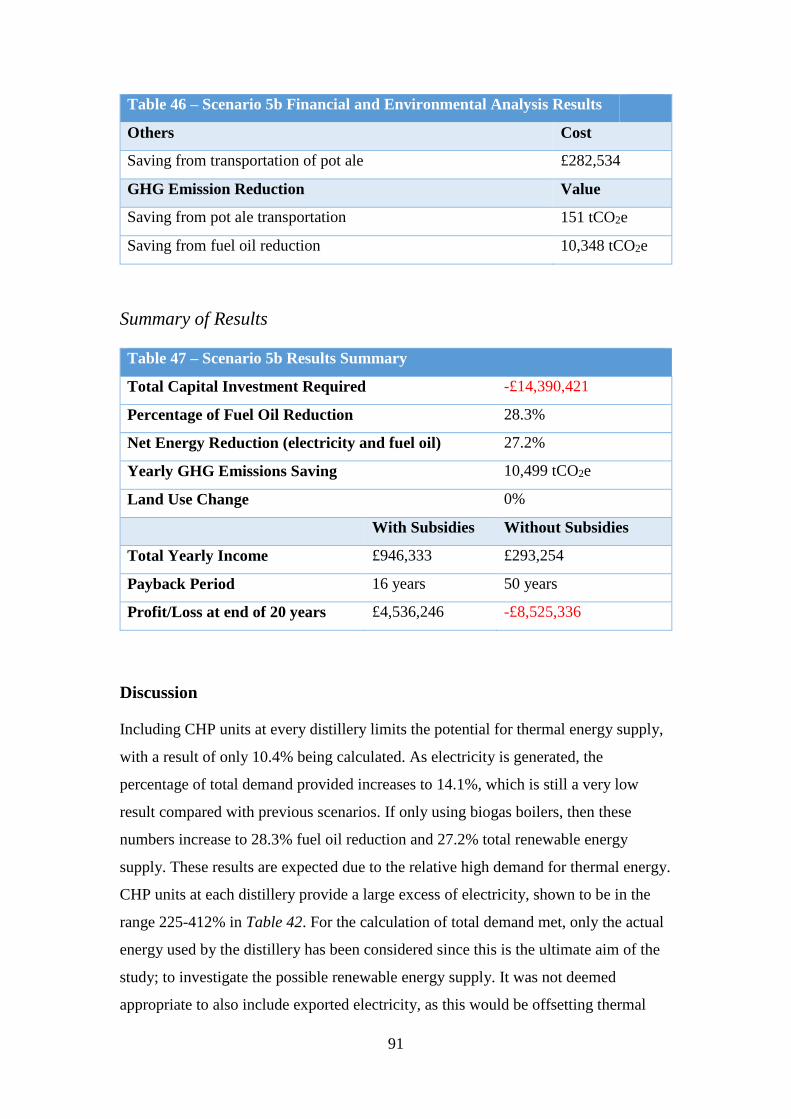
91
Table 46 – Scenario 5b Financial and Environmental Analysis Results
Others Cost
Saving from transportation of pot ale £282,534
GHG Emission Reduction Value
Saving from pot ale transportation 151 tCO2e
Saving from fuel oil reduction 10,348 tCO2e
Summary of Results
Table 47 – Scenario 5b Results Summary
Total Capital Investment Required -£14,390,421
Percentage of Fuel Oil Reduction 28.3%
Net Energy Reduction (electricity and fuel oil) 27.2%
Yearly GHG Emissions Saving 10,499 tCO2e
Land Use Change 0%
With Subsidies Without Subsidies
Total Yearly Income £946,333 £293,254
Payback Period 16 years 50 years
Profit/Loss at end of 20 years £4,536,246 -£8,525,336
Discussion
Including CHP units at every distillery limits the potential for thermal energy supply,
with a result of only 10.4% being calculated. As electricity is generated, the
percentage of total demand provided increases to 14.1%, which is still a very low
result compared with previous scenarios. If only using biogas boilers, then these
numbers increase to 28.3% fuel oil reduction and 27.2% total renewable energy
supply. These results are expected due to the relative high demand for thermal energy.
CHP units at each distillery provide a large excess of electricity, shown to be in the
range 225-412% in Table 42. For the calculation of total demand met, only the actual
energy used by the distillery has been considered since this is the ultimate aim of the
study; to investigate the possible renewable energy supply. It was not deemed
appropriate to also include exported electricity, as this would be offsetting thermal
92
demand which would provide inaccurate results. Therefore the maximum possible
benefit which could result from electricity generation is 4% on a total demand basis.
Over-delivering on electricity then restricts the potential for thermal demand
reduction which shows that CHP is a less desirable use for the produced biogas. This
problem could be overcome by sizing the CHP units to meet the electrical demand
with no surplus, coupled with storage to optimise the generated electricity, allowing
supply and demand matching. The remaining biogas could then be used in biogas
boilers to increase the thermal energy supply. This would of course have financial
implications, with greater capital being required, the extent of which would require
further investigation.
The situation is reversed when considering the GHG emissions reduction, with
scenario 5b outperforming 5a. This is because the benefit from exporting electricity is
included in this calculation. The emissions reduction with CHP systems is around
12,000 tCO2e per year, and with only biogas boilers it is 10,500 tCO2e. These values
are comparable with scenarios 1 and 2. As the AD plants would be on the distillery
land, there would be restricted space which is why additional feedstocks were not
considered and therefore no land on Islay would be required to change use.
The investment required for both options is similar at £15.9m for CHP units and
£14.4m for biogas boilers. The payback periods with subsidies are also similar at 17
and 16 years for CHP units and biogas boilers respectively. Without subsidies
however, the results are very different at 822 years with CHP units and 50 years with
biogas boilers. Even with the subsidies, the payback periods are fairly high which
reduces the chance of interest from investors.
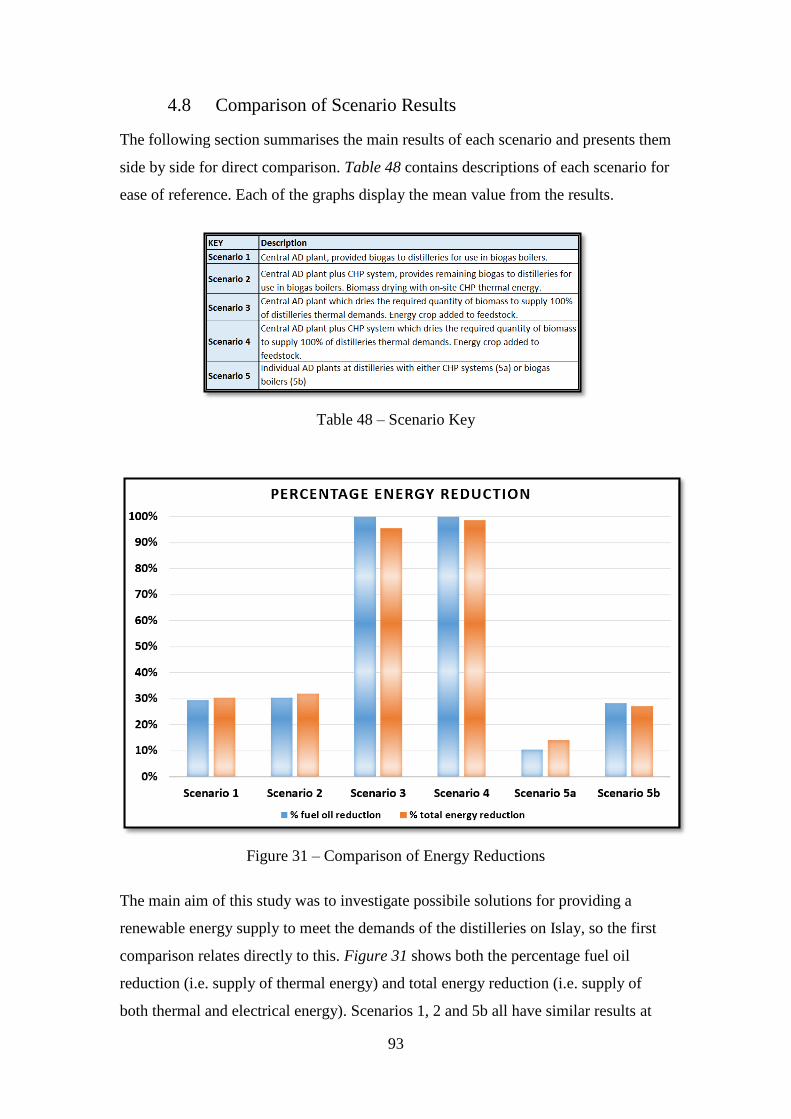
93
4.8 Comparison of Scenario Results
The following section summarises the main results of each scenario and presents them
side by side for direct comparison. Table 48 contains descriptions of each scenario for
ease of reference. Each of the graphs display the mean value from the results.
Table 48 – Scenario Key
Figure 31 – Comparison of Energy Reductions
The main aim of this study was to investigate possibile solutions for providing a
renewable energy supply to meet the demands of the distilleries on Islay, so the first
comparison relates directly to this. Figure 31 shows both the percentage fuel oil
reduction (i.e. supply of thermal energy) and total energy reduction (i.e. supply of
both thermal and electrical energy). Scenarios 1, 2 and 5b all have similar results at

94
around 30%. Scenario 5a has the lowest result, with only a 10% fuel oil reduction due
to the use of CHP rather than biogas boilers. Scenarios 3 and 4 have the highest
results as they used backward working methodology in order to assess the feasibility
of meeting 100% of the thermal demands. Due to the relatively small proportion of
total demand the electrical demand makes up (around 4%), meeting 100% of the
thermal demand automatically results in a high total demand reduction.
Figure 32 – Comparison of GHG Emissions and Land Required
Figure 32 goes on to compare environmental factors, in this case GHG emissions
reductions and land use change. It is clear that the effect on emissions is greatly
influenced by the reduction in fuel oil, with scenarios 3 and 4 again showing the
highest results. However the payoff for this benefit is the highest resulting land use
change, with around 7% of the area of Islay being required to grow willow and sugar
beet to meet the high thermal demand of the distilleries. Because Islay has such a low
population density, it could be the case that there would not be adverse effects of this
level of land use change, however further studies into specific current land use would
be required to determine whether this was feasible.

95
Figure 33 – Comparison of Capital and Payback Period
Figure 33 compares the main financial aspects, in particular the initial capital
investment required along with the payback period. Interestingly the scenarios with the
highest capital required (3 and 4) also have the lowest payback periods. This is due to
the high savings from eliminating the reliance on fuel oil. It is difficult to identify any
cut-off marks which would define which options are financially feasible or not as this
depends on investors’ ideas about ideal payback periods. However if this type of project
was to be jointly funded by those receiving the benefits themselves, perhaps they would
favour longer than usual payback periods due to the longer term continued benefits.
Diageo is one of the owners of distilleries on Islay and they are known to have invested
heavily in other renewable energy projects which suggests they may be interested in
further projects.

96
5.0 Discussions
5.1. Technical
The technology itself is well established, therefore it is known that these concepts are
technically feasible. It is more a question of configuration, with some scenarios proving
to be more successful than others.
The pumping of feedstocks requires deeper research which should include actual testing
to identify specific material properties. It is still considered to be technically feasible,
however the energy required must be confirmed.
Unless there is a constant thermal demand at the location of biogas use, a solution to
biogas storage is required. In this case, the drying of biomass provides a solution.
Biogas is not easily stored due to the high composition of CO2 which would require
large volumes to store at lower pressure. An alternative solution could be to convert to
biomethane, the potential energy savings and financial viability of which would have
to be analysed.
The study could be used as a model which can be applied to other locations that have a
regular supply of organic waste or by-products. For example, a fishing port which may
have processing plants in close proximity could utilise the high biogas yielding fish
waste in a central plant rather than transporting it to a disposal site.
The greatest results in terms of percentage of energy supply comes from focussing on
the production of thermal energy, rather than electrical. This is because the total energy
demand of distilleries is composed of 96% thermal and only 4% electrical; therefore
the maximum benefit which can be achieved from electricity production is 4% of the
total energy requirements.
5.2. Environmental
The results suggest that it could be possible to entirely eliminate the distilleries reliance
on fossil fuel for heating which would require the use of all available feedstocks.
Scenario 4 shows a GHG emission reduction of 36,500 tCO2e/year.

97
By drying biomass as a way to ‘store’ the energy from biogas, an additional benefit is
found in that the energy available is effectively tripled (compared with the energy
available in the biogas which is used to dry the biomass). This of course comes at a
cost; in this case, a lot of land would be required for harvesting of willow. But there is
a low population density on Islay, and only around 7% of the land would be required
for this purpose.
5.3. Financial
Currently, most biogas plants in the UK use CHP systems as higher income has been
made from the feed-in tariff. However with the degression of tariffs, the results here
show that FIT is now so low that it may not compensate for the high capital and on-
going costs associated with CHP systems. Therefore the use of biogas boilers is more
profitable, provided there is a use for the heat on site since thermal energy cannot be
transported easily.
Sugar beet is an expensive energy crop, but was selected because of the high energy
yield per hectare in order to reduce the land area required. With the results showing
reasonable land usage, it may be possible to select a cheaper alternative energy crop,
which uses more land area.
The lowest payback period is 7 years, for both scenarios 3 and 4, which also require the
highest capital investment. At over £30 million for scenario 4, this is considered
reasonable based on reports of other similar projects capital requirements such as
Cameronbridge distillery which required £65 million.
5.4. Social
It is important to consider the social implications of a project of this scale, especially in
such a remote area as it could be more sensitive to change. There could be a negative
effect with regards to jobs; for example Gleaner Oil on the island supplies the fuel oil
which a large proportion of goes to the distilleries. Without this income revenue, the
business would suffer and jobs could be lost. Likewise with the end to the transportation
of pot ale to the discharge point; it was disclosed that this is carried out by local people
which they would no longer be required to do. In both cases due to the remoteness of
98
the location, the solution would not be as simple as finding work elsewhere. Having
said that, keeping people in a job should not be a barrier to projects with such
environmental benefits.
The employment situation would not all be negative however, there would also be
opportunities for job creation. A centralised AD plant would require staff for operation.
There is also the need for more diverse farming activities with the requirement for
willow and energy crops. Although a recent study64 has shown that a high proportion
of farmers would not choose to switch from livestock to energy crop farming, Islay’s
dairy farming industry has been on the decline for a number of years. Therefore it could
be possible that farmers here would be happier to make the switch to energy crops if it
is the only viable option.
General logistics mustn’t be overseen. Having spoken with a member of the IET, it
became clear that Islay has over the years, settled into a balanced routine. Making
sudden changes can have knock on effects to many other aspects. For example it was
stated that the grain which is imported onto the island by truck via the ferry also collects
the spent grain which is exported on the return journey and used for animal feed.
Removing the return load would increase the cost of grain. It is not known to what
degree this would affect the price, however it must be considered.
There is an opportunity for community benefits in the longer term. The IET are involved
in many renewable energy projects on the island which not only improves the
environment, but also provides income for the community. After the payback period,
there is a lot of cost savings available for the distilleries, a percentage of this could be
fed back to the community to benefit the wider island. Working together with a
community in such a way is more likely to gain the support of locals rather than
encourage resistance.
64 (Warren, Burton, Buchanan, & Birnie, 2016)

99
5.5. Critical Evaluation
The methodology and approach taken when carrying out this study has been logical,
allowing reasonable estimates to be calculated for each scenario. However a number of
shortfalls have prevented greater accuracy of results:
Lack of real data from distilleries – exact energy demands and by-product
quantities;
Lack of accurate costs of equipment – due to commercial sensitivity, companies
were not willing to provide cost information;
Lack of time, specific expertise and accurate details of by-product properties
prevented an in-depth analysis of pumping energy requirements.
With exact distillery data and accurate costs, single results could have been obtained
for each scenario rather than a range, of which the mean value was taken as the
estimated answer. Although it is unlikely for any of the results to fall at either the
extreme best or worst case estimate, it is equally unlikely that it would fall exactly in
the middle.
The investigation into pumping energy exposed the complexity of the situation, with
physical testing of the by-products being a requirement for exact inputs to the analysis.
Accurate results would identify exact electricity requirements, which could change the
financial and environmental results to some degree.

100
6.0 Conclusions
It was shown that the distillery feedstocks alone could only provide around 30% of their
energy requirements, with central plant scenarios opening up further options to increase
the potential supply by adding additional feedstocks compared with individual plants
at each distillery due to space required for larger digesters.
Where thermal demands greatly outweigh electrical, the advice based on this study
would be to optimise the potential thermal output by drying biomass which can be
easily stored and used when required. This maximises the reduction of fossil fuel
reliance and therefore achieves maximum GHG emission reductions.
Based on the results and discussions of this study, in the specific case of the whisky
distilleries on Islay, scenario 4 would be the chosen option. It provides the greatest total
energy (98.6%) and GHG emissions reduction (36,500 tCO2e), which requires a
realistically achievable area of land on the island (7.2%). The financial income is
slightly lower than that of scenario 3, however has the same payback period of 7 years
and is deemed acceptable due to the other benefits.
It is accepted that case by case analyses would be required for other geographical
locations as land availability/suitable feedstocks/energy demands etc. will all differ.
This of course assumes the continued support from various subsidy schemes. Subsidies
are paramount to the viability of these projects; as degressions continue in future years,
long payback periods would be required and as such, would not be financially viable.
101
7.0 Further Work
The results of the analysis and conclusion open opportunities for further work:
Real data on energy usage from distilleries and equipment costs would help to
refine the results.
Dynamic energy data would allow an analysis of supply and demand matching,
which could identify how much biogas would be wasted, or how much storage
would be required to cover periods of low demand.
A comparison of the feasibility of biogas conversion to biomethane against
drying of biomass could be conducted.
A study into the feasibility of using fuel cells instead of CHP would be
interesting. They have very high up-front costs, but little to no maintenance
required so could be cheaper in the long run. With higher efficiencies, they
could provide an innovative solution where both electrical and thermal demands
are a requirement.

102
References
ADBA. (2013). Increasing the Value of Digestate. Retrieved August 2016, from
ADBA: http://adbioresources.org/wp-content/uploads/2013/07/Quinton-
Fivelman-edit.pdf
ADBA. (2016). Anaerobic Digestion Market Report: July 2016. Retrieved August
2016, from http://www.ciwm-journal.co.uk/wordpress/wp-
content/uploads/2016/07/marketreport2016-44a4_v1.pdf
AHDB. (2011). Making Grass Silage for Better Returns. Retrieved August 2016, from
AHDB Beef and Lamb: http://beefandlamb.ahdb.org.uk/wp/wp-
content/uploads/2013/06/Manual-5-
makinggrasssilageforbetterreturns070211.pdf
Allardyce, S., Baster, E., Kirk, C., & Lamond, W. (2011). Energy from Whisky Co-
Products. Retrieved August 2016, from Energy Systems Research Unit:
http://www.esru.strath.ac.uk/EandE/Web_sites/10-11/Whisky/index.html
Biomass Energy Centre. (2004). Woodfuel heating in the North of England: A Practical
Guide. Retrieved August 2016, from Biomass Energy Centre:
http://www.biomassenergycentre.org.uk/pls/portal/docs/PAGE/RESOURCES/
REF_LIB_RES/PUBLICATIONS/WOODFUEL%20HEATING%20IN%20T
HE%20NORTH%20OF%20ENGLAND.PDF
Biomass Energy Centre. (2016). Biomass Energy Centre. Retrieved August 2016, from
Biomass Energy Centre:
http://www.biomassenergycentre.org.uk/portal/page?_pageid=73,1&_dad=por
tal&_schema=PORTAL
Clarke Energy. (2016). Biogas. Retrieved August 2016, from Clarke Energy: Engineer-
Install-Maintain: https://www.clarke-energy.com/biogas/

103
COFORD. (2012). COFORD Connects: Storage of Short Rotation Coppice Willow
Fuel. Retrieved August 2016, from COFORD:
http://www.coford.ie/media/coford/content/publications/projectreports/cofordc
onnects/HAR30_LR.PDF
Coppice Resources Ltd. (2009). Biomass. Retrieved August 2016, from CRL:
http://www.coppiceresources.co.uk/Biomass.asp
Coprob Beta. (2011). Production of Methane from Sugar Beet. Retrieved August 2016,
from Beta Italia:
http://www.betaitalia.it/UploadedFiles/news/PRODUCTION_OF_METHAN
E_FROM_SUGAR_BEET.pdf
DECC. (2014). RHI Biomethane Injection to Grid Tariff Review. Retrieved August
2016, from
https://www.gov.uk/government/uploads/system/uploads/attachment_data/file/
384202/Biomethane_Tariff_Review_-_Government_Response_-
_December_2014.pdf
DECC. (2016). Review of support for Anaerobic Digestion and Micro-Combined Heat
and Power under the Feed-in Tariff Scheme. Retrieved August 2016, from
https://www.gov.uk/government/uploads/system/uploads/attachment_data/file/
535842/FITs_ADmCHP_consultation_document_May_2016_1_-
_14_July_deadline.pdf
DECC. (2016(b)). Policy Paper: 2010 to 2015 Government Policy: Low Carbon
Technologies. Retrieved August 2016, from Department of Energy & Climate
Change: Environment Agency:
https://www.gov.uk/government/publications/2010-to-2015-government-
104
policy-low-carbon-technologies/2010-to-2015-government-policy-low-
carbon-technologies#appendix-5-the-renewables-obligation-ro
Demuynck, M. (1984). Biogas Plants in Europe: A Practical Handbook. Lancaster:
Dordrecht Lancaster Reidel for the Commission of the European Communities.
Edina UK Ltd. (2013). CHP System Datasheet.
Friends of the Earth. (2007). Briefing: Food Waste Collections. Retrieved August 2016,
from Friends of the Earth, See Things Differently:
https://www.foe.co.uk/sites/default/files/downloads/food_waste.pdf
Gissen, C., Prade, T., Kreuger, E., Nges, I. A., Rosenqvist, H., Svensson, S.-E., . . .
Bjornsson, L. (2014). Comparing energy crops for biogas production – Yields,
energy input and costs in cultivation using digestate and mineral fertilisation.
Biomass and Bioenergy, 64, 199-210. Retrieved August 2016, from
http://www.sciencedirect.com/science/article/pii/S0961953414001901
ICBD. (2014). Whisky: Technology, Production and Marketing (2nd ed.). London:
Elsevier Ltd. Retrieved August 2016, from
http://www.sciencedirect.com/science/book/9780124017351
IET. (2012). Islay Energy Trust Home. Retrieved August 2016, from Islay Energy
Trust: https://islayenergytrust.org.uk/
Islay Info. (2016). Welcome to Islay Info. Retrieved August 2016, from Islay Info:
http://www.islayinfo.com/index.html
ISWA. (2013). WMW. Retrieved August 2016, from Waste Management World:
https://waste-management-world.com/a/viridors-154m-gasification-biogas-
and-recycling-facility-underway-in-glasgow

105
Jacobs. (2008). Information Sheet 12: Sources of Energy. Retrieved August 2016, from
Climate Change Levy:
http://www.cclevy.com/images/Sources%20of%20Energy%20Info%2012.pdf
Krajnc, N. (2015). Wood Fuels Handbook. Retrieved August 2016, from
http://www.fao.org/3/a-i4441e.pdf
Krich, K., Augenstein, D., Batmale, J., Rutledge, B., & Salour, D. (2005). Biomethane
from Dairy Waste: A Sourcebook for the Production and Use of Renewable
Natural Gas in California. Retrieved August 2016, from
http://extension.psu.edu/natural-resources/energy/waste-to-
energy/resources/biogas/links/anaerobic-digester-design-and-
operation/biomethane-from-dairy-waste.pdf
Meadows, S. (2015). Anaerobic Digestion and Resource Use within the Scotch Whisky
& UK Beer Industries. Retrieved August 2016, from
http://www.esru.strath.ac.uk/Documents/MSc_2015/Meadows.pdf
NNFCC. (2009). AD. Retrieved August 2016, from The Official Information Portal on
Anaerobic Digestion: http://www.biogas-info.co.uk/
Ofgem. (2016). Feed-in Tariff Factsheet. Retrieved August 2016, from Ofgem:
https://www.ofgem.gov.uk/system/files/docs/2016/07/fit_factsheet_july_16_-
_final.pdf
Ofgem. (2016(b)). About the Non-Domestic RHI. Retrieved August 2016, from Ofgem:
https://www.ofgem.gov.uk/environmental-programmes/non-domestic-
rhi/about-non-domestic-rhi
Ofgem. (2016(c)). Tariffs and Payments: Non-Domestic RHI. Retrieved August 2016,
from Ofgem: https://www.ofgem.gov.uk/environmental-programmes/non-
106
domestic-rhi/contacts-guidance-and-resources/tariffs-and-payments-non-
domestic-rhi
Ofgem. (2016(d)). About the RO. Retrieved August 2016, from Ofgem:
https://www.ofgem.gov.uk/environmental-programmes/ro/about-ro
Ofgem. (2016(e)). Climate Change Levy (CCL) Exemption. Retrieved August 2016,
from Ofgem: https://www.ofgem.gov.uk/environmental-programmes/ccl
Ofgem e-serve. (2016). Feed-in Tariff Generation & Export Payment Rate Table.
Retrieved August 2016, from Ofgem:
https://www.ofgem.gov.uk/system/files/docs/2016/04/01_april_2016_tariff_ta
ble.pdf
O'Kiely, P., Korres, N., West, J. S., & Benzie, J. A. (2013). Bioenergy Production by
Anaerobic Digestion. Taylor and Francis. Retrieved August 2016, from
http://ebookcentral.proquest.com/lib/strath/reader.action?docID=1366589
Osaka University. (1997). Renewable biological systems for alternative sustainable
energy production (FAO Agricultural Services Bulletin - 128). Retrieved
August 2016, from FAO Corporate Document Repository:
http://www.fao.org/docrep/w7241e/w7241e00.htm#Contents
Revenue Scotland. (2016). Scottish Landfill Tax. Retrieved August 2016, from Revenue
Scotland: https://www.revenue.scot/scottish-landfill-tax
Rezaiyan, J., & Cheremisinoff, N. P. (2005). Gasification Technologies: A Primer for
Engineers and Scientists. London: Taylor & Francis.
Ricardo-AEA. (2015). Biomethane for Transport from Landfill and Anaerobic
Digestion. Retrieved August 2016, from
https://www.gov.uk/government/uploads/system/uploads/attachment_data/file/
416002/biomethane-for-transport.pdf
107
Rico, C., Diego, R., Valcarce, A., & Rico, J. L. (2014). Biogas Production from Various
Typical Organic Wastes Generated in the Region of Cantabria (Spain): Methane
Yields and Co-Digestion Tests. Smart Grid and Renewable Energy, 5, 128-136.
Retrieved August 2016, from
http://file.scirp.org/pdf/SGRE_2014060617201362.pdf
Rural Futures, SKM Enviros, CNG Services Ltd. (2010). Economic Viability of Farm
Scale AD Biogas Production across Cheshire and Warrington. Retrieved
August 2016, from http://www.reaseheath.ac.uk/wp-
content/uploads/2013/11/AD-Feasibility-Study-Main-Report.pdf
SAC Consulting. (2012). Distillery Feed By-Products Briefing. Retrieved August 2016,
from http://www.sruc.ac.uk/download/downloads/id/1057/distillery_feed_by-
products_briefing
Schmack Biogas. (2007). Draff Test Report.
Schmack Biogas. (2007(b)). Pot Ale Test Report.
Scotch Whisky Association. (2015). Scotch Whisky Industry Environmental Strategy
Report 2015. Retrieved August 2016, from Scotch-Whisky:
https://www.google.co.uk/url?sa=t&rct=j&q=&esrc=s&source=web&cd=3&c
ad=rja&uact=8&ved=0ahUKEwiYyujB_-
POAhUH7BQKHZ5pB9gQFggsMAI&url=http%3A%2F%2Fwww.scotch-
whisky.org.uk%2Fnews-publications%2Fnews%2Fscotch-whisky-industry-
on-course-to-reach-green-targets%2F
Scotch Whisky Association. (2016). Retrieved August 2016, from Scotch Whisky
Association: http://www.scotch-whisky.org.uk/
Scottish Energy News. (2013). Now third Scots whisky distiller goes green with new
biomass boiler. Retrieved August 2016, from Scottish Energy News, Informing

108
You Every Day: http://www.scottishenergynews.com/now-third-scots-whisky-
distiller-goes-green-with-new-biomass-boiler/
Scottish Government. (2011). Scotland's Census: Shaping our Future. Retrieved
August 2016, from Scotland's Census: http://www.scotlandscensus.gov.uk/ods-
web/area.html
Scottish Government. (2013). Scotland's Zero Waste Plan. Retrieved August 2016,
from The Scottish Government:
http://www.gov.scot/Topics/Environment/waste-and-pollution/Waste-
1/wastestrategy
Scottish Government. (2015). Sector Study on Beer, Whisky and Fish: Final Report.
Retrieved August 2016, from https://consult.scotland.gov.uk/zero-waste-
delivery/making-things-
last/supporting_documents/ZWS645%20Beer%20Whisky%20Fish%20Report
_0.pdf
SEAI. (2016). Gas Yield Table. Retrieved August 2016, from SEAI:
http://www.seai.ie/Renewables/Bioenergy/Bioenergy_Technologies/Anaerobi
c_Digestion/The_Process_and_Techniques_of_Anaerobic_Digestion/Gas_Yie
lds_Table.pdf
Select Committe on Economic Affairs. (2008). The Economics of Renewable Energy,
Volume II: Evidence (Vol. 2). Authority of the House of Lords.
SEPA. (2016). Zero Waste. Retrieved August 2016, from Scottish Environment
Protection Agency: http://www.sepa.org.uk/environment/waste/zero-waste/
Stafford, D. A., Hawkes, D. L., & Horton, R. (1980). Methane Production from Waste
Organic Matter. Boca Raton: CRC Press, Inc.
109
SWA. (2012). Future Energy Opportunities: A Guide for Distillers. Retrieved August
2016, from Scotch Whisky Association: http://www.scotch-
whisky.org.uk/media/41152/guide_for_distillers.pdf
SWA. (2013). Case Study Diageo. Retrieved August 2016, from Scotch Whisky
Association: http://www.scotch-whisky.org.uk/media/63755/diageo.pdf
SWA. (2015). The Glenmorangie Company Anaerobic Digestion Project. Retrieved
August 2016, from Scotch Whisky Association: http://www.scotch-
whisky.org.uk/news-publications/publications/documents/the-glenmorangie-
company-anaerobic-digestion-project/#.V73ADJgrKUk
The Questor Centre. (2014). Quantification of Feedstocks for Anaerobic Digestion
Group Report. Retrieved August 2016, from
http://questor.qub.ac.uk/GeneralFileStorenew/DO-
Bioenergy/Filetoupload,465975,en.pdf
UK Government. (2012). Renewable Transport Fuels Obligation. Retrieved August
2016, from Gov.UK: https://www.gov.uk/guidance/renewable-transport-fuels-
obligation#rtfo-guidance
UK Government. (2016). Gas and Electricity Prices in the Non-Domestic Sector.
Retrieved August 2016, from GOV.UK:
https://www.gov.uk/government/statistical-data-sets/gas-and-electricity-
prices-in-the-non-domestic-sector
UK Government. (2016(b)). Monthly and annual prices of road fuels and petroleum
products. Retrieved August 2016, from GOV.UK:
https://www.gov.uk/government/statistical-data-sets/oil-and-petroleum-
products-monthly-statistics
110
UK Government. (2016(c)). Greenhouse gas reporting - Conversion factors 2016.
Retrieved August 2016, from GOV.UK:
https://www.gov.uk/government/publications/greenhouse-gas-reporting-
conversion-factors-2016
UK Government. (2016(d)). Electricity: Chapter 5, Digest of United Kingdom Energy
Statistics (DUKES). Retrieved August 2016, from GOV.UK:
https://www.gov.uk/government/uploads/system/uploads/attachment_data/file/
540933/Chapter_5_web.pdf
UK Government. (2016(e)). Renewable sources of energy: Chapter 6, Digest of United
Kingdom Energy Statistics (DUKES). Retrieved August 2016, from GOV.UK:
https://www.gov.uk/government/uploads/system/uploads/attachment_data/file/
547977/Chapter_6_web.pdf
University of Leeds. (2012). CIVE2400 Fluid Mechanics, Section 1: Fluid Flow in
Pipes. Retrieved August 2016, from Institute of Engineering Thermofluids,
Surfaces and Interfaces, School of Mechanical Engineering:
http://www.efm.leeds.ac.uk/CIVE/CIVE2400/pipe_flow2.pdf
Van Brakel, J. (1980). The Ignis Fatuus of Biogas. Delft: Delft University Press.
Retrieved August 2016, from
https://lirias.kuleuven.be/bitstream/123456789/510838/1/biogas.pdf
Warren, C. R., Burton, R., Buchanan, O., & Birnie, R. V. (2016). Limited adoption of
short rotation coppice: The role of farmers' socio-cultural identity in influencing
practice. Journal of Rural Studies, 45, 175-183. Retrieved August 2016, from
http://www.sciencedirect.com/science/article/pii/S0743016716300523
Wheatley, A. (Ed.). (1990). Anaerobic Digestion: A Waste Treatment Technology.
London: Elsevier Applied Science.

111
Williams, P. T. (2005). Waste Treatment and Disposal (2nd ed.). Leeds: John Wiley &
Sons, Ltd. Retrieved August 2016, from
http://lib.myilibrary.com/Open.aspx?id=28761&src=0
WRAP. (2008). The food we waste . Retrieved August 2016, from
http://www.ifr.ac.uk/waste/Reports/WRAP%20The%20Food%20We%20Was
te.pdf
WRAP. (2010). Case Study: UK Drink Sector, Organic Arisings. Retrieved August
2016, from
http://www.wrap.org.uk/sites/files/wrap/Organic%20resource%20FINAL%20
010512%20AG.pdf
WRAP. (2016). Operational AD sites map. Retrieved August 2016, from Wrap:
http://www.wrap.org.uk/content/operational-ad-sites-map
Zero Waste Scotland. (2010). Digestate Market Development in Scotland. Scottish
Government. Retrieved August 2016, from
http://www.wrap.org.uk/sites/files/wrap/Zero_Waste_Scotland_Digestate_Mar
ket_Development.pdf

112
Appendices
Appendix A: Energy Values
Table 49 shows a selection of the data obtained from a study conducted in 201565. The
total energy, whisky production and electricity were all supplied by the distilleries. The
yellow column at the end was calculated for the Islay study, to isolate the thermal
energy from electricity as it is of more interest here. Total thermal energy per year
against volume of whisky produced was plotted in a graph to investigate the
relationship.
Table 49 – Energy Figures from Past Study
Graphical representation of yearly energy demands against total whisky produced:
Figure 34 – Total Energy Demand V Annual Whisky Production
65 (Meadows, 2015)
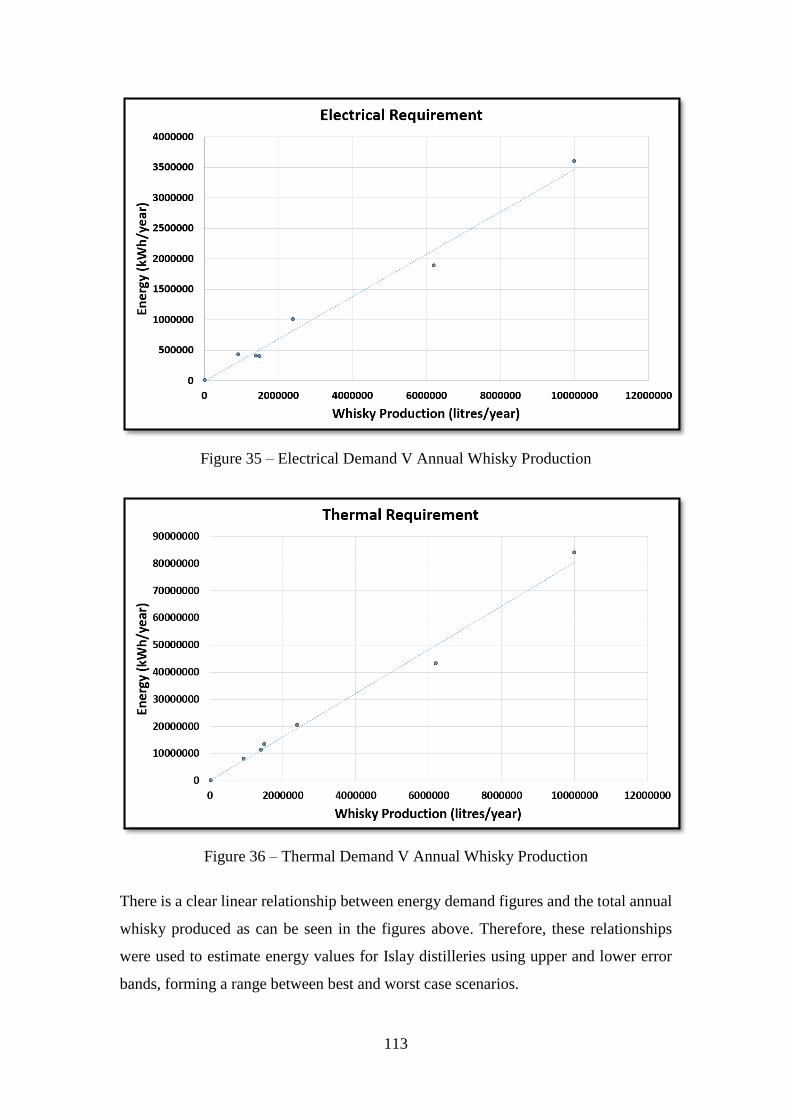
113
Figure 35 – Electrical Demand V Annual Whisky Production
Figure 36 – Thermal Demand V Annual Whisky Production
There is a clear linear relationship between energy demand figures and the total annual
whisky produced as can be seen in the figures above. Therefore, these relationships
were used to estimate energy values for Islay distilleries using upper and lower error
bands, forming a range between best and worst case scenarios.
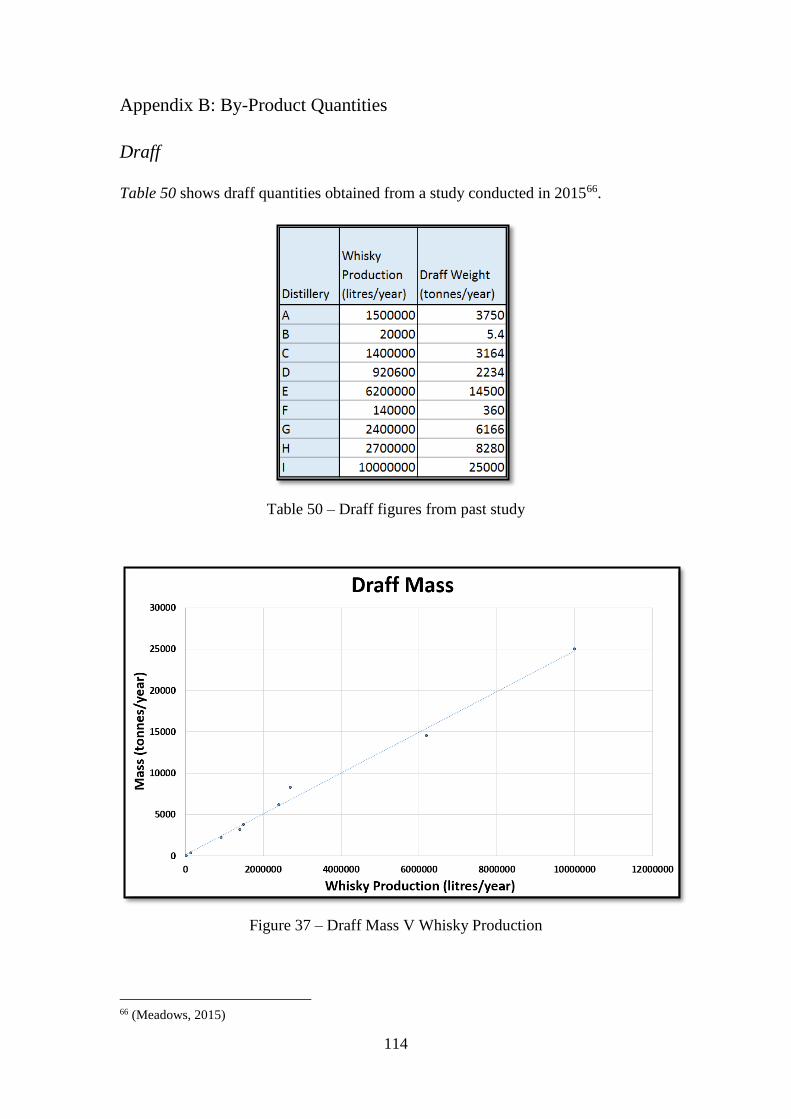
114
Appendix B: By-Product Quantities
Draff
Table 50 shows draff quantities obtained from a study conducted in 201566.
Table 50 – Draff figures from past study
Figure 37 – Draff Mass V Whisky Production
66 (Meadows, 2015)

115
Pot Ale
Table 51 shows pot ale quantities obtained from a study conducted in 201567.
Table 51 – Pot ale figures from past study
Figure 38 – Pot Ale Volume V Whisky Production
67 (Meadows, 2015)

116
Appendix C: Energy Analysis Calculations
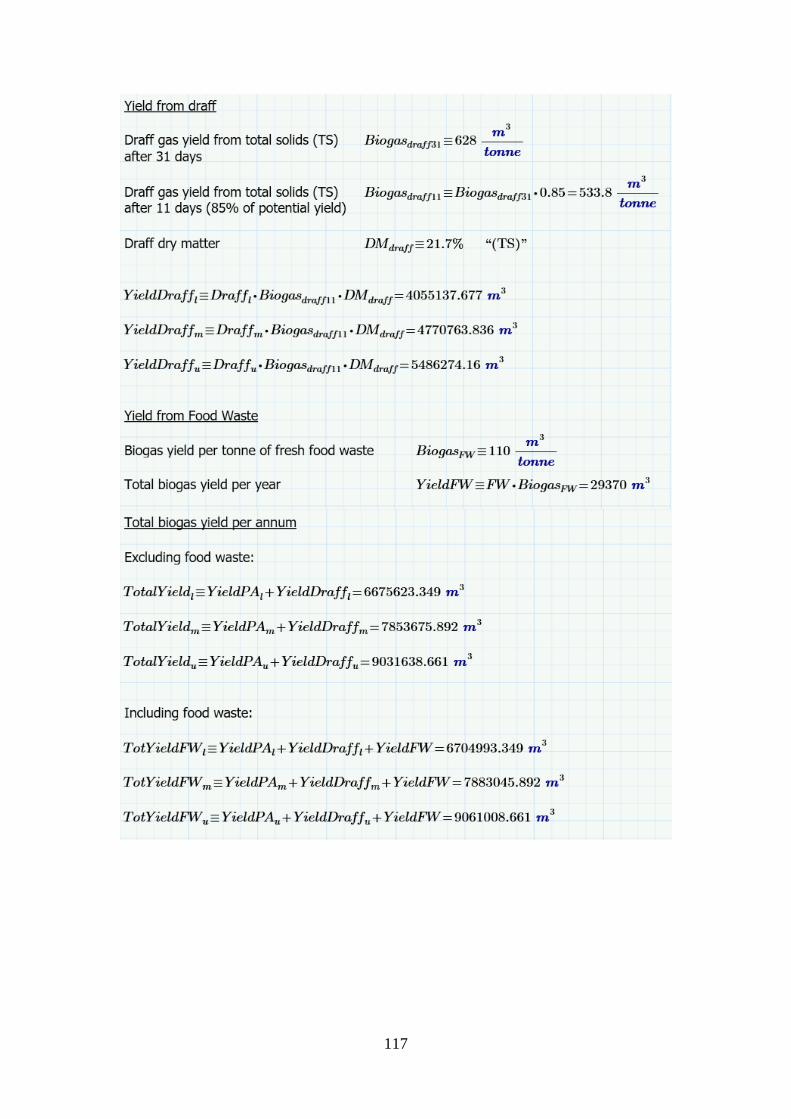
117
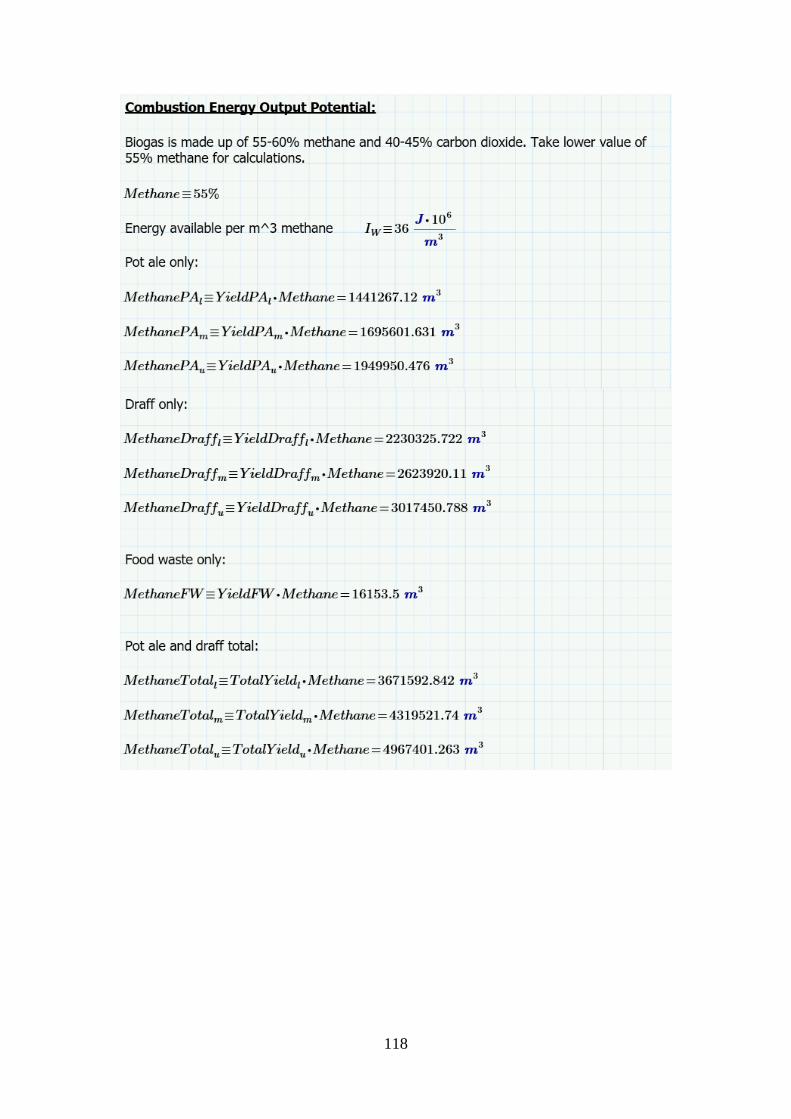
118

119

120