synthesis and characterization of non- stoichiometric li1
TRANSCRIPT
Synthesis and Characterization of Non-Stoichiometric Li1.1Co0.3Fe2.1O4 FerriteNanoparticles For Humidity ApplicationsEbtesam Ateia ElFarhatey ( [email protected] )
Cairo University https://orcid.org/0000-0002-6100-8220Mahmoud A. Ateia
Cairo UniversityM.M. Mosry
Building Physics Institute (BPI)Charanjeet Singh
Lovely Professional UniversityM.M. Arman
Cairo University
Research Article
Keywords: Humidity, Nyquist plot, Hopping charge carrier, spinel nanoparticles
Posted Date: November 1st, 2021
DOI: https://doi.org/10.21203/rs.3.rs-1025245/v1
License: This work is licensed under a Creative Commons Attribution 4.0 International License. Read Full License
1
Synthesis and Characterization of non-Stoichiometric Li1.1Co0.3Fe2.1O4
Ferrite Nanoparticles for Humidity Applications
Mahmoud A. Ateia1, Ebtesam E. Ateia1,2*, M.M.Mosry3, Charanjeet Singh4, M.M. Arman1
1 Physics Department, Faculty of Science, Cairo University, Giza, Egypt 2 Academy of Scientific Research and Technology (ASRT), Egypt
3 Housing and Building National Research Center (HBRC), Building Physics Institute (BPI), P.O. Box 1770, 87
El‑Tahrir St., Dokki, Cairo, Egypt 4Department of Electronics, Lovely Professional University,
Phagwara, Punjab, India
Abstract:
Humidity sensor plays a crucial role in determining the efficiency of materials and the precision of apparatuses. To
measure and control humidity, a non-stoichiometric Li1.1Co0.3Fe2.1O4 mesopores sensor is synthesized by a modified
citrate auto combustion technique.
The XRD study confirms that prepared nanoparticles are cubic spinel structures having Fd3m space group. The
crystallite size is approximate 36 nm. Thermal analyses measurements confirm that the samples become thermally stable
starting from 600 °C. Additionally, the kinetic studies of the prepared samples are calculated via a pseudo-first-order
kinetic model. The temperature dependence of AC conductivity is found to increase with increasing the temperature.
These observations are explained in various models. The resistivity mechanism of humidity sensors is studied via
Complex impedance spectroscopy (CIS). Its impedance data is fitting to a corresponding circuit, to achieve a simulation
of the sample under study. This fitting is detected by the Nyquist plot (Cole-Cole). The obtained data confirms that the
studied samples are very sensitive to humidity and can be commercially used as a humidity sensing element.
Keywords: Humidity; Nyquist plot; Hopping charge carrier; spinel nanoparticles;
1. Introduction
Ferrite is an important material, where its structure and physical properties are very favorable at a nanometric scale.
It plays a crucial behavior as functional material [1]. Among ferrite nanoparticles, lithium ferrite can be considered as a
significant transition metal spinel oxide with the advantage of low price, environmental friendliness, and easy
manufacture 2]. The Li ferrite nanoparticles are indexed according to the space group Fd3m [3] and can be
characterized as (A)[B2] O4. The “A” and “B” represent the tetrahedral and the octahedral sites respectively [4]. It has
been broadly investigated for various applications such as microwave devices and magnetic switching circuits.
Additionally, it can be used in lithium batteries.
The effect of cations substitutions on the physical properties of Li nano ferrites is examined by many researchers
[5,6]. The reversible loss of lithium and oxygen during the sintering process is the main issue that restricts the
*Corresponding author: [email protected]
2
preparation process of the lithium ferrites.Therefore, lithium ferrite is often doped with other cations to adjust its
physical properties [7].
The nano ferrite is categorized as a high resistivity material. Its resistivity decreases with increasing the
surrounding humidity. Spinel ferrite nanoparticles can be used as humidity sensors (HS) due to their high porosity, large
surface/volume ratio, high resistivity, low price, and easy preparation [8]. The surrounding humidity can change the
resistivity of the ferrite by nearly three orders of magnitude. Generally, the humidity is specified as relative humidity
(RH) which signifies the amount of water vapors in the air at a specified temperature. An extensive literature survey
reveals a vast majority of sensors are based on ferrite nanoparticles [9].
In this study, the structural, morphological, and electrical properties were performed on Li1.1Co0.3Fe2.1O4 ferrite
nanoparticles. The main challenge is to advance ferrite nanoparticles with high quality, and low cost. These studies offer
a good reference value for how to maximize the performances of the examined samples in the HS applications.
2. Experimental Work
2.1. Preparation technique
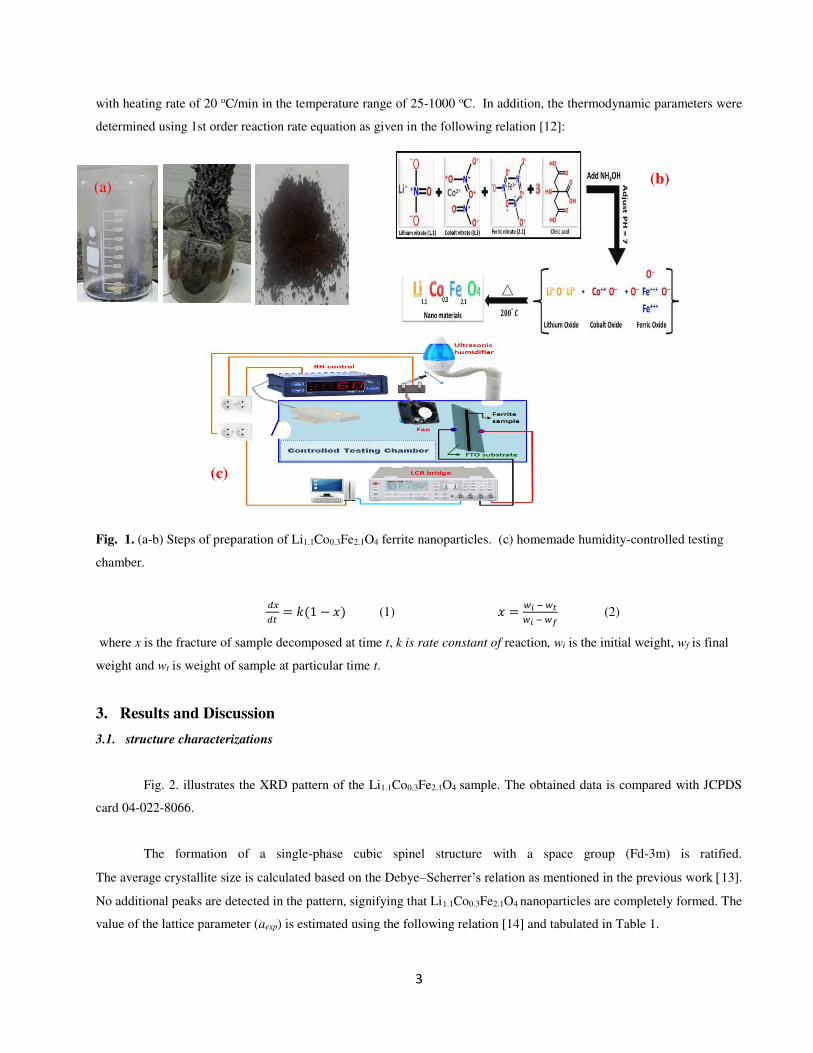
All chemicals were purchased from Sigma-Aldrich. LiCoFeO4 was prepared by mixing non- stoichiometric
proportions of iron, cobalt, lithium nitrates with the calculated amount of citric acid by citrate auto combustion technique
as reported previously [10] with some adjustments as shown in Fig. 1(a,b).
2.2. Device fabrication
Transparent Fluorine doped Tin Oxide (FTO) coated glass substrate has been cleaned to be utilized for sensor
fabrication. In brief, a proper amount of sensing material has been grounded carefully in an agate mortar for 10 min, then
mixed with a suitable amount of distilled water and grounded again for an additional 10 min to form a past. The slurry
was poured on the surface of the pre-cleaned FTO substrate and dried at 60oC for 12hr. Fig. 1(c). illustrates the
schematic diagram of the sensor. It was conditioned at 90% RH and AC voltage (1V, 100Hz) for 24 hr to enhance its
stability. The behavior and performance of the sensor were evaluated in a homemade humidity-controlled testing
chamber as shown in Fig.1:c. More details regarding the humidity testing chamber specifications can be found in our
previous work [11].
2.3. Characterization of ferrite nanoparticles
X-ray diffraction (XRD) patterns of ferrite nanoparticles were obtained by an X-ray diffractometer (Xpert PRO
MPD) using CuKα radiation. The shape and size distribution of the nanoparticles were investigated using Field emission
scanning electron microscope (FESEM, model Quanta 250). The prepared samples were analyzed through TGA/DTG
3
with heating rate of 20 oC/min in the temperature range of 25-1000 oC. In addition, the thermodynamic parameters were
determined using 1st order reaction rate equation as given in the following relation [12]:
Fig. 1. (a-b) Steps of preparation of Li1.1Co0.3Fe2.1O4 ferrite nanoparticles. (c) homemade humidity-controlled testing
chamber.
𝑑𝑥𝑑𝑡 = 𝑘(1 − 𝑥) (1) 𝑥 = 𝑤𝑖 − 𝑤𝑡𝑤𝑖 − 𝑤𝑓 (2)
where x is the fracture of sample decomposed at time t, k is rate constant of reaction, wi is the initial weight, wf is final
weight and wt is weight of sample at particular time t.
3. Results and Discussion
3.1. structure characterizations
Fig. 2. illustrates the XRD pattern of the Li1.1Co0.3Fe2.1O4 sample. The obtained data is compared with JCPDS
card 04-022-8066.
The formation of a single-phase cubic spinel structure with a space group (Fd-3m) is ratified.
The average crystallite size is calculated based on the Debye–Scherrer’s relation as mentioned in the previous work 13].
No additional peaks are detected in the pattern, signifying that Li1.1Co0.3Fe2.1O4 nanoparticles are completely formed. The
value of the lattice parameter (aexp) is estimated using the following relation [14] and tabulated in Table 1.
(c)
(a) (b)

4
Fig. 2. The XRD diffraction pattern for Li1.1Co0.3Fe2.1O4.
𝑎𝑒𝑥𝑝 = 𝑑√ℎ2 + 𝑘2 + 𝑙2 ( 3 )
Where d is the d-spacing and (hkl) are the Miller indices of the planes associated with characteristic peaks.
The X-ray density (DX), experimental density (dexp), and porosity (P), for Li1.1Co0.3Fe2.1O4 are demonstrated as
mentioned in the previous work [15]. The calculated data is illustrated in the Table 1.
𝑑𝑥 = 𝑍𝑀𝑎𝑒𝑥𝑝3 𝑁𝐴 ( 4 ) 𝑑𝐵 = 𝑚𝜋𝑟2𝑡 ( 5 ) 𝑃(%) = (1 − 𝑑𝐵𝑑𝑥 ) × 100 ( 6 )
where Z is number of molecules per unit cell (for spinel ferrites Z = 8), M is molecular weight of the sample (g/mole),
NA is the Avogadro's number (6.023×10²³ atom/mole), and m, r and t are the mass, radius and thickness, respectively, of
each pellet of Li1.1Co0.3Fe2.1O4 nano ferrite sample.
Table 1
The experimental lattice constant (a exp.), the theoretical density (dx), experimental density (dexp), porosity (P) and
crystallite size (D) of the investigated sample.
3.2. Field Emission Scanning Electron Microscope
The FESEM images of the investigated sample are presented in Fig. 3(a-b).
Fig. 3. (a-b) FESEM images of LiCoFeO sample.
Sample 𝑎𝑒𝑥𝑝 (Ǻ) dx (g/cm3) dexp (g/cm3) P (%) D (nm)
Li1.1Co0.3Fe2.1O4 8.324 4.758 2.528 46.86 36
(a) (b)
5
The LiCoFeO grains with porous nature and rocky like shape are clearly appeared. As can be seen, the sample is spongy
and porous agglomerates. The appearance of porous can be attributed to the escape of gases during the combustion
process. The same behavior was attained for copper nano ferrites [16]. The FESEM images show that some of the
particles combined with each other to form clusters and leave some spaces as pores. These pores serve as humidity or gas
adsorption sites as will be discussed later. The detected porosity from XRD agrees with the FESEM images. The
Li1.1Co0.3Fe2.1O4 with such morphology is highly recommended in humidity sensor applications.
3.3. Thermogravimetric analysis.
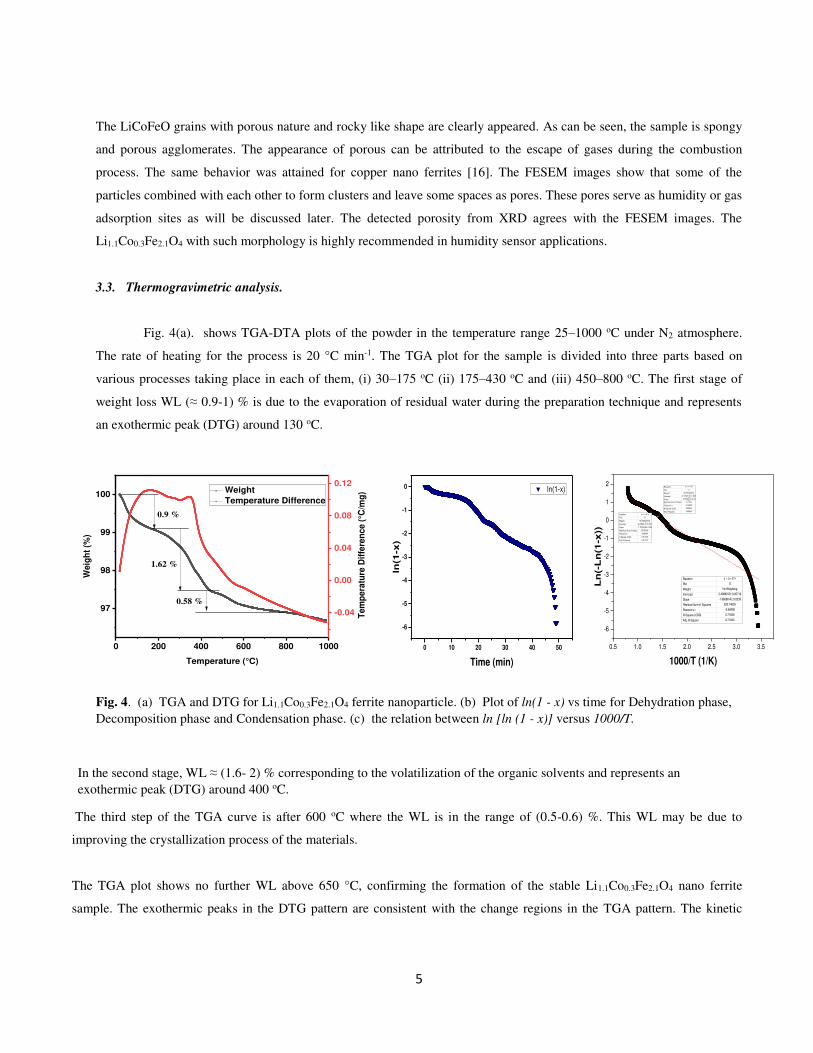
Fig. 4(a). shows TGA-DTA plots of the powder in the temperature range 25–1000 oC under N2 atmosphere.
The rate of heating for the process is 20 °C min-1. The TGA plot for the sample is divided into three parts based on
various processes taking place in each of them, (i) 30–175 oC (ii) 175–430 oC and (iii) 450–800 oC. The first stage of
weight loss WL (≈ 0.9-1) % is due to the evaporation of residual water during the preparation technique and represents
an exothermic peak (DTG) around 130 oC.
Fig. 4. (a) TGA and DTG for Li1.1Co0.3Fe2.1O4 ferrite nanoparticle. (b) Plot of ln(1 - x) vs time for Dehydration phase,
Decomposition phase and Condensation phase. (c) the relation between ln [ln (1 - x)] versus 1000/T.
In the second stage, WL ≈ (1.6- 2) % corresponding to the volatilization of the organic solvents and represents an
exothermic peak (DTG) around 400 oC.
The third step of the TGA curve is after 600 oC where the WL is in the range of (0.5-0.6) %. This WL may be due to
improving the crystallization process of the materials.
The TGA plot shows no further WL above 650 °C, confirming the formation of the stable Li1.1Co0.3Fe2.1O4 nano ferrite
sample. The exothermic peaks in the DTG pattern are consistent with the change regions in the TGA pattern. The kinetic
0 200 400 600 800 1000
97
98
99
100 Weight
Temperature Difference
Temperature (°C)
Weig
ht
(%)
0.9 %
1.62 %
0.58 %
-0.04
0.00
0.04
0.08
0.12
Tem
pera
ture
Dif
fere
nce (
°C/m
g)
0.5 1.0 1.5 2.0 2.5 3.0 3.5
-6
-5
-4
-3
-2
-1
0
1
2
Ln
(-L
n(1
-x))
1000/T (1/K)
Equation y = a + b*x
Plot D
Weight No Weighting
Intercept 2.49889 ± 0.05719
Slope -1.66688 ± 0.0239
Residual Sum of Squares 620.14035
Pearson's r -0.84296
R-Square (COD) 0.71058
Adj. R-Square 0.71043
Equation y = a + b*x
Plot D
Weight No Weighting
Intercept 4.61827 ± 0.00859
Slope -3.03784 ± 0.00568Residual Sum of Squar
es0.0154
Pearson's r -0.99922
R-Square (COD) 0.99844
Adj. R-Square 0.99843
Equation y = a + b*x
Plot D
Weight No Weighting
Intercept 2.70449 ± 0.009
Slope -1.73194 ± 0.009
Residual Sum of Squar 25.89186
Pearson's r -0.95784
R-Square (COD) 0.91745
Adj. R-Square 0.91742
0 10 20 30 40 50
-6
-5
-4
-3
-2
-1
0 ln(1-x)
ln(1
-x)
Time (min)
6
studies of the prepared samples are calculated via a pseudo-first-order kinetic model. The rate constant (k) can be obtained
from the slope of the linear plot of ln (1-x) against time (t) by using the next equation. The data is plotted in Fig. 4(b).
ln(1 − 𝑥) = −𝑘𝑡 ( 7 )
The half-life (t1/2) is determined via Eq. (8), and the obtained results are illustrated in Table 2.
𝑡1/2 = 0.693 𝑘⁄ ( 8 )
The Coats and Redfern model can be used to detect the kinetics parameters as designated in the following formula [12]:
ln[− 𝑙𝑛 (1 − 𝑥)] = 𝑙𝑛 𝐴𝑅𝑇2𝛽𝐸𝑎 − 𝐸𝑎𝑅𝑇 ( 9)
where A, , and R are the pre-exponential parameter, the heating rate, and the universal gas constant (8.3143 Jmol-1 K-1)
respectively. While Ea is activation energy and T is the temperature (K). The Ea can be obtained by drawing the relation
between ln [ln (1 - x)] versus 1000/T as shown in Fig. 4(c). The Ea values 25 kJ mol-1 ratify that this is a chemically
controlled reaction and not diffusion or mass transfer limitations. Additionally, other parameters like the change of the
entropy (So), enthalpy (H o), and Gibbs free energy (Go) is calculated using basic thermodynamic equations [17]:
∆𝐻 = 𝐸𝑎 − 𝑅. 𝑇 ( 10 ) ∆𝑆 = 𝑅. ln ( 𝐴.ℎ𝐾.𝑇 ) ( 11 ) ∆𝐺 = ∆H − T. ∆S ( 12 )
Where h and K is Blank constant and Boltzmann constant respectively. The results for each phase are tabulated in Table 2.
The positive value of H o designates the input heat energy which is required for the reactants. The degree of disturbance of
the system can be identified by S. The negative value of So specifies that the transition state orientation is higher compared
to the reactants in the ground state. Additionally, it signifies that the Li2O + CoO + FeO join each other to form LiCoFeO
which is more organized and stable compared to the ground state and subsequently decreases the randomness of the system.
The G gives an idea on, either non-spontaneity or spontaneity of the reaction depending on the +ve or -ve values of Go. In
the present study, +ve values of G indicate the non-spontaneous nature of the process.
Table 2
Thermodynamic and Kinetic parameters of each phase during thermogravimetric analysis of Li1.1Co0.3Fe2.1O4
nanoparticles.
Region Temp (K) k (min-1) t1/2 (min) Ea (kJmol-1) ΔH (kJmol-1) ΔS (Jmol-1 K-1) ΔG
(KJmol-1)
First 623 0.034 20.563 18.85 8.67 -284.63 186.0
Second 723 0.137 5.058 25.23 19.22 -265.74 211.3
Third 830 0.107 6.470 14.38 7.48 -289.69 247.9
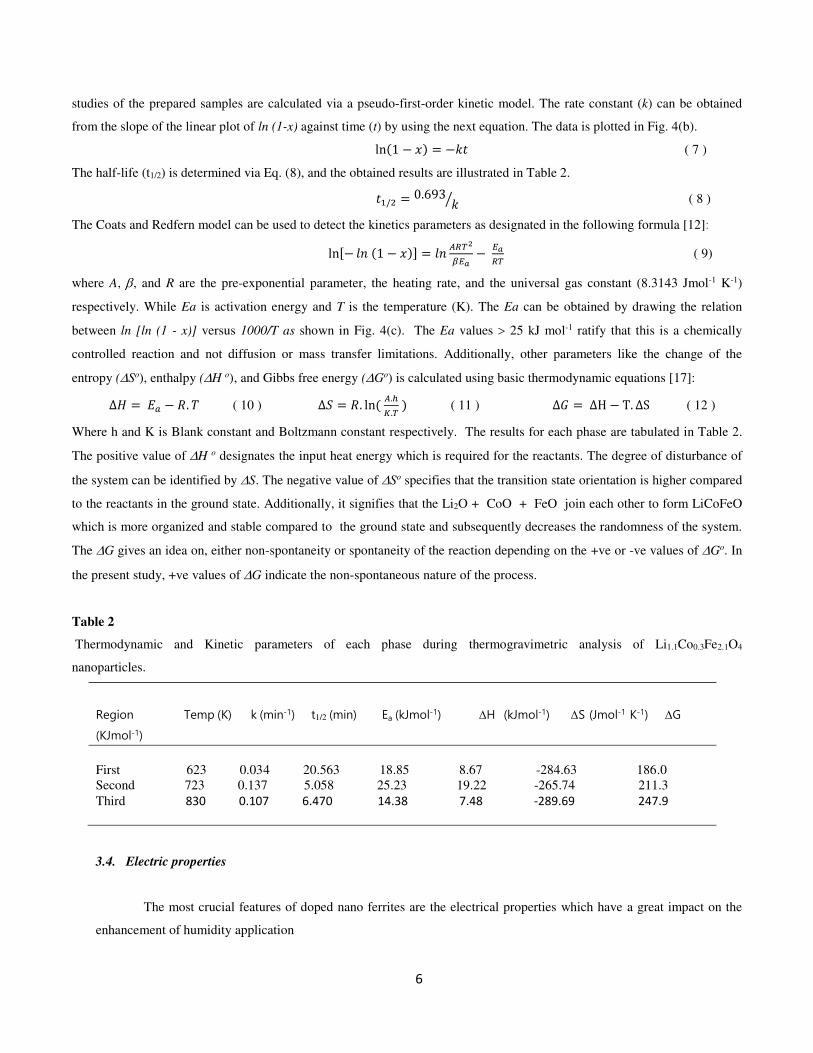
3.4. Electric properties
The most crucial features of doped nano ferrites are the electrical properties which have a great impact on the
enhancement of humidity application
7
.
Fig. 5. (a) The dependence of dielectric constant (ԑ/) on the absolute temperature as a function of frequency. (b) The
dependence of ԑ/ on the frequencies.
The dielectric constant (ԑ/) gradually increases with increasing temperature till 550 °C then rapidly increases is detected up to
650 °C as shown in Fig. 5 (a-b). The rapid increase in the ԑ/ can be attributed to the dipolar polarization. According to Koops’
model, ferrites are comprised of two layers, the first is low resistance grains, and the other is high-resistance grain boundaries.
When the electric field is applied to the investigated sample, electrons accumulate at grain boundaries and hinders the electron
conduction. This accumulation generates space charge polarization. The electron hopping in Li1.1Co0.3Fe2.1O4 is principally
between the elements at B site as Fe2+- Fe3+, and Co2+ -Co3+ ions [18, 19]. The excess of metals ions in Li1.1Co0.3Fe2.1O4 (B
cations 2) will greatly increase the probability of electron hopping between Fe2+ / Fe3+, and Co2+/Co3+ ions. This inevitably
leads to an increase of space charge reaching the grain boundary, thus increasing the space charge polarization. However,
these space charge carriers need some time to line up along their axes by the varying applied field, consequently, ԑ/ decreases
with increasing frequency.
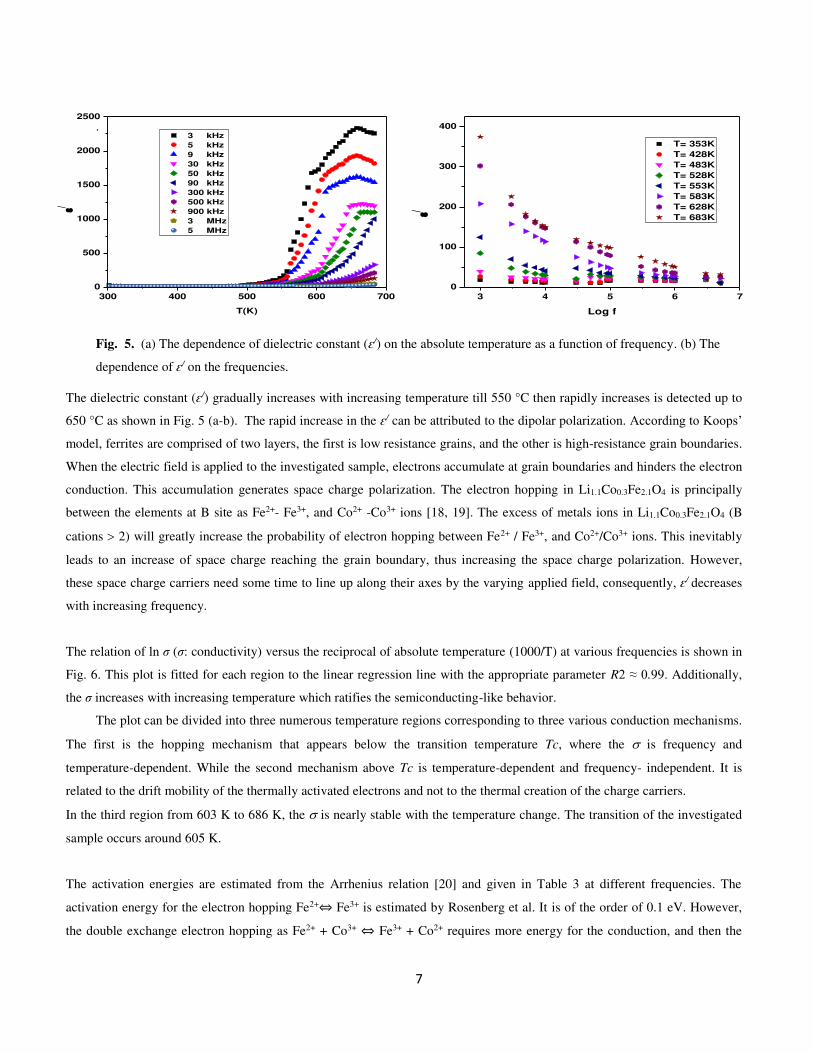
The relation of ln σ (σ: conductivity) versus the reciprocal of absolute temperature (1000/T) at various frequencies is shown in
Fig. 6. This plot is fitted for each region to the linear regression line with the appropriate parameter R2 ≈ 0.99. Additionally,
the σ increases with increasing temperature which ratifies the semiconducting-like behavior.
The plot can be divided into three numerous temperature regions corresponding to three various conduction mechanisms.
The first is the hopping mechanism that appears below the transition temperature Tc, where the is frequency and
temperature-dependent. While the second mechanism above Tc is temperature-dependent and frequency- independent. It is
related to the drift mobility of the thermally activated electrons and not to the thermal creation of the charge carriers.
In the third region from 603 K to 686 K, the is nearly stable with the temperature change. The transition of the investigated
sample occurs around 605 K.
The activation energies are estimated from the Arrhenius relation [20] and given in Table 3 at different frequencies. The
activation energy for the electron hopping Fe2+⇔ Fe3+ is estimated by Rosenberg et al. It is of the order of 0.1 eV. However,
the double exchange electron hopping as Fe2+ + Co3+ ⇔ Fe3+ + Co2+ requires more energy for the conduction, and then the
300 400 500 600 700
0
500
1000
1500
2000
2500
3 kHz
5 kHz
9 kHz
30 kHz
50 kHz
90 kHz
300 kHz
500 kHz
900 kHz
3 MHz
5 MHz
/
T(K)
3 4 5 6 7
0
100
200
300
400
T= 353K
T= 428K
T= 483K
T= 528K
T= 553K
T= 583K
T= 628K
T= 683K/
Log f
8
activation energies would naturally be considerably larger. Accordingly, in the present case, the obtained activation energies of
the range of 0.2-0.3 eV suggest that the double exchange interaction process is more predominant. The obtained activation
energies of pure materials agree well with that reported for the double exchange electron hopping (~ 0.25eV) [ 21].
Fig. 6.(a) The relation of ln σ (σ: conductivity) and the reciprocal of absolute temperature (1000/T) at different frequencies. (b) The relation of Ln σ and Ln ω for the investigated sample.
Table 3
The activation energies for Li1.1Co0.3Fe2.1O4.
Fig. 6 (b). illustrates the relation of Ln σ (σ: conductivity) and Ln ω (ω: angular frequency) for the sample
Li1.1Co0.3Fe2.1O4 as a function of the absolute temperature. The ac obeyed the power law that was discussed previously
[22].
𝜎𝑎𝑐(𝜔) = 𝐵 𝜔𝑠 ( 13 )
where σac is the ac conductivity, ω = 2πf is the angular frequency, B is a temperature-dependent constant and S is the
frequency-dependent exponent. The slope of lines represents the values of the exponent factor (S). The experimental
values of the slope S attained for Li1.1Co0.3Fe2.1O4 is 0.57. The obtained value agrees well with the values (0.6–1.0) found
for the hoping mechanism in most transition metal oxide materials [23].
3.5. Humidity sensing studies
The porosity is a significant advantage of nano ferrite which is essential for a humidity sensor. The change of resistivity
with exposure to humidity is a basic requirement for the sensor. This change depends on the band gaps, surface
morphology, size, diffusion rate of gas, and specific surface area of the used magnetic materials. [24]
Frequency (kHz)/
activation energy (eV)
50 90 300 500 900 1000
E1 0.25 0.21 0.26 0.29 0.30 0.29
E2 0.98 0.93 0.82 0.77 0.63 0.67
1.5 2.0 2.5 3.0 3.5-16
-12
-8
-4
3 kHz
5 kHz
9 kHz
30 kHz
50 kHz
90 kHz
300 kHz
500 kHz
900 kHz
1 MHz
ln
1000/T (K)-1
8 10 12 14 16 18-16
-14
-12
-10
-8
-6
-4
T= 302K
T= 353K
T= 403K
T= 453K
T= 503K
T= 553K
T= 603K
T=653K
Ln
Ln
9
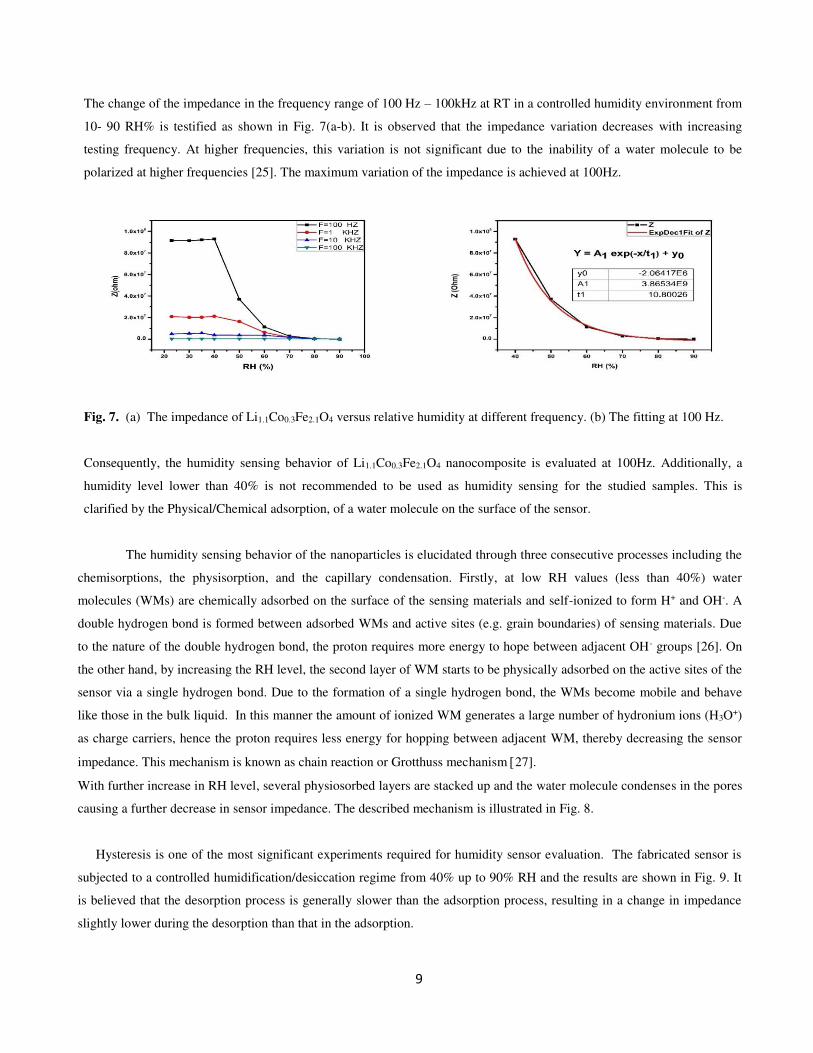
The change of the impedance in the frequency range of 100 Hz – 100kHz at RT in a controlled humidity environment from
10- 90 RH% is testified as shown in Fig. 7(a-b). It is observed that the impedance variation decreases with increasing
testing frequency. At higher frequencies, this variation is not significant due to the inability of a water molecule to be
polarized at higher frequencies [25]. The maximum variation of the impedance is achieved at 100Hz.
Fig. 7. (a) The impedance of Li1.1Co0.3Fe2.1O4 versus relative humidity at different frequency. (b) The fitting at 100 Hz.
Consequently, the humidity sensing behavior of Li1.1Co0.3Fe2.1O4 nanocomposite is evaluated at 100Hz. Additionally, a
humidity level lower than 40% is not recommended to be used as humidity sensing for the studied samples. This is
clarified by the Physical/Chemical adsorption, of a water molecule on the surface of the sensor.
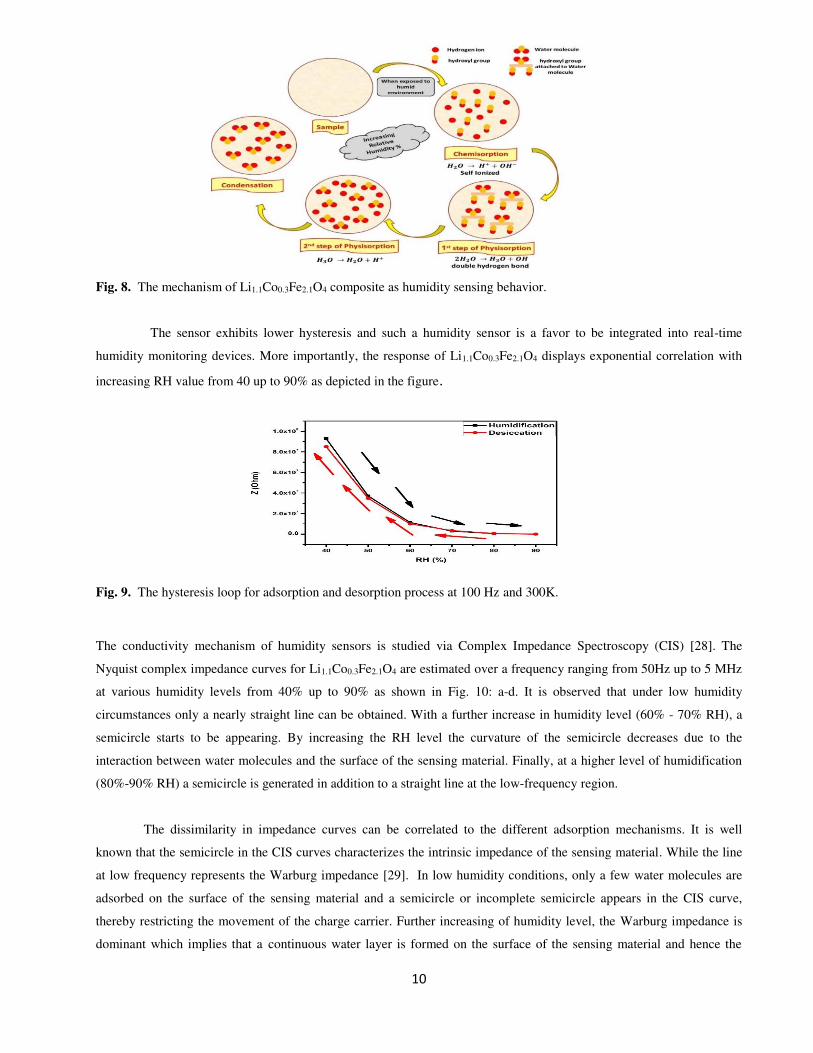
The humidity sensing behavior of the nanoparticles is elucidated through three consecutive processes including the
chemisorptions, the physisorption, and the capillary condensation. Firstly, at low RH values (less than 40%) water
molecules (WMs) are chemically adsorbed on the surface of the sensing materials and self-ionized to form H+ and OH-. A
double hydrogen bond is formed between adsorbed WMs and active sites (e.g. grain boundaries) of sensing materials. Due
to the nature of the double hydrogen bond, the proton requires more energy to hope between adjacent OH- groups [26]. On
the other hand, by increasing the RH level, the second layer of WM starts to be physically adsorbed on the active sites of the
sensor via a single hydrogen bond. Due to the formation of a single hydrogen bond, the WMs become mobile and behave
like those in the bulk liquid. In this manner the amount of ionized WM generates a large number of hydronium ions (H3O+)
as charge carriers, hence the proton requires less energy for hopping between adjacent WM, thereby decreasing the sensor
impedance. This mechanism is known as chain reaction or Grotthuss mechanism 27].
With further increase in RH level, several physiosorbed layers are stacked up and the water molecule condenses in the pores
causing a further decrease in sensor impedance. The described mechanism is illustrated in Fig. 8.
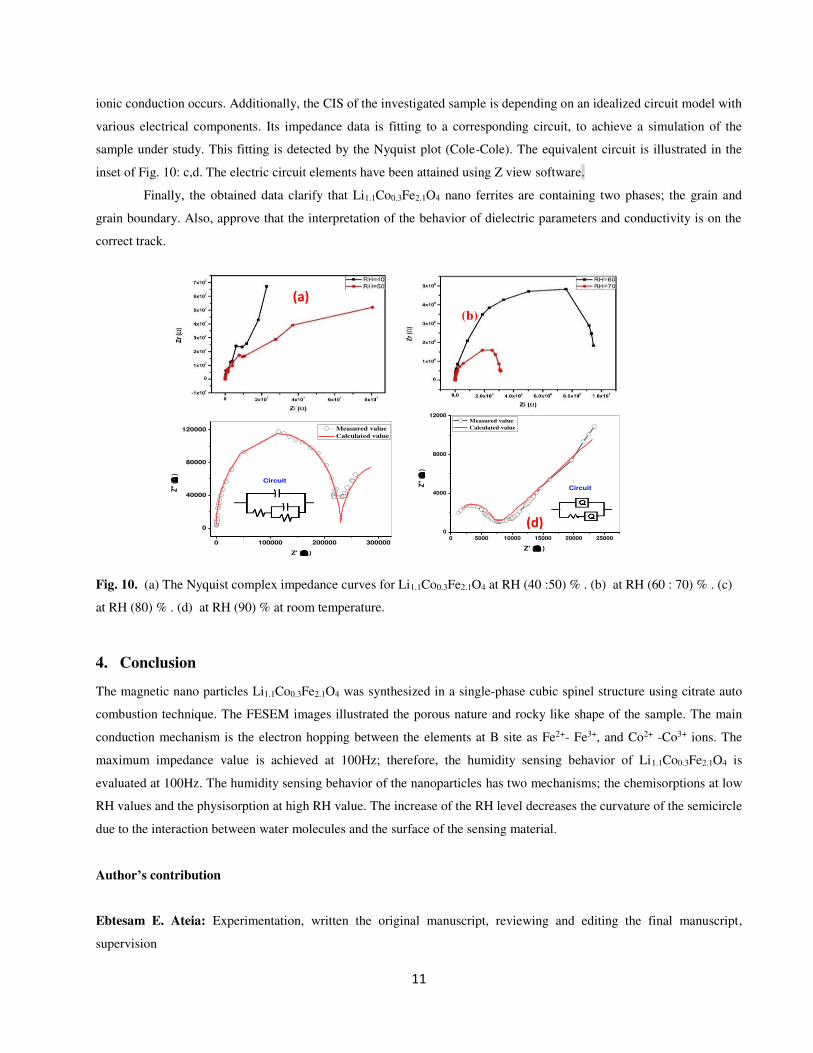
Hysteresis is one of the most significant experiments required for humidity sensor evaluation. The fabricated sensor is
subjected to a controlled humidification/desiccation regime from 40% up to 90% RH and the results are shown in Fig. 9. It
is believed that the desorption process is generally slower than the adsorption process, resulting in a change in impedance
slightly lower during the desorption than that in the adsorption.
10
Fig. 8. The mechanism of Li1.1Co0.3Fe2.1O4 composite as humidity sensing behavior.
The sensor exhibits lower hysteresis and such a humidity sensor is a favor to be integrated into real-time
humidity monitoring devices. More importantly, the response of Li1.1Co0.3Fe2.1O4 displays exponential correlation with
increasing RH value from 40 up to 90% as depicted in the figure.
Fig. 9. The hysteresis loop for adsorption and desorption process at 100 Hz and 300K.
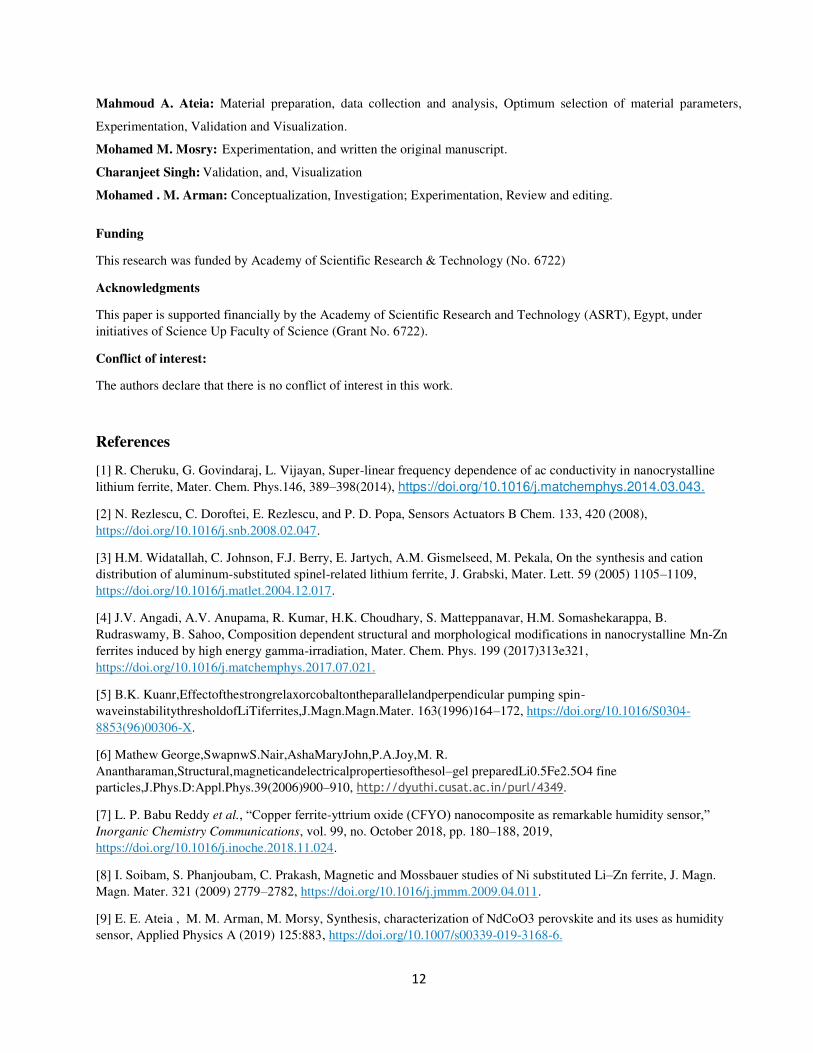
The conductivity mechanism of humidity sensors is studied via Complex Impedance Spectroscopy (CIS) [28]. The
Nyquist complex impedance curves for Li1.1Co0.3Fe2.1O4 are estimated over a frequency ranging from 50Hz up to 5 MHz
at various humidity levels from 40% up to 90% as shown in Fig. 10: a-d. It is observed that under low humidity
circumstances only a nearly straight line can be obtained. With a further increase in humidity level (60% - 70% RH), a
semicircle starts to be appearing. By increasing the RH level the curvature of the semicircle decreases due to the
interaction between water molecules and the surface of the sensing material. Finally, at a higher level of humidification
(80%-90% RH) a semicircle is generated in addition to a straight line at the low-frequency region.
The dissimilarity in impedance curves can be correlated to the different adsorption mechanisms. It is well
known that the semicircle in the CIS curves characterizes the intrinsic impedance of the sensing material. While the line
at low frequency represents the Warburg impedance [29]. In low humidity conditions, only a few water molecules are
adsorbed on the surface of the sensing material and a semicircle or incomplete semicircle appears in the CIS curve,
thereby restricting the movement of the charge carrier. Further increasing of humidity level, the Warburg impedance is
dominant which implies that a continuous water layer is formed on the surface of the sensing material and hence the
11
ionic conduction occurs. Additionally, the CIS of the investigated sample is depending on an idealized circuit model with
various electrical components. Its impedance data is fitting to a corresponding circuit, to achieve a simulation of the
sample under study. This fitting is detected by the Nyquist plot (Cole-Cole). The equivalent circuit is illustrated in the
inset of Fig. 10: c,d. The electric circuit elements have been attained using Z view software.
Finally, the obtained data clarify that Li1.1Co0.3Fe2.1O4 nano ferrites are containing two phases; the grain and
grain boundary. Also, approve that the interpretation of the behavior of dielectric parameters and conductivity is on the
correct track.
Fig. 10. (a) The Nyquist complex impedance curves for Li1.1Co0.3Fe2.1O4 at RH (40 :50) % . (b) at RH (60 : 70) % . (c)
at RH (80) % . (d) at RH (90) % at room temperature.
4. Conclusion
The magnetic nano particles Li1.1Co0.3Fe2.1O4 was synthesized in a single-phase cubic spinel structure using citrate auto
combustion technique. The FESEM images illustrated the porous nature and rocky like shape of the sample. The main
conduction mechanism is the electron hopping between the elements at B site as Fe2+- Fe3+, and Co2+ -Co3+ ions. The
maximum impedance value is achieved at 100Hz; therefore, the humidity sensing behavior of Li1.1Co0.3Fe2.1O4 is
evaluated at 100Hz. The humidity sensing behavior of the nanoparticles has two mechanisms; the chemisorptions at low
RH values and the physisorption at high RH value. The increase of the RH level decreases the curvature of the semicircle
due to the interaction between water molecules and the surface of the sensing material.
Author’s contribution
Ebtesam E. Ateia: Experimentation, written the original manuscript, reviewing and editing the final manuscript,
supervision
(d)
(a)
(b)
0 5000 10000 15000 20000 25000
0
4000
8000
12000
Z''
()
Z' ( )
Measured value
Calculated value
Circuit
0 100000 200000 300000
0
40000
80000
120000
Z''
( )
Z' ()
Measured value
Calculated value
Circuit
12
Mahmoud A. Ateia: Material preparation, data collection and analysis, Optimum selection of material parameters,
Experimentation, Validation and Visualization.
Mohamed M. Mosry: Experimentation, and written the original manuscript.
Charanjeet Singh: Validation, and, Visualization
Mohamed . M. Arman: Conceptualization, Investigation; Experimentation, Review and editing.
Funding
This research was funded by Academy of Scientific Research & Technology (No. 6722)
Acknowledgments
This paper is supported financially by the Academy of Scientific Research and Technology (ASRT), Egypt, under
initiatives of Science Up Faculty of Science (Grant No. 6722).
Conflict of interest:
The authors declare that there is no conflict of interest in this work.
References
[1] R. Cheruku, G. Govindaraj, L. Vijayan, Super-linear frequency dependence of ac conductivity in nanocrystalline
lithium ferrite, Mater. Chem. Phys.146, 389–398(2014), https://doi.org/10.1016/j.matchemphys.2014.03.043.
[2] N. Rezlescu, C. Doroftei, E. Rezlescu, and P. D. Popa, Sensors Actuators B Chem. 133, 420 (2008),
https://doi.org/10.1016/j.snb.2008.02.047.
[3] H.M. Widatallah, C. Johnson, F.J. Berry, E. Jartych, A.M. Gismelseed, M. Pekala, On the synthesis and cation
distribution of aluminum-substituted spinel-related lithium ferrite, J. Grabski, Mater. Lett. 59 (2005) 1105–1109,
https://doi.org/10.1016/j.matlet.2004.12.017.
[4] J.V. Angadi, A.V. Anupama, R. Kumar, H.K. Choudhary, S. Matteppanavar, H.M. Somashekarappa, B.
Rudraswamy, B. Sahoo, Composition dependent structural and morphological modifications in nanocrystalline Mn-Zn
ferrites induced by high energy gamma-irradiation, Mater. Chem. Phys. 199 (2017)313e321,
https://doi.org/10.1016/j.matchemphys.2017.07.021.
[5] B.K. Kuanr,Effectofthestrongrelaxorcobaltontheparallelandperpendicular pumping spin-
waveinstabilitythresholdofLiTiferrites,J.Magn.Magn.Mater. 163(1996)164–172, https://doi.org/10.1016/S0304-
8853(96)00306-X.
[6] Mathew George,SwapnwS.Nair,AshaMaryJohn,P.A.Joy,M. R.
Anantharaman,Structural,magneticandelectricalpropertiesofthesol–gel preparedLi0.5Fe2.5O4 fine
particles,J.Phys.D:Appl.Phys.39(2006)900–910, http://dyuthi.cusat.ac.in/purl/4349.
[7] L. P. Babu Reddy et al., “Copper ferrite-yttrium oxide (CFYO) nanocomposite as remarkable humidity sensor,” Inorganic Chemistry Communications, vol. 99, no. October 2018, pp. 180–188, 2019,
https://doi.org/10.1016/j.inoche.2018.11.024.
[8] I. Soibam, S. Phanjoubam, C. Prakash, Magnetic and Mossbauer studies of Ni substituted Li–Zn ferrite, J. Magn.
Magn. Mater. 321 (2009) 2779–2782, https://doi.org/10.1016/j.jmmm.2009.04.011.
[9] E. E. Ateia , M. M. Arman, M. Morsy, Synthesis, characterization of NdCoO3 perovskite and its uses as humidity
sensor, Applied Physics A (2019) 125:883, https://doi.org/10.1007/s00339-019-3168-6.
13
[10] E. E. Ateia, “Assessing of channel structure and magnetic properties on heavy metal ions removal from water,” J.
Mater. Sci. Mater. Electron., 2021, doi: 10.1007/s10854-021-07008-9, https://doi.org/10.1007/s10854-021-07008-9.
[11] E. E. Ateia and A. T. Mohamed, “Humidity sensor applications based on mesopores LaCoO3,” Journal of
Materials Science: Materials in Electronics, vol. 30, no. 21, pp. 19254–19261, 2019, https://doi.org/10.1007/s10854-
019-02284-y.
[12] M. A. Farrukh, K. M. Butt, K. K. Chong, and W. S. Chang, “Photoluminescence emission behavior on the reduced band gap of Fe doping in CeO2-SiO2 nanocomposite and photophysical properties,” J. Saudi Chem. Soc., vol. 23, no.
5, pp. 561–575, 2019, doi: 10.1016/j.jscs.2018.10.002, https://doi.org/10.1016/j.jscs.2018.10.002.
[13] E. E. Ateia, M. K. Abdelmaksoud, and H. Ismail, “A study of the magnetic properties and the magneto-
crystalline anisotropy for the nano-composites CoFe2O4/Sm0.7La0.3FeO3,” J. Mater. Sci. Mater. Electron., vol. 32, no.
4, pp. 4480–4492, 2021, doi: 10.1007/s10854-020-05189-3, https://doi.org/10.1007/s10854-020-05189-3.
[14] Lakshita . PHOR, Vinod KUMAR, Structural, thermomagnetic, and dielectric properties of Mn0.5Zn0.5GdxFe2–xO4 (x
= 0, 0.025, 0.050, 0.075, and 0.1). Journal of Advanced Ceramics 2020, 9(2): 243-254, https://doi.org/10.1007/s40145-
020-0364-y.
[15] M.A. Ahmed, M. Solyman Selim, M.M. Arman, Novel multiferroic La0.95Sb0.05FeO3 orthoferrite, Materials
Chemistry and Physics 129 (2011) 705– 712, https://doi.org/10.1016/j.matchemphys.2011.03.033.
[16] Xuan Zhao, Yue Fu, Jin Wang, Yujiao Xu, Jing-Hua Tian, Ruizhi Yang, Ni-doped CoFe2O4 Hollow
Nanospheres as Efficient Bi-functional Catalysts, Electrochimica Acta 201 (2016) 172–178, https://doi.org/10.1016/j.electacta.2016.04.001
[17] S. K. Paswan et al., “Optimization of structure-property relationships in nickel ferrite nanoparticles annealed at
different temperature,” J. Phys. Chem. Solids, vol. 151, no. October 2020, p. 109928, 2021, doi:
10.1016/j.jpcs.2020.109928, https://doi.org/10.1016/j.jpcs.2020.109928.
[18] G.A. Sawatzky, F. VAN DER Woude, A.H. Morrish, Cation Distributions in Octahedral and Tetrahedral Sites of
the Ferrimagnetic Spinel CoFe2O4, J. Appl. Phys. 39 (1968) 1204-1205, https://doi.org/10.1063/1.1656224.
[19] R. Yadav, M.K. Yadav, N.K. Singh, Electrocatalytic Properties of Sol-Gel Derived Spinel CoxFe3-xO4 (0 x 1.
5) Electrodes for Oxygen Evolution in Alkaline Solution, Int. J. Electrochem. Sci. 8 (2013) 6321–6331,
http://electrochemsci.org/papers/vol8/80506321.pdf.
[20] Jin Soo Kim, Hai Joon Lee, Sun Young Lee, Ill Won Kim, Su Dae Lee, Frequency and temperature dependence
of dielectric and electrical properties of radio-frequency sputtered lead-free K0.48Na0.52NbO3 thin films, The Solid
Films 518 (2010) 6390 – 6393, https://doi.org/10.1016/j.tsf.2010.02.078.
[21] B. Senthilkumar, R. Kalai Selvan, P. Vinothbabu, I. Perelshtein, and A. Gedanken, “Structural, magnetic, electrical and electrochemical properties of NiFe2O4 synthesized by the molten salt technique,” Mater. Chem. Phys.,
vol. 130, no. 1–2, pp. 285–292, 2011, doi: 10.1016/j.matchemphys.2011.06.043, https://doi.org/10.1016/j.matchemphys.2011.06.043.
[22] S. Singh, S. C. Katyal, and N. Goswami, “Dielectric and electrical study of zinc copper ferrite nanoparticles prepared by exploding wire technique,” Appl. Phys. A Mater. Sci. Process., vol. 125, no. 9, pp. 1–14, 2019, doi:
10.1007/s00339-019-2936-7, https://doi.org/10.1007/s00339-019-2936-7.
14
[23] A.S. Das, M. Roy, D. Biswas, R. Kundu, A. Acharya, D. Roy,S. Bhattacharya, Ac conductivity of transition
metal oxide doped glassy nanocomposite systems: temperature and frequency dependency. Mater. Res. Express. 5,
095201 (2018), Materials Research Express, Volume 5, Number 9.
[24] E. Rios, J.L. Gautier, G. Poillerat, P. Chartier, Mixed valency spinel oxides of transition metals and
electrocatalysis: case of the MnxCo3-xO4 system, Electrochim. Acta 44 (1998) 1491–1497, https://doi.org/10.1016/S0013-4686(98)00272-2.
[25] M. Morsy, M. M. Mokhtar, S. H. Ismail, G. G. Mohamed, and M. Ibrahim, “Humidity Sensing Behaviour of Lyophilized rGO/Fe2O3 Nanocomposite,” Journal of Inorganic and Organometallic Polymers and Materials, vol. 30,
no. 10, pp. 4180–4190, 2020, https://doi.org/10.1007/s10904-020-01570-1.
[26] A. Tripathy et al., “Design and development for capacitive humidity sensor applications of lead-free Ca, Mg, Fe, Ti-
oxides-based electro-ceramics with improved sensing properties via physisorption,” Sensors (Switzerland), vol. 16, no. 7,
2016, https://doi.org/10.3390/s16071135.
[27] P. Chavan, “Chemisorption and Physisorption of Water Vapors on the Surface of Lithium-Substituted Cobalt Ferrite
Nanoparticles,” ACS Omega, vol. 6, no. 3, pp. 1953–1959, 2021, doi: 10.1021/acsomega.0c04784,
https://doi.org/10.1021/acsomega.0c04784.
[28] T. Şaşmaz Kuru, M. Kuru, and S. Bağcı, “Structural, dielectric and humidity properties of Al-Ni-Zn ferrite prepared
by co-precipitation method,” Journal of Alloys and Compounds, vol. 753, pp. 483–490, 2018,
https://doi.org/10.1016/j.jallcom.2018.04.255.
[29] X. Zhao, X. Chen, X. Yu, X. Ding, X. L. Yu, and X. P. Chen, “Fast response humidity sensor based on graphene
oxide films supported by TiO2 nanorods,” Diamond and Related Materials, vol. 109, no. April, p. 108031, 2