systems analysis for thermal infrared thz torch applications · systems analysis for thermal...
TRANSCRIPT

Systems Analysis for Thermal Infrared ‘THz Torch’Applications
Fangjing Hu & Jingye Sun & Helen E. Brindley &
Xiaoxin Liang & Stepan Lucyszyn
Received: 16 September 2014 /Accepted: 16 December 2014 /Published online: 24 February 2015# The Author(s) 2015. This article is published with open access at Springerlink.com
Abstract The ‘THz Torch’ concept was recently introduced by the authors for providingsecure wireless communications over short distances within the thermal infrared (10-100 THz).Unlike conventional systems, thermal infrared can exploit front-end thermodynamics withengineered blackbody radiation. For the first time, a detailed power link budget analysis isgiven for this new form of wireless link. The mathematical modeling of a short end-to-end link isprovided, which integrates thermodynamics into conventional signal and noise power analysis. Asexpected from the Friis formula for noise, it is found that the noise contribution from thepyroelectric detector dominates intrinsic noise. Fromoutput signal and noise voltagemeasurements,experimental values for signal-to-noise ratio (SNR) are obtained and compared with calculatedpredictions. As with conventional communications systems, it is shown for the first time that themeasured SNR and measured bit error rate found with this thermodynamics-based system resem-bles classical empirical models. Our system analysis can serve as an invaluable tool for thedevelopment of thermal infrared systems, accurately characterizing each individual channel and,thus, enables the performance of multi-channel ‘THz Torch’ systems to be optimized.
Keywords ‘THz Torch’ . power link budget . thermal infrared . wireless communications .
thermodynamics . blackbody source
1 Introduction
Until very recently, there has been little in the way of enabling technologies within thermalinfrared (ca. 10-100 THz) part of the frequency spectrum to support wireless communications.
J Infrared Milli Terahz Waves (2015) 36:474–495DOI 10.1007/s10762-014-0136-2
F. Hu : J. Sun :X. Liang : S. Lucyszyn (*)Department of Electrical and Electronic Engineering and Centre for Terahertz Science and Engineering,Imperial College London, Exhibition Road, London SW7 2AZ, United Kingdome-mail: [email protected]
H. E. BrindleySpace and Atmospheric Physics Group, Department of Physics, Imperial College London, Exhibition Road,London SW7 2AZ, United Kingdom
X. LiangInstitute of Microelectronics of Chinese Academy of Sciences, 3 Beitucheng West Road, Chaoyang District,Beijing 100029, PR China

However, the authors previously demonstrated that the thermal infrared (IR) offers opportu-nities for developing secure communications within this largely unregulated part of theelectromagnetic spectrum. The ‘THz Torch’ concept, recently introduced by the authors,fundamentally exploits engineered blackbody radiation, by partitioning thermally-generatedspectral power into pre-defined frequency channels; the energy in each channel is thenindependently pulsed modulated to create a robust form of short-range secure communicationsin the far/mid infrared [1–7]. For example, an octave bandwidth (25-50 THz) single-channellink with a data rate of 760 bps was reported [3, 4]. Multi-channel ‘THz Torch’ systems wereintroduced with multiplexing schemes to increase the level of security, at the physical layer;first with frequency division multiplexing (FDM) [2, 4] and then very recently with frequency-hopping spread-spectrum (FHSS) [5]. Indeed, the resilience to both interception and jammingwith 2,560 bps FDM and 640 bps FHSS systems was demonstrated in [5]. Furthermore, theradiation mechanisms associated with the thermal transducer were analysed in [7].
There have been many short-range wireless communications systems operating at differentwavelengths. In the visible (390 < λ [nm] < 760) and near infrared (760 < λ [nm] < 2,500) ranges,light-emitting diodes (LEDs) have been widely used to establish wireless communications linksdue to the superior illumination efficiency, high modulation speed and low cost [8–11]. Wave-lengths from 780 to 950 nm are currently the best choice for infrared indoor wireless systems. Inthis range, low cost LEDs are readily available and this wavelength matches the peak responsivityof inexpensive silicon photodiodes [11]. The Infrared Data Association (IrDA) has established acomplete set of protocols for wireless infrared communications. For the Infrared Physical LayerSpecification (IrPHY), LEDs with wavelength of 850 to 900 nm are employed, having data ratesstarting from 2.4 kbps up to 1 Gbps (GigaIR). The transmission ranges are: 1 m for standardapplications, 0.2 m for low-power-to-low-power applications and several meters for GigaIR [12].The primary drawback of radiation in visible and near infrared (NIR) bands relates to eye safety; itcan pass through the human cornea and be focused by the lens onto the retina, where it canpotentially induce thermal damage [8]. The cornea is opaque to radiation at wavelengths beyondapproximately 1,400 nm, greatly reducing potential ocular hazards. Therefore, from a safetyperspective, it is believed that the infrared C-band (1,530-1,565 nm) may be better suited.Unfortunately, the photodiodes available for this range, which are made of Ge or InGaAs, havemuch higher costs and capacitances per unit area than silicon-based detectors [8]. Furthermore,NIR systems experience atmospheric absorption, scattering losses and scintillation effects [13],although it is not considered to be a hurdle for short-range communications.
By operating in the mid- or long-wavelength infrared (MWIR or LWIR) regions, enhancedlink and increased transmission range can be achieved, due to a lower susceptibility toatmospheric affects [14]. Although LEDs operating at MWIR have been demonstrated[15–17], the output power decreases at longer wavelengths, from W power levels in theNIR range to several μW at a wavelength of 4.6 μm [16]. On the other hand, the unit priceincreases, from tens of cents up to hundreds of dollars. These facts limit the real-worldapplications of LEDs at such wavelengths. Within MWIR and LWIR ranges, semiconductorlasers or nonlinear optical devices are generally preferred for free-space wireless communica-tions. The MWIR spectral band, defined from 3 to 5 μm, is considered to be eye-safe, with alow loss atmospheric window and have low thermal and solar background emissions [18]. Ashort-range wireless link using an interband cascade laser has been demonstrated, having a 70Mbps data rate and 1 m transmission range [19]. A long distance (i.e., >5 km) free-spacecommunications link has also been reported using an optical parametric oscillator device,showing the potential for realistic battlefield scenarios [18].
In the LWIR range, the 8 to 14 μm atmospheric transmission window is often employed forfree-space wireless communications, due to its superior penetration of atmospheric obscurants
J Infrared Milli Terahz Waves (2015) 36:474–495 475

such as fog, smoke and dust [20]. In the past, 10 μmCO2 lasers were deployed, in spite of theirlimitations of large size, high power consumption and inability to modulate at high speeds[21]. More recently, the emerging quantum cascade laser (QCL) technology has drawn broadattention for MWIR and LWIR applications, due to its compact size, be-spoke emissioncharacteristics and improved power efficiency [22–24]. However, these laser sources are stillconsidered luxury (non-ubiquitous) products on the domestic market, and only high-end users(e.g., scientific or military) can afford and/or physically accommodate.
Compared to wireless communications systems at other wavelengths, our thermodynamics-based system is inherently low cost and can be secure [5]. With the former, thermal sourcesand detectors are employed to establish the communications link, significantly decreasing thecost for the complete system. Furthermore, the output power level of the transmitter can becontrolled simply by changing the bias current. Although 800 nm systems based on LEDshave similar cost and complexity, they are not spectrally tunable and the output power fromLEDs has to be limited under a certain threshold, due to safety considerations. Our wirelesscommunications system has its shortest operating wavelength of >3 μm and can be consideredto be eye-safe. With the latter, it has been experimentally verified that in order to underminethe inherent immunity to interference and interception, both the jammer and intruding receiver,respectively, must be designed to have: (1) a significant amount of overlapping spectralchannel bandwidths; (2) similar modulation frequency; (3) line of sight detection and (4)synchronized hopping pattern (with FHSS) [5]. It should be noted that although such thermal-based sources offer many benefits (e.g., simplicity, ease of tuning and affordability), the maindrawback is that there is no signal coherency. Thus, only the intensity of the band-limitedoutput power can be controlled and detected. Moreover, due to the large thermal time constantsassociated with the sources and detectors, as well as issues associated with spreading loss, thiswireless communications link is expected to work at lower data rates and over a shorter range.
To assess the performance of this thermodynamics-based link, accurate signal and noisepower link budget analysis is required. In this paper, for the first time, we report on the detailedpower link budget analysis for the thermal infrared wireless communications system usingengineered blackbody radiation. Here, a generic 4-channel system, with a 640 bps data rate perchannel and a transmission range of 1 cm is investigated as a function of channel transmitterbias currents. The calculated output signal and noise voltages from each of the uncorrelatedchannel receivers are compared with measured values. Furthermore, the signal-to-noise ratios(SNRs) for each channel are measured, showing good agreement with calculated results.
2 System overview
The basic architecture for a single-channel ‘THz Torch’ link is shown in Fig. 1 [1–6]. With ourparticular setup, the transmitter consists of five miniature incandescent light bulbs connected inseries. The emitted output power is then filtered by an optical coating THz band-pass filter(BPF) and the band-limited thermal power is modulated using on-off keying (OOK) with polar
Fig. 1 Basic architecture for ultra-low cost on-off keying ‘THz Torch’ wireless link (reproduced from [5])
476 J Infrared Milli Terahz Waves (2015) 36:474–495

non-return-to-zero (NRZ) pulses. One of the key advantages of this technology is that poweramplification is not required, which would be technologically difficult and prohibitivelyexpensive to implement at terahertz frequencies. Instead, increasing the level of transmitpower can be as easy as increasing the bias current through the bulb array and/or increasingthe number or size of the bulbs. The received output power is first filtered (by a THz BPFidentical to that at the transmitter) and then detected; the pyroelectric infrared (PIR) sensorcreates an electrical signal that is amplified and digitized by the back-end electronics, whichcontains a baseband (BB) low noise amplifier (LNA), baseband BPF and Schmitt trigger.
The overall signal power link budget breaks down into three blocks (transmitter,free space channel and receiver), as shown in Fig. 2. Here, Ifilament is the radiantintensity of the tungsten filament; TG is the power transmittance of the bulb’s glass envelope;Iprimary and Isecondary are the radiant intensity from primary and secondary radiation mechanism,respectively; TTHz�BPF is the average power transmittance of the optical coating band-pass filter;
ITX is the total radiant intensity from the channel transmitter’s source; LFS is the free space channelloss; PRX is the peak-to-peak power incident on the sensor; RV is the voltage responsivity of thePIR sensor; u is the output RMS voltage from the detector; ABB�LNA is the voltage gain of thebaseband LNA; ABB�BPF is the voltage gain of the baseband BPF; and Vout is the output RMSvoltage at the channel receiver.
3 Transmitter output radiant intensity
The incandescent light bulb represents a convenient thermal IR blackbody source. Given that ithas an absolute temperature of T [K] and can be approximated as a blackbody radiator withemissivity ε(λ,T), its spectral radiance can be calculated using Planck's law
I λ; Tð Þ ¼ ε λ; Tð Þ⋅2hc2
λ5 ⋅1
e hc=λkBT−1W=m2=sr=m� � ð1Þ
where λ [m] is the wavelength in free space; h [J s] is the Planck constant; c [m/s] is the speedof light in vacuum; and kB [J/K] is the Boltzmann constant.
Similarly, the gas surrounding the filament can also be approximated as a blackbody,emitting at ambient temperature T0 [K]. Assuming the gas and the filament have the sametemperature and wavelength dependent emissivity the net radiance emanating from thefilament is given by
INET λ;Tð Þ ¼ ε λ;Tð Þ⋅ 2hc2
λ5 ⋅1
e hc=λkBT−1� 2hc2
λ5 ⋅1
e hc=λkBT0 −1
� �W=m2=sr=m� � ð2Þ
Fig. 2 Signal power link budget representation for the thermodynamics-based wireless link
J Infrared Milli Terahz Waves (2015) 36:474–495 477

Taking the effective radiating area into account and then integrating over the spectral bandof interest, the band-limited net output radiant intensity can be expressed as
I Tð Þ ¼ Aeff ⋅Z λ1
λ2
INET λ; Tð Þdλ W=sr½ � ð3Þ
where Aeff [m2] is the total effective radiating area of the radiator; λ1 and λ2 are the free space
wavelengths associated with the lower and upper frequency of interest, respectively.In our case, the output radiant intensity can include both primary radiation from the
tungsten filaments (in the spectral region dominated by high transmittance through the glassenvelope) and secondary radiation from the bulbs’ glass envelopes (in the spectral regiondominated by high absorption within the glass envelope), which are heated by their filaments.The radiant intensity from the primary radiation can be expressed as
Iprimary T filament
� � ¼ I filament T filament
� �W=sr½ � ð4Þ
with I filament T filament
� � ¼ Ae f f�filament⋅Z λ1
λ2
TG λð Þ⋅INET λ; Tfilament
� �dλ W=sr½ � ð5Þ
where Tfilament represents the working temperature for all identical filaments, Aeff_filament =Afilament/2 [m2] is the estimated total effective radiating area for five filaments, Afilament = 12.73mm2 for the five filaments [4], and TG(λ) is the power transmittance of the glass envelope inthermal equilibrium.
A material’s emissivity is normally defined as a function of both wavelength and temper-ature. However, to a good approximation for our application, the filament can be assumed tobe a ‘grey surface’, thus, removing its wavelength dependency. Measured data for the averageemissivity of tungsten, as a function of temperature, has been previously sourced from [25] andempirically fitted by the following [4]
εfilament T filament
� �≈1:343� 10−4⋅Tfilament K½ � � 2:019� 10−2 ð6Þ
Using measured data for the complex index of refraction [26], the power transmittance,reflectance and absorbance can be calculated using the methodology described in [27]. Fig. 3
Fig. 3 Calculated power transmittance, reflectance and absorbance for 350 μm thick window glass at 293 K
478 J Infrared Milli Terahz Waves (2015) 36:474–495

shows the calculated values against frequency for typical (soda lime silica) window glass at aroom temperature of 293 K. It can be seen that typical window glass can be considered opaquebelow ~60 THz. For most thermal infrared applications, this would only allow its use in itstransparent region between ca. 70 to 100 THz. Fortunately, for our ‘THz Torch’ applications,the high absorbance will provide a secondary source of blackbody radiation within the opaquespectral region of the glass.
The radiant intensity from the secondary radiation can be expressed as
I secondary Tglass
� � ¼ Ae f f�glass⋅Z λ1
λ2
INET λ; Tglass
� �dλ W=sr½ � ð7Þ
INET λ; Tglass
� � ¼ εglass λ; Tglass
� �⋅
2hc2
λ5 ⋅1
e hc=λkBTglass−1� 2hc2
λ5 ⋅1
e hc=λkBT 0−1
� �W=m2=sr=m� � ð8Þ
where Aeff_glass [m2] is the total effective radiating area for the glass envelopes and εglass(λ,
Tglass) is the emissivity of the glass envelope having an outer surface temperature Tglass. Here,we assume that εglass(λ,Tglass) does not change significantly as temperature increases from theambient room temperature of 293 K to the highest elevated temperature of 366 K; this is areasonable assumption, as stated in [25]. Furthermore, according to Kirchhoff's law of thermalradiation, emissivity is equal to the power absorbance when in thermodynamic equilibrium.Therefore, the absorbance shown in Fig. 3 can be used as the frequency-dependent emissivityof the glass envelope to give εglass(λ).
With our particular 5-bulb array configuration, the radiant intensity from secondary radia-tion can be further separated out into two parts: the central higher temperature region and itssurrounding lower temperature region. Therefore, (7) and (8) can be re-written as
I secondary Tglass
� � ¼ Iglass Thigh
� �þ Iglass T lowð Þ W=sr½ � ð9Þ
Iglass Thigh
� � ¼ Ae f f�glass�high⋅Z λ1
λ2
INET λ; Thigh
� �dλ W=sr½ � ð10Þ
Iglass T lowð Þ ¼ Aef f�glass�low⋅Z λ1
λ2
INET λ; Tlowð Þdλ W=sr½ � ð11Þ
where Thigh and Tlow are the average temperatures for the high and low temperature regions,respectively; Aeff_glass_high ≈ D2 (1− π/4) = 1.45 mm2 is the effective total radiating area of thehigher temperature region from within our five-bulb array; Aef f�glass�low ≈ 8π D=2ð Þ2 ¼ 42:47mm2 is the effective total radiating area of the lower temperature region; and D is the diameterof the bulb’s glass envelope (2.6 mm in our case) [4].
The calculated filament temperatures [4] and the measured glass envelope temperaturesover different regions within the source (using a FLIR E60 thermal imaging camera), are givenin Table 1, for different bias currents. Note that the average temperature of the glass envelope isonly slightly higher than the low temperature, since Ae f f�glass�high ≪ Ae f f�glass�low. By splitting
the radiant intensity from secondary radiation into two parts, the temperature distribution andoutput radiant intensity estimation can be described more accurately.
J Infrared Milli Terahz Waves (2015) 36:474–495 479

The overall total radiant intensity from the transmitter, with contributions from bothradiation mechanisms, can be expressed by
ITX Tð Þ ¼ Iprimary T filament
� �þ I secondary Tglass
� �� �⋅
ATHz�BPF
Ae f f�glass
!⋅TTHz�BPF W=sr½ � ð12Þ
where, ATHz�BPF ¼ 3:7� 4:7 mm2 is the aperture size for the THz BPF, Ae f f�glass ¼Ae f f�glass�high þ Ae f f�glass�low ≈ 43:92 mm2, giving an transmitter aperture efficiency ofATHz�BPF
Ae f f�glass≈ 40%:
Four 1 mm thick optical coating filters, sourced from Northumbria Optical Coatings Ltd.[28], are employed to define four non-overlapping frequency bands within the far/mid-infraredspectral range. The measured transmittances for each filter are given in Fig. 4, from 17 to 100THz, and Table 2 [28]. The calculated net spectral radiance from primary and secondaryradiation, at a bias current of 44 mA, is also shown in Fig. 4. It should be noted that when thetotal effective radiating areas of Ae f f�filament and Ae f f�glass are taken into account for the
filament and glass envelope, respectively, the resulting radiant intensities are of the same orderof magnitude from the two sources of radiation [7]. Furthermore, it is clearly shown that at abias current of 44 mA, Channel A, C and D are expected to have higher output radiated power,as the spectral radiance peaks locate within the pass bands of their respective filters at this biaspoint. On the other hand, Channel B is away from either radiation peaks, giving the lowestoutput radiated power of the four channels, as will be confirmed experimentally in Section 5.
Table 1 Temperatures for bulb filament and glass envelope regions [7]
Temperature (K) Source Bias Current (mA)
44 50 60 70 80
Calculated Tfilament 772 894 1042 1161 1262
Measured Thigh 312.3 318.9 331.8 346.9 366.1
Measured Tavgerage 306.3 310.6 319.9 330.9 344.9
Measured Tlow 306.0 310.4 319.4 330.4 344.2
Fig. 4 Measured transmittance for channel (A, B, C and D) filters from Northumbria Optical Coatings Ltd. [28]and calculated net spectral radiance from both primary and secondary radiation at a bias current of 44 mA [7]
480 J Infrared Milli Terahz Waves (2015) 36:474–495

4 Free space losses
Free space losses include both spreading losses and atmospheric attenuation. With the latter,clear conditions are assumed throughout. If one considers the transmitter to be a point sourceLambertian radiator, which radiates uniformly in all directions, the free space loss LFS can becalculated by applying Lambert’s cosine law to give
LFS ≈ TATMOSPHERIC ⋅AS
R2 ⋅cos θ sr½ � ð13Þ
where TATMOSPHERIC is the atmospheric power transmittance averaged across the channelbandwidth for a specific propagation distance (1 cm in our case); AS = 3 × 3 mm2 is the area ofthe detector’s sensing element;R = 13.8mm is the total transmission distance in free space betweenthe point source and detecting element of the PIR sensor (i.e., 1 cm distance between transmitterand receiver, plus the 2 mm space between the bulbs and the optical coating filter, plus the 1.8 mmdistance between the receiver’s optical coating filter and sensing element); θ is the angle betweenthe central line of sight and the offset from the surface normal of the detector (zero in our case).
For short-range communications, TATMOSPHERIC is expected to be unity. To confirm this,Line-By-Line Radiative Transfer Model (LBLRTM) simulation software is used. This is anaccurate, efficient and highly flexible model for calculating spectral transmittance and radi-ance, representing the best approach for calculating the atmospheric attenuation for each of thefour channels.
LBLRTM extracts absorption line parameters from the HITRAN line database [29], as wellas additional line parameters from other sources. It incorporates the water vapor continuumabsorption model, as well as continuum extinctions for carbon dioxide, oxygen, nitrogen andozone [30]. Since only generic atmospheric attenuation is being investigated in this section, ahorizontally homogeneous atmospheric profile based on the values given at sea-level for theUS Standard 1976 Model [31] is assumed, where temperature and atmospheric pressure are288.15 K and 101.325 kPa, respectively. The 1976 US Standard atmosphere was defined to berepresentative of annual average conditions experienced at mid-latitudes. Note that the effectsof atmospheric ionization from solar radiation is not an issue at the wavelengths considered.Furthermore, at the shorter wavelengths (≳75 THz, i.e., ≲4 μm) considered in this study, theinfluence of scattering from atmospheric aerosol (dust, smoke, etc.) might be expected toincrease and this process is not accounted for in LBLRTM. However, over the shortest pathsconsidered here, this effect should not be significant.
The calculated mean transmittance, as a function of the propagation distance from 1 mm to1 km, for our 4-channel ‘THz Torch’ system is given in Fig. 5(a). In addition, Fig. 5(b) to 5(d)show the simulated transmittances across the spectrum from 10 to 100 THz, with a resolution
Table 2 Measured channel power transmittance [28]
Channel 50% Cut-off Frequencies (THz)TTHz�BPF Average
Transmittance (%)f 1 ¼ c=λ1 f 2 ¼ c=λ2
A 15 (assumed) 34 ~79.6
B 42 57 ~84.2
C 60 72 ~75.7
D 75 89 ~72.2
J Infrared Milli Terahz Waves (2015) 36:474–495 481

of 300 MHz, for various distances. It can be confirmed that in principle, a single-channel ‘THzTorch’ wireless link operating in Channel D (75-89 THz) can operate up to a range of ~1 km;although in order to minimize the significant spreading losses, collimating lenses would beneeded at both the transmitter and receiver. In practice, a realistic transmission range of a fewmeters can be expected. The transmittances for all channels exceed 83%, with Channel A andD greater than 98%, which is acceptable and can be easily compensated for by increasing thesource bias current.
Conversely, Channel B (42-57 THz) has the worst atmospheric transmittance performance,due to the very high water absorption, limiting the effective range to approximately 1 m with theuse of collimating lenses. Between these extremes, Channel C (60-72 THz) is partially affected bycarbon dioxide, as is Channel A (15-34 THz) that also suffers from atmospheric absorption fromozone and water vapor over longer distances. It is interesting to note that banded-averageatmospheric transmittance does not follow any simple scaling law with distance. As a result,accurate signal power link budget calculations require the use of atmospheric attenuationmodeling software simulations to be performed for a specific bandwidth, time of day, precipita-tion, site locations (i.e., taking into account transmission path inhomogeneity), etc.. Nevertheless,for a range of only 1 cm, the simulated mean transmittances for each channel are given in Table 3.
(a) (b)
(c) (d)
Fig. 5 (a) Simulated mean transmittances for different transmission channels (A, B, C and D) againstpropagation distance, using LBLRTM with the U.S. Standard 1976 Model at sea level; and the transmittanceacross the spectrum from 10 to 100 THz for a distance of (b) 1 cm; (c) 1 m; and (d) 1 km
Table 3 Simulated mean transmittance for each channel (A, B, C, D)
Channel A: 15-34 (THz) B: 42-57 (THz) C: 60-72 (THz) D: 75-89 (THz)
TATMOSPHERIC (%) 99.98435 99.58088 99.79324 99.99992
TATMOSPHERIC (dB) -0.00068 -0.01824 -0.00899 -0.000003
482 J Infrared Milli Terahz Waves (2015) 36:474–495

5 Receiver output signal voltage
At the receiver, the incident power LFS ⋅ ITX Tð Þ passes through a THz BPF and the resultingreceived power PRX(T) at each PIR sensor can be estimated using the following
PRX Tð Þ ≈ TTHz�BPF ⋅ LFS ⋅ ITX Tð Þ W½ � ð14ÞSince mechanical optical choppers are employed, with our prototype hardware implemen-
tation, power is transmitted sinusoidally and, therefore, PRX(T) is representative of peak values.The LME-553 PIR sensor from InfraTec GmbH was chosen for its ability to detect incoherentband-limited power, having also an ultra-wide bandwidth, room temperature operation, beingultra-low cost and having a relatively fast response time (~1 ms) [32]. Its output RMS voltageu(T) is proportional to the incident radiation power PRX(T), representing a square-law detectoroperating in its linear region:
u Tð Þ ¼ RV ⋅PRX Tð Þ2ffiffiffi2
p V½ � ð15Þ
where RV V=W½ � is the voltage responsivity of the PIR detector. In our case, the LME-553 PIRsensor is made from lithium tantalate (LiTaO3), with an additional black absorption layer [32].Here, without any optical filtering, the maximum RMS voltage responsivity is quoted as 6,500V/W (centered at a 100 Hz chopping frequency) [32]. For a speed of 320 Hz, the roll-off valueof RMS voltage responsivity is approximately 90% of its maximum value, giving an estimatedresponsivity of 5,850 V/W.
Considering the voltage gains from the back-end electronics, the output RMS voltage canbe expressed as
Vout Tð Þ ¼ u Tð Þ⋅ABB�LNA⋅ABB�BPF V½ � ð16Þ
where ABB�LNA ¼ 99:4 and ABB�BPF ¼ 1:06 with our prototype demonstrator.
The calculated and measured output RMS voltages Vout(T) for each channel receiver areshown in Fig. 6(a) and 6(b), respectively, as a function of source bias current. When compared topredictions, it can be seen that there is good agreement in both trends and values. Note that onlymeasured RMS voltages up to ~2.83 Vwere recorded, as the detector saturates when the peak-to-peak voltage reaches ~8 V. As expected, the output signal voltage increases as the transmitter’ssource bias current increases. It was seen in Section 4 that there is negligible atmosphericattenuation with any of the channels over this short distance. However, from Fig. 6(a),it can be seen that Channel D exhibits the most significant voltage increase withbiasing current. The reason for this is that primary radiation dominates (due to the highpower transmittance and low power absorbance of the glass envelope), increasing from 80to 131 THz, and Channel D is the nearest to the spectral radiance peak, as seen in Fig. 6(c).
Similarly, Channel A benefits from the spectral radiance peak of the secondary radiationsource (due to the low power transmittance and high power absorbance of the glass envelope)increasing from 31.7 to 35.6 THz and from 32.3 to 37.9 THz for low and high temperatureregions, respectively. Furthermore, Channel B is the least responsive, because it is the furthestaway from any spectral radiance peaks and/or associated tails.
There are additional loss mechanisms that have not yet been taken into consideration. Forexample, the LiTaO3 pyroelectric material with black absorption layer does not have a flatabsorptive spectral response across the entire thermal infrared. As a result, the voltageresponsivity will be wavelength dependent, with a decreasing value below its cut-off frequency
J Infrared Milli Terahz Waves (2015) 36:474–495 483

of ~15 THz [33]. Also, in practice, the transmitter aperture efficiency of 40% does not take intoaccount diffraction effects or any significant mechanical misalignments. Finally, specular andmolecular reflections have not been included in the atmospheric attenuation calculations.These additional loss mechanisms require detailed numerical CAD modeling, which is beyondthe scope of this study. Nevertheless, a good agreement has been achieved between thepredicted and measured receiver output signal voltages, for all channels, using our end-to-end signal power link budget analysis.
6 Receiver output noise voltage
To determine the signal-to-noise ratio (SNR) performance of the ‘THz Torch’ communicationssystem, the noise analysis for each channel receiver must also be undertaken. The additiveintrinsic noise for each channel can be separated out into two sources: noise from the front-endsensor and noise from the back-end electronics. The block diagram for the complete channelreceiver is illustrated in Fig. 7(a). Within each channel receiver, a dual-sensor configuration isemployed, where two identical PIR sensors LME-553 are used; one is a dummy sensor that isopaque to the environment, to minimize unwanted microphonic effects caused by mechanical/acoustic vibrations incident to the pyroelectric material. The output from each PIR sensor willpass through the buffering stage and is then amplified and filtered, before it is thresholddetected by the Schmitt trigger (ST); the output of which is a polar NRZ signal. Intrinsic noisewill be generated at each stage, and combined with noise contributions from all previous
Fig. 6 Source bias current dependency: (a) calculated channel receiver output RMS voltages; (b) measuredchannel receiver output RMS voltages; and (c) calculated primary and secondary radiation spectral radiancepeaks
484 J Infrared Milli Terahz Waves (2015) 36:474–495

stages. The total noise of the channel receiver is evaluated at the output of the baseband BPF,as shown in Fig. 7(b). Note that without a THz BPF the intrinsic noise performance would notbe channel specific. Also, noise contribution from the ST is not included here as signal andnoise power are measured at the output of the baseband BPFs.
6.1 Pyroelectric infrared sensor noise sources
The pyroelectric sensor transduces not only the useful incident thermal power but alsoambient background noise power. Here, the received OOK-modulated thermal pulse isdetected by the resulting surface temperature differences, giving rise to surfacecharges (due to the pyroelectric effect), which in turn generates a short circuit current.This extremely low current, supplied by the high impedance of the pyroelectric material, isthen converted to the required output voltage by an integrated transimpedance amplifier (TIA)having a similarly high input impedance.
With our current mode TIA-based PIR sensor (LME-553) there are a number of intrinsicnoise sources, which include: temperature noise VNT, due to temperature fluctuation; dielectricnoise VND, due to the dielectric loss associated with the pyroelectric material; noise from theinput resistance VNR; noise from the large feedback resistor VNFB; current noise from the TIA’soperational amplifier (op-amp) VNI; and voltage noise from the op-amp VNU. Each of thesenoise contributions will now be considered in turn, for completeness, as there is no singlereference that covers all possible contributions.
6.1.1 Temperature noise VNT
When the sensing element is in thermal equilibrium with its surroundings, therewill be no output voltage. However, temperature fluctuation will cause a response
(a)
(b)
Fig. 7 Complete channel receiver: (a) detailed block diagram; and (b) noise contributions
J Infrared Milli Terahz Waves (2015) 36:474–495 485

from the sensing element, resulting in the following voltage-noise spectral density[34]
VNT ¼ RV
α
ffiffiffiffiffiffiffiffiffiffiffiffiffiffiffiffiffiffiffi4kBT2GT
pV=
ffiffiffiffiffiffiHz
ph ið17Þ
where α is the absorbance of the pyroelectric sensing element, which quantifieshow much incident thermal power will be absorbed by the material; GT ¼ HP
τTW=K½ �
is the thermal conductance of the pyroelectric sensing element; HP ¼ c0PdPAS J=K½ �
is the heat capacity; cP′ [Jm−3 K−1] is the volume-specific heat capacity; dP [m] is
the thickness of the pyroelectric sensing element; AS [m2] is the surface area of thepyroelectric sensing element; and τT [s] is the thermal time constant of the PIRdetector. For our current mode TIA-based PIR sensors, the voltage responsivity RV
is given by [34]
RV ¼ ωmαASpRFB
GT
1ffiffiffiffiffiffiffiffiffiffiffiffiffiffiffiffiffiffiffiffiffiffiffiffi1þ ωmτTð Þ2
q 1ffiffiffiffiffiffiffiffiffiffiffiffiffiffiffiffiffiffiffiffiffiffiffiffi1þ ωmτEð Þ2
q V=W½ � ð18Þ
where ωm ¼ 2π f m rad=s½ � is the angular frequency of the modulation signal; fm isthe modulation frequency; p [C m−2K−1] is the pyroelectric coefficient of the sens-ing element; RFB [Ω] is the feedback resistance of the integrated op-amp; τE =RFB ⋅CFB [s] is the electrical time constant for the integrated op-amp; and CFB [F] is thefeedback capacitance.
6.1.2 Dielectric noise VND
The pyroelectric sensing element acts as a dielectric, with an associated Johnson-Nyquistvoltage-noise spectral density expressed as [35]
VND ¼ RFB⋅
ffiffiffiffiffiffiffiffiffiffiffiffiffiffiffiffiffiffiffiffiffiffiffiffiffiffiffiffiffiffiffiffiffiffiffi4kBT ⋅ωmCP⋅tanδP
1þ ωmτEð Þ2s
V=ffiffiffiffiffiffiHz
ph ið19Þ
where CP ¼ ε0εrASdP
[F] is the electrical capacitance of the pyroelectric sensing element; ε0 F=m½ �and εr are the permittivity of free space and dielectric constant of the pyroelectric material,respectively; and tanδP is the dielectric loss tangent. It can be seen that this noise contribution ismodulation frequency dependent, and proportional to the electrical capacitance, as well as thefeedback resistance of the integrated op-amp. This noise contribution is more significant at highermodulation frequencies.
6.1.3 Input resistance noise VNR and feedback resistor noise VNFB
Both contributions are Johnson-Nyquist noise, generated by the thermal agitation of the chargecarriers within the large integrated op-amp feedback RFB [Ω] and input Rinput [Ω] resistors atthermal equilibrium. The respective voltage-noise spectral densities are given by [37]
VNR ¼ RFB⋅
ffiffiffiffiffiffiffiffiffiffiffiffiffiffiffiffiffiffiffiffiffiffiffiffiffiffiffiffiffiffiffiffiffiffiffiffiffiffiffiffi4kBT
Rinput⋅ 1þ ωmτEð Þ2h i
vuut V=ffiffiffiffiffiffiHz
ph ið20Þ
486 J Infrared Milli Terahz Waves (2015) 36:474–495

and
VN FB ¼ffiffiffiffiffiffiffiffiffiffiffiffiffiffiffiffiffiffiffiffiffiffiffiffiffi4kBT ⋅RFB
1þ ωmτEð Þ2s
V=ffiffiffiffiffiffiHz
ph ið21Þ
6.1.4 Op-amp current noise VNI
The integrated op-amp also generates noise from within the PIR detector. The voltage-noisespectral density introduced by the associated current noise can be expressed as [37]
VNI ¼ iopamp⋅RFBffiffiffiffiffiffiffiffiffiffiffiffiffiffiffiffiffiffiffiffiffiffiffiffi1þ ωmτEð Þ2
q V=ffiffiffiffiffiffiHz
ph ið22Þ
where iopamp A=ffiffiffiffiffiffiHz
p� �is the equivalent input current-noise spectral density.
6.1.5 Op-amp voltage noise VNU
The voltage-noise spectral density associated with VNU is due to the equivalent input noisevoltage of the integrated op-amp, which can be expressed as [37]
VNU ¼ uopamp⋅RFB
Req⋅
ffiffiffiffiffiffiffiffiffiffiffiffiffiffiffiffiffiffiffiffiffiffiffiffiffiffi1þ ωmτE 0ð Þ21þ ωmτEð Þ2
sV=
ffiffiffiffiffiffiHz
ph ið23Þ
where uopamp [V=ffiffiffiffiffiffiHz
p] is the equivalent input voltage-noise spectral density;
Req=Rinput ||RFB ||RP [Ω] is the equivalent resistance of the circuit; RP ¼ 1ωmCptanδP
Ω½ �is the equivalent resistance of the pyroelectric sensing element; τE 0 ¼ Req⋅Ceq [s] isthe electrical time constant of the equivalent circuit; Ceq=(CP+Cinput+CFB) [F] is theequivalent capacitance of the circuit; and Cinput [F] is the input capacitance of theintegrated op-amp.
6.1.6 Total voltage-noise spectral density VN-LME-553 for a single LME-553 detector
Fig. 8 shows the calculated voltage-noise spectral densities for each individual noise source forthe LME-553 PIR detector. An insert table of all associated parameters is also given. Note thatfor the parameters not specified in LME-553 datasheets, typical values for similar LiTaO3 typePIR detectors have been given (indicated by *).
From these calculations, it can be seen that VNFB dominates at lower modulationfrequencies, due to the large feedback resistor. At modulation frequencies above 200Hz, VNU dominates, because of the large equivalent input voltage-noise spectraldensity at the input of the op-amp. It is also shown that VND surpasses all but VNU
above 200 Hz. Noise from temperature fluctuation, input resistance and op-ampcurrent noise, are less significant.
The overall voltage-noise spectral density VN-LME-553 can be calculated from the summationof each individual noise source contribution:
VN−LME−553 ¼ffiffiffiffiffiffiffiffiffiffiffiffiffiffiffiffiffiffiffiffiffiffiffiffiffiffiffiffiffiffiffiffiffiffiffiffiffiffiffiffiffiffiffiffiffiffiffiffiffiffiffiffiffiffiffiffiffiffiffiffiffiffiffiffiffiffiffiffiffiffiffiffiffiffiffiffiffiffiffiffiffiffiffiV 2
NT þ V 2ND þ V 2
NR þ V 2N FB þ V 2
NI þ V 2NU
qV=
ffiffiffiffiffiffiHz
ph ið24Þ
J Infrared Milli Terahz Waves (2015) 36:474–495 487

Fig. 9 shows the calculated overall voltage-noise spectral density and the measured resultsgiven by the LME-553 datasheet [32]. It can be seen that there is excellent agreement at lowfrequencies; discrepancy above this frequency is mainly due to not having exact values for allparameters. For example, in order to obtain CP, which will significantly affect the value of Ceq
and τE ′, the thickness of the pyroelectric material dP had to be assumed to be a typical value of30 μm [38]. This will introduce inaccuracy in calculating VNU and VND, especially at highfrequencies where these noise sources dominate.
By integrating over the modulation bandwidth, assuming a 1 Ω reference load resistance,the total noise power for a single LME-553 PIR sensor can be calculated as
NLME−553 ¼Z f m2
f m1
V 2N−LME−553 d f m W½ � ð25Þ
where fm1 = 1 Hz and fm2 = 1 kHz are the lower and upper modulation frequency, respectively.The noise power is calculated to be 0.84 μW. Note that there are a number of additionalsources of unwanted signals at the PIR sensor (mostly associated with the environment), suchas atmospheric noise, fluctuations in ambient temperature, stray electromagnetic interferenceand microphonics. These extrinsic effects can only be modelled once specific ambientdeployment conditions are known and thus are not considered further here.
After identifying the intrinsic noise sources associated with the LME-553, its noiseequivalent power (NEP) and specific detectivity D* can be calculated, as shown in
Fig. 8 Calculated voltage-noise spectral density for the LME-553 detector and associated parameters
Fig. 9 Calculated and measured [32] overall voltage-noise spectral density for the LME-553 detector
488 J Infrared Milli Terahz Waves (2015) 36:474–495

Fig. 10(a) and 10(b), respectively. These results are also compared with associated measureddata [32]. It can be seen that the predicted and measured results have a good fit over threeorders of magnitude in the modulation frequency.
6.2 Back-end electronics noise sources
The back-end electronics is used to further amplify the output signal from the PIR sensor andalso filter-out unwanted noise from the PIR sensor. With our particular circuit, two identicalPIR sensors were used for noise reduction. The output from each detector passes through aunity gain buffer amplifier. The small-signal output voltage will be amplified by a commonlow-noise instrumentation amplifier (INA), having a designed voltage gain of 100. The signalfrom the output of the INA is then filtered by a 4th-order Sallen-Key Butterworth basebandBPF, having a designed center frequency of 320 Hz. Therefore, the noise from the back-endelectronics include: voltage and current noise from the external op-amps (OPA227) used inbuffer and filter stages; voltage and current noise from the instrumentation amplifier (INA163);and noise from all the resistors. It should be noted that burst and avalanche noise sourcesassociated with op-amps are too small to be considered further [40].
Noise analysis for the back-end electronics can be performed using an analog circuit-basedsimulation program. Resistors having resistance R are represented by Johnson-Nyquist noiseby default (having voltage-noise spectral density
ffiffiffiffiffiffiffiffiffiffiffiffiffiffi4kBTR
p). However, not all macros contain
correct noise information for op-amps and INAs. Therefore, the uncorrelated voltage andcurrent noise sources were added to the input of the op-amps and the INA. The current andvoltage noise sources have two different noise contributions: Johnson-Nyquist noise, whichhas a flat spectral density; and flicker noise, which dominates at low frequencies. Fig. 11(a)and 11(b) show the noise models for the OPA227 and the INA163, respectively. In the noisemodel, a current-controlled voltage source (CCVS) with a transresistance of 1 Ω is applied toconvert current-noise spectral density to voltage-noise spectral density. The simulated voltageand current noise spectral densities for OPA227 and INA163 are shown in Fig. 11(c).
Since the noise sources for each component have been modelled, the output voltage-noisespectral density for the back-end electronics can be calculated from
VN−BE ¼ffiffiffiffiffiffiffiffiffiffiffiffiffiffiffiffiffiffiffiffiffiffiffiffiffiffiffiffiffiffiffiffiffiffiffiffiffiffiffiffiffiffiffiffiffiffiffiffiffiffiffiffiffiffiffiffiffiffiffiffiffiffiffiffiffiffiffiffiffiffiffiffiffiffiffiffiffiffiffiffiffiffiffiffiffiffiffiffiffiffiffiffiffiffiffiffiffiffiffiffiffiffiffiffiffiffiffiffiffiffiffiffiffiffiffiffiVN−buffer⋅AINA⋅ABB�BPF
2þ VN−INA⋅ABB�BPF
2þ V 2
N−BPF
rV=
ffiffiffiffiffiffiHz
ph ið26Þ
where AINA is the voltage gain of the INA. The output noise power from the complete back-end
electronics NBE ¼ ∫ f m2f m1V 2
N−BE d f m is predicted to be 3.52 nW, over a modulation bandwidth
from 1 Hz to 1 kHz.
(a) (b)
Fig. 10 Calculated and measured [32] noise equivalent power and specific directivity for LME-553 detector
J Infrared Milli Terahz Waves (2015) 36:474–495 489

If noise from both LME-553 PIR detectors are considered uncorrelated, the overall voltage-noise spectral density for the complete channel receiver is expressed as
VN−receiver ¼ffiffiffiffiffiffiffiffiffiffiffiffiffiffiffiffiffiffiffiffiffiffiffiffiffiffiffiffiffiffiffiffiffiffiffiffiffiffiffiffiffiffiffiffiffiffiffiffiffiffiffiffiffi2V 2
N−LME−553−output þ V 2N−BE
qV=
ffiffiffiffiffiffiHz
ph ið27Þ
where VN�LME�553�output ¼ VN�LME�553⋅ABB�LNA⋅ABB�BPF represents the voltage-noise spec-
tral density contributed by a single LME-553 at the output of the back-end electronics;ABB�LNA ¼ Abuffer⋅AINA and Abuffer = 1 is the voltage gain of the buffer stage. The
calculated intrinsic noise power for the complete channel receiver is Nreceiver=6.52 mW, over amodulation bandwidth from 1 Hz to 1 kHz.
Fig. 12 shows the simulated voltage-noise spectral density for a single LME-553 PIRdetector and back-end noise sources for the channel receiver. As expected, the formerpredominantly dominates the channel receiver; while the latter can be ignored at all but verylow modulation frequency (where flicker noise dominates).
(a) (b)
(c)
Fig. 11 Back-end noise modeling: (a) model for the operational amplifier OPA277; (b) model for the low-noiseinstrumentation amplifier INA163; and (c) associated simulated voltage-noise spectral densities
490 J Infrared Milli Terahz Waves (2015) 36:474–495

6.3 Channel receiver noise measurements
The noise performance for each channel receiver is measured directly using a PicoScope 2205MSO digital oscilloscope. A noise floor at 65 μVRMS was first recorded by short-circuiting thehigh-impedance input of the oscilloscope. The duration of the measurements was 5 minutes foreach channel. Since RMS values of noise voltage can be measured directly, the correspondingtotal noise power can be calculated, as shown in Table 4, whereOpaque and Filter denote the PIRdetector having either a blocked aperture or filled with its assigned channel THz BPF, respec-tively.When comparedwith the calculated value ofNLME−553 = 0.84μW, themeasured values are2 to 3 times higher. This discrepancy is due to two main practical reasons: first, the calculatedvalues were obtained by integrating over a modulation bandwidth from 1 Hz to 1 kHz, while thenoise coupled into the PIR sensor is much wider. Second, in practice, the PIR sensor is exposed tobackground ambient conditions; extrinsic noise sources in situ are coupled into the detector, butare not included in the simulations. It should be noted that the calculations are based on valuesfrom the data sheet, which does not give information on measurement conditions.
When considering the output noise power from the complete channel receiver, there isgenerally good agreement; for Channels C and D their measured values are smaller than thepredicted value of Nreceiver = 6.52 mW. This is because there is no THz BPF applied in thesimulations (i.e. values are not channel dependent). When the channel THz BPFs are included,more of the extrinsic ambient background noise is filtered out as the channel frequency
Fig. 12 Voltage-noise spectral density for a single LME-553 detector and back-end noise source contributions tothe channel receiver
Table 4 Measured noise power for each PIR detector and channel receiver
Channel NLME−553 (μW) Nreceiver (mW)
Calculated Measured Calculated Measured
Opaque Filter
A 0.84 2.50 2.34 6.52 6.89
B 0.84 2.22 2.25 6.52 6.45
C 0.84 2.40 2.19 6.52 5.12
D 0.84 1.96 1.74 6.52 4.16
J Infrared Milli Terahz Waves (2015) 36:474–495 491

increases, leading to lower measured values when compared to those calculated. Also, thenoise sources from the two PIR detectors are considered to be totally uncorrelated in thecalculation, which may not be the case in practice.
6.4 Measured output signal-to-noise ratio (SNR)
Since both the signal and noise properties of this wireless communications system have beenmeasured, assuming a 1 Ω reference load resistance, the measured output SNR can becalculated as
SNRdB ¼ 10log10V 2
out
Nreceiver
� �dB½ � ð28Þ
To validate the results, measured end-to-end SNRs (which takes all previously recordedvalues of source bias current into account) are compared against calculated values, resulting inthe scatter plot shown in Fig. 13. In Fig. 13, SNR values were obtained by varying the sourcebias current from 44 to 80 mA and the transmission range from 1 to 3 cm, to obtain differentreceiver output signal voltages. In general, the measured SNR values agree well with thepredicted data. In low SNR conditions, the measured results tend to be higher than predicted.This is because the calculated noise power is higher than measured, for Channels B, C and D –resulting in lower calculated SNRs.
Fig. 14 shows the measured bit error rate (BER) against measured SNR. The measuredBER was obtained using the methodology described in [5], where an end-to-end binary datastream having 2×106 bits was used. When no bit errors were observed, actual BER values areconsidered to be smaller than 10-6 and, therefore, not shown. A simple empirical curve fit isalso shown in Fig. 14, given by
BER ≈ 0:5e− SNR=10ð Þ ð29Þ
It can be seen that (29), with our polar signaling, resembles the classical relationshipBER ¼ 0:5 e− Eb=N0ð Þ obtained for the optimum differential binary phase-shift keying(DBPSK) [41]. When compared to DBPSK, our existing hardware prototype demonstratorrequires much higher values of SNR for the same levels of BER. Therefore, Fig. 14 and (29)
Fig. 13 Measured SNR against calculated SNR performance for each channel receiver (A, B, C, D)
492 J Infrared Milli Terahz Waves (2015) 36:474–495
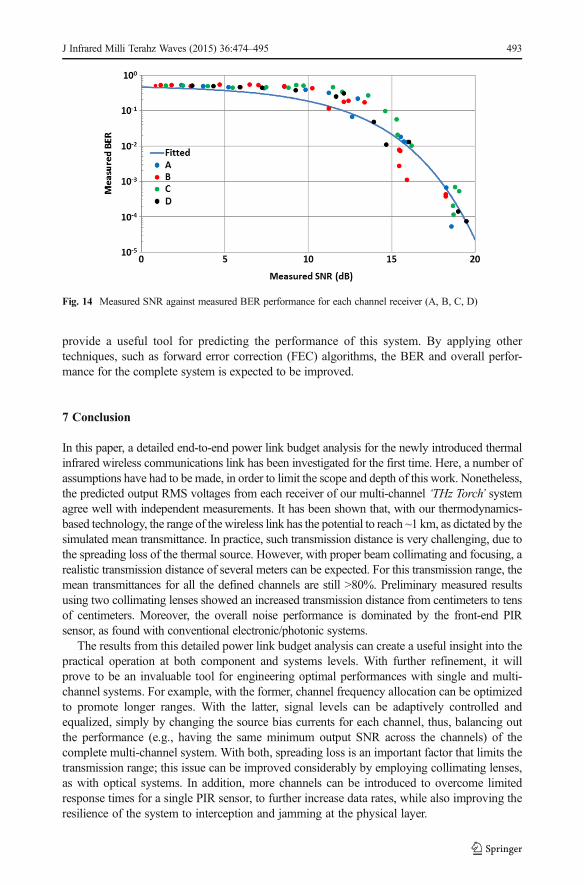
provide a useful tool for predicting the performance of this system. By applying othertechniques, such as forward error correction (FEC) algorithms, the BER and overall perfor-mance for the complete system is expected to be improved.
7 Conclusion
In this paper, a detailed end-to-end power link budget analysis for the newly introduced thermalinfrared wireless communications link has been investigated for the first time. Here, a number ofassumptions have had to be made, in order to limit the scope and depth of this work. Nonetheless,the predicted output RMS voltages from each receiver of our multi-channel ‘THz Torch’ systemagree well with independent measurements. It has been shown that, with our thermodynamics-based technology, the range of the wireless link has the potential to reach ~1 km, as dictated by thesimulated mean transmittance. In practice, such transmission distance is very challenging, due tothe spreading loss of the thermal source. However, with proper beam collimating and focusing, arealistic transmission distance of several meters can be expected. For this transmission range, themean transmittances for all the defined channels are still >80%. Preliminary measured resultsusing two collimating lenses showed an increased transmission distance from centimeters to tensof centimeters. Moreover, the overall noise performance is dominated by the front-end PIRsensor, as found with conventional electronic/photonic systems.
The results from this detailed power link budget analysis can create a useful insight into thepractical operation at both component and systems levels. With further refinement, it willprove to be an invaluable tool for engineering optimal performances with single and multi-channel systems. For example, with the former, channel frequency allocation can be optimizedto promote longer ranges. With the latter, signal levels can be adaptively controlled andequalized, simply by changing the source bias currents for each channel, thus, balancing outthe performance (e.g., having the same minimum output SNR across the channels) of thecomplete multi-channel system. With both, spreading loss is an important factor that limits thetransmission range; this issue can be improved considerably by employing collimating lenses,as with optical systems. In addition, more channels can be introduced to overcome limitedresponse times for a single PIR sensor, to further increase data rates, while also improving theresilience of the system to interception and jamming at the physical layer.
Fig. 14 Measured SNR against measured BER performance for each channel receiver (A, B, C, D)
J Infrared Milli Terahz Waves (2015) 36:474–495 493

Acknowledgements This work was partially supported by the China Scholarship Council (CSC).
Open Access This article is distributed under the terms of the Creative Commons Attribution License whichpermits any use, distribution, and reproduction in any medium, provided the original author(s) and the source arecredited.
References
1. S. Lucyszyn, H. Lu and F. Hu, “Ultra-low cost THz short-range wireless link”, in IEEE InternationalMicrowave Workshop Series on Millimeter Wave Integrated Technologies, Sitges, Spain, 49-52 (2011)
2. F. Hu and S. Lucyszyn, “Ultra-low cost ubiquitous THz security systems”, in Proc. of the 25th Asia-PacificMicrowave Conference (APMC2011), Melbourne, Australia, 60-62 (2011) (Invited)
3. F. Hu and S. Lucyszyn, “Improved ‘THz Torch’ technology for short-range wireless data transfer”, in IEEEInternational Wireless Symposium (IWS2013), Beijing, China, 1-4 (2013)
4. F. Hu and S. Lucyszyn, “Emerging thermal infrared ‘THz Torch’ technology for low-cost security anddefence applications”, Chapter 13, in “THz and Security Applications: Detectors, Sources and AssociatedElectronics for THz Applications”, NATO Science for Peace and Security Series B: Physics and Biophysics,ed. By C. Corsi and F. Sizov (Springer, Netherlands, 2014), 239-275
5. X. Liang, F. Hu, Y. Yan and S. Lucyszyn, “Secure thermal infrared communications using engineeredblackbody radiation”, Scientific Reports, Nature Publishing Group, vol. 4 (2014)
6. X. Liang, F. Hu, Y. Yan and S. Lucyszyn, “Link budget analysis for secure thermal infrared communicationsusing engineered blackbody radiation”, XXXI General Assembly and Scientific Symposium of theInternational Union of Radio Science (URSIGASS 2014), Beijing, China, (2014)
7. F. Hu and S. Lucyszyn, “Modelling miniature incandescent light bulbs for thermal infrared 'THz Torch'applications”, Journal of Infrared, Millimeter, and Terahertz Waves, Springer, doi:10.1007/s10762-014-0130-8 (2015) in press
8. J. M. Kahn and J. R. Barry, “Wireless infrared communications”, Proceedings of the IEEE, vol. 9219, no. 97,265-298 (1997)
9. T. Komine and M. Nakagawa, “Fundamental analysis for visible-light communication system using LEDlights”, IEEE Transactions on Consumer Electronics, vol. 50, no. 1, 100-107 (2004)
10. A. H. Azhar, T.-A. Tran and D. O. Brien, “A Gigabit/s indoor wireless transmission using MIMO-OFDMvisible-light communications”, IEEE Photonics Technology Letters, vol. 25, no. 2, 171-174 (2013)
11. H. Elgala, R. Mesleh and H. Haas, “Indoor optical wireless communication: Potential and state-of-the-art”,IEEE Communications Magazine, vol. 49, no. 9, 56-62 (2011)
12. J. B. Carruthers, “Wireless infrared communications”, Wiley Encyclopedia of Telecommunications, vol.2002, no. 1, 1-10 (2002)
13. J. Ma, L. Moeller and J. F. Federici, “Experimental comparison of terahertz and infrared signaling incontrolled atmospheric turbulence”, Journal of Infrared, Millimeter, and Terahertz Waves, doi: 10.1007/s10762-014-0121-9 (2014)
14. A. Hood, A. Evans and M. Razeghi, “Type-II Superlattices and Quantum Cascade Lasers for MWIR andLWIR Free-Space Communications”, in Proc. SPIE 6900, Quantum Sensing and Nanophotonic Devices V,doi:10.1117/12.776376 (2008)
15. E. J. Koerperick, D. T. Norton, J. T. Olesberg, B. V. Olson, J. P. Prineas and T. F. Boggess, “Wireless infraredcommunications”, IEEE Journal of Quantum Electronics,, vol. 47, no. 1, 50-54 (2011)
16. Microsensor Technology, “LED specifications”, 2013. [Online]. Available: http://ir.microsensortech.com/leds.htm
17. Boston Electronics Corporation, “Optically immersed 7.0 μm LED”, 2009. [Online]. Available: http://www.boselec.com/products/documents/IRSourcesWEBLED11-12-10.pdf
18. N. S. Prasad, “Optical Communications in the mid-wave IR spectral band”, in “Free-Space LaserCommunications: Principles and Advances”, Optical and Fiber Communications Reports, ed. By A. K.Majumdar and J. C. Ricklin (Springer, New York, 2008), 347-391
19. A. Soibel, M. W. Wright, W. H. Farr, S. A. Keo, C. J. Hill, R. Q. Yang and H. C. Liu, “Midinfrared interbandcascade laser for free space optical communication”, IEEE Photonics Technology Letters, vol. 22, no. 2, 121-123 (2010)
20. E. Leitgeb, T. Plank, M. S. Awan, P. Brandl, W. Popoola, Zabih Ghassemlooy, F. Ozek and M. Wittig,“Analysis and evaluation of optimum wavelengths for free-space optical transceivers”, in IEEE 12thInternational Conference on Transparent Optical Networks (ICTON), 1-7 (2010)
494 J Infrared Milli Terahz Waves (2015) 36:474–495

21. M. Achour, “Free-space optics wavelength selection: 10 μm versus shorter wavelengths”, Journal of OpticalNetworking, vol. 2, no. 6, 127-143 (2003)
22. Y. Yao, A. J. Hoffman and C. F. Gmachl, “Mid-infrared quantum cascade lasers”, Nature Photonics, vol. 6,432-439 (2012)
23. S. Blaser, D. Hofstetter, M. Beck and J. Faist, “Free-space optical data link using Peltier-cooled quantumcascade laser”, Electronics Letters, vol. 37, no. 12, 778-780 (2001)
24. A. Pavelchek, R. G. Trissel, J. Plante and S. Umbrasas, “Long-wave infrared (10-micron) free-space opticalcommunication system”, in Proc. SPIE 5160, Free-Space Laser Communication and Active LaserIllumination III, doi: 10.1117/12.5049406 (2004)
25. D. R. Lide (Ed.), CRC Handbook of Chemistry and Physics, CRC Press, 77th edn (1996)26. M. Rubin, “Optical properties of soda lime silica glasses”, Solar Energy Materials, vol. 12, no. 4, 275-288
(1985)27. S. Lucyszyn and Y. Zhou, “Characterising room temperature THz metal shielding using the engineering
approach”, PIER J., vol. 103, 17-31 (2010)28. Northumbria Optical Coatings Ltd., “Online catalogue”, 2006. [Online]. Available: http://www.noc-ltd.com/
catalogue29. S. A. Clough, M. W. Shephard, E. J. Mlawer, J. S. Delamere, M. J. Iacono, K. Cady-Pereira, S. Boukabara,
and P. D. Brown, “Atmospheric radiative transfer modeling: a summary of the AER codes”, Journal ofQuantitative Spectroscopy & Radiative Transfer, vol. 91, no. 2, 233-244 (2005)
30. M. W. Shephard, S. A. Clough, V. H. Payne, W. L. Smith, and S. Kireev, “Performance of the line-by-lineradiative transfer model (LBLRTM) for temperature and species retrievals: IASI case studies from JAIVEx”,Atmospheric Chemistry and Physics, vol. 9, no. 19, 7397-7417 (2009)
31. U.S. Committee on Extension to the Standard Atmosphere (COESA), “The U.S. Standard Atmosphere1976”, 1976. [Online]. Available: http://www.astrohandbook.com/ch09/standard_atmos_1976.pdf
32. InfraTec, “LME-553 datasheet”, 2012. [Online]. Available: http://www.infratec-infrared.com/Data/LME-553.pdf
33. Gentec Electro-Optics (Gentec-EO), “Absorption curves for THz-BL”, 2014. [Online]. Available: http://gentec-eo.com/Content/downloads/absorption-curves/Curves_THz_2014_V1.0.pdf
34. InfraTec, “Detector basics”, 2011. [Online]. Available: http://www.infratec.de/fileadmin/media/Sensorik/pdf/Appl_Notes/Application_Detector_Basics.pdf
35. S. T. Liu and D. Long, “Pyroelectric detectors and materials”, Proceedings of IEEE, vol. 66, no. 1, 14-26(1978)
36. R. W. Whatmore, “Pyroelectric devices and materials”, Reports on Progress in Physics, vol. 49, no. 12,1335-1386 (1986)
37. DIAS Infrared GmbH, “Pyroelectric infrared detectors”, 2006. [Online]. Available: http://www.dias-infrared.de/pdf/basics_eng.pdf
38. InfraTec, “Advanced features of InfraTec pyroelectric detectors”, 2012. [Online]. Available: http://www.infratec.eu/fileadmin/media/Sensorik/pdf/Appl_Notes/Application_Advanced_Features.pdf
39. InfraTec, “JFET and operation amplifier characteristics”, 2001. [Online]. Available: http://www.infratec.eu/fileadmin/media/Sensorik/pdf/Appl_Notes/Application_JFET.pdf
40. Texas Instruments, “Application report SLVA043B: noise analysis in operational amplifier circuits”, 2007.[Online]. Available: http://www.ti.com/lit/an/slva043b/slva043b.pdf
41. F. Xiong (Ed.), Digital Modulation Techniques, Artech House, Inc., 2nd edn (2006)
J Infrared Milli Terahz Waves (2015) 36:474–495 495