t3sd project solution
TRANSCRIPT

Project

NIIT Project 1.3
Speedster Motors Corp (SM Corp) is a pioneer and global leader in the field of automobile manufacturing since 1950. At present, the company has 1,13,000 employees across the globe. It has well-established manufacturing units in 10 countries. Its vehicles are sold in 10 countries.
The main focus of SM Corp. is to constantly improve their manufacturing processes for making quality products, generating growth, and ensuring a healthy working atmosphere for all the employees. The company’s Chief Executive Officer (CEO), John Thomas Edgar Jr., explains, “Quality management is our first priority”.
The company has well-established information systems for maintaining and monitoring its core and support business processes. All processes for manufacturing automobiles and its associated accessories are in line with the 8D Processes* used in the manufacturing industry.
The annual turnover of the company in the previous year was over $15 billion. The sales were boosted due to a strong economy in the operating countries. As a result, the company sold approximately 1.0 million cars globally, which was a 5 percent increase from previous year’s sales and second highest total sales in the company’s history.
The SM Corp. has global alliances with automobile-related industry giants. Some of the alliances include:
Mitzatchi Heavy Industries Ltd: This organization is one of the major suppliers of assembly line machinery required by SM Corp. for manufacturing automotives. Mitzatchi manufactures equipment such as vertical door assembly (assemblies), fully automatic spring making machines, CNC spring forming machinery, wire-straightening and cutting machines.
Infuji Motors Ltd. and Ho-Chan Motor Corp. of Japan: These organizations supply several customized components required for manufacturing cars by SM Corp. The components include lambo doors, oil coolers, grille series, vertical door kits and lambo style hinge kits.
Continental Heavy Industries Ltd: This organization supplies chassis control systems, electronic air suspension systems, and sensors to SM Corp.
Lambart Corporation: This organization supplies electronic components and hydraulic brakes to SM Corp.
JDMorgan Financial Services: This organization provides automotive and commercial financing along with a variety of mortgage and insurance products to the customers of SM Corp.
Speedster Motor Corporation
1.4 Project NIIT
Note
The 8D Process is a procedure defined by the automotive industry for problem related troubleshooting and the elimination of problems by suppliers.
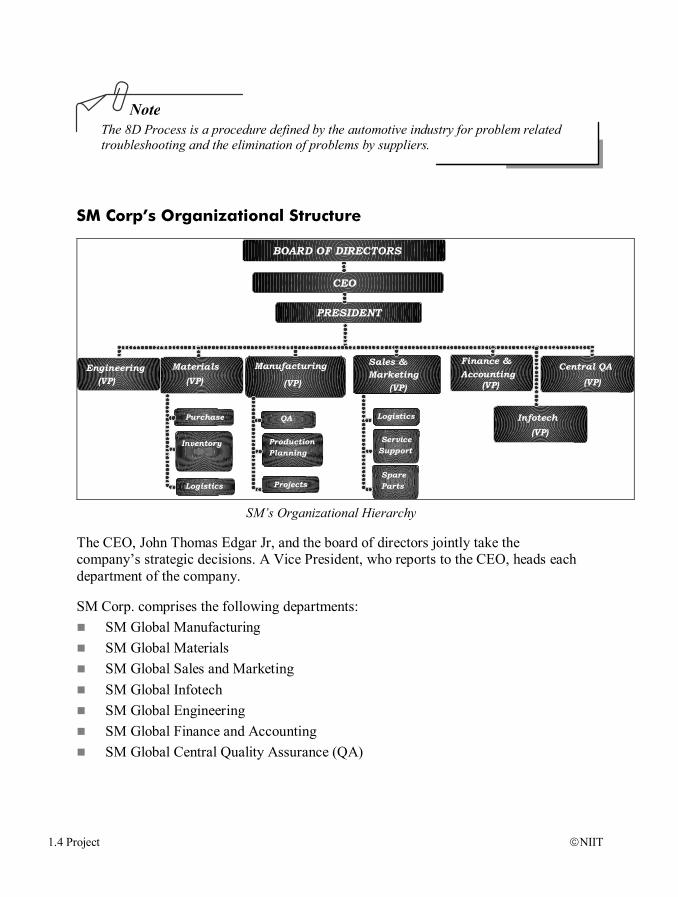
SM Corp’s Organizational Structure
Logistics Service Support
CEO
BOARD OF DIRECTORS
PRESIDENT
Materials Manufacturing Finance & Accounting Engineering
(VP) (VP) Central QA Sales &
Marketing
Purchase Inventory
Logistics
Production Planning
QA
Projects Spare Parts
(VP) (VP) (VP) (VP)
Infotech (VP)
SM’s Organizational Hierarchy
The CEO, John Thomas Edgar Jr, and the board of directors jointly take the company’s strategic decisions. A Vice President, who reports to the CEO, heads each department of the company.
SM Corp. comprises the following departments: SM Global Manufacturing SM Global Materials SM Global Sales and Marketing SM Global Infotech SM Global Engineering SM Global Finance and Accounting SM Global Central Quality Assurance (QA)

NIIT Project 1.5
SM Global Manufacturing Department
SM Global Manufacturing department manages and monitors all manufacturing units of the company. This department oversees the various operations required for manufacturing automobiles. In other words, the global department works in conjunction with the regional manufacturing units to systematically design, plan, organize, and control all these manufacturing operations to create quality products.
The regional manufacturing units manage their region’s manufacturing processes. Each unit uses approximately 50,000 components per day for its main products, cars, alone. These components include wheel speed sensors, brake hoses, electronic brake and safety systems, and automotive engine gaskets among others.
These components are put through astringent quality checking processes to ensure zero defects. Then, these components are assembled together to create the final product – an automobile.
SM Corp. manufactures cars to cater to different segments of the society. The spread includes luxury cars, convertibles, sports cars, and family cars. SM Corp.’s automotive brands include Humbridge™, Adela™, Alayna™, Charis™, Jorjia™, Neptune™, Juniper™, and Kelsey™. The company manufactures components and accessories that are sold under the name brand names SM™, SM Silvester™, and SM Ancillaries™.
SM Corp. has automated production management systems to enable them effectively manage their manufacturing processes. The management analyzes data generated from these systems to take effective business decisions that help in improve and monitor their manufacturing processes.
SM Global Materials Department
SM Corp is divided into four regions. The SM Global Materials department manages and monitors the material requirements and planning across all regions. The SM Global Materials department is the nucleus of a strong inventory control system. The department is further divided into Regional Materials Department (RMD) for each manufacturing unit.
The RMD plans work orders and purchase requisitions for all its manufacturing units and their associated storage warehouses. The RMD suggests appropriate rescheduling of the current material plan by taking into account lead-times for required components for an individual manufacturing unit falling within its territory.
The RMD also handles the inventory control processes for its manufacturing units. These processes calculate the amount of raw materials required to manufacture any

1.6 Project NIIT
specific product. Additionally, the RMD manages the reordering of materials and rescheduling of production orders for its manufacturing units.
The RMD provides macro-level manufacturing plans that determine how the products can be manufactured within predefined timelines. These plans are then sent to individual manufacturing units. Each unit translates this macro-level plan into a master production schedule.
Each manufacturing unit has an associated storage warehouse. This warehouse serves two purposes. One, it stores all the raw products that are needed by the manufacturing units to create their products. These products include both accessories and components. It is the warehouse that issues all the products required by its manufacturing unit.
The second purpose is to store the finished products that are sold to the retailers. These products include accessories and components that comprise the finished products. The warehouse also has to maintain inventory details about selling of items to the retailers because these products are part of the inventory being stored and managed by the warehouse.
All these inventory processes are managed by automated Inventory Management Systems (IMS) installed across all manufacturing units. Every RMD uses its IMS to review items listed on their master production schedules, calculate the quantity of all components and materials required to manufacture those items, and identify the supply of materials required for the scheduled production. This ensures that the inventory is used most effectively to enhance chain profitability.
The management uses data generated by IMS to identify strategies that can be used to improve and monitor all the inventory control processes.
SM Global Sales and Marketing Department
The SM Global Sales and Marketing department manages and monitors all the sales and marketing processes to ensure high profitability, increased market shares, and happy customers. The department is further divided into Regional Sales & Marketing Department (RSMD).
The RSMD is actively involved in improving, managing, and monitoring sales and marketing initiatives to promote the company’s automobiles. One such initiative is the sales analysis process.
Through sales analysis, the management seeks insights into strong and weak territories, high-volume and low-volume products, and the types of customers providing satisfactory and unsatisfactory sales volume. The sales analysis also uncovers details, such as buying preferences of their retailers, which otherwise lie

NIIT Project 1.7
unanalyzed in the sales records thereby alerting the management to provide opportunities for improving operations.
Another form of sales analysis performed at SM Corp is the demand forecast analysis. This forecast forms the basis for all strategic, tactical, and operational decisions in devising effective sales and marketing strategies. The forecasts are formulated depending on the situational obstacles and pressures. Devising accurate demand forecasts plays a significant role in their business as all their plans and budgets are frozen based on this sales planning.
The RSMD also analyzes data pertaining to the buying habits and trends of customers in its regions. The results help the RSMD derive a list of relevant marketing strategies. All RSMD’s have automated sales and marketing systems. These systems manage and monitor the detailed sales performance of the individual department to detect strengths and weaknesses of the current sales and marketing processes.
The management uses data generated by these systems to perform their sales analysis and demand forecasts to ensure high profits and an increased customer base.
SM Global InfoTech Department
The SM Global InfoTech department develops, manages, and maintains the information technology requirements within the company. This department is actively involved in producing innovative technologies that are incorporated into the automotives manufactured by SM Corp.
One such technological innovation is the SSecure™ a microchip designed to provide hands-free MyCaller feature to vehicle drivers. This feature enables vehicle drivers to receive and make telephone calls without removing their hands from the steering wheel or their eyes from the road. SSecure™ is available with Alayna™, Juniper™, Kelsey™, and Charis™ models.
The Infotech department of SM Corp. has created a new business sub-unit called eSM to bring the company's e-commerce and Internet marketing initiatives together. The mandate of eSM is to enhance and accelerate Internet-related and wireless communications-related activities and learning’s across the globe.
SM Corp. has manufacturing units established at different time periods and spread across 10 nations. To optimize various processes and maximize efficiencies at all manufacturing units, the management of SM Corp has implemented various Information Systems (IS).
SM Corp. - Management Information Systems
1.8 Project NIIT
During its initial years, SM Corp. used applications developed in dBase to store data for two of its storage warehouses that were associated with each manufacturing unit. The company, then, expanded this and used the same applications developed in dBase to store information about all their existing warehouses. The data from the year 1985 to 1994 was stored in dBase.
As the organization grew, the need to automate the manufacturing unit’s storage warehouses was inevitable. In the year 1995, the management decided to use applications developed in MS Access to cater to this growing need for faster data retrieval and efficient data storage. In addition, the data prior to 1995, which was stored in dBase, was migrated to MS Excel.
A few years later, the organizational needs required a database management system that could cater to storing and efficiently managing massive volumes of data. This led to SM Corp. implementing the MS SQL Server as its backend database management system for the manufacturing unit’s storage warehouses. This automation led to improved inventory control processes at these units.
This global nature of the MIS enabled each manufacturing unit and its associated departments to have their own supporting applications and technologies that create individual silos of data.
However, the existing MIS have the following shortcomings: Inability to obtain consolidated reports: Due to the varied nature of the existing
data management systems, (Excel, SQL, Access), individual MIS’s have created silos of information. Therefore, consolidation of data for report generation is difficult.
Inability to access reports in real-time: The management at the head office or the management at other locations cannot access the reports generated by the MIS of one manufacturing unit in real-time. This is because every unit is organized as separate business or functional unit that doesn’t communicate or share data with another. The management is unable to take effective and timely business decisions.
Unavailability of archived data for analysis: The company has over the years amassed huge volumes of data. This data is archived in offline mass storage devices such as magnetic tapes. Every year the company consolidates its data according to the Key Performance Indicators (KPI’s) to generate reports for profitability analysis. The management compares the current results with that of the previous years. Such analysis gives the management insight into the profitability of its existing processes. At times, the existing KPI’s used for calculating the profitability analysis report are different from the ones used in the past. This leads to problems in consolidation of previous reports with the existing ones. In such scenarios, the

NIIT Project 1.9
data used to calculate the previous years has to be restored from the offline storage devices. The task of restoring data involves:
Incurring infrastructure costs to install additional high-performance, high-speed, and high-capacity servers to store this data.
Identifying and extracting relevant data from these newly restored systems. Running complex algorithms on this data to generate reports as per the
current KPI’s. Such complex and time-consuming activities are required because of the inability of the existing IMS to provide the necessary historical data.
Non-scalability of existing systems: The existing MIS’s are not versatile enough to offer advanced database management features, such as XML support, Data Transformation Services (DTS), and data mining. The existing systems do not allow the management to make predictions about the future or to do trend pattern analysis.
Historically, the problem was how to obtain the data. The implementation of MIS has solved this problem. However, the problem now is how to filter and analyze the relevant data from the massive volumes of data generated by the MIS.
Scene 1: 15th January
Every year, the top managers of all the manufacturing units attend a high-level meet at the head office, New York. This meet is organized to provide a platform for all the managers to share their best practices. The top management of the company discusses new initiatives with their managers, assesses the performance of previous initiatives, announces the health statistics of the company, and honors the top performers of the year. This year the senior management has decided to focus on the Global Materials – Inventory department, the Global Sales and Marketing department, and the Global Materials – Purchase department.
Meeting 1: 15th January (for Case Study 1 – Inventory Management System (IMS))
Location: The New York Head Office – The Boardroom, SM Corp.
Attendees: The Board Members – SM Corp; CEO – SM Corp, John Edgar Jr.; Vice President – Global Materials (Inventory), Ron Barrows; CIO – Ralph McGuire
The Vice President, Ron Barrows introduces the initiative taken by the Inventory department. This initiative, he feel is very critical as it will help them analyze their chain profitability. This will also include analyzing the gross margin for every product
SM Corp. – Business Intelligence Systems
1.10 Project NIIT
at the end of every year, according to product, product-category, and product sub-category across all storage warehouses. The products include the finished components and accessories used for manufacturing cars. The management also wants to use the analysis results to compare the percentage growth of gross margin return on inventory for all existing storage warehouses.
For this, they want to compare the prices of the components used for manufacturing products, along with information such as whether these products are manufactured in-house or are obtained from vendors. This will help them assess the inventory management at every storage warehouse. With this information, the management would want to segregate profitable storage warehouses from the least profitable ones. This will help them optimize the inventory levels across all warehouses.
Optimizing inventory levels will reduce costs incurred due to inventory, such as inventory carrying costs, at every warehouse. As a conclusion to the initiation on this discussion, the management, then, takes the decision that it wants to analyze the chain profitability of the inventory management system.
However, they realize that such an analysis requires restoration of massive volumes of data from the archived sources onto online sources. This could prove to be expensive to the organization in terms of infrastructure such as hardware, CPU, memory, and servers and resources in terms of staff required for performing the various tasks associated with such processes. The CEO decides that he would meet the CIO, Ralph McGuire separately to discuss how this problem needs to be solved.
(The meeting concludes)
Meeting 2: 16th January (for Case Study 2 – Sales & Marketing Management System (SMMS))
Location: The New York Head Office – The Boardroom, SM Corp.
Attendees: The Board Members, CEO – John Edgar Jr.; Vice President – Global Sales and Marketing, Alan Flintoff; CIO – Ralph McGuire
The senior management of sales and marketing takes this opportunity to assess the performance of the sales initiatives undertaken in the previous year. These initiatives were taken to provide detailed reports regarding the sales of products across the globe for the past four years. These yearly sales reports were consolidated to provide the total sales in all product categories across all warehouses for those years. The management realizes that data provided by these reports is at a macro level. The micro level detailing, such as individual product sales per month per warehouse, is still unavailable.
This year, the senior sales management wants to take two additional initiatives. Firstly, they want a method that will enable them to view sales data at a micro level of

NIIT Project 1.11
detailing. As one of the board members puts it, “We have been viewing standard reports. Now we want to view the so called ad hoc reports.” The second initiative is to investigate the historical sales data to identify any persisting growth trends that might exist but have been overlooked.
At this point, the Vice President, Sales and Marketing, Alan Flintoff, elucidates on the first initiative. He says, “The standard reports available to us provide yearly sales figures pertaining to each category of products for each individual warehouse. What if I want to view a break up of these sales figures for each product year wise or month wise? What if I want to view the growth trend of my products year wise?”
Alan continues, “See, our product information is often stored across disparate locations and in inconsistent and often redundant ways. The data that I receive is mostly in spreadsheets formats. Then, if I have to discuss that report with the relevant manager, many a times it so happens that the reports have been updated or changed, and both of us end up with different version of the same report.
So, distribution of this latest report must be done by fax, or e-mail. This sheer volume of products that we develop, combined with the complexity of sourcing from our global locations is really mind-boggling. So, we need a method that can streamline product development and sourcing processes, so that our retailers can get products to market more quickly and cost efficiently.”
This leaves the first big question mark on how to obtain such reports for the current year, let alone analyzing data for the past years. The second question would be how to break-up the consolidated sales data.
After a quick round of brainstorming by the board members pertaining to the second initiative, a conclusion is derived. The members agree that by analyzing results of the investigation of their historical data, the regional managers will be better equipped to identify reasons why some products are performing better than the rest. This will also help managers assess the actual field sales versus designated targets, and provide valuable insights into the buying preferences of customers. The results will also help identify how sales of the not so popular products can be boosted.
As a conclusion to the initiation on this discussion, the management, then, takes the decision that they want to perform a growth trend analysis for their sales and marketing system. In addition, they need to have some way of viewing this data up to the level of detailing specified by Alan. The CEO decides that only after a discussion with the CIO will it be possible to determine whether such level of detailing for reporting purposes is technically feasible.
(The meeting concludes)

1.12 Project NIIT
Meeting 3: 17th January (for Case Study 3 – Vendor Management System (VMS))
Location: The New York Head Office – The Boardroom, SM Corp.
Attendees: The Board Members, CEO – John Edgar Jr.; Managing Director – Global Materials (Purchase), Mr. David Kilmer ; CIO – Ralph McGuire
This year, the Managing Director – Purchase, Materials, David Kilmer wants to review its business pertaining to the vendors. The management wants to analyze how reliable and profitable their vendors are. The management also wants to identify and analyze the costs associated with doing business with the vendors. The outcomes of such analysis will help the management identify methods of negotiating terms and conditions effectively with the vendors.
The senior purchase management wants to take the initiative of assessing vendor profitability and vendor reliability. They also want a method that will enable them to view vendor data from various aspects at micro level of detailing. As one of the board members puts it, “We have been viewing standard reports. Now we want to view the so called ad hoc reports.”
At this point, David elucidates on this initiative. He says, “The standard reports available to us provide vendor profitability in terms of the number of orders that were given to a particular vendor. This helped us identify which vendor obtained the highest orders. So, what we obtained from this analysis was the vendors who were gaining maximum profit by being associated with us.”
He further continues, “Now, we want to analyze the vendor profitability from our perspective. We would want to identify those vendors who gave us the best pricing for our raw materials. We would also want to view detailed information, such as the number of orders placed per year or the average lead times pertaining to any vendor. And I should be able to view this in real time and not wait for the standard reports given to me at the end of a quarter or a year.”
Another problem is the distribution of these reports. This sheer volume of products that we develop, combined with the complexity of sourcing from our global locations is really overwhelming. And at times, when I want to discuss some issues with the regional managers, I find both of us are referring to two versions of the same report. Because of this, I feel so old and outdated when these young guys come with the latest reports on their sleek laptops and I come with my humble outdated hardcopy of the same report.” (There is round of laughter. David waits for the laughter to die down before he continues.)
“See, it’s not about them having laptops and I feeling old (Smiles). But its about how can we streamline product acquisition and sourcing processes, so that we can obtain our raw materials at the best possible prices and within acceptable timeframes,” concludes David.
NIIT Project 1.13
As a conclusion to the initiation on this discussion, the management takes the decision to analyze vendor profitability and vendor reliability to cut down the costs associated with doing business with them. In addition, it is decided that they need to have some method of viewing this data in real time as suggested by David.
The CEO, John Edgar Jr. says, “I have decided two things. First, I don’t want my team to feel old (laughter) so this year the company will provide sleek laptops as a new year gift to all of you (Applause). Second, I will meet up with Ralph to discuss how you old people can be updated.” (More laughter)
(The meeting concludes)
Scene 2: 25th January
Location: The CEO’s Office – SM Corp.
Attendees: CEO – SM Corp, John Edgar Jr.; CIO – SM Corp., Ralph McGuire; Vice President – Global Materials ( Inventory), Ron Barrows; Vice President – Sales and Marketing, Alan Flintoff; Managing Director – Global Materials (Purchase), David Kilmer
After the separate meetings with Ron Barrows, Alan Flintoff, and David Kilmer, the CEO decides to meet them together. The agenda of the meeting is to identify how the initiatives taken in the boardroom meetings can be implemented.
Ralph McGuire, who has been a passive participant in these discussions, decides to bring in his perspective. Being a technocrat for the past 25 years, he has enough experience to assess such situations. The type of analysis the management of all three departments wants involves restoring terabytes of archived data onto online systems. This is a tedious and a time-consuming job. He also realizes that the management wants results within specific timeframes.
This could prove to be expensive to the organization in terms of infrastructure required, such as hardware, CPU, memory, and servers and resources in terms of staff required to perform the various tasks associated with such processes. In addition, such detailed level of analysis will require database management systems capable of performing complex aggregations within acceptable timeframes.
Ralph is well-versed with the problems faced while using multiple join queries spanning multiple tables and millions of rows in an OLTP environment. The time taken to provide results is directly proportional to the number of joins and tables used. Ralph knows that the top management commonly asks such ad hoc queries. Therefore, it is better to build a solution that can store information across business units in a consistent format, can handle massive volumes of historical data, and can query data stored across different business units of the company. In addition, the solution should
1.14 Project NIIT
provide a collaborative delivery platform to present the business information in real time.
Ralph presents these ideas to the management. The management feels that these are their exact requirements. Ralph explains to them the benefits of such a solution. This solution will enable them to view their existing data from different angles. The advantage that the managers can derive from such a solution is generating ad hoc reports according to their requirement on the fly. Moreover, this solution will enable to the managers to view and keep a track of business measures and KPIs on the unified self-explanatory interface, such as business dashboard. The business dashboards will enable the managers to ascertain the current status of the business measures and then, take quick business decisions.
Ralph suggests that the underlying technology used by systems providing such solutions also enables accurate trend forecasting and pattern analysis based on huge volumes of data spanning several years. This solution will help drive the entire business towards the required objectives. These objectives will increase the organizational efficacy, and enable the enterprise to understand the existing data and make better and faster decisions. Ralph informs them that BI solutions have been successfully implemented by some major organizations.
After hearing out Ralph, the management is keyed up to know how this BI solution can benefit their organization at the inventory level, at the sales and marketing level, and at the vendor management level. The solution will inevitably contribute towards broader organizational goals. As a result, the CEO wants Ralph to take this initiative and analyze whether this BI project is a solution to the individual departmental problems. Ralph decides to address this initiative with his internal team before taking a final call on whether a BI solution is required.
Scene 3: 5th February
Location: The CIO’s Office – SM Corp.
Attendees: CIO – SM Corp, Ralph McGuire; Business Development Manager – Bizzilence Consultants, Warren Ross
After the meeting with the top management, Ralph McGuire calls for a meeting with his senior team members. He briefs them on the minutes of meeting with the top management. He informs them that the management wants a feasibility analysis report on the implementation of this Business Intelligence Solution for their company.
Ralph knows that if the reports highlight the financial viability and benefits that this data warehouse project will provide, the management will sponsor the project. This is because the aftermath of the half-yearly meet has given Ralph the signal that there is some level of compelling business motivation underlying the need for such a project.

NIIT Project 1.15
Ralph understands the magnitude of this BI project that his company is planning to implement. He knows that his team will not be able to handle this project. This is because they do not have the pre–requisite knowledge, technical qualifications, or the resources to build such a solution.
For this, Ralph has proactively identified some consultant companies that have built successful BI solutions for major industry giants. Of these, Bizzilence Consultants are the most reliable and authentic. Ralph realizes that the credibility of Bizzilence will be very crucial in the data warehouse development life cycle. This is because the time and costs involved in the development and maintenance of the data warehouse will depend on the efficacy of Bizzilence.
In addition, the ability of the data warehouse to generate the requisite solutions will determine whether this project was a success or a failure. This is dependent on the ability of Bizzilence to understand the company’s business needs and translate them into a data warehouse solution.
The work on the project can begin only when the feasibility of the project has been determined. Ralph asks his secretary to send a mail to the General Manager - Sales and Marketing Division of Bizzilence Consultants, outlining the business need for their organization. The next day, Ralph receives a meeting request for the same. The meeting is scheduled after two days.
After two days, Warren Ross, Business Development Manager, Bizzilence Consultants, and two business development executives, arrive at Ralph’s office. Ralph McGuire and John T. Edgar represent SM Corp. This is the first meeting between the two parties.
The discussion starts with evaluating the readiness factors for the project and the need for a BI solution is highlighted. Initially, John who is not very conversant with the BI technologies is not very convinced. He asks Warren how this BI solution will help in cutting down the costs and increasing the profits of his company.
Warren responds by explaining how this solution will reduce costs and increase profits. First, his team will understand the key strategic business initiatives for the individual business processes. This will be accomplished by identifying key performance indicators (KPI’s) for the process. Next, they will simulate the business process outcomes if the solution is implemented in terms of financial data and the specified KPI’s. Finally, they will present the results that will indicate the level of impact of this solution on these metrics and will encompass the Return on Investment (ROI) aspect. This will enable to rapidly detect the business exceptions or failures, quickly formulate the exception handling strategy, effectively visualize the remote business operations, increase efficiency of business operations, and quickly respond to changes in market conditions and customer preferences.
1.16 Project NIIT
At this point, John is seemingly convinced and entrusts the responsibility of this entire project to Ralph. Warren and Ralph decide to meet again within a few weeks to discuss the further course of action.
Scene 4: 13th February
Location: Office of General Manager – Sales & Marketing, Bizzilence Consultants
Attendees: Business Development Manager, Warren Ross; Chief Technical Office (CTO), Ms. Hannah Bryan; Project Manager – Bizzilence, Judy Flintoff
Warren Ross wants to finalize the team that will be working on the SM Corp. Data Warehousing project. He meets the Chief Technical Officer, Hannah Bryan. Both discuss the project and decide upon an action plan. Hannah allocates this project to Judy Flintoff, who has been working with them for the past seven years. Her team comprises the following:
Florence Williams, the Business Systems Analyst Vijay Krishnan Menon, the Network Engineer Lara Morgan and Jeremiah Isaac, the Data Modelers Raymond Smith, the Data Warehouse administrator Bina McGreen, the Data Staging System Designer
The other team members are involved in developing and maintaining end user applications. Judy wants to meet the people at various management levels at SM Corp. She informs the CTO about her requirements. The CTO arranges a meeting with the CIO of SM Corp. and his team. Warren, their Business Development Manager of Bizzilence Consultants, accompanies Judy.
Scene 5: 19th February
Location: The New York Head Office – The Boardroom, SM Corp.
Attendees: CIO – SM Corp, Ralph McGuire; Project Manager – Bizzilence Consultants, Judy Flintoff; Business Project Lead – Inventory, Keith Philip; Business Project Lead – Sales and Marketing, George Webster; Business Project Lead – Purchase, Alec McForrester
The main agenda of the meeting is to define the project scope. For this purpose, Judy has some questions that she needs to ask. The CIO, Ralph McGuire, introduces Keith Philip, the Business Project Lead for Global Materials – Inventory, George Webster, the Business Project Lead for Global Sales and Marketing, and Alec McForrester, the Business Project Lead for Global Materials – Purchase. The CTO of Bizzilence Consultants joins them through video conferencing. After the initial introduction, the meeting starts.

NIIT Project 1.17
Judy: (to Ralph) “Good morning Ralph. I would take this opportunity to inform you and your team that the main agenda of this meeting is to plan our course of action for the next few weeks. For this, all of us will be working in collaboration.”
Ralph: “Good morning to all of you. I agree with Judy that we all will have to work really hard to ensure that this project works out well. At least, I am very excited about this.”
Judy: “So let’s start. Ralph, my first question is for you. I want to know whether you want a complete integrated data warehousing solution for all the business processes, such as inventory, sales and marketing, or purchase. Or do you want to focus on individual departments first, and then gradually create a complete integrated solution?”
Ralph: “Well, we would ideally want to implement this solution at the department level. Probably at a later stage we can think of the integrated solution you are talking about. After integration of data obtained from different departments, we may go for fetching the department wise data required for our business reports. Will that be a good choice?”
Judy: “It is a good choice Ralph. See, you have some advantages of using this approach. First, the time required to create such a solution will be less and the costs that will be associated with its creation will be lower than that of creating a data warehouse for your entire company. In addition, you will see results of this project in a shorter time span.”
Ralph: “It sounds pretty good to me. What do you say Keith?”
Keith: “Yes, it sounds good but I have a doubt. You are saying that we will create a smaller version of the data warehouse for our Material department first, and then you will create smaller warehouses for other departments. But how will you integrate information from these smaller subsets? Isn’t this also creating the same individual silos of information? Then, how is this solution different from our existing systems?”
Judy: “That is a very valid question Keith. In fact, I was expecting that. When we talk about building an individual subset of the entire data warehouse, we have a well-defined methodology for integration of these smaller subsets into a complete data warehouse. We will create this subset in a manner that it provides scope for integration. Therefore, all these separate systems will be able to share information. That is no issue at all.”
Keith: “Okay. You are the expert.”
Judy: “Now, I want to have a few specific questions regarding this project. Who all will want to use this system? I mean, who are the end users for this system?”

1.18 Project NIIT
Ralph: “Well, we have the top management who want to view the reports, we have our statisticians and analysts, who are the think tanks of our company, we have some middle level regional managers who want information specific to their area of work, we have operational managers who manage information about our daily operations and finally we have the database administrators and their team, who generate these reports for all of us.”
Judy: “It seems you have included the entire organization to view information from the data warehouse.”
Ralph: “But, we have some strictly confidential information that we do not want the middle or the junior management to view. Is it possible to restrict the viewing of this information?”
Judy: “Yes. We have various levels of permissions that we can assign to various levels of users. For example, you can partition the cube to restrict the user or you can create views to allow the user to view only part of the information. You can also restrict access to the reports created using the data warehouse. Therefore, security is integrated within the data warehouse.”
Ralph: “Okay.”
Judy: “Next question. How many users that you would access this system?”
George: “I think not more than 700 users initially. Right Alec?”
Alec: “Right.”
Judy: “So, you mean to say that 700 is the total number of users for all the three department-wise solutions that we will be creating?”
George: “No, this number of users per department. Every department has approximately 700 users.”
Judy: “Okay. Ralph, what is the time limit that you have specified for every individual project?”
Ralph: “Well Judy, we want you to complete this within 6 months. And, I mean the functional system.”
Judy: “Okay. So, if I understand you correctly, the time span for each individual departmental solution will be 6 months.”
Ralph: “Yes. Well, it’s almost lunch time. I think we can continue after lunch. Will that be fine with you and your team Judy?”
Judy: “Sure, no problem. Let’s go.”
NIIT Project 1.19
(The meeting is adjourned for lunch. After that all the attendees gather and the meeting continues. In the second half of the meeting, the DBA – Inventory, Anthony Wilikins, DBA – Sales and Marketing, Mike Redford, and DBA – Vendor Management System, Bryan Floyd joins them)
Judy: “That was refreshing. So, shall we continue?”
Ralph: “Sure. And Judy, let me introduce my technical team. This is DBA Inventory, Anthony Wilikins, DBA Sales and Marketing, Mike Redford, and DBA Vendor Management System, Bryan Floyd.”
Judy: “Good afternoon to all of you. We need your help regarding the hardware and software specific information.”
Anthony: “Sure. We’ll be glad to be of some help to you.”
Mike: “Same here.”
Bryan (simply smiles)
Judy: “Thanks. Let me introduce our network engineer, Vijay Krishnan Menon or Kris, as we all know him. Now, he will continue the discussion.”
Anthony, Mike, and Bryan (chorus): “Hi Kris.”
Kris: “Hello everyone. Well, now it is pretty clear to me that it is a data mart that we are looking at, right. Now, all that I say pertains to an individual data mart solution. So, I would like to take an idea on what type of servers are you looking for to support your BI solution?”
Ralph: “Well, it would be much better if you suggest the servers. You are the expert.”
Kris: (smiles) “Well Ralph, if you put it that way, I will be more than obliged to help. How many users do you want this system to support?”
Judy: “About 700 per data mart.”
Kris: “If 700 is the number you are looking at, what is the approximate size of your existing databases, both online and archived. I assume you want to restore everything.”
Anthony: “Well, the size will be well over a terabyte. Or even more, but nothing less than that. I think the same applies to both our Sales systems and Purchase departments, right. ”
Mike and Bryan nod in agreement.
1.20 Project NIIT
Kris: “Good. This is what I was expecting. My suggestion to you will be to use two Hewlett Packard ProLiant DL500 Class Servers for data warehouse. One of the servers will be used to create the warehouse and cubes every month. The second server will be the read-only server allowing the new data to be reprocessed without impacting the users. The ProLiant DL500s are 6-Core processor, Intel Xeon 7400 series servers with 16GB of standard RAM, and 256GB of maximum memory.
We also need to use Hewlett Packard LH4 class servers for the OLAP server. The LH4s include two processor with 500 MHz Pentium III Xeon Servers having 1 to 2 GB of RAM. The OLAP cubes can be built on the ProLiant DL500 and, then, restored to these smaller OLAP servers to free up the build server to process the next month’s data.”
Ralph: “What about the software? We are currently using Microsoft SQL Server 2000 to handle our data. Do we need to upgrade or change our database software to meet the data warehouse requirements?”
Kris: “Yes. It would be a good idea to use the Microsoft SQL Server 2008 software for providing the infrastructure for Data Warehousing solution and SAS Enterprise Intelligence Platform (EIP) – tools and services for developing and hosting the Business Intelligence solution. Microsoft SQL Server 2008 is an RDBMS that will help your organization manage any data, any place, and any time. It will enable you to store data from structured, semi-structured, and unstructured documents, such as images and rich media, directly within the database. SAS is the market leader in End-to-End Business Intelligence and Business Analytics solutions.”
Ralph: “I take your word for the technical appropriateness of this system. But, what about the cost of the system?”
Kris: “The approximate cost will vary ranging from $ 150,000 - $ 300,000. But, let me first tell you the features of this system. To begin with, it uses dual core processing technology. It can support four processors. So, it is scalable.
Then, it has good support for parallel processing. As a result, it utilizes the processing power of all the four processors. It supports parallel execution of tasks, such as creating indexes on very large tables or processing cubes scanning millions of rows and multiple dimensions.”
Bryan: “How does it enable me to create faster indexes?”
Kris: “See, the ProLiant DL500 server allows the creation of sub-indexes for each top level index. These sub-indexes are processed on separate processors. Because symmetric multiprocessing architecture is adopted by the ProLiant DL500, after all the sub-indexes have been processed, they are combined to generate a single index. On a
NIIT Project 1.21
SMP server, such as ProLiant DL500, the processing time is reduced by approximately 70 percent.”
Bryan: “That’s great. And what else can it do?”
Kris: “There’s a whole list. It also supports partitioned views to enable faster loads and query execution. This will increase the performance of the largest and most commonly used dimensions and facts. Then, it provides support for indexed views which will enable faster refresh of the data mart.”
George: “Well, that’s great. Anyway, all of us can do a bit of reading up on the ProLiant DL500 server.”
Kris: “What do you say Ralph?
Ralph: “Well, it sounds good to me too. But, I will have to justify the cost of the servers to our sponsor – our CEO.”
Kris: “Before that, let me tell you what other costs you will need to consider. I’ll just list them down for you:
The Operating System for the BI solution: Unix server (4 processors), Microsoft SQL Server 2008, and SAS EIP license is estimated between $150,000 and $300,000.
The number of developers/administrators for developing this application is estimated at five for the first year. Second year onwards the number of developers/administrators required to maintain the application are two.
The BI application developer and administrator cost for five individuals is estimated between $100,000 and $150,000 for the first year. The maintenance costs for the same year are approximately $150,000. The BI application developer and administrator cost for two individuals is estimated at $60,000 for successive years. The maintenance costs for each of these successive years comes to approximately $40,000. This total cost of $100,000 includes the costs of training the employees of the organization for using the BI solution, and the other costs involved for maintenance.
The software maintenance fee is 20% of the initial license fee per year for the BI application.
Well, this is still incomplete. To give a holistic view of the financial benefits that this solution will provide, we will need some information from you.”
Ralph: “What type of information do you require?”
Anthony: “Sorry to interrupt, but Kris you have only told us about the server costs. What about the other costs involved?”
1.22 Project NIIT
Kris: “Well, on a broad level, there are two types of costs involved. We have the initial costs and the recurring costs. The initial costs pertain to hardware, software, and the external consultancy costs. The recurring costs include the software maintenance costs and the resource costs incurred for this activity. I have provided you these broad costs. We will provide you with details about certain other financial costs involved in calculating the returns on investments very shortly, right Judy?”
Judy: “Yes, but to do that we would want some financial information from your enterprise.”
Ralph: “I think then you need to meet our finance personnel. They will give you all the information that is required.”
Judy: “That would be great. So, when can we meet them?”
Ralph: “I will try to fix up a meeting as soon as possible. I think that this has been a very informative session for all of us here. For any other support that you require Judy, feel free to contact any one of us.”
Judy: “Thanks a lot. I think it has been an equally informative session for all us here.”
(The meeting is concluded)
Scene 6: 22nd February
Location: The Chief Financial Office – Finance and Accounting, SM Corp.
Attendees: Deputy General Manager – Finance, Greg Inmon; Business Systems Analyst – Bizzilence, Florence Williams; Data Modeler – Bizzilence, Lara Morgan
By this time, it is very clear that SM Corp. wants a BI system in place. Now, it is time to dwell deep into the intricacies of how to present this feasibility analysis to the senior management. For this purpose, Judy asks Keith to arrange for a meeting with the appropriate financial officer. The perspective for this meeting will be to obtain data from the finance department pertinent to this project.
Florence: “Hi Greg. Thanks a lot for your time. This is Lara, an important member of my team.”
Greg: “It’s a pleasure, Florence. I hear your organization is building a data warehouse for us. Did I get the term right?”
Florence: “Yes, we sure are in the process of doing so. In fact, this is the main agenda for this meeting.”
Greg: “You mean that we will create a data warehouse here?”
NIIT Project 1.23
Florence (smiles): “Well, we need financial data to start the project. Therefore, in a way we are starting from here.”
Greg: “No problem. What type of information are you looking at?”
Lara: “We need some specific information. First, is your company financing this project in-house or are you obtaining capital from the market?”
Greg: “We are financing this project from outside.”
Lara: “Then, what is the borrowing rate you are looking for?”
Greg: “This rate will be about 8 percent.”
Lara: “Okay. What is the number of years you generally take while calculating returns on your investments?”
Greg: “You mean the time period for calculating the ROI for any investment?”
Lara: “Precisely.”
Greg: “That’s 3 years excluding the year that we initiated the project.”
Florence: “So, we should be looking at a figure of three for calculating the ROI for this project also.”
Greg: “Yes. That’s the norm in our company.”
Lara: “The second figure we are looking for is the costs that are incurred to maintain all your Inventory Management Systems (IMS), your Sales and Marketing Management Systems (SMMS), and your Vendor Management Systems (VMS) across the globe for the past year.”
Greg: “Do you mean the labor costs involved or the costs to maintain the systems or the other miscellaneous costs involved?”
Lara: “Actually, it is a culmination of all these costs. Something like an average of all these costs.”
Greg (opens a drawer and takes out a file and flips through some pages): “Let me see. Here it is. For the IMS, the exact figure is $550,000. For our SMMS, it is $560,000 and for our VMS it is $575,990. Actually, these are consolidated values. If you want the breakdown of this value, I can provide that too.”
Florence: “Well, we would request you to give us some document where this figure is reflected. Just for documentation purposes. Is it possible?”
Greg: “Sure. That wouldn’t be a problem.”
1.24 Project NIIT
Florence (to Lara): “Is there something else that you want to ask?”
Lara: “No, I think that is all.”
Florence (to Greg): “Thanks a lot for your precious time Greg.”
Greg: “I am glad I could be of help. Thanks.”
(The meeting is adjourned.)
After this meeting, Judy and her team gather all the relevant data and collect all the reports that are required for the meeting with the board of directors and the CEO of SM Corp. Judy presents these reports to the senior management. The CEO of SM Corp. is impressed with the figures presented in this meeting and decides to give the contract of creating the BI solution to Bizzilence Consultants.
Scene 7: 25th February
Location: Project Manager’s Office – Bizzilence Consultants
Attendees: Project Manager, Judy Flintoff; Business System Analyst, Florence Williams; Data Modeler, Jeremiah Isaac
Now, Judy and her team need specific information about the kinds of solutions the end-users of this system are looking for from this solution. For this, they need to meet two categories of people: the senior management who needs to view the reports and the people who actually create these reports.
Judy allocates the task of meeting the business managers of SM Corp. to Florence and Jeremiah. Florence has been working with Bizzilence for the past four years. Before that she was working as a senior business analyst with a leading manufacturing firm.
Jeremiah has been working with Bizzilence as a Systems Analyst for the past five years. This gives him the requisite technical knowledge to analyze what type of information the business managers are looking for as solutions to their problems.
Florence has made a list of people that she wants to meet for obtaining the relevant data. She has planned the meetings and provides the same to Jeremiah:
1st March: Global Materials – Inventory Vice President – Ron Barrows
4th March: Global Sales and Marketing Vice President – Alan Flintoff
7th March: Global Materials – Purchase Vice President – Alan Flintoff
9th March: Global Materials – Inventory

NIIT Project 1.25
Business Analyst – Joshua Philip DBA – Anthony Wilikins
13th March: Global Sales and Marketing Business Analyst – Darius Carter DBA – Mike Redford
17th March: Global Materials – Purchase Business Analyst – Nancy Barrymore DBA – Bryan Floyd
Meeting 1: 1st March (for Case Study 1 – IMS)
Location: The Vice President’s Office – Global Materials (Inventory), SM Corp.
Attendees: Vice President – Global Materials, Ron Barrows; Business Systems Analyst Bizzilence – Florence Williams; Data Modeler – Bizzilence, Jeremiah Isaac
Keith Philip, the business project lead, had provided various documents regarding the Materials department to Florence. Now, Florence and Jeremiah have come to meet the Vice President, Global Materials.
Florence: “Hi Ron. Thanks a lot for giving us your precious time. Just a few questions.”
Ron: “No problem, Florence. I know that you and your team are building systems for people like us who are not so conversant with technology. Am I right?”
Florence: “Right. Now let’s start. My first question to you is what are the success metrics against which you compare your department’s performance?”
Ron: “The major metric is our chain profitability. As we are in charge of managing all the supplies of various components from our vendors or our in-house manufacturing units, we have to maintain optimized inventory levels of these components within all our warehouses. You see these levels directly impact our chain profitability. As a result, we need to be really careful about what and how much do we stock it.”
Jeremiah: “What do you exactly mean by chain profitability?”
Ron: “Well, chain profitability, by definition, means the difference between the total cost incurred by us to maintain the entire chain and the revenue that is generated from our end customer. Our chain starts from our suppliers, encompasses our manufacturing process and its supporting processes, and finally ends at our end customers.
See, our chain needs to respond to the wide variation in demand, the changes in deadlines, and lead times. In addition, we have to manage all these wide variety of components that we stock in our warehouses.”
1.26 Project NIIT
Jeremiah: “So, you mean to say that you need to view reports that reflect the chain profitability?”
Ron: “Precisely.”
Florence: “And how do you decide, whether any part of this chain, for example a storage warehouse where you stock your inventory, is profitable?”
Ron: “Well, there is something called the Gross Margin Return On Inventory or GMROI (Gem-Roy). This is a numeric figure. The GMROI value will indicate the health of the storage warehouses of each manufacturing unit.
A high value of GMROI indicates our products are moving through the storage warehouses quickly and, therefore, the storage warehouse is profitable. On the other hand, a low value of GMROI indicates that the products are moving through the store slowly and, therefore, the storage warehouse is non-profitable.”
Jeremiah: “So, it is GMROI you are looking for?”
Ron: “Yes, as GMROI will also tell me how many gross margin dollars am I getting back (costs + profits) for each dollar I have invested in my inventory, consolidated across all my storage warehouses. This is the figure that I present to our CEO at the year end company meet.”
Florence: “So, it means that your CEO wants a list of the most profitable warehouses and the least profitable ones that year?”
Ron: “Yes, and mostly along with this, I need to present the results of the previous years also. This gives all of us, at the senior management level, an insight into what we have done right and what needs to be improved.”
Jeremiah: “And what levels of information are you looking for that should be provided by these reports?”
Ron: “Well, ideally I would want to do two things. The first would be limiting. Using limiting, I would want to view the total value of GMROI for all my storage warehouses for the past year and the current year to be displayed. It would be really great to view the percentage growth for the GMROI, if that’s possible. Then, I would want to view GMROI according to an individual region with the same benchmarks as above.”
Jeremiah (is documenting this conversation): “Well, with this solution in place, you will be able to do much more than that.”
Ron: “Really, how?”

NIIT Project 1.27
Jeremiah: “Until now, you were only able to view standard reports. With such reports, you had limited number of options in terms of how you want to view the information and what information you want to view. Data warehousing changes all this. It enables you to generate ad hoc reports. You can view the information according to your specifications and define the level of drilling down as per your requirements.”
Ron: “So, you are saying that I can view the GMROI for every individual country in the region and all the storage warehouses within the country?”
Jeremiah: “Even more than that. You can view the percentage growth of these storage warehouses by grouping them according to their surface area or the products that they store.”
Ron: “That would be good. This has triggered off another question. What if I want to view all products in any storage warehouse according to their inventory carrying costs and compare these values over a number of years? Again, would it be possible to view all this information graphically? I mean, sort of a pie chart that displays products according to their contribution to the total inventory carrying costs. This would surely help me optimize the ordering of such components and control my inventory. Is that also possible?”
Jeremiah: “Well, that might be possible. I cannot commit to you at this point in time. This is because as of now I have not seen your data sources or the type of reports that are generated.”
Ron: “That is okay. I will be waiting for this solution.”
Florence: “Well, at this point in time, I think this is all the information we need from you. In case we need more information, I hope you can spare some time for us?”
Ron: “No problem, Florence. Best of luck for the project.”
Florence and Jeremiah: “Thanks Ron.”
Meeting 2: 4th March (for Case Study 2 – SMMS)
Location: The Vice President’s Office – Sales and Marketing, SM Corp.
Attendees: Vice President – Global Sales and Marketing, Alan Flintoff; Business Systems Analyst – Bizzilence, Florence Williams; Data Modeler – Bizzilence, Jeremiah Isaac
Florence had asked George Webster, the business project lead, to provide some information regarding the various types of sales reports that are required by the top management. George has also provided some additional documents to Florence pertaining to their requirements. Now, Florence and Jeremiah have come to meet the Vice President, Global Sales and Marketing.
1.28 Project NIIT
Florence: “Good morning Alan. Thanks a lot for giving us your precious time. I just want to ask you a few questions and it shouldn’t take more than 45 minutes. I hope we are not bothering you”
Alan: “No, Florence. It’s all right. In the end, we will be the gainers right? I am happy that I could be of some help.”
Florence: “Thanks. So, let’s start. What are the success metrics against which you compare your department’s performance?”
Alan: “We have two metrics. The first is product growth trends and the second is the product profitability. As we are in charge of selling all the products to our retailers, we have to maintain optimized product inventory levels within all our warehouses. This helps us stock out products accordingly. You see these stock levels directly impact our product profitability. As a result, we need to be really careful about what and how much do we stock.”
Judy: “And why is that?”
Alan: “See, we need to decide what is the net profitability of each product or product category. We also want to know which products or product categories should you promote or stock more heavily. Again, we also have to see that the purchasing and distribution decisions are optimized across locations, suppliers and categories. So you see there are multiple things that we have to keep in mind.”
Jeremiah: “What do you exactly mean by product profitability?”
Alan: “Well, product profitability is a way of planning variable markups by determining the profitability of the individual products or product categories. It can be calculated by the adjusted per unit gross margin and assigning direct product costs to the item for expenses like distribution and selling.”
Jeremiah: “And what is product growth trends?”
Alan: “This is related to the concept of trending for all my products. Trending gives me more visibility into the net product profitability. This helps us make to make more profitable, fact based decisions on the products, new product introductions, or product promotions.”
Jeremiah: “So, you mean to say that you need to view reports that reflect the trending?”
Alan: “Precisely.”
Florence: “And how do you establish trends, and then identify whether a product or a product category is profitable?”
NIIT Project 1.29
Alan: “Well, this is where the growth trend analysis comes into the picture. This figure is calculated as a percentage. The growth trend analysis takes each product, product subcategory, or product category’s total performance over a given period. It then calculates a percent change versus the previous year. Finally, it trends those growth rates.
A positive growth trend indicates our products are fast moving and, therefore, are profitable. On the other hand, a negative growth trend indicates that the products are slow moving and, therefore are non-profitable.”
Jeremiah: “So, it is growth trend analysis that you are looking for?”
Alan: “Yes, as growth trend analysis will also tell me which are our top-selling products and the associated sales figures. This is the figure that I present to our CEO at the year end company meet.”
Florence: “So, it means that your CEO wants a list of the top selling products that have a shown a positive growth that year?”
Alan: “Yes, and mostly along with this, I need to present the results of the previous years also. This gives all of us, at the senior management level, an insight into what we have done right and what needs to be improved.”
Jeremiah: “Well, with this solution in place, you will be able to generate ad hoc reports, which I assume is your greatest concern.”
Alan: “Oh yes it is. You see, with the standard reports we are really tied down, so to say.”
Jeremiah: “What type of reports are you looking for?
Alan: “I would want to view a report such as the growth trends for every individual country in the region and all the storage warehouses within the country. In addition, I would want to view the real-time report of daily sales of our products in different stores. Will that be possible?”
Jeremiah: “Well, that might be possible. I cannot commit to you at this point in time. This is because as of now I have not seen your data sources or the type of reports that are generated.”
Alan: “Great! I will be looking forward to meeting you again.”
Florence and Jeremiah: “Thank you for you time. And it has been a great learning session for us Alan.”
Alan: “Thanks.”
1.30 Project NIIT
(The meeting is concluded)
Meeting 3: 7th March (for Case Study 3 – VMS)
Location: The Managing Director Office – Global Materials (Purchase), SM Corp.
Attendees: Managing Director – Global Materials (Purchase), David Kilmer; Business Systems Analyst – Bizzilence, Florence Williams; Data Modeler – Bizzilence, Jeremiah Isaac
Alec McForrester, the business project lead, had provided various documents regarding the Materials (Purchase) department to Florence. Now, Florence and Jeremiah have come to meet the Managing Director, David Kilmer.
Florence: “Hi David. It’s been a great session for both of us here. We have learnt so much about the various business processes, and believe me it is very complex.”
Jeremiah: “And we thought developing software was difficult and complex.”
David (smiles): “No problem, Florence and Jeremiah. I hope even today’s session is enjoyable.”
Florence: “Okay, let’s get started. Question number one, what is the success metrics against which you compare your department’s performance?”
David: “We have two metrics. The first is vendor profitability and the second is the vendor reliability. You see, we have to manage vendors located across the globe. These multiple vendors supply multiple products. This means one vendor can supply more than one product or many vendors can supply a single product.
Now, we have each manufacturing unit maintaining its inventory ordering and vendor details. Therefore, to maintain optimized inventory levels at these units, we have to do careful planning before we place fresh orders for various products.”
Jeremiah: “What do you exactly mean by vendor profitability and vendor reliability?”
David: “Well, vendor profitability is a way of identifying the vendors who are giving maximum discounts along with the best prices for the products being supplied by them.
By vendor reliability, I mean the vendors who have been delivering our orders on time and therefore within the specified lead times (Smiles). Now I know you will ask what lead-time is. Am I right?”
NIIT Project 1.31
Jeremiah (smiles): “Well, I know lead time is the time interval between the beginning of a project and the appearance of its results. In our software industry we usually talk in terms of projects.”
David: “In our manufacturing industry, lead time is the time interval between the date an order was placed and the date that order was delivered. Just like your software projects, we keep a track of our orders.
Let me elucidate on this. Suppose, we place an order with any vendor on a particular date, called the order date. We expect the vendor to deliver this order on another specified date called the delivery date. Now, we usually give a specified lead-time to the vendor for the delivery of this order.
In an ideal situation, the delivery date should be the order date plus the specified lead-time. In case the vendor delivers the order on the specified delivery date, it is good. But in case the vendor delivers the order after the lead-time has elapsed, the desired and actual delivery dates will vary. And that is not good.”
Jeremiah: “If I understand you correctly, you would want to do business with those vendors who deliver the orders on time. Therefore, the difference between their desired and actual delivery dates should be zero or should be minimum. And hence those vendors will be the most reliable. Did I get that right?”
David: “Precisely.”
Jeremiah: “Now, what do you mean by vendor profitability?”
David: “By vendor profitability, I mean those vendors who have been supplying the products at the lowest costs.”
Jeremiah: “How do you decide whether a vendor is profitable or not? Is it solely on the basis of the product cost prices or is there something else?”
David: “There is more to it than the eye can see. Suppose in a specified period, vendor A obtains 10 orders for a product and vendor B obtains 5 orders for the same product. To add to the complexity, vendor A gives a varying discount between 5– 10 percent in that time period. Vendor B also gives a fixed discount of say 7 percent during that time period. Now, how do we decide which vendor is more profitable?
For this, we will calculate the average total cost price for the product for both vendors A and B, across the same time period. On the basis of this average cost price for that product, we will select that vendor who provides the product with the lower value.”
Jeremiah: “Therefore, the vendor who has the lowest average cost price is more profitable and your company would want to do business with that vendor.”
1.32 Project NIIT
David: “There is a slight complexity here. To decide the vendors with whom we want to do business, we track both the metrics – vendor reliability and vendor profitability. The profitability aspect provides information about how a vendor is pricing the products. The reliability aspect provides information about whether that vendor is delivering the products on time. We would not want to do business with a vendor who has low prices but very high lead times, would we?”
Jeremiah: “Okay. So, you would want to view reports, which show both these metrics for all the vendors. This will help you make decisions pertaining to the vendors with whom you want to do business.”
David: “Exactly.”
Florence: “This is very interesting. David, is this analysis performed on the fly or does it happen at predefined time intervals, like a quarter, half yearly or year end?”
David: “We do this at the end of the year. It provides us information about what went right and what needs to be improved.”
Jeremiah (is busy documenting the conversation): “Well, with this solution in place, you will be able to do much more than that.”
David: “Really, how?”
Jeremiah: “Until now, you were only able to view standard reports. With such reports, you had limited number of options in terms of how you want to view the information and what information you want to view. You can drill down as per your requirements and generate ad hoc reports.”
David: “So, what you are saying is that I can view the vendor profitability for every individual product per vendor in every individual country in the region or all the storage warehouses within the country?”
Jeremiah: “Quite possible. In addition, you can view the indicators that will alert you about the lead time given by various vendors. You can identify the vendors how has or might miss the deadline for delivery.”
David: “That’s good news.”
Florence: “I hope you can spare some time for us if we require more information?”
David: “Sure, Florence. Best of luck.”
Florence and Jeremiah: “Thanks David.”
(The meeting ends here)

NIIT Project 1.33
Scene 8: 9th March
Jeremiah wants to meet Anthony Wilikins and Joshua Philip of the IMS to obtain the details of the reports that can be an important input while designing the data. After that he plans to meet Mike Redford and Darius Carter of the SMMS to identify types of reports they generate for their mangers. Finally, he will meet Nancy Barrymore and Bryan Floyd of the VMS to understand how they obtain the information from the existing systems and generate the reports required by their top management.
Meeting 1: 9th March (for Case Study 1 – IMS)
Location: The Business Analyst’s Office – SM Corp
Attendees: Data Modeler– Bizzilence, Jeremiah Isaac; Business Analyst – Inventory, Joshua Philip; DBA –IMS, Anthony Wilikins
Jeremiah is well prepared with his notepad and some sample documents provided by Judy.
Jeremiah: “Hi guys. Thanks for you time.”
Anthony and Joshua (in chorus): “No problem, Jeremiah.”
Jeremiah: “We need your help regarding some reports that we have to generate from this BI solution.”
Joshua: “Sure. How can we help?”
Jeremiah: “Well, yesterday Florence and I had a meeting with Ron. We wanted to know what type of reports he is looking for from this data warehouse. He told us that he wanted to view the chain profitability. He also told us that he measured this profitability by a numeric value called GMROI.”
Joshua: “Yes, GMROI is the one that we generally calculate and then present this summarized value to our top management.”
Jeremiah: “How is this GMROI calculated?”
Anthony: “GMROI is the product of the gross margin and the number of turns.”
Jeremiah: “Anthony, I do not understand this inventory specific language. Could you instead give me an example of some report you have generated, which is complex, yet is very important to the senior management?”
(Anthony looks at Joshua for the latest reports. Joshua opens a file and takes out three copies of a complex looking report. He passes one copy to both Anthony and Jeremiah.)
1.34 Project NIIT
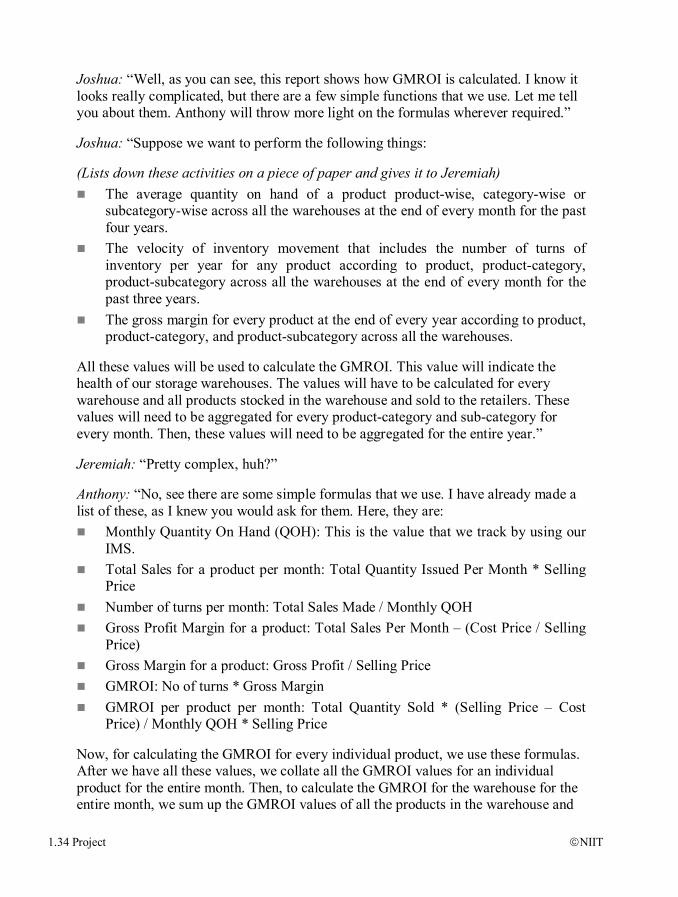
Joshua: “Well, as you can see, this report shows how GMROI is calculated. I know it looks really complicated, but there are a few simple functions that we use. Let me tell you about them. Anthony will throw more light on the formulas wherever required.”
Joshua: “Suppose we want to perform the following things:
(Lists down these activities on a piece of paper and gives it to Jeremiah) The average quantity on hand of a product product-wise, category-wise or
subcategory-wise across all the warehouses at the end of every month for the past four years.
The velocity of inventory movement that includes the number of turns of inventory per year for any product according to product, product-category, product-subcategory across all the warehouses at the end of every month for the past three years.
The gross margin for every product at the end of every year according to product, product-category, and product-subcategory across all the warehouses.
All these values will be used to calculate the GMROI. This value will indicate the health of our storage warehouses. The values will have to be calculated for every warehouse and all products stocked in the warehouse and sold to the retailers. These values will need to be aggregated for every product-category and sub-category for every month. Then, these values will need to be aggregated for the entire year.”
Jeremiah: “Pretty complex, huh?”
Anthony: “No, see there are some simple formulas that we use. I have already made a list of these, as I knew you would ask for them. Here, they are:
Monthly Quantity On Hand (QOH): This is the value that we track by using our IMS.
Total Sales for a product per month: Total Quantity Issued Per Month * Selling Price
Number of turns per month: Total Sales Made / Monthly QOH Gross Profit Margin for a product: Total Sales Per Month – (Cost Price / Selling
Price) Gross Margin for a product: Gross Profit / Selling Price GMROI: No of turns * Gross Margin GMROI per product per month: Total Quantity Sold * (Selling Price – Cost
Price) / Monthly QOH * Selling Price
Now, for calculating the GMROI for every individual product, we use these formulas. After we have all these values, we collate all the GMROI values for an individual product for the entire month. Then, to calculate the GMROI for the warehouse for the entire month, we sum up the GMROI values of all the products in the warehouse and
NIIT Project 1.35
compare this value against our standard GMROI chart. This will indicate whether the GMROI value for the warehouse is within acceptable range or not.
So, Jeremiah, I think this is all that you will need to calculate the GMROI.”
Anthony: “One important fact that you have to keep in mind while calculating the GMROI is that GMROI can only be calculated for those products, such as accessories or components that are being sold to our retailers world-wide. This will not include the products that we are supplying to our manufacturing units.”
Jeremiah: “So, you mean to say that we will only select those products that have an associated selling price as I deduce from the formulas you have listed above?”
Anthony: “Precisely. And this is what we do.”
Jeremiah: “At this point of time it will suffice. But Anthony, I would want to meet you once more for some other inputs. Would that be okay?
Anthony: “Yes. Anytime.”
(The meeting concludes here)
Meeting 2:13th March (for Case Study 2 – SMMS)
Location: The Business Analyst’s Office – SM Corp
Attendees: Data Modeler – Bizzilence, Jeremiah Isaac; Business Analyst – Sales and Marketing, Darius Carter; DBA – SMMS, George Webster
Jeremiah: “Hi Mike. Hi Darius.”
Mike and Darius (in chorus): “Hi Jeremiah. So what’s up with your data warehouse?”
Jeremiah: “Our data warehouse is doing fine. And I hope after meeting with you two, it will be even better.”
Darius: “Hope so. So, how can we be of help to you?”
Jeremiah: “Well, yesterday Florence and I had a meeting with Alan. We wanted to know what type of reports he wants from this solution. He said he wanted to view the growth trend reports.
Darius: “Yes, growth trends for all the products year-wise are what we generally calculate and then present this summarized value to our top management.”
Jeremiah: “How do you calculate this growth trend?”
1.36 Project NIIT
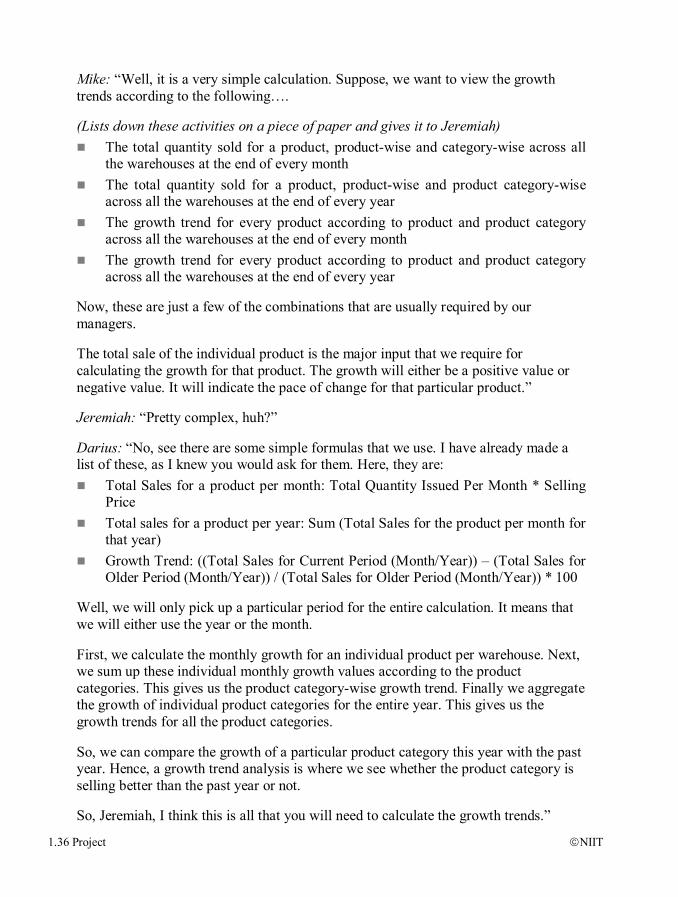
Mike: “Well, it is a very simple calculation. Suppose, we want to view the growth trends according to the following….
(Lists down these activities on a piece of paper and gives it to Jeremiah) The total quantity sold for a product, product-wise and category-wise across all
the warehouses at the end of every month The total quantity sold for a product, product-wise and product category-wise
across all the warehouses at the end of every year The growth trend for every product according to product and product category
across all the warehouses at the end of every month The growth trend for every product according to product and product category
across all the warehouses at the end of every year
Now, these are just a few of the combinations that are usually required by our managers.
The total sale of the individual product is the major input that we require for calculating the growth for that product. The growth will either be a positive value or negative value. It will indicate the pace of change for that particular product.”
Jeremiah: “Pretty complex, huh?”
Darius: “No, see there are some simple formulas that we use. I have already made a list of these, as I knew you would ask for them. Here, they are:
Total Sales for a product per month: Total Quantity Issued Per Month * Selling Price
Total sales for a product per year: Sum (Total Sales for the product per month for that year)
Growth Trend: ((Total Sales for Current Period (Month/Year)) – (Total Sales for Older Period (Month/Year)) / (Total Sales for Older Period (Month/Year)) * 100
Well, we will only pick up a particular period for the entire calculation. It means that we will either use the year or the month.
First, we calculate the monthly growth for an individual product per warehouse. Next, we sum up these individual monthly growth values according to the product categories. This gives us the product category-wise growth trend. Finally we aggregate the growth of individual product categories for the entire year. This gives us the growth trends for all the product categories.
So, we can compare the growth of a particular product category this year with the past year. Hence, a growth trend analysis is where we see whether the product category is selling better than the past year or not.
So, Jeremiah, I think this is all that you will need to calculate the growth trends.”
NIIT Project 1.37
Mike: “One important fact you have to keep in mind while calculating the growth trends is that it can only be calculated for those products, such as accessories or components, which are being sold to our retailers world-wide. This will not include the products that we are supplying to our manufacturing units.”
Jeremiah: “So you mean to say that we will only select those products that have an associated selling price as I deduce from the formulas you have listed above?”
Mike: “Precisely. And this is what we do.”
Jeremiah (checks his notes): “Well guys, that’s all the information that I’ll need.
Mike and Darius: “Right pal. Bye”
Jeremiah: “Bye.”
(The meeting concludes)
Meeting 3: 17th March (for Case Study 3 – VMS)
Location: The Business Analyst’s Office – SM Corp
Attendees: Data Modeler – Bizzilence- Jeremiah Isaac; Business Analyst – Purchase, Nancy Barrymore; DBA – VMS, Bryan Floyd
Jeremiah: “Hello everyone. Thanks for you time.”
Nancy and Bryan (in chorus): “No problem, Jeremiah.”
Jeremiah: “Both of you know that we are building a data warehouse.”
Nancy: “So, how can we help?”
Jeremiah: “Well, yesterday Florence and I had a meeting with David. We wanted to know what type of reports he is looking for from this data warehouse. He told us that he wanted to view the vendor profitability and vendor reliability.”
Bryan: “Yes, we generate these reports year-wise and then present this summarized value to our top management.”
Jeremiah: “Actually, we had a small learning session with David. He told us for vendor profitability, you calculate the average total cost price for the product supplied with any number of vendors across the same time period. The vendor who has the lowest average cost price is more profitable and your company would want to do business with that vendor.”
Bryan: “That’s very impressive.”

1.38 Project NIIT
Jeremiah: “Thanks. But all I know about vendor reliability is that a vendor who delivers an order on time is the most reliable.”
Bryan: “Well, you know the basics. Let me show you how it is actually done. First, we deal with vendor reliability.
Suppose, we want to see how reliable a vendor is, we will perform the following:
(Lists down these activities on a piece of paper and gives it to Jeremiah) The total discounted price for a product per vendor for all the warehouses at the
end of every year The average discounted price for a product per vendor for all the warehouses at
the end of every year (this is the final value that we use) The lead time for a product per vendor for all the warehouses at the end of every
year The average lead-time per product per vendor across for all the warehouses at the
end of each year
Now, these are just a few of the combinations that are usually required by our managers.”
Jeremiah: “So, how do we use this?”
Nancy: “I have already made a list as I knew you would ask for these formulas. Here, they are:
Total number of orders per product per vendor per year: Count (Number of orders placed)
Total Discounted Price per product per vendor per year: Sum (After Discount Total Price)
Total Quantity Received per product per vendor per year: Sum (Quantity Received per order)
Average Total Discounted Price per product per vendor per year: (Total Discounted Price ) / (Total number of orders)
Average Quantity Received per product per vendor per year: (Total Quantity Received) / (Total number of orders)
Average Discounted Cost Price per product per vendor per year: Total Discounted Price / Average Quantity Received
Lead-time per product per vendor: Values tracked in our VMS Total lead time per product per vendor per year: Sum (Lead-time per product per
order) Average lead-time per product per vendor per month: (Total lead time) / (Total
number of orders )

NIIT Project 1.39
For vendor profitability, we focus on the average discounted cost price. This value is available for all the vendors who have supplied the same product that year. The vendor with the lowest average discounted cost price for that product is the most profitable while the vendor with the highest value is the least profitable.
For vendor reliability, we focus on the average lead times. This value is available for all the vendors who have supplied products that year. The lower the average lead time, higher is the reliability of the vendor and higher the average lead time, lower is the vendor reliability.”
Jeremiah: “Well people, this is quite a bit of information that I have gathered here. I hope that we make good use of it”.
Nancy: “Sure you will.”
Jeremiah: “Thanks for you time. In case of any problem, I’ll revert back to you. Thanks again.”
(The meeting concludes)
Scene 9: 20th March
Location: The DBA’s Office – Global Materials (Inventory), SM Corp.
Attendees: Data Modeler – Bizzilence, Jeremiah Isaac; DBA (Inventory) – Anthony Wilikins; DBA (Sales and Marketing) – Mike Redford; DBA (Purchase) – Bryan Floyd
Jeremiah wants to meet all the above mentioned people to identify the type of data sources that they have been using for the past 10 – 15 years.
Jeremiah: “I have a few more questions pertaining to data sources and tools used for analysis. I wanted to meet all three of you.”
Anthony: “Please go ahead. We will try our best to provide you the solutions that you are looking for”
Jeremiah (smiles): “Thanks. My first question is, do you use any data analysis tool? If yes, have you encountered any problems with it?”
Anthony: “Not as such. We use MS Excel for creating reports. MS Excel provides us the necessary features to perform analysis.”
Jeremiah: “OK. So the complex reports that you had shown us were created in Excel?”
Anthony: “Exactly.”
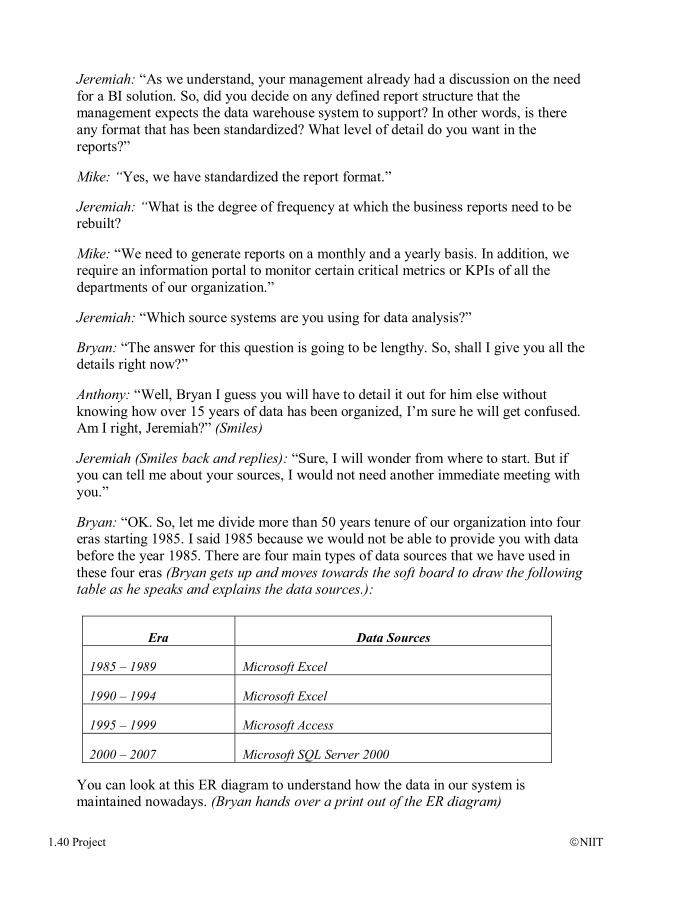
1.40 Project NIIT
Jeremiah: “As we understand, your management already had a discussion on the need for a BI solution. So, did you decide on any defined report structure that the management expects the data warehouse system to support? In other words, is there any format that has been standardized? What level of detail do you want in the reports?”
Mike: “Yes, we have standardized the report format.”
Jeremiah: “What is the degree of frequency at which the business reports need to be rebuilt?
Mike: “We need to generate reports on a monthly and a yearly basis. In addition, we require an information portal to monitor certain critical metrics or KPIs of all the departments of our organization.”
Jeremiah: “Which source systems are you using for data analysis?”
Bryan: “The answer for this question is going to be lengthy. So, shall I give you all the details right now?”
Anthony: “Well, Bryan I guess you will have to detail it out for him else without knowing how over 15 years of data has been organized, I’m sure he will get confused. Am I right, Jeremiah?” (Smiles)
Jeremiah (Smiles back and replies): “Sure, I will wonder from where to start. But if you can tell me about your sources, I would not need another immediate meeting with you.”
Bryan: “OK. So, let me divide more than 50 years tenure of our organization into four eras starting 1985. I said 1985 because we would not be able to provide you with data before the year 1985. There are four main types of data sources that we have used in these four eras (Bryan gets up and moves towards the soft board to draw the following table as he speaks and explains the data sources.):
Era Data Sources
1985 – 1989 Microsoft Excel
1990 – 1994 Microsoft Excel
1995 – 1999 Microsoft Access
2000 – 2007 Microsoft SQL Server 2000
You can look at this ER diagram to understand how the data in our system is maintained nowadays. (Bryan hands over a print out of the ER diagram)

NIIT Project 1.41
Jeremiah: “So, you mean to say that all your three systems, IMS, SMMS, and VMS have a consolidated ER diagram?”
Anthony: “Precisely. See, each manufacturing unit has the IMS, the SMMS, and the VMS combined, up and running. But, this merging is only at each individual manufacturing unit level, nowhere else.”
Jeremiah: “Okay. My next question is what is the size of the data sources pertaining to each system?”
Bryan: “We have amassed more than one terabyte of data. This includes both online data as well as offline data.”
Jeremiah: “Do you have any missing data?”
Bryan: “No. As per our current reporting needs, data provided by our existing systems is sufficient.”
Jeremiah: “Are there any type of inconsistencies in data?”
Bryan: “The newer systems that are using MS SQL 2000 as a backend have fewer issues but the older systems that include Access and Excel have inconsistencies in terms of the data structures and the format used for storing information.”
Jeremiah: “Is there enough data to address the business queries?”
Mike: “Yes. As Bryan has said, we have massive volumes of data that is both online and offline. It is well defined. But note that when I say well-defined, it could mean well-defined from the transactional perspective and not from your data warehouse perspective. I am not sure if it will suffice the data warehouse requirements.”
Jeremiah: Thanks a ton, Bryan, Anthony, and Mike. You have provided me with a lot of information in just one meeting. But, please excuse me. I might get back to you incase of any other queries. Thanks again.”
Bryan, Anthony, and Mike: “No problem, Jeremiah. Anytime.”
(The meeting ends here.)
Finally, after all this information has been gathered, Judy and her team dedicate themselves to this BI solution.
1.42 Project NIIT
This book contains three case studies. One case study will be allocated to the students in groups. The following are the inputs for project allocation, execution, and evaluation:
The project should be allocated to students in the second class room session of the third week of the semester. The students can start working on the project after completing chapter 7 of Modeling and Designing Data Warehouse module. Chapter 7 will be conducted in the first class room session of the fourth week of the semester. You may consult the milestone document to understand the session plan for each module of the semester and make the students start work on the project accordingly.
The project will be allocated to students in groups, each group consisting of three students. Group size can vary depending on the class strength.
There will be two levels of groups, the major groups and the minor groups. Each major group will comprise nine students and each minor group will
comprise three students. Allocate individual case studies to each minor group. After completing their individual data mart solutions, the minor groups will
reorganize to form the major group. They will combine their solutions to create a complete integrated data warehousing solution.
Group # <1>: Enterprise Data Warehouse Solution: Group A: Inventory Management System – three student per IMS Group B: Sales & Marketing Management System – three students per
SMMS Group C: Vendor Management System – three students per VMS
Once they have built the complete data warehouse solution, you will divide them into their existing minor groups and ask them to create their reports from this integrated data warehouse and not their individual data marts.
Students will have to plan and create the various data warehouse components for their case study separately.
During allocation, explain to the students the scope of the project by referring to the Project Activities and Project Timelines.
Explain the points mentioned in the Project Standards and Guidelines before students start project documentation.
Evaluate the students according to the guidelines given in the Project Evaluation Guidelines.
Project Execution
NIIT Project 1.43
The project will be carried out in the following phases: Plan data warehouse project Determine business requirements Plan data warehouse architecture Create logical design Create physical design Extract, transform, and load data Test and maintain data warehouse Create data marts for further analysis and reporting Perform required analysis Generate business reports
Students should perform the activities in each two-hour session as per the plan indicated under the heading Project Activities. They should mention the details and date of the activity in the project details. This will be the project schedule for each student. After every two hours, the instructor will validate each activity and sign for the activity.
The project is to be evaluated on the basis of the following parameters: Quality: Conformance to requirements of the case study (Data Marts) – 40 marks
The solution maps to the requirements specified in the case study. The logical design created is correct according to the requirements of the
case study. Timeliness – 10 marks
Timely completion of the project. Quality of documentation – 10 marks
Completion of all formats. Correctness of all formats.
Creating the correct enterprise warehouse solution – 20 marks Query handling during the project walkthrough – 20 marks
Phases in Project Execution
Project Evaluation Guidelines
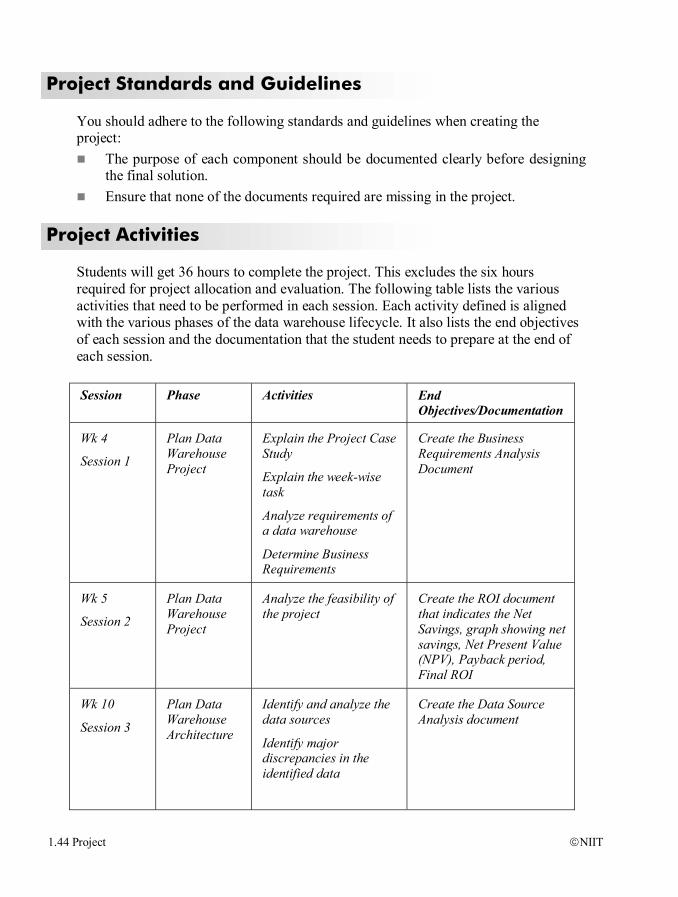
1.44 Project NIIT
You should adhere to the following standards and guidelines when creating the project:
The purpose of each component should be documented clearly before designing the final solution.
Ensure that none of the documents required are missing in the project.
Students will get 36 hours to complete the project. This excludes the six hours required for project allocation and evaluation. The following table lists the various activities that need to be performed in each session. Each activity defined is aligned with the various phases of the data warehouse lifecycle. It also lists the end objectives of each session and the documentation that the student needs to prepare at the end of each session.
Session Phase Activities End
Objectives/Documentation
Wk 4
Session 1
Plan Data Warehouse Project
Explain the Project Case Study
Explain the week-wise task
Analyze requirements of a data warehouse
Determine Business Requirements
Create the Business Requirements Analysis Document
Wk 5
Session 2
Plan Data Warehouse Project
Analyze the feasibility of the project
Create the ROI document that indicates the Net Savings, graph showing net savings, Net Present Value (NPV), Payback period, Final ROI
Wk 10
Session 3
Plan Data Warehouse Architecture
Identify and analyze the data sources
Identify major discrepancies in the identified data
Create the Data Source Analysis document
Project Standards and Guidelines
Project Activities
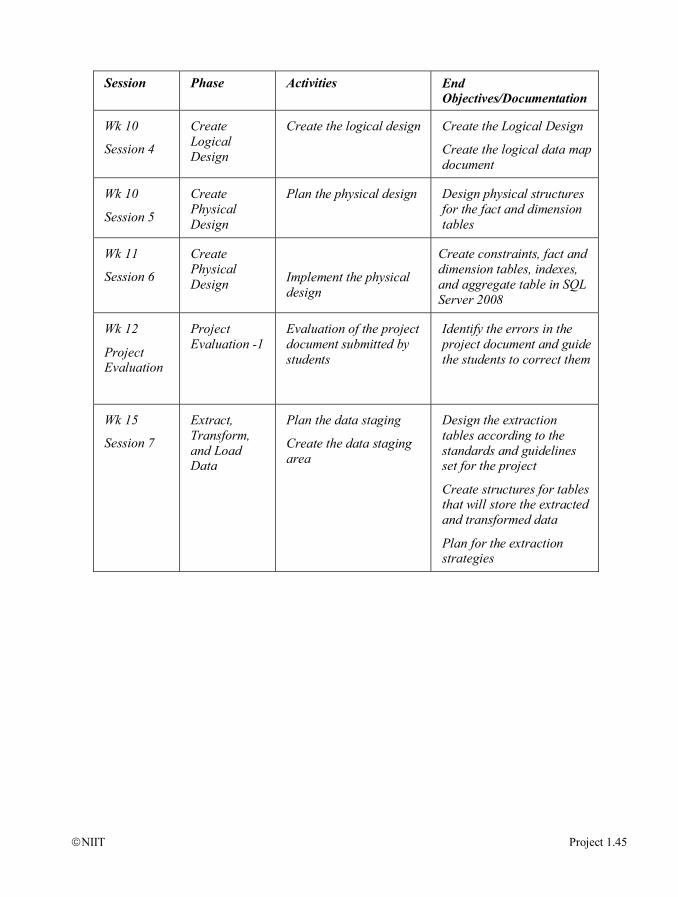
NIIT Project 1.45
Session Phase Activities End Objectives/Documentation
Wk 10
Session 4
Create Logical Design
Create the logical design Create the Logical Design
Create the logical data map document
Wk 10
Session 5
Create Physical Design
Plan the physical design Design physical structures for the fact and dimension tables
Wk 11
Session 6
Create Physical Design
Implement the physical design
Create constraints, fact and dimension tables, indexes, and aggregate table in SQL Server 2008
Wk 12
Project Evaluation
Project Evaluation -1
Evaluation of the project document submitted by students
Identify the errors in the project document and guide the students to correct them
Wk 15
Session 7
Extract, Transform, and Load Data
Plan the data staging
Create the data staging area
Design the extraction tables according to the standards and guidelines set for the project
Create structures for tables that will store the extracted and transformed data
Plan for the extraction strategies
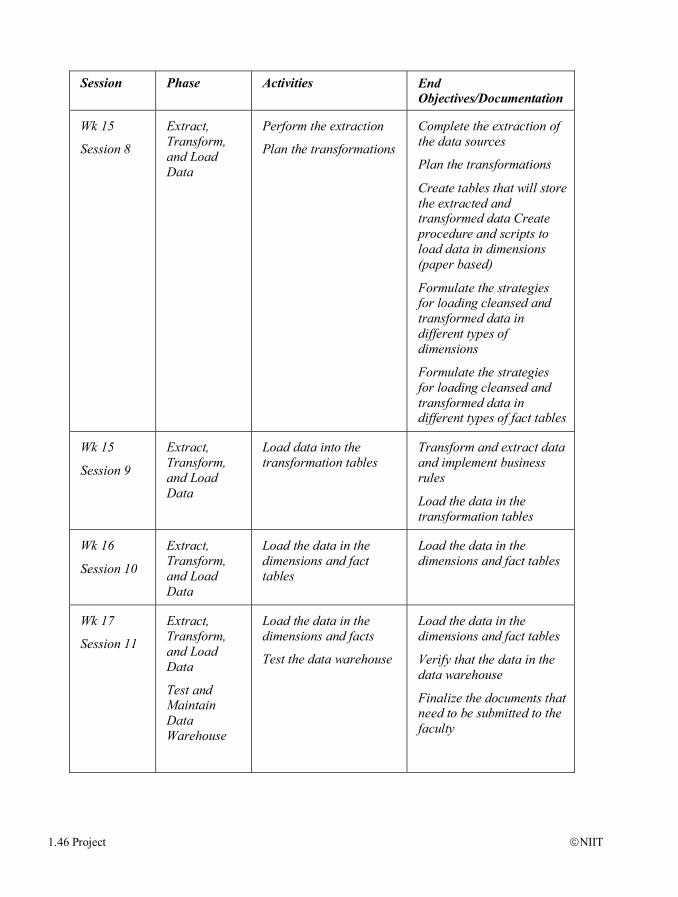
1.46 Project NIIT
Session Phase Activities End Objectives/Documentation
Wk 15
Session 8
Extract, Transform, and Load Data
Perform the extraction
Plan the transformations
Complete the extraction of the data sources
Plan the transformations
Create tables that will store the extracted and transformed data Create procedure and scripts to load data in dimensions (paper based)
Formulate the strategies for loading cleansed and transformed data in different types of dimensions
Formulate the strategies for loading cleansed and transformed data in different types of fact tables
Wk 15
Session 9
Extract, Transform, and Load Data
Load data into the transformation tables
Transform and extract data and implement business rules
Load the data in the transformation tables
Wk 16
Session 10
Extract, Transform, and Load Data
Load the data in the dimensions and fact tables
Load the data in the dimensions and fact tables
Wk 17
Session 11
Extract, Transform, and Load Data
Test and Maintain Data Warehouse
Load the data in the dimensions and facts
Test the data warehouse
Load the data in the dimensions and fact tables
Verify that the data in the data warehouse
Finalize the documents that need to be submitted to the faculty
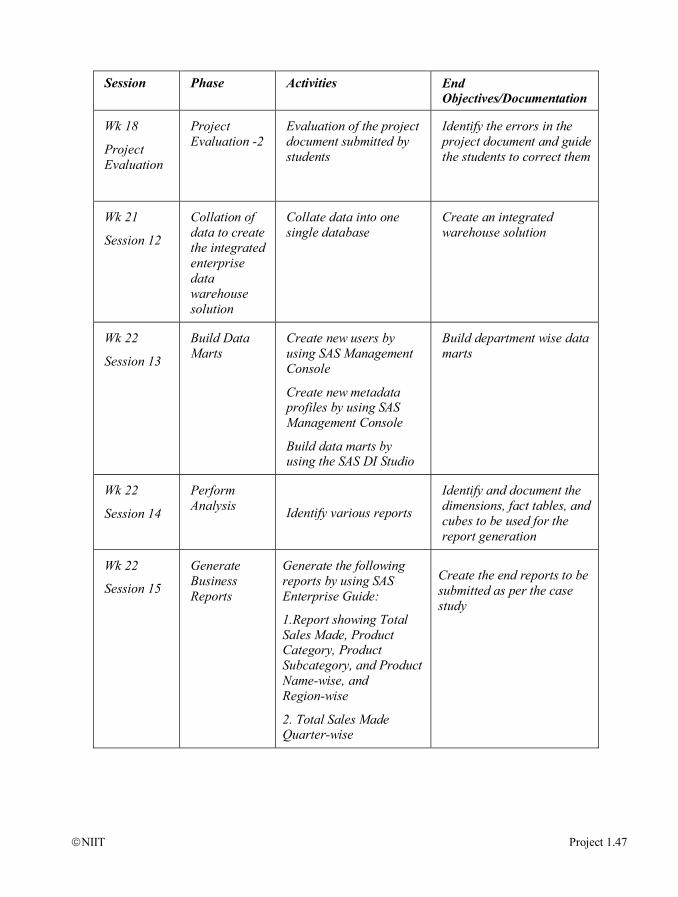
NIIT Project 1.47
Session Phase Activities End Objectives/Documentation
Wk 18
Project Evaluation
Project Evaluation -2
Evaluation of the project document submitted by students
Identify the errors in the project document and guide the students to correct them
Wk 21
Session 12
Collation of data to create the integrated enterprise data warehouse solution
Collate data into one single database
Create an integrated warehouse solution
Wk 22
Session 13
Build Data Marts
Create new users by using SAS Management Console
Create new metadata profiles by using SAS Management Console
Build data marts by using the SAS DI Studio
Build department wise data marts
Wk 22
Session 14
Perform Analysis Identify various reports
Identify and document the dimensions, fact tables, and cubes to be used for the report generation
Wk 22
Session 15
Generate Business Reports
Generate the following reports by using SAS Enterprise Guide:
1.Report showing Total Sales Made, Product Category, Product Subcategory, and Product Name-wise, and Region-wise
2. Total Sales Made Quarter-wise
Create the end reports to be submitted as per the case study

1.48 Project NIIT
Session Phase Activities End Objectives/Documentation
Wk 23
Session 16
Generate Business Reports
Generate a report showing Total Sales Made based on Product Category-wise, Retailer-wise, and Warehouse-wise by using SAS AddIn for Microsoft Office
Create the end reports to be submitted as per the case study
Wk 23
Session 17
Generate Business Reports
Generate the following reports by using SAS Web Report Studio:
1..Number of Turns Retailer-wise and Warehouse-wise
2. Number of Turns Product Category-wise. Product Subcategory-wise, Product Name-wise, and Warehouse-wise
Create the end reports to be submitted as per the case study
Wk 23
Session 18
Generate Business Reports
Generate a dashboard by using the SAS Information Delivery Portal
Create the end reports to be submitted as per the case study
Wk 24
Project Evaluation
Project Evaluation -3
Evaluation of the project document submitted by students
Identify the errors in the project document and guide the students to correct them
Assign marks to the student on the basis of the specified evaluation criteria.
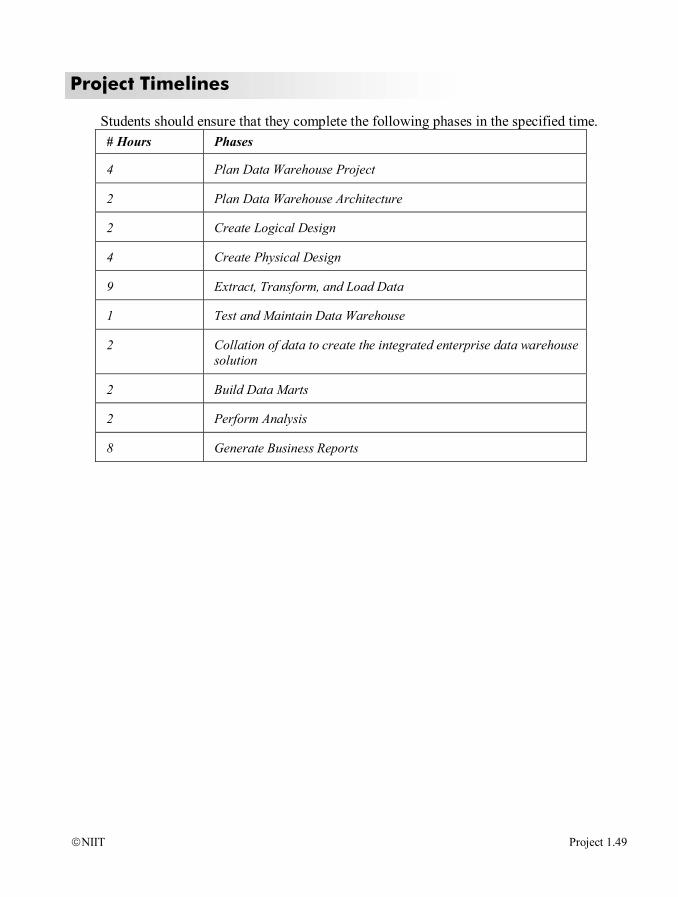
NIIT Project 1.49
Students should ensure that they complete the following phases in the specified time. # Hours Phases
4 Plan Data Warehouse Project
2 Plan Data Warehouse Architecture
2 Create Logical Design
4 Create Physical Design
9 Extract, Transform, and Load Data
1 Test and Maintain Data Warehouse
2 Collation of data to create the integrated enterprise data warehouse solution
2 Build Data Marts
2 Perform Analysis
8 Generate Business Reports
Project Timelines
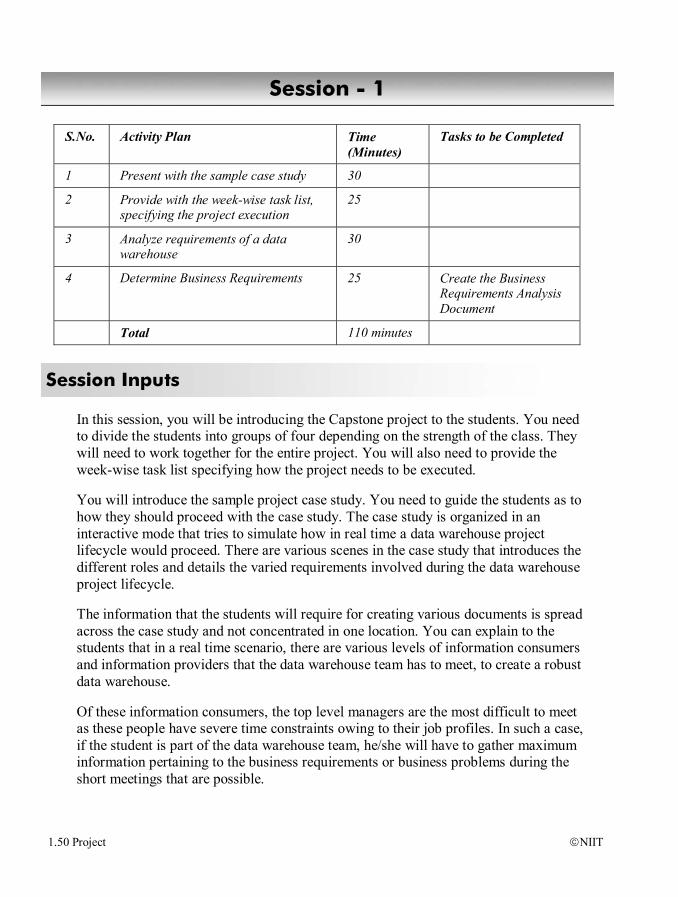
1.50 Project NIIT
S.No. Activity Plan Time (Minutes)
Tasks to be Completed
1 Present with the sample case study 30
2 Provide with the week-wise task list, specifying the project execution
25
3 Analyze requirements of a data warehouse
30
4 Determine Business Requirements 25 Create the Business Requirements Analysis Document
Total 110 minutes
In this session, you will be introducing the Capstone project to the students. You need to divide the students into groups of four depending on the strength of the class. They will need to work together for the entire project. You will also need to provide the week-wise task list specifying how the project needs to be executed.
You will introduce the sample project case study. You need to guide the students as to how they should proceed with the case study. The case study is organized in an interactive mode that tries to simulate how in real time a data warehouse project lifecycle would proceed. There are various scenes in the case study that introduces the different roles and details the varied requirements involved during the data warehouse project lifecycle.
The information that the students will require for creating various documents is spread across the case study and not concentrated in one location. You can explain to the students that in a real time scenario, there are various levels of information consumers and information providers that the data warehouse team has to meet, to create a robust data warehouse.
Of these information consumers, the top level managers are the most difficult to meet as these people have severe time constraints owing to their job profiles. In such a case, if the student is part of the data warehouse team, he/she will have to gather maximum information pertaining to the business requirements or business problems during the short meetings that are possible.
Session - 1
Session Inputs
NIIT Project 1.51
From the information providers, the student will have to gather the technical requirements that require another round of meetings as it may not be possible to gather all the information at one time. Keeping this point of view, the case study has various scenes that discuss various issues related to any data warehouse project.
Therefore, the students will have to read the entire case study to understand its structure. It is only then will they be able to start identifying the pertinent portions from the case study. However, you can provide the following pointers to them pertaining to the sample case study:
There are three case studies. Each minor group (three students) should be given one of these:
Global Materials (Inventory) – Inventory Management System (IMS) Global Sales and Marketing System – Sales & Marketing System (SMMS) Global Materials (Purchase) – Vendor Management System (VMS)
Once each minor group has completed the solution for their respective case study, they will need to combine their solutions.
In Student Guide is organized as follows: Scene 1:
Meeting 1: Refers to the IMS Meeting 2: Refers to the SMMS Meeting 3: Refers to the VMS
Scene 2, 3, 4, 5, and 6: Common to all the three case studies Scene 7:
Meeting 1: Refers to the IMS Meeting 2: Refers to the SMMS Meeting 3: Refers to the VMS
Scene 8: Meeting 1: Refers to the IMS Meeting 2: Refers to the SMMS Meeting 3: Refers to the VMS
Scene 9: Common to all the three case studies History of the company: Read the history of the company to identify how it is
organized.You can give a quick overview of how this organization works if necessary. The history of the organization will provide inputs to the Business Analysis document.
SM Corp - MIS: This section provides a brief overview of the existing Information Systems and the problems faced by them.
1.52 Project NIIT
Starting with the scenes, the following lists what information a student should expect to extract from each scene:
Scene 1, 2, 3, and 4: Lays the foundation for the data warehouse project. These scenes provide information about how projects such as data warehouses are discussed in the boardrooms and which all people are involved at the top level while deciding whether a data warehouse is to be implemented or not.
Scene 5: Lays the foundation for the costs that are associated with the data warehouse project. This talks in detail about the hardware requirements, the software requirements, and the resource requirement in terms of software developers or maintenance personnel, administration personnel among others. The scene provides information required for the creating part of the ROI document that the student will have to create. Additionally, this scene provides information that will be the inputs required to create the Business Analysis Document, such as end user information, time frame set for the project among others.
Scene 6: Provides information that will be used as inputs to create the ROI document. This will provide information such as borrowing rate. The inputs to the formulas that are used for calculating the various financial measures is provided by this scene.
Scene 7: Provides information about the business problem from a Vice President’s or Managing Director’s point of view. This provides an overview of what information do managers look for from any report. This scene is crucial as it provides the theoretical information about main financial measures that are required for the report generation:
Meeting 1: It describes how GMROI is used as a KPI for any warehouse. Additionally, it provides information about how to interpret the value of GMROI when it will be calculated at the reporting tools at any level, such as the region level or the warehouse level.
Meeting 2: It describes how the Growth Trend Analysis is performed. Additionally, it shows what periods of time can we use for performing this analysis, such as monthly or yearly.
Meeting 3: It describes how vendor profitability and vendor reliability are used as business metrics. Additionally, it provides theoretical information about what these two metrics are and how they are used by businesses.
Scene 8: Meeting 1: Provides the crux of the IMS case study. All the information
pertaining to how to derive at a solution for the business problem is derived from this scene. It provides details about the various types of reports that are expected from the new system. It also provides the

NIIT Project 1.53
Note
mathematical calculations that will be needed while generating the reports for the end user.
Meeting 2: Provides the crux of the SMMS case study. All the information pertaining to how to derive at a solution for the business problem is derived from this scene. It provides details about the various types of reports that are expected from the new system. It also provides the mathematical calculations that will be needed while generating the reports for the end user.
Meeting 3: Provides the crux of the VMS case study. All the information pertaining to how to derive at a solution for the business problem is derived from this scene. It provides details about the various types of reports that are expected from the new system. It also provides the mathematical calculations that will be needed while generating the reports for the end user.
Scene 9: Provides information about the data sources, such as the time span for which they were used and the type of application or database management systems that used as a backend for storing the data.
You can provide the student with this overview. It should enable them focus on the relevant parts of the case study.
(You can ask the students to enact out the various scenes.)
In addition, the student will be creating the various documents that include the business requirement analysis document. The students will have to identify all the required parameters that are given in the solution.
You need to help them identify the exact requirements of the organization. Details are provided in the sample Business Requirement Analysis document.
Before the starting of the Project, ensure a minimum of 20 GB hard disk space is available on the machine on which the project will be executed.
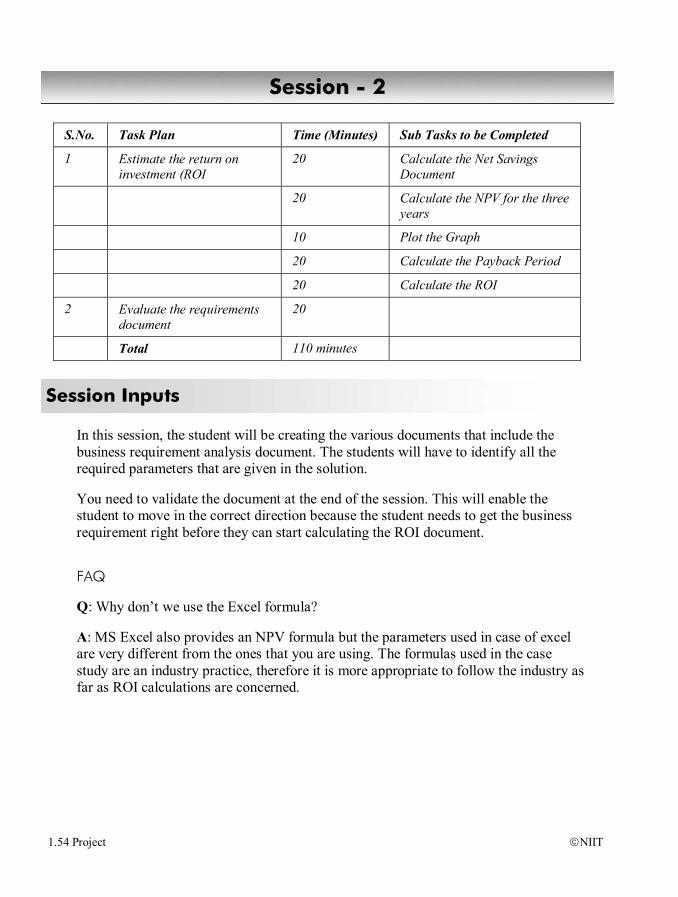
1.54 Project NIIT
S.No. Task Plan Time (Minutes) Sub Tasks to be Completed
1 Estimate the return on investment (ROI
20 Calculate the Net Savings Document
20 Calculate the NPV for the three years
10 Plot the Graph
20 Calculate the Payback Period
20 Calculate the ROI
2 Evaluate the requirements document
20
Total 110 minutes
In this session, the student will be creating the various documents that include the business requirement analysis document. The students will have to identify all the required parameters that are given in the solution.
You need to validate the document at the end of the session. This will enable the student to move in the correct direction because the student needs to get the business requirement right before they can start calculating the ROI document.
FAQ
Q: Why don’t we use the Excel formula?
A: MS Excel also provides an NPV formula but the parameters used in case of excel are very different from the ones that you are using. The formulas used in the case study are an industry practice, therefore it is more appropriate to follow the industry as far as ROI calculations are concerned.
Session - 2
Session Inputs
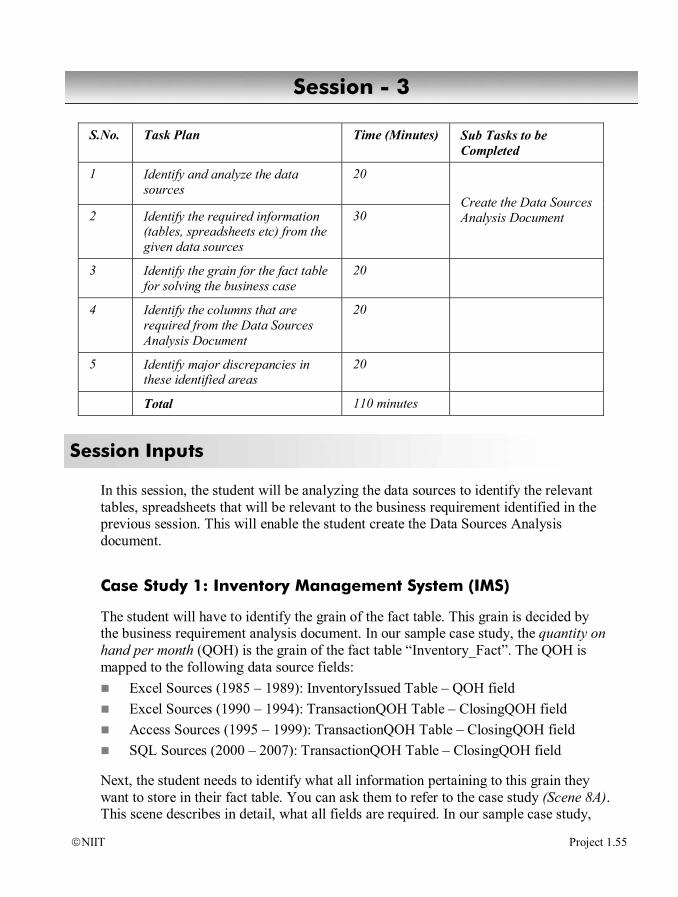
NIIT Project 1.55
S.No. Task Plan Time (Minutes) Sub Tasks to be Completed
1 Identify and analyze the data sources
20
2 Identify the required information (tables, spreadsheets etc) from the given data sources
30 Create the Data Sources Analysis Document
3 Identify the grain for the fact table for solving the business case
20
4 Identify the columns that are required from the Data Sources Analysis Document
20
5 Identify major discrepancies in these identified areas
20
Total 110 minutes
In this session, the student will be analyzing the data sources to identify the relevant tables, spreadsheets that will be relevant to the business requirement identified in the previous session. This will enable the student create the Data Sources Analysis document.
Case Study 1: Inventory Management System (IMS)
The student will have to identify the grain of the fact table. This grain is decided by the business requirement analysis document. In our sample case study, the quantity on hand per month (QOH) is the grain of the fact table “Inventory_Fact”. The QOH is mapped to the following data source fields:
Excel Sources (1985 – 1989): InventoryIssued Table – QOH field Excel Sources (1990 – 1994): TransactionQOH Table – ClosingQOH field Access Sources (1995 – 1999): TransactionQOH Table – ClosingQOH field SQL Sources (2000 – 2007): TransactionQOH Table – ClosingQOH field
Next, the student needs to identify what all information pertaining to this grain they want to store in their fact table. You can ask them to refer to the case study (Scene 8A). This scene describes in detail, what all fields are required. In our sample case study,
Session - 3
Session Inputs
1.56 Project NIIT
the reports have to be based on GMROI. The fields from our existing sources that are used to calculate the GMROI are as follows:
ClosingQOH: Quantity On Hand QtyIssued: QuantityIssued UnitSellingPrice: SellingPrice UnitCostPrice: CostPrice
The formulas are given below: Total Sales Made for a product: QuantityIssued * UnitSellingPrice # of Turns for a product: Total Sales Made / Quantity on Hand Gross Profit for a product: Total Sales Made – (UnitSellingPrice / UnitCostPrice) Gross Margin for a product: Gross Profit / Selling Price GMROI: # of Turns * Gross Margin
These are the main fields that are required for the case study.
Case Study 2: Sales and Marketing Management Systems (SMMS)
The student will have to identify the grain of the fact table. This grain is decided by the business requirement analysis document. In the sales and marketing case study, the quantity issued per month (QtyIssued) is the grain of the fact table “Sales_Fact”. The QtyIssued is mapped to the following data source fields:
Excel Sources (1985 – 1989): InventoryIssued Table – qtyissued field Excel Sources (1990 – 1994): InventoryIssue Table – qtyissued field Access Sources (1995 – 1999): InventoryIssue Table – qtyissued field SQL Sources (2000 – 2007): InventoryIssue Table – QtyIssued field
Next, the student needs to identify what all information pertaining to this grain they want to store in their fact table. You can ask them to refer to the case study (Scene 7). This scene describes in detail, what all fields are required. In this case study, the reports have to be based on Growth Trend Analysis (GTA). The fields from our existing sources that are used to calculate the GTA are as follows:
QtyIssued: QuantityIssued UnitSellingPrice: Selling Price
NIIT Project 1.57
The formulas are given below: Total Sales for a product per month: Total Quantity Issued Per Month * Selling
Price Total sales for a product per year: Sum (Total Sales for the product per month for
that year) Growth Trend: ((Total Sales for Current Period (Month/Year)) – (Total Sales for
Older Period (Month/Year)) / ( Total Sales for Older Period (Month/Year) ) * 100
The students will have to perform the following aggregation in their fact tables: Include the total monthly sales for a product in their fact table. For an individual
product - Total_Monthly_Sales = QtyIssued * SellingPrice Include the total yearly sales for a product in their fact table. For an individual
product: Total_Yearly_Sales = Sum (Total_Monthly_Sales)
These are the main fields that are required for the sales and marketing case study.
Case Study 3: Vendor Management Systems (VMS)
The student will have to identify the grain of the fact table. This grain is decided by the business requirement analysis document. In the vendor management case study, the quantity received per month is the grain of the fact table “Vendor_Fact”. The quantity received is mapped to the following data source fields:
Excel Sources (1985 – 1989): InventoryOrdered Table – QtyReceived field Excel Sources (1990 – 1994): InventoryOrdered Table – QtyReceived field Access Sources (1995 – 1999): InventoryOrdered Table – QtyReceived field SQL Sources (2000 – 2007): InventoryOrdered Table – QtyReceived field
Next, the student needs to identify what all information pertaining to this grain they want to store in their fact table. You can ask them to refer to the case study (Scene 7). This scene describes in detail, what all fields are required.
In this case study, the reports have to be based on vendor profitability and vendor reliability. The additional fields from our existing sources that are used to calculate the these two fields are as follows:
Lead Time: This is the difference between the DateOrdered and DateReceived. This time has already been calculated and stored in the InventoryOrdered table.
After_Discount_Price: This gives the total cost price for a product at the end of every month. This price is calculated as QtyReceived * (Unit_Cost_Price – (Unit_Cost_Price * Discount)). This field is stored at the monthly level. The student will have to add the values for this field for a particular product vendor-wise and year-wise.

1.58 Project NIIT
These values map to the fields in the sources: Excel Sources (1985 – 1989): InventoryOrdered Table – Lead Time field Excel Sources (1985 – 1989): InventoryOrdered Table – After_Discount_Price
field Excel Sources (1990 – 1994): InventoryOrdered Table – Lead Time field Excel Sources (1990 – 1994): InventoryOrdered Table – After_Discount_Price
field Access Sources (1995 – 1999): InventoryOrdered Table – Lead Time field Access Sources (1995 – 1999): InventoryOrdered Table – After_Discount_Price
field SQL Sources (2000 – 2007): InventoryOrdered Table – Lead Time field SQL Sources (2000 – 2007): InventoryOrdered Table – After_Discount_Price
field The two values that the student will need in their fact table will be the Average Discounted Cost Price for a particular product vendor-wise and the Average Lead Time for a particular vendor. These values are calculated as follows:
Total number of orders per product per vendor per year: Count (Number of orders placed)
Total Discounted Price per product per vendor per year: Sum (After Discount Total Price)
Total Quantity Received per product per vendor per year: Sum (Quantity Received per order)
Average Total Discounted Price per product per vendor per year: (Total Discounted Price ) / (Total number of orders)
Average Quantity Received per product per vendor per year: (Total Quantity Received) / (Total number of orders)
Average Discounted Cost Price per product per vendor per year: Total Discounted Price / Average Quantity Received
Lead-time per product per vendor: Values tracked in our VMS Total lead time per product per vendor per year: Sum (Lead-time per product per
order) Average lead-time per product per vendor per month: (Total lead time) / (Total
number of orders)
These are the main fields that are required for the vendor management case study.
Now the students can identify what other fields that they want to include in their dimensional model. The inputs from this exercise will help them identify the various discrepancies that exist in the data sources, where one piece of data may have discrepancies in terms of data types or names, among others. The students can collate this data.
NIIT Project 1.59
S.No. Activity Plan Time (Minutes) Tasks to be Completed
1 Identify any aggregations 20 Create an aggregation plan
2 Create the Logical Design 30 Create Dimensional Model
3 Create the Logical Data Map 60 Create the Logical Data Map.
Total 110 minutes
In this session, the students will derive the various dimensions and the fact table(s) from the data source analysis document to complete their logical design.
After the logical design is complete, they can complete the Logical Data Map by mapping their dimensions and fact tables with the available source tables. The Logical Data Map provided in the sample case study can be shown to the student.
Case Study 1: Inventory Management System (IMS)
Following are the dimensions that the student should have identified: Product Warehouse Region Retailer Date
This is accompanied by the single fact table, Inventory_Fact. The details of these are provided in the Logical Data Map document and Logical Design document.
FAQ
Q: What if the student includes the CostPrice and the SellingPrice in the fact table?
A: The CostPrice and the SellingPrice should not be included in the fact table. This is because the fact table contains information about one product multiple number of times. Consider this, if the CostPrice and SellingPrice fields occupy 10 bytes each and we have 100 products. Now, if our fact table has 10,000,000 rows, therefore by adding these field in our fact table, we increase its storage requirement by (10,000,000 * 10 bytes) * 2 = 200,000,000 bytes. But if we were to store these values in the Product
Session - 4
Session Inputs
1.60 Project NIIT
dimension, the storage requirements would be 100 * 10 * 10 = 10000 bytes. Therefore, it is not a good idea to store such type of static data in the fact table.
Q: Is the Product dimension as a slowly changing dimension?
A: In this case, it is not a SCD. There are two reasons for this. The first reason is that the client has not specified the need to track the product prices for the past years. Even the reports that need to be generated are for the past four years. The second reason is that mostly in the industry, it is not a practice to track information such as CostPrice and SellingPrice. If these values need to be tracked, it has to be a clear cut client requirement.
Q: What if the student includes ROQ, Qty_Per_Unit, Unit in the Product dimension?
A: It is irrelevant to store these values in our dimension tables. There are two reasons for not tracking these values. The first reason is that these fields add no value to our business solution. They are not used anywhere in the calculations for the GMROI. The second reason is that they will unnecessarily use storage space in our data warehouse. Though storage is not one of the constraints in the data warehouse scenario, nevertheless it is not a good idea to include the “good to know” fields without any logical deduction for their inclusion.
Q: What if the student includes the OpeningQOH in the fact table, along with ClosingQOH?
A: The student only needs the ClosingQOH and it not the OpeningQOH. It is therefore wrong to include the OpeningQOH in the fact table. This field in not being used anywhere in solving our business requirement therefore should be omitted.
Q: What if the student plans to create an aggregate fact table?
A: It is a good idea to include an aggregate fact table in the model. But, it is very important the student identifies exactly which combination of attributes to use for building this table. For example, in our sample case study a student might want to create a fact table with to store Total Sales Made, Number of turns, Gross Profit or Gross margin for an individual product to facilitate the GMROI calculation. In such a case, you need to remind the student that this aggregation is stored according to a single product but will a use be able to roll these aggregates to the Product SubCategory or Product Category? Also, can these values be viewed by product name by warehouse or by product name and by region and by date or any such combination? Hence, an aggregate fact table should only be built on the attributes that are most commonly used and explicitly specified by the user for grouping the standard reports.
NIIT Project 1.61
Q: What if the student plans to include a calculated value in the fact table?
A: Aggregate values should not be stored in the fact table. It is known practice that if the numerator and denominator for a particular calculated value are stored in the fact table, that value should be calculated at the reporting end and not stored in the fact table.
Q: What if the student includes the Vendor dimension in the schema?
A: You can ask the student to identify whether their QOH and QtyIssued fields are additive, semi-additive, or non additive. The answer is they are addititve fields hence they should be additive across all the dimensions. In case the Vendor dimension is also included, these fields make no sense for a Vendor. Hence, it should not be included in the logical design.
Q: What if the student has included the Day, Day_of_Month, Day_of_Week, Week_of_Month, Week_of_Year attributes in the Date dimension?
A: It is clearly mentioned in the case study (Scene 7) that the Quantity On Hand field is stored at a monthly level therefore the data for these fields listed above is not available. Hence, it does not make sense to store data at these levels as it will be repetition of the same data across multiple rows, which will increase the size of the Date dimension unnecessarily.
Case Study 2: Sales and Marketing Management System (SMMS)
Following are the dimensions that the student should have identified: Product Warehouse Region Retailer Date
This is accompanied by the single fact table, Sales_Fact. The following list gives the attributes of the Sales_Fact table:
Surrogate Keys: Product_key Warehouse_key Retailer_key Date_key Region_key
1.62 Project NIIT
Numeric Measures: Quantity Issued Total_Monthly_Sales Total_Yearly_Sales
The dimensions are the same as the ones identified in the sample case study.
FAQ
Q: What if the student includes the CostPrice and the SellingPrice in the fact table?
A: Same as case study 1
Q: Is the Product dimension as a slowly changing dimension?
A: Same as case study 1
Q: What if the student includes ROQ, Qty_Per_Unit, Unit in the Product dimension?
A: Same as case study 1
Q: What if the student includes the Vendor dimension in the schema?
A: Same as case study 1
Q: What if the student has included the Day, Day_of_Month, Day_of_Week, Week_of_Month, Week_of_Year attributes in the Date dimension?
A: It is clearly mentioned in the case study (Scene 7) that the Quantity Issued field is stored at a monthly level therefore the data for these fields listed above is not available. Hence, it does not make sense to store data at these levels as it will be repetition of the same data across multiple rows, which will increase the size of the Date dimension unnecessarily.
Q: What if the student does not want to include the Total_Monthly_Sales and Total_Yearly_Sales in the fact table and instead wants to handle this at the reporting time?
A: The student should not leave this at the reporting stage because the aggregation will first need to be built for an individual product at the monthly level. Then, they will need to be aggregated for the yearly level. This is a very time consuming process and might lead to the reporting application hang.

NIIT Project 1.63
Case Study 3: Vendor Management System (VMS)
Following are the dimensions that the student should have identified: Product Warehouse Region Vendor Date
This is accompanied by the Vendor_fact table that has the following keys: Surrogate Keys:
Product_key Warehouse_key Vendor_key Date_key Region_key
Numeric Measures: Quantity Received Lead Time After_Discount_Price Average_Discounted_Price (this calculated values can be stored in the fact
table otherwise the student may have to create complex MDX scripts to generate these values)
Average_Lead_Time (this calculated values can be stored in the fact table otherwise the student may have to create complex MDX scripts to generate these values)
In this case study, the Date_Ordered and the Date_Received lead to the concept of the role playing dimensions. The difference between the two dates is the “day” field. The year and the month are the same. Therefore, the student might need to use the concepts taught in Module 1 about role playing dimensions.
Important Note
You need to ensure that the students understand why the concept of conformed dimensions is important. The following is the list of conformed dimensions that the minor groups should be creating:
Product Warehouse Date
1.64 Project NIIT
Region Retailer Vendor
The minor groups must adhere to common standards and formats while creating their individual data marts. The students in Session 18 will be required to collate their data an integrated solution. In case any of the above dimension is non-conformed, then the minor groups will be able they will not be able to efficiently create the solution.
In case they have conformed all their dimensions, only their fact tables will be different. To create their final data warehouse they will simply need to: 1. Choose their conformed dimensions from any of the data marts. 2. Need to add individual fact tables from their data marts (Inventory_fact,
Sales_fact, and Vendor_fact) to this data warehouse. 3. This will be the final data warehouse that the student will need to create by the
end of Session 12. 4. Once they have done this, they will need to use this data warehouse to create their
cubes and generate their final reports.
In case they have not created the conformed dimensions, then they will need to perform the following tasks: 1. Extract the data from the non-conformed dimensions and bring them in a staging
area. 2. Perform the ETL steps to arrive at the final dimensions that will be used for the
main data warehouse. 3. Reload all their fact tables so that their surrogate keys in the fact tables map to
their new dimension tables that they have created. This will create the final integrated solution of the enterprise.
4. This will be the final data warehouse that the student will need to create by the end of Session 12.
5. Once they have done this, they will need to use this data warehouse to create their cubes and generate their final reports.
NIIT Project 1.65
S.No. Task Plan Time (Minutes) Sub Tasks to be Completed
1 Create the physical tables mapping to the dimensions and fact tables identified in the logical design.
110 Create the Physical Design.
Total 110
In this session, the students create the physical tables that will be store their final data.
Session - 5
Session Inputs

1.66 Project NIIT
S.No. Task Plan Time (Minutes) Sub Tasks to be Completed
1 Implement the physical design 110 Create constraints, fact and dimension tables, indexes, and aggregate table in SQL Server 2008
Total 110
In this session, the students will constraints, fact and dimension tables, indexes, and aggregate table in SQL Server 2008. The students might require some help on the SQL Server 2008 interface. You can give them a brief overview on how to use the various features of SQL Server 2008.
Session - 6
Session Inputs
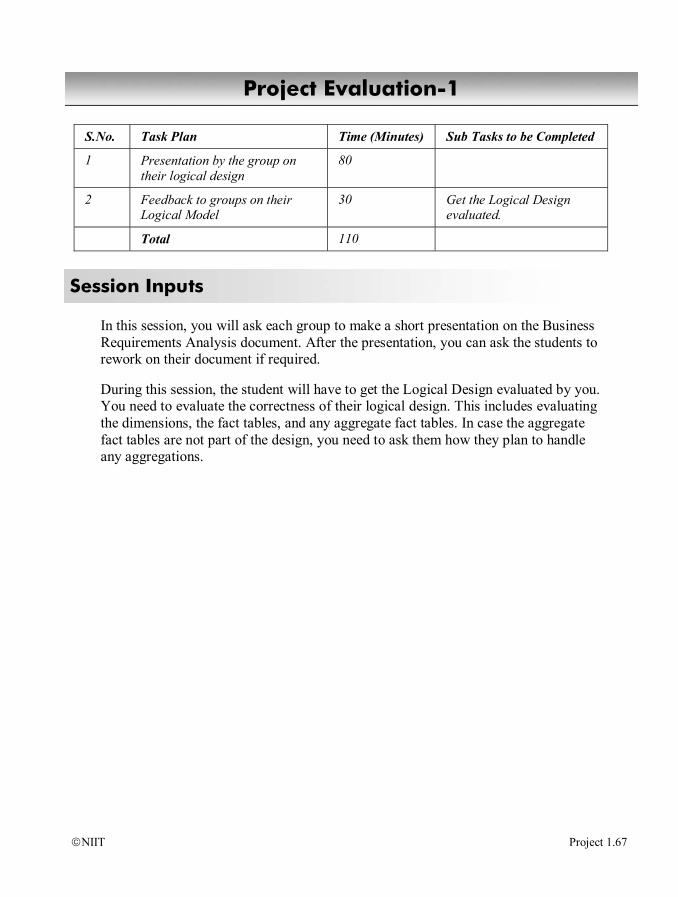
NIIT Project 1.67
S.No. Task Plan Time (Minutes) Sub Tasks to be Completed
1 Presentation by the group on their logical design
80
2 Feedback to groups on their Logical Model
30 Get the Logical Design evaluated.
Total 110
In this session, you will ask each group to make a short presentation on the Business Requirements Analysis document. After the presentation, you can ask the students to rework on their document if required.
During this session, the student will have to get the Logical Design evaluated by you. You need to evaluate the correctness of their logical design. This includes evaluating the dimensions, the fact tables, and any aggregate fact tables. In case the aggregate fact tables are not part of the design, you need to ask them how they plan to handle any aggregations.
Project Evaluation-1
Session Inputs
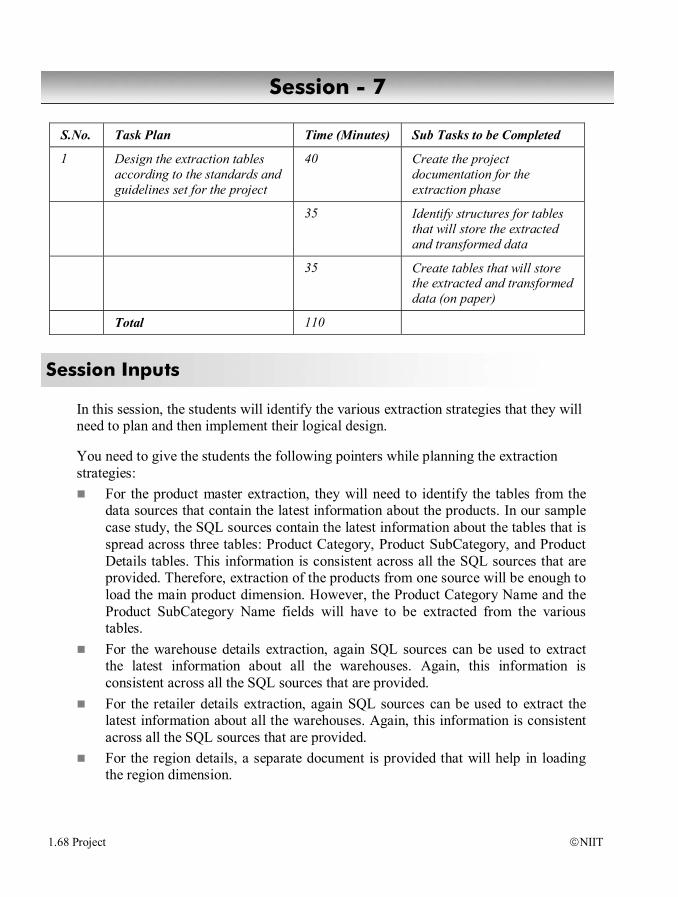
1.68 Project NIIT
S.No. Task Plan Time (Minutes) Sub Tasks to be Completed
1 Design the extraction tables according to the standards and guidelines set for the project
40 Create the project documentation for the extraction phase
35 Identify structures for tables that will store the extracted and transformed data
35 Create tables that will store the extracted and transformed data (on paper)
Total 110
In this session, the students will identify the various extraction strategies that they will need to plan and then implement their logical design.
You need to give the students the following pointers while planning the extraction strategies:
For the product master extraction, they will need to identify the tables from the data sources that contain the latest information about the products. In our sample case study, the SQL sources contain the latest information about the tables that is spread across three tables: Product Category, Product SubCategory, and Product Details tables. This information is consistent across all the SQL sources that are provided. Therefore, extraction of the products from one source will be enough to load the main product dimension. However, the Product Category Name and the Product SubCategory Name fields will have to be extracted from the various tables.
For the warehouse details extraction, again SQL sources can be used to extract the latest information about all the warehouses. Again, this information is consistent across all the SQL sources that are provided.
For the retailer details extraction, again SQL sources can be used to extract the latest information about all the warehouses. Again, this information is consistent across all the SQL sources that are provided.
For the region details, a separate document is provided that will help in loading the region dimension.
Session - 7
Session Inputs

NIIT Project 1.69
For the fact tables, the student will have to extract relevant details from the associated tables. This data varies across all the sources, hence will require the maximum work.
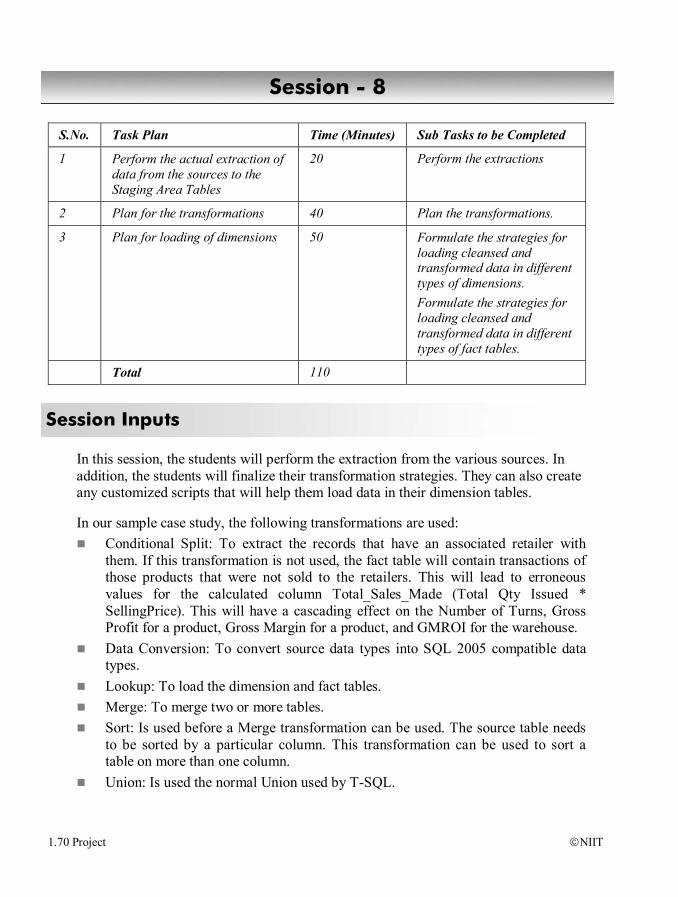
1.70 Project NIIT
S.No. Task Plan Time (Minutes) Sub Tasks to be Completed
1 Perform the actual extraction of data from the sources to the Staging Area Tables
20 Perform the extractions
2 Plan for the transformations 40 Plan the transformations.
3 Plan for loading of dimensions 50 Formulate the strategies for loading cleansed and transformed data in different types of dimensions. Formulate the strategies for loading cleansed and transformed data in different types of fact tables.
Total 110
In this session, the students will perform the extraction from the various sources. In addition, the students will finalize their transformation strategies. They can also create any customized scripts that will help them load data in their dimension tables.
In our sample case study, the following transformations are used: Conditional Split: To extract the records that have an associated retailer with
them. If this transformation is not used, the fact table will contain transactions of those products that were not sold to the retailers. This will lead to erroneous values for the calculated column Total_Sales_Made (Total Qty Issued * SellingPrice). This will have a cascading effect on the Number of Turns, Gross Profit for a product, Gross Margin for a product, and GMROI for the warehouse.
Data Conversion: To convert source data types into SQL 2005 compatible data types.
Lookup: To load the dimension and fact tables. Merge: To merge two or more tables. Sort: Is used before a Merge transformation can be used. The source table needs
to be sorted by a particular column. This transformation can be used to sort a table on more than one column.
Union: Is used the normal Union used by T-SQL.
Session - 8
Session Inputs

NIIT Project 1.71
For the loading strategies for the transformation tables, tell the students that the structure as well as the data types of these tables has to be the same as the dimensions and fact tables. In case there is a difference in either the structure or the data types of a transformation table and its associated fact or dimension table, then errors will occur when the student will try to load the data from the transformation table into the dimension or the fact table.
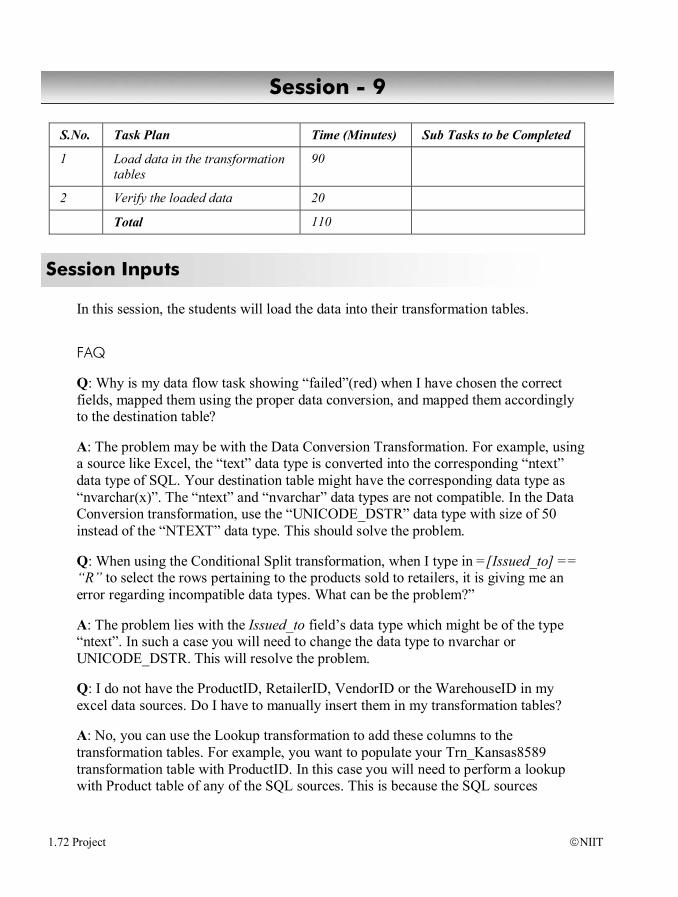
1.72 Project NIIT
S.No. Task Plan Time (Minutes) Sub Tasks to be Completed
1 Load data in the transformation tables
90
2 Verify the loaded data 20
Total 110
In this session, the students will load the data into their transformation tables.
FAQ
Q: Why is my data flow task showing “failed”(red) when I have chosen the correct fields, mapped them using the proper data conversion, and mapped them accordingly to the destination table?
A: The problem may be with the Data Conversion Transformation. For example, using a source like Excel, the “text” data type is converted into the corresponding “ntext” data type of SQL. Your destination table might have the corresponding data type as “nvarchar(x)”. The “ntext” and “nvarchar” data types are not compatible. In the Data Conversion transformation, use the “UNICODE_DSTR” data type with size of 50 instead of the “NTEXT” data type. This should solve the problem.
Q: When using the Conditional Split transformation, when I type in =[Issued_to] == “R” to select the rows pertaining to the products sold to retailers, it is giving me an error regarding incompatible data types. What can be the problem?”
A: The problem lies with the Issued_to field’s data type which might be of the type “ntext”. In such a case you will need to change the data type to nvarchar or UNICODE_DSTR. This will resolve the problem.
Q: I do not have the ProductID, RetailerID, VendorID or the WarehouseID in my excel data sources. Do I have to manually insert them in my transformation tables?
A: No, you can use the Lookup transformation to add these columns to the transformation tables. For example, you want to populate your Trn_Kansas8589 transformation table with ProductID. In this case you will need to perform a lookup with Product table of any of the SQL sources. This is because the SQL sources
Session - 9
Session Inputs
NIIT Project 1.73
contains the latest information about all the products. Similarly, you will need to perform the lookups for RetailerID and the WarehouseID.
Q: While performing the lookup for the <ProductID>, it gave an error that no matching rows were found. How do I solve this problem?
< --- >: RetailerID, ProductID, VendorID, WarehouseID
A: You have to configure your Lookup transformation to ignore the failure, such as not finding a matching row. You can use the Configure Error property to ignore the error.
Q: I have performed a lookup but still there are some products where the ProductID is null. What could be the reason?
A: The NULL values are due to the product name discrepancies. You need to ensure that the product names in your excel data sources and the product names in your SQL sources match. A good practice would be first to update your transformation tables with the correct names and then apply the lookups.
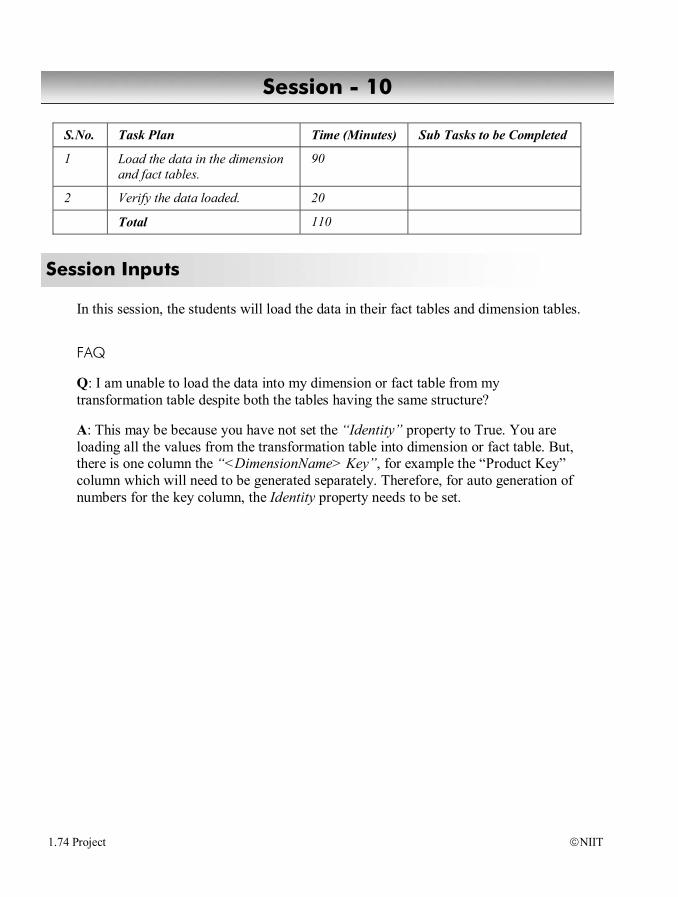
1.74 Project NIIT
S.No. Task Plan Time (Minutes) Sub Tasks to be Completed
1 Load the data in the dimension and fact tables.
90
2 Verify the data loaded. 20
Total 110
In this session, the students will load the data in their fact tables and dimension tables.
FAQ
Q: I am unable to load the data into my dimension or fact table from my transformation table despite both the tables having the same structure?
A: This may be because you have not set the “Identity” property to True. You are loading all the values from the transformation table into dimension or fact table. But, there is one column the “<DimensionName> Key”, for example the “Product Key” column which will need to be generated separately. Therefore, for auto generation of numbers for the key column, the Identity property needs to be set.
Session - 10
Session Inputs
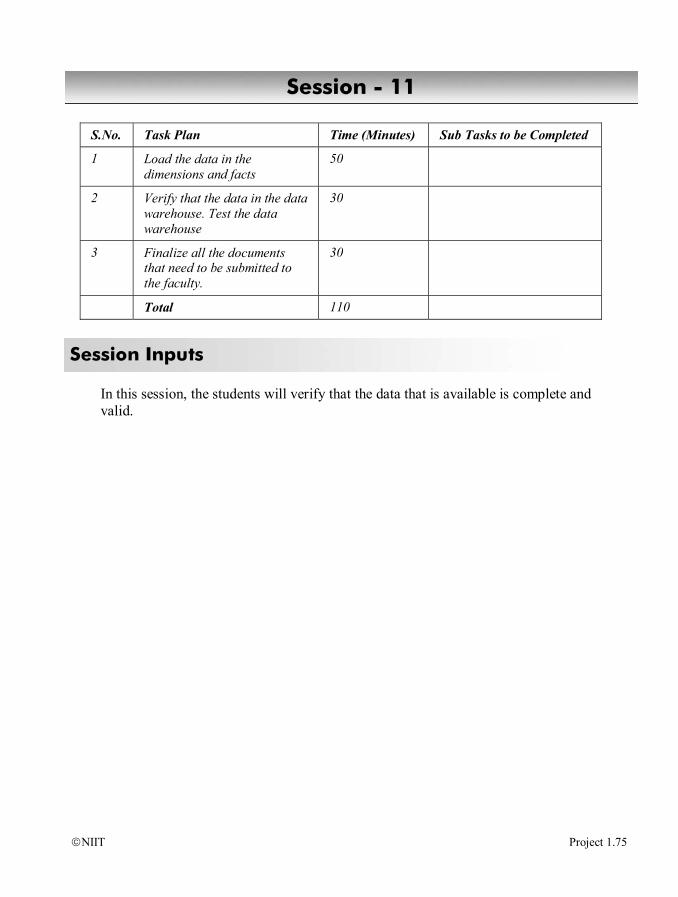
NIIT Project 1.75
S.No. Task Plan Time (Minutes) Sub Tasks to be Completed
1 Load the data in the dimensions and facts
50
2 Verify that the data in the data warehouse. Test the data warehouse
30
3 Finalize all the documents that need to be submitted to the faculty.
30
Total 110
In this session, the students will verify that the data that is available is complete and valid.
Session - 11
Session Inputs
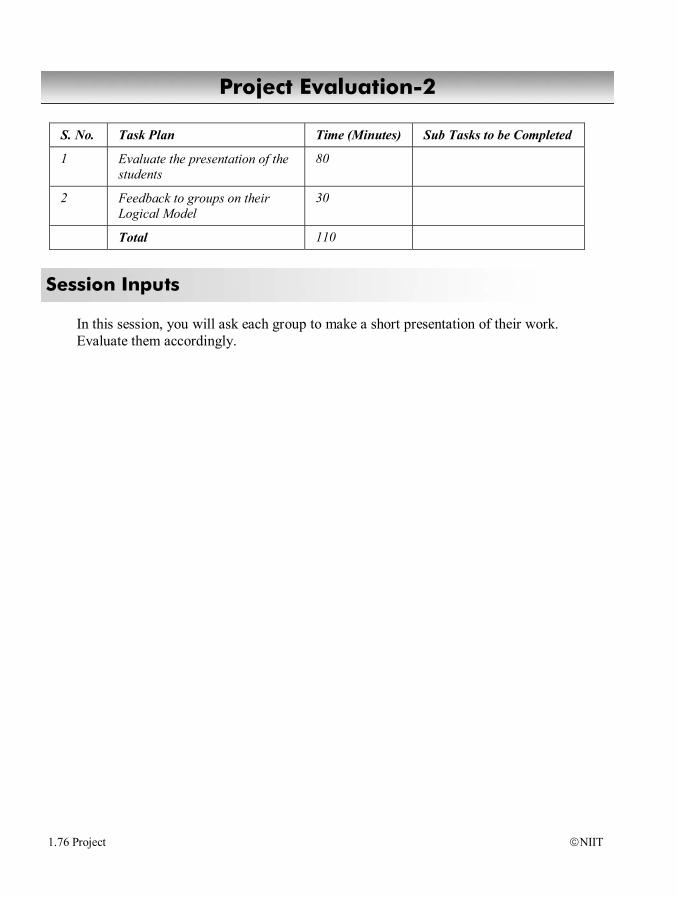
1.76 Project NIIT
S. No. Task Plan Time (Minutes) Sub Tasks to be Completed
1 Evaluate the presentation of the students
80
2 Feedback to groups on their Logical Model
30
Total 110
In this session, you will ask each group to make a short presentation of their work. Evaluate them accordingly.
Project Evaluation-2
Session Inputs

NIIT Project 1.77
S.No. Task Plan Time (Minutes) Sub Tasks to be Completed
1 Combine their solutions to create an integrated Enterprise Data Warehousing Solution.
110 Create a single data warehouse by combining information from all three data marts (Inventory, Sales, and Vendor)
Total 110
In this session, the students will need to integrate their solutions to create a complete data warehousing solution. They should have the following fact and dimension tables in place once they have collated their work:
Dimension Tables (Conformed) Product Warehouse Retailer Vendor Date Region
Fact Tables Inventory_Fact Sales_Fact Vendor_Fact
Once they are through with this task, then they will use this data warehouse to extract relevant information pertaining to the business requirement and generate the relevant reports by using various SAS tools.
For your reference, the integrated Enterprise Data Warehousing solution is present at the following location in the TIRM CD:
TRIM\07_Solutions\05_PROJECT\03_INVENTORY_MGMT_SYSTEM\04_DATA_WAREHOUSE\Inventory_DataMart.bak
Session - 12
Session Inputs
1.78 Project NIIT
Use the Inventory_DataMart.bak file to restore the Inventory_DataMart data warehouse. To restore the Inventory_DataMart data warehouse in SQL Server 2008, you need to perform the following steps: 1. Open Microsoft SQL Server Management Studio of Microsoft SQL Server 2008
and connect it to the server. 2. Expand the Databases node in the Object Explorer window. 3. Right-click the System Databases node and then, select Restore Database. The
Restore Database- dialog box appears. 4. Ensure that the General option is selected in the Select a page section. 5. Select the From device option in the Source for restore section. 6. Click the ellipse button adjacent to the From device option to browse for the
backup file. The Specify Backup dialog box appears. 7. Click the Add button. The Locate Backup File dialog box appears. 8. Locate and select the Inventory_DataMart.bak file from the Select the file
section. 9. Click the OK button. The selected file is added in the Specify Backup dialog
box. 10. Click the OK button. The focus moves to the Restore database- dialog box. 11. Select Inventory_DataMart from the To database drop-down list. 12. Select the Restore check box in the Select the backup sets to restore section. 13. Click the OK button. The Microsoft SQL Server Management Studio message
box appears. 14. Click the OK button. The focus moves to Microsoft SQL Server Management
Studio. 15. Exit Microsoft SQL Server Management Studio.
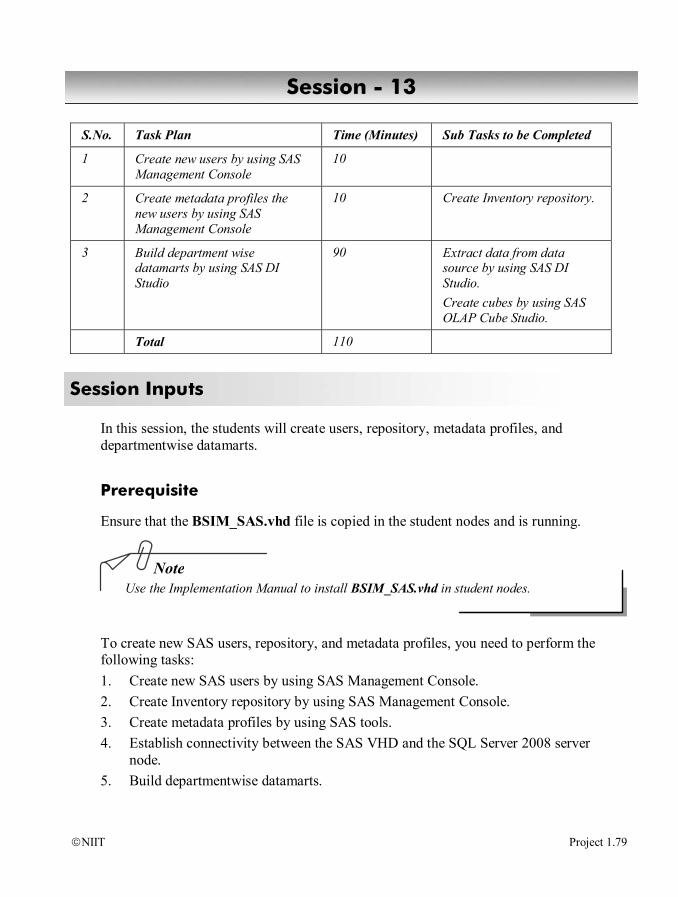
NIIT Project 1.79
Note
S.No. Task Plan Time (Minutes) Sub Tasks to be Completed
1 Create new users by using SAS Management Console
10
2 Create metadata profiles the new users by using SAS Management Console
10 Create Inventory repository.
3 Build department wise datamarts by using SAS DI Studio
90 Extract data from data source by using SAS DI Studio. Create cubes by using SAS OLAP Cube Studio.
Total 110
In this session, the students will create users, repository, metadata profiles, and departmentwise datamarts.
Prerequisite
Ensure that the BSIM_SAS.vhd file is copied in the student nodes and is running.
Use the Implementation Manual to install BSIM_SAS.vhd in student nodes.
To create new SAS users, repository, and metadata profiles, you need to perform the following tasks: 1. Create new SAS users by using SAS Management Console. 2. Create Inventory repository by using SAS Management Console. 3. Create metadata profiles by using SAS tools. 4. Establish connectivity between the SAS VHD and the SQL Server 2008 server
node. 5. Build departmentwise datamarts.
Session - 13
Session Inputs
1.80 Project NIIT
Task 1: Creating New SAS Users by Using SAS Management Console
To create new SAS users by using SAS Management Console, you need to perform the following steps: 1. Select Start All Programs SAS SAS Management Console 9.1. The Open
a Metadata Profile dialog box appears. 2. Ensure that the Open an existing metadata profile option is selected. 3. Ensure that BIArchitecture is selected in the Open an existing metadata profile
drop-down list. 4. Click the OK button. The Enter your user information dialog box appears. 5. Enter Ahmed in the User ID text box. 6. Enter Student1 in the Password text box. 7. Click the OK button. The focus shifts to the SAS Management Console window. 8. Ensure that the Foundation repository is selected from the Repository
drop-down list. 9. Right-click the User Manager node in the SAS Management Console
navigation tree and then, select New User. The New User Properties window appears.
10. Ensure that the General tab is selected. 11. Type Vijay in the Name text box. 12. Type IT Administrator in the Job Title text box. 13. Click the Groups tab, and then double-click the All SAS Users, SAS General
Servers, and WRS Administrator groups in the Available Groups list. 14. Ensure that the All SAS Users, SAS General Servers, and WRS Administrator
groups are displayed in the Member of list. 15. Click the Logins tab. 16. Click the New button. The New Login Properties dialog box appears. 17. Type birev03\Vijay in the User ID text box. 18. Type Student1 in the Password text box. 19. Type Student1 in the Confirm Password text box. 20. Ensure that DefaultAuth is selected from the Authentication Domain
drop-down list. 21. Click the OK button. The focus shifts to the New User Properties message box. 22. Click the OK button. The focus shifts to the SAS Management Console window. 23. Ensure that Vijay is displayed under the Name column in the display area.

NIIT Project 1.81
Note
You need to repeat steps of Task 1 to add other new users. The following table displays various user names, job titles, and groups of various users.
S.No. User Name Job Title Password UserID Groups
1. Raymond Data Warehouse Administrator
Student1 birev03\Raymond All SAS Users
2. Lara Data Modeler Student1 birev03\Lara All SAS Users
3. Jeremiah Data Modeler Student1 birev03\Jeremiah All SAS Users Portal Admins
4. Ron Business Analyst
Student1 birev03\Ron All SAS Users Portal Admins
5. Alan Power User Student1 birev03\Alan All SAS Users Portal Admins
User Names, Job Titles, and Groups
Create the users Vijay, Raymond, Lara, Jeremiah, Ron, and Alan in the Local Users and Groups of Windows Server 2003. Use Student1 as the password for all the users.
Task 2: Creating Inventory Repository by Using SAS Management Console
To create Inventory repository by using the Metadata Manager plug-in of SAS Management Console, you need to use the following details:
Type: Custom Name: Inventory Description: Inventory Repository (Custom) Engine: Base Path: S:\Workshop\winsas\sbip\MetadataServer\MetadataRepositories\Inventory Depend on: Foundation
You need to clear the This repository will be under change management check box.
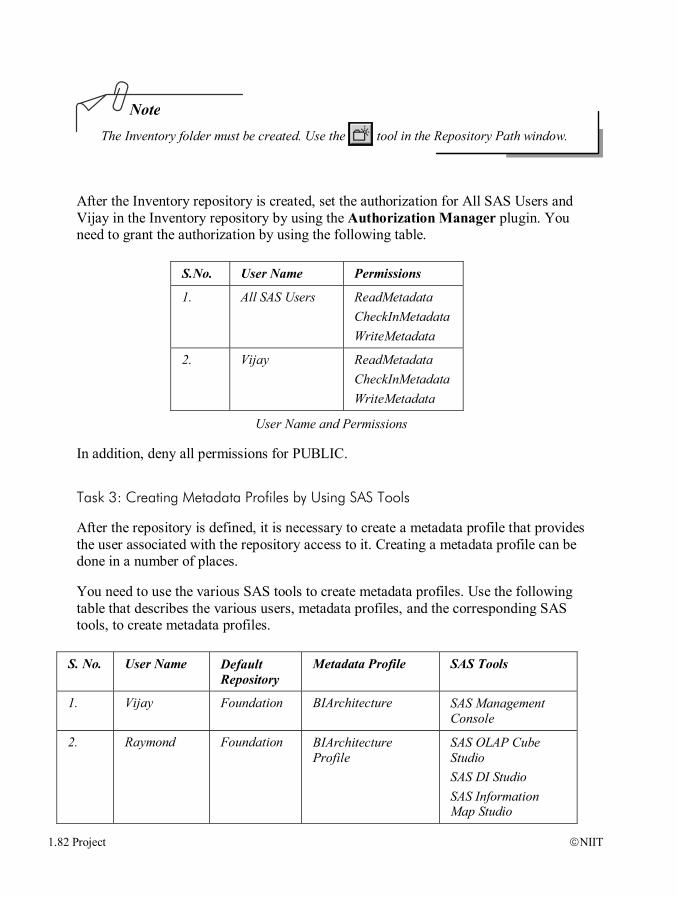
1.82 Project NIIT
Note
The Inventory folder must be created. Use the tool in the Repository Path window.
After the Inventory repository is created, set the authorization for All SAS Users and Vijay in the Inventory repository by using the Authorization Manager plugin. You need to grant the authorization by using the following table.
S.No. User Name Permissions
1. All SAS Users ReadMetadata CheckInMetadata WriteMetadata
2. Vijay ReadMetadata CheckInMetadata WriteMetadata
User Name and Permissions
In addition, deny all permissions for PUBLIC.
Task 3: Creating Metadata Profiles by Using SAS Tools
After the repository is defined, it is necessary to create a metadata profile that provides the user associated with the repository access to it. Creating a metadata profile can be done in a number of places.
You need to use the various SAS tools to create metadata profiles. Use the following table that describes the various users, metadata profiles, and the corresponding SAS tools, to create metadata profiles.
S. No. User Name Default
Repository Metadata Profile SAS Tools
1. Vijay Foundation BIArchitecture SAS Management Console
2. Raymond Foundation BIArchitecture Profile
SAS OLAP Cube Studio SAS DI Studio SAS Information Map Studio

NIIT Project 1.83
Note
S. No. User Name Default Repository
Metadata Profile SAS Tools
3. Raymond Inventory Inventory Profile SAS OLAP Cube Studio SAS DI Studio SAS Information Map Studio
4. Lara Inventory Lara Inventory Profile
SAS OLAP Cube Studio
5. Jeremiah Inventory Jeremiah Inventory Profile
SAS Information Map Studio
The Details of Various Users
You have created the users, repository, and metadata profiles. Now, you need to extract data from SQL Server.
Task 4: Establishing Connectivity Between the SAS VHD and the SQL Server 2008 Server Node.
To extract data, Inventory_DataMart, stored in the SQL Server 2008, you need to establish connectivity between the SAS VHD and the SQL Server 2008 server node, by using the following steps: 1. Select Start All Programs Administrative Tools Data Sources (ODBC).
The ODBC Data Source Administrator dialog box appears. 2. Click the System DSN tab. 3. Click the Add button. The Create New Data Source dialog box appears. 4. Select the SQL Server driver, and then click the Finish button. The Create a
New Data Source to SQL Server wizard appears.
Ensure that the network settings are configured in the virtual machine.
5. Type Inventory in the Name text box. 6. Select the appropriate SQL Server from the Server drop-down list. 7. Click the Next button. 8. Select the With SQL Server authentication using a Login ID and password
entered by the user option. 9. Type login name in the Login ID text box.
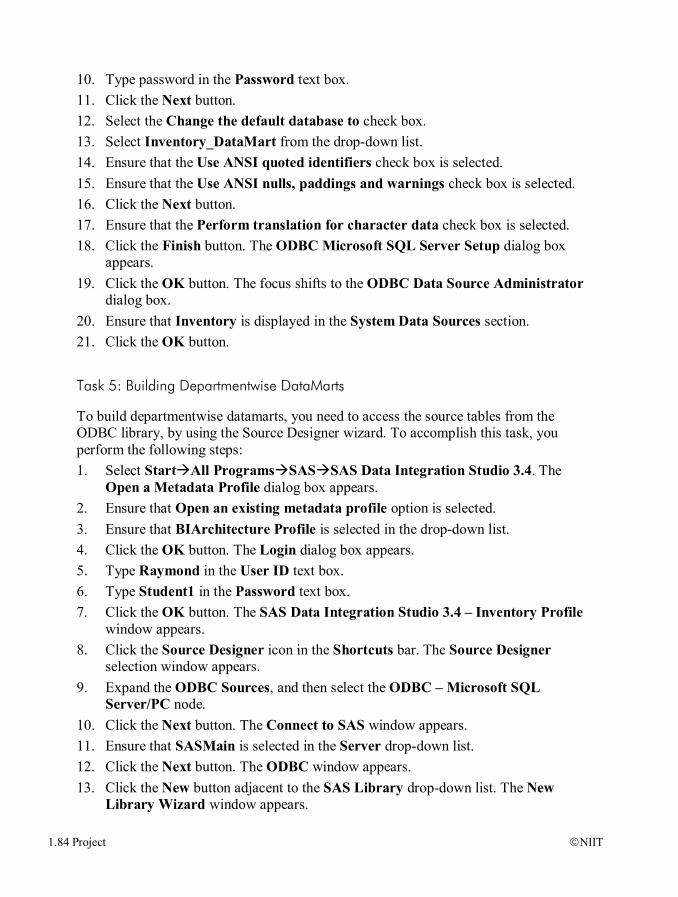
1.84 Project NIIT
10. Type password in the Password text box. 11. Click the Next button. 12. Select the Change the default database to check box. 13. Select Inventory_DataMart from the drop-down list. 14. Ensure that the Use ANSI quoted identifiers check box is selected. 15. Ensure that the Use ANSI nulls, paddings and warnings check box is selected. 16. Click the Next button. 17. Ensure that the Perform translation for character data check box is selected. 18. Click the Finish button. The ODBC Microsoft SQL Server Setup dialog box
appears. 19. Click the OK button. The focus shifts to the ODBC Data Source Administrator
dialog box. 20. Ensure that Inventory is displayed in the System Data Sources section. 21. Click the OK button.
Task 5: Building Departmentwise DataMarts
To build departmentwise datamarts, you need to access the source tables from the ODBC library, by using the Source Designer wizard. To accomplish this task, you perform the following steps: 1. Select Start All Programs SAS SAS Data Integration Studio 3.4. The
Open a Metadata Profile dialog box appears. 2. Ensure that Open an existing metadata profile option is selected. 3. Ensure that BIArchitecture Profile is selected in the drop-down list. 4. Click the OK button. The Login dialog box appears. 5. Type Raymond in the User ID text box. 6. Type Student1 in the Password text box. 7. Click the OK button. The SAS Data Integration Studio 3.4 – Inventory Profile
window appears. 8. Click the Source Designer icon in the Shortcuts bar. The Source Designer
selection window appears. 9. Expand the ODBC Sources, and then select the ODBC – Microsoft SQL
Server/PC node. 10. Click the Next button. The Connect to SAS window appears. 11. Ensure that SASMain is selected in the Server drop-down list. 12. Click the Next button. The ODBC window appears. 13. Click the New button adjacent to the SAS Library drop-down list. The New
Library Wizard window appears.

NIIT Project 1.85
14. Type inventory_odbc_library in the Name text box. 15. Click the Next button. 16. Type invodbc in the Libref text box. 17. Click the Next button. The focus shifts to the New Library Wizard window. 18. Click the New button adjacent to the Database Server drop-down list. The New
ODBC Server Wizard window appears. 19. Type Inventory_odbc_server in the Name text box. 20. Click the Next button. 21. Select ODBC – Microsoft SQL Server(PC Client) from the Data Source Type
drop-down list. 22. Click the Next button. 23. Select the Datasrc option. 24. Type Inventory in the text box adjacent to the Datasrc option. 25. Click the Next button. 26. Click the Finish button. The focus shifts to the New Library Wizard window. 27. Click the New button adjacent to the Database Schema drop-down list. The New
ODBC Database Schema Wizard window appears. 28. Type Inventory_odbc_schema in the Name text box. 29. Click the Next button. 30. Type dbo in the Database Schema Name text box. 31. Click the Next button. 32. Click the Finish button. The focus shifts to the New Library Wizard window. 33. Click the Next button. 34. Select SASMain from the text area. 35. Click the Next button. 36. Ensure that the Foundation node is expanded, and then select the Shared Data
node. 37. Click the Next button. 38. Click the Finish button. The focus shifts to the ODBC window. 39. Click the Next button. The Define Tables window appears. 40. Select the Date, Inventory_Fact, Product, Region, Retailer, and Vendor_Dim,
and Warehouse tables. 41. Click the Next button. The Select Folder window appears. 42. Expand the Foundation node, and then select the Shared Data node. 43. Click the Next button. The Wizard Finish window appears. 44. Click the Finish button.

1.86 Project NIIT
45. Ensure that the tables, Date, Inventory_Fact, Product, Region, Retailer, Vendor_Dim, and Warehouse, are populated in the Tables folder within the Inventory tab of the Tree view.
Now, use the Target Designer wizard to create a target table, new_Inventory_fact.
Include the following new measures in the new_Inventory_Fact table, by using the properties as displayed in the table.
Measure Column Name Column
Type Column Length
Informat Format
totalsales totalsales Numeric 8 DOLLAR23.2 DOLLAR23.2
noofturns noofturns Numeric 8 11. 11.
grossprofit grossprofit Numeric 8 DOLLAR23.2 DOLLAR23.2
grossmargin grossmargin Numeric 8 DOLLAR23.2 DOLLAR23.2
gmroi gmroi Numeric 8 DOLLAR23.2 DOLLAR23.2
The Properties of the Measures
Now, populate the new_Inventory_Fact table by performing SQL transformation between the Inventory_Fact and Product tables. Finally, exit SAS Data Integration Studio.
Now, you need to create a cube, Inventory_Cube, in the Foundation repository, by using the SAS OLAP Cube Studio. Login to SAS OLAP Cube Studio as Raymond in BIArchitecture Profile. To create the cube, Inventory_Cube, you need to use the following details:
General Properties: Cube Name: Inventory_Cube Description: Inventory cube for SMCorp. Repository: Foundation OLAP Schema: SASMain – OLAP Schema Path: S:\Project\Cubes Input type: Star Schema Advanced Cube Options:
Character Missing Member: Null Numeric Missing Member: 0
Star Schema Fact Table: new_Inventory_fact Drill-Through option: Use input table for Drill-Through: new_inventory_fact
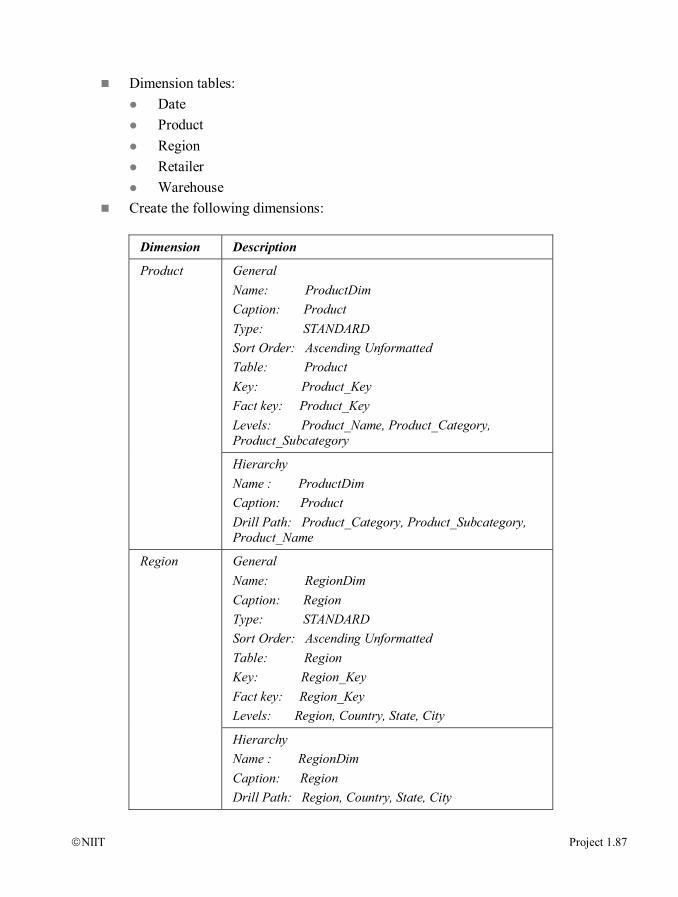
NIIT Project 1.87
Dimension tables: Date Product Region Retailer Warehouse
Create the following dimensions:
Dimension Description
General Name: ProductDim Caption: Product Type: STANDARD Sort Order: Ascending Unformatted Table: Product Key: Product_Key Fact key: Product_Key Levels: Product_Name, Product_Category, Product_Subcategory
Product
Hierarchy Name : ProductDim Caption: Product Drill Path: Product_Category, Product_Subcategory, Product_Name
General Name: RegionDim Caption: Region Type: STANDARD Sort Order: Ascending Unformatted Table: Region Key: Region_Key Fact key: Region_Key Levels: Region, Country, State, City
Region
Hierarchy Name : RegionDim Caption: Region Drill Path: Region, Country, State, City
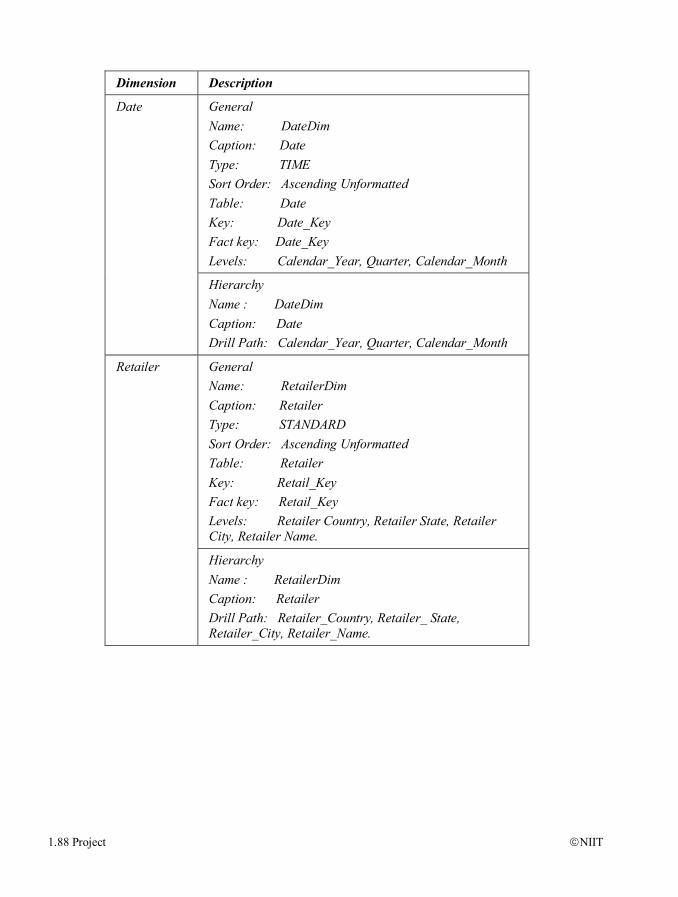
1.88 Project NIIT
Dimension Description
General Name: DateDim Caption: Date Type: TIME Sort Order: Ascending Unformatted Table: Date Key: Date_Key Fact key: Date_Key Levels: Calendar_Year, Quarter, Calendar_Month
Date
Hierarchy Name : DateDim Caption: Date Drill Path: Calendar_Year, Quarter, Calendar_Month
General Name: RetailerDim Caption: Retailer Type: STANDARD Sort Order: Ascending Unformatted Table: Retailer Key: Retail_Key Fact key: Retail_Key Levels: Retailer Country, Retailer State, Retailer City, Retailer Name.
Retailer
Hierarchy Name : RetailerDim Caption: Retailer Drill Path: Retailer_Country, Retailer_ State, Retailer_City, Retailer_Name.
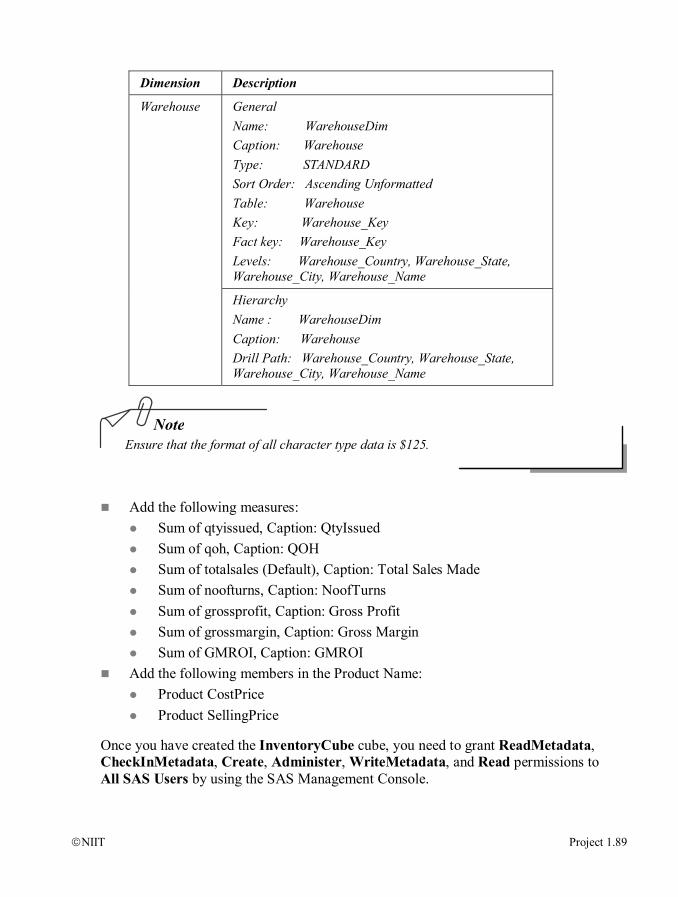
NIIT Project 1.89
Note
Dimension Description
General Name: WarehouseDim Caption: Warehouse Type: STANDARD Sort Order: Ascending Unformatted Table: Warehouse Key: Warehouse_Key Fact key: Warehouse_Key Levels: Warehouse_Country, Warehouse_State, Warehouse_City, Warehouse_Name
Warehouse
Hierarchy Name : WarehouseDim Caption: Warehouse Drill Path: Warehouse_Country, Warehouse_State, Warehouse_City, Warehouse_Name
Ensure that the format of all character type data is $125.
Add the following measures:
Sum of qtyissued, Caption: QtyIssued Sum of qoh, Caption: QOH Sum of totalsales (Default), Caption: Total Sales Made Sum of noofturns, Caption: NoofTurns Sum of grossprofit, Caption: Gross Profit Sum of grossmargin, Caption: Gross Margin Sum of GMROI, Caption: GMROI
Add the following members in the Product Name: Product CostPrice Product SellingPrice
Once you have created the InventoryCube cube, you need to grant ReadMetadata, CheckInMetadata, Create, Administer, WriteMetadata, and Read permissions to All SAS Users by using the SAS Management Console.

1.90 Project NIIT
FAQ
Q: When I try to view the calculated members against any attribute, it shows no value or a #VALUE!. What could be the reason?
A: You need to check your MDX scripts. Probably you have not used the correct hierarchies while identifying your measures or members. Therefore, your calculated member is unable to identify them correctly.]
Q: In my cube I used the Product, Retailer, Region, Date, and Warehouse dimensions, and the Inventory_fact fact table. But in my cube browser, for some product categories, it shows “#-INDIV!” for my calculated fields. What could be the problem?
A: In the sample case study, we want to view the GMROI for the products sold to retailers. Therefore, the products that we require in our cube are those which have an associated selling price. If the Product dimension is used in the cube, the values for Total Sales Made, No. of Turns, Gross Profit, Gross Margin and GMROI will show “#-INDIV!”. These values indicate that the selling price for that product is zero.
To solve this problem, you need to create two views: vwProduct: A view that is created on the Product dimension. It contains only
those products where the UnitSellingPrice > 0. vwInventory_fact: A view that is created on the main Inventory_fact table. It will
contain only those rows of those products where the UnitSellingPrice > 0. This can be achieved by using joining this view with the vwProduct view.
While creating the data source view for the cube, instead of choosing Product dimension, choose vwProduct, and instead of choosing the Inventory_fact fact table, choose vwInventory. The remaining dimensions remain the same.
The dimensions and the fact table are not related to one another and will appear as separate tables. To relate them, you need to drag the keys from the fact table and drop them onto the relevant dimension tables. It will automatically create a relationship. Then, you can create your cube based on this data source view.
Case Study 2: Sales and Marketing Management System (SMMS)
The students will use the SAS EIP tools to generate their reports.
Case Study 3: Vendor Management System (VMS)
The students will use the SAS EIP tools to generate their reports.
NIIT Project 1.91
S.No. Task Plan Time (Minutes) Sub Tasks to be Completed
1 Identify various reports 110
Total 110
In this session, the students will identify and document the dimensions, fact tables, and cubes to be used for the report generation.
Session - 14
Session Inputs
1.92 Project NIIT
S.No. Task Plan Time (Minutes) Sub Tasks to be Completed
1 Generate the following reports by using SAS Enterprise Guide: 1.Report showing Total Sales Made, Product_ Category, Product_ Subcategory, and Product_ Name, and Region columns 2. Report showing Total Sales Made in each Quarter
110
Total 110
In this session, the students will create the end reports to be submitted as per the case study by using SAS Enterprise Guide.
To generate the reports in SAS Enterprise Guide, you need to perform the following steps: 1. Select Start All Programs SAS Enterprise Guide 4. The Welcome to
SAS Enterprise Guide window appears. 2. Click the New Project option under the New section of the Welcome to SAS
Enterprise Guide window. The focus shifts to the SAS Enterprise Guide window.
3. Select File Open OLAP Cube. The OLAP Cube Login dialog box appears. 4. Ensure that the BIREV03 option is selected in the OLAP Server Name combo
box. 5. Ensure that the SAS OLAP Data Provider 9.1 option is selected in the Provider
drop-down list. 6. Type Raymond in the User Name text box. 7. Enter Student1 in the Password text box. 8. Click the Connect button. The Open OLAP Cube window appears. 9. Select the Inventory_Cube check box from the Cubes column. 10. Click the Open button. The Inventory_Cube (FOUNDATION) cube appears in
the Workspace area.
Session - 15
Session Inputs
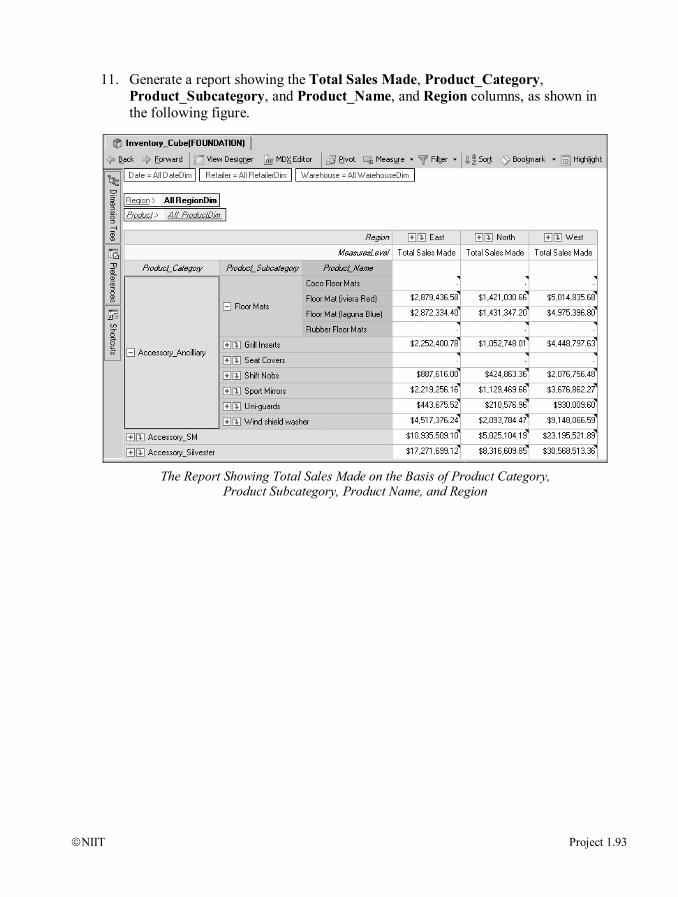
NIIT Project 1.93
11. Generate a report showing the Total Sales Made, Product_Category, Product_Subcategory, and Product_Name, and Region columns, as shown in the following figure.
The Report Showing Total Sales Made on the Basis of Product Category,
Product Subcategory, Product Name, and Region

1.94 Project NIIT
Similarly, perform Step No. 3 to 10, to generate a report showing Total Sales Made in each Quarter, as shown in the following figure.
The Report Showing the Total Sales Made in Each Quarter

NIIT Project 1.95
S.No. Task Plan Time (Minutes) Sub Tasks to be Completed
1 Generate a report showing Total Sales Made based on Region, Retailer, and Product by using SAS AddIn for Microsoft Office
110
Total 110
In this session, the students will create the end reports to be submitted as per the case study by using SAS AddIn for Microsoft Office.
To generate a report showing total sales made based on Product Category, Retailer, and Warehouse by using SAS AddIn for Microsoft Office, you need to perform the following tasks: 1. Create an Information Map by using SAS Information Map Studio. 2. Display the report by using SAS AddIn for Microsoft Office.
Task 1: Creating an Information Map by Using SAS Inforamtion Map Studio
To create an Information Map, you need to perform the following steps: 1. Select Start All Programs SAS SAS Information Map Studio 3.1. The
Open Metadata Profile window appears. 2. Ensure that Open an existing metadata profile option is selected. 3. Ensure that Inventory Profile is selected in the drop-down list. 4. Click the OK button. The Login dialog box appears. 5. Type Raymond in the User ID text box. 6. Type Student1 in the Password text box. 7. Click the OK button. The SAS Information Map Studio window appears. 8. Select Insert Table from the standard toolbar. The Insert Table dialog box
appears. 9. Select the inventory_odbc_library library. 10. Click the OK button. The focus shifts to the SAS Information Map window. 11. Double-click the Inventory_Fact, Product, Retail, and Warehouse tables in the
Physical Data section.
Session - 16
Session Inputs
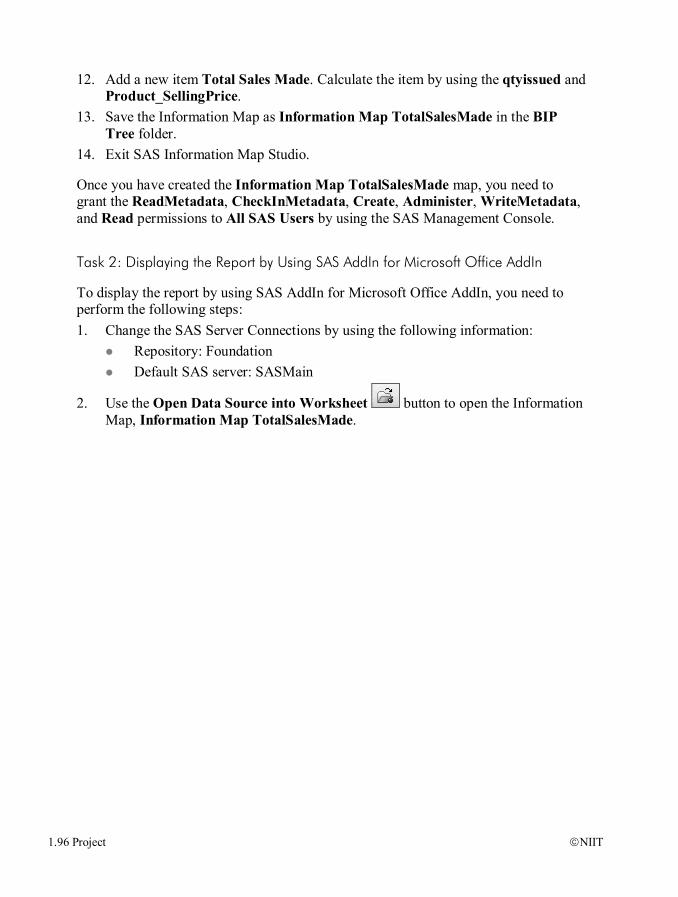
1.96 Project NIIT
12. Add a new item Total Sales Made. Calculate the item by using the qtyissued and Product_SellingPrice.
13. Save the Information Map as Information Map TotalSalesMade in the BIP Tree folder.
14. Exit SAS Information Map Studio.
Once you have created the Information Map TotalSalesMade map, you need to grant the ReadMetadata, CheckInMetadata, Create, Administer, WriteMetadata, and Read permissions to All SAS Users by using the SAS Management Console.
Task 2: Displaying the Report by Using SAS AddIn for Microsoft Office AddIn
To display the report by using SAS AddIn for Microsoft Office AddIn, you need to perform the following steps: 1. Change the SAS Server Connections by using the following information:
Repository: Foundation Default SAS server: SASMain
2. Use the Open Data Source into Worksheet button to open the Information Map, Information Map TotalSalesMade.
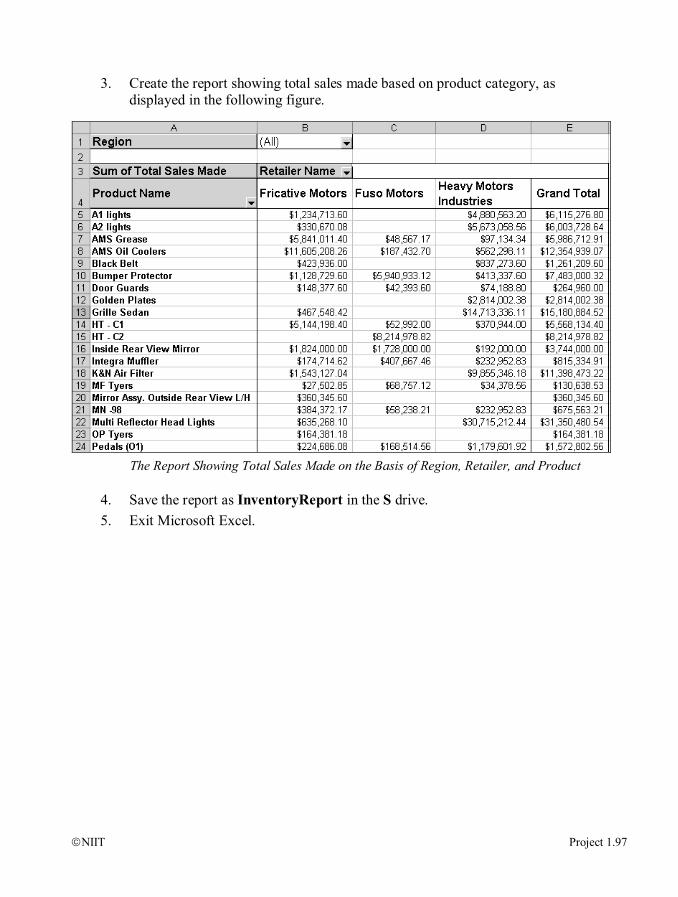
NIIT Project 1.97
3. Create the report showing total sales made based on product category, as displayed in the following figure.
The Report Showing Total Sales Made on the Basis of Region, Retailer, and Product
4. Save the report as InventoryReport in the S drive. 5. Exit Microsoft Excel.
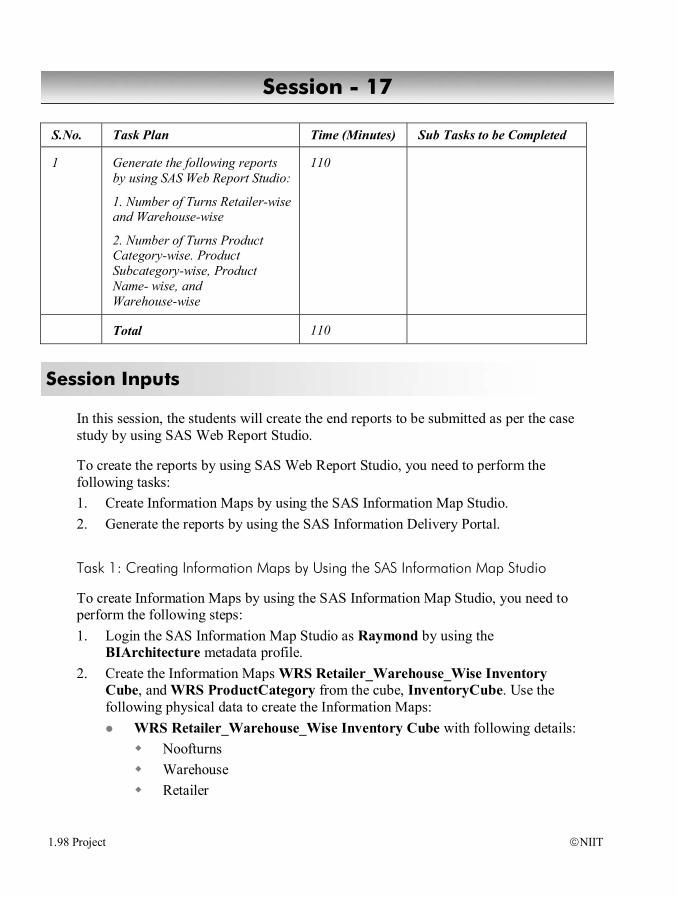
1.98 Project NIIT
S.No. Task Plan Time (Minutes) Sub Tasks to be Completed
1 Generate the following reports by using SAS Web Report Studio:
1. Number of Turns Retailer-wise and Warehouse-wise
2. Number of Turns Product Category-wise. Product Subcategory-wise, Product Name- wise, and Warehouse-wise
110
Total 110
In this session, the students will create the end reports to be submitted as per the case study by using SAS Web Report Studio.
To create the reports by using SAS Web Report Studio, you need to perform the following tasks: 1. Create Information Maps by using the SAS Information Map Studio. 2. Generate the reports by using the SAS Information Delivery Portal.
Task 1: Creating Information Maps by Using the SAS Information Map Studio
To create Information Maps by using the SAS Information Map Studio, you need to perform the following steps: 1. Login the SAS Information Map Studio as Raymond by using the
BIArchitecture metadata profile. 2. Create the Information Maps WRS Retailer_Warehouse_Wise Inventory
Cube, and WRS ProductCategory from the cube, InventoryCube. Use the following physical data to create the Information Maps:
WRS Retailer_Warehouse_Wise Inventory Cube with following details: Noofturns Warehouse Retailer
Session - 17
Session Inputs
NIIT Project 1.99
WRS ProductCategory with following details: Noofturns Warehouse Product
3. Save both the Information Maps in the BIP Tree ReportStudio Users Maps folder.
4. Grant the ReadMetadata, CheckInMetadata, Create, Administer, WriteMetadata, and Read permissions to All SAS Users to the WRS Retailer_Warehouse_Wise Inventory Cube and WRS ProductCategory Information Maps.
5. Exit SAS Information Map Studio.
Task 2: Generate the Reports by Using the SAS Information Delivery Portal
To generate the reports by using the SAS Information Delivery Portal, you need to perform the following steps: 1. Log in to the Web Report Studio as Ron.

1.100 Project NIIT
2. Create a new report, Report Retailer_Warehouse_Wise Inventory Cube, by using the Information Map, WRS Retailer_Warehouse_Wise Inventory Cube, as shown in the following figure.
The Report Showing Number of Turns on the Basis of Retailer and Warehouse
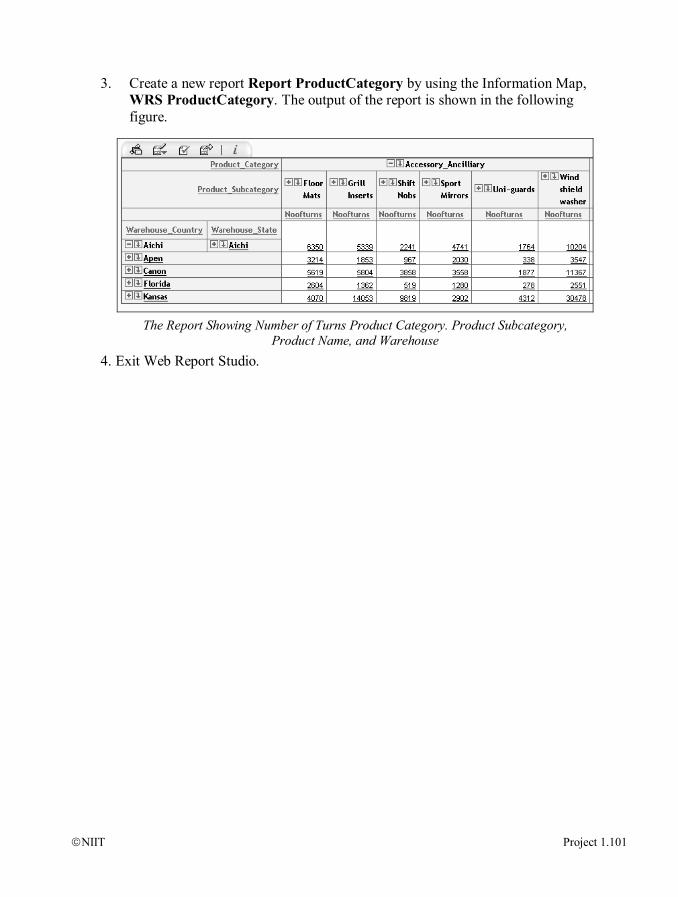
NIIT Project 1.101
3. Create a new report Report ProductCategory by using the Information Map, WRS ProductCategory. The output of the report is shown in the following figure.
The Report Showing Number of Turns Product Category. Product Subcategory,
Product Name, and Warehouse
4. Exit Web Report Studio.
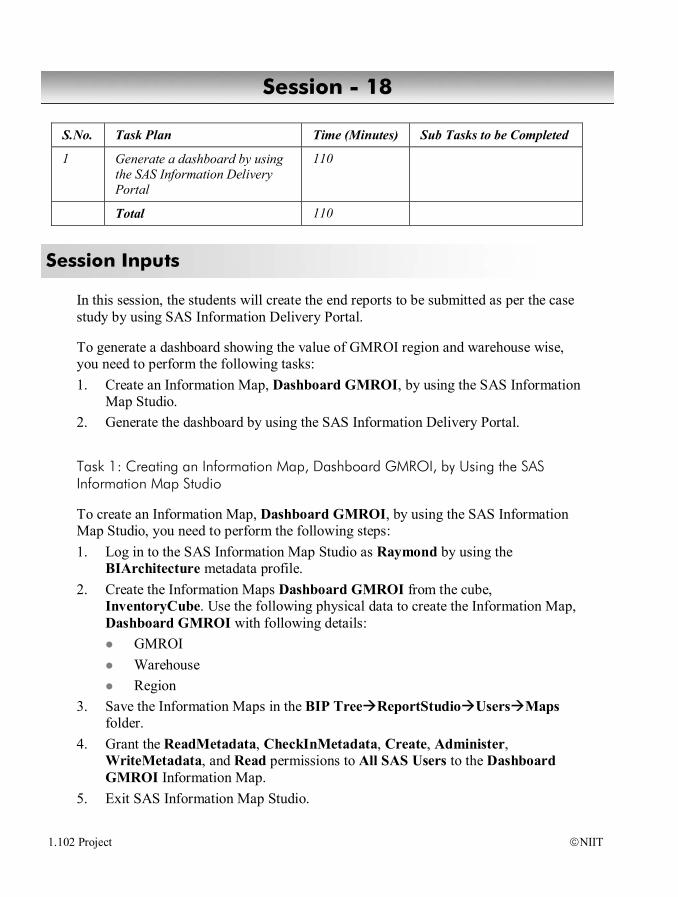
1.102 Project NIIT
S.No. Task Plan Time (Minutes) Sub Tasks to be Completed
1 Generate a dashboard by using the SAS Information Delivery Portal
110
Total 110
In this session, the students will create the end reports to be submitted as per the case study by using SAS Information Delivery Portal.
To generate a dashboard showing the value of GMROI region and warehouse wise, you need to perform the following tasks: 1. Create an Information Map, Dashboard GMROI, by using the SAS Information
Map Studio. 2. Generate the dashboard by using the SAS Information Delivery Portal.
Task 1: Creating an Information Map, Dashboard GMROI, by Using the SAS Information Map Studio
To create an Information Map, Dashboard GMROI, by using the SAS Information Map Studio, you need to perform the following steps: 1. Log in to the SAS Information Map Studio as Raymond by using the
BIArchitecture metadata profile. 2. Create the Information Maps Dashboard GMROI from the cube,
InventoryCube. Use the following physical data to create the Information Map, Dashboard GMROI with following details:
GMROI Warehouse Region
3. Save the Information Maps in the BIP Tree ReportStudio Users Maps folder.
4. Grant the ReadMetadata, CheckInMetadata, Create, Administer, WriteMetadata, and Read permissions to All SAS Users to the Dashboard GMROI Information Map.
5. Exit SAS Information Map Studio.
Session - 18
Session Inputs
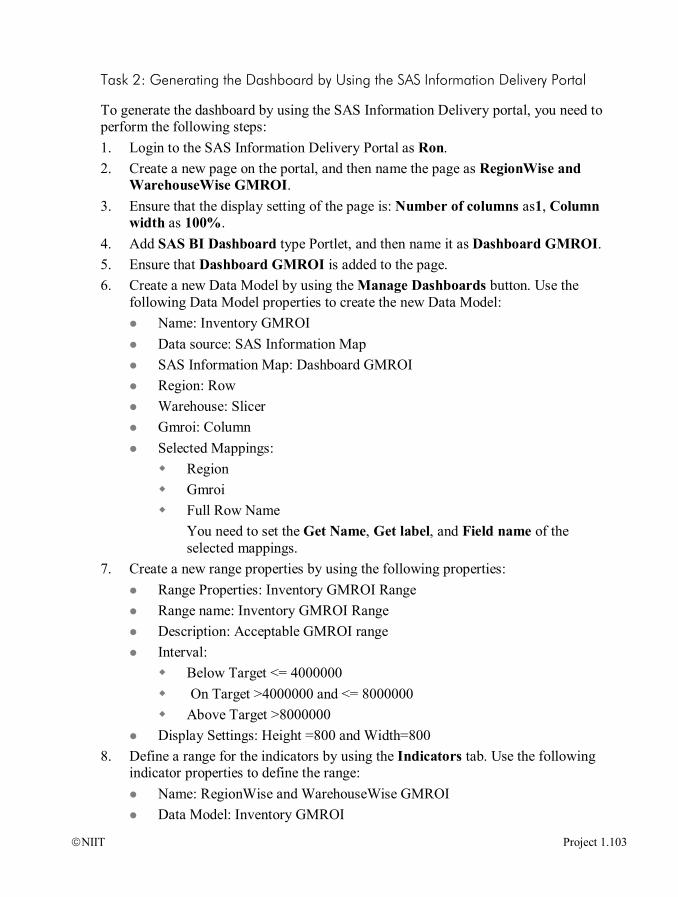
NIIT Project 1.103
Task 2: Generating the Dashboard by Using the SAS Information Delivery Portal
To generate the dashboard by using the SAS Information Delivery portal, you need to perform the following steps: 1. Login to the SAS Information Delivery Portal as Ron. 2. Create a new page on the portal, and then name the page as RegionWise and
WarehouseWise GMROI. 3. Ensure that the display setting of the page is: Number of columns as1, Column
width as 100%. 4. Add SAS BI Dashboard type Portlet, and then name it as Dashboard GMROI. 5. Ensure that Dashboard GMROI is added to the page. 6. Create a new Data Model by using the Manage Dashboards button. Use the
following Data Model properties to create the new Data Model: Name: Inventory GMROI Data source: SAS Information Map SAS Information Map: Dashboard GMROI Region: Row Warehouse: Slicer Gmroi: Column Selected Mappings:
Region Gmroi Full Row Name
You need to set the Get Name, Get label, and Field name of the selected mappings.
7. Create a new range properties by using the following properties: Range Properties: Inventory GMROI Range Range name: Inventory GMROI Range Description: Acceptable GMROI range Interval:
Below Target <= 4000000 On Target >4000000 and <= 8000000 Above Target >8000000
Display Settings: Height =800 and Width=800 8. Define a range for the indicators by using the Indicators tab. Use the following
indicator properties to define the range: Name: RegionWise and WarehouseWise GMROI Data Model: Inventory GMROI
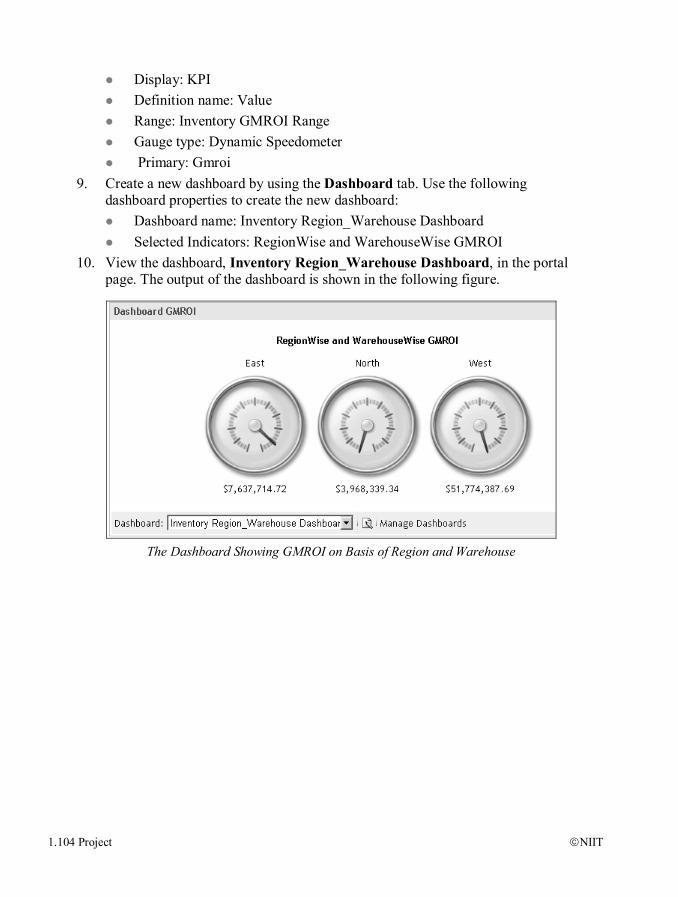
1.104 Project NIIT
Display: KPI Definition name: Value Range: Inventory GMROI Range Gauge type: Dynamic Speedometer Primary: Gmroi
9. Create a new dashboard by using the Dashboard tab. Use the following dashboard properties to create the new dashboard:
Dashboard name: Inventory Region_Warehouse Dashboard Selected Indicators: RegionWise and WarehouseWise GMROI
10. View the dashboard, Inventory Region_Warehouse Dashboard, in the portal page. The output of the dashboard is shown in the following figure.
The Dashboard Showing GMROI on Basis of Region and Warehouse
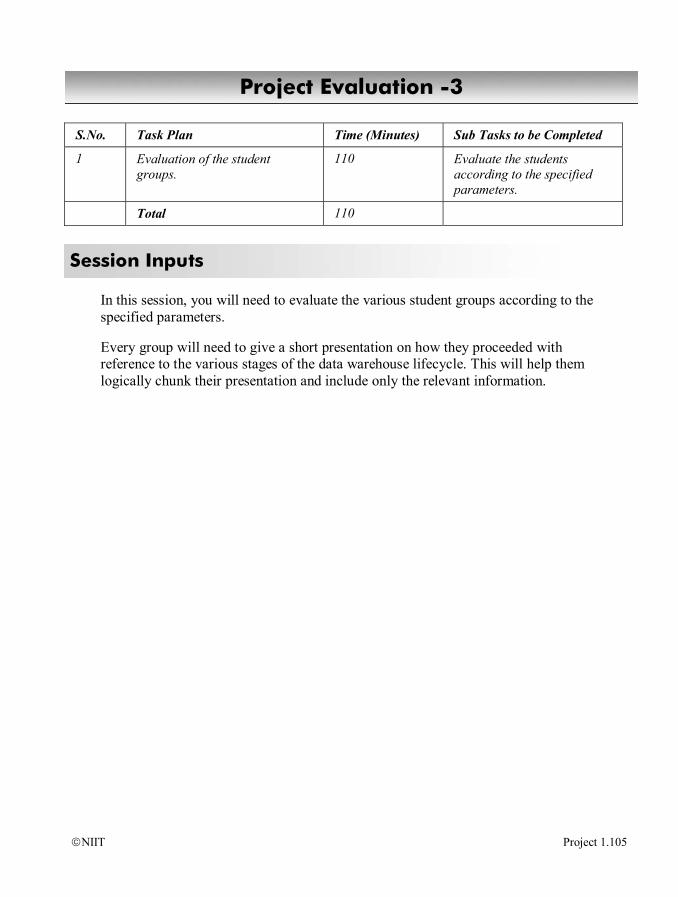
NIIT Project 1.105
S.No. Task Plan Time (Minutes) Sub Tasks to be Completed
1 Evaluation of the student groups.
110 Evaluate the students according to the specified parameters.
Total 110
In this session, you will need to evaluate the various student groups according to the specified parameters.
Every group will need to give a short presentation on how they proceeded with reference to the various stages of the data warehouse lifecycle. This will help them logically chunk their presentation and include only the relevant information.
Project Evaluation -3
Session Inputs
1.106 Project NIIT
PROJECT ON Speedster Motors Corporation – Inventory Management System
Developed by Name: Michael John Reg. No.: 6709-50-386
Sample Project Documentation: Inventory Management System
NIIT Project 1.107
Inventory Management System
Batch Code : B010101
Start Date : Dec 1, 2005 End Date: March 10, 2006
Name of the Coordinator : Alex Norton
Names of the Developer : Michael John
Date of Submission : March 10, 2005

1.108 Project NIIT
CERTIFICATE
This is to certify that this report, titled Speedster Motor Corporation – Inventory Management System, embodies the original work done by Michael John in partial fulfillment of his course requirement at NIIT.
Coordinator:
Alex Norton
NIIT Project 1.109
ACKNOWLEDGEMENT
Note: We have benefited a lot from the feedback and suggestions given to us by Mr. Alex Norton and other faculty members.

1.110 Project NIIT
REQUIREMENTS ANALYSIS DOCUMENT
Company Name Speedster Motors Corp. (SM Corp)
Name of the Data Warehouse Project
Inventory Management Project
Document Version 1
Starting Month of the Project 12/01/2005
Duration of the Data Warehouse Project
6 months
Business Overview Established in 1950, Speedster Motor Corp., a automobile manufacturing company, is a pioneer and global leader in automobile industry for more than 50 years. The company has well-established manufacturing units in 10 countries and its vehicles are sold in 33 countries. It has strength of 113,000 employees across the globe.
Business Objective To constantly improve manufacturing processes for making quality products for its customers and generating growth and ensuring a healthy working environment for all the employees.
Planned Budget for the Data Warehouse Project
$550,000
Architectural Approach Data Mart/Bottom-up Approach
Business Requirement The top management of Speedster Motor Corp. wants to analyze their chain profitability as another new initiative to improve the performance and health statistics of the company.
In other words, currently, the management is unable to segregate the profitable storage warehouses from the least profitable ones.

NIIT Project 1.111
Company Name Speedster Motors Corp. (SM Corp)
Identifying the profitable storage warehouses will enable the management to:
Critical Business Problems
1) Individual IMS have created SILOS of information
2) Management cannot access the reports generated by the IMS of one manufacturing unit in real time
3) Unavailability of archived data for analysis
4) Cannot predict future requirements
Analytic Requirement
1) Gross Margin for Every product category wise as well as sub category wise across all storage warehouse
2) Compare gross margin for all products in the existing storage warehouses
3) Segregate profitable storage warehouses and optimize inventory levels
End Users Expected number of end-users of the data warehouse is 700 but, currently, the data warehouse can support 500 end users.
CEO, Vice Presidents, Regional Materials Managers, Business Analyst, Database Administrators, and Data Entry Operators.
The end users are connected through LAN and WAN.
User-friendly end user application tools need to be built.
The end users are located at different locations and in different time zones.
End User Training Training on data warehouse usage is required for the end users.
Specific Reports used by the End Users
Gross Margin Return on Investment (GMROI) for each warehouse region-wise and country-wise.
Gross Margin Return on Investment (GMROI) for each warehouse product-wise.

1.112 Project NIIT
Company Name Speedster Motors Corp. (SM Corp)
Analysis of Reports These reports indicate the health of the storage warehouses of each manufacturing unit.
A high value of GMROI indicates that the products are moving through the storage warehouses quickly and, therefore, the storage warehouse is profitable. On the other hand, a low value of GMROI indicates that the products are moving through the store slowly and, therefore, the storage warehouse is non-profitable.
Data Sources Data source 1: Excel
Data source 2: Excel
Data source 3: Access
Data source 4: SQL
The various data sources contain data spanning the year 1985-2007.
Size of the Data Sources 92 MB, approximately
Data Availability No issues in accessing data from the year 1985 onwards. Data prior to 1985 not available.
System Requirement Two Hewlett Packard LXR8000 class servers for data warehouse. One of the servers will be used to create the warehouse and cubes every month. The second server will be the read-only server, allowing the new data to be reprocessed without impacting the users. The LXR8000s are 4-processor, 500 megahertz (MHz) Pentium III Xeon servers with 4 GB of RAM, 1 terabyte of disk space, and approximately 600 GB of disk space on the second production data warehouse server.
One Hewlett Packard LH4 class servers for the OLAP server. The LH4s include 2-processor with 500 MHz Pentium III Xeon Servers having 1 to 2 GB of RAM. The OLAP cubes can be built on the LXR 8000 and, then, restored to these smaller OLAP servers to free up the build server to process the next month’s data.
Resource Requirement Five developers/administrators for developing the BI solution
From the second year, two developers/administrators required to maintain the solution
NIIT Project 1.113
Company Name Speedster Motors Corp. (SM Corp)
Success Criteria of the data warehouse project
Access to more than 10 years of historical data for analysis
End users training will not take much time for the data warehouse project
Considerable support can be obtained from the business sponsor
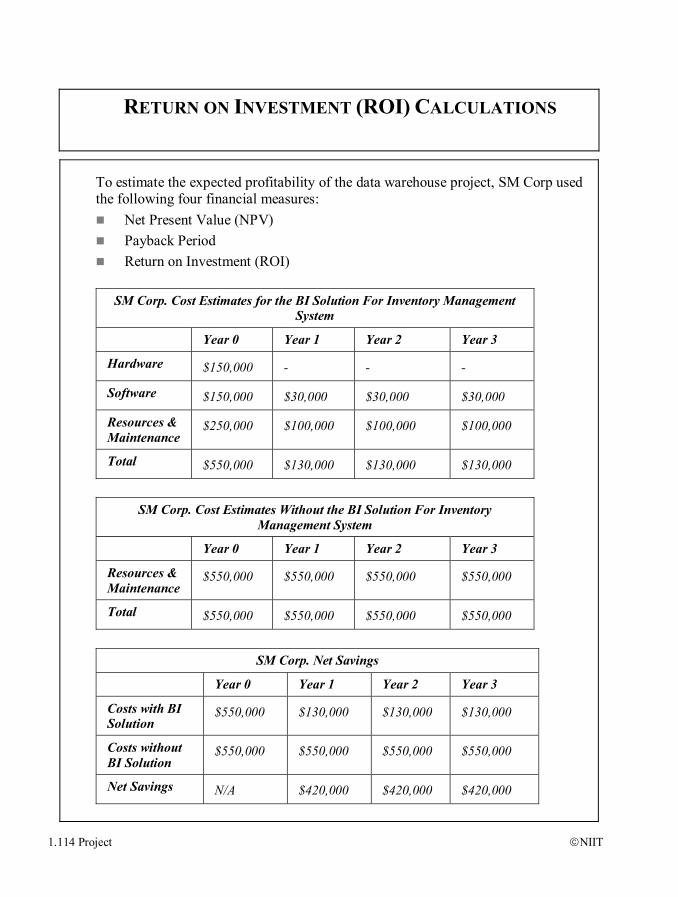
1.114 Project NIIT
RETURN ON INVESTMENT (ROI) CALCULATIONS
To estimate the expected profitability of the data warehouse project, SM Corp used the following four financial measures:
Net Present Value (NPV) Payback Period Return on Investment (ROI)
SM Corp. Cost Estimates for the BI Solution For Inventory Management
System
Year 0 Year 1 Year 2 Year 3
Hardware $150,000 - - -
Software $150,000 $30,000 $30,000 $30,000
Resources & Maintenance
$250,000 $100,000 $100,000 $100,000
Total $550,000 $130,000 $130,000 $130,000
SM Corp. Cost Estimates Without the BI Solution For Inventory
Management System
Year 0 Year 1 Year 2 Year 3
Resources & Maintenance
$550,000 $550,000 $550,000 $550,000
Total $550,000 $550,000 $550,000 $550,000
SM Corp. Net Savings
Year 0 Year 1 Year 2 Year 3
Costs with BI Solution
$550,000 $130,000 $130,000 $130,000
Costs without BI Solution
$550,000 $550,000 $550,000 $550,000
Net Savings N/A $420,000 $420,000 $420,000
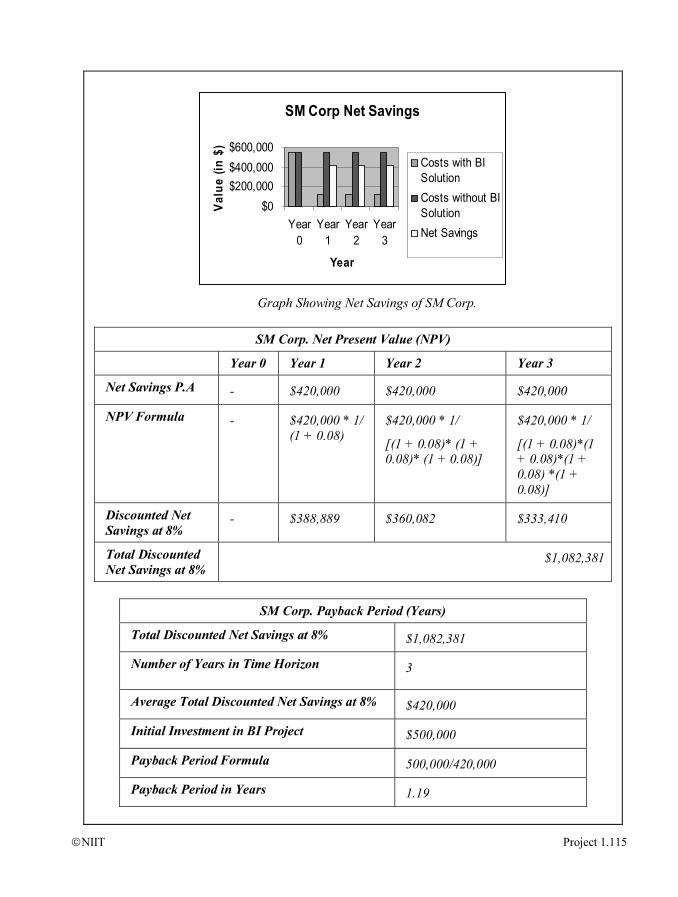
NIIT Project 1.115
SM Corp Net Savings
$0$200,000$400,000$600,000
Year0
Year1
Year2
Year3
Year
Valu
e (in
$)
Costs with BISolutionCosts without BISolutionNet Savings
Graph Showing Net Savings of SM Corp.
SM Corp. Net Present Value (NPV)
Year 0 Year 1 Year 2 Year 3
Net Savings P.A - $420,000 $420,000 $420,000
NPV Formula - $420,000 * 1/ (1 + 0.08)
$420,000 * 1/
[(1 + 0.08)* (1 + 0.08)* (1 + 0.08)]
$420,000 * 1/
[(1 + 0.08)*(1 + 0.08)*(1 + 0.08) *(1 + 0.08)]
Discounted Net Savings at 8%
- $388,889 $360,082 $333,410
Total Discounted Net Savings at 8%
$1,082,381
SM Corp. Payback Period (Years)
Total Discounted Net Savings at 8% $1,082,381
Number of Years in Time Horizon 3
Average Total Discounted Net Savings at 8% $420,000
Initial Investment in BI Project $500,000
Payback Period Formula 500,000/420,000
Payback Period in Years 1.19

1.116 Project NIIT
SM Corp Return on Investment (ROI)
Total Discounted Net Savings at 8% $1,082,381
Initial Investment in BI Project $500,000
ROI Formula (1,082,381/ 500,000) * 100
ROI 216 %

NIIT Project 1.117
DATA SOURCES ANALYSIS DOCUMENT
The following data sources are analyzed to create the data sources analysis document:
MS Excel Sources: From Year 1985 to 1989 MS Excel Sources: From Year 1990 to 1994 MS Access Sources: From Year 1995 to 1999 MS SQL 200 Source: From Year 2000 till date

1.118 Project NIIT
MS Excel Sources: From Year 1985 to 1989
Spreadsheet Name Table Name Column Name Data Type
1985_1989_US_Kansas.xls
Products product_name Text
Products Category Text
Products Subcategory Text
Products UnitCostPrice Number
Products UnitSellingPrice Number
Products ReOrder level Text
Products ReOrder Qty Text
Products QtyonHand Text
InventoryIssued product_ name Text
InventoryIssued qty_issued Number
InventoryIssued issued_by Text
InventoryIssued date_issued date
InventoryIssued issued_to Text
InventoryIssued Retailer_name Text
InventoryIssued Retailer_address Text
InventoryIssued Retailer_phone Text
InventoryIssued Retailer_state Text
InventoryIssued Retailer_country Text
MS Excel Sources: From Year 1990 to 1994
Spreadsheet Name Table Name Column Name Data Type
WarehouseKansas.xls product Category Text
product subcategory Text
product Product_name Text
product product_model Text
product unit Number
product Qty_per_unit Number
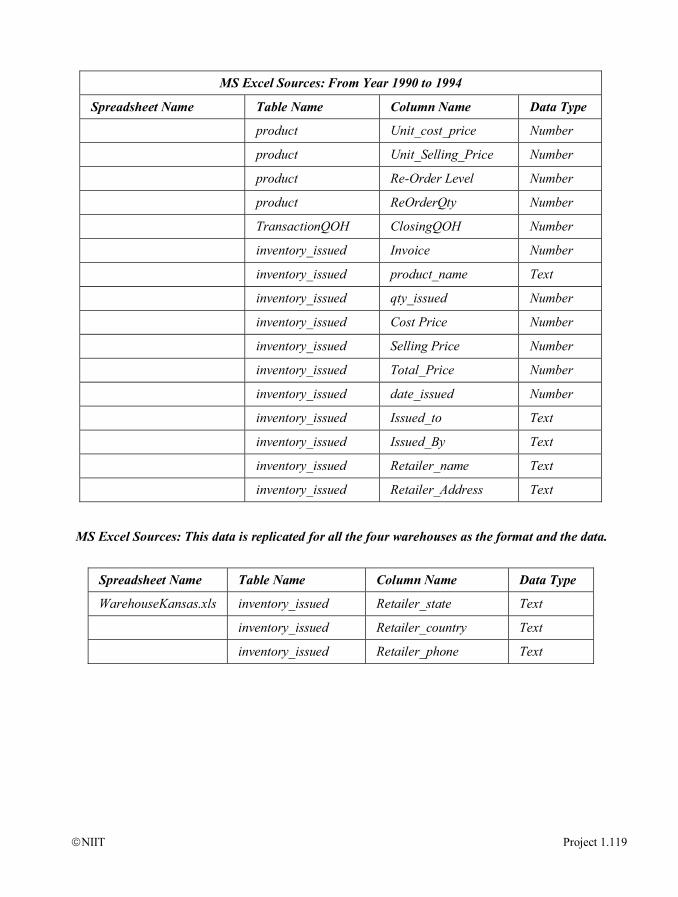
NIIT Project 1.119
MS Excel Sources: From Year 1990 to 1994
Spreadsheet Name Table Name Column Name Data Type
product Unit_cost_price Number
product Unit_Selling_Price Number
product Re-Order Level Number
product ReOrderQty Number
TransactionQOH ClosingQOH Number
inventory_issued Invoice Number
inventory_issued product_name Text
inventory_issued qty_issued Number
inventory_issued Cost Price Number
inventory_issued Selling Price Number
inventory_issued Total_Price Number
inventory_issued date_issued Number
inventory_issued Issued_to Text
inventory_issued Issued_By Text
inventory_issued Retailer_name Text
inventory_issued Retailer_Address Text
MS Excel Sources: This data is replicated for all the four warehouses as the format and the data.
Spreadsheet Name Table Name Column Name Data Type
WarehouseKansas.xls inventory_issued Retailer_state Text
inventory_issued Retailer_country Text
inventory_issued Retailer_phone Text
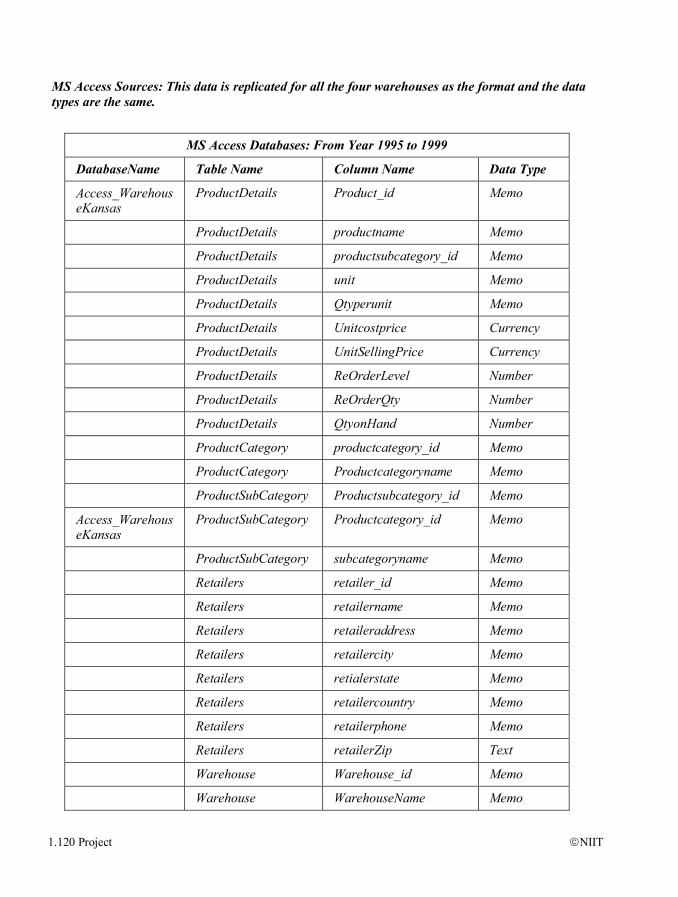
1.120 Project NIIT
MS Access Sources: This data is replicated for all the four warehouses as the format and the data types are the same.
MS Access Databases: From Year 1995 to 1999
DatabaseName Table Name Column Name Data Type
Access_WarehouseKansas
ProductDetails Product_id Memo
ProductDetails productname Memo
ProductDetails productsubcategory_id Memo
ProductDetails unit Memo
ProductDetails Qtyperunit Memo
ProductDetails Unitcostprice Currency
ProductDetails UnitSellingPrice Currency
ProductDetails ReOrderLevel Number
ProductDetails ReOrderQty Number
ProductDetails QtyonHand Number
ProductCategory productcategory_id Memo
ProductCategory Productcategoryname Memo
ProductSubCategory Productsubcategory_id Memo
Access_WarehouseKansas
ProductSubCategory Productcategory_id Memo
ProductSubCategory subcategoryname Memo
Retailers retailer_id Memo
Retailers retailername Memo
Retailers retaileraddress Memo
Retailers retailercity Memo
Retailers retialerstate Memo
Retailers retailercountry Memo
Retailers retailerphone Memo
Retailers retailerZip Text
Warehouse Warehouse_id Memo
Warehouse WarehouseName Memo
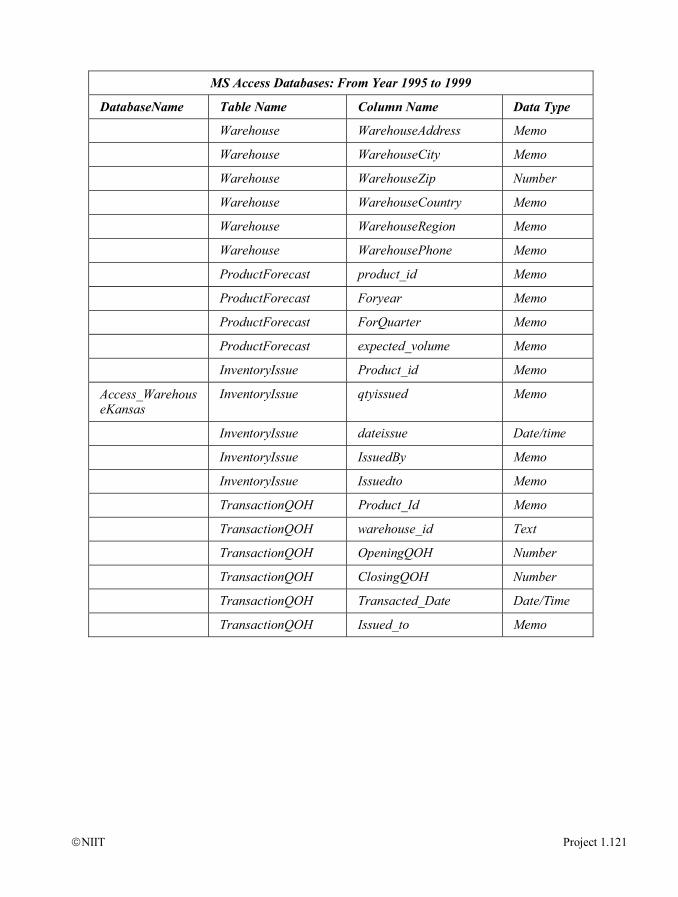
NIIT Project 1.121
MS Access Databases: From Year 1995 to 1999
DatabaseName Table Name Column Name Data Type
Warehouse WarehouseAddress Memo
Warehouse WarehouseCity Memo
Warehouse WarehouseZip Number
Warehouse WarehouseCountry Memo
Warehouse WarehouseRegion Memo
Warehouse WarehousePhone Memo
ProductForecast product_id Memo
ProductForecast Foryear Memo
ProductForecast ForQuarter Memo
ProductForecast expected_volume Memo
InventoryIssue Product_id Memo
Access_WarehouseKansas
InventoryIssue qtyissued Memo
InventoryIssue dateissue Date/time
InventoryIssue IssuedBy Memo
InventoryIssue Issuedto Memo
TransactionQOH Product_Id Memo
TransactionQOH warehouse_id Text
TransactionQOH OpeningQOH Number
TransactionQOH ClosingQOH Number
TransactionQOH Transacted_Date Date/Time
TransactionQOH Issued_to Memo
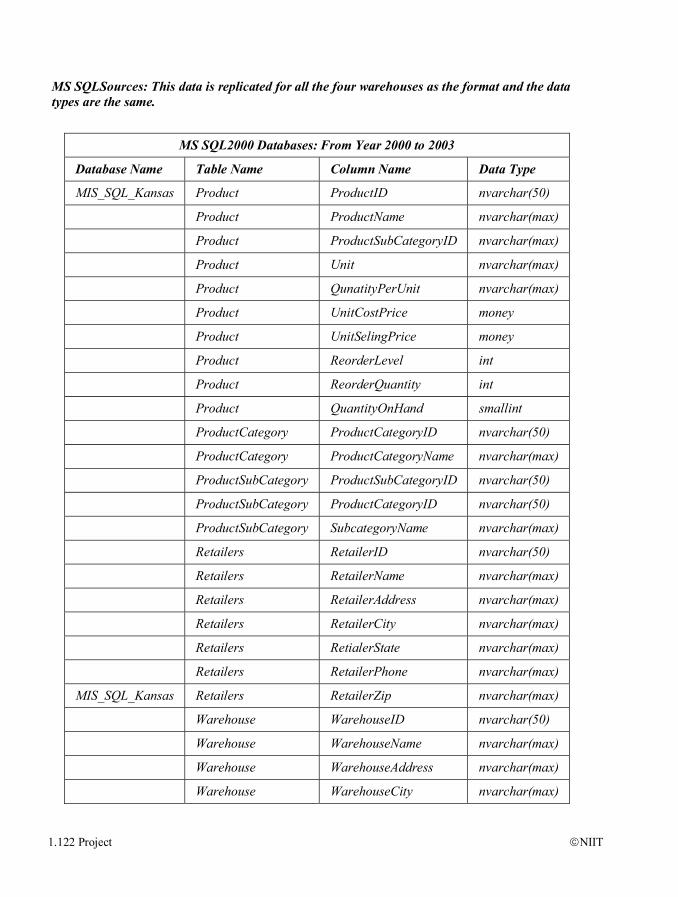
1.122 Project NIIT
MS SQLSources: This data is replicated for all the four warehouses as the format and the data types are the same.
MS SQL2000 Databases: From Year 2000 to 2003
Database Name Table Name Column Name Data Type
MIS_SQL_Kansas Product ProductID nvarchar(50)
Product ProductName nvarchar(max)
Product ProductSubCategoryID nvarchar(max)
Product Unit nvarchar(max)
Product QunatityPerUnit nvarchar(max)
Product UnitCostPrice money
Product UnitSelingPrice money
Product ReorderLevel int
Product ReorderQuantity int
Product QuantityOnHand smallint
ProductCategory ProductCategoryID nvarchar(50)
ProductCategory ProductCategoryName nvarchar(max)
ProductSubCategory ProductSubCategoryID nvarchar(50)
ProductSubCategory ProductCategoryID nvarchar(50)
ProductSubCategory SubcategoryName nvarchar(max)
Retailers RetailerID nvarchar(50)
Retailers RetailerName nvarchar(max)
Retailers RetailerAddress nvarchar(max)
Retailers RetailerCity nvarchar(max)
Retailers RetialerState nvarchar(max)
Retailers RetailerPhone nvarchar(max)
MIS_SQL_Kansas Retailers RetailerZip nvarchar(max)
Warehouse WarehouseID nvarchar(50)
Warehouse WarehouseName nvarchar(max)
Warehouse WarehouseAddress nvarchar(max)
Warehouse WarehouseCity nvarchar(max)

NIIT Project 1.123
MS SQL2000 Databases: From Year 2000 to 2003
Database Name Table Name Column Name Data Type
Warehouse WarehouseZip nvarchar(max)
Warehouse WarehouseCountry nvarchar(max)
Warehouse WarehouseRegion nvarchar(max)
Warehouse WarehousePhone nvarchar(max)
InventoryIssue ProductID nvarchar(50)
InventoryIssue RetailerID nvarchar(50)
InventoryIssue WarehouseID nvarchar(50)
InventoryIssue QtyIssued int
InventoryIssue DateIssue Date/Time
InventoryIssue IssuedBy nvarchar(max)
InventoryIssue IssuedTo nvarchar(max)
TransactionQOH ProductID nvarchar(50)
TransactionQOH WarehouseID nvarchar(50)
TransactionQOH OpeningQOH Int
TransactionQOH ClosingQOH Int
TransactionQOH Transacted_Date Date/Time
TransactionQOH IssuedTo nvarchar(max)

1.124 Project NIIT
LOGICAL DIMENSIONAL MODEL
The logical data map and the solution files will be provided as data files.

NIIT Project 1.125
SAMPLE SNAPSHOTS OF REPORTS
The Report Showing Total Sales Made on the Basis of Product Category, Product
Subcategory, Product Name, and Region
The Report Showing Total Sales Made in Each Quarter

1.126 Project NIIT
The Report Showing Total Sales Made on the Basis of Region, Retailer, and Product

NIIT Project 1.127
The Report Showing Number of Turns on the Basis of Retailer and Warehouse
The Report Showing Number of Turns Product Category. Product Subcategory,
Product Name, and Warehouse

1.128 Project NIIT
The Dashboard Showing GMROI on Basis of Region and Warehouse
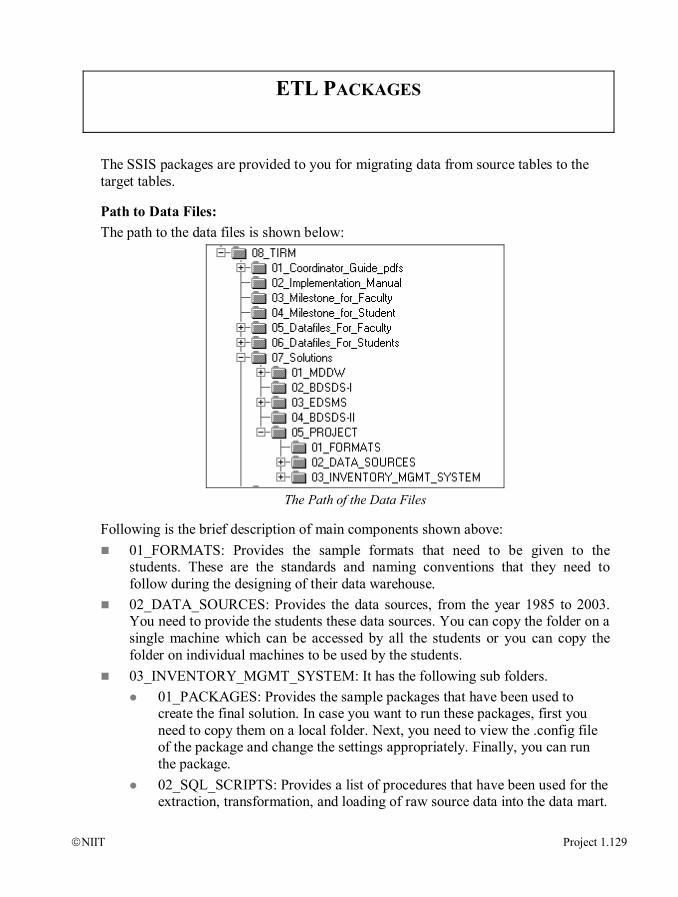
NIIT Project 1.129
ETL PACKAGES
The SSIS packages are provided to you for migrating data from source tables to the target tables.
Path to Data Files: The path to the data files is shown below:
The Path of the Data Files
Following is the brief description of main components shown above: 01_FORMATS: Provides the sample formats that need to be given to the
students. These are the standards and naming conventions that they need to follow during the designing of their data warehouse.
02_DATA_SOURCES: Provides the data sources, from the year 1985 to 2003. You need to provide the students these data sources. You can copy the folder on a single machine which can be accessed by all the students or you can copy the folder on individual machines to be used by the students.
03_INVENTORY_MGMT_SYSTEM: It has the following sub folders. 01_PACKAGES: Provides the sample packages that have been used to
create the final solution. In case you want to run these packages, first you need to copy them on a local folder. Next, you need to view the .config file of the package and change the settings appropriately. Finally, you can run the package.
02_SQL_SCRIPTS: Provides a list of procedures that have been used for the extraction, transformation, and loading of raw source data into the data mart.
1.130 Project NIIT
03_LOGICAL_DATA_MAP: Provides the Logical Data Map for the sample solution.
04_DATA_WAREHOUSE: Provides the sample inventory data mart. This is a .bak file that you will need to restore on your local machine. You will need to connect to this mart through SAS VHD to implement the final solution.