tackling nurse shortages in oecd countries steven … · tackling nurse shortages in oecd countries...
TRANSCRIPT
DELSA/ELSA/WD/HEA(2005)1
OECD HEALTH WORKING PAPERS
19
Tackling Nurse Shortages in OECD Countries Steven Simoens, Mike Villeneuve and Jeremy Hurst
Unclassified DELSA/ELSA/WD/HEA(2005)1 Organisation de Coopération et de Développement Economiques Organisation for Economic Co-operation and Development ___________________________________________________________________________________________
English - Or. English DIRECTORATE FOR EMPLOYMENT, LABOUR AND SOCIAL AFFAIRS EMPLOYMENT, LABOUR AND SOCIAL AFFAIRS COMMITTEE
OECD HEALTH WORKING PAPERS NO. 19 TACKLING NURSE SHORTAGES IN OECD COUNTRIES
Steven Simoens, Mike Villeneuve and Jeremy Hurst
Document complet disponible sur OLIS dans son format d'origine Complete document available on OLIS in its original format
DE
LSA
/EL
SA/W
D/H
EA
(2005)1 U
nclassified
English - O
r. English

DELSA/ELSA/WD/HEA(2005)1
DIRECTORATE FOR EMPLOYMENT, LABOUR AND SOCIAL AFFAIRS
OECD HEALTH WORKING PAPERS This series is designed to make available to a wider readership health studies prepared for use within the OECD. Authorship is usually collective, but principal writers are named. The papers are generally available only in their original language – English or French – with a summary in the other. Comment on the series is welcome, and should be sent to the Directorate for Employment, Labour and Social Affairs, 2, rue André-Pascal, 75775 PARIS CEDEX 16, France.
The opinions expressed and arguments employed here are the responsibility of the author(s) and do not necessarily reflect those of the OECD
Applications for permission to reproduce or translate all or part of this material should be made to:
Head of Publications Service
OECD 2, rue André-Pascal
75775 Paris, CEDEX 16 France
Copyright OECD 2005

DELSA/ELSA/WD/HEA(2005)1
ACKNOWLEDGEMENTS
The authors would like to express their gratitude to Stephane Jacobzone and Antonio Giuffrida who set up and were involved in the initial stages of the work programme leading to this report, to Karinne Logez who provided statistical assistance, and to Gery Coomans who designed and carried out the projections of the age structure of the nurse workforce. They are also grateful to the experts from participating countries who responded to questionnaires on policies and data, which provided much of the information contained in this paper. These experts attended two meetings of an Expert Group and provided guidance and feedback at various stages of the project. They include: Julian Evans, Hertha Rack, Dirk Moens, Robert Shearer, Jakob Preisler, Raimo Jamsen, Pascale Breuil, Thomas Hofmann, Lykourgos Liaropoulos, Kieran Feely, Masato Kumaki, Cho Sung-Hyun, Mariana Barraza-Llorens, Piet De Bekker, Gillian Anne Durham, Erling Steen, José Martins, Rosa Mataix, Ingalill Lutz, Yves Eggli, Keith Derbyshire, Marilyn Biviano and other national participants. The authors are indebted to Peter Scherer for his valuable comments on an earlier version of the paper.
DELSA/ELSA/WD/HEA(2005)1
SUMMARY
1. There are reports of current nurse shortages in all but a few OECD countries. With further increases in demand for nurses expected and nurse workforce ageing predicted to reduce the supply of nurses, shortages are likely to persist or even increase in the future, unless action is taken to increase flows into and reduce flows out of the workforce or to raise the productivity of nurses.
2. This paper analyses shortages of nurses in OECD countries. It defines and describes evidence on current nurse shortages, and analyses international variability in nurse employment. Additionally, a number of demand and supply factors that are likely to influence the existence and extent of any future nurse shortages are examined. In order to resolve nurse shortages, the paper compares and evaluates policy levers that decision makers can use to increase flows of nurses into the workforce, reduce flows out of the workforce, and improve nurse retention rates.
3. Although delayed market response may have been responsible for recurring cycles of shortages and surpluses of nurses in the past, current and future nurse shortages in OECD countries appear to be driven by a broader set of economic, demographic and sociological factors. In addition to delayed market response, current nurse shortages seem to be caused by fewer young people entering the workforce, a greater range of professional opportunities open to young people, the low social value given to nursing, negative perceptions of nurse working conditions and an ageing nurse workforce. Furthermore, demand for nurses has continued to increase due to ageing populations, increased consumer activism and rapid evolution of medical technologies.
4. To date, little is known about the cost-effectiveness of different policies to ensure an adequate supply of nurses. Both pay and conditions of service seem to influence flows of nurses into and out of the workforce, and nurse retention. Pay has been shown to influence entry into nursing school, participation of qualified nurses in the workforce, nurse retention, and exits from the workforce, although more work is needed to quantify the impacts of pay on these stocks and flows. Improvement in conditions of service, such as: offering flexible work and retirement arrangements; setting up family care initiatives; improving workforce management policies; creating a supportive organizational culture; enhancing career advancement prospects; also seem to have had some success in retaining nurses. Additionally, staffing levels seem to play a role in recruitment and retention, with evidence emerging that minimum nurse-to-patient ratios are associated with reduced nurse turnover and increased nursing school intake. There is also some research indicating that nurse shortages may be reduced by raising the proportion of nurses who are registered, without employing more overall.
5. Although there are signs that nurse shortages are set to worsen in the near future if policy action is not taken, this is not an inevitable outcome. Traditional policy responses that focus on one specific aspect of flows in or out of the workforce or retention, however, are unlikely to suffice. Instead, this paper points to the introduction of mixed policies that initiate innovative approaches to nurse education and training, offer strong incentives to recruit domestic and foreign nurses, raise productivity and make pay and conditions of service attractive enough to retain nurses of all ages.
DELSA/ELSA/WD/HEA(2005)1
1 RESUME
6. Tous les pays de l’OCDE, à l’exception de quelques-uns, font état d’une pénurie d’infirmières. Etant donné que la demande d’infirmières va vraisemblablement augmenter encore et que l’offre devrait diminuer sous l’effet du vieillissement de cette population, la pénurie est susceptible de persister, voire de s’aggraver dans l’avenir si des mesures ne sont pas prises pour accroître les flux d’entrées dans la profession et réduire le nombre de sorties, ou pour augmenter la productivité des infirmières.
7. Ce document présente une analyse de la pénurie d’infirmières que connaissent actuellement les pays de l’OCDE. Il rend compte des données disponibles sur ce phénomène et examine les différences entre pays dans le domaine de l’emploi infirmier. Il passe également en revue un certain nombre de facteurs qui agissent du côté de la demande et de l’offre et pourraient déterminer l’existence de futures pénuries d’infirmières et l’ampleur qu’elles auront. Afin d’apporter une solution à ce problème, les auteurs comparent et évaluent les mesures que les pouvoirs publics peuvent prendre pour accroître les flux d’entrées dans la population active infirmière, réduire les sorties et améliorer les taux de rétention du personnel infirmier.
8. La réaction tardive du marché est certes sans doute à l’origine des cycles de pénurie et d’excédent d’infirmières qui se sont produits dans le passé, mais il semble que le manque de personnel infirmier auquel les pays de l’OCDE sont et seront confrontés dans l’avenir soit induit par des facteurs plus divers, d’ordre économique, démographique et sociologique. Outre ce décalage dans la réaction du marché, la pénurie actuelle d’infirmières paraît tenir au fait que les jeunes sont moins nombreux à entrer dans la profession, qu’un plus large éventail de débouchés professionnels leur est offert, que le métier d’infirmière est socialement peu valorisé, que les conditions de travail du personnel infirmier sont perçues de façon négative et que ce dernier vieillit. De plus, la demande d’infirmières a continué de croître en raison du vieillissement de la population, d’une intensification de l’action de défense des consommateurs et de l’évolution rapide des technologies médicales.
9. Il existe pour le moment peu d’informations sur le rapport coût-efficacité des différentes politiques qui visent à assurer une offre d’infirmières suffisante. La rémunération et les conditions de travail, réunis, semblent influer sur les flux d’entrées dans la profession et les flux de sorties, ainsi que sur la rétention du personnel infirmier. Des études ont montré que la rémunération avait une incidence sur le nombre d’admissions dans les écoles d’infirmières, la décision des infirmières diplômées d’exercer, la rétention du personnel infirmier et les sorties de la profession, mais d’autres recherches sont nécessaires pour quantifier les effets de la rémunération sur ces stocks et flux. L’amélioration des conditions d’emploi, tels que : l’assouplissement des modalités de travail et de départ à la retraite, la mise en place des dispositifs d’aide aux familles, l’amélioration des politiques de gestion du personnel, la création d’une culture professionnelle favorable, l’amélioration des perspectives de carrière, semblent également avoir eu un succès dans la rétention du nombre d’infirmières. En outre, le niveau des effectifs paraît jouer un role dans le recrutement et la rétention ; en observant les faits, on commence à se rendre compte que lorsqu’il existe un rapport infirmières/patients minimum, la rotation du personnel infirmier est plus faible et les entrées dans les écoles d’infirmières plus nombreuses. Certaines études montrent aussi qu’il y aurait peut-être moyen de réduire la pénurie de personnel infirmier en augmentant la proportion d’infirmières pourvues d’un bon niveau de formation, sans en employer plus qu’il n’en faut.

DELSA/ELSA/WD/HEA(2005)1
10. Si la pénurie de personnel infirmier semble devoir s’aggraver dans un proche avenir en l’absence d’une intervention des pouvoirs publics, il est de toute évidence possible de s’attaquer à ce problème. Mais il est peu probable que les mesures classiques qui portent essentiellement sur un aspect précis des flux d’entrées ou de sorties dans la profession, ou de la rétention des effectifs, soient suffisantes. Les auteurs de ce document portent l’attention sur la mise en place de politiques mixtes qui permettent d’aborder la formation des infirmières de façon novatrice, d’encourager fortement le recrutement de personnel infirmier à l’intérieur et à l’extérieur du pays, d’augmenter la productivité et de rendre les salaires et les conditions d’emploi assez intéressants pour retenir dans la profession les infirmières de tous âges.
DELSA/ELSA/WD/HEA(2005)1
TABLE OF CONTENTS
ACKNOWLEDGEMENTS ............................................................................................................................3 SUMMARY ....................................................................................................................................................4 1 RESUME..................................................................................................................................................5 2 INTRODUCTION....................................................................................................................................9 3 IDENTIFYING NURSE SHORTAGES AND SURPLUSES...............................................................10
3.1 Demand for and supply of nurses in OECD countries ....................................................................10 3.2 International variability in nurse employment ................................................................................12 3.3 Evidence on current nurse shortages and surpluses in OECD countries.........................................18
4 FACTORS AFFECTING FUTURE DEMAND FOR AND SUPPLY OF NURSES ...........................18 4.1 Demand-side factors .......................................................................................................................19 4.2 Supply-side factors..........................................................................................................................20
5 POLICIES AFFECTING FLOWS IN AND OUT OF THE NURSE WORKFORCE..........................27 5.1 Increasing flows of nurses into the workforce ................................................................................27 5.2 Reducing flows of nurses out of the workforce ..............................................................................38
6 POLICIES AFFECTING NURSE RETENTION AND TURNOVER..................................................40 6.1 Factors affecting nurse turnover......................................................................................................40 6.2 Policies designed to improve nurse retention..................................................................................43
7 CONCLUDING REMARKS .................................................................................................................48 8 REFERENCES.......................................................................................................................................50 Figures
Figure 1. Flow chart of the contribution of nurse services to the production of health care ................11 Figure 2. Derived demand for and supply of nurses .............................................................................13 Figure 3. Nurse density, 2000 ...............................................................................................................14 Figure 4. Nurse density and health expenditure, 2000..........................................................................15 Figure 5. Proportion of registered and practical nurses in the workforce .............................................17 Figure 6. Evolution of nurse age structure in selected OECD countries, 2001-2021 ...........................22 Figure 8. Number of weekly hours worked by full-time and part-time nurses by age, 2000 ...............26 Figure 9. Admissions to the United Kingdom Central Council for Nursing register, 1984-2000 ........34
Boxes
Box 1. An economic definition of shortages and surpluses of nurses .......................................................13 Box 2. The definition of a nurse ................................................................................................................16

DELSA/ELSA/WD/HEA(2005)1
Box 3. Assumptions underlying nurse age projections..............................................................................20 Box 4. Improving the effectiveness of nurse workforce planning .............................................................30 Box 5. The effect of a dominant (monopsony) hospital on nurse wage rates and employment ................42 Box 6. Hospital nurse job satisfaction in five OECD countries.................................................................43 Box 7. Magnet hospitals in the United States ............................................................................................45 Box 8. Introducing minimum nurse-to-patient ratios.................................................................................46

DELSA/ELSA/WD/HEA(2005)1
2 INTRODUCTION
11. This paper reports the findings on the demand for and supply of nurses of the OECD’s project on Human Resources on Health Care, which took place during 2002-04.
12. Accessible health care requires a well-trained and well-motivated nurse workforce of an adequate size which is able to deliver safe, high-quality medical services. However, concerns have been voiced in many OECD countries that a gap may be looming between demand for and supply of nurses. Demand is likely to increase due to economic expansion, population growth, an ageing population, technological advances, and higher patient expectations. Evidence of the strong growth in demand can be seen in the 4% real growth in health expenditure in 1997-2001 which exceeds that of previous years (3.7% in 1989-1992 and 2.5% in 1992-1997) (OECD, 2003a). On the other hand, supply is expected to fall or at best grow slowly (in the absence of countermeasures) as a result of a societal trend towards reduced hours of work, an ageing nurse workforce and trends towards early and partial retirement. Looking at trends over time for all OECD countries, growth in nurse density slowed down during the 1990s as compared to the 1970s and 1980s, with nurse density starting to decline in Australia, Canada and Sweden (OECD, 2003). Therefore, whereas a few countries or areas within countries are experiencing surpluses of nurses, it is much more common to find evidence of growing demand and shortages.
13. This paper analyses how decision makers can tackle current and expected future nurse shortages in OECD countries. Section 2 defines and presents evidence on nurse shortages and surpluses, explores observed international variations in the size and composition of the nurse workforce, and examines some of its implications. Section 3 discusses demand and supply factors that influence flows in and out of the nurse workforce and, thus, contribute to current and future nurse shortages. Among other things, this section assesses the impact of trends in the age structure and number of hours worked by nurses on the supply of nurses and examines their implications for meeting likely future needs.
14. In any given year, the number of nurses is increased by flows into the profession originating from newly-graduated nurses, immigrating nurses and nurses who re-enter the workforce. On the other hand, nurse numbers are reduced by flows out of the workforce arising from career change, withdrawal from the labour force of nurses of working age and retirement. Section 4 identifies, compares and evaluates policy levers that decision makers can use to influence each of these flows in and out of the nurse workforce, with a view to tackle nurse shortages. Policies designed to reduce nurse turnover are assessed in section 5. Section 6 concludes with a discussion of the main findings.

DELSA/ELSA/WD/HEA(2005)1
3 IDENTIFYING NURSE SHORTAGES AND SURPLUSES
15. In general, it is not easy to determine what is the right number of nurses in a country. This section proposes a framework for analysing nurse employment by: distinguishing the demand for the services of nurses from the supply; by indicating how, in principle, equilibrium levels of demand and supply may differ across countries; and by distinguishing two different concepts of shortages and surpluses of nurses. International variations in the size and the composition of the nurse workforce, and whether any implications for health outcomes and costs can be identified, are also considered. Finally, evidence on current nurse shortages and surpluses in OECD countries is reported.
3.1 Demand for and supply of nurses in OECD countries
16. Figure 1 presents a flow chart depicting the way in which the services of nurses contribute to the production of health care. The volume and quality of health care services is determined by the supply of nurse services, in combination with the supply of services of other health care resources such as other health care workers, pharmaceuticals, equipment, beds, etc. There is corresponding demand for the services of nurses (and for the services of other health care resources) derived from the demand for health care itself.
17. In any given year, the number of nurses is increased by flows into the profession, originating from newly-graduated nurses, immigrating nurses and nurses who re-enter the workforce; and reduced by flows out of the profession, arising from emigration, career change and retirement. The figure suggests that decision makers and managers can draw on a range of instruments including education and recruitment methods, levels of remuneration and policies on conditions of service, to ensure an adequate supply of nurses.

DELSA/ELSA/WD/HEA(2005)1
Figure 1. Flow chart of the contribution of nurse services to the production of health care
New graduates Immigrants
Re-entrants
Leavers Emigrants
Retirees
Number and productivity of nurses
QQuuaannttiittyy aanndd qquuaalliittyy ooff hheeaalltthh ccaarree
Derived demand for nurse services
Supply of nurse services
PPaattiieennttss OOuuttffllooww
IInnffllooww
NNuummbbeerr aanndd pprroodduuccttiivviittyy
ooff ootthheerr hheeaalltthh ccaarree rreessoouurrcceess
Supply of other services
Derived demand for other services
Policies on: • Education • Pay • Work conditions • Migration • Retirement
DELSA/ELSA/WD/HEA(2005)1
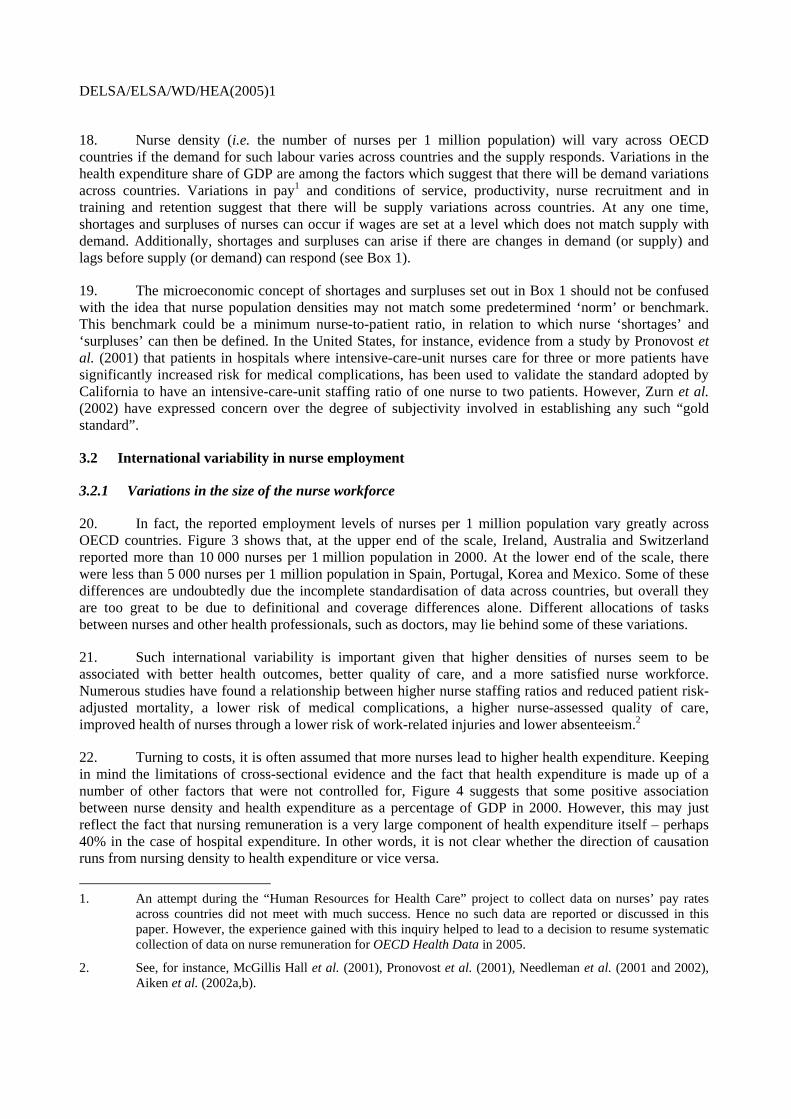
18. Nurse density (i.e. the number of nurses per 1 million population) will vary across OECD countries if the demand for such labour varies across countries and the supply responds. Variations in the health expenditure share of GDP are among the factors which suggest that there will be demand variations across countries. Variations in pay1 and conditions of service, productivity, nurse recruitment and in training and retention suggest that there will be supply variations across countries. At any one time, shortages and surpluses of nurses can occur if wages are set at a level which does not match supply with demand. Additionally, shortages and surpluses can arise if there are changes in demand (or supply) and lags before supply (or demand) can respond (see Box 1).
19. The microeconomic concept of shortages and surpluses set out in Box 1 should not be confused with the idea that nurse population densities may not match some predetermined ‘norm’ or benchmark. This benchmark could be a minimum nurse-to-patient ratio, in relation to which nurse ‘shortages’ and ‘surpluses’ can then be defined. In the United States, for instance, evidence from a study by Pronovost et al. (2001) that patients in hospitals where intensive-care-unit nurses care for three or more patients have significantly increased risk for medical complications, has been used to validate the standard adopted by California to have an intensive-care-unit staffing ratio of one nurse to two patients. However, Zurn et al. (2002) have expressed concern over the degree of subjectivity involved in establishing any such “gold standard”.
3.2 International variability in nurse employment
3.2.1 Variations in the size of the nurse workforce
20. In fact, the reported employment levels of nurses per 1 million population vary greatly across OECD countries. Figure 3 shows that, at the upper end of the scale, Ireland, Australia and Switzerland reported more than 10 000 nurses per 1 million population in 2000. At the lower end of the scale, there were less than 5 000 nurses per 1 million population in Spain, Portugal, Korea and Mexico. Some of these differences are undoubtedly due the incomplete standardisation of data across countries, but overall they are too great to be due to definitional and coverage differences alone. Different allocations of tasks between nurses and other health professionals, such as doctors, may lie behind some of these variations.
21. Such international variability is important given that higher densities of nurses seem to be associated with better health outcomes, better quality of care, and a more satisfied nurse workforce. Numerous studies have found a relationship between higher nurse staffing ratios and reduced patient risk-adjusted mortality, a lower risk of medical complications, a higher nurse-assessed quality of care, improved health of nurses through a lower risk of work-related injuries and lower absenteeism.2
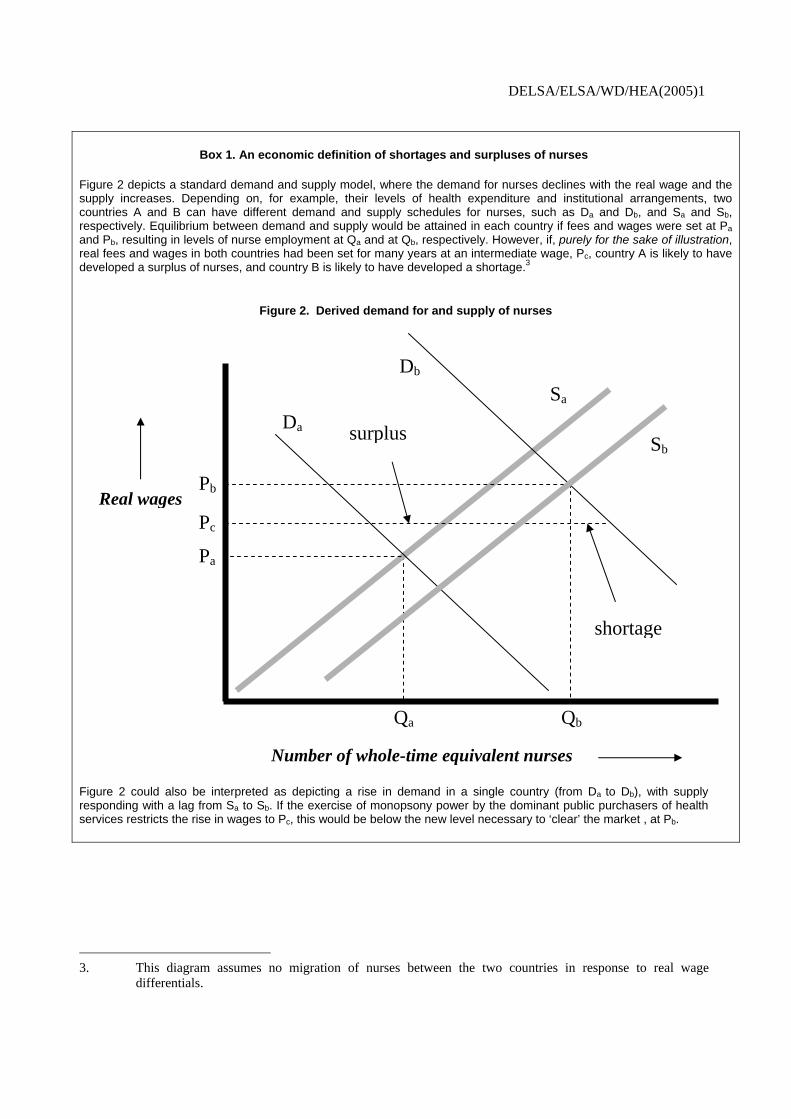
22. Turning to costs, it is often assumed that more nurses lead to higher health expenditure. Keeping in mind the limitations of cross-sectional evidence and the fact that health expenditure is made up of a number of other factors that were not controlled for, Figure 4 suggests that some positive association between nurse density and health expenditure as a percentage of GDP in 2000. However, this may just reflect the fact that nursing remuneration is a very large component of health expenditure itself – perhaps 40% in the case of hospital expenditure. In other words, it is not clear whether the direction of causation runs from nursing density to health expenditure or vice versa.
1. An attempt during the “Human Resources for Health Care” project to collect data on nurses’ pay rates
across countries did not meet with much success. Hence no such data are reported or discussed in this paper. However, the experience gained with this inquiry helped to lead to a decision to resume systematic collection of data on nurse remuneration for OECD Health Data in 2005.
2. See, for instance, McGillis Hall et al. (2001), Pronovost et al. (2001), Needleman et al. (2001 and 2002), Aiken et al. (2002a,b).
DELSA/ELSA/WD/HEA(2005)1
Box 1. An economic definition of shortages and surpluses of nurses
Figure 2 depicts a standard demand and supply model, where the demand for nurses declines with the real wage and the supply increases. Depending on, for example, their levels of health expenditure and institutional arrangements, two countries A and B can have different demand and supply schedules for nurses, such as Da and Db, and Sa and Sb, respectively. Equilibrium between demand and supply would be attained in each country if fees and wages were set at Pa and Pb, resulting in levels of nurse employment at Qa and at Qb, respectively. However, if, purely for the sake of illustration, real fees and wages in both countries had been set for many years at an intermediate wage, Pc, country A is likely to have developed a surplus of nurses, and country B is likely to have developed a shortage.3
Figure 2. Derived demand for and supply of nurses
Figure 2 could also be interpreted as depicting a rise in demand in a single country (from Da to Db), with supply responding with a lag from Sa to Sb. If the exercise of monopsony power by the dominant public purchasers of health services restricts the rise in wages to Pc, this would be below the new level necessary to ‘clear’ the market , at Pb.
3. This diagram assumes no migration of nurses between the two countries in response to real wage
differentials.
Real wages
Number of whole-time equivalent nurses
Sa
Db
Da
Pa
Pb
Qa Qb
Pc
Sbsurplus
shortage

DELSA/ELSA/WD/HEA(2005)1
Figure 3. Nurse density, 2000
13,963
11,726
10,735
9,928
9,620
9,582
9,533
9,130
8,835
8,782
7,476
6,750
5,885
3,694
3,663
3,007
1,897
0 2,000 4,000 6,000 8,000 10,000 12,000 14,000 16,000
Ireland
Australia
Switzerland
Canada
Germany
New Zealand
Denmark
United States
Sweden
United Kingdom
Slovak Republic
France
Austria
Spain
Portugal
Korea
Mexico
Practising nurses per 1 million population
Notes: - Data on Austria refer to nurses employed in hospitals; they do not include nurses working in other health facilities. - Data on Germany relate to full-time equivalent nurses (not headcounts). - Data on Spain refer to registered nurses who are employed in the National Health Service.
Sources: - Data are taken from the Australian Bureau of Statistics and the Australian Institute for Health and Welfare (Australia), Statistics Austria (Austria), Canadian Institute for Health and Information (Canada), DREES (France), the Ministry of Health and Welfare and the Korean Institute for Health and Social Affairs (Korea), National Institute for Statistics, Geography and Informatics (Mexico), New Zealand Health Information Service (New Zealand), National Board of Health and Welfare (Sweden), Swiss Statistics Office (Switzerland) and the Bureau of Health Professions and the Health Resources and Services Administration (United States). - Data for Denmark, Germany, Ireland, Portugal, Slovak Republic, Spain and the United Kingdom are taken from OECD Health Data 2003, 3rd edition.
DELSA/ELSA/WD/HEA(2005)1
Figure 4. Nurse density and health expenditure, 2000
United States
United Kingdom
Switzerland
SwedenSpain
Portugal
New Zealand
MexicoKorea
Ireland
Germany
FranceDenmark
Canada
Austria
Australia
0
2
4
6
8
10
12
14
0 2000 4000 6000 8000 10000 12000 14000 16000
Practising nurses per 1 million population
Hea
lth e
xpen
ditu
re a
s pe
rcen
tage
of g
ross
dom
estic
pr
oduc
t
Notes: - Data on Austrian nurses refer to nurses employed in hospitals; they do not include nurses working in other health facilities. - Data on German nurses relate to full-time equivalent nurses (not headcounts). - Data on Spanish nurses refer to publicly employed nurses (nurses employed in the National Health Service).
Sources: - Data are taken from the Australian Bureau of Statistics and the Australian Institute for Health and Welfare (Australia), Statistics Austria (Austria), Canadian Institute for Health and Information (Canada), DREES (France), the Ministry of Health and Welfare and the Korean Institute for Health and Social Affairs (Korea), National Institute for Statistics, Geography and Informatics (Mexico), New Zealand Health Information Service (New Zealand), National Board of Health and Welfare (Sweden), Swiss Statistics Office (Switzerland) and the Bureau of Health Professions and the Health Resources and Services Administration (United States). Data for Denmark, Germany, Ireland, Portugal, Slovak Republic, Spain and the United Kingdom are taken from OECD Health Data 2003, 3rd edition.
3.2.2 Variations in the composition of the nurse workforce
23. The nurse workforce can be disaggregated into various categories of nurse. Countries have used different typologies of nurses depending on the educational skills and qualifications required and the scope of practice. Many countries adopt a typology consisting of three types of nurse – the registered nurse, the enrolled nurse and the nurse aide (see Box 2). However, the nurse workforce in a country such as the Netherlands is made up of registered nurses, enrolled nurses and three categories of nurses’ aides. Other countries such as Austria, France and Spain appear to have only one category of qualified nurse. Some countries have also changed their typology of nurses over time. For instance whereas two categories of nurses (the registered nurse and the enrolled nurse) were educated in the United Kingdom prior to 1989, the training of enrolled nurses was then gradually phased out.
DELSA/ELSA/WD/HEA(2005)1
Box 2. The definition of a nurse
Nurses
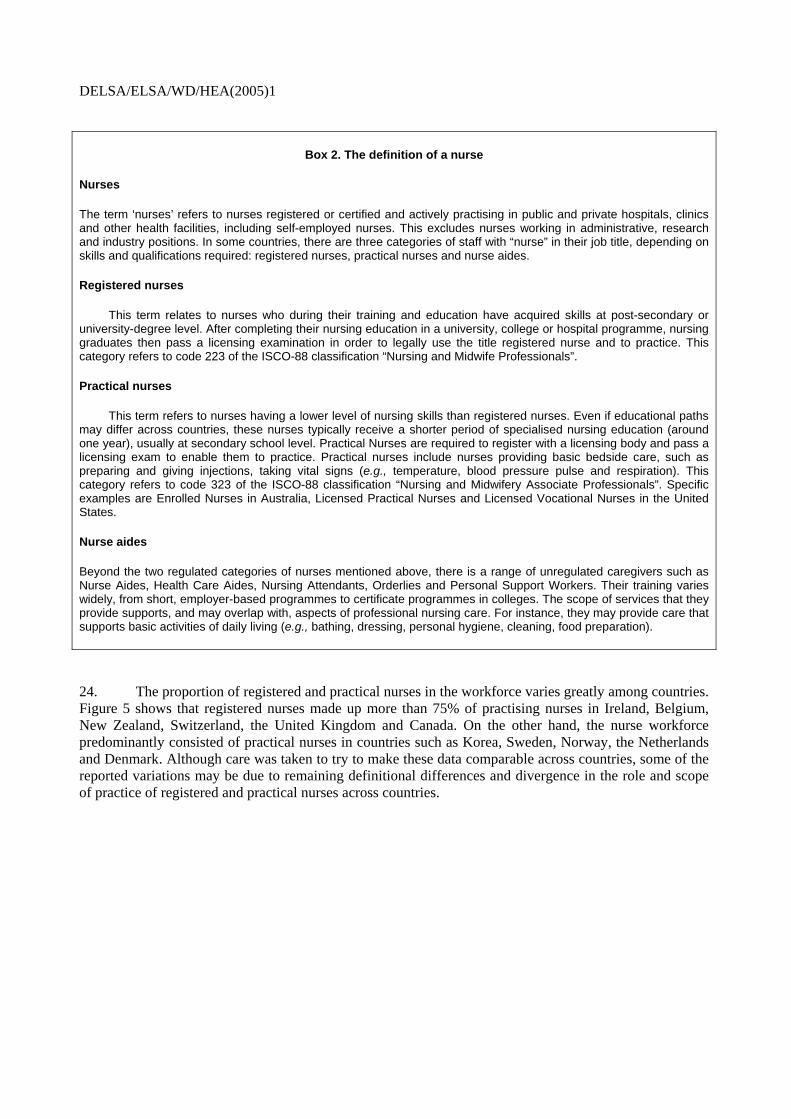
The term ‘nurses’ refers to nurses registered or certified and actively practising in public and private hospitals, clinics and other health facilities, including self-employed nurses. This excludes nurses working in administrative, research and industry positions. In some countries, there are three categories of staff with “nurse” in their job title, depending on skills and qualifications required: registered nurses, practical nurses and nurse aides.
Registered nurses
This term relates to nurses who during their training and education have acquired skills at post-secondary or university-degree level. After completing their nursing education in a university, college or hospital programme, nursing graduates then pass a licensing examination in order to legally use the title registered nurse and to practice. This category refers to code 223 of the ISCO-88 classification “Nursing and Midwife Professionals”.
Practical nurses
This term refers to nurses having a lower level of nursing skills than registered nurses. Even if educational paths may differ across countries, these nurses typically receive a shorter period of specialised nursing education (around one year), usually at secondary school level. Practical Nurses are required to register with a licensing body and pass a licensing exam to enable them to practice. Practical nurses include nurses providing basic bedside care, such as preparing and giving injections, taking vital signs (e.g., temperature, blood pressure pulse and respiration). This category refers to code 323 of the ISCO-88 classification “Nursing and Midwifery Associate Professionals”. Specific examples are Enrolled Nurses in Australia, Licensed Practical Nurses and Licensed Vocational Nurses in the United States.
Nurse aides
Beyond the two regulated categories of nurses mentioned above, there is a range of unregulated caregivers such as Nurse Aides, Health Care Aides, Nursing Attendants, Orderlies and Personal Support Workers. Their training varies widely, from short, employer-based programmes to certificate programmes in colleges. The scope of services that they provide supports, and may overlap with, aspects of professional nursing care. For instance, they may provide care that supports basic activities of daily living (e.g., bathing, dressing, personal hygiene, cleaning, food preparation).
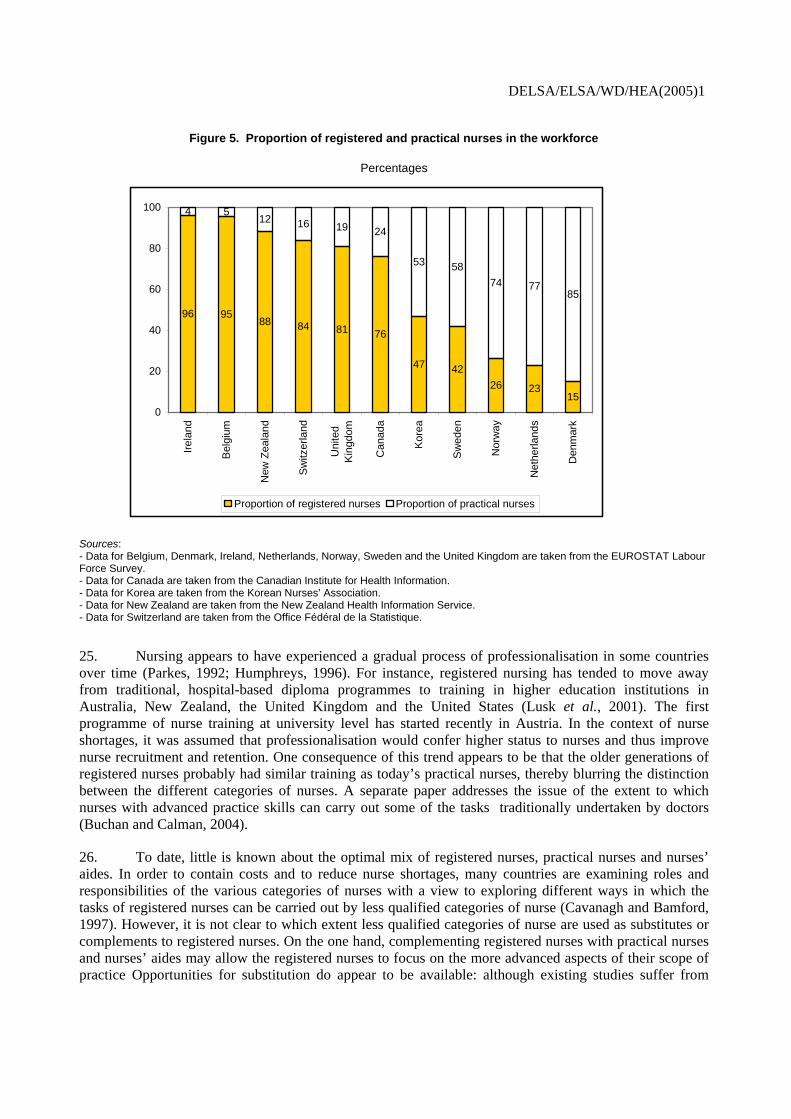
24. The proportion of registered and practical nurses in the workforce varies greatly among countries. Figure 5 shows that registered nurses made up more than 75% of practising nurses in Ireland, Belgium, New Zealand, Switzerland, the United Kingdom and Canada. On the other hand, the nurse workforce predominantly consisted of practical nurses in countries such as Korea, Sweden, Norway, the Netherlands and Denmark. Although care was taken to try to make these data comparable across countries, some of the reported variations may be due to remaining definitional differences and divergence in the role and scope of practice of registered and practical nurses across countries.
DELSA/ELSA/WD/HEA(2005)1
Figure 5. Proportion of registered and practical nurses in the workforce
Percentages
96 9588 84 81 76
47 4226 23
15
4 512 16 19 24
53 5874 77
85
0
20
40
60
80
100
Irela
nd
Bel
gium
New
Zea
land
Switz
erla
nd
Uni
ted
Kin
gdom
Can
ada
Kor
ea
Sw
eden
Nor
way
Net
herla
nds
Den
mar
k
Proportion of registered nurses Proportion of practical nurses
Sources: - Data for Belgium, Denmark, Ireland, Netherlands, Norway, Sweden and the United Kingdom are taken from the EUROSTAT Labour Force Survey. - Data for Canada are taken from the Canadian Institute for Health Information. - Data for Korea are taken from the Korean Nurses’ Association. - Data for New Zealand are taken from the New Zealand Health Information Service. - Data for Switzerland are taken from the Office Fédéral de la Statistique.
25. Nursing appears to have experienced a gradual process of professionalisation in some countries over time (Parkes, 1992; Humphreys, 1996). For instance, registered nursing has tended to move away from traditional, hospital-based diploma programmes to training in higher education institutions in Australia, New Zealand, the United Kingdom and the United States (Lusk et al., 2001). The first programme of nurse training at university level has started recently in Austria. In the context of nurse shortages, it was assumed that professionalisation would confer higher status to nurses and thus improve nurse recruitment and retention. One consequence of this trend appears to be that the older generations of registered nurses probably had similar training as today’s practical nurses, thereby blurring the distinction between the different categories of nurses. A separate paper addresses the issue of the extent to which nurses with advanced practice skills can carry out some of the tasks traditionally undertaken by doctors (Buchan and Calman, 2004).
26. To date, little is known about the optimal mix of registered nurses, practical nurses and nurses’ aides. In order to contain costs and to reduce nurse shortages, many countries are examining roles and responsibilities of the various categories of nurses with a view to exploring different ways in which the tasks of registered nurses can be carried out by less qualified categories of nurse (Cavanagh and Bamford, 1997). However, it is not clear to which extent less qualified categories of nurse are used as substitutes or complements to registered nurses. On the one hand, complementing registered nurses with practical nurses and nurses’ aides may allow the registered nurses to focus on the more advanced aspects of their scope of practice Opportunities for substitution do appear to be available: although existing studies suffer from

DELSA/ELSA/WD/HEA(2005)1
methodological difficulties, they suggest that financial savings can be obtained by employing nurses’ aides alongside qualified nursing personnel (Bostrom and Zimmerman, 1993). However, such substitution might compromise quality of care, and thus be undesirable. Recent research has found an association between higher nurse qualifications and better patient health outcomes (Aiken et al., 2003). Further research needs to be conducted to investigate the impact of changes in the scope of practice and the use of the various categories of nursing staff on recruitment and retention.
3.3 Evidence on current nurse shortages and surpluses in OECD countries
27. The majority of OECD countries seem to be suffering from nurse shortages of the kind illustrated in Box 1, above. Some countries have published estimates of how many headcounts or full-time equivalent nurses per year over the next decade would be needed to match demand for and supply of nurses. Australia reports a shortage of around 6 000 registered nurses (around 3% of practicing registered nurses) (Access Economics, 2004, and O’Hagan, 2002). Conservative estimates of Canada’s shortage of registered nurses put the number in the range of 16 000 (Canadian Nursing Advisory Committee, 2002) or 6.9% of the present workforce. The Netherlands has reported a shortage of 7 000 nurses (1% of the practising registered nurse workforce). The shortage of nurses in Norway has been estimated at 3 300 full-time equivalents or about 5.4% of practicing nurses (Askildsen et al., 2003). There are 3 000 (4.6%) fewer generalist nurses in Switzerland than required (Irwin, 2001). The United States government reported a shortage of 110 700 registered nurses (5% of the practicing registered nurse workforce) in 2000 (National Centre for Health Workforce Analysis, 2002).
28. These national shortages are often unevenly distributed geographically and by specialty area. In the United Kingdom, for example, it was noted that vacancy rates varied from 1.8% in district nursing to 4.7% in the category of ‘other psychiatry’ (Buchan and Secombe, 2003b). Although Australia reported that the proportion of nurses in urban and rural settings roughly mirrored the population distribution, it has been noted that employers in rural and remote settings have trouble finding sufficient numbers of qualified staff to work in areas such as long-term care (Mundy 2001). These “one-time” estimates of vacancy numbers will include “frictional” vacancies which may be filled quickly. Data on a growth in vacancies over time would be needed to confirm a supply shortage. In 2002-03, such rates appear to have fallen in England (Buchan and Secombe, 2002) and between 1996 and 2003 in Scotland (Buchan and Secombe, 2003b). However, employers in the United States have also reported growing difficulties in filling vacancies (Heinrich, 2001).
29. Unemployment of nurses appears to be marginal or non-existent in most OECD countries. Only the Slovak Republic and Spain reported unemployment rates exceeding 5% in 2000 (EUROSTAT Labour Force Survey).
4 FACTORS AFFECTING FUTURE DEMAND FOR AND SUPPLY OF NURSES
30. With gaps already appearing between demand for and supply of nurses in many countries, and further increases in demand expected, it is important to understand what future trends might affect nurse shortages. A number of demand-side and supply-side factors suggest that a greater nurse density may be required to meet future needs. This section discusses factors that may influence the future demand for and supply of nurses.
DELSA/ELSA/WD/HEA(2005)1
4.1 Demand-side factors
31. A number of factors influence demand for nurses, but in opposite directions. Even though reductions in hospital beds and average lengths of stay, and increasing use of day hospitalisation appear to decrease demand for nurses, rising activity generated by population ageing, advances in medical technology and rising consumer expectations have increased demand. To date, little is known about the net effect of these opposing factors on the demand for nurses.
32. As a result of system-wide fiscal restraint during the 1990s, many countries downsized hospitals and substantially reduced the number of acute care beds, length of stay (except for the United Kingdom) and average numbers of acute care hospital days per capita. Only Turkey and Korea increased their numbers of beds. Health care system restructuring was generally accompanied by a slower growth or decline in the number of nurses and supporting staff at professional, clerical and ancillary service levels. This was based on claims that fewer nurses would be required due to the increasing shift of services to day surgery as a result of technological advances, and to outpatient and community settings.
33. On the other hand, advances in medical science and technology have increased the length of human life by allowing illnesses to be diagnosed more accurately and more quickly, by enabling formerly fatal injuries to be treated successfully, by offering treatment options to older and less physically strong patients. In addition to this, many formerly terminal illnesses have taken on a chronic nature. One consequence of technological progress has been a rise in the volume, intensity and complexity of care provided in most health care delivery settings. In Ontario, Canada, there was a 26% increase in severity-adjusted cases, a 20% reduction in beds per adjusted episode, and a 3.7% reduction in nurses per adjusted episode during the 1990s (Birch et al. 2003). In addition to this, there has been a trend of downloading acuity across the health care system. Tertiary settings now provide care for patients who previously would not have survived, filling critical care beds with only the sickest patients. Patients that would have been treated in intensive care units 20 years ago now find themselves placed on general hospital wards, and many of those former ward patients now receive care in outpatient, long-term care, rehabilitation and home settings. Increasing acuity and complexity of care across the system is likely to drive up demand for nurses.
34. Population ageing may also raise demand for nurses, especially for those working in long-term and home care, due to an increasing number of longer-living seniors who need medical services. In the United States, for example, demand for nurses is predicted to rise in settings associated with providing services to the elderly; for example, by 2020, demand by nursing homes for registered nurses is expected to rise from the present 8% to 10% of total demand for nurses and demand in home care is projected to rise from 6.5% to 9% (National Center for Workforce Analysis, 2002). However, evidence from Australia, Canada and the United States suggests that the gradual ageing of the population in these countries by itself tends to be only a minor determinant of the annual growth in demand for medical services and health expenditure (Reinhardt, 2003). While acknowledging wide margins of error, OECD estimates indicate that ageing alone typically will imply the need to increase health expenditure by up to three percentage points of GDP by 2050 (OECD, 2003c).
35. Health systems in countries are being reshaped by the expectations of consumers who are demanding faster access to more and better medical services, and who want more influence in their health care systems. As a result of the near-global availability of mass media sources such as television, and more recently, the internet, patients are better informed than ever before, are aware of many details of medical advances, and in some situations (cosmetic procedures and laser eye surgery are often cited as examples) ‘shop’ for their medical services based on published cost, quality and outcome indicators. The growing knowledge and expectations of consumers seem to drive up, especially, demand for more diagnostic services (e.g., CT and MRI scanning), screening and monitoring (e.g., prostate, colon and breast cancer
DELSA/ELSA/WD/HEA(2005)1
screening), surgical procedures often related to ageing (e.g., hip and knee replacement), transplant options and elective cosmetics which, in turn, raises the demand for nurses.
4.2 Supply-side factors
36. A number of factors are expected to diminish the supply of nurses in the absence of reactions or countermeasures. Demographic trends such as population ageing are projected to decrease the flow of young nurses joining the workforce and increase flows out of the workforce due to retirement. Additionally, societal trends towards more leisure time, part-time work, early and partial retirement are also expected to reduce the lifetime of hours worked by nurses during their professional career.
4.2.1 Nurse ageing
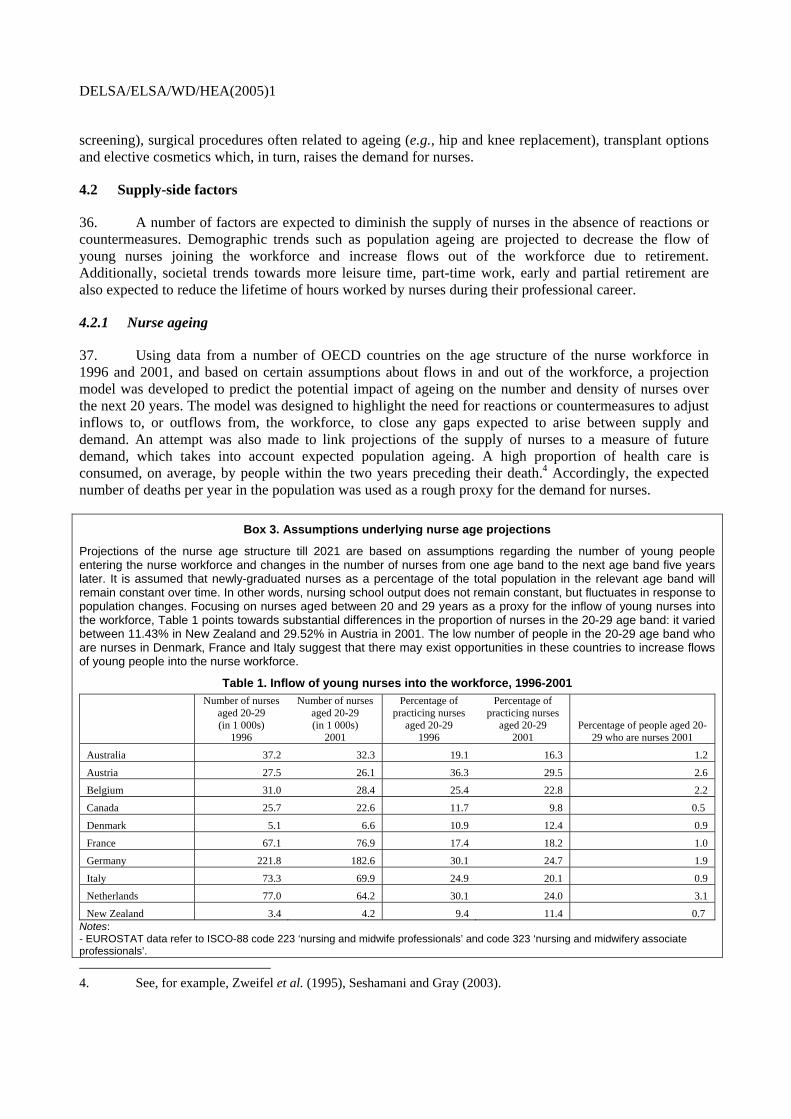
37. Using data from a number of OECD countries on the age structure of the nurse workforce in 1996 and 2001, and based on certain assumptions about flows in and out of the workforce, a projection model was developed to predict the potential impact of ageing on the number and density of nurses over the next 20 years. The model was designed to highlight the need for reactions or countermeasures to adjust inflows to, or outflows from, the workforce, to close any gaps expected to arise between supply and demand. An attempt was also made to link projections of the supply of nurses to a measure of future demand, which takes into account expected population ageing. A high proportion of health care is consumed, on average, by people within the two years preceding their death.4 Accordingly, the expected number of deaths per year in the population was used as a rough proxy for the demand for nurses.
Box 3. Assumptions underlying nurse age projections
Projections of the nurse age structure till 2021 are based on assumptions regarding the number of young people entering the nurse workforce and changes in the number of nurses from one age band to the next age band five years later. It is assumed that newly-graduated nurses as a percentage of the total population in the relevant age band will remain constant over time. In other words, nursing school output does not remain constant, but fluctuates in response to population changes. Focusing on nurses aged between 20 and 29 years as a proxy for the inflow of young nurses into the workforce, Table 1 points towards substantial differences in the proportion of nurses in the 20-29 age band: it varied between 11.43% in New Zealand and 29.52% in Austria in 2001. The low number of people in the 20-29 age band who are nurses in Denmark, France and Italy suggest that there may exist opportunities in these countries to increase flows of young people into the nurse workforce.
Table 1. Inflow of young nurses into the workforce, 1996-2001
Number of nurses aged 20-29 (in 1 000s)
1996
Number of nurses aged 20-29 (in 1 000s)
2001
Percentage of practicing nurses
aged 20-29 1996
Percentage of practicing nurses
aged 20-29 2001
Percentage of people aged 20-29 who are nurses 2001
Australia 37.2 32.3 19.1 16.3 1.2
Austria 27.5 26.1 36.3 29.5 2.6
Belgium 31.0 28.4 25.4 22.8 2.2
Canada 25.7 22.6 11.7 9.8 0.5
Denmark 5.1 6.6 10.9 12.4 0.9
France 67.1 76.9 17.4 18.2 1.0
Germany 221.8 182.6 30.1 24.7 1.9
Italy 73.3 69.9 24.9 20.1 0.9
Netherlands 77.0 64.2 30.1 24.0 3.1
New Zealand 3.4 4.2 9.4 11.4 0.7 Notes: - EUROSTAT data refer to ISCO-88 code 223 ‘nursing and midwife professionals’ and code 323 ‘nursing and midwifery associate professionals’. 4. See, for example, Zweifel et al. (1995), Seshamani and Gray (2003).
DELSA/ELSA/WD/HEA(2005)1
- Data for Australia refer to 1995 and 1999. Data for Canada and New Zealand refer to 1995 and 2000. - Data for Canada refer to registered nurses only Sources: EUROSTAT Labour Force Survey and the New Zealand Health Information Service; population data for Australia, Canada and New Zealand: US Bureau of the Census International Database.
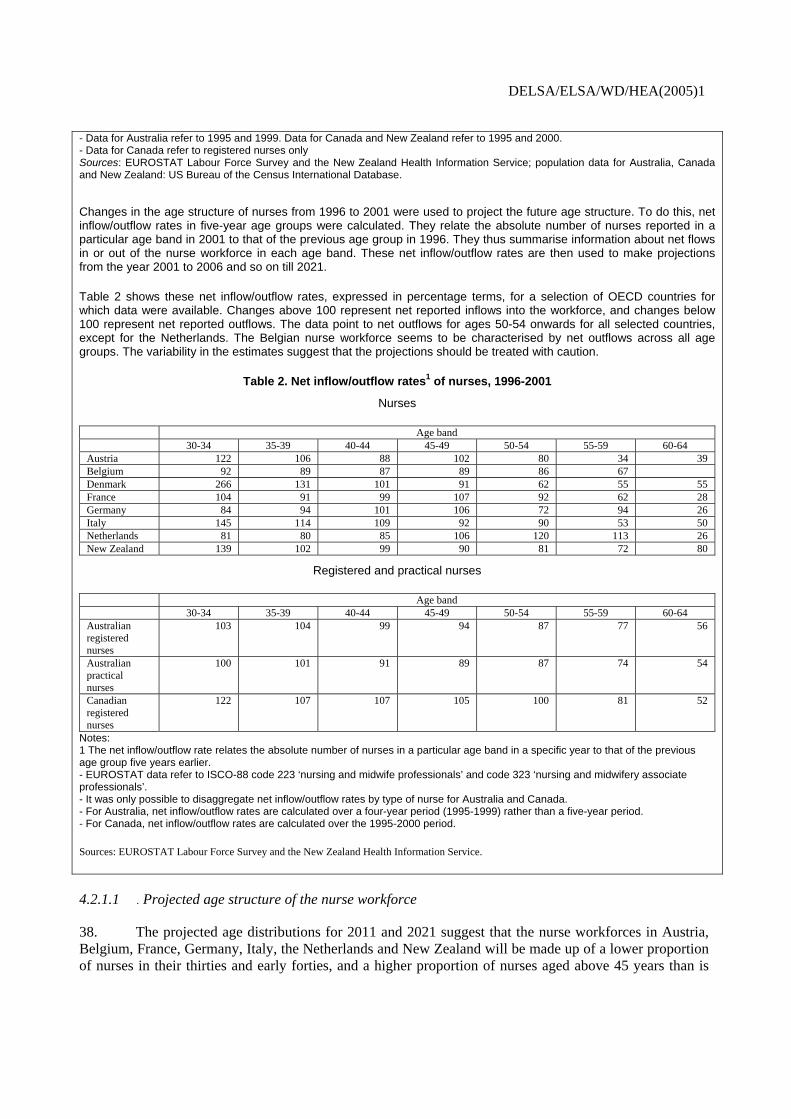
Changes in the age structure of nurses from 1996 to 2001 were used to project the future age structure. To do this, net inflow/outflow rates in five-year age groups were calculated. They relate the absolute number of nurses reported in a particular age band in 2001 to that of the previous age group in 1996. They thus summarise information about net flows in or out of the nurse workforce in each age band. These net inflow/outflow rates are then used to make projections from the year 2001 to 2006 and so on till 2021.
Table 2 shows these net inflow/outflow rates, expressed in percentage terms, for a selection of OECD countries for which data were available. Changes above 100 represent net reported inflows into the workforce, and changes below 100 represent net reported outflows. The data point to net outflows for ages 50-54 onwards for all selected countries, except for the Netherlands. The Belgian nurse workforce seems to be characterised by net outflows across all age groups. The variability in the estimates suggest that the projections should be treated with caution.
Table 2. Net inflow/outflow rates1 of nurses, 1996-2001
Nurses
Age band 30-34 35-39 40-44 45-49 50-54 55-59 60-64
Austria 122 106 88 102 80 34 39 Belgium 92 89 87 89 86 67 Denmark 266 131 101 91 62 55 55 France 104 91 99 107 92 62 28 Germany 84 94 101 106 72 94 26 Italy 145 114 109 92 90 53 50 Netherlands 81 80 85 106 120 113 26 New Zealand 139 102 99 90 81 72 80
Registered and practical nurses
Age band 30-34 35-39 40-44 45-49 50-54 55-59 60-64
Australian registered nurses
103 104 99 94 87 77 56
Australian practical nurses
100 101 91 89 87 74 54
Canadian registered nurses
122 107 107 105 100 81 52
Notes: 1 The net inflow/outflow rate relates the absolute number of nurses in a particular age band in a specific year to that of the previous age group five years earlier. - EUROSTAT data refer to ISCO-88 code 223 ‘nursing and midwife professionals’ and code 323 ‘nursing and midwifery associate professionals’. - It was only possible to disaggregate net inflow/outflow rates by type of nurse for Australia and Canada. - For Australia, net inflow/outflow rates are calculated over a four-year period (1995-1999) rather than a five-year period. - For Canada, net inflow/outflow rates are calculated over the 1995-2000 period.
Sources: EUROSTAT Labour Force Survey and the New Zealand Health Information Service.
4.2.1.1 . Projected age structure of the nurse workforce
38. The projected age distributions for 2011 and 2021 suggest that the nurse workforces in Austria, Belgium, France, Germany, Italy, the Netherlands and New Zealand will be made up of a lower proportion of nurses in their thirties and early forties, and a higher proportion of nurses aged above 45 years than is

DELSA/ELSA/WD/HEA(2005)1
now the case (see Figure 6). The proportion of Danish nurses in their thirties is expected to peak by 2011 and still remain at a high level by 2021.
Figure 6. Evolution of nurse age structure in selected OECD countries, 2001-2021
Austria
0
5
10
15
20
25
30
15_1
9
20_2
4
25_2
9
30_3
4
35_3
9
40_4
4
45_4
9
50_5
4
55_5
9
60_6
4
Age band
Pro
porti
on o
f nur
ses
2001 2011 2021
Belgium
0
5
10
15
20
25
30
15_1
9
20_2
4
25_2
9
30_3
4
35_3
9
40_4
4
45_4
9
50_5
4
55_5
9
60_6
4
Age band
Pro
porti
on o
f nur
ses
2001 2011 2021
Denmark
0
5
10
15
20
25
30
15_1
9
20_2
4
25_2
9
30_3
4
35_3
9
40_4
4
45_4
9
50_5
4
55_5
9
60_6
4
Age band
Pro
porti
on o
f nur
ses
2001 2011 2021
France
0
5
10
15
20
25
30
15_1
9
20_2
4
25_2
9
30_3
4
35_3
9
40_4
4
45_4
9
50_5
4
55_5
9
60_6
4
Age band
Pro
porti
on o
f nur
ses
2001 2011 2021
Germany
0
5
10
15
20
25
30
15_1
9
20_2
4
25_2
9
30_3
4
35_3
9
40_4
4
45_4
9
50_5
4
55_5
9
60_6
4
Age band
Pro
porti
on o
f nur
ses
2001 2011 2021
Italy
0
5
10
15
20
25
30
15_1
9
20_2
4
25_2
9
30_3
4
35_3
9
40_4
4
45_4
9
50_5
4
55_5
9
60_6
4
Age band
Pro
porti
on o
f nur
ses
2001 2011 2021
Netherlands
0
5
10
15
20
25
30
15_1
9
20_2
4
25_2
9
30_3
4
35_3
9
40_4
4
45_4
9
50_5
4
55_5
9
60_6
4
Age band
Prop
ortio
n of
nur
ses
2001 2011 2021
Notes: - EUROSTAT data refer to ISCO-88 code 223 ‘nursing and midwife professionals’ and code 323 ‘nursing and midwifery associate professionals’. - Data for New Zealand refer to 2000, 2010 and 2020. - For a description of the assumptions underlying these projections, see Box 3.
Source: EUROSTAT Labour Force Survey.

DELSA/ELSA/WD/HEA(2005)1
4.2.1.2 Projected size of the nurse workforce
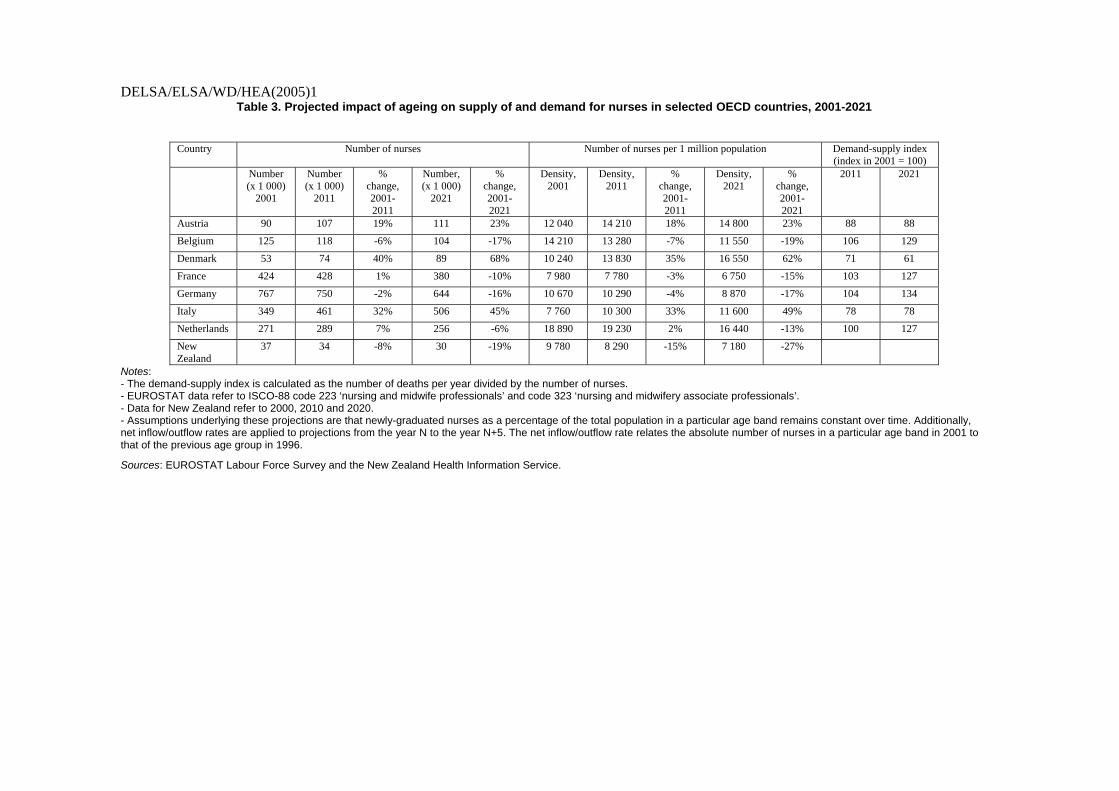
39. What do the projections suggest could happen to nurse numbers over the next 20 years in the absence of countermeasures to adjust inflows or outflows? The number of nurses in Belgium, Germany and New Zealand is expected to fall by up to 10% by 2011 and by more than 15% by 2021 (see Table 3). The moderate ageing process of nurses in Austria, Denmark and Italy is not projected to translate into a decline in nurse numbers in 2011 or 2021. Although nurse numbers are projected to remain relatively stable in France and the Netherlands by 2011, they could fall by 2021.
40. The number of nurses per 1 million population is projected to increase by 15-30% by 2011 and by more than 25% by 2021 in Austria, Denmark and Italy (see Table 3). Nurse density could decline by up to 15% by 2011 and 15-30% by 2021 in Belgium, France, Germany and New Zealand. Projections suggest that the density of Dutch nurses will remain stable in 2011, but be lower in 2021 as compared with 2001.
4.2.1.3 Projected impact of ageing on supply of nurse relative to demands
41. An index of demand-supply balance was calculated by dividing the expected number of deaths per year (see Section 3.2.1, above) by the projected number of nurses, expressing the result as an index number. A projected volume below 100 suggests that nurse shortages would decline in the absence of countermeasures. A projected value above 100 suggests that they would increase. A value of 100 would represent “equilibrium” in the labour market for nurses. Calculations of this index (Table 3) suggest it could decrease in Austria, Denmark, and Italy, the index would decrease over the next 20 years. Expected rates of increase in nurse numbers in these countries are projected to exceed expected rates of increase in the number of deaths in the population. However, in Belgium, France, Germany and the Netherlands, the index could remain relatively stable until 2011, but increase by at least 25% by 2021.
DELSA/ELSA/WD/HEA(2005)1
Table 3. Projected impact of ageing on supply of and demand for nurses in selected OECD countries, 2001-2021
Country Number of nurses Number of nurses per 1 million population Demand-supply index
(index in 2001 = 100) Number
(x 1 000) 2001
Number (x 1 000)
2011
% change, 2001-2011
Number, (x 1 000)
2021
% change, 2001-2021
Density, 2001
Density, 2011
% change, 2001-2011
Density, 2021
% change, 2001-2021
2011 2021
Austria 90 107 19% 111 23% 12 040 14 210 18% 14 800 23% 88 88
Belgium 125 118 -6% 104 -17% 14 210 13 280 -7% 11 550 -19% 106 129
Denmark 53 74 40% 89 68% 10 240 13 830 35% 16 550 62% 71 61
France 424 428 1% 380 -10% 7 980 7 780 -3% 6 750 -15% 103 127
Germany 767 750 -2% 644 -16% 10 670 10 290 -4% 8 870 -17% 104 134
Italy 349 461 32% 506 45% 7 760 10 300 33% 11 600 49% 78 78
Netherlands 271 289 7% 256 -6% 18 890 19 230 2% 16 440 -13% 100 127
New Zealand
37 34 -8% 30 -19% 9 780 8 290 -15% 7 180 -27%
Notes: - The demand-supply index is calculated as the number of deaths per year divided by the number of nurses. - EUROSTAT data refer to ISCO-88 code 223 ‘nursing and midwife professionals’ and code 323 ‘nursing and midwifery associate professionals’. - Data for New Zealand refer to 2000, 2010 and 2020. - Assumptions underlying these projections are that newly-graduated nurses as a percentage of the total population in a particular age band remains constant over time. Additionally, net inflow/outflow rates are applied to projections from the year N to the year N+5. The net inflow/outflow rate relates the absolute number of nurses in a particular age band in 2001 to that of the previous age group in 1996.
Sources: EUROSTAT Labour Force Survey and the New Zealand Health Information Service.
DELSA/ELSA/WD/HEA(2005)1
4.2.2 Nurse work hours
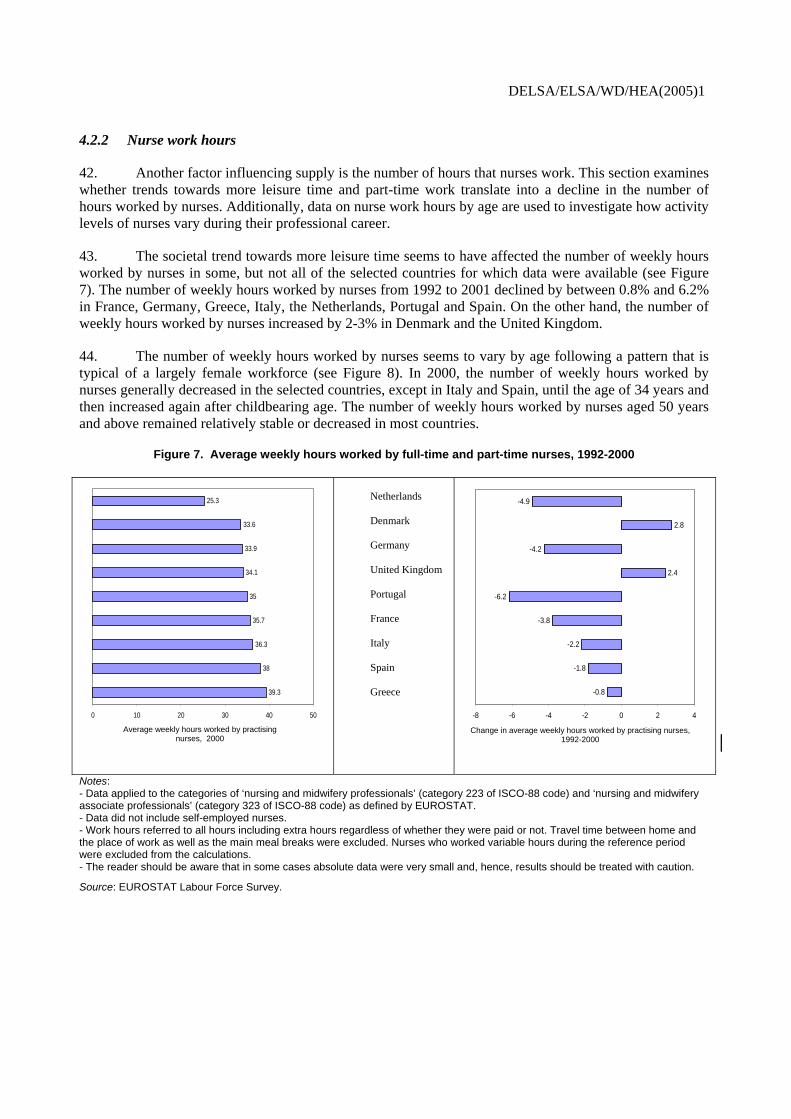
42. Another factor influencing supply is the number of hours that nurses work. This section examines whether trends towards more leisure time and part-time work translate into a decline in the number of hours worked by nurses. Additionally, data on nurse work hours by age are used to investigate how activity levels of nurses vary during their professional career.
43. The societal trend towards more leisure time seems to have affected the number of weekly hours worked by nurses in some, but not all of the selected countries for which data were available (see Figure 7). The number of weekly hours worked by nurses from 1992 to 2001 declined by between 0.8% and 6.2% in France, Germany, Greece, Italy, the Netherlands, Portugal and Spain. On the other hand, the number of weekly hours worked by nurses increased by 2-3% in Denmark and the United Kingdom.
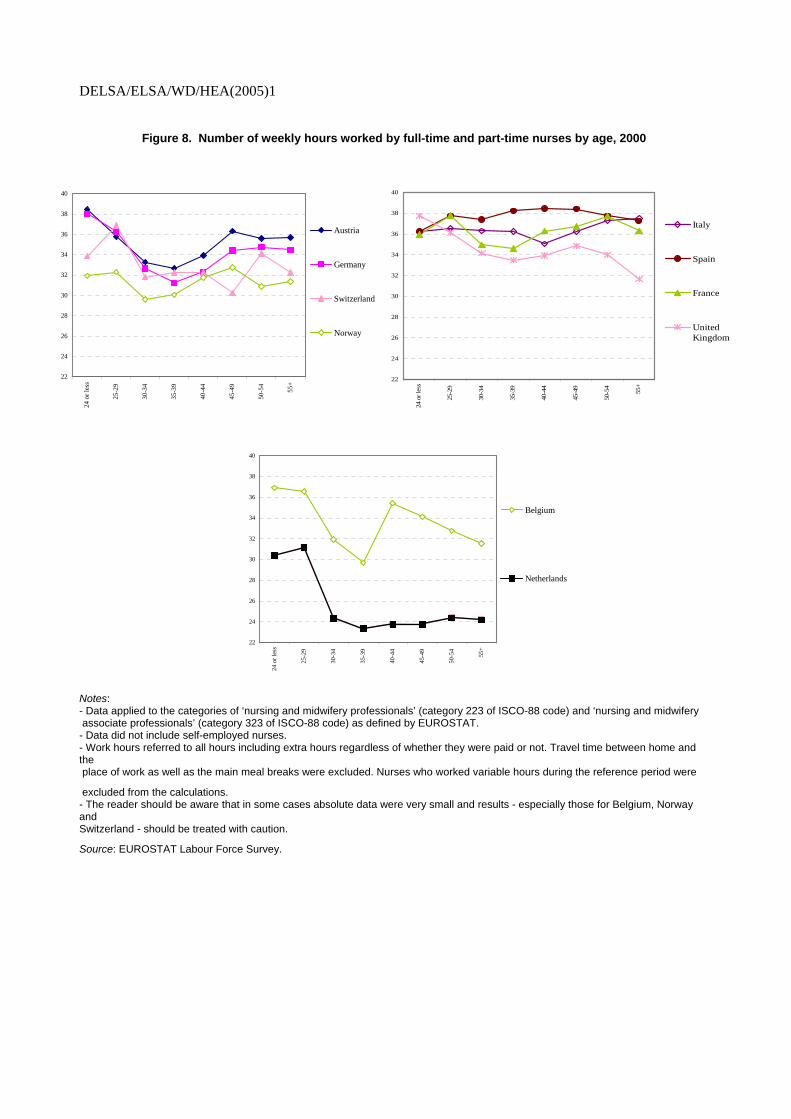
44. The number of weekly hours worked by nurses seems to vary by age following a pattern that is typical of a largely female workforce (see Figure 8). In 2000, the number of weekly hours worked by nurses generally decreased in the selected countries, except in Italy and Spain, until the age of 34 years and then increased again after childbearing age. The number of weekly hours worked by nurses aged 50 years and above remained relatively stable or decreased in most countries.
Figure 7. Average weekly hours worked by full-time and part-time nurses, 1992-2000
39.3
38
36.3
35.7
35
34.1
33.9
33.6
25.3
0 10 20 30 40 50
Average number of weekly hours worked by practising nurses, 2000
Netherlands Denmark Germany United Kingdom Portugal France Italy Spain Greece -0.8
-1.8
-2.2
-3.8
-6.2
2.4
-4.2
2.8
-4.9
-8 -6 -4 -2 0 2 4
Change in average number of weekly hours worked by practising nurses, 1992-2000
Notes: - Data applied to the categories of ‘nursing and midwifery professionals’ (category 223 of ISCO-88 code) and ‘nursing and midwifery associate professionals’ (category 323 of ISCO-88 code) as defined by EUROSTAT. - Data did not include self-employed nurses. - Work hours referred to all hours including extra hours regardless of whether they were paid or not. Travel time between home and the place of work as well as the main meal breaks were excluded. Nurses who worked variable hours during the reference period were excluded from the calculations. - The reader should be aware that in some cases absolute data were very small and, hence, results should be treated with caution.
Source: EUROSTAT Labour Force Survey.
Average weekly hours worked by practising nurses, 2000
Change in average weekly hours worked by practising nurses, 1992-2000
DELSA/ELSA/WD/HEA(2005)1
Figure 8. Number of weekly hours worked by full-time and part-time nurses by age, 2000
22
24
26
28
30
32
34
36
38
40
24 o
r les
s
25-2
9
30-3
4
35-3
9
40-4
4
45-4
9
50-5
4
55+
Austria
Germany
Switzerland
Norway
22
24
26
28
30
32
34
36
38
40
24 o
r les
s
25-2
9
30-3
4
35-3
9
40-4
4
45-4
9
50-5
4
55+
Italy
Spain
France
UnitedKingdom
22
24
26
28
30
32
34
36
38
40
24 o
r les
s
25-2
9
30-3
4
35-3
9
40-4
4
45-4
9
50-5
4
55+
Belgium
Netherlands
Notes: - Data applied to the categories of ‘nursing and midwifery professionals’ (category 223 of ISCO-88 code) and ‘nursing and midwifery associate professionals’ (category 323 of ISCO-88 code) as defined by EUROSTAT. - Data did not include self-employed nurses. - Work hours referred to all hours including extra hours regardless of whether they were paid or not. Travel time between home and the place of work as well as the main meal breaks were excluded. Nurses who worked variable hours during the reference period were
excluded from the calculations. - The reader should be aware that in some cases absolute data were very small and results - especially those for Belgium, Norway and Switzerland - should be treated with caution.
Source: EUROSTAT Labour Force Survey.
DELSA/ELSA/WD/HEA(2005)1
5 POLICIES AFFECTING FLOWS IN AND OUT OF THE NURSE WORKFORCE
45. The previous sections have reported evidence on current nurse shortages in many OECD countries and have illustrated that future shortages could arise as a result of factors such as nurse ageing unless actions are taken to increase inflows to or decrease outflows from the nurse workforce. In general, the supply of nurses will be affected by the relative attractiveness of the nursing profession compared with alternative occupations. This, in turn, will be influenced by relative pay and working conditions, as well as broader societal judgements about the “status” of the nursing profession. A combination of these factors is likely to affect entry into the profession, participation in the workforce, retention and retirement of nurses. This section of the paper explores the cost-effectiveness of policies on conditions of service and pay in increasing flows of nurses into the workforce and reducing flows of nurses out of the workforce. Policies designed to improve nurse retention are assessed in section 5.
5.1 Increasing flows of nurses into the workforce
5.1.1 Domestic nurse education and training
46. Some OECD countries leave the training of nurses mainly to decentralised market forces, whereas others regulate nursing school intake. Table 4 indicates that the number of available nursing places is determined by nursing schools themselves on the basis of student demand and their assessment of the needs of the labour market in Australia, Belgium, Mexico, Netherlands, New Zealand, Norway and the United States. The role of the government in these countries is limited to the funding of public nursing education. However, in Austria, Canada, England, Germany, Greece, Ireland, Japan, Korea, Slovak Republic, Spain, Sweden and Switzerland, the number of places available in nursing schools is planned to a greater extent by Government (Ministries of Health and Education) at national and/or regional level. To date, little is known about whether workforce planning or a more market-oriented approach is better suited to ensuring an adequate supply of nurses.

DELSA/ELSA/WD/HEA(2005)1
Table 4. Determining the number of places available in nursing schools
Country Nursing school intake Australia The number of places available in nursing schools, for registered nurse education, is determined by individual
universities. The Commonwealth Department of Education, Science and Training provides funding to universities under the Higher Education Funding Act 1988. Universities are provided block funding and are essentially autonomous organisations that are responsible for the distribution of funds between faculties and schools based on their own assessment of the extent of student demand and the needs of the labour market. When nurse education was transferred to universities in 1993/1994, universities were asked to provide a minimum number of places for basic nurse education to ensure an adequate supply of nurses to each state and territory. The Higher Education Support Act of 2003 provided a significant increase in the number of nursing places available in Australia and made nursing a priority area.
Austria Federal states determine the number of places available in nursing schools. Nursing associations and labour unions have some influence, but no formal say in determining the number of places available in nursing schools.
Belgium
There is no central authority that determines the number of places available in nursing schools.
Canada Provincial/territorial governments provide funding to post-secondary educational institutions. The number of places available in nursing schools is based on negotiation between the ministries of health and education. Many provinces/territories have government-funded nursing advisory committees which provide advice to the government on education plans for nurses.
England The number of places available in nursing schools is determined in partnership between the Department of Health and local Workforce Development Confederations. Workforce Development Confederations identify their own needs and the Department of Health ensures that local plans collectively meet national needs. This process relates to the number of places funded by the Department of Health. Higher education institutions may provide further places for students who fund their own courses.
Germany The number of places available in nursing schools may be determined by the Federal Lander.
Greece The Ministry of Education and the Central Health Council determine the number of available places in public nursing schools.
Ireland The number of places available in nursing schools is determined by the Higher Education Authority with training places being funded by the Department of Health and Children.
Japan
The number of places available in nursing schools is determined jointly by national and prefecture governments.
Korea The number of places available in nursing schools is determined by the government.
Mexico There is no central authority that determines the number of places available in nursing schools.
Netherlands There is no central authority that determines the number of places available in nursing schools.
New Zealand There is no central authority that determines the number of places available in nursing schools.
Norway Each nursing school determines the number of available positions.
Slovak Republic The number of places available in nursing schools is determined by the Ministries of Health and Education.
Spain The number of places available in nursing schools is determined by the Ministries of Health and Education. The number of nursing places was limited in the late 1990s to about 7 000 per annum.
Sweden The number of places available in nursing schools is determined by the government.
Switzerland
The number of places available in nursing schools is determined by cantons.
United States There is no central authority that determines the number of places available in nursing schools, although state’s decisions on public nursing education funding has a direct impact on capacity to train nurses.
Source: European Observatory on Health Care Systems and OECD Human Resources for Health Care project.
47. Although nurse labour markets will in principle adjust towards equilibrium in the long-term, response to changing demand and/or supply conditions may not be immediate. Such lags may cause cycles of alternate shortages and surpluses of nurses. This appears to be an example of the so-called ‘cobweb’ cycle: a cyclical pattern in nursing school intake is brought about by the fact that the training period
DELSA/ELSA/WD/HEA(2005)1
imposes lags in the response of potential entrants to any rises and falls in relative wages in response to shifts in nursing demand.
48. The experience of the United States labour market for registered nurses suggests that delayed market response may be one of the factors explaining alternate nurse shortages and surpluses in the late 1970s and mid 1980s, respectively (Newschaffer and Schoenman, 1990; Pope and Menke, 1990). In 1979-1980, the United States was experiencing a shortage of registered nurses. As a result, wages of registered nurses started to climb in the early 1980s, leading to an increased number of new entrants into the profession and falling vacancy rates. As the supply of registered nurses rose and the labour market moved towards a new equilibrium, wage growth levelled off. As wages peaked, demand for registered nurses began to outstrip supply in the mid-1980s. Consequently, hospitals raised wages to alleviate shortages, with the real earnings of registered nurses rising almost twice as much from 1985 to 1989 as from 1981 to 1985. In consequence, enrolments of registered nurses rose in 1988, reflecting wage gains.
49. More recent evidence from the United States shows that, faced by nurse shortages, inflation-adjusted median earnings of registered nurses increased by 13% in 1997-2000 and wages of starting registered nurses increased by 5.7% in 2000-2002 (Robinson, 2002). This increase in wages appears to reflect accelerating demand for registered nurses (Buerhaus et al., 2003). However, the Bureau of Health Professions still projects a shortage of 800 000 nurses by 2020. A model taking into account the impact of pay on demand for nurses and supply (new entrants into the profession and exits from the workforce) suggested that inflated-adjusted wages would have to increase by 3.2%-3.8% per year between 2002 and 2016 to create equilibrium in the nurse labour market by 2020 (Spetz and Given, 2003).
50. Recognizing that delayed market response may be one factor contributing to nurse shortages and surpluses implies that policy should focus on facilitating faster market adjustment to equilibrium. The United States experience suggests that, as demand for registered nurses outpaced supply, employers were slow to increase wages. Policies such as devolving the process of pay bargaining to local areas and increasing nurse representation in decision-making bodies might be adopted to speed up the adjustment process on a future occasion.
51. However, nurse workforce planning has also been blamed for recurring cycles of nurse shortages. Countries’ experiences indicate that nurse workforce planning has struggled with the intermittent timing of conducting such exercises, scarcity of timely and accurate data, difficulties with forecasting methods, inaccurate projections of future demand and supply, failure to consider the potential for substitution between different types of nurses and between nurses and physicians; resistance from the professions to accept new roles; and failure to incorporate future patterns of delivery of care by nurses. Some limited avenues for improving the effectiveness of nurse workforce planning are discussed in Box 4.

DELSA/ELSA/WD/HEA(2005)1
Box 4. Improving the effectiveness of nurse workforce planning
A number of guidelines have been proposed in the literature to inform nurse workforce planning. For instance, in 1994, the International Council of Nurses published a reference document on nurse workforce planning. This document proposed minimum data sets for any planning exercise and established a number of criteria guiding the choice of projection method for predicting demand for and supply of nurses. Groups responsible for nurse workforce planning in OECD countries such as the United Kingdom Workforce Development Confederations have also published guidelines governing workforce planning. The experience of these groups and the international literature allow us to identify some guiding principles on best practices.
Existing planning exercises have used a variety of methods to project historical data forward under a number of assumptions. According to the International Council of Nurses (1994), the selection of the most appropriate method of forecasting depends on the degree of Government involvement in planning and delivery of health care services; the quality of available data and planning expertise; the extent to which forecasts take into account previous experiences in the production and utilisation of nurses; and the extent to which forecasts are acceptable within the context of a country.
To date, none of the forecasting methods have proven accurate for long-term forecasting. A review of the literature seems to indicate that nurse workforce planning exercises are not currently able to provide accurate projections beyond a three- to five-year time period (Department of Health and Children, Ireland, 2002). This implies that nurse workforce planning exercises need to be updated regularly if they are to be of any use.
There is not much evidence as to whether nurse workforce planning is best carried out at national level or delegated to the regional level, except for the experience of the introduction of the internal market in the United Kingdom in the early 1990s. As a result, local National Health Service trusts became responsible for determining the intake to nurse education. However, the narrow focus of trusts, varying capacity of local training and education consortiums, and lack of a national overview meant that most trusts under-estimated demand for nurses (Buchan and Edwards, 2000), resulting in a marked reduction in the number of student nurses. This may have been an example of a well-known phenomenon in workforce training. Individual firms have an incentive to leave training to other firms and to recruit the skilled workers subsequently. Such incentives can lead to an underinvestment in training overall.
The international literature seems to support workforce planning for the entire health service (what is sometimes denoted by the term ‘integrated workforce planning’) rather than conducting separate planning exercises for individual professions (Department of Health and Children, Ireland, 2002). As traditional professional boundaries continue to evolve over time, the potential for substitution between health care workers needs to be taken into account in any workforce planning exercise. A move favouring an integrated workforce planning approach has been initiated in, for example, England, New Zealand and the Slovak Republic.
A recent paper commissioned by the World Health Organisation advocated the integration of workforce planning with the planning of service delivery as the configuration of services is likely to change over time (O’Brien-Pallas et al., 2001a). In this respect, the Scottish Integrated Workforce Planning Group (2002) argued that, on the one hand, services need to be planned taking into account implications for the workforce and that, on the other hand, the workforce needs to be managed in a way that supports the delivery of services.
52. In response to claims of nurse shortages, some countries have started to increase the number of available places in nursing schools. For instance, as the result of the National Health Service Plan, the United Kingdom will train 5 500 more nurses, midwives and health visitors every year by 2004 than in 1999. Increases in the number of places for nurses have also been implemented in Canada (up by 46% across all three regulated nursing groups in that country), Ireland (from 968 in 1998 to 1 640 in 2002) and a number of American states in the late 1990s.
53. To attract more students into nursing school, some countries have launched advertising campaigns that aim to attract young people into nursing and show them what it is like to work as a nurse. For instance, the Belgian Federal Government has distributed leaflets in all high schools promoting enrolment in nursing schools. In Ireland, the Nursing Careers Centre and schools of nursing received
DELSA/ELSA/WD/HEA(2005)1
IEP 765 000 in 2000 to carry out a campaign promoting and marketing nursing as a career, resulting in a 35% increase in the number of applications for nursing in 2002 (Monitoring Committee, 2002). In the United States, the Johnson & Johnson Company set up a two-year, USD 20 million national advertising and recruitment campaign in 2002. The Campaign for Nursing’s Future ran television advertisements with a Dare to Care theme showing culturally diverse nurses in quick media clips; sent recruitment brochures, posters and videos to high schools, nursing schools and nursing organisations; maintained a website offering comprehensive information about opportunities in nursing as well as creating scholarship grants for nursing students. There have been reports that this campaign has raised the visibility of nursing and has been linked with increased enrolments in entry-level baccalaureate programmes in nursing.5 As a result of such initiatives promoting the nursing profession, Ireland, Switzerland, United Kingdom and the United States have reported increased nurse school enrolment.
54. Australia, Belgium, Germany, Ireland, Netherlands, Norway and Switzerland are reviewing or reforming education paths to improve the attractiveness of the nursing profession and increase flows of nurses into the workforce. Australia, Ireland and the United Kingdom have recently carried out national reviews of nursing education. International experience seems to indicate that there is no one best model of nursing education (Department of Health and Children, 2002).
55. Reforms of nurse education paths have also focused specifically on upgrading professional profiles (e.g., in Australia, Belgium, Ireland and Spain), on making nurse education more flexible (e.g., in the United Kingdom), and on accelerating degree programmes in the United States (American Association of Colleges of Nursing, 2003a). In Australia, enrolled nurses who have the Australian Qualifications Framework Certificate 4 or the Diploma for enrolled nurses can be upgraded to become registered nurses. The French Community in Belgium has actively supported the education as nurses of lesser-qualified health staff. In 2001, Ireland announced a sponsorship scheme for experienced health care assistants wishing to train as nurses. Successful candidates were allowed to retain their salary during the four years of the degree programme in return for a commitment to work as nurses for their public health service employer following graduation. Spain intends to push for increasing professionalism through more and higher university education (Zabalegui, 2002). In 1999, the United Kingdom launched a new nursing education strategy ‘Making a difference for nurses, midwives and health visitors’, which allowed education to be spread over more than three years by incorporating take-a-break periods, introduced new pathways into nursing via national vocational qualifications and created new posts of nurse consultants. ‘Step-on, step-off’ education (you can step out of education once you have completed a year and return to the same point in the course at a later date) was specifically introduced to attract mature applicants into the nursing profession.
56. Some countries have introduced education-related funding policies to increase the number of individuals who enter nurse education. I(N Australia, the Federal Government has introduced a “rural and Remote Nurse Scholarship” programme which is a national initiative that seeks to remove some of the barriers to studying nursing or to re-entering the nursing workforce. Again, in Australia, the Victorian Government has allocated AUD 1.56 million over three years to encourage the uptake of nurse postgraduate places (Victorian Government Department of Human Services, 2001). In Canada, the province of Prince Edward Island has offered financial assistance of up to CAD 2 400 with tuition fees in return for a commitment by the student to work with the health region for an agreed period of time. A survey of American states indicated that 29 states had in place scholarship and loan repayment programmes targeted at registered nurses in 2002 (Hayes, 2002). In the United States, Congress has proposed legislation to offer loan repayments and scholarship programmes to nurse students.
5. See “Nursing campaign paying dividends” Modern Healthcare, 7th April 2003.

DELSA/ELSA/WD/HEA(2005)1
57. There may also be a role for nurse remuneration as a policy tool to attract students into the nursing profession. This is because starting salaries in jobs that have similar educational requirements to nursing appear to influence the decisions students make to enter nursing. Evidence from the United States suggests that higher wages have a significant positive effect on attracting new students to first-degree nursing programmes (Chiha and Link, 2003). Additionally, regression equations of the number of future graduations from registered nurse programmes on a number of explanatory variables found a statistically significant coefficient of lagged wage changes of 2.25-2.51, indicating that the change in past wages is a key determinant of changes in the enrolment and graduation rates of registered nurses (Spetz and Given, 2003).
58. The cost-effectiveness of these education and remuneration policies designed to increase nursing school intake depends on a number of factors. Governments may incur a substantial cost in funding additional public places in nurse schools and other nursing education initiatives. Furthermore, this requires a sufficient number of high-quality applicants available to fill the additional seats, which depends on the size of applicant cohorts and the relative attractiveness of the nursing profession. For instance, there have been reports from Austria and Germany that places in schools of nursing cannot be filled due to a lack of sufficiently qualified applicants. Evidence of attrition rates of around 20% in nursing schools in the United Kingdom also needs to be considered in the light that students appear to be leaving nursing schools because of changed perceptions of nursing as a discipline, competing demands (e.g., family care), dissatisfaction with quality of clinical placements and financial concerns rather than academic failure (Hoffman, 2003).
59. Sharp increases in the demand for training places may meet capacity constraints in nursing facilities. In the United States, the ability to educate and train more nursing students is inhibited by faculty shortages, the part-time nature of teaching and low faculty salaries. In fact, the American Association of Colleges of Nursing reported that nursing schools have turned away more than 5 000 qualified applicants due to faculty shortages (American Association of Colleges of Nursing, 2003b). In response to this, the United States has created partnerships between schools and health care facilities that allow their personnel to serve as teachers and clinical support. Additionally, legislation has been proposed to increase funding to nurse schools and boost salaries of teachers to a level comparable to clinical jobs. Some nursing schools have also introduced initiatives to fast track nurses to academic careers by exposing selected students to research and assisting nurses to complete their doctorates more quickly. Canadian universities such as the University of Alberta and University of Toronto offer graduate programs (e.g., PhD, Nurse Practitioner) that allow students to do the bulk of the work on-line or through other remote teaching and learning methods.
5.1.2 Nurse re-entry
60. Countries may have a sufficient number of qualified nurses who are not currently active to reduce or even resolve nurse shortages, if those nurses can be persuaded to re-enter the workforce. Evidence from the United States suggests that the number of registered nurses who were potentially available to work, but were currently unemployed or were working in non-nursing occupations equalled between 67% and 195% of vacant positions, depending on assumptions (Lafer et al., 2003). A recent study shows that growth in the employment of registered nurses in the United States of 5.1% in 2001-2002 was made possible by a 15.8% increase in the number of domestic registered nurses over the age of 50 in the workforce (Buerhaus et al., 2003).
61. Several countries have reported some success in stimulating the re-entry of nurses into the workforce by offering training courses and making a financial contribution to tuition fees and/or salary. In some cases, these policies have been accompanied by the requirement that nurses commit themselves to remain in the workforce for a minimum period of time.
DELSA/ELSA/WD/HEA(2005)1
62. In Australia, the Victorian Government offers funding of AUD 2 100 to each hospital and AUD 1 700 to each non-practising registered nurse undertaking a re-entry programme or accredited supervised practice programme (Victorian Government Department of Human Services, 2001). The Canadian province of Prince Edward Island reimburses the fee for the Nursing Refresher Programme to encourage nurses to re-enter the workforce in return for a commitment to work with the health region for a negotiated period, and the province of British Columbia also has had success attracting nurses back into the workforce. In 2000, the Irish Nursing and midwifery recruitment and retention initiative abolished fees for education courses for nurses returning to the workforce and paid the salary of nurses and midwives undertaking such courses. In the United Kingdom, the National Health Service Plan encouraged the return of qualified nurses by improving access to back-to-practice courses, increasing work-based learning and providing additional nursery facilities, support and mentoring to those nurses returning to work (Secretary of State for Health, 2000). Individuals who come back and complete a ‘return to practice’ course are eligible for payments of GBP 1 000 for nurses and GBP 1 500 for midwives. Figures on the number of returnees indicated that 7 812 nurses and midwives had contacted the National Health Service, 3 763 nurses and midwives had returned, and 1 906 nurses and midwives were undertaking refresher education or waiting to start education since April 2001.
5.1.3 Nurse immigration
63. In addition to domestically-trained nurses, immigration of foreign nurses can make a contribution to offsetting shortages. International flows of nurses appear to be driven by a number of pull factors such as opportunities for professional training, higher wages and better employment opportunities in the host country. Push factors such as less attractive living and conditions of service in the home country also play a role.
64. Immigration of foreign(-trained) nurses can make a significant contribution to a country’s nurse workforce. Foreign nurses made up 6.7%, 23.1% and 8.3% of the nurse workforce in 2001 in Austria, Switzerland and the United Kingdom, respectively (EUROSTAT Labour Force Survey). The proportion of foreign-trained registered nurses in New Zealand in 1997 and in the United States in 2000 was 16.5% and 3.9%, respectively (Ministry of Health, 1999; Bureau of Health Professions, 2002). Data show a decrease in the number of British registrants between 1986/87 and 1999/2000(see Figure 9), although recent increases in the number of training places mean that British registrants are likely to increase in future years. Since 1988, increasing inflows from abroad have not only been able to compensate for the falling number of British registrants, but have actually increased the total number of nurse registrants. The number of registrations awarded to foreign-trained nurses increased from 2 587 in 1984/85 to 13 599 in 2002/03.

DELSA/ELSA/WD/HEA(2005)1
Figure 9. Admissions to the United Kingdom Central Council for Nursing register, 1984-2000
Figure 9. Admissions to the Nursing and Midwifery Council register 1984 - 2002
0
5,000
10,000
15,000
20,000
25,000
30,000
35,000
40,000
84/85
85/86
86/87
87/88
88/89
89/90
90/91
91/92
92/93
93/94
94/95
95/96
96/97
97/98
98/99
99/00
00/01
01/02
02/03
TotalUKEC/Non-EC
Source: United Kingdom Central Council for Nursing (2002).
65. Developing countries are just one, but not necessarily the main source of international recruitment of nurses by OECD countries. Table 5 shows that Austria, Ireland, New Zealand and Switzerland have mainly recruited nurses from other industrialised countries or OECD countries. Moreover, although the United Kingdom and the United States recruit a substantial proportion of their foreign nurse workforce from the Philippines, nurse emigration is actively promoted by the Government of the Philippines in order to stimulate remittance monies being sent back to the country.
66. There also appear to be substantial cross-flows of nurses between OECD countries. Table 5 indicates that 30.5% of foreign nurses working in the United Kingdom originate from Ireland. Conversely, Ireland attracts 69.3% of its foreign nurses from the United Kingdom. Similar cross-flows exist between the United Kingdom and the United States. this shows the links between a common language and heritage in determining the direction of certain nursing migratory flows – a phenomenon well-known in the migration literature.

DELSA/ELSA/WD/HEA(2005)1
Table 5. Number of foreign(-trained) nurses in selected OECD countries
Composition of foreign nurse workforce, Austria (2001): 6.75%a
Composition of foreign nurse workforce in Ireland (2001):
3.63%a
Bosnia Herzegovina 29.0% Georgia 5.6% United Kingdom 69.3% Romania 13.4% Philippines 5.2% Australia 10.6% Croatia 11.6% Slovak republic 4.8% New Zealand 8.9% Czech Republic 8.1% Germany 4.1% European Union 6.6%
Poland 7.6% Federal Republic of Yugoslavia 3.3%
France 2.4%
Finland 5.7% Others 1.7% United States 2.3%
Composition of foreign-trained registered nurse workforce in New Zealand (1997): 16.5%c
Composition of foreign nurse workforce, Switzerland (2001):
23.11%a
United Kingdom 46.0% Germany 22.5% Liechtenstein 3.1% Australia 13.8% Bosnia Herzegovina 14.0% Canada 2.3% Barbados 11.6% France 9.4% Yugoslavia 2.3% South Africa 3.2% Albania 7.6% Croatia 1.8% Italy 7.0% Luxembourg 1.5% Netherlands 6.1% Spain 1.3% Finland 4.9% South America 1.2% Austria 4.8% United Kingdom 1.0% Poland 4.0% Belgium 0.9% Philippines 3.7% Georgia 0.8%
Composition of foreign nurse workforce in United Kingdom
(2001): 8.34%a
Composition of foreign-trained registered nurse workforce in
United States (2000): 3.9%b
Ireland 30.5% Poland 1.6% Philippines 43.0% Other Africa 17.8% Spain 1.4% Canada 16.1% Philippines 16.5% Finland 1.3% United Kingdom 7.8% Central America and Caribbean
8.8%
Germany 1.1% India 9.6%
United States 3.9% China 1.1%
South Africa 3.4% Hungary 1.0% South America 3.4% Sweden 1.0% Australia 3.3% Oceania and other
territories
1.0%
Southern, South Eastern Asia
2.0%
New Zealand 0.9%
Note: EUROSTAT data refer to nursing and midwifery professionals (category 223 of ISCO-88 code) and nursing and midwifery associate professionals (category 323 of ISCO-88 code). The reader should be aware that absolute numbers are very small and hence should be treated with caution.
Sources: a EUROSTAT Labour Force Survey; b Bureau of Health Professions (2002), c Ministry of Health (1999).
67. The direction of migration flows can change over time. Whereas Ireland used to export nurses, it has recently become a net importer of nurses. Table 6 shows that the number of Irish nurses/midwives seeking verification of qualifications for work abroad has decreased by 67% from 2 604 in 1989 to 860 in 1999. On the other hand, the total number of registrations by foreign nurses in Ireland amounted to 1 663 in 1999, pointing to a net inflow to Ireland of 803 nurses. A similar shift was seen in the total labour market in Ireland, reflecting high economic growth and full employment in the 1990s.

DELSA/ELSA/WD/HEA(2005)1
Table 6. Verification of qualifications of Irish nurses who wish to work abroad, 1989-1999
Reported destination
1989 1990 1991 1992 1993 1994 1995 1996 1997 1998 1999
United Kingdom 1 848 905 584 617 440 649 799 573 440 285 262
Other European Union countries
10 3 10 16 11 10 21 11 11 9 12
Australia 525 260 137 69 173 262 380 448 462 460 503
United States 167 78 71 19 23 30 19 23 20 18 40
Canada 42 76 27 16 6 2 7 4 6 7 12
Other 12 16 16 17 31 47 46 20 44 30 31
TOTAL 2 604 1 338 845 754 684 1 000 1 272 1 079 983 809 860
Note: An Bord Altranais provides information on the number of nurses and midwives obtaining verification of Irish qualifications in order to apply to register as nurses or midwives in another country. However, some nurses may obtain verification in preparation for work abroad, but may in fact never leave the country.
Source: An Bord Altranais (The Irish Department of Health and Children)
5.1.3.1 Policies influencing immigration of nurses
68. Certain OECD countries have introduced policies that aim to facilitate international recruitment of nurses. One type of policy has been to relax regulatory and certification processes in the host country to assist nurses in obtaining registration more easily. For instance, European Union Member States have adopted sectoral directives that facilitate the movement of nurses through the harmonisation and recognition of qualifications and diplomas. The so-called “nursing and midwifery directives” entitle any European Union nurse who has completed basic education in a Member State and who holds a recognised qualification to be automatically registered in any other Member State. However, the impact of the European Union nurses’ directives on the movement of nurses seems to have been minimal due perhaps to language and other barriers and to failure to implement the directives and recognise the equivalence of qualifications by some Member States. Simplified procedures exist for nurses trained in specific countries. There is a Mutual Recognition Agreement between Australia and New Zealand, providing for automatic recognition of nursing qualifications. However, the potential tension between pressures to accelerate nurse immigration and the need to maintain regulatory processes and standards has been highlighted in a few countries.6 In Greece, concerns have been raised about the qualifications and linguistic skills of foreign nurses and the quality of health care provided by foreign nurses.
69. Alternatively, some countries have fast-tracked visa or work-permit applications of foreign nurses. The entry of qualified nurses to Australia has been facilitated by identifying nurses as priority applicants. Additionally, nurses on three-month working holiday visas are able to change to a temporary visa while in Australia. Under the North American Free Trade Agreement, Canada, Mexico and the United States removed all quota limitations on the temporary migration of nurses. However, the impact of this agreement to date seems to have been limited due to the absence of requirements on licensing and recognition of qualifications and its narrow scope of application. Although the nursing profession is subject to the general provisions of the agreement, nurses must still obtain an H-1C visa7 or a temporary visa to work in the United States.
6. However, this may also serve to protect wages of domestic nurses in those countries in which pay rates are
not set at national level.
7. A non-immigrant visa allowing the holder to work in health care shortage areas.
DELSA/ELSA/WD/HEA(2005)1
70. Some countries have adopted policies of active and targeted international recruitment of nurses. There can be an overall gain in efficiency if nurses flow from countries with surpluses to countries with shortages. In England, for example, the Department of Health and the National Health Service are recruiting nurses through agreements with the Governments of Spain, India and the Philippines, countries that are reported to have nurse surpluses (OECD, 2003b). In addition to this, individual employers and recruitment agencies attract nurses from many other countries in the absence of any formal agreement.
71. To attract foreign nurses, some countries provide initial periods of supervised practice as well as language training, cultural orientation and social support (Buchan et al., 2003a). This is because a lack of knowledge of the local language and health care system has proven to inhibit immigration of nurses into some countries. Therefore, in Austria, Czech and Turkish nurses can attend free language courses. Spanish nurses who migrate to France participate in courses that aim to familiarise them with nursing practices in France and the French language, and are initially supervised by a tutor when practising. In Ireland, foreign nurses from countries other than Australia, Canada, New Zealand and the United States may be subjected to a period of supervised clinical practice, orientation and assessment. In the United Kingdom, immigrating Spanish nurses are offered an individual language programme and take part in an induction programme which covers information about the National Health Service, roles and responsibilities of the nurse profession as well as general information about living in the United Kingdom and British culture. As part of their education programme, Indian nurses who wish to work in the United States take courses in cross-cultural etiquette and English. Canada has begun to assemble a roster of best practices for integration of internationally-trained nurses that highlights a variety of programs put in place to help nurses trained outside of Canada fit into both the job and larger social environment (Munro, 2003).
72. Temporary migration may produce benefits in the home country through remittances and an upgrading of skills. Permanent migration, however, is likely to produce little or no benefits in the home country. Therefore, in response to concerns about a brain-drain in the home country, certain OECD countries have put in place policies discouraging international recruitment of nurses from developing countries.
73. Government departments, nursing associations and/or registration authorities in many OECD countries have initiated policy statements and ethical guidelines for employers recruiting nurses from other countries. However, it has been argued that such guidelines focus more on the practicalities of recruitment, rather than on any moral considerations (Buchan et al., 2003a). It is difficult to assess the impact of these guidelines on migration flows from developing countries to OECD countries. Although the 1999 guidelines from England did reduce inflows from named developed countries such as South Africa and the Caribbean, this was accompanied by increased recruitment from other developing countries that were not mentioned in the guidelines (Buchan, 2002). As a result, the Department of Health strengthened its code for international recruitment in 2001, which covers issues relating to working in developing countries, fair recruitment, advertising and working with recruitment agencies.
74. An alternative approach has been taken by Norway, which regulates international recruitment of nurses through government-to-government agreements and which has assigned responsibility for attracting a limited number of foreign nurses to a single government agency (OECD, 2003b). This approach allows the government to control migration flows and balance concerns about permanent brain drain in the home country with the need to cut nurse shortages in the host country.
75. In countries that have recruitment agencies, there have been reports that agencies have sometimes provided misleading information about nurse pay and conditions of service in host countries and have demanded large fees to assist nurses to migrate (see for example Fritsch, 2001). Therefore, some countries have regulated the role of agencies and have established a list of approved recruitment agencies that

DELSA/ELSA/WD/HEA(2005)1
comply with ethical criteria. The English Department of Health, for instance, has introduced a Code of Practice for recruitment agencies.
5.2 Reducing flows of nurses out of the workforce
76. Flows out of the nurse workforce are made up of nurses emigrating to another country, nurses moving into another profession, nurses withdrawing from the workforce for example to care for relatives, and nurses retiring. Data on net inflow/outflow rates of nurses between 1996 and 2001 reported in Table 2 also give some indication of flows in and out of the nurse workforce from 1996 to 2001. Although the profile of net inflow/outflow rates does not provide information about the reasons for the outflows, Table 2 shows net outflows from ages 50-54 onwards in all selected countries, except for the Netherlands, and net outflows in younger age bands in some cases.
5.2.1.1 Nurse emigration
77. Some OECD countries are experiencing emigration of nurses to other countries. Although there is a lack of available data, the magnitude of nurse emigration flows appears to be relatively small: 0.2% of Australian nurses emigrated in 2000, 0.9% of nurses emigrated from Norway in 2001, between 0.9% and 1.4% of British nurses emigrated in 2001. Few countries seem to have adopted policies designed to reduce the level of nurse emigration. For instance, Australia stated that it subscribes to the Commonwealth Code of Practice for the International Recruitment of Health Workers which provides governments with a framework of guidelines within which international recruitment should take place. On the other hand, some countries that are reported to have nurse surpluses have adopted policies to stimulate nurse emigration. For instance, Spain has put in place a government-to-government agreement with, for example, England to send Spanish nurses abroad.
5.2.1.2 Participation in the nurse workforce
78. There is some evidence about why experienced nurses choose to move out of nursing into other professions. Surveys of registered nurses working in jobs other than nursing in the United States, suggest that reasons for leaving nursing include a desire for: better work hours, a more professionally rewarding job, better home and family time, less exposure to violence, bullying and other abuse than in nursing jobs (Bureau of Health Professions, 2000; National Center for Health Workforce Analysis, 2002). Meanwhile, behavioural studies suggest that pay also influences flows of nurses out of the workforce. Concerning the decision of currently qualified registered nurses to cease participating in the nurse workforce, two literature reviews of relevant studies from the United Kingdom and the United States suggest that there is a short-term elasticity of workforce participation on the real wage of around 0.3, suggesting that a 10% reduction in the real wage of registered nurses would lower participation in the nurse workforce by around 3% (Antonazzo et al., 2003; Shields, 2003). That implies that any significant relative wage reduction would have a noticeable impact on participation.
79. While nominal wages of registered nurses have risen in the United States, real earnings have been quite flat for about 20 years (National Center for Health Workforce Analysis, 2002). Elementary school teachers, by contrast, have enjoyed a significant increase in actual and real earnings over the same period. Additionally, the compressed salary range between the newest and most experienced nurses may serve as a disincentive to staying in nursing because wages top off after just a few years of service. Nurses with five years experience in the United States earn about 15% to 17% more than a new graduate, but only about 1% to 5% less than their senior colleagues who may have graduated 20 years before them (National Center for Health Workforce Analysis, 2002). Initiatives that countries have taken to improve the remuneration of nurses relative to that of other professions include increases in nurse salaries in for example Ireland, and

DELSA/ELSA/WD/HEA(2005)1
the introduction of cost-of-living supplements. In the United Kingdom, for instance, pay for nurses increased by 15% (in cash terms) from 1997 to 2000 (National Health Service Executive, 2000).
80. Research has consistently shown that having young children is associated with reduced participation in the nurse workforce (Antonazzo et al., 2003; Shields, 2003). In a predominantly female workforce, the development of family-friendly policies that allow nurses to balance work and family responsibilities more easily seems to be crucial to reducing withdrawal from the nursing workforce. Survey evidence from Ireland indicates that family commitments were responsible for 44% of nurses leaving the profession (Health Services National Partnership Forum and Irish Nurses’ Organisation, 2003). The United Kingdom, for example, has made available GBP 70 million in the three years from April 2001 to build 150 on-site nurseries with places subsidised at an average of GBP 30 per place per week. The Department of Health also reported that the introduction of a Childcare Tax Credit scheme resulted in fewer nurses leaving the National Health Service (Department of Health, 2001). Every National Health Service organisation is expected to have a child care co-ordinator by 2004, responsible for providing nursery places and places for school-aged children.
5.2.1.3 Nurse retirement
81. There is little evidence that OECD countries have implemented or planned specific policies to compensate for early and partial retirements. In fact up until the late 1990s, it was a common money-saving strategy for employers in some countries to offer incentives to nurses to retire early. Where they do exist, retirement policies have centred on diminishing flows out of the nurse workforce by reducing the rate at which nurses take early retirement, by delaying retirement or by attracting retired nurses back into the workforce.
82. One policy approach to keep nurses in the workforce up to their potential retirement age is to offer more flexible working patterns that reduce workload, but do not negatively affect pay. A number of Belgian hospitals, for example, have reported some success in retaining experienced nurses while accommodating the needs of older nurses by allowing those aged 45 years and older to work 36 hours per week and those aged 55 years and older to work 32 hours per week - all for a full 40-hour salary (Peterson, 2001). This is a very expensive measure, however: it represents a 25% per hour pay rise for those over 55. In the United Kingdom, a flexible retirement initiative was launched in July 2000 that enabled staff nearing retirement to move into part-time work in ways without reducing their pension benefits. Alternatively they may take on new roles and even if they do so at a lower salary level, the pension entitlement from their higher- level post is preserved.
83. Other policies aim to defer the retirement of nurses. The United Kingdom flexible retirement initiative encourages staff to stay on beyond the normal retirement age for a limited number of months by offering additional pension contributions.
84. A third policy strand is designed to attract retired nurses back into the workforce. In the United Kingdom, National Health Service staff can retire and start receiving a pension whilst carrying on with part-time work. Such policies need to focus not only on encouraging nurses to return to practice, but also to keep potential returnees informed and interested while they are away. Therefore, all National Health Service Trusts have established ‘keep-in-touch’ schemes. This means that retiring staff can put their name forward to be called on to work for the National Health Service on a casual basis, as and when they choose.
DELSA/ELSA/WD/HEA(2005)1
6 POLICIES AFFECTING NURSE RETENTION AND TURNOVER
85. A certain amount of turnover or job mobility within nursing is to be expected in an efficient labour market, although to date there is little evidence about what this level of turnover might be and how it might differ across countries.8 A range of different studies in a variety of OECD countries, which included Australia, Canada, Korea, New Zealand, the United Kingdom and the United States, found turnover rates mainly in the range of 9-15%. (O’Brien-Pallas et al., 2003; McCarthy et al., 2002; Gray and Phillips, 1994; Audit Commission, 1997; Buchan and Seccombe, 2002; Buchan and Seccombe, 2003b; the Nursing Executive Center, 2000; Hospital and Healthcare Compensation Service, 2000). Nurse turnover rates seem to be higher than turnover rates in other professions: 7.5% for US pharmacists (American Society of Health-System Pharmacists, 2003), 9.5% for Norwegian teachers (Falch and Strøm, 2002), 8.7% for US public school teachers (National Center for Education Statistics, 1995).
86. Nurse retention and turnover involve a trade-off between benefits and costs. Possible benefits of turnover include increased productivity from more closely matching the skills of nurses with job requirements and an opportunity for the employer to change the composition of the workforce. On the other hand, turnover generates administrative costs of identifying, selecting and educating nurses and may be associated with short-term productivity losses. High levels of turnover have been linked with decreased productivity and, consequently, poor-quality patient care (Audit Commission, 1997).
87. Preliminary results of a study comparing nursing turnover among a sample of OECD countries indicate that direct and indirect costs of nurse turnover amounted to AUD 16 634 in Australia, CAD 10 101 in Canada, NZD 10 239 in New Zealand and USD 33 062 in the United States (O’Brien-Pallas et al., 2003). Two British studies provided estimates of the administrative costs and costs of productivity losses associated with nurse turnover in the National Health Service that ranged from GBP 494 to GBP 4 398 per nurse (Gray and Normand, 1990; Buchan and Seccombe, 1991). However, neither study quantified potential long-term efficiency gains from a better match of nurses and jobs. In 1997, the Audit Commission reported that the cost of replacing a Grade E nurse varied between GBP 4 200 and almost GBP 6 000 per nurse. According to the American Organization of Nurse Executives, hospitals in the United States spend nearly USD 50 000 per registered nurse in turnover costs (American Organization of Nurse Executives, 2002).
88. This section discusses some of the factors affecting nurse turnover. Additionally, it identifies, compares and evaluates the range of policy levers that decision makers and managers have used to retain nurses.
6.1 Factors affecting nurse turnover
89. Nurse turnover seems to be driven by a number of factors. These include the rate of economic growth in a country and the existence of hospital monopsony power in the labour market for nurses. Additionally, rising nurse workloads, inadequate nurse staffing and unattractive conditions of service have been related to nurse job dissatisfaction and turnover.
90. Countries have traditionally reported fewer problems retaining nurses in times of economic recession as there are fewer other employment opportunities available. The economic downturn in the early 1990s in the United Kingdom and the United States, for instance, has been cited as a factor reducing job
8. Any data need to be interpreted with caution given variability in the samples used and differences in
methods of computing turnover rates.
DELSA/ELSA/WD/HEA(2005)1
mobility, keeping nurses in jobs, working longer hours and postponing career breaks in a sample of hospitals in each country (Buchan, 1994).
91. If hospitals exercise monopsony (single buyer) power in their local labour market for nurses, profit-maximising behaviour will lead to a lower wage and nurse employment level than would occur in a competitive labour market. (See Box 5)Empirical evidence about the incidence and extent of hospital monopsony power in the labour market for registered nurses is mixed. A few studies have found evidence suggesting that hospitals have market power in the nurse labour market and act as monopsonists in setting wages (Staiger et al., 1999). However, others have observed that wages of registered nurses were not related to hospital density (Hirsch and Schumacher, 1995).
92. Fiscal stabilisation measures taken during the 1990s in certain OECD countries precipitated cost cutting, which led to significant reductions in the number of nurses and supporting staff at professional, clerical and ancillary service levels. At the same time, demand for nurses continued to rise due to ageing populations, technological advances and higher patient expectations, implying that sicker patients on average now receive care from fewer nurses with fewer support services and a more intense workload (Birch et al., 2003). Aiken et al., 2001, argued that efforts in the 1990s to restructure hospital nursing were unsuccessful in retaining nurses because these policies focused predominantly on cost cutting, reduced front-line nurse leadership roles and did not involve nurses in the process of redesigning nursing practice.
93. There is abundant evidence that the workload, an important source of nurse job dissatisfaction, has risen in some OECD countries due to a higher volume of administrative and non-patient-care-related responsibilities being assigned to nurses (Buerhaus et al., 2002). Nurses have been reported to spend time cleaning rooms or transporting food trays while a number of other tasks such as oral hygiene and skin care, teaching, and comforting patients were left undone (Aiken et al., 2001). Additionally, nurses are increasingly taking up management responsibilities. Rising workload increases overtime, injury rates, absenteeism and sick time of practising nurses, which in turn leads to higher nurse turnover (Newman and Maylor, 2002).
94. A large survey of registered nurses in Canada, England, Germany, Scotland and the United States reported high levels of nurse dissatisfaction with their job, which was attributed to negative perceptions of staffing adequacy and workforce management policies (see Box 4). High levels of job dissatisfaction, burnout and intentions to quit have also been frequently mentioned by nurses in Australia, Austria, Greece and Korea.

DELSA/ELSA/WD/HEA(2005)1
Box 5. The effect of a dominant (monopsony) hospital on nurse wage rates and employment
If a hospital is a monopsonist (single buyer) in the local market for nurses and the supply of nurses is somewhat inelastic, it will hire fewer nurses at a lower average wage rate than would be the case in a competitive market, if it wishes to maximize its profit or financial surplus.
That is illustrated in Figure 10, which depicts demand and supply schedules identical to those illustrated in Figure 2, above. The demand for nurses is derived from the revenue that the hospital can earn from an additional nurse (or the marginal revenue product of a nurse). This demand curve is assumed to slope downwards. The supply schedule is derived from the willingness of nurses to work at different wages and is assumed to slope upwards.
If the market is perfectly competitive, any one hospital will be unable to affect the wage rate and it will face a completely elastic supply of nurses. Each hospital will hire more nurses until the wage equals the marginal revenue product. The competitive equilibrium would be at wage Wc and employment level Qc where demand and supply are equal.
However, if the hospital is a monopsonist in its local market, it will find that it has to pay not only the additional nurse but all its nurses a higher wage rate if it wishes to hire more nurses. Consequently, the marginal cost of hiring an additional nurse will lie above the average cost (which can be read off from the supply curve). Profit will be maximized when this marginal cost is equal to the marginal revenue product of an additional nurse – that is when the marginal cost schedule meets the demand curve. That will be at a lower employment rate, Qm, and a lower wage rate, Wm, than in the competitive equilibrium.
Figure 10. Nurse demand and supply schedules
Quantity (employed nurses)
D Demand: marginal revenue product of an additional nurse
Wc
Wm
Qm Qc
Marginal cost to hospital of hiring an additional nurse
S Supply: willingness of nurses to work and average cost of an additional nurse
Wage rates and marginal revenue product of a nurse
MCm
DELSA/ELSA/WD/HEA(2005)1
Box 6. Hospital nurse job satisfaction in five OECD countries
A study of 43 000 registered nurses from more than 700 hospitals was conducted in Canada, England, Germany, Scotland and the United States in 1998 and 1999. Nurses in these countries with distinctly different health care systems reported low levels of job satisfaction. The proportion of registered nurses who were dissatisfied with their present job ranged from 33% to 41% for all countries, except for Germany where it was 17%. A substantial proportion of registered nurses in each country, which varied between 29% and 43%, experienced considerable job-related strain (except for Germany).
Job dissatisfaction and job-related strain both lead to registered nurses planning to leave their job. The proportion of registered nurses who were planning to leave their present job in the next year was 17% in Canada, 39% in England, 17% in Germany, 30% in Scotland and 23% in the United States.
Despite high levels of job dissatisfaction, the majority of registered nurses felt that they worked with physicians who provide high-quality care and with nurses who are clinically competent. They also stated that physicians and nurses had good working relationships.
However, registered nurses had negative perceptions of staffing adequacy. Between 30% and 50% of registered nurses in all five countries reported that there was enough staff to get the work done and that there was adequate support staff. Only around one-third of registered nurses stated that there were enough registered nurses to provide high-quality care.
Registered nurses also expressed concerns about workforce management policies. Fewer than half of registered nurses in each country reported that the hospital administration responded to nurses’ concerns, provided opportunities for nurses to participate in policy decisions and acknowledged nurses’ contributions to patient care. A minority of registered nurses felt that they had opportunities for advancement, except for nurses in Germany. Salaries were felt to be adequate by the majority of registered nurses in Canada and the United States, but not in England, Germany and Scotland.
Source: Aiken et al. (2001).
6.2 Policies designed to improve nurse retention
6.2.1 Workplace strategies
95. A common strategy employed by hospitals is to use mandatory overtime as a solution to nurse shortages. For instance, one third of nurses participating in the American Nurses Association national survey stated that they had worked involuntary overtime during the past two years (American Nurses Association, 2001). However, this strategy has not been successful as it negatively affects patient outcomes and quality of care, and leads to increased nurse turnover, lower productivity, longer patient stays and higher rates of treatment errors.9 An increasing number of American states are therefore passing legislation placing limits on mandatory overtime, with many citing patient and nurse safety concerns as a leading reason.
96. To date, evidence about which workplace strategies create and maintain a work environment that retains nurses is only beginning to emerge. A recent study documented and evaluated a number of ‘healthy workplace’ strategies being used in Canada and internationally that were perceived to have a positive
9. Research demonstrates that overtime is highly predictive of increased lost-day injury claim rates among
nurses and higher absenteeism (O’Brien-Pallas et al., 2001; Shamian et al., 2001). Concern has also been expressed that overtime and fatigue may be related to treatment errors and patient safety (Baker and Norton, 2002).

DELSA/ELSA/WD/HEA(2005)1
impact on nurse retention by improving their work life, job satisfaction and productivity (Wagner et al., 2002).10 These strategies included flexible work arrangements, family care initiatives, leave and compensation, legislation, health and well-being, physician work environment and safety practices, supportive organizational culture, union and management support and initiatives. The results indicated that employee / employer relationships constitute a crucial factor in retaining nurses. Successful strategies demonstrated employer trust in employees through: alternative work arrangements and leaves; employer commitment to employees through opportunities for educational development of nurses; continuous communication with employees through interdisciplinary interaction; and employee influence through involvement of nurses in decisions about the design of their work. Factors that contributed to successful implementation of these strategies included: choice for employer and employee; certainty and predictability for employer and employee; the need to address quality-of-life issues; the need to work within constraints; the importance of recognizing trade-offs between job security and productivity; the need to agree upon joint processes; education and preparation of a culture of change for employers and employees; and government support of workplace strategies.
97. These findings highlight the importance of developing mechanisms for the ongoing collection and dissemination of workplace strategies that have been shown to be successful in retaining nurses. For instance, the United Kingdom Department of Health launched a Good Practice Database in 2002. This database, which can be accessed through the internet, shares examples of innovative practice in National Health Service organizations that improves retention of staff, including nurses. Governments and nursing associations can also play a role here by identifying hospitals and other nursing organizations that share attributes that create and maintain work environments that retain nurses. In the United States, the Magnet Nursing Services Recognition Program was established to recognize those hospitals that were successful in retaining nurses (see Box 6). Recently, a multi-stakeholder Magnet Advisory Network was created in New Zealand to determine transferability of ‘Magnet Manuals’ developed in the United States and develop timeframes to move the work forward. One hospital in the United Kingdom acquired “Magnet” accreditation during the period 2000-02. Two surveys of the nurses concerned, in 2000 and 2002, respectively, suggested that achieving such accreditation had raised nurses job satisfaction (by 28%), and had raised the proportion of nurses who perceived quality of care to have risen in the past year (by 74%). However, interpretation of these results is clouded by the fact that Rochdale was the first hospital to acquire “Magnet” status outside the US and may not be typical. Moreover, the hospital went through a merger with other hospitals during the process of consideration (Buchan et al., 2003c).
98. Countries have developed various policies to reduce nurse turnover by alleviating workload. For instance, Canada reviewed a sample of nurse workplaces to identify those strategies that were effective in reducing workload (Baumann and Underwood, 2002). The results indicated that higher work intensity for remaining staff as the result of nurse turnover, sickness and annual leave can be avoided by hiring more nurses than strictly required. It is not clear whether such policies will always be cost-effective In Scotland, efforts are made to minimise the routine use of agency nurses by employing a larger proportion of nurses in permanent positions. Moreover, encouraging self-scheduling with appropriate support and promoting the use of technological advances offer opportunities to better cope with and even reduce workload. Delegation of tasks to other types of nurses, co-operation with physicians, and communication with patients, also constitute important components of any workload strategy. In the United Kingdom, the National Health Service Plan seeks to improve conditions of service by making employers responsible for implementing employee-friendly working patterns, including team-based, employee-led rostering, an annual envelope of hours, reduced hours options, flexitime and part-time working (Secretary of State for Health, 2000). In response to the observation of nurses performing administrative and management tasks that increase their workload and take them away from their prime role of providing patient care, the 10. However, it should be noted that the impact of these strategies on nurse retention was hypothesized but not
proven and the relative cost-effectiveness of the various strategies in retaining nurses was not considered.

DELSA/ELSA/WD/HEA(2005)1
National Health Service Plan proposed to create more consultant posts for nurses, to extend nurses’ prescribing rights, allow nurses to make and receive referrals, and admit and discharge patients.
Box 7. Magnet hospitals in the United States
Early in the 1980s, the American Academy of Nursing conducted a study to identify which hospitals were successful in retaining nurses and raising productivity and what organisational features were shared by these hospitals. As a result, 41 ‘magnet hospitals’ were identified that had a number of common organisational features that promoted and sustained professional nursing practice. These included flat organisational structures, unit-based decision making processes, influential nurse executives and investments in the education and expertise of nurses. These organisational attributes of magnet hospitals have been shown to be associated with better patient outcomes and higher levels of patient satisfaction. Nurses have experienced higher levels of job satisfaction, lower rates of burnout, lower rates of needle-stick injuries, and increased perceptions of productivity and quality of care. As a consequence, magnet hospitals have reported higher nurse retention rates. Although magnet hospitals tended to have a higher nurse-to-patient ratio, the higher nurse wage bill was more than offset by shorter lengths of stay and lower utilisation of intensive care unit days.
In the early 1990s, the American Nurses Association through the American Nurses Credentialing Center, established the Magnet Nursing Services Recognition Program to recognise excellence in professional nursing practice. This programme of magnet hospital designation is available to all hospitals and represents a voluntary form of external professional nurse peer review that is based on a hospital’s ability to meet 14 standards of nursing care. Certification as a magnet hospital involves a multi-stage process of written documentation and on-site evaluation by nurse experts. The Magnet Nursing Services Recognition Program requires hospital recertification every four years. As of October 15, 2003, there were 88 magnet-designated hospitals.
Source: Aiken et al. (2000)
99. As the nurse workforce continues to age, it will become increasingly important to retain older nurses. However, the ability of older nurses to keep up with the physical demands of nursing is questionable (Buerhaus et al., 2003). Therefore, fundamental changes are needed to improve the ergonomic work environment by promoting the use of all-electric hospital beds that allow patients to reposition themselves more easily, critical-care beds that convert to seats without needing to lift comatose patients, larger wheels on equipment to help make moving easier, electronic lifts, positioning of supplies that reduce the amount of walking in all settings, and lighter, smaller equipment for transport by community nurses. To date, few of those kinds of changes that could substantially reduce the physical workload have been implemented in any broad way.
6.2.2 Minimum nurse-to-patient ratios
100. Recognising that adequate staffing levels are often a prerequisite for creating attractive conditions of service and improving nurse retention, some countries have implemented minimum ratios of nurses to patients (see Box 7). California proposed legislated nurse-patient ratios in January 2002 to take effect in 2003 and 2004, as has the Australian state of Victoria. Since implementing its minimum staffing legislation, the Victoria government claims that 2 650 nurses who had not been working in nursing have re-entered the workforce and that demand for places in nursing schools has increased by 25.5%. In the United States, the experience of individual hospitals suggests that minimum staffing ratios are successful in reducing nurse turnover, although that sometimes came at the expense of other hospitals in the area (Lafer et al., 2003). However, more evidence is needed about whether the savings arising from reduced nurse turnover and shorter patient stays compensate for the increased costs of higher staffing levels. The implications of higher staffing levels on nurse productivity also need to be considered.
DELSA/ELSA/WD/HEA(2005)1
Box 8. Introducing minimum nurse-to-patient ratios
It is estimated that 85% of California hospitals complied with the 2003 ratios before the project was implemented (Seago et al., 2003). However, depending on the clinical setting, 15% to 54% of hospital units were not in compliance with the proposed 2004 ratios. The largest numbers that would not meet the 2004 ratios occurred in medical/surgical and other acute care, observation and rehabilitation settings.
Across all hospitals in the state, the average predicted increases in full-time equivalent registered nurse employment was 2.8% to meet 2003 ratios and 4% for 2004 ratios - leading to per-hospital spending increases averaging USD 143 836 for 2003 and USD 217 210 for 2004. These figures represent increases in nursing expenditures for 2003 and 2004 of 1.0% and 1.7%, respectively (Spetz, 2002).
Reporting to the United States Congress on minimum staffing levels in nursing homes, the Centers for Medicare and Medicaid reported evidence from 5 000 sites across 10 states to suggest that certain threshold staffing levels were associated with minimal quality outcomes for patients (http://www.cms.hhs.gov/medicaid/reports/rp700exs.pdf). The investigators also identified staffing levels beyond which no further quality was gained and suggested ratios that maximize quality outcomes. The study concluded that the nursing shortage would not preclude implementation of minimum staffing standards (2 hours per resident day for nursing aides and 1 hour per resident day for licensed nurses.) About 50% of facilities fell below these standards. It was estimated that the resulting demand would drive up registered nurse salaries 2.5% to 7% and would also impact the salaries of the Practical Nurses and aides. The investigators were cautious with regard to interpreting the impact of staffing on retention and turnover of nurses. Preliminary estimates of the cost to implement the staffing ratios in nursing homes nationally was estimated to be in the range of USD 7.6 billion for 2001 – about 8% above the current spending levels. It should be noted however, that a recent study of 90 randomly-selected nursing homes in the United States found substantial cost savings in nursing homes providing a high quality of care (median costs of USD 85.35 per resident per day) versus those considered to provide poor-quality care (USD 92.31 per resident per day) – a difference of some USD 300 000 annually for a 120-bed home (Rantz, 2003).
6.2.3 Education levels and continuing education
101. It seems that the educational composition of the nurse workforce may play a role as well as minimum nurse-to-patient ratios. Recent evidence that hospitals with a higher proportion of registered nurses exhibit improved nurse retention and lower patient mortality (Aiken et al., 2003) suggests that there may be a trade-off between the number of nurses and the education of nurses. This seems to imply that nurse turnover may be reduced by employing fewer nurses, while raising the proportion of nurses who are registered.
102. Offering opportunities for continuing education and training also appears to be crucial in retaining nurses. Continuing education may allow nurses to keep up with changes in treatment and technology, and offers a path for career advancement. In Ireland, the 2000 ‘Nursing and midwifery recruitment and retention initiative’ has offered fee support and enhanced salary to nurses and midwives undertaking part-time nursing and certain undergraduate degree courses or specific courses in specialised areas of clinical practice. In 2002, Nursing and Midwifery Planning and Development Units were established to oversee the provision of continuing nurse and midwife education in each health board area. A high level of take-up of such courses has been reported.
6.2.4 Pay levels
103. Is raising pay effective in reducing nurse turnover? Studies in Norway, the United Kingdom and the United States suggest that a higher wage does reduce the level of nurse turnover, but there is little evidence about whether the reduced costs of turnover exceed the increased costs of pay.11 The study by Gray et al. (1996) concluded that policies, which target pay increases at those grades of nurses who are
11. See, for instance, Ahlburg and Brown Mahoney (1996), Gray and Phillips (1996), Shields and Ward (2001)
and Holmas (2002).

DELSA/ELSA/WD/HEA(2005)1
particularly sensitive to the level of remuneration or where short-term productivity losses are substantial, are cost-effective. The authors also found that pay increases across-the-board for all members of the nursing profession were not a cost-effective way of reducing turnover.
6.2.5 Career advancement
104. Another strand of retention policies has focused on improving career advancement prospects for nurses. Possible approaches to guide career advancement of nursing staff that are proposed in the literature include clinical ladders, single or multi-occupation job evaluation and individual or group performance pay (see, for instance, Buchan and Thompson, 1997). In Ireland, the Nursing Careers Centre was set up in 1998 under the management of An Bord Altranais to promote and market nursing as a career and to provide career guidance. In the United Kingdom, the Department of Health launched a National Health Service Careers service in April 1999 in England that offers information on all NHS careers including nurses, midwives and health visitors. The Department of Health reported that this service received around 20 000 emails and telephone calls per month, in addition to thousands of hits on its website (www.nhs.uk/careers). The Department of Health has also promoted career progression by extending the roles of nurses, increasing the number of senior nurses and nurse consultants (Secretary of State for Health, 2000).A survey of American states indicated that 12 states had developed or were developing nursing career ladders in 2002 (Hayes, 2002).
105. A recurrent theme in the literature is the lack of leadership development of nurses. Nurses who are involved in managing their working lives tend to be more pragmatic and realistic, leading to greater job satisfaction and retention (Meadows et al., 2000). Ireland established a ‘high-level steering group on the empowerment of nurses and midwives’ in 2000 to promote the meaningful involvement of nurses and midwives in the management of services. Amongst its range of initiatives, pilot management development programmes were set up to prepare nurse managers for their role as human resource managers. The United Kingdom has introduced service modernisation sessions where staff can apply the lessons that have been learned in other parts of the National Health Service to re-design local services. Additionally, a new Leadership Centre for Health was created in 2001 which provides tailored support for staff with leadership potential at different stages in their careers and for those already in leadership roles.
6.2.6 Violence and harassment
106. Some countries have made efforts to reduce violence against and harassment of nursing staff. Ireland, for instance, developed a comprehensive policy for identifying workplace bullying and setting out effective procedures for dealing with allegations of bullying. In the United Kingdom, the National Health Service zero tolerance zone was created in October 1999, which issued guidance to managers and staff on risk assessment and prevention, how to deal with patients and members of the public who harass staff, and how to develop policies to withhold treatment from violent and abusive patients. This was accompanied by an investment of GBP 3 million over a period of three years to support new initiatives that tackled violence against National Health Service staff.
107. More work needs to be done to assess the costs of improving nurse retention by reducing workload, increasing nurse staffing levels, education and pay, and making conditions of service more attractive. Meanwhile, it is possible that savings arising from reduced nurse turnover costs, lower expenditure on temporary nurses and shorter patient stays could help in funding the necessary improvements in nurse pay and conditions of service.

DELSA/ELSA/WD/HEA(2005)1
7 CONCLUDING REMARKS
108. Over the past decade, many OECD member countries have become increasingly concerned about nurse shortages, which may negatively affect patient health outcomes, quality of care, nurses’ health and job satisfaction. The evidence of current nurse shortages is a bit mixed but projections suggest that many countries will face shortages in the coming decades. These nurse shortages are arising as a result of increasing demand for nurses due to ageing populations, new technologies which increase the range of conditions which can be treated, and greater consumer activism; and a falling or slow-growing supply due to fewer younger people entering the workforce, a greater range of professional opportunities, the low social value given to nursing, negative perceptions of nurse conditions of service and an ageing nurse workforce.
109. Policy decisions taken to reduce costs by reducing the numbers of nursing graduates and practising nurses have reduced or slowed down growth in the size of the nurse workforce. Additionally, reports from some countries suggest that lack of qualified applicants has left places in nursing schools sitting empty. In countries that may actually have enough people with the required nursing qualifications, certain jobs are deliberately left unfilled by nurses who have the required skills, but prefer to engage in other activities. This is because nurses are not willing to work under the conditions of service and pay currently offered. Unhappy with lack of pay progression and conditions of service, nurses opt out of the workforce which increases workload, overtime, injury rates, absenteeism and sick time of remaining practicing nurses. This drives additional nurses out of the workforce and aggravates nurse shortages.
110. Although nurse labour markets may match demand for and supply of nurses in an efficient way in the long-term, their response to changing demand or supply conditions may not be immediate, thus perpetuating cycles of temporary nurse shortages or surpluses. The effectiveness of nurse workforce planning appears to be inhibited by the intermittent timing of conducting planning exercises, difficulties with forecasting methods, failure to consider the potential for substitution of nurses for physicians and between different types of nurses, resistance from nurses to accept new roles, and failure to anticipate future patterns of delivery of care by nurses. In most countries, a mix of market mechanisms and government measures may be needed to match demand and supply in an efficient way.
111. To date, little is known about the cost-effectiveness of different policies designed to ensure an adequate supply of nurses on their own or in comparison with each other. National advertising, recruitment and incentive campaigns seem to have had some success in increasing enrolments in nursing schools in some countries, but these may be a slow and costly way of increasing nurse numbers when subsequent attrition and turnover is high. Also, moves to increase nursing school intake will be inhibited by the costs of funding additional public places in nursing schools, shortages of faculty and clinical placements, and smaller cohorts of young people in the population. Additionally, many countries are sustaining their nurse workforce by facilitating international recruitment of nurses. Temporary migration may produce benefits in the home country through remittances and an upgrading of skills, and increase the number of domestic nurses. However, moves to recruit nurses from developing countries need to be balanced by concerns about a brain-drain in the home country.
112. Policies designed to reduce flows of nurses out of the workforce appear to be relatively under-developed in many OECD countries. As a first step, countries need to make more efforts to maximise participation of qualified nurses in the workforce by introducing family-friendly policies. Research suggests that large pay increases would be needed to have a noticeable impact on decreasing flows of nurses out of the workforce. In the context of an ageing nurse workforce, incentives for nurses to retire early need to be replaced by policies that aim to reduce the rate at which nurses take early retirement, delay

DELSA/ELSA/WD/HEA(2005)1
retirement of nurses and attract retired nurses back into the workforce. Some countries have succeeded in retaining or re-employing considerable numbers of older nurses by raising their pay.
113. There is ample evidence that nurse dissatisfaction with staffing levels, pay and conditions of service contributes to low morale, work-related injuries and absenteeism, thereby increasing nurse turnover and exacerbating nurse shortages. Policies need to focus on introducing workplace strategies that retain nurses such as the Magnet Nursing Services Recognition Program in the United States. Evidence is also emerging that nurse retention can be enhanced by employing fewer nurses, but a higher proportion of registered nurses. More research is needed to assess the net costs of such policies that improve staffing levels, pay and conditions of service by comparing the costs of policies with any savings arising from reduced nurse turnover, lower expenditure on temporary nurses and shorter patient stays.
114. Some OECD countries, such as the United Kingdom, have recently increased nurse pay with a view to tackling nurse shortages. This reflects behavioural evidence that pay rates are important factors influencing flows in and out of the nurse workforce and nurse retention. However, little is known about the cost-effectiveness of pay as a policy tool to ensure an adequate supply of nurses. Existing studies have provided some evidence relating to how pay influences entry into the profession, participation in the workforce, retention and retirement of nurses. However, this small body of evidence is country-specific and suffers from methodological limitations. To date, it is not possible to quantify the impact of pay on overall nurse labour supply.12 There is also a shortage of data at an international level on levels of, and trends in, nurse remuneration. It is hoped to begin remedying this deficit in OECD Health Data from 2005. Another issue that has received little attention in the literature is the institutional process through which nurse remuneration levels are determined in OECD countries. There is a need to identify the stakeholders who are involved in the bargaining process, to examine how the negotiation process takes place and to investigate the balance of power between stakeholders.
115. In many countries it is argued that the measures discussed above may not be enough. To reconcile the growing demand for high-quality health care with continuing financial constraints and a dwindling supply of workers, it will be necessary for labour productivity to rise. New ways of working and improved technologies are needed to economise on the contribution both of nurses and of other health care professionals.
116. Further work is needed to identify: the best combinations of market and planning mechanisms to maintain an appropriate rate of training of nurses; the best method of planning overall nurse numbers, when planning is indicated; and the relative cost-effectiveness of the different ways of adjusting expected supply to expected demand.
12. There is also a shortage of data at an international level on levels of, and trends in, nurse remuneration. It is
hoped to begin remedying this deficit in OECD Health Data, from 2005.

DELSA/ELSA/WD/HEA(2005)1
8 REFERENCES
ACCESS ECONOMICS (2004), Employment Demand in Nursing Occupations, Report for Commonwealth Department of Health and Ageing, Australia.
AHLBURG D.A. and C.B. MAHONEY (1996), “The effect of wages on the retention of nurses” The Canadian Journal of Economics, Vol. 29, pp. S126-S129.
AIKEN L.H., S. CLARKE, R. CHEUNG, D. SLOANE and J. SILBER (2003), “Educational Levels of Hospital Nurses and Surgical Patient Mortality” Journal of the American Medical Association, Volume 290, pp. 1617-1623.
AIKEN L.H., S. CLARKE, D. SLOANE, J. SOCHALSKI, R. BUSSE, H. CLARKE, P. GIOVANNETTI, J. HUNT, A.M. RAFFERTY and J. SHAMIAN (2001), “Nurses’ Reports on Hospital Care in Five Countries” Health Affairs, Vol. 20, No. 3, pp. 43-53.
AIKEN L.H., D.S. HAVENS and D.M. SLOANE (2000), “The Magnet Nursing Services Recognition Program: A Comparison of Two Groups of Magnet Hospitals” American Journal of Nursing, Vol. 100, No. 3, p. 26.
AMERICAN ASSOCIATION OF COLLEGES OF NURSING (2001), Enrolment Increase Insufficient to Meet the Projected Need for New Nurses, American Association of Colleges of Nursing, Washington.
AMERICAN ASSOCIATION OF COLLEGES OF NURSING (2003a), Accelerated Programs: the Fast-Track to Careers in Nursing, American Association of Colleges of Nursing, Washington.
AMERICAN ASSOCIATION OF COLLEGES OF NURSING (2003b), Faculty Shortages, American Association of Colleges of Nursing, Washington.
AMERICAN ORGANIZATION OF NURSE EXECUTIVES (2002), Acute Care Hospital Survey of Registered Nurse Vacancy and Turnover Rates. Washington.
AMERICAN NURSES ASSOCIATION (2001), Analysis of American Nurses Association Staffing Survey. Cornerstone Communications Group, Warwick.
AMERICAN SOCIETY OF HEALTH-SYSTEM PHARMACISTS (2003), Pharmacy Staffing Survey 2003. ASHSP, Bethesda.
ANTONAZZO, E., A. SCOTT, D. SKATUN and R.F. ELLIOTT (2003), “The Labour Market for Nursing: A Review of the Labour Supply Literature” Health Economics, Vol. 12, pp. 465-478.
ASKILDSEN J., B. BALTAGI and T. HOLMAS (2003), “Wage Policy in the Health Care Sector: A Panel Data Analysis of Nurses’ Labour Supply” Health Economics, Vol. 12, No. 9, pp. 705–719.
AUDIT COMMISSION (1997), Finders, Keepers – The Management of Staff Turnover in NHS Trusts. Audit Commission, Oxon.

DELSA/ELSA/WD/HEA(2005)1
BAKER, G. and P. NORTON (2002), Patient Safety and Healthcare Error in the Canadian Healthcare System: A Systematic Review and Analysis of Leading Practices in Canada with Reference to Key Initiatives Elsewhere, Health Canada, Ottawa.
BAUMANN A. and J. UNDERWOOD (2002), Innovation and Strategies for Addressing Nursing Workload. Working Paper Series 02-01, Nursing Effectiveness, Utilisation and Outcomes Research Unit, McMaster University, Hamilton, and University of Toronto, Toronto.
BIRCH S., L. O'BRIEN-PALLAS, C. ALKSNIS, G. TOMBLIN MURPHY and D. THOMSON (2003), “Beyond Demographic Change in Health Human Resources Planning: An Extended Framework and Application to Nursing” Journal of Health Services Research and Policy, Vol. 8, No. 4, pp. 225-229.
BOSTROM J. and J. ZIMMERMAN (1993), “Restructuring Nursing for a Competitive Health Care Environment” Nursing Economics, Vol. 11, pp. 35-41.
BUCHAN J. (1994), “Lessons from America? US Magnet Hospitals and Their Implications for UK Nursing” Journal of Advanced Nursing, Vol. 19, pp. 373-384.
BUCHAN J. (2002), International Recruitment of Nurses: United Kingdom Case Study. Royal College of Nursing, World Health Organization and International Council of Nurses, London.
BUCHAN, J., BALL, J. AND RAFFERTY, A.M. (2003c), A Lasting Attraction? The “Magnet” Accreditation of Rochdale Infirmary; Queen Margaret University College, Edinburgh.
BUCHAN, J and L. CALMAN (2004), Skill Mix and Policy Change in the Health Workforce: Nurses in Advanced Roles, OECD Health Working Papers No. 17, Paris.
BUCHAN J., T. PARKIN and J. SOCHALSKI (2003a), International Nurse Mobility. Trends and Policy Implications. World Health Organization, Geneva.
BUCHAN J. and I. SECCOMBE (1991), Nurse Turnover Costs: A Review for the Royal College of Nursing. IMS Report No. 212, Institute of Manpower Studies, University of Sussex, Brighton.
BUCHAN J. and I. SECCOMBE (2002), Behind the Headlines - A Review of the UK Nursing Labour Market in 2001, Royal College of Nursing, London.
BUCHAN J. and I. SECCOMBE (2003b), More Nurses, Working Differently?: A Review of the UK Nursing Labour Market 2002 – 2003, Report Commissioned for the Royal College of Nursing, London.
BUCHAN J. and M. THOMPSON (1997), Recruiting, Retaining and Motivating Nursing Staff: The Use of Clinical Ladders. Institute for Employment Studies, University of Sussex, Brighton.
BUERHAUS P.I., J. NEEDLEMAN, S. MATTKE and M. STEWART (2002), “Strengthening Hospital Nursing” Health Affairs, Vol. 21, No. 5, pp. 123-132.
BUERHAUS P.I., D.O. STAIGER and D.I. AUERBACH (2003), “Is the current shortage of hospital nurses ending?” Health Affairs, Vol. 22, No. 6, pp. 191-198.
BUREAU OF HEALTH PROFESSIONS, Projected Supply, Demand, and Shortages. Health Resources and Services Administration, Washington.
BUREAU OF HEALTH PROFESSIONS (2000), The Registered Nurse Population. Health Resources and Services Administration, Washington.

DELSA/ELSA/WD/HEA(2005)1
CANADIAN NURSING ADVISORY COMMITTEE (2002), Our Health Our Future: Creating Quality Workplaces for Canadian Nurses. Advisory Committee on Health Human Resources and Health Canada, Ottawa.
CAVANAGH S.J. and M. BAMFORD (1997), “Substitution in Nursing Practice: Clinical, Management and Research Implications” Journal of Nursing Management, Vol. 5, No. 6, pp. 333-339.
DEPARTMENT OF HEALTH (2001), Investment and Reform for NHS Staff – Taking Forward the NHS Plan. Department of Health, London.
DEPARTMENT OF HEALTH AND CHILDREN (2002), Towards Workforce Planning. The Nursing and Midwifery Resource. Department of Health and Children, Dublin.
FRITSCH K. (2001), Health Workforce Migration – Western Pacific Region. Paper presented at the Global Nursing Partnerships Conference Enquiry, 19 October 2001, Atlanta.
GRAY A. and C. NORMAND (1990), “Hidden Costs of Turnover”, Health Service Journal, Vol. 100, pp. 1 646-1 647.
GRAY A. and V. PHILLIPS (1994), “Turnover, Age and Length of Service: A Comparison of Nurses and Other Staff in the National Health Service” Journal of Advanced Nursing, Vol. 19, pp. 819-827.
GRAY A. and V. PHILLIPS (1996), “Labour turnover in the British National Health Service: a local labour market analysis” Health Policy, Vol. 36, pp. 273-289.
GRAY A., V. PHILLIPS and C. NORMAND (1996), “The Costs of Nursing Turnover: Evidence from the British National Health Service” Health Policy, Vol. 38, pp. 117-128.
HAYES P. (2002), Responding to Health Workforce Shortages: State Initiatives, Activities and Policies. Department of Health, Workforce Training and Education Coordinating Board, Olympia.
HEALTH SERVICES NATIONAL PARTNERSHIP FORUM and IRISH NURSES’ ORGANISATION (2003), An Examination of Non-Practicing Qualified Nurses in the Republic of Ireland and an Assessment of their Intentions and Willingness to Return to Practice. Health Services National Partnership Forum and Irish Nurses’ Organisation, Dublin.
HEINRICH J. (2001), Nursing Workforce - Emerging Nurse Shortages Due to Multiple Factors. General Accounting Office Report to the Chairman, Subcommittee on Health, Committee on Ways and Means, House of Representatives, Washington.
HIRSCH, B. and E. SCHUMACHER (1995), “Monopsony Power and Relative Wages in the Labor Market for Nurses” Journal of Health Economics, Vol. 14, pp. 443-476.
HOLMAS T.H. (2002), “Keeping nurses at work: a duration analysis” Health Economics, Vol. 11, pp. 493-503.
HOSPITAL AND HEALTHCARE COMPENSATION SERVICE (2000), Hospital Salary and Benefits Report, 2000-2001. Hospital and Healthcare Compensation Service, Oakland.
HUMPHREYS J. (1996), “English Nurse Education and Reform in the National Health Service” Journal of Education Policy, Vol. 11, pp. 655-679.
IRWIN J. (2001), “Migration Patterns of Nurses in the EU” Eurohealth, Vol. 7, No. 4, pp. 13-15.

DELSA/ELSA/WD/HEA(2005)1
LAFER G., H. MOSS, R. KIRTNER and V. REES (2003), Solving the Nursing Shortage. Best and Worst Practices for Recruiting, Retaining and Recouping of Hospital Nurses. Labor Education and Research Center, University of Oregon, Eugene.
LUSK B., RUSSELL R.L., RODGERS J. and WILSON-BARNETT J. (2001), “Preregistration Nursing Education in Australia, New Zealand, the United Kingdom, and the United States of America” Journal of Nursing Education, Vol. 40, No. 5, pp. 197-202.
MCCARTHY G., M. TYRRELL and C. CRONIN (2002), National Study of Turnover in Nursing and Midwifery. Department of Health and Children, Dublin.
MEADOWS S., R. LEVENSON and J. BAEZA (2000), The Last Straw. Explaining the NHS Nursing Shortage. King’s Fund, London.
MINISTRY OF HEALTH (1999), New Zealand Nurses and Midwives 1997. New Zealand Health Information Service, Ministry of Health, Wellington.
MONITORING COMMITTEE (2002), Implementation of Recommendations of the Commission on Nursing. Third Annual Progress Report of Monitoring Committee. Department of Health and Children, Dublin.
MUNDY G. (2001), Aged and Community Services Australia - Submission to the Senate Inquiry into Nursing (Australia), 10 July 2001, Canberra.
MUNRO, L. (2003). A Few Good Nurses. A Forum on Best Practices for Integration of Internationally Trained Nurses. Immigrant and Refugee Employment Service Committee (Hamilton Training Advisory Board, Human Resources Development Canada, and Ontario Ministry of Training, Colleges, and Universities), Hamilton.
NATIONAL CENTER FOR EDUCATION STATISTICS (1995). Teacher Supply, Teacher Qualifications, and Teacher Turnover: 1990-9. NCES 95-744, U.S. Department of Education, Washington, http://nces.ed.gov/pubsearch/pubsinfo.asp?pubid=95778
NATIONAL CENTER FOR HEALTH WORKFORCE ANALYSIS (2002), Projected Supply, Demand and Shortages of Registered Nurses: 2000-2020. US Department of Health and Human Services, Health Resources and Services Administration, Bureau of Health Professions, Washington.
NATIONAL HEALTH SERVICE EXECUTIVE (2000), Recruiting and Retaining Nurses, Midwives and Health Visitors in the NHS – A Progress Report. Department of Health, London.
NEWMAN K. and U. MAYLOR (2002), “The NHS Plan: Nurse Satisfaction, Commitment and Retention Strategies” Health Services Management Research, Vol. 15, pp. 93-105.
NEWSCHAFFER C.J. and J.A. SCHOENMAN (1990), “Registered nurse shortages: the road to appropriate public policy” Health Affairs, Vol. 9, No. 1, pp. 98-106.
THE NURSING EXECUTIVE CENTER (2000), The Nurse Perspective: Drivers of Nurse Job Satisfaction and Turnover. The Advisory Board Company, Washington.
O'BRIEN-PALLAS L., J. SHAMIAN, J. BUCHAN, C. DUFFIELD, F. HUGHES, H. LASCHINGER, P. STONE and P. GRIFFIN (2003), An International Examination of the Cost and Impact of Turnover on Patient Safety and Nurse Outcomes: Preliminary Findings. Fifth Joint National Conference on Quality in Health Care, February 13, 2003, Toronto.
DELSA/ELSA/WD/HEA(2005)1
O’BRIEN-PALLAS, L., D. THOMSON, C. ALKSNIS and S. BRUCE (2001), “The Economic Impact of Nurse Staffing Decisions: Time to Turn Down Another Road?”, Hospital Quarterly, Vol. 4, No. 3, pp. 42-50.
O’HAGAN J. (2002), “Turning the Tide” The Sydney Morning Herald, 2 October 2002, Sydney.
OECD (2003a), Health at a Glance. OECD Indicators 2003. Organisation for Economic Co-operation and Development, Paris.
OECD (2003b), La mobilité international des professionnels de la santé : évaluation et enjeux à partir du cas sud-africain. Organisation for Economic Co-operation and Development, Paris (DELSA/ELSA/WP2(2003)4).
OECD (2003c), Spending on health and long-term care: projections to 2050 revisited. Organisation for Economic Co-operation and Development, Paris (SG/ADHOC/HEA(2003)3).
PARKES M. (1992), The Future of Nurse Education: Professional, Academic and Vocational Perspectives. Western Australia Institute of Technology, Western Australia.
PETERSON C.A. (2001), “Nursing Shortage: Not a Simple Problem - No Easy Answers” Online Journal of Issues in Nursing, Vol. 6, No. 1.
POPE G.C. and T. MENKE (1990), “Hospital labor markets in the 1980s” Health Affairs, Vol. 9, No. 4, pp. 128-137.
PRONOVOST P.J., D. DANG, T. DORMAN, P.A. LIPSETT, E. GARRETT, M. JENCKES and E.B. BASS (2001), “Intensive Care Unit Nurse Staffing and the Risk for Complications after Abdominal Aortic Surgery” Effective Clinical Practice, Vol. 4, pp. 199-206.
RANTZ M. (2003), “Does Good Quality Care in Nursing Homes Cost More or Less than Poor Quality Care?” Nursing Outlook, Vol. 51, No. 2, pp. Pages 93-94.
REINHARDT U.E. (2003), “Does the Ageing of the Population Really Drive the Demand for Health Care?” Health Affairs, Vol. 22, No. 6, pp. 27-39.
ROBINSON E.S. (2002), “Nursing 2002 Salary Survey” Nursing, Vol. 32, No. 4, pp. 46-49.
ROYAL COLLEGE OF NURSING (2002), RCN Submission to Spending Review 2002. Royal College of Nursing, London.
SCHUMACHER E. (1997), “Relative Wages and Exit Behaviour among Registered Nurses” Journal of Labor Research, Vol. 18, No. 4, pp. 581-592.
SEAGO J., J. SPETZ, J. COFFMAN, E. ROSENOFF and E. O’NEIL (2003), “Minimum Staffing Ratios: The California Workforce Initiative Survey” Nursing Economics, Vol. 21, No. 2, pp. 65-70.
SECRETARY OF STATE FOR HEALTH (2000), The NHS Plan. A Plan for Investment. A Plan for Reform. HMSO (Cm 4818-I), London.
SESHAMANI M. and A.M. GRAY (2003), “A longitudinal study of the effects of age and time to death on hospital costs” Journal of Health Economics (in press).
SHAMIAN, J., L. O'BRIEN-PALLAS, M. KERR, M. KOEHOORN, D. THOMSON, and C. ALKSNIS (2001), Effects Of Job Strain, Hospital Organizational Factors And Individual Characteristics On
DELSA/ELSA/WD/HEA(2005)1
Work-Related Disability Among Nurses, Final report Submitted to Workers' Safety Insurance Board, October 2001, Toronto.
SHIELDS M.A. (2003), The Global Shortage Of Registered Nurses: What Can Policy-Makers Learn From The Econometric Evidence On Nurse Labour Supply? Report Prepared for the Victorian Department of Treasury and Finance, Melbourne.
SHIELDS M.A. and M. WARD (2001), “Improving nurse retention in the National Health Service in England: the impact of job satisfaction on intentions to quit” Journal of Health Economics, Vol. 20, pp. 677-701.
SPETZ J. (2002). Revised Cost Estimates of Minimum Nurse-to-Patient Ratio Proposals. UCSF (University of California, San Francisco) Center for California Health Workforce Studies & Department of Community Health Systems, School of Nursing, UCSF, San Francisco.
SPETZ J. and R. GIVEN (2003), “The Future of the Nurse Shortage: will Wage Increases Close the Gap?” Health Affairs, Vol. 22, No. 6, pp. 199-206.
STAIGER D., J. SPETZ and C. PHIBBS (1999), Is There Monopsony in the Labor Market? Evidence from a Natural Experiment. NBER Working Paper No. 7 258, National Bureau of Economic Research, Cambridge.
UNITED KINGDOM CENTRAL COUNCIL FOR NURSING, MIDWIFERY AND HEALTH VISITING (2001), Fitness for Practice and Purpose. Report of the UKCC’s Post-Commission Development Group, United Kingdom Central Council for Nursing, Midwifery and Health Visiting, London.
VICTORIAN GOVERNMENT DEPARTMENT OF HUMAN SERVICES (2001), Nurse Recruitment and Retention Committee. Government Response. Policy and Strategic Projects Division, Victorian Government Department of Human Services, Melbourne.
WAGNER S., S. Bookey-Bassett, L. Clement-Gallien and J. Butler, J. (2002). A Catalogue of Current Strategies for Healthy Workplaces. Report commissioned for the Canadian Nursing Advisory Committee, Ottawa.
ZABALEGUI, A. (2002), “Nursing Education in Spain - Past, Present, Future” Nursing Education Today Vol. 22, No. 4, pp. 311-318.
ZWEIFEL P. et al. (1995), Ageing of population and health care expenditure: a red herring? Paper presented to Third European Conference on Health Economics, Stockholm, 20-22 August 1995.
ZURN P., M. DAL POZ, B. STILWELL, and O. ADAMS (2002), Imbalances in the Health Workforce. Briefing paper. World Health Organisation, Geneva.

DELSA/ELSA/WD/HEA(2005)1
OECD HEALTH WORKING PAPERS Papers in this series can be found on the OECD website: www.oecd.org/els/health/workingpapers
No. 18 PRIVATE HEALTH INSURANCE IN THE NETHERLANDS: A CASE STUDY (2004) Nicole Tapay and Francesca Colombo
No. 17 SKILL-MIX AND POLICY CHANGE IN THE HEALTH WORKFORCE: NURSES IN ADVANCED ROLES (2004) James Buchan and Lynn Calman
No. 16 SHA-BASED NATIONAL HEALTH ACCOUNTS IN THIRTEEN OECD COUNTRIES: A COMPARATIVE ANALYSIS (2004) Eva Orosz and David Morgan
No. 15 PRIVATE HEALTH INSURANCE IN OECD COUNTRIES: THE BENEFITS AND COSTS FOR INDIVIDUALS AND HEALTH SYSTEMS (2004) Francesca Colombo and Nicole Tapay
No. 14 INCOME-RELATED INEQUALITY IN THE USE OF MEDICAL CARE IN 21 OECD COUNTRIES (2004) Eddy van Doorslaer, Cristina Masseria and the OECD Health Equity Research Group
No. 13 DEMENTIA CARE IN 9 OECD COUNTRIES: A COMPARATIVE ANALYSIS (2004) Pierre Moise, Michael Schwarzinger, Myung-Yong Um and the Dementia Experts’ Group
No. 12 PRIVATE HEALTH INSURANCE IN FRANCE (2004) Thomas C. Buchmueller and Agnes Couffinhal
No. 11 THE SLOVAK HEALTH INSURANCE SYSTEM AND THE POTENTIAL ROLE FOR PRIVATE HEALTH INSURANCE: POLICY CHALLENGES (2004) Francesca Colombo and Nicole Tapay
No. 10 PRIVATE HEALTH INSURANCE IN IRELAND. A CASE STUDY (2004) Francesca Colombo and Nicole Tapay
No. 9 HEALTH CARE SYSTEMS: LESSONS FROM THE REFORM EXPERIENCE (2003) Elizabeth Docteur and Howard Oxley
No. 8 PRIVATE HEALTH INSURANCE IN AUSTRALIA. A CASE STUDY (2003) Francesca Colombo and Nicole Tapay
No. 7 EXPLAINING WAITING-TIMES VARIATIONS FOR ELECTIVE SURGERY ACROSS OECD COUNTRIES (2003) Luigi Siciliani and Jeremy Hurst
No. 6 TACKLING EXCESSIVE WAITING TIMES FOR ELECTIVE SURGERY: A COMPARISON OF POLICIES IN 12 OECD COUNTRIES (2003) Jeremy Hurst and Luigi Siciliani
No. 5 STROKE CARE IN OECD COUNTRIES: A COMPARISON OF TREATMENT, COSTS AND OUTCOMES IN 17 COUNTRIES (2003) Lynelle Moon, Pierre Moïse, Stéphane Jacobzone and the ARD-Stroke Experts Group
No. 4 SURVEY OF PHARMACOECONOMIC ASSESSMENT ACTIVITY IN ELEVEN COUNTRIES (2003) Michael Dickson, Jeremy Hurst and Stéphane Jacobzone
No. 3 OECD STUDY OF CROSS-NATIONAL DIFFERENCES IN THE TREATMENT, COSTS AND OUTCOMES OF ISCHAEMIC HEART DISEASE (2003) Pierre Moise, Stéphane Jacobzone and the ARD-IHD Experts Group
No. 2 INVESTMENT IN POPULATION HEALTH IN FIVE OECD COUNTRIES (2003) Jan Bennett
No. 1 PHARMACEUTICAL USE AND EXPENDITURE FOR CARDIOVASCULAR DISEASE AND STROKE: A STUDY OF 12 OECD COUNTRIES (2003) Michael Dickson and Stéphane Jacobzone

DELSA/ELSA/WD/HEA(2005)1
Other health-related working papers, also available from the OECD website, include:
LABOUR MARKET AND SOCIAL POLICY OCCASIONAL PAPERS No. 56 AN ASSESSMENT OF THE PERFORMANCE OF THE JAPANESE HEALTH CARE SYSTEM (2001)
Hyoung-Sun Jeong and Jeremy Hurst
No. 53 TOWARDS MORE CHOICE IN SOCIAL PROTECTION? INDIVIDUAL CHOICE OF INSURER IN BASIC MANDATORY HEALTH INSURANCE IN SWITZERLAND (2001) Francesca Colombo
No. 47 PERFORMANCE MEASUREMENT AND PERFORMANCE MANAGEMENT IN OECD HEALTH SYSTEMS (2001) Jeremy Hurst and Melissa Jee-Hughes
No. 46 EXPLORING THE EFFECTS OF HEALTH CARE ON MORTALITY ACROSS OECD COUNTRIES (2000) Zeynep Or
No. 44 AN INVENTORY OF HEALTH AND DISABILITY-RELATED SURVEYS IN OECD COUNTRIES (2000) Claire Gudex and Gaetan Lafortune
No. 41 CARE ALLOWANCES FOR THE FRAIL ELDERLY AND THEIR IMPACT ON WOMEN CARE-GIVERS (2000) Jane Jenson and Stéphane Jacobzone
No. 40 PHARMACEUTICAL POLICIES IN OECD COUNTRIES: RECONCILING SOCIAL AND INDUSTRIAL GOALS (2000) Stéphane Jacobzone
RECENT RELATED OECD PUBLICATIONS:
TOWARDS HIGH-PERFORMING HEALTH SYSTEMS (2004), OECD Health Project series
TOWARDS HIGH-PERFORMING HEALTH SYSTEMS: POLICY STUDIES (2004), OECD Health Project series
PRIVATE HEALTH INSURANCE IN OECD COUNTRIES (2004), OECD Health Project series
OECD HEALTH DATA 2004 (2004), available in English, French, German, Italian, Russian and Spanish on CD-ROM (Windows 98/2000/NT/Me/XP)
HEALTH AT A GLANCE – OECD INDICATORS 2003 (2003), published biennially
A DISEASE-BASED COMPARISON OF HEALTH SYSTEMS: What is Best and at What Cost? (2003)
OECD REVIEWS OF HEALTH CARE SYSTEMS – KOREA (2003)
POVERTY AND HEALTH (2003)
ASSESSING MICROBIAL SAFETY OF DRINKING WATER: IMPROVING APPROACHES AND METHODS (2003)
MEASURING UP: IMPROVING HEALTH SYSTEM PERFORMANCE IN OECD COUNTRIES (2002)
MEASURING EXPENDITURE ON HEALTH-RELATED R&D (2001)
A SYSTEM OF HEALTH ACCOUNTS (2000)
GENETIC TESTING: POLICY ISSUES FOR THE NEW MILLENIUM (2000)
For a full list, consult the OECD On-Line Bookstore at www.oecd.org, or write for a free written catalogue to the following address:
OECD Publications Service 2, rue André-Pascal, 75775 PARIS CEDEX 16
or to the OECD Distributor in your country