taiwan statistical data book 2019
TRANSCRIPT

Taiwan Statistical Data Book
2019
National Development Council
R.O.C. (Taiwan)


Preface
I. The Taiwan Statistical Data Book is designed to give domestic and foreign
readers concise statistical information on present-day Taiwan, Republic of
China. The statistics cover demographic, economic, social, cultural and physi-
cal aspects. This book is produced only in English.
II. Considering the trend of energy conservation and carbon reduction, from
2016, we will gradually replace printed copies with e-documents. Our
book can be downloaded on our website: http://www.ndc.gov.tw.
(Home Statistics Taiwan Statistical Data Book)

I. Statistical data published herein are compiled from material collected from various agencies concerned.
II. The metric system of measurement and calendar year are used unless otherwise specified.
III. Figures which appeared in previous editions have been updated, wherever necessary.
IV. Symbols:
( ) indicates inapplicability, discontinuity, etc.;
(…) indicates unavailability of statistical data;
( 0 ) indicates that a figure is zero or less than half of the unit of measurement.
Taiwan Statistical Data Book
Explanatory Notes

��������


PageAbstract of Key Economic and Social Statistics
1. International Comparison of Economic Growth Rates, Foreign Exchange Rates, 1and External Accounts
2. Sources of Taiwan's Economic Growth 43. Taiwan's Macroeconomic Performance 84. Products of which Taiwan was among the World's Three Largest Producers 125. Taiwan's Science and Technology Development Indicators 146. Taiwan's Human Resources 157. Statistical Data of Taiwan's Official Development Assistance 17
1. Indicators1. Indicators of the Taiwan Economy 19
2. Area and Population2-1. Area and Geographical Position of Taiwan 252-2. Population 272-3. Population Density and Vital Statistics 282-4. Population Aged 15 and Over by Level of Education 292-5. Population by Dependent and Working Age Groups 302-6. Population by Age Group 312-7. Percentages of Population by Age Group 332-8. Labor Force Statistics 35
Taiwan Statistical Data Book 2019
Contents
i

Page2-9. Employment by Industry 372-10. Employment by Level of Education 392-11. Average Monthly Working Hours of Employees of Nonagricultural Industries 412-12. Average Monthly Earnings of Employees of Nonagricultural Industries 432-13. Indices of Average Earnings of Employees of Nonagricultural Industries 452-14. Labor Productivity in Industry 472-15. Unit Labor Cost in Industry 49
3. National Income3-1. Gross Domestic Product and Gross National Income 513-2. Average Annual Growth Rate of Real GDP 523-3. Average Annual Growth Rate of Real GNI 543-4. Per Capita Gross National Income 563-5. National Income 573-6. Per Capita National Income 583-7. Distribution of National Income 593-8. Gross Domestic Product by Industry 613-9. Expenditure on Gross National Income 653-10. Sources of Economic Growth: Expenditure Side 693-11. Composition of Gross Capital Formation by Owner 713-12. Composition of Fixed Capital Formation by Industry 733-13. Composition of Gross Capital Formation by Type of Capital Goods 77
ii
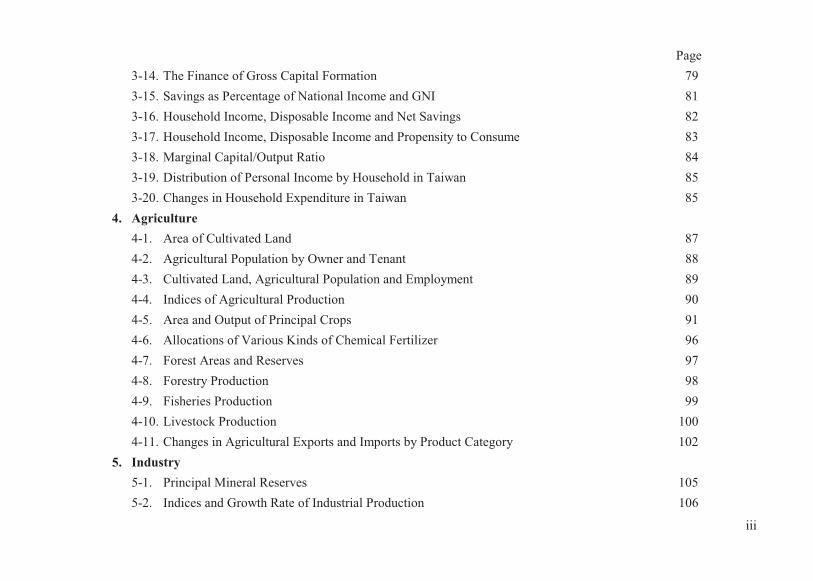
Page3-14. The Finance of Gross Capital Formation 793-15. Savings as Percentage of National Income and GNI 813-16. Household Income, Disposable Income and Net Savings 823-17. Household Income, Disposable Income and Propensity to Consume 833-18. Marginal Capital/Output Ratio 843-19. Distribution of Personal Income by Household in Taiwan 853-20. Changes in Household Expenditure in Taiwan 85
4. Agriculture4-1. Area of Cultivated Land 874-2. Agricultural Population by Owner and Tenant 884-3. Cultivated Land, Agricultural Population and Employment 894-4. Indices of Agricultural Production 904-5. Area and Output of Principal Crops 914-6. Allocations of Various Kinds of Chemical Fertilizer 964-7. Forest Areas and Reserves 974-8. Forestry Production 984-9. Fisheries Production 994-10. Livestock Production 1004-11. Changes in Agricultural Exports and Imports by Product Category 102
5. Industry5-1. Principal Mineral Reserves 1055-2. Indices and Growth Rate of Industrial Production 106
iii

Page5-3. Indices of Industrial Production by Sectors 1075-4. Output of Principal Industrial Products 1105-5. Installed Capacity and Operation of the Power System 1125-6. Power Generation and Consumption 1175-7. Power Consumption by Industry 1195-8. Supply of Commercial Energy 1205-9. Final Demand for Commercial Energy 1225-10. Final Consumption of Commercial Energy by Sector 1245-11. Number of Factories Registered 126
6. Science and Technology6-1. R&D Expenditure Indicators 1276-2. R&D Personnel Indicators 1276-3. Science and Technology Output Indicators 1286-4. R&D Expenditure by Source of Funds 1286-5. R&D Expenditure by Sector of Performance 1296-6. R&D Expenditure by Type of R&D 1296-7. R&D Expenditure by Field of Science and Technology 1306-8. R&D Expenditure as a Percentage of GDP in Selected Countries 130
iv

Page7. Transportation and Communications
7-1. Indices of Transportation and Communications 131
7-2. Route Length of Railway 132
7-3. Number of Railway Stations 133
7-4. Length of Roads 134
7-5. Number of Motor Vehicles Registered 135
7-6. Railway and Road Densities 136
7-7. Railway and Highway Carriers Traffic 137
7-8. Civil Aviation Transportation at Airports 138
7-9. Freight Handled at Seaports 140
7-10. Imports and Exports Carried by National & Foreign Vessels 142
7-11. Number of R.O.C. - Registered Ships and Volume of Cargo 143
7-12. Number of Visitors Arriving by Residence 144
7-13. Number of Visitors Arriving by Visiting Purpose 145
7-14. Postal Establishments and Mail Routes 146
7-15. Volume of Postal Service 147
7-16. Telephone Traffic and Subscriptions 149
7-17. Broadband Internet Accounts 150
v

Page8. Money and Banking
8-1. Principal Financial Indicators 1518-2. Number of Financial Institutions 1538-3. Non-financial Sector Sources of Funds 1558-4. Monetary Aggregates 1598-5. Factors Affecting Monetary Aggregate (M1B) 1608-6. Deposits of All Banks by Account 1618-7. Total Deposits with Monetary Financial Institutions 1638-8. Deposits with All Banks by Depositor 1658-9. Loans and Discounts at All Banks by Borrower 1678-10. Loans of Other Monetary Financial Institutions 1718-11. Major Liabilities of Other Financial Institutions 1728-12. Loans of Other Financial Institutions 1738-13. Foreign Exchange Rates and Bank Interest Rates 174
9. Public Finance9-1. Net Governmet Revenues, Expenditures and Financing of All Levels 1759-2. Net Government Revenues of All Levels by Source 1779-3. Net Government Expenditures of All Levels by Administrative Affair 1799-4. Net Government Expenditures of All Levels as a Percentage of GDP 1819-5. Total Tax Revenues 182
vi

Page9-6. Structure of Total Tax Revenues 1849-7. Total Tax Revenues by Direct and Indirect Taxes 1869-8. Tax Revenues Index 187
10. Prices10-1. Price Indices 18910-2. Group Indices of Wholesale Prices 19010-3. Group Link Indices of Wholesale Prices 19310-4. Consumer Price Indices 19610-5. Consumer Price Link Indices 19710-6. Import Price Indices 19810-7. Import Price Link Indices 20010-8. Export Price Indices 20210-9. Export Price Link Indices 20310-10. Indices of Prices Received and Paid in Agricultural Production 20410-11. Link Indices of Prices Received and Paid by Farmers 205
11. External Trade11-1. Balance of Payments 20711-2. Indices of Foreign Trade 21111-3. Export and Import Foreign Exchange Proceeds & Payments 21311-4. Foreign Trade (Customs Statistics) 21411-5. Exports and Imports Per Capita 215
vii
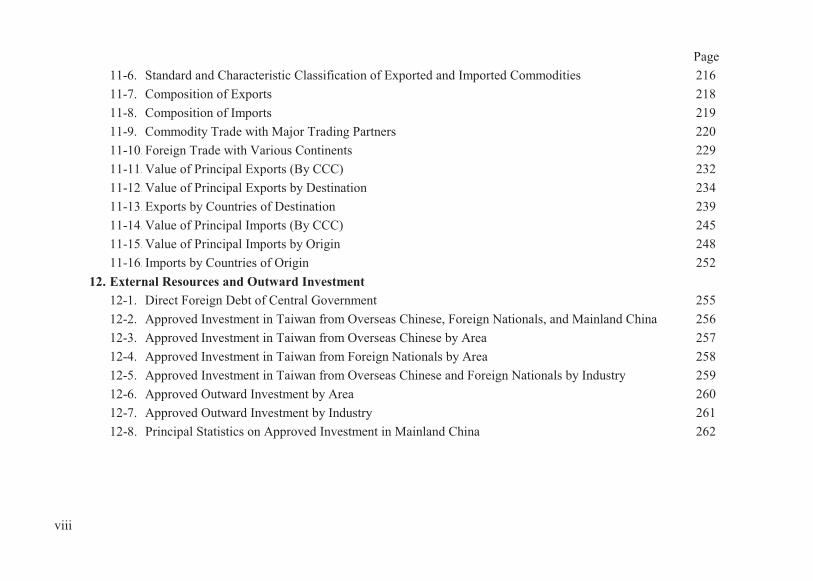
Page11-6. Standard and Characteristic Classification of Exported and Imported Commodities 21611-7. Composition of Exports 21811-8. Composition of Imports 21911-9. Commodity Trade with Major Trading Partners 22011-10.Foreign Trade with Various Continents 22911-11.Value of Principal Exports (By CCC) 23211-12.Value of Principal Exports by Destination 23411-13.Exports by Countries of Destination 23911-14.Value of Principal Imports (By CCC) 24511-15.Value of Principal Imports by Origin 24811-16.Imports by Countries of Origin 252
12. External Resources and Outward Investment12-1. Direct Foreign Debt of Central Government 25512-2. Approved Investment in Taiwan from Overseas Chinese, Foreign Nationals, and Mainland China 25612-3. Approved Investment in Taiwan from Overseas Chinese by Area 25712-4. Approved Investment in Taiwan from Foreign Nationals by Area 25812-5. Approved Investment in Taiwan from Overseas Chinese and Foreign Nationals by Industry 25912-6. Approved Outward Investment by Area 26012-7. Approved Outward Investment by Industry 26112-8. Principal Statistics on Approved Investment in Mainland China 262
viii

Page13. Education and Culture
13-1. Number of Schools, Personnel, Students and Graduates 26513-2. Number of Schools by Level of Education 26613-3. Number of School Personnel by Level of Education 26713-4. Number of Classes in Elementary and Secondary Schools 26813-5. Number of Students by Level of Education 26913-6. Number of Students Receiving Higher Education by Discipline 27113-7. Number of Students Receiving High School, Normal and Vocational Education 27413-8. Percentage of Graduates Enrolled in Next Higher Level of Schools 27513-9. Availability of Schools and Teachers 27613-10. Educational Expenditure Per Student at All Levels 27713-11. Students Studying Abroad 27813-12. Number of Newspapers, Periodicals, News Agencies and Publishing Corporations 28213-13. Arts and Cultural Activities in Taiwan 282
14. Health and Medical Care14-1. Health Workforce 28314-2. Availability of Medical Care 28514-3. Incidence of Communicable Diseases 28614-4. Leading Causes of Death 29414-5. Food Intake Per Capita Per Day 29614-6. Social Indicators 297
ix

Page15. Social Affairs
15-1. Units and Persons Insured under Labor and Farmers' Insurances Schemes 29915-2. Premiums and Compensation under Labor and Farmers' Insurances Schemes 30915-3. Compensation from Labor and Farmers' Insurance Schemes by Industry 31315-4. Compensation from Labor Insurance by Category of Payment 32315-5. Compensation from Farmers' Insurance by Category of Payment 32515-6. Units Insured under Government Employee Insurance and Related Insurance 327
Programs15-7. Persons Insured under Government Employee Insurance and Related Insurance 328
Programs15-8. Receipts and Expenditures of Government Employee Insurance 32915-9. Medical Care and Cash Benefits under Government Employee Insurance 33015-10. Major Receipts and Expenditures of Government Employee Insurance and Related 332
Insurance Programs15-11. Units and Persons Insured under Government Employee and School Staff 333
Insurance and Retired Government Employee Insurance15-12. Receipts and Expenditures of Government Employee and School Staff Insurance 33415-13. Receipts and Expenditures of Retired Government Employee Insurance 33715-14. Cash Benefits under Government Employee and School Staff Insurance 33815-15. Cash Benefits under Retired Government Employee Insurance 339
x

Page15-16. Number of Group Insurance Applicants and Beneficiaries under National Health 340
Insurance15-17. Average Amount of Monthly Payroll on which National Health Insurance 344
Premiums Are Assessed15-18. Revenues and Costs of National Health Insurance 346
16. National Well-being Indicators16-1. Housing conditions 34716-2. Income and Wealth 34816-3. Jobs and Earnings 34916-4. Social connections 35016-5. Education and skills 35116-6. Environmental quality 35216-7. Civic engagement and governance 35316-8. Health status 35416-9. Subjective Well-Being 35516-10. Personal security 35616-11. Work and life balance 357
xi

Page17. International Statistics
17-1. Area and Population 35917-2. Economically Active and Total Populations 36017-3. Distribution of Employment by Industry 36117-4. Population by Age Group 36217-5. Gross Domestic Product and Per Capita GDP 36317-6. Savings and Investment 36417-7. Structure of Gross Domestic Product by Industry 36517-8. Expenditure on Gross Domestic Product 36617-9. External Debt 36717-10. Indices of Industrial Production 36817-11. Producer Price Indices 36917-12. Consumer Price Indices 37017-13. International Rankings 371
xii
ABSTRACT OF KEY ECONOMIC
AND SOCIAL STATISTICS


1-a. International Comparison of Economic Growth Rates, Foreign
A. Economic Growth Rates Unit: %
Year Rep. ofChina Hong Kong Indonesia India Japan Rep. of
KoreaMainland
China Malaysia Philippines
2010 10.6 6.8 6.4 10.3 4.2 6.5 10.6 7.5 7.6 2011 3.8 4.8 6.2 6.6 -0.1 3.7 9.5 5.3 3.7 2012 2.1 1.7 6.0 5.5 1.5 2.3 7.9 5.5 6.7 2013 2.2 3.1 5.6 6.4 2.0 2.9 7.8 4.7 7.1 2014 4.0 2.8 5.0 7.4 0.4 3.3 7.3 6.0 6.1 2015 0.8 2.4 4.9 8.0 1.2 2.8 6.9 5.1 6.1 2016 1.5 2.2 5.0 8.2 0.6 2.9 6.7 4.2 6.9 2017 3.1 3.8 5.1 7.2 1.9 3.1 6.8 5.9 6.7 2018 2.6 3.0 5.2 7.1 0.8 2.7 6.6 4.7 6.2
Year Singapore Thailand Australia France Germany Italy Switzerland UnitedKingdom
UnitedStates
2010 15.2 7.5 2.4 1.9 3.9 1.7 2.9 1.7 2.6 2011 6.5 0.8 2.8 2.2 3.7 0.6 1.8 1.6 1.6 2012 4.3 7.2 3.9 0.3 0.7 -2.8 1.0 1.4 2.2 2013 5.0 2.7 2.1 0.6 0.6 -1.7 1.9 2.0 1.8 2014 4.1 1.0 2.6 1.0 2.2 0.1 2.5 2.9 2.5 2015 2.5 3.1 2.5 1.1 1.5 0.9 1.3 2.3 2.9 2016 2.8 3.4 2.8 1.2 2.2 1.1 1.6 1.8 1.6 2017 3.9 4.0 2.4 2.2 2.5 1.6 1.7 1.8 2.2 2018 3.2 4.1 2.8 1.5 1.5 0.9 2.5 1.4 2.9
Sources: (1) Online database of Directorate-General of Budget, Accounting & Statistics, Executive Yuan, R.O.C., retrieved June 2019.
(2) IMF World Economic Outlook Database April 2019.
Exchange Rates, and External Accounts
1
Rep. of China Hong Kong Indonesia India Japan Rep. of Korea Mainland China Malaysia
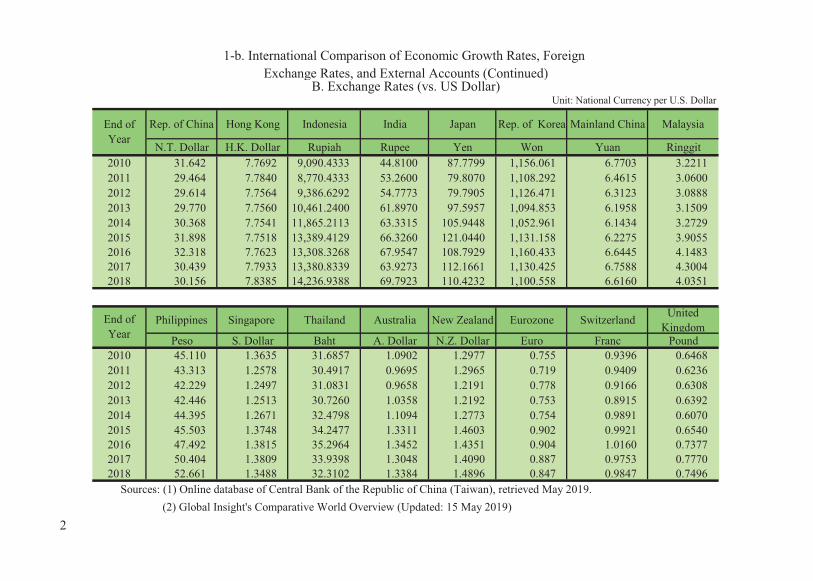
N.T. Dollar H.K. Dollar Rupiah Rupee Yen Won Yuan Ringgit2010 31.642 7.7692 9,090.4333 44.8100 87.7799 1,156.061 6.7703 3.2211 2011 29.464 7.7840 8,770.4333 53.2600 79.8070 1,108.292 6.4615 3.0600 2012 29.614 7.7564 9,386.6292 54.7773 79.7905 1,126.471 6.3123 3.0888 2013 29.770 7.7560 10,461.2400 61.8970 97.5957 1,094.853 6.1958 3.1509 2014 30.368 7.7541 11,865.2113 63.3315 105.9448 1,052.961 6.1434 3.2729 2015 31.898 7.7518 13,389.4129 66.3260 121.0440 1,131.158 6.2275 3.9055 2016 32.318 7.7623 13,308.3268 67.9547 108.7929 1,160.433 6.6445 4.1483 2017 30.439 7.7933 13,380.8339 63.9273 112.1661 1,130.425 6.7588 4.3004 2018 30.156 7.8385 14,236.9388 69.7923 110.4232 1,100.558 6.6160 4.0351
Philippines Singapore Thailand Australia New Zealand Eurozone Switzerland UnitedKingdom
Peso S. Dollar Baht A. Dollar N.Z. Dollar Euro Franc Pound2010 45.110 1.3635 31.6857 1.0902 1.2977 0.755 0.9396 0.6468 2011 43.313 1.2578 30.4917 0.9695 1.2965 0.719 0.9409 0.6236 2012 42.229 1.2497 31.0831 0.9658 1.2191 0.778 0.9166 0.6308 2013 42.446 1.2513 30.7260 1.0358 1.2192 0.753 0.8915 0.6392 2014 44.395 1.2671 32.4798 1.1094 1.2773 0.754 0.9891 0.6070 2015 45.503 1.3748 34.2477 1.3311 1.4603 0.902 0.9921 0.6540 2016 47.492 1.3815 35.2964 1.3452 1.4351 0.904 1.0160 0.7377 2017 50.404 1.3809 33.9398 1.3048 1.4090 0.887 0.9753 0.7770 2018 52.661 1.3488 32.3102 1.3384 1.4896 0.847 0.9847 0.7496
(2) Global Insight's Comparative World Overview (Updated: 15 May 2019)
1-b. International Comparison of Economic Growth Rates, Foreign Exchange Rates, and External Accounts (Continued)
B. Exchange Rates (vs. US Dollar)
Sources: (1) Online database of Central Bank of the Republic of China (Taiwan), retrieved May 2019.
Unit: National Currency per U.S. Dollar
End ofYear
End ofYear
2

1-c. International Comparison of Economic Growth Rates, Foreign Exchange Rates, and External Accounts (Continued)
C. Current Account Balances, External Debts, and Foreign Exchange Holdings Unit: US$ billion
Year Rep. of China Hong Kong Singapore Rep. of Korea Thailand India Indonesia Malaysia Mainland ChinaExternal Current Account Balance
2012 43.2 4.1 49.3 48.8 -1.7 -87.8 -24.4 16.2 215.4 2013 49.9 4.2 48.3 77.3 -4.9 -32.3 -29.1 11.3 148.2 2014 60.5 4.1 56.0 83.0 15.2 -26.8 -27.5 14.8 236.0 2015 73.1 10.3 52.0 105.1 32.1 -22.1 -17.5 9.0 304.2 2016 71.6 12.7 55.5 97.9 48.2 -14.4 -17.0 7.2 202.2 2017 83.5 15.9 53.9 75.2 50.2 -48.7 -16.2 9.4 164.9 2018 71.9 12.6 63.9 76.4 37.7 -68.5 -31.1 8.3 49.2
External Debt (End of Year)2012 130.8 1029.9 1521.9 408.9 130.7 409.4 252.4 196.9 737.0 2013 170.1 1160.8 1346.0 423.5 141.9 446.2 266.1 212.3 863.2 2014 177.9 1301.0 1412.6 424.3 141.7 474.7 293.3 214.0 1779.9 2015 159.0 1300.4 1325.6 396.1 131.1 485.1 310.7 195.0 1383.0 2016 172.2 1356.4 1389.2 382.2 132.2 471.8 320.0 203.8 1415.8 2017 181.9 1576.6 1400.5 412.0 155.2 495.7 352.5 217.9 1710.6 2018 191.2 1693.5 1468.8 440.6 158.1 510.4 376.8 223.5 …
Foreign Exchange Holdings (End of Year)2012 403.2 317.4 259.3 327.0 181.6 292.0 112.8 139.7 3,387.9 2013 416.8 311.2 273.1 346.5 167.3 304.2 99.4 134.9 3,880.4 2014 419.0 328.5 256.9 363.6 157.1 341.6 111.9 115.9 3,899.3 2015 426.0 358.8 247.7 368.0 156.5 360.2 105.9 95.3 3,406.1 2016 434.2 386.2 246.6 371.1 171.9 370.0 116.4 94.5 3,097.8 2017 451.5 431.4 279.9 389.3 202.6 424.5 130.2 96.4 3,235.9 2018 461.8 424.7 287.7 403.7 205.6 400.2 120.7 104.0 3,168.0
Sources: (1) IMF World Economic Outlook Database April 2019. (2) Online database of Central Bank of the Republic of China (Taiwan), retrieved May 2019.
(3) Asia Development Bank, Asia Development Outlook April 2019.
3

2-a. Sources of Taiwan's Economic Growth A. By Expenditure
Item 2010 2011 2012 2013 2014 2015 2016 2017 2018Real Growth Rate (%)Gross Domestic Product 10.6 3.8 2.1 2.2 4.0 0.8 1.5 3.1 2.6 Domestic Demand 10.3 0.6 0.6 2.0 3.7 1.9 2.1 1.2 3.2 Private Consumption 3.8 3.1 1.8 2.3 3.4 2.6 2.4 2.5 2.0 Government Consumption 1.1 2.0 2.2 -0.8 3.7 -0.1 3.6 -0.6 3.7 Fixed Capital Formation 19.3 -1.2 -2.6 5.3 2.1 1.6 2.4 -0.1 2.5 Private 27.6 1.2 -0.4 7.1 3.6 3.0 2.8 -1.1 1.8 Government -2.9 -5.8 -11.0 -2.8 -7.5 -2.7 1.6 5.8 2.5 Public Enterprises 7.5 -13.4 -7.4 3.0 5.0 -7.1 -3.9 0.2 13.8 Increase in Inventory … … … … … … … … … Net Exports of Goods & Services … … … … … … … … … Exports of Goods & Services 25.7 4.2 0.4 3.5 5.9 -0.4 1.9 7.4 3.8 (Less): Imports of Goods & Services 28.0 -0.5 -1.8 3.4 5.7 1.1 3.1 5.3 5.0 Contribution (percentage point)Gross Domestic Product 10.6 3.8 2.1 2.2 4.0 0.8 1.5 3.1 2.6 Domestic Demand 9.6 0.5 0.6 1.9 3.4 1.7 1.9 1.1 2.8 Private Consumption 2.1 1.7 1.0 1.3 1.9 1.4 1.2 1.3 1.1 Government Consumption 0.2 0.3 0.3 -0.1 0.5 0.0 0.5 -0.1 0.5 Fixed Capital Formation 4.1 -0.3 -0.6 1.2 0.5 0.4 0.5 0.0 0.5 Private 4.1 0.2 -0.1 1.2 0.6 0.5 0.5 -0.2 0.3 Government -0.1 -0.2 -0.4 -0.1 -0.2 -0.1 0.0 0.2 0.1 Public Enterprises 0.13 -0.24 -0.11 0.04 0.07 -0.09 -0.04 0.00 0.14 Increase in Inventory 3.2 -1.1 -0.1 -0.5 0.5 0.0 -0.4 -0.1 0.7 Net Exports of Goods & Services 1.1 3.3 1.5 0.3 0.7 -0.9 -0.4 2.0 -0.2 Exports of Goods & Services 15.5 3.0 0.3 2.5 4.1 -0.3 1.2 4.7 2.4 (Less): Imports of Goods & Services 14.4 -0.3 -1.2 2.1 3.4 0.7 1.6 2.7 2.6
Sources: Online database of Directorate-General of Budget, Accounting & Statistics, Executive Yuan, R.O.C., retrieved June 2019. 4

B. By IndustryItem 2010 2011 2012 2013 2014 2015 2016 2017 2018
Real Growth Rate (%)Gross Domestic Product 10.6 3.8 2.1 2.2 4.0 0.8 1.5 3.1 2.6 Agriculture 2.3 4.5 -3.2 1.4 1.6 -8.4 -10.1 8.4 2.3 Industry 20.8 6.0 3.3 1.7 7.2 -0.5 2.8 4.6 3.3 Mining and Quarrying 44.4 -4.8 -1.0 -4.2 -4.4 -6.6 -7.4 -0.6 4.7 Manufacturing 22.7 6.8 3.7 1.7 8.2 -0.3 3.1 5.3 3.4 Electricity, Gas Supply, 4.8 2.8 1.7 3.1 1.9 -5.4 4.5 -0.4 1.4 Construction 13.7 1.0 -1.4 0.9 0.8 -0.9 -1.5 -0.6 3.3 Services 6.3 3.1 1.3 2.3 3.3 1.2 1.3 2.5 2.6 Wholesale and Retail Trade 6.3 3.7 1.1 1.6 4.2 0.4 1.0 3.8 3.4 Transportation and Storage 7.6 2.1 1.8 7.6 0.9 -0.6 2.9 5.9 4.8 Accommodation and Food Services 10.6 10.0 2.4 4.1 1.9 2.1 1.7 0.3 2.9 Information and Communications 9.4 3.6 3.1 3.4 3.2 5.4 3.7 3.4 1.9 Finance, Insurance 8.4 4.2 1.1 4.0 7.6 3.8 2.4 5.1 3.4 Professional, Scientific & Technical Services 5.3 4.2 2.0 1.5 1.2 -0.2 0.6 -1.0 2.2 Supporting Services 8.5 4.4 4.8 2.5 4.4 4.9 3.1 3.5 2.8 Public Administration and Defence 3.1 0.0 0.7 -0.7 -0.2 0.1 -0.1 0.9 0.9 Educational Services 2.3 2.6 1.1 0.7 1.1 0.1 -0.9 -1.0 0.3 Human Health Services 1.6 5.5 0.3 -0.8 4.3 1.2 2.9 1.4 3.2 Others 4.3 2.2 2.0 1.6 4.8 -0.2 -0.3 1.3 4.0 Statistical discrepancy ... ... ... ... ... ... ... ... ...
2-b. Sources of Taiwan's Economic Growth (Continued)
5

Item 2010 2011 2012 2013 2014 2015 2016 2017 2018Contribution (percentage point)
Gross Domestic Product 10.6 3.8 2.1 2.2 4.0 0.8 1.5 3.1 2.6 Agriculture 0.04 0.07 -0.05 0.02 0.03 -0.15 -0.17 0.15 0.04 Industry 6.56 2.03 1.07 0.55 2.40 -0.21 0.99 1.64 1.20 Mining and Quarrying 0.06 -0.01 0.00 0.00 0.00 -0.01 -0.01 0.00 0.00 Manufacturing 6.06 1.97 1.07 0.48 2.35 -0.08 0.92 1.64 1.08 Electricity and Gas Supply 0.07 0.05 0.00 0.03 0.00 -0.10 0.10 -0.01 0.02 Construction 0.34 0.03 -0.04 0.02 0.02 -0.02 -0.04 -0.01 0.08 Services 4.19 1.98 0.84 1.50 2.12 0.80 0.84 1.58 1.60 Wholesale and Retail Trade 1.10 0.63 0.19 0.27 0.72 0.06 0.16 0.61 0.55 Transportation and Storage 0.21 0.06 0.05 0.22 0.02 -0.02 0.09 0.17 0.14 Accommodation and Food Services 0.22 0.21 0.06 0.10 0.05 0.05 0.04 0.01 0.08 Information and Communications 0.33 0.12 0.10 0.11 0.10 0.16 0.11 0.10 0.05 Finance, Insurance 0.53 0.26 0.07 0.26 0.49 0.25 0.15 0.33 0.23 Professional, Scientific & Technical Services 0.12 0.09 0.04 0.03 0.03 0.00 0.01 -0.02 0.04 Supporting Services 0.12 0.06 0.07 0.04 0.07 0.07 0.05 0.05 0.04 Public Administration and Defence 0.24 0.00 0.05 -0.05 -0.02 0.00 0.00 0.06 0.06 Educational Services 0.11 0.12 0.05 0.03 0.05 0.01 -0.04 -0.04 0.01 Human Health Services 0.05 0.15 0.01 -0.02 0.13 0.04 0.08 0.04 0.10 Others 0.12 0.06 0.05 0.04 0.13 0.00 -0.01 0.03 0.10 Statistical discrepancy ... ... ... ... ... ... ... ... ...
2-b. Sources of Taiwan's Economic Growth (Continued)B. By Industry
6

Item 2010 2011 2012 2013 2014 2015 2016 2017 2018
Contribution (percentage point)
Gross Domestic Product 10.6 3.8 2.1 2.2 4.0 0.8 1.5 3.1 2.6
Increase in Employment 2.1 2.1 1.4 1.0 1.0 1.1 0.6 0.8 0.7
Increase in Labor Productivity 8.5 1.7 0.7 1.2 3.0 -0.3 0.9 2.3 1.9
Contribution (%)
Gross Domestic Product 100.0 100.0 100.0 100.0 100.0 100.0 100.0 100.0 100.0
Increase in Employment 19.7 54.2 68.4 45.0 25.4 133.3 41.1 24.4 27.8
Increase in Labor Productivity 80.3 45.8 31.6 55.0 74.6 -33.3 58.9 75.6 72.2
2-c. Sources of Taiwan's Economic Growth (Continued) C. By Input
7
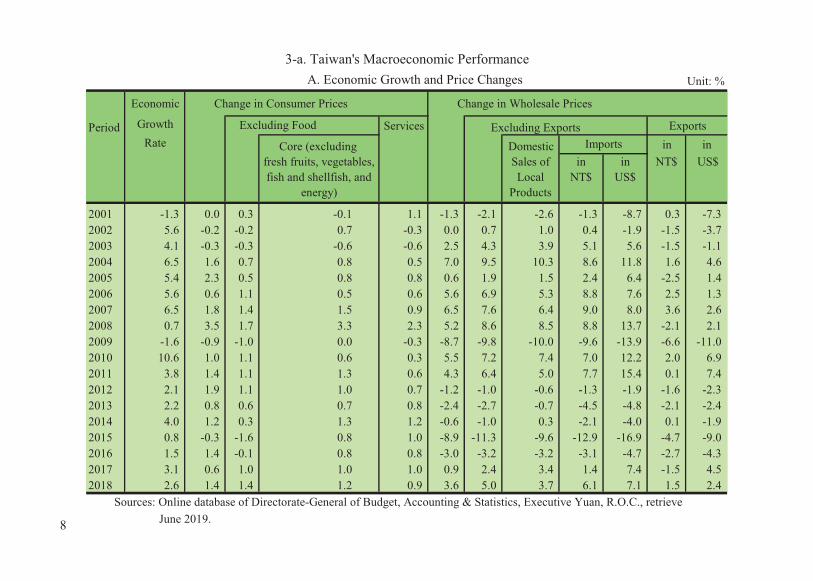
3-a. Taiwan's Macroeconomic PerformanceUnit: %
Economic Change in Consumer Prices Change in Wholesale Prices
Period Growth Services Excluding Exports Exports Rate Core (excluding Domestic in in
fresh fruits, vegetables,fish and shellfish, and
energy)
Sales ofLocal
Products
inNT$
inUS$
NT$ US$
2001 -1.3 0.0 0.3 -0.1 1.1 -1.3 -2.1 -2.6 -1.3 -8.7 0.3 -7.3 2002 5.6 -0.2 -0.2 0.7 -0.3 0.0 0.7 1.0 0.4 -1.9 -1.5 -3.7 2003 4.1 -0.3 -0.3 -0.6 -0.6 2.5 4.3 3.9 5.1 5.6 -1.5 -1.1 2004 6.5 1.6 0.7 0.8 0.5 7.0 9.5 10.3 8.6 11.8 1.6 4.6 2005 5.4 2.3 0.5 0.8 0.8 0.6 1.9 1.5 2.4 6.4 -2.5 1.4 2006 5.6 0.6 1.1 0.5 0.6 5.6 6.9 5.3 8.8 7.6 2.5 1.3 2007 6.5 1.8 1.4 1.5 0.9 6.5 7.6 6.4 9.0 8.0 3.6 2.6 2008 0.7 3.5 1.7 3.3 2.3 5.2 8.6 8.5 8.8 13.7 -2.1 2.1 2009 -1.6 -0.9 -1.0 0.0 -0.3 -8.7 -9.8 -10.0 -9.6 -13.9 -6.6 -11.0 2010 10.6 1.0 1.1 0.6 0.3 5.5 7.2 7.4 7.0 12.2 2.0 6.9 2011 3.8 1.4 1.1 1.3 0.6 4.3 6.4 5.0 7.7 15.4 0.1 7.4 2012 2.1 1.9 1.1 1.0 0.7 -1.2 -1.0 -0.6 -1.3 -1.9 -1.6 -2.3 2013 2.2 0.8 0.6 0.7 0.8 -2.4 -2.7 -0.7 -4.5 -4.8 -2.1 -2.4 2014 4.0 1.2 0.3 1.3 1.2 -0.6 -1.0 0.3 -2.1 -4.0 0.1 -1.9 2015 0.8 -0.3 -1.6 0.8 1.0 -8.9 -11.3 -9.6 -12.9 -16.9 -4.7 -9.0 2016 1.5 1.4 -0.1 0.8 0.8 -3.0 -3.2 -3.2 -3.1 -4.7 -2.7 -4.3 2017 3.1 0.6 1.0 1.0 1.0 0.9 2.4 3.4 1.4 7.4 -1.5 4.5 2018 2.6 1.4 1.4 1.2 0.9 3.6 5.0 3.7 6.1 7.1 1.5 2.4
Sources: Online database of Directorate-General of Budget, Accounting & Statistics, Executive Yuan, R.O.C., retrieve June 2019.
Excluding FoodImports
A. Economic Growth and Price Changes
8

3-b. Taiwan's Macroeconomic Performance (Continued)
Exports Imports TradeMajor Exports Major Imports Balance
Period Parts ofElectronicProduct
Information,Communicationand Audio-video
Products
Iron & Steeland Articles
Thereof
CapitalGoods
Agricultural &Industrial Raw
Materials
ConsumerGoods
Amount (US$ million)2011 312,923 75,473 36,762 19,356 288,062 37,498 220,673 27,479 24,861 2012 306,409 75,216 31,553 17,796 277,324 34,914 212,031 28,218 29,085 2013 311,428 80,595 31,073 17,447 278,010 36,742 208,395 29,712 33,418 2014 320,092 90,159 31,007 18,458 281,850 38,479 207,797 31,469 38,242 2015 285,344 85,913 30,479 15,300 237,219 38,054 162,615 32,002 48,124 2016 280,321 92,798 30,181 14,420 230,568 42,660 153,096 31,525 49,753 2017 317,249 107,200 34,106 17,342 259,266 42,476 179,073 34,015 57,983 2018 335,909 110,771 35,330 19,016 286,333 43,315 203,458 36,063 49,576
Rate of Increase (%)2011 12.6 9.2 17.8 17.9 12.4 -4.2 15.0 18.5 14.4 2012 -2.1 -0.3 -14.2 -8.1 -3.7 -6.9 -3.9 2.7 17.0 2013 1.6 7.2 -1.5 -2.0 0.3 5.2 -1.7 5.3 14.9 2014 2.8 11.9 -0.2 5.8 1.4 4.7 -0.3 5.9 14.4 2015 -10.9 -4.7 -1.7 -17.1 -15.8 -1.1 -21.7 1.7 25.8 2016 -1.8 8.0 -1.0 -5.8 -2.8 12.1 -5.9 -1.5 3.4 2017 13.2 15.5 13.0 20.3 12.5 -0.4 17.0 7.9 16.5 2018 5.9 3.3 3.6 9.7 10.4 2.0 13.6 6.0 -14.5
Sources: Online database of Ministry of Finance, R.O.C., retrieved June 2019.
B. Merchandise Exports and Imports
9
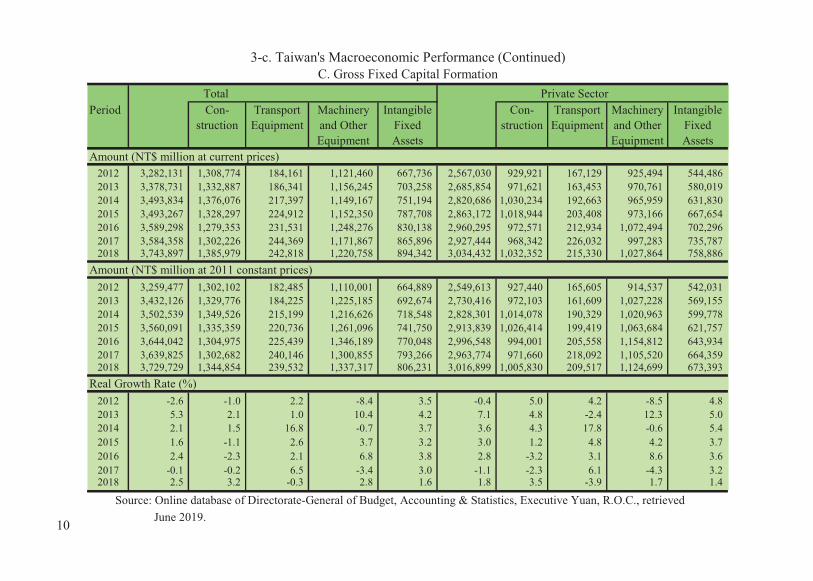
3-c. Taiwan's Macroeconomic Performance (Continued)C. Gross Fixed Capital Formation
Total Private SectorPeriod Con-
structionTransport
EquipmentMachineryand OtherEquipment
IntangibleFixedAssets
Con-struction
TransportEquipment
Machineryand OtherEquipment
IntangibleFixedAssets
Amount (NT$ million at current prices)2012 3,282,131 1,308,774 184,161 1,121,460 667,736 2,567,030 929,921 167,129 925,494 544,486 2013 3,378,731 1,332,887 186,341 1,156,245 703,258 2,685,854 971,621 163,453 970,761 580,019 2014 3,493,834 1,376,076 217,397 1,149,167 751,194 2,820,686 1,030,234 192,663 965,959 631,830 2015 3,493,267 1,328,297 224,912 1,152,350 787,708 2,863,172 1,018,944 203,408 973,166 667,654 2016 3,589,298 1,279,353 231,531 1,248,276 830,138 2,960,295 972,571 212,934 1,072,494 702,296 2017 3,584,358 1,302,226 244,369 1,171,867 865,896 2,927,444 968,342 226,032 997,283 735,787 2018 3,743,897 1,385,979 242,818 1,220,758 894,342 3,034,432 1,032,352 215,330 1,027,864 758,886
Amount (NT$ million at 2011 constant prices)2012 3,259,477 1,302,102 182,485 1,110,001 664,889 2,549,613 927,440 165,605 914,537 542,031 2013 3,432,126 1,329,776 184,225 1,225,185 692,674 2,730,416 972,103 161,609 1,027,228 569,155 2014 3,502,539 1,349,526 215,199 1,216,626 718,548 2,828,301 1,014,078 190,329 1,020,963 599,778 2015 3,560,091 1,335,359 220,736 1,261,096 741,750 2,913,839 1,026,414 199,419 1,063,684 621,757 2016 3,644,042 1,304,975 225,439 1,346,189 770,048 2,996,548 994,001 205,558 1,154,812 643,934 2017 3,639,825 1,302,682 240,146 1,300,855 793,266 2,963,774 971,660 218,092 1,105,520 664,359 2018 3,729,729 1,344,854 239,532 1,337,317 806,231 3,016,899 1,005,830 209,517 1,124,699 673,393
Real Growth Rate (%)2012 -2.6 -1.0 2.2 -8.4 3.5 -0.4 5.0 4.2 -8.5 4.82013 5.3 2.1 1.0 10.4 4.2 7.1 4.8 -2.4 12.3 5.02014 2.1 1.5 16.8 -0.7 3.7 3.6 4.3 17.8 -0.6 5.42015 1.6 -1.1 2.6 3.7 3.2 3.0 1.2 4.8 4.2 3.72016 2.4 -2.3 2.1 6.8 3.8 2.8 -3.2 3.1 8.6 3.62017 -0.1 -0.2 6.5 -3.4 3.0 -1.1 -2.3 6.1 -4.3 3.22018 2.5 3.2 -0.3 2.8 1.6 1.8 3.5 -3.9 1.7 1.4
Source: Online database of Directorate-General of Budget, Accounting & Statistics, Executive Yuan, R.O.C., retrievedJune 2019. 10

3-c. Taiwan's Macroeconomic Performance (Continued)C. Gross Fixed Capital Formation
Government Sector Public Enterprise SectorPeriod Con-
structionTransport
EquipmentMachineryand OtherEquipment
IntangibleFixedAssets
Con-struction
TransportEquipment
Machineryand OtherEquipment
IntangibleFixedAssets
Amount (NT$ million at current prices)2012 510,976 350,250 9,950 42,964 107,812 204,125 28,603 7,082 153,002 15,438 2013 492,460 336,389 7,429 40,405 108,237 200,417 24,877 15,459 145,079 15,002 2014 462,170 315,449 7,379 35,004 104,338 210,978 30,393 17,355 148,204 15,026 2015 438,990 286,269 8,936 38,853 104,932 191,105 23,084 12,568 140,331 15,122 2016 443,441 281,148 8,309 41,847 112,137 185,562 25,634 10,288 133,935 15,705 2017 473,920 306,778 9,499 44,933 112,710 182,994 27,106 8,838 129,651 17,399 2018 497,910 315,356 10,921 52,853 118,780 211,555 38,271 16,567 140,041 16,676
Amount (NT$ million at 2011 constant prices)2012 506,289 346,306 9,916 42,735 107,332 203,575 28,356 6,964 152,729 15,526 2013 492,167 333,142 7,401 43,003 108,642 209,659 24,735 15,174 154,788 14,863 2014 455,137 306,316 7,412 37,272 104,034 220,035 29,637 17,242 158,232 14,520 2015 442,656 286,380 8,899 42,670 105,337 204,444 23,349 12,462 154,511 14,322 2016 449,700 285,543 8,256 45,451 111,295 196,535 26,172 10,145 145,538 14,611 2017 475,651 304,716 9,457 50,122 112,490 196,863 26,920 8,751 144,930 16,051 2018 487,685 302,915 11,009 58,101 117,570 223,996 36,769 16,530 154,312 15,181
Real Growth Rate (%)2012 -11.0 -13.7 11.4 -11.2 -2.9 -7.4 -6.9 -35.4 -7.1 8.22013 -2.8 -3.8 -25.4 0.6 1.2 3.0 -12.8 117.9 1.4 -4.32014 -7.5 -8.1 0.2 -13.3 -4.2 5.0 19.8 13.6 2.2 -2.32015 -2.7 -6.5 20.1 14.5 1.3 -7.1 -21.2 -27.7 -2.4 -1.42016 1.6 -0.3 -7.2 6.5 5.7 -3.9 12.1 -18.6 -5.8 2.02017 5.8 6.7 14.6 10.3 1.1 0.2 2.9 -13.7 -0.4 9.92018 2.5 -0.6 16.4 15.9 4.5 13.8 36.6 88.9 6.5 -5.4
11

4-a. Products of which Taiwan was among the World's Three Largest Producers in 2018 Unit: %
2nd and 3rd Place WorldwideTaiwan'sGlobalMarketShare
Taiwan'sGlobalMarketShare
Taiwan'sGlobalMarketShare
1. Motherboards (1) 84.8 14. High-end bicycles(2) 33.4 -- 2nd Place Worldwide (9 Items)
2. Cable CPE (2) 83.2 15. printed circuit 29.9 1. servers(2) 35.4
3. golf club heads(2) 81.5 boards(1) 2. TFT-LCD panels (>10") (1) 30.8
4. notebook computers (2) 78.7 16. ABS(2) 28.7 3. TFT-LCD panels (<10") (1) 27.1
5. IC foundries(1) 75.6 17. instant noodles(2) 22.0 4. IC substrates(1) 26.0
6. WLAN (1) 68.1 18. tea drinks(2) 17.3 5. TPE(2) 19.5
7. DSL CPE (2) 66.1 6. ball screw(1) 18.7
8. IC packaging and 55.8 7. IC design(1) 17.0
testing (1) 8. silicon solar cells(2) 11.0
9. desktop computers(2) 51.1 9. PTA(2) 8.7
10. functional textiles(1) 51.1
11. PND (1) 47.9 -- 3rd Place Worldwide (1 Items)
12. mobile device optical 46.4 1. monosodium glutamate(2) 8.9
lens(1)
13. Copper Clad 43.4
Laminate(2)
(1) Production value. (2) production volume.Source: Industrial Technology Information Service (ITIS) Program.
1. Including Offshore Production
ItemsItemsItems
1st Place Worldwide (18 Items)
12

4-b. Products of which Taiwan was among the World's Three Largest Producers in 20182. Excluding Offshore Production Unit: %
2nd Place Worldwide (8 Items) 3rd Place Worldwide (7 Items)Taiwan'sGlobalMarketShare
Taiwan'sGlobalMarketShare
Taiwan'sGlobalMarketShare
1. IC foundries (1) 71.8 1. PND(1) 39.1 1. TFT-LCD panels 21.4
2. IC packaging & testing(1) 48.5 2. IC substrates (1) 22.9 (>10") (1)
3. green algae(2) 45.2 3. TFT-LCD panels 22.5 2. ABS (2) 11.8
4. High-end bicycles(2) 29.6 (<10") (1) 3. TPE (2) 8.1
4. IC design(1) 16.5 4. Nylon fiber(2) 5.6
5. ball screw(1) 16.3 5. b-carotene(2) 4.6
6. Copper Clad Laminate(2) 15.9 6. polyester yarns(2) 2.0
7. printed circuit 11.5 7. WLAN (1) 0.8
boards(1)
8. silicon solar cells(2) 11.0
(1) Production value. (2) production volume.
ItemsItemsItems
1st Place Worldwide (4 Items)
13
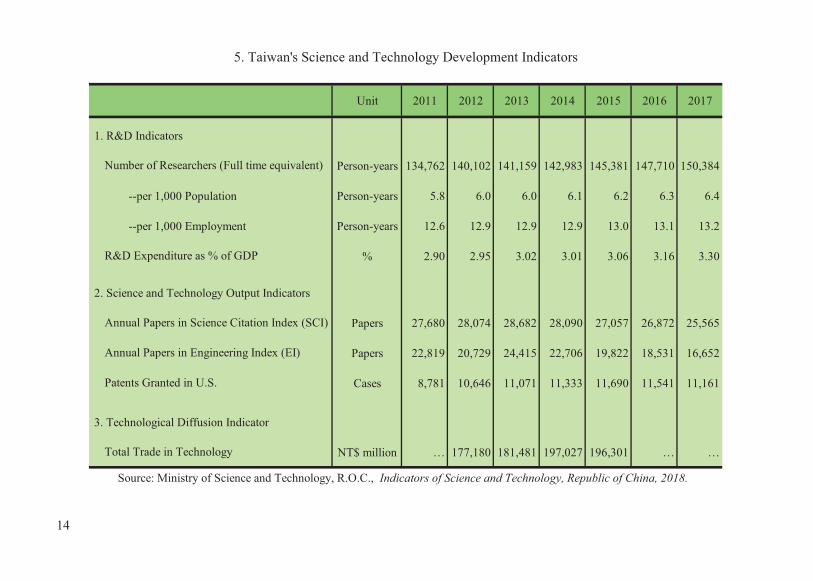
Unit 2011 2012 2013 2014 2015 2016 2017
1. R&D Indicators
Person-years 134,762 140,102 141,159 142,983 145,381 147,710 150,384
--per 1,000 Population Person-years 5.8 6.0 6.0 6.1 6.2 6.3 6.4
--per 1,000 Employment Person-years 12.6 12.9 12.9 12.9 13.0 13.1 13.2
% 2.90 2.95 3.02 3.01 3.06 3.16 3.30
2. Science and Technology Output Indicators
Papers 27,680 28,074 28,682 28,090 27,057 26,872 25,565
Papers 22,819 20,729 24,415 22,706 19,822 18,531 16,652
Cases 8,781 10,646 11,071 11,333 11,690 11,541 11,161
3. Technological Diffusion Indicator
NT$ million … 177,180 181,481 197,027 196,301 … …
Source: Ministry of Science and Technology, R.O.C., Indicators of Science and Technology, Republic of China, 2018.
5. Taiwan's Science and Technology Development Indicators
Annual Papers in Science Citation Index (SCI)
Total Trade in Technology
Annual Papers in Engineering Index (EI)
Patents Granted in U.S.
Number of Researchers (Full time equivalent)
R&D Expenditure as % of GDP
14

6-a. Taiwan's Human ResourcesUnit: %
Educational Labor Rate of Unemploy- Growth Rate Ratio of Employment Structure Expenditures as % of
Period GNI(1)
GDP(1)
2001 5.7 5.8 57.2 -1.2 4.6 2.95 70.4 7.5 36.6 55.9 2002 5.6 5.8 57.3 0.8 5.2 8.59 70.6 7.5 35.8 56.7 2003 5.6 5.8 57.3 1.3 5.0 6.74 70.9 7.3 35.5 57.2 2004 5.5 5.6 57.7 2.2 4.4 4.74 71.2 6.6 35.9 57.5 2005 5.5 5.7 57.8 1.6 4.1 3.58 71.6 5.9 36.4 57.7 2006 5.4 5.6 57.9 1.7 3.9 4.07 71.9 5.5 36.6 57.9 2007 5.2 5.3 58.3 1.8 3.9 7.21 72.2 5.3 36.8 57.9 2008 5.4 5.6 58.3 1.1 4.1 -0.12 72.6 5.1 36.8 58.0 2009 5.8 6.0 57.9 -1.2 5.9 1.10 73.0 5.3 35.9 58.9 2010 5.3 5.4 58.1 2.1 5.2 18.43 73.6 5.2 35.9 58.8 2011 5.3 5.5 58.2 2.1 4.4 1.26 74.0 5.1 36.3 58.6 2012 5.4 5.6 58.4 1.4 4.2 -0.03 74.2 5.0 36.2 58.8 2013 5.3 5.5 58.4 1.0 4.2 2.47 74.2 5.0 36.2 58.9 2014 5.1 5.2 58.5 1.0 4.0 3.93 74.0 5.0 36.1 58.9 2015 5.0 5.1 58.7 1.1 3.8 -0.86 73.9 5.0 36.0 59.0 2016 4.9 5.1 58.8 0.6 3.9 5.26 73.5 5.0 35.9 59.2 2017 4.9 5.1 58.8 0.8 3.8 3.53 73.0 4.9 35.8 59.3 2018 5.0 5.1 59.0 0.7 3.7 2.36 72.5 4.9 35.7 59.4
(1) Referring to fiscal year.(2) Referring to end of year.Sources: (1) Online database of Directorate-General of Budget, Accounting & Statistics, Executive Yuan, R.O.C., retrieved June 2019. (2) Online database of Ministry of the Interior, R.O.C. (Taiwan), retrieved June 2019. (3) Online database of Ministry of Education, R.O.C. (Taiwan), retrieved June 2019.
Services
A. Labor Force, Employment, and Labor Productivity
ParticipationRate
Growth inEmployment
ment Rate of LaborProductivity inManufacturing
Working-Age(15~64)
Population toTotal Population
(2)
Agri-culture
Industry
15

6-b. Taiwan's Human Resources (Continued)B. Educational & Occupational Structure of Employed Population
By Occupation By Education White-collar Workers Blue-collar
Period Total Legislators,Senior
Officials &Managers
Pro-fessionals
Tech-nicians &Associate
Pro-fessionals
ClericalSupportWorkers
Craft &MachineOperationRelatedWorkers
Persons (1,000 persons)2010 10,492 4,707 443 1,116 1,995 1,153 2,069 512 3,204 2,361 3,583 4,5492011 10,709 4,775 435 1,195 1,957 1,188 2,086 496 3,352 2,312 3,645 4,7522012 10,860 4,838 422 1,244 1,950 1,222 2,119 495 3,408 2,268 3,674 4,9182013 10,967 4,884 404 1,286 1,962 1,232 2,156 492 3,435 2,226 3,661 5,0802014 11,078 4,961 394 1,333 1,990 1,244 2,166 492 3,459 2,124 3,675 5,2802015 11,197 5,024 387 1,370 2,019 1,248 2,181 496 3,496 2,061 3,692 5,4462016 11,268 5,056 381 1,389 2,029 1,257 2,206 500 3,506 2,009 3,688 5,5712017 11,352 5,106 383 1,409 2,043 1,271 2,231 500 3,515 1,960 3,695 5,6992018 11,434 5,153 384 1,430 2,051 1,288 2,259 505 3,517 1,914 3,707 5,814
Structure (%)2010 100.0 44.9 4.2 10.6 19.0 11.0 19.7 4.9 30.5 22.5 34.1 43.4 2011 100.0 44.6 4.1 11.2 18.3 11.1 19.5 4.6 31.3 21.6 34.0 44.4 2012 100.0 44.5 3.9 11.5 18.0 11.3 19.5 4.6 31.4 20.9 33.8 45.3 2013 100.0 44.5 3.7 11.7 17.9 11.2 19.7 4.5 31.3 20.3 33.4 46.3 2014 100.0 44.8 3.6 12.0 18.0 11.2 19.6 4.4 31.2 19.2 33.2 47.7 2015 100.0 44.9 3.5 12.2 18.0 11.1 19.5 4.4 31.2 18.4 33.0 48.6 2016 100.0 44.9 3.4 12.3 18.0 11.2 19.6 4.4 31.1 17.8 32.7 49.4 2017 100.0 45.0 3.4 12.4 18.0 11.2 19.7 4.4 31.0 17.3 32.5 50.2 2018 100.0 45.1 3.4 12.5 17.9 11.3 19.8 4.4 30.8 16.7 32.4 50.8
Sources: Online database of Directorate-General of Budget, Accounting & Statistics, Executive Yuan, R.O.C., retrieved June 2019.
Service &Sales
Workers
SkilledAgricultural,Forestry &
FisheryWorkers
JuniorHigh &Below
SeniorHigh &Voca-tional
JuniorCollege
&Above
16

Economic Infrastructure and ServicesPeriod Amount % of
GNI(1)Subtotal Education Health
andMedical
WaterSupply
andSanit-ation
Govern-ment and
CivilSociety
OtherSocialInfra-
structureand
Services
Subtotal Transportand
Storage
ICT /Commun-ications
EnergyGenerationand Supply
Amount unit: US$ 1,000
2015 295,997 0.055 171,128 58,135 14,699 4,416 30,450 63,428 30,440 5,147 4,202 4,290
2016 350,774 0.064 195,870 52,099 19,746 1,862 49,958 72,205 33,468 827 5,046 8,720
2017 310,317 0.056 156,970 35,571 24,103 786 27,033 58,543 72,037 26,263 3,872 1,162
2018 301,657 0.051 148,389 45,497 16,480 1,796 25,687 58,929 49,539 26,811 15,979 5,062
Structure (%)
2015 100.0 57.8 19.6 5.0 1.5 10.3 21.4 10.3 1.7 1.4 1.5
2016 100.0 55.8 14.9 5.6 0.5 14.2 20.6 9.5 0.2 1.4 2.5
2017 100.0 47.1 11.5 7.8 0.3 8.7 18.9 23.2 8.5 1.3 0.4
2018 100.0 49.2 15.1 5.5 0.6 8.5 19.5 16.4 8.9 5.3 1.7
(1) GNI means gross national income; a donor's efforts, particularly OECD countries, are usually measured in terms of ODA/GNI.
Source: The data are provided by Ministry of Foreign Affairs, Executive Yuan, R.O.C. (Taiwan).
7-a. Statistical Data of Taiwan's Official Development Assistance
Total (ODA) Social Infrastructure and Services
17

OthersPeriod Other
EconomicInfra-
structure andServices
Subtotal Agriculture,Forestry and
Fishery
Industry,Mining and
Construction
Trade Policyand
Regulations
Tourism Subtotal Environ-mental
Protection
CrossSectors
Amount unit: US$ 1,000
2015 16,801 41,794 36,745 2,062 751 2,236 7,011 1,525 5,486 45,623
2016 18,874 45,060 39,231 1,178 3,019 1,632 2,138 2,018 120 74,238
2017 40,740 35,957 32,510 2,544 430 472 2,056 1,622 434 54,230
2018 1,687 38,393 37,055 476 745 117 6,521 315 6,207 58,814
Structure (%)
2015 5.7 14.1 12.4 0.7 0.3 0.8 2.4 0.5 1.9 15.4
2016 5.4 12.9 11.2 0.3 0.9 0.5 0.6 0.6 0.0 21.2
2017 12.7 11.2 10.1 0.8 0.1 0.2 0.6 0.5 0.1 16.9
2018 0.6 12.7 12.3 0.2 0.3 0.0 2.2 0.1 2.1 19.5
Production Sectors Sustainable Development
7-b. Statistical Data of Taiwan's Official Development Assistance (Continued)
18

1. INDICATORS


1-1a. Indicators of the Taiwan Economy
GDP GNI
1955 7.7 1,940 3,364 216 1,940 3,363 216 10.6 … 14.4 1960 7.2 1,743 5,943 163 1,742 5,940 163 12.6 18.6 14.2 1965 11.9 2,869 9,173 229 2,864 9,157 229 -0.3 -0.1 -4.6 1970 11.5 5,786 15,870 397 5,775 15,841 396 4.1 3.6 2.7 1975 6.2 15,838 37,438 985 15,750 37,230 980 1.9 5.2 -5.1 1980 8.0 42,295 86,002 2,389 42,237 85,883 2,386 16.5 19.0 21.5 1985 4.8 63,623 132,142 3,315 64,806 134,599 3,377 0.0 -0.2 -2.6 1990 5.7 166,615 220,933 8,216 170,978 226,718 8,431 5.2 4.1 -0.6 1994 7.5 256,404 321,741 12,160 260,467 326,840 12,352 1.7 4.1 2.2 1995 6.5 279,224 347,789 13,129 283,411 353,004 13,326 2.4 3.7 7.4 1996 6.2 292,665 374,816 13,650 296,653 379,923 13,836 2.3 3.1 -1.0 1997 6.1 303,737 402,939 14,040 306,859 407,082 14,184 2.2 0.9 -0.5 1998 4.2 280,369 429,624 12,840 282,418 432,763 12,934 3.3 1.7 0.6 1999 6.7 304,171 445,951 13,819 306,976 450,063 13,947 -2.0 0.2 -4.5 2000 6.4 331,452 466,598 14,941 335,921 472,889 15,142 -0.9 1.3 1.8 2001 -1.3 300,450 454,687 13,448 306,129 463,282 13,703 -0.6 -0.01 -1.3 2002 5.6 308,875 475,484 13,750 315,887 486,280 14,062 -0.4 -0.2 0.0 2003 4.1 318,590 486,018 14,120 328,145 500,594 14,544 -1.4 -0.3 2.5 2004 6.5 348,479 514,405 15,388 359,609 530,835 15,879 -0.3 1.6 7.0 2005 5.4 375,769 532,001 16,532 384,808 544,798 16,930 -1.5 2.3 0.6 2006 5.6 388,589 553,851 17,026 398,171 567,508 17,446 -1.0 0.6 5.6 2007 6.5 408,254 585,016 17,814 418,387 599,536 18,256 -0.4 1.8 6.5 2008 0.7 416,961 571,838 18,131 426,937 585,519 18,564 -2.6 3.5 5.2 2009 -1.6 392,065 561,636 16,988 404,587 579,574 17,531 0.1 -0.9 -8.7 2010 10.6 446,105 610,140 19,278 459,679 628,706 19,864 -1.5 1.0 5.5 2011 3.8 485,653 617,078 20,939 498,832 633,822 21,507 -2.3 1.4 4.3 2012 2.1 495,845 631,142 21,308 511,179 650,660 21,967 0.5 1.9 -1.2 2013 2.2 511,614 652,429 21,916 525,851 670,585 22,526 1.5 0.8 -2.4 2014 4.0 530,519 688,434 22,668 546,013 708,540 23,330 1.7 1.2 -0.6 2015 0.8 525,562 714,774 22,400 542,194 737,393 23,109 3.3 -0.3 -8.9 2016 1.5 531,281 730,411 22,592 547,665 752,936 23,289 0.9 1.4 -3.0 2017 3.1 574,940 742,976 24,408 590,189 762,681 25,055 -1.2 0.6 0.9 2018 2.6 589,997 754,711 25,026 601,217 768,959 25,501 -1.0 1.4 3.6
Period EconomicGrowth Rate at2011 Prices (%)
GNI in US$Million at
Current Prices
GDP in US$Million at
Current Prices
Per Capita GDP
NT$ US$
Change in Prices (%)
NT$ US$
Per Capita GNIGDP
Deflator
ConsumerPriceIndex
WholesalePriceIndex
19

As As AsPercentage Percentage Percentageof GNI (%) of GNI (%) of GNI (%)
1955 4.5 14.9 4.0 13.1 0.4 1.2 … … … …1960 11.6 18.3 12.7 19.9 -1.5 -2.4 … … … …1965 24.6 21.5 25.7 22.5 -2.3 -2.0 … … … …1970 61.2 26.5 58.1 25.4 0.0 0.0 … … … …1975 164.9 27.6 180.2 30.3 -22.4 -3.8 … … … …1980 496.5 32.7 505.9 33.3 -23.3 -1.5 … … … …1985 893.7 34.6 489.1 19.1 373.1 14.6 5.7 44.6 34.9 49.7 1990 1,439.2 31.3 1,142.1 24.8 297.2 6.5 4.0 39.3 31.2 56.7 1994 2,076.5 30.1 1,898.2 27.5 178.3 2.6 3.3 34.9 26.6 61.8 1995 2,218.4 29.6 2,072.4 27.6 146.0 1.9 3.3 33.7 25.6 63.0 1996 2,330.4 28.6 2,043.9 25.1 286.6 3.5 3.0 33.1 25.5 63.9 1997 2,525.1 28.7 2,317.2 26.3 207.9 2.4 2.4 32.8 25.5 64.8 1998 2,674.6 28.3 2,571.4 27.2 103.2 1.1 2.3 32.4 25.4 65.3 1999 2,855.3 28.8 2,598.2 26.2 257.1 2.6 2.4 31.3 24.9 66.3 2000 3,105.5 29.6 2,815.1 26.8 290.4 2.8 2.0 31.3 25.6 66.7 2001 2,804.5 27.1 2,175.7 21.0 628.8 6.1 1.9 29.4 24.1 68.8 2002 3,106.2 28.4 2,241.9 20.5 864.4 7.9 1.8 31.1 26.0 67.1 2003 3,415.5 30.2 2,377.9 21.1 1,037.6 9.2 1.7 32.1 27.3 66.2 2004 3,668.5 30.5 2,954.3 24.6 714.3 5.9 1.6 32.7 28.0 65.6 2005 3,667.6 29.6 2,957.8 23.9 709.8 5.7 1.6 32.3 27.8 66.1 2006 4,022.1 31.1 3,111.0 24.0 911.1 7.0 1.6 32.4 27.7 66.1 2007 4,322.5 31.5 3,221.5 23.5 1,101.0 8.0 1.5 33.0 28.4 65.6 2008 3,987.9 29.6 3,217.0 23.9 770.8 5.7 1.6 31.3 27.4 67.2 2009 3,918.2 29.3 2,580.2 19.3 1,338.0 10.0 1.7 31.5 26.7 66.8 2010 4,821.8 33.1 3,524.6 24.2 1,297.2 8.9 1.6 33.8 29.1 64.6 2011 4,624.9 31.5 3,382.9 23.0 1,242.0 8.5 1.7 33.0 28.7 65.3 2012 4,611.0 30.5 3,304.2 21.8 1,306.9 8.6 1.7 32.8 28.4 65.6 2013 5,008.8 32.0 3,360.2 21.5 1,648.6 10.5 1.7 33.5 28.8 64.9 2014 5,569.1 33.6 3,521.2 21.2 2,047.9 12.4 1.8 34.8 30.0 63.4 2015 6,033.1 34.9 3,513.1 20.3 2,520.0 14.6 1.7 35.3 30.2 63.0 2016 6,070.7 34.3 3,562.2 20.1 2,508.5 14.2 1.8 35.5 30.7 62.7 2017 6,161.1 34.3 3,543.2 19.7 2,617.9 14.6 1.8 35.5 31.0 62.7 2018 5,976.9 33.0 3,794.0 20.9 2,182.9 12.0 1.6 35.2 30.8 63.2
(1) Statistical discrepancies are not included.
Period
Gross National Savings and Gross Domestic Capital FormationGross National Savings
NT$billion
Gross Domestic Capital Formation
NT$billion
Excess Savings
NT$billion
1-1b. Indicators of the Taiwan Economy (Continued)
Manu-facturing
Services
Structure of Production (% of GDP by Sector)(1)
Agri-culture Industry
20
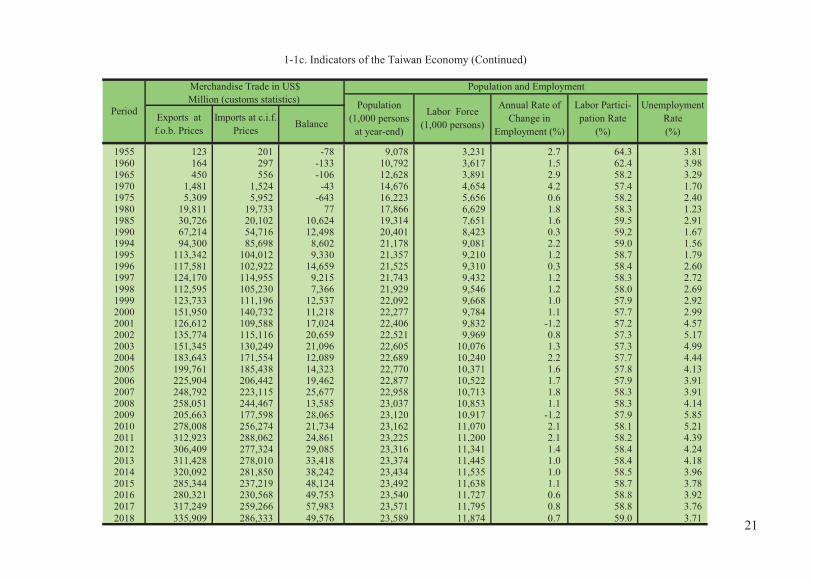
1955 123 201 -78 9,078 3,231 2.7 64.3 3.81 1960 164 297 -133 10,792 3,617 1.5 62.4 3.98 1965 450 556 -106 12,628 3,891 2.9 58.2 3.29 1970 1,481 1,524 -43 14,676 4,654 4.2 57.4 1.70 1975 5,309 5,952 -643 16,223 5,656 0.6 58.2 2.40 1980 19,811 19,733 77 17,866 6,629 1.8 58.3 1.23 1985 30,726 20,102 10,624 19,314 7,651 1.6 59.5 2.91 1990 67,214 54,716 12,498 20,401 8,423 0.3 59.2 1.67 1994 94,300 85,698 8,602 21,178 9,081 2.2 59.0 1.56 1995 113,342 104,012 9,330 21,357 9,210 1.2 58.7 1.79 1996 117,581 102,922 14,659 21,525 9,310 0.3 58.4 2.60 1997 124,170 114,955 9,215 21,743 9,432 1.2 58.3 2.72 1998 112,595 105,230 7,366 21,929 9,546 1.2 58.0 2.69 1999 123,733 111,196 12,537 22,092 9,668 1.0 57.9 2.92 2000 151,950 140,732 11,218 22,277 9,784 1.1 57.7 2.99 2001 126,612 109,588 17,024 22,406 9,832 -1.2 57.2 4.57 2002 135,774 115,116 20,659 22,521 9,969 0.8 57.3 5.17 2003 151,345 130,249 21,096 22,605 10,076 1.3 57.3 4.99 2004 183,643 171,554 12,089 22,689 10,240 2.2 57.7 4.44 2005 199,761 185,438 14,323 22,770 10,371 1.6 57.8 4.13 2006 225,904 206,442 19,462 22,877 10,522 1.7 57.9 3.91 2007 248,792 223,115 25,677 22,958 10,713 1.8 58.3 3.91 2008 258,051 244,467 13,585 23,037 10,853 1.1 58.3 4.14 2009 205,663 177,598 28,065 23,120 10,917 -1.2 57.9 5.85 2010 278,008 256,274 21,734 23,162 11,070 2.1 58.1 5.21 2011 312,923 288,062 24,861 23,225 11,200 2.1 58.2 4.39 2012 306,409 277,324 29,085 23,316 11,341 1.4 58.4 4.24 2013 311,428 278,010 33,418 23,374 11,445 1.0 58.4 4.18 2014 320,092 281,850 38,242 23,434 11,535 1.0 58.5 3.96 2015 285,344 237,219 48,124 23,492 11,638 1.1 58.7 3.78 2016 280,321 230,568 49,753 23,540 11,727 0.6 58.8 3.92 2017 317,249 259,266 57,983 23,571 11,795 0.8 58.8 3.76 2018 335,909 286,333 49,576 23,589 11,874 0.7 59.0 3.71
Labor Force(1,000 persons)
Annual Rate ofChange in
Employment (%)
Labor Partici-pation Rate
(%)
UnemploymentRate(%)
1-1c. Indicators of the Taiwan Economy (Continued)
Period Exports atf.o.b. Prices
Merchandise Trade in US$Million (customs statistics)
Imports at c.i.f.Prices Balance
Population and Employment
Population(1,000 persons
at year-end)
21

1955 … … … … … 15.60 … …1960 … … … … … 36.23 … …1965 16.0 15.6 21.0 11.520 … 40.05 … 245 1970 21.1 15.0 17.7 9.800 … 40.05 … 482 1975 27.8 28.8 30.0 10.750 … 38.00 … 1,074 1980 21.6 22.7 26.6 11.000 18.290 36.01 … 2,205 1985 22.6 12.2 6.4 5.250 6.441 39.85 0.1990 22,556 1990 11.0 -6.7 14.8 7.750 9.580 26.89 0.1857 72,441 1994 15.1 12.2 15.2 5.500 7.210 26.46 0.2588 92,454 1995 9.4 0.8 10.5 5.500 7.030 26.48 0.2815 90,310 1996 9.1 8.3 7.9 5.000 5.940 27.46 0.2524 88,038 1997 8.0 8.4 10.0 5.250 6.840 28.66 0.2369 83,502 1998 8.6 3.8 7.8 4.750 6.890 33.45 0.2555 90,341 1999 8.3 16.9 3.6 4.500 5.120 32.27 0.2833 106,200 2000 6.5 -0.3 3.7 4.625 5.060 31.23 0.2897 106,742 2001 4.3 11.9 -0.8 2.125 3.780 33.80 0.2781 122,211 2002 2.5 9.3 -2.5 1.625 2.140 34.58 0.2757 161,656 2003 5.7 19.3 2.8 1.375 1.160 34.42 0.2969 206,632 2004 7.2 12.4 8.6 1.750 1.090 33.42 0.3089 241,738 2005 6.6 6.8 7.8 2.250 1.360 32.17 0.2918 253,290 2006 5.2 4.5 4.1 2.750 1.640 32.53 0.2797 266,148 2007 0.8 0.0 2.4 3.375 1.960 32.84 0.2789 270,311 2008 7.2 -0.8 3.4 2.000 1.970 31.52 0.3049 291,707 2009 5.8 28.9 0.7 1.250 0.290 33.05 0.3532 348,198 2010 5.5 9.0 6.2 1.625 0.460 31.64 0.3605 382,005 2011 4.8 3.3 6.0 1.875 0.810 29.46 0.3692 385,547 2012 3.5 5.0 5.7 1.875 0.850 29.61 0.3711 403,169 2013 5.8 8.5 4.6 1.875 0.730 29.77 0.3050 416,811 2014 6.1 6.2 5.2 1.875 0.690 30.37 0.2867 418,980 2015 5.8 6.9 4.6 1.625 0.630 31.90 0.2635 426,031 2016 3.6 5.8 3.9 1.375 0.400 32.32 0.2971 434,204 2017 3.6 3.5 4.8 1.375 0.480 30.44 0.2714 451,500 2018 2.7 5.8 5.4 1.375 0.550 30.16 0.2731 461,784
(2) Rate for 91-180 days commercial paper in secondary market.
Annual Rate ofChange in Loans& Investments
(%)
Period
Foreign Exchange Rate(NT$ per foreign currency)Annual Rate
of Change inM1B (%)
Annual Rateof Change in
M2 (%)
Monetary Aggregates (end of year) Interest Rate (% per annum)
1-1d. Indicators of the Taiwan Economy (Continued)
Foreign ExchangeHoldings of Central
Bank of ROC in US$Million (end of year)
US Dollar(end of year)
MoneyMarket Rate
(2)
RediscountRate of CentralBank of China
(Taiwan)Japanese Yen(end of year)
22

1955 … … … … … …1960 … … … … … …1965 … … … … … …1970 … … … … 4.58 0.2941975 8.7 17.3 … … 4.25 0.3121980 2.1 22.7 … … 4.17 0.278 1985 2.3 4.3 25.4 1.03 4.50 0.291 1990 7.6 13.3 71.5 1.62 5.18 0.312 1994 3.5 6.7 114.7 1.69 5.38 0.318 1995 7.4 5.7 125.0 1.69 5.34 0.317 1996 5.2 4.1 138.0 1.72 5.38 0.317 1997 5.6 4.6 156.3 1.79 5.41 0.320 1998 5.2 2.9 176.5 1.88 5.51 0.324 1999 6.7 3.6 190.5 1.94 5.50 0.325 2000 5.9 3.1 197.6 1.91 5.55 0.326 2001 3.0 -1.3 205.0 2.02 6.39 0.350 2002 8.6 0.1 224.4 2.10 6.16 0.345 2003 6.7 2.9 242.9 2.22 6.07 0.343 2004 4.7 2.8 263.3 2.26 6.03 0.338 2005 3.6 3.0 281.0 2.32 6.04 0.340 2006 4.1 1.3 307.0 2.43 6.01 0.339 2007 7.2 2.0 331.8 2.48 5.98 0.340 2008 -0.1 0.1 351.8 2.68 6.05 0.341 2009 1.1 -8.7 368.2 2.84 6.34 0.345 2010 18.4 9.2 396.6 2.81 6.19 0.342 2011 1.3 3.4 416.2 2.91 6.17 0.342 2012 0.0 1.4 435.0 2.96 6.13 0.338 2013 2.5 0.5 459.5 3.02 6.08 0.336 2014 3.9 3.5 485.7 3.01 6.05 0.336 2015 -0.9 3.6 513.1 3.06 6.06 0.338 2016 5.3 0.9 543.6 3.16 6.08 0.336 2017 3.5 3.1 576.7 3.30 6.07 0.337 2018 2.4 4.5 … … 6.09 0.338
Labor Productivity and EmployeeCompensation in Manufacturing
Distribution of PersonalIncome by Household
1-1e. Indicators of the Taiwan Economy (Continued)
Period Annual Rate ofChange in LaborProductivity (%)
R&D Expenditure
Amount in NT$Billion
As Percentage ofGDP (%)
Gini CoefficientAnnual Rate of Change inAverage Monthly Com-
pensation (%)
Ratio of HighestFifth's Income to
Lowest Fifth's
23
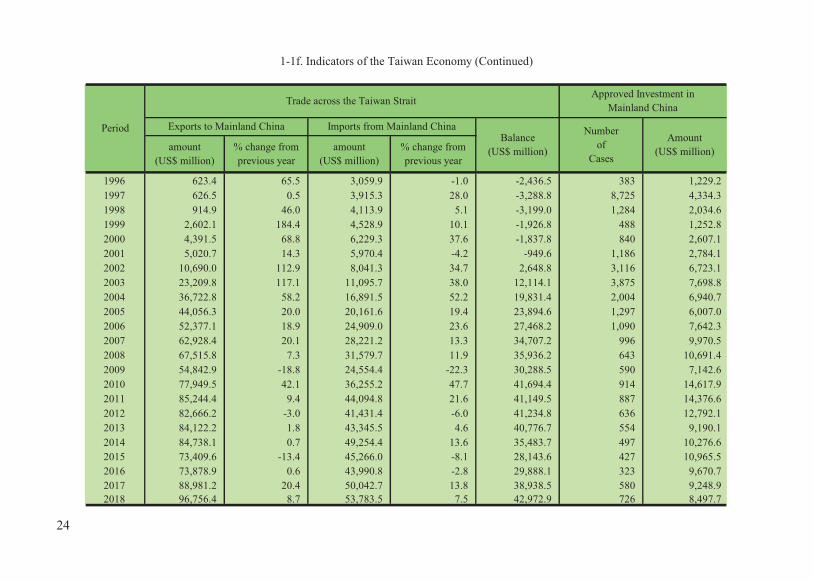
1-1f. Indicators of the Taiwan Economy (Continued)
1996 623.4 65.5 3,059.9 -1.0 -2,436.5 383 1,229.2 1997 626.5 0.5 3,915.3 28.0 -3,288.8 8,725 4,334.3 1998 914.9 46.0 4,113.9 5.1 -3,199.0 1,284 2,034.6 1999 2,602.1 184.4 4,528.9 10.1 -1,926.8 488 1,252.8 2000 4,391.5 68.8 6,229.3 37.6 -1,837.8 840 2,607.1 2001 5,020.7 14.3 5,970.4 -4.2 -949.6 1,186 2,784.1 2002 10,690.0 112.9 8,041.3 34.7 2,648.8 3,116 6,723.1 2003 23,209.8 117.1 11,095.7 38.0 12,114.1 3,875 7,698.8 2004 36,722.8 58.2 16,891.5 52.2 19,831.4 2,004 6,940.7 2005 44,056.3 20.0 20,161.6 19.4 23,894.6 1,297 6,007.0 2006 52,377.1 18.9 24,909.0 23.6 27,468.2 1,090 7,642.3 2007 62,928.4 20.1 28,221.2 13.3 34,707.2 996 9,970.5 2008 67,515.8 7.3 31,579.7 11.9 35,936.2 643 10,691.4 2009 54,842.9 -18.8 24,554.4 -22.3 30,288.5 590 7,142.6 2010 77,949.5 42.1 36,255.2 47.7 41,694.4 914 14,617.9 2011 85,244.4 9.4 44,094.8 21.6 41,149.5 887 14,376.6 2012 82,666.2 -3.0 41,431.4 -6.0 41,234.8 636 12,792.1 2013 84,122.2 1.8 43,345.5 4.6 40,776.7 554 9,190.1 2014 84,738.1 0.7 49,254.4 13.6 35,483.7 497 10,276.6 2015 73,409.6 -13.4 45,266.0 -8.1 28,143.6 427 10,965.5 2016 73,878.9 0.6 43,990.8 -2.8 29,888.1 323 9,670.7 2017 88,981.2 20.4 50,042.7 13.8 38,938.5 580 9,248.9 2018 96,756.4 8.7 53,783.5 7.5 42,972.9 726 8,497.7
Amount(US$ million)
Approved Investment inMainland China
Balance(US$ million)
Period Imports from Mainland China
Trade across the Taiwan Strait
Exports to Mainland China
amount(US$ million)
% change fromprevious year
amount(US$ million)
% change fromprevious year
Numberof
Cases
24

2. AREA AND POPULATION


2-1a. Area and Geographical Position of Taiwan(1)
Geographical Area No. of Coastline
Division (km2) Islands (km) Aspect Apex Aspect Apex
Whole Area 36,013.7 (2) 86 1578.0 Eastern Point 124°34'09" Southern Point 21°45'18"
Western Point 119°18'03" Northern Point 25°56'21"
Taiwan Island 35,886.9 22 1251.3 Eastern Point 121°59'15" Southern Point 21°53'50"
Western Point 120°01'00" Northern Point 25°18'20"
Penghu Archipela -go 126.9 64 326.8 Eastern Point 119°42'54" Southern Point 23°09'40"
Western Point 119°18'03" Northern Point 23°45'41"
(1) Including reclaimed tidal land.(2) Area of Kinmen and Lienchiang County are excluded.Source: The data are provided by the Ministry of the Interior, R.O.C. (Taiwan).
Longitude Latitude
(13,903 miles )
25

2-1b. Area and Geographical Position of Taiwan (Continued)
Geographical Area No. of Coastline
Division (km2) Islands (km) Aspect Apex Aspect Apex
Kinmen County 151.7 13 110.2 Eastern Point 118°31'01" Southern Point 24°09'48"
Western Point 118°08'06" Northern Point 24°34'16"
Lienchiang County 29.6 36 138.1 Eastern Point 120°30'08" Southern Point 25°56'04"
Western Point 119°54'04" Northern Point 26°23'08"
Longitude Latitude
26

2-2. Population
Number (1) (1,000 persons)Total Male Female Total Male Female
1955 9,078 4,647 4,430 3.8 3.6 4.01960 10,792 5,525 5,267 3.5 3.5 3.41965 12,699 6,528 6,171 3.0 3.1 2.91970 14,754 7,773 6,981 2.4 2.4 2.41975 16,223 8,501 7,722 1.9 1.8 2.01980 17,866 9,320 8,546 1.8 1.7 1.91985 19,314 10,023 9,290 1.3 1.2 1.41990 20,401 10,541 9,861 1.2 1.1 1.31994 21,178 10,907 10,271 0.9 0.8 1.01995 21,357 10,991 10,367 0.8 0.8 0.91996 21,525 11,066 10,460 0.8 0.7 0.91997 21,743 11,164 10,579 1.0 0.9 1.11998 21,929 11,243 10,685 0.9 0.7 1.01999 22,092 11,313 10,780 0.7 0.6 0.92000 22,277 11,392 10,885 0.8 0.7 1.02001 22,406 11,442 10,964 0.6 0.4 0.72002 22,521 11,485 11,035 0.5 0.4 0.72003 22,605 11,515 11,089 0.4 0.3 0.52004 22,689 11,542 11,148 0.4 0.2 0.52005 22,770 11,562 11,208 0.4 0.2 0.52006 22,877 11,592 11,285 0.5 0.3 0.72007 22,958 11,609 11,350 0.4 0.1 0.62008 23,037 11,626 11,411 0.3 0.2 0.52009 23,120 11,637 11,483 0.4 0.1 0.62010 23,162 11,635 11,527 0.2 0.0 0.42011 23,225 11,646 11,579 0.3 0.1 0.52012 23,316 11,673 11,643 0.4 0.2 0.52013 23,374 11,685 11,689 0.2 0.1 0.42014 23,434 11,698 11,736 0.3 0.1 0.42015 23,492 11,712 11,780 0.2 0.1 0.42016 23,540 11,719 11,821 0.2 0.1 0.32017 23,571 11,720 11,852 0.1 0.0 0.32018 23,589 11,713 11,876 0.1 -0.1 0.2(1) Excluding servicemen and foreign nationals; servicemen included since 1969.Source: See Table 2-1.
End of YearGrowth Rate (%)
27

Per sq. km. of Number Rate Number Rate Number Ratecultivated land (1,000) (%) (1,000) (%) (1,000) (%)
1955 252.43 1,039.8 404 4.53 77 0.86 327 3.67 1960 300.11 1,241.9 419 3.95 74 0.69 346 3.26 1965 351.37 1,426.8 407 3.27 68 0.55 339 2.71 1970 408.24 1,630.3 394 2.72 71 0.49 323 2.21 1975 448.64 1,769.1 368 2.30 75 0.47 293 1.82 1980 493.82 1,969.8 414 2.34 84 0.48 330 1.86 1985 533.84 2,175.0 346 1.80 92 0.48 254 1.32 1990 563.85 2,292.3 336 1.66 106 0.52 230 1.13 1994 585.32 2,428.7 323 1.53 114 0.54 209 0.99 1995 590.28 2,446.4 330 1.55 119 0.56 210 0.99 1996 594.92 2,468.5 326 1.52 122 0.57 203 0.95 1997 600.83 2,513.6 326 1.51 121 0.56 205 0.95 1998 605.96 2,552.8 271 1.24 123 0.56 148 0.68 1999 610.49 2,583.9 284 1.29 126 0.57 158 0.72 2000 615.58 2,617.7 305 1.38 126 0.57 179 0.81 2001 619.14 2,639.1 260 1.17 128 0.57 133 0.59 2002 622.33 2,658.9 248 1.10 129 0.57 119 0.53 2003 624.64 2,678.0 227 1.01 131 0.58 96 0.43 2004 626.98 2,714.0 216 0.96 135 0.60 81 0.36 2005 629.22 2,733.0 206 0.91 139 0.61 66 0.29 2006 632.16 2,757.8 204 0.90 136 0.60 69 0.30 2007 634.39 2,779.6 204 0.89 141 0.62 63 0.28 2008 636.57 2,801.3 199 0.86 144 0.62 55 0.24 2009 638.82 2,835.2 191 0.83 144 0.62 48 0.21 2010 639.99 2,848.5 167 0.72 146 0.63 21 0.09 2011 641.70 2,873.5 197 0.85 153 0.66 44 0.19 2012 644.21 2,904.0 229 0.99 154 0.66 75 0.32 2013 645.81 2,922.3 199 0.85 156 0.67 43 0.19 2014 647.47 2,930.6 210 0.90 164 0.70 46 0.20 2015 649.01 2,949.0 214 0.91 164 0.70 50 0.21 2016 650.32 2,964.7 208 0.89 172 0.73 36 0.15 2017 651.19 2,972.3 194 0.82 171 0.73 23 0.10 2018 651.68 2,983.4 182 0.77 173 0.73 9 0.04
(1) See (1) of Table 2-2.(2) End of year.Source: See Table 2-1.
Deaths Natural Increase
2-3. Population Density and Vital Statistics (1)
YearPer sq. km.
Population Density (2) Births
28
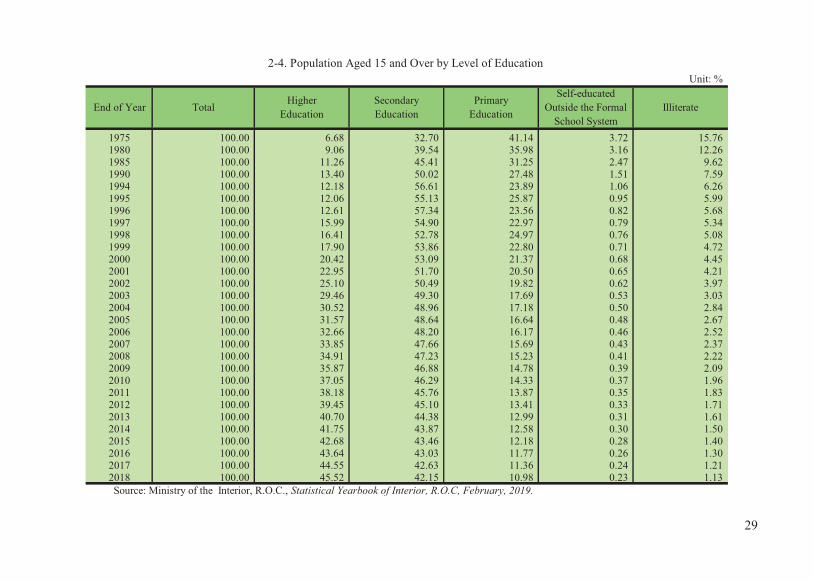
2-4. Population Aged 15 and Over by Level of Education Unit: %
1975 100.00 6.68 32.70 41.14 3.72 15.761980 100.00 9.06 39.54 35.98 3.16 12.261985 100.00 11.26 45.41 31.25 2.47 9.621990 100.00 13.40 50.02 27.48 1.51 7.591994 100.00 12.18 56.61 23.89 1.06 6.261995 100.00 12.06 55.13 25.87 0.95 5.991996 100.00 12.61 57.34 23.56 0.82 5.681997 100.00 15.99 54.90 22.97 0.79 5.341998 100.00 16.41 52.78 24.97 0.76 5.081999 100.00 17.90 53.86 22.80 0.71 4.722000 100.00 20.42 53.09 21.37 0.68 4.452001 100.00 22.95 51.70 20.50 0.65 4.212002 100.00 25.10 50.49 19.82 0.62 3.972003 100.00 29.46 49.30 17.69 0.53 3.032004 100.00 30.52 48.96 17.18 0.50 2.842005 100.00 31.57 48.64 16.64 0.48 2.672006 100.00 32.66 48.20 16.17 0.46 2.522007 100.00 33.85 47.66 15.69 0.43 2.372008 100.00 34.91 47.23 15.23 0.41 2.222009 100.00 35.87 46.88 14.78 0.39 2.092010 100.00 37.05 46.29 14.33 0.37 1.962011 100.00 38.18 45.76 13.87 0.35 1.832012 100.00 39.45 45.10 13.41 0.33 1.712013 100.00 40.70 44.38 12.99 0.31 1.612014 100.00 41.75 43.87 12.58 0.30 1.502015 100.00 42.68 43.46 12.18 0.28 1.402016 100.00 43.64 43.03 11.77 0.26 1.302017 100.00 44.55 42.63 11.36 0.24 1.212018 100.00 45.52 42.15 10.98 0.23 1.13Source: Ministry of the Interior, R.O.C., Statistical Yearbook of Interior, R.O.C, February, 2019.
End of Year TotalSelf-educated
Outside the FormalSchool System
IlliterateHigher
EducationSecondaryEducation
PrimaryEducation
29

1955 4,163 3,940 223 4,915 84.7 80.2 4.5 1960 5,172 4,904 268 5,620 92.0 87.3 4.8 1965 6,002 5,667 335 6,626 90.6 85.5 5.0 1970 6,249 5,821 428 8,426 74.2 69.1 5.1 1975 6,306 5,738 568 9,917 63.6 57.9 5.7 1980 6,505 5,739 766 11,361 57.3 50.5 6.7 1985 6,693 5,716 977 12,621 53.0 45.3 7.7 1990 6,794 5,525 1,269 13,607 49.9 40.6 9.3 1994 6,732 5,170 1,562 14,446 46.6 35.8 10.8 1995 6,707 5,076 1,631 14,650 45.8 34.6 11.1 1996 6,674 4,983 1,692 14,851 44.9 33.5 11.4 1997 6,666 4,914 1,752 15,076 44.2 32.6 11.6 1998 6,626 4,815 1,810 15,303 43.3 31.5 11.8 1999 6,600 4,735 1,865 15,492 42.6 30.6 12.0 2000 6,624 4,703 1,921 15,652 42.3 30.0 12.3 2001 6,635 4,662 1,973 15,770 42.1 29.6 12.5 2002 6,630 4,599 2,031 15,891 41.7 28.9 12.8 2003 6,569 4,482 2,088 16,035 41.0 27.9 13.0 2004 6,538 4,387 2,150 16,152 40.5 27.2 13.3 2005 6,476 4,259 2,217 16,295 39.7 26.1 13.6 2006 6,433 4,146 2,287 16,444 39.1 25.2 13.9 2007 6,374 4,031 2,343 16,585 38.4 24.3 14.1 2008 6,307 3,905 2,402 16,730 37.7 23.3 14.4 2009 6,236 3,778 2,458 16,884 36.9 22.4 14.6 2010 6,112 3,624 2,488 17,050 35.8 21.3 14.6 2011 6,030 3,502 2,528 17,195 35.1 20.4 14.7 2012 6,012 3,412 2,600 17,304 34.7 19.7 15.0 2013 6,041 3,347 2,694 17,333 34.9 19.3 15.5 2014 6,086 3,277 2,809 17,348 35.1 18.9 16.2 2015 6,126 3,188 2,939 17,366 35.3 18.4 16.9 2016 6,248 3,142 3,106 17,292 36.1 18.2 18.0 2017 6,360 3,092 3,268 17,211 37.0 18.0 19.0 2018 6,482 3,048 3,434 17,107 37.9 17.8 20.1 (1) See (1) of Table 2-2.Source: See Table 2-1.
Under 15(B)
Number of Persons of Dependent Age(1,000 persons)
65 & Over(C)
2-5. Population by Dependent and Working Age Groups (1)
(A)/(D) x 100 (B)/(D) x 100 (C)/(D) x 100
Comparison (%)End of Year Total
(A)
Number of Persons ofWorking Age (15~64)
(D) (1,000 persons)
30

1955 9,078 3,940 1,778 1,217 946 4,915 926 766 704 602 1960 10,792 4,904 1,931 1,761 1,212 5,620 940 759 805 738 1965 12,628 5,667 1,985 1,923 1,759 6,626 1,199 768 905 821 1970 14,676 5,821 1,889 2,007 1,925 8,426 1,754 1,198 926 908 1975 16,223 5,738 1,792 1,928 2,017 9,917 1,927 1,757 1,191 917 1980 17,866 5,739 1,997 1,818 1,924 11,361 2,007 1,922 1,735 1,175 1985 19,314 5,716 1,867 2,036 1,814 12,621 1,912 2,000 1,898 1,713 1990 20,401 5,525 1,613 1,893 2,019 13,607 1,796 1,902 1,975 1,872 1994 21,178 5,170 1,602 1,616 1,952 14,446 1,969 1,801 1,892 1,960 1995 21,357 5,076 1,590 1,601 1,884 14,650 2,008 1,780 1,881 1,958 1996 21,525 4,983 1,591 1,615 1,776 14,851 2,000 1,825 1,851 1,954 1997 21,743 4,914 1,599 1,627 1,688 15,076 2,012 1,852 1,843 1,923 1998 21,929 4,815 1,546 1,614 1,656 15,303 1,989 1,900 1,821 1,905 1999 22,092 4,735 1,507 1,625 1,602 15,492 1,940 1,959 1,796 1,890 2000 22,277 4,703 1,489 1,615 1,599 15,652 1,875 2,002 1,779 1,881 2001 22,406 4,662 1,427 1,619 1,616 15,770 1,768 1,992 1,829 1,856 2002 22,521 4,599 1,351 1,621 1,627 15,891 1,681 2,005 1,856 1,847 2003 22,605 4,482 1,310 1,561 1,611 16,035 1,646 1,977 1,901 1,821 2004 22,689 4,387 1,244 1,521 1,622 16,152 1,593 1,928 1,959 1,797 2005 22,770 4,259 1,144 1,503 1,612 16,295 1,590 1,865 2,003 1,782 2006 22,877 4,146 1,093 1,437 1,616 16,444 1,609 1,760 1,999 1,836 2007 22,958 4,031 1,053 1,360 1,618 16,585 1,620 1,676 2,017 1,867 2008 23,037 3,905 1,026 1,320 1,559 16,730 1,606 1,642 1,995 1,917 2009 23,120 3,778 1,002 1,256 1,520 16,884 1,618 1,590 1,951 1,982 2010 23,162 3,624 964 1,158 1,502 17,050 1,608 1,587 1,887 2,029 2011 23,225 3,502 957 1,108 1,436 17,195 1,612 1,604 1,779 2,023 2012 23,316 3,412 984 1,068 1,360 17,304 1,616 1,616 1,688 2,039 2013 23,374 3,347 987 1,040 1,320 17,333 1,557 1,602 1,650 2,014 2014 23,434 3,277 1,005 1,017 1,255 17,348 1,518 1,614 1,593 1,965 2015 23,492 3,188 1,052 978 1,158 17,365 1,500 1,604 1,586 1,898 2016 23,540 3,142 1,063 971 1,108 17,292 1,435 1,608 1,602 1,788 2017 23,571 3,092 1,022 1,002 1,067 17,211 1,358 1,612 1,612 1,693 2018 23,589 3,048 1,009 1,001 1,039 17,107 1,318 1,553 1,597 1,653
(1) See (1) of Table 2-2.Source: See Table 2-1.
Subtotal Under 5 30~345~9 10~14 Subtotal 15~19 20~24 25~29
15-64
2-6a. Population by Age Group (1)Unit: 1,000 persons
Under 15End of Year All Ages
31

1955 488 445 361 276 204 143 223 104 118 1960 632 504 454 350 257 181 268 118 150 1965 771 646 507 446 330 233 335 155 180 1970 846 850 698 514 431 300 428 200 228 1975 897 834 835 678 487 395 568 264 304 1980 907 887 818 811 646 454 766 351 415 1985 1,159 895 868 795 776 604 977 407 570 1990 1,685 1,145 888 852 765 728 1,269 546 722 1994 1,835 1,594 1,001 884 789 722 1,562 647 915 1995 1,858 1,670 1,121 848 810 715 1,631 664 967 1996 1,877 1,704 1,275 827 828 709 1,692 671 1,020 1997 1,916 1,733 1,392 849 839 719 1,752 673 1,079 1998 1,944 1,776 1,490 895 852 731 1,810 668 1,142 1999 1,951 1,816 1,568 975 851 747 1,865 663 1,202 2000 1,948 1,840 1,644 1,096 818 769 1,921 659 1,262 2001 1,947 1,859 1,679 1,251 801 789 1,973 656 1,317 2002 1,914 1,896 1,706 1,364 822 799 2,031 666 1,366 2003 1,892 1,919 1,745 1,456 866 811 2,088 677 1,411 2004 1,878 1,926 1,784 1,532 944 811 2,150 694 1,456 2005 1,870 1,925 1,809 1,608 1,063 780 2,217 715 1,502 2006 1,850 1,928 1,832 1,647 1,217 766 2,287 737 1,550 2007 1,845 1,897 1,870 1,675 1,329 789 2,343 749 1,594 2008 1,824 1,879 1,896 1,716 1,422 834 2,402 763 1,640 2009 1,805 1,868 1,905 1,756 1,498 911 2,458 764 1,694 2010 1,792 1,862 1,905 1,780 1,573 1,027 2,488 737 1,751 2011 1,845 1,842 1,906 1,801 1,608 1,175 2,528 725 1,804 2012 1,874 1,837 1,875 1,838 1,636 1,284 2,600 747 1,853 2013 1,924 1,816 1,856 1,864 1,676 1,374 2,694 792 1,902 2014 1,984 1,795 1,845 1,872 1,714 1,447 2,809 866 1,943 2015 2,029 1,781 1,839 1,871 1,737 1,520 2,939 977 1,962 2016 2,023 1,834 1,820 1,872 1,757 1,554 3,106 1,118 1,988 2017 2,040 1,864 1,816 1,842 1,793 1,582 3,268 1,222 2,046 2018 2,014 1,914 1,795 1,824 1,818 1,620 3,434 1,309 2,125
Unit: 1,000 persons2-6b. Population by Age Group (Continued)
End of Year35-39 40-44 45-49 50-54 55-59 60-64
65 & Over
Subtotal 65-69 Over 70
15-64
32

1955 100.0 43.4 19.6 13.4 10.4 54.1 10.2 8.4 7.8 6.6 1960 100.0 45.4 17.9 16.3 11.2 52.1 8.7 7.0 7.5 6.8 1965 100.0 44.9 15.7 15.2 13.9 52.5 9.5 6.1 7.2 6.5 1970 100.0 39.7 12.9 13.7 13.1 57.4 12.0 8.2 6.3 6.2 1975 100.0 35.4 11.0 11.9 12.4 61.1 11.9 10.8 7.3 5.6 1980 100.0 32.1 11.2 10.2 10.8 63.6 11.2 10.8 9.7 6.6 1985 100.0 29.6 9.7 10.5 9.4 65.3 9.9 10.4 9.8 8.9 1990 100.0 27.1 7.9 9.3 9.9 66.7 8.8 9.3 9.7 9.2 1994 100.0 24.4 7.6 7.6 9.2 68.2 9.3 8.5 8.9 9.3 1995 100.0 23.8 7.4 7.5 8.8 68.6 9.4 8.3 8.8 9.2 1996 100.0 23.1 7.4 7.5 8.3 69.0 9.3 8.5 8.6 9.1 1997 100.0 22.6 7.4 7.5 7.8 69.3 9.3 8.5 8.5 8.8 1998 100.0 22.0 7.0 7.4 7.6 69.8 9.1 8.7 8.3 8.7 1999 100.0 21.4 6.8 7.4 7.3 70.1 8.8 8.9 8.1 8.6 2000 100.0 21.1 6.7 7.3 7.2 70.3 8.4 9.0 8.0 8.4 2001 100.0 20.8 6.4 7.2 7.2 70.4 7.9 8.9 8.2 8.3 2002 100.0 20.4 6.0 7.2 7.2 70.6 7.5 8.9 8.2 8.2 2003 100.0 19.8 5.8 6.9 7.1 70.9 7.3 8.7 8.4 8.1 2004 100.0 19.3 5.5 6.7 7.1 71.2 7.0 8.5 8.6 7.9 2005 100.0 18.7 5.0 6.6 7.1 71.6 7.0 8.2 8.8 7.8 2006 100.0 18.1 4.8 6.3 7.1 71.9 7.0 7.7 8.7 8.0 2007 100.0 17.6 4.6 5.9 7.0 72.2 7.1 7.3 8.8 8.1 2008 100.0 17.0 4.5 5.7 6.8 72.6 7.0 7.1 8.7 8.3 2009 100.0 16.3 4.3 5.4 6.6 73.0 7.0 6.9 8.4 8.6 2010 100.0 15.6 4.2 5.0 6.5 73.6 6.9 6.9 8.1 8.8 2011 100.0 15.1 4.1 4.8 6.2 74.0 6.9 6.9 7.7 8.7 2012 100.0 14.6 4.2 4.6 5.8 74.2 6.9 6.9 7.2 8.7 2013 100.0 14.3 4.2 4.4 5.6 74.2 6.7 6.9 7.1 8.6 2014 100.0 14.0 4.3 4.3 5.4 74.0 6.5 6.9 6.8 8.4 2015 100.0 13.6 4.5 4.2 4.9 73.9 6.4 6.8 6.8 8.1 2016 100.0 13.3 4.5 4.1 4.7 73.5 6.1 6.8 6.8 7.6 2017 100.0 13.1 4.3 4.3 4.5 73.0 5.8 6.8 6.8 7.2 2018 100.0 12.9 4.3 4.2 4.4 72.5 5.8 6.6 6.8 7.0
(1) See (1) of Table 2-2.Source: See Table 2-1.
2-7a. Percentages of Population by Age Group (1)Unit: %
End ofYear
All AgesUnder 15 15-64
Subtotal Under 5 5-9 10-14 30-34Subtotal 15-19 20-24 25-29
33

1955 5.4 4.9 4.0 3.0 2.2 1.6 2.5 1.1 1.3 1960 5.9 4.7 4.2 3.2 2.4 1.7 2.5 1.1 1.4 1965 6.1 5.1 4.0 3.5 2.6 1.8 2.6 1.2 1.4 1970 5.8 5.8 4.8 3.5 2.9 2.0 2.9 1.4 1.6 1975 5.5 5.1 5.1 4.2 3.0 2.4 3.5 1.6 1.9 1980 5.1 5.0 4.6 4.5 3.6 2.5 4.3 2.0 2.3 1985 6.0 4.6 4.5 4.1 4.0 3.1 5.1 2.1 3.0 1990 8.3 5.6 4.4 4.2 3.8 3.6 6.2 2.7 3.5 1994 8.7 7.5 4.7 4.2 3.7 3.4 7.4 3.1 4.3 1995 8.7 7.8 5.2 4.0 3.8 3.3 7.6 3.1 4.5 1996 8.7 7.9 5.9 3.8 3.8 3.3 7.9 3.1 4.7 1997 8.8 8.0 6.4 3.9 3.9 3.3 8.1 3.1 5.0 1998 8.9 8.1 6.8 4.1 3.9 3.3 8.3 3.0 5.2 1999 8.8 8.2 7.1 4.4 3.9 3.4 8.4 3.0 5.4 2000 8.7 8.3 7.4 4.9 3.7 3.4 8.6 3.0 5.7 2001 8.7 8.3 7.5 5.6 3.6 3.5 8.8 2.9 5.9 2002 8.5 8.4 7.6 6.1 3.6 3.5 9.0 3.0 6.1 2003 8.4 8.5 7.7 6.4 3.8 3.6 9.2 3.0 6.2 2004 8.3 8.5 7.9 6.8 4.2 3.6 9.5 3.1 6.4 2005 8.2 8.5 7.9 7.1 4.7 3.4 9.7 3.1 6.6 2006 8.1 8.4 8.0 7.2 5.3 3.3 10.0 3.2 6.8 2007 8.0 8.3 8.1 7.3 5.8 3.4 10.2 3.3 6.9 2008 7.9 8.2 8.2 7.4 6.2 3.6 10.4 3.3 7.1 2009 7.8 8.1 8.2 7.6 6.5 3.9 10.6 3.3 7.3 2010 7.7 8.0 8.2 7.7 6.8 4.4 10.7 3.2 7.6 2011 7.9 7.9 8.2 7.8 6.9 5.1 10.9 3.1 7.8 2012 8.0 7.9 8.0 7.9 7.0 5.5 11.2 3.2 7.9 2013 8.2 7.8 7.9 8.0 7.2 5.9 11.5 3.4 8.1 2014 8.5 7.7 7.9 8.0 7.3 6.2 12.0 3.7 8.3 2015 8.6 7.6 7.8 8.0 7.4 6.5 12.5 4.2 8.3 2016 8.6 7.8 7.7 8.0 7.5 6.6 13.2 4.8 8.4 2017 8.7 7.9 7.7 7.8 7.6 6.7 13.9 5.2 8.7 2018 8.7 7.9 7.7 7.8 7.6 6.7 14.6 5.6 9.0
Over 70
2-7b. Percentages of Population by Age Group (continued)
End of Year15-64 65 & Over
35-39 40-44 60-6445-49 50-54 55-59 Subtotal 65-69
34
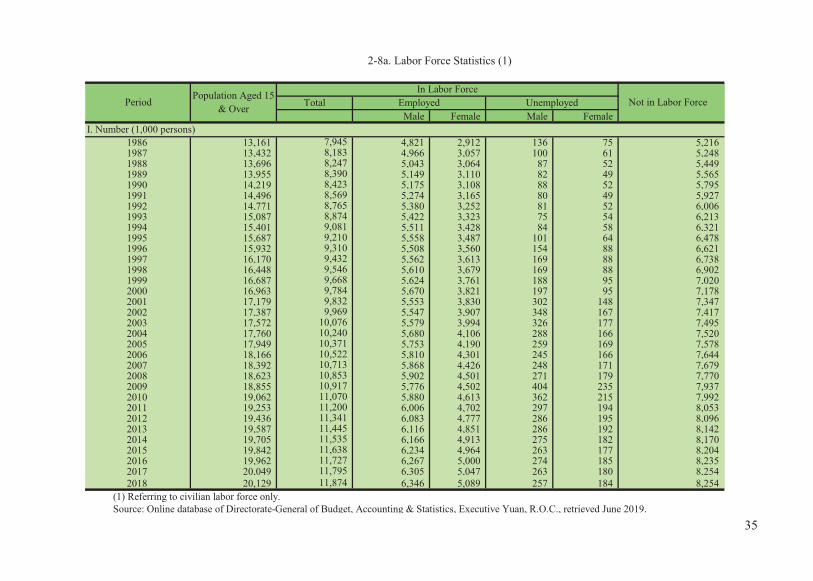
Male Female Male Female
1986 13,161 4,821 2,912 136 75 5,216 1987 13,432 4,966 3,057 100 61 5,248 1988 13,696 5,043 3,064 87 52 5,449 1989 13,955 5,149 3,110 82 49 5,565 1990 14,219 5,175 3,108 88 52 5,795 1991 14,496 5,274 3,165 80 49 5,927 1992 14,771 5,380 3,252 81 52 6,006 1993 15,087 5,422 3,323 75 54 6,213 1994 15,401 5,511 3,428 84 58 6,321 1995 15,687 5,558 3,487 101 64 6,478 1996 15,932 5,508 3,560 154 88 6,621 1997 16,170 5,562 3,613 169 88 6,738 1998 16,448 5,610 3,679 169 88 6,902 1999 16,687 5,624 3,761 188 95 7,020 2000 16,963 5,670 3,821 197 95 7,178 2001 17,179 5,553 3,830 302 148 7,347 2002 17,387 5,547 3,907 348 167 7,417 2003 17,572 5,579 3,994 326 177 7,495 2004 17,760 5,680 4,106 288 166 7,520 2005 17,949 5,753 4,190 259 169 7,578 2006 18,166 5,810 4,301 245 166 7,644 2007 18,392 5,868 4,426 248 171 7,679 2008 18,623 5,902 4,501 271 179 7,770 2009 18,855 5,776 4,502 404 235 7,937 2010 19,062 5,880 4,613 362 215 7,992 2011 19,253 6,006 4,702 297 194 8,053 2012 19,436 6,083 4,777 286 195 8,096 2013 19,587 6,116 4,851 286 192 8,142 2014 19,705 6,166 4,913 275 182 8,170 2015 19,842 6,234 4,964 263 177 8,204 2016 19,962 6,267 5,000 274 185 8,235 2017 20,049 6,305 5,047 263 180 8,254 2018 20,129 6,346 5,089 257 184 8,254
(1) Referring to civilian labor force only.Source: Online database of Directorate-General of Budget, Accounting & Statistics, Executive Yuan, R.O.C., retrieved June 2019.
7,945
11,727 11,795 11,874
8,183 8,247
8,874
8,390
I. Number (1,000 persons)
Period Population Aged 15& Over
11,535
2-8a. Labor Force Statistics (1)
EmployedIn Labor Force
Total Unemployed Not in Labor Force
10,240 10,371 10,522 10,713 10,853
11,638
10,917 11,070 11,200 11,341 11,445
8,423 8,569 8,765
9,081 9,210 9,310 9,432 9,546
9,784 9,832 9,969
10,076
9,668
35

TotalMale Female Male Female
1986 100.0 60.4 36.6 22.1 1.0 0.6 39.6 2.7 1987 100.0 60.9 37.0 22.8 0.7 0.5 39.1 2.0 1988 100.0 60.2 36.8 22.4 0.6 0.4 39.8 1.7 1989 100.0 60.1 36.9 22.3 0.6 0.4 39.9 1.6 1990 100.0 59.2 36.4 21.9 0.6 0.4 40.8 1.7 1991 100.0 59.1 36.4 21.8 0.6 0.3 40.9 1.5 1992 100.0 59.3 36.4 22.0 0.5 0.4 40.7 1.5 1993 100.0 58.8 35.9 22.0 0.5 0.4 41.2 1.5 1994 100.0 59.0 35.8 22.3 0.5 0.4 41.0 1.6 1995 100.0 58.7 35.4 22.2 0.6 0.4 41.3 1.8 1996 100.0 58.4 34.6 22.3 1.0 0.6 41.6 2.6 1997 100.0 58.3 34.4 22.3 1.0 0.5 41.7 2.7 1998 100.0 58.0 34.1 22.4 1.0 0.5 42.0 2.7 1999 100.0 57.9 33.7 22.5 1.1 0.6 42.1 2.9 2000 100.0 57.7 33.4 22.5 1.2 0.6 42.3 3.0 2001 100.0 57.2 32.3 22.3 1.8 0.9 42.8 4.6 2002 100.0 57.3 31.9 22.5 2.0 1.0 42.7 5.2 2003 100.0 57.3 31.7 22.7 1.9 1.0 42.7 5.0 2004 100.0 57.7 32.0 23.1 1.6 0.9 42.3 4.4 2005 100.0 57.8 32.1 23.3 1.4 0.9 42.2 4.1 2006 100.0 57.9 32.0 23.7 1.3 0.9 42.1 3.9 2007 100.0 58.2 31.9 24.1 1.3 0.9 41.8 3.9 2008 100.0 58.3 31.7 24.2 1.5 1.0 41.7 4.1 2009 100.0 57.9 30.6 23.9 2.1 1.2 42.1 5.9 2010 100.0 58.1 30.8 24.2 1.9 1.1 41.9 5.2 2011 100.0 58.2 31.2 24.4 1.5 1.0 41.8 4.4 2012 100.0 58.4 31.3 24.6 1.5 1.0 41.7 4.2 2013 100.0 58.4 31.2 24.8 1.5 1.0 41.6 4.2 2014 100.0 58.5 31.3 24.9 1.4 0.9 41.5 4.0 2015 100.0 58.7 31.4 25.0 1.3 0.9 41.3 3.8 2016 100.0 58.7 31.4 25.0 1.4 0.9 41.3 3.9 2017 100.0 58.8 31.4 25.2 1.3 0.9 41.2 3.8 2018 100.0 59.0 31.5 25.3 1.3 0.9 41.0 3.7
Population Aged 15& Over
Not in Labor Force UnemploymentRate (%)
II. Percentage (%)
2-8b. Labor Force Statistics (continued)
PeriodIn Labor Force
Employed Unemployed
36

1955 3,108 1,667 560 57 411 84 8 881 313 124 444 1960 3,473 1,742 713 80 514 107 12 1,018 346 154 518 1965 3,763 1,748 839 82 612 130 15 1,176 389 179 608 1970 4,576 1,681 1,278 72 958 231 17 1,617 623 248 746 1975 5,521 1,681 1,927 62 1,518 325 23 1,913 775 314 824 1980 6,547 1,277 2,784 56 2,152 549 27 2,487 1,058 332 1,097 1985 7,428 1,297 3,088 35 2,501 517 34 3,044 1,327 385 1,332 1990 8,283 1,064 3,382 20 2,653 673 36 3,837 1,621 441 1,775 1994 8,939 976 3,506 18 2,485 967 36 4,456 1,875 2,109 1995 9,045 954 3,504 15 2,449 1,003 36 4,587 1,919 469 2,198 1996 9,068 918 3,399 14 2,422 928 35 4,751 1,976 472 2,303 1997 9,176 878 3,502 13 2,570 885 35 4,795 1,995 465 2,335 1998 9,289 822 3,523 12 2,611 865 35 4,944 2,047 477 2,421 1999 9,385 774 3,492 11 2,603 843 35 5,118 2,169 476 2,473 2000 9,491 738 3,534 11 2,655 832 36 5,220 2,201 481 2,537 2001 9,383 706 3,432 10 2,594 745 82 5,245 2,211 611 2,424 2002 9,454 709 3,388 9 2,572 724 83 5,356 2,272 598 2,487 2003 9,573 696 3,398 9 2,600 701 88 5,480 2,288 601 2,591 2004 9,786 642 3,514 7 2,681 732 93 5,631 2,331 614 2,684 2005 9,942 590 3,619 7 2,732 791 89 5,733 2,360 611 2,763 2006 10,111 554 3,700 7 2,777 829 88 5,857 2,424 626 2,808 2007 10,294 543 3,788 6 2,842 846 93 5,962 2,463 621 2,878 2008 10,403 535 3,832 6 2,886 842 99 6,036 2,457 617 2,962 2009 10,279 543 3,684 5 2,790 788 102 6,051 2,428 609 3,014 2010 10,493 550 3,769 4 2,861 797 107 6,174 2,474 612 3,088 2011 10,709 542 3,892 4 2,949 831 108 6,275 2,491 629 3,156 2012 10,860 544 3,935 4 2,975 845 111 6,381 2,550 642 3,188 2013 10,967 544 3,965 4 2,988 861 113 6,458 2,592 659 3,205 2014 11,079 548 4,004 4 3,007 881 111 6,526 2,617 674 3,234 2015 11,198 555 4,035 4 3,024 895 112 6,609 2,655 683 3,271 2016 11,267 557 4,043 4 3,028 899 112 6,667 2,679 689 3,298 2017 11,352 557 4,063 4 3,045 901 112 6,732 2,707 696 3,329 2018 11,434 561 4,083 4 3,064 904 111 6,790 2,739 704 3,348
Source: See Table 2-8a.
OtherServices
UtilitiesPeriod Total Primary
Industry
Secondary Industry
I. Number (1,000 persons)
2-9a. Employment by Industry
Mfg. Const. Subtotal Trans.Subtotal Mining Comm.
Tertiary Industry
37
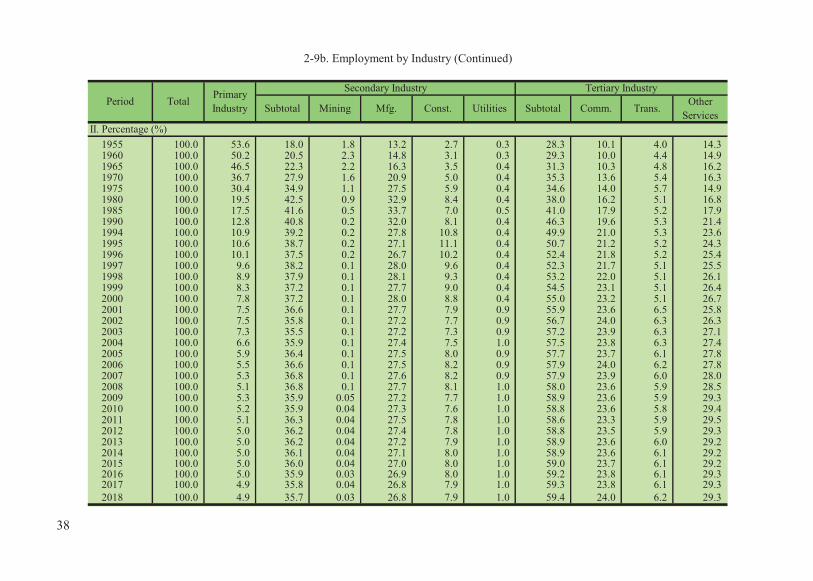
1955 100.0 53.6 18.0 1.8 13.2 2.7 0.3 28.3 10.1 4.0 14.3 1960 100.0 50.2 20.5 2.3 14.8 3.1 0.3 29.3 10.0 4.4 14.9 1965 100.0 46.5 22.3 2.2 16.3 3.5 0.4 31.3 10.3 4.8 16.2 1970 100.0 36.7 27.9 1.6 20.9 5.0 0.4 35.3 13.6 5.4 16.3 1975 100.0 30.4 34.9 1.1 27.5 5.9 0.4 34.6 14.0 5.7 14.9 1980 100.0 19.5 42.5 0.9 32.9 8.4 0.4 38.0 16.2 5.1 16.8 1985 100.0 17.5 41.6 0.5 33.7 7.0 0.5 41.0 17.9 5.2 17.9 1990 100.0 12.8 40.8 0.2 32.0 8.1 0.4 46.3 19.6 5.3 21.4 1994 100.0 10.9 39.2 0.2 27.8 10.8 0.4 49.9 21.0 5.3 23.6 1995 100.0 10.6 38.7 0.2 27.1 11.1 0.4 50.7 21.2 5.2 24.3 1996 100.0 10.1 37.5 0.2 26.7 10.2 0.4 52.4 21.8 5.2 25.4 1997 100.0 9.6 38.2 0.1 28.0 9.6 0.4 52.3 21.7 5.1 25.5 1998 100.0 8.9 37.9 0.1 28.1 9.3 0.4 53.2 22.0 5.1 26.1 1999 100.0 8.3 37.2 0.1 27.7 9.0 0.4 54.5 23.1 5.1 26.4 2000 100.0 7.8 37.2 0.1 28.0 8.8 0.4 55.0 23.2 5.1 26.7 2001 100.0 7.5 36.6 0.1 27.7 7.9 0.9 55.9 23.6 6.5 25.8 2002 100.0 7.5 35.8 0.1 27.2 7.7 0.9 56.7 24.0 6.3 26.3 2003 100.0 7.3 35.5 0.1 27.2 7.3 0.9 57.2 23.9 6.3 27.1 2004 100.0 6.6 35.9 0.1 27.4 7.5 1.0 57.5 23.8 6.3 27.4 2005 100.0 5.9 36.4 0.1 27.5 8.0 0.9 57.7 23.7 6.1 27.8 2006 100.0 5.5 36.6 0.1 27.5 8.2 0.9 57.9 24.0 6.2 27.8 2007 100.0 5.3 36.8 0.1 27.6 8.2 0.9 57.9 23.9 6.0 28.0 2008 100.0 5.1 36.8 0.1 27.7 8.1 1.0 58.0 23.6 5.9 28.5 2009 100.0 5.3 35.9 0.05 27.2 7.7 1.0 58.9 23.6 5.9 29.3 2010 100.0 5.2 35.9 0.04 27.3 7.6 1.0 58.8 23.6 5.8 29.4 2011 100.0 5.1 36.3 0.04 27.5 7.8 1.0 58.6 23.3 5.9 29.5 2012 100.0 5.0 36.2 0.04 27.4 7.8 1.0 58.8 23.5 5.9 29.3 2013 100.0 5.0 36.2 0.04 27.2 7.9 1.0 58.9 23.6 6.0 29.2 2014 100.0 5.0 36.1 0.04 27.1 8.0 1.0 58.9 23.6 6.1 29.2 2015 100.0 5.0 36.0 0.04 27.0 8.0 1.0 59.0 23.7 6.1 29.2 2016 100.0 5.0 35.9 0.03 26.9 8.0 1.0 59.2 23.8 6.1 29.3 2017 100.0 4.9 35.8 0.04 26.8 7.9 1.0 59.3 23.8 6.1 29.3 2018 100.0 4.9 35.7 0.03 26.8 7.9 1.0 59.4 24.0 6.2 29.3
2-9b. Employment by Industry (Continued)
Period Total PrimaryIndustry
Secondary Industry Tertiary Industry
Subtotal Subtotal Comm. Trans. OtherServices
Utilities
II. Percentage (%)
Mining Mfg. Const.
38

2-10a. Employment by Level of Education
Junior High & Below Senior High & Vocational Junior College & Above
Subtotal Primary &Below Junior High Subtotal Senior High Vocational Subtotal Junior
CollegeCollege &
AboveI. Number (1,000 persons)
1980 6,547 4,588 3,360 1,228 1,279 449 829 681 350 331 1985 7,428 4,703 3,228 1,475 1,797 533 1,264 928 510 419 1990 8,283 4,456 2,807 1,649 2,473 704 1,770 1,354 758 596 1992 8,632 4,414 2,654 1,760 2,691 745 1,946 1,527 884 643 1993 8,745 4,265 2,516 1,750 2,822 759 2,064 1,658 954 704 1994 8,939 4,262 2,458 1,804 2,925 774 2,151 1,751 1,019 732 1995 9,045 4,180 2,361 1,819 2,999 767 2,232 1,866 1,066 800 1996 9,068 3,953 2,194 1,759 3,095 786 2,309 2,019 1,162 858 1997 9,176 3,877 2,112 1,765 3,110 805 2,304 2,189 1,250 938 1998 9,289 3,762 1,985 1,778 3,214 854 2,359 2,313 1,308 1,005 1999 9,385 3,609 1,815 1,794 3,317 874 2,443 2,459 1,394 1,065 2000 9,491 3,520 1,724 1,797 3,375 877 2,498 2,596 1,473 1,123 2001 9,383 3,318 1,602 1,716 3,371 859 2,512 2,694 1,525 1,169 2002 9,454 3,179 1,532 1,647 3,424 857 2,567 2,851 1,581 1,271 2003 9,573 3,063 1,452 1,611 3,491 869 2,622 3,019 1,628 1,391 2004 9,786 2,975 1,376 1,598 3,592 883 2,709 3,220 1,677 1,542 2005 9,942 2,880 1,300 1,581 3,605 873 2,732 3,458 1,724 1,733 2006 10,111 2,770 1,206 1,564 3,631 865 2,766 3,711 1,759 1,951 2007 10,294 2,689 1,137 1,553 3,680 886 2,794 3,925 1,764 2,161 2008 10,403 2,560 1,063 1,497 3,667 881 2,786 4,176 1,787 2,389 2009 10,279 2,392 971 1,421 3,551 859 2,692 4,336 1,767 2,568 2010 10,493 2,361 945 1,415 3,583 871 2,712 4,549 1,798 2,752 2011 10,709 2,312 910 1,402 3,645 894 2,751 4,752 1,814 2,938 2012 10,860 2,268 885 1,383 3,674 910 2,764 4,917 1,812 3,106 2013 10,967 2,226 855 1,371 3,661 908 2,753 5,080 1,807 3,273 2014 11,079 2,124 787 1,337 3,675 928 2,747 5,280 1,805 3,474 2015 11,198 2,061 750 1,311 3,692 946 2,746 5,445 1,805 3,640 2016 11,267 2,009 718 1,291 3,688 951 2,737 5,571 1,801 3,770 2017 11,352 1,959 686 1,274 3,694 953 2,742 5,698 1,806 3,892 2018 11,434 1,913 656 1,258 3,706 958 2,749 5,814 1,815 3,999
Source: See Table 2-8a.
Period Total
39
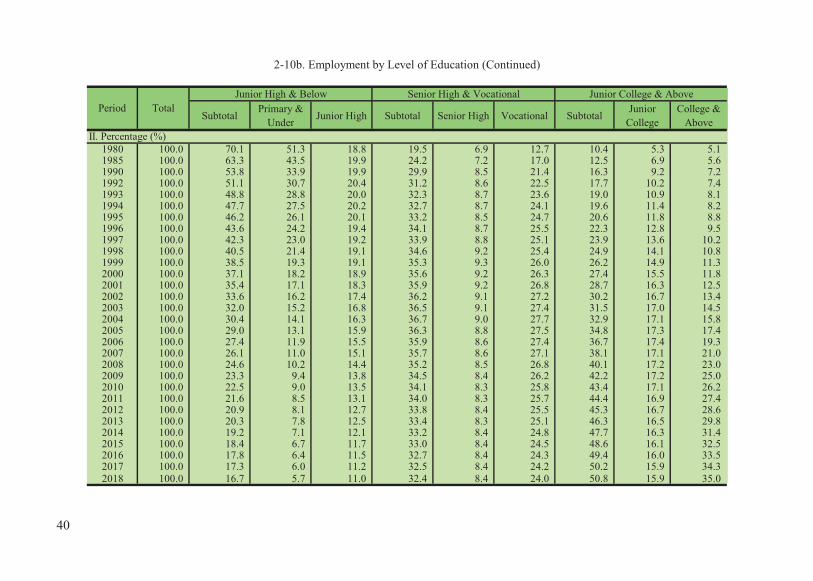
2-10b. Employment by Level of Education (Continued)
Junior High & Below Senior High & Vocational Junior College & Above
Subtotal Primary &Under Junior High Subtotal Senior High Vocational Subtotal Junior
CollegeCollege &
Above
1980 100.0 70.1 51.3 18.8 19.5 6.9 12.7 10.4 5.3 5.1 1985 100.0 63.3 43.5 19.9 24.2 7.2 17.0 12.5 6.9 5.6 1990 100.0 53.8 33.9 19.9 29.9 8.5 21.4 16.3 9.2 7.2 1992 100.0 51.1 30.7 20.4 31.2 8.6 22.5 17.7 10.2 7.4 1993 100.0 48.8 28.8 20.0 32.3 8.7 23.6 19.0 10.9 8.1 1994 100.0 47.7 27.5 20.2 32.7 8.7 24.1 19.6 11.4 8.2 1995 100.0 46.2 26.1 20.1 33.2 8.5 24.7 20.6 11.8 8.8 1996 100.0 43.6 24.2 19.4 34.1 8.7 25.5 22.3 12.8 9.5 1997 100.0 42.3 23.0 19.2 33.9 8.8 25.1 23.9 13.6 10.2 1998 100.0 40.5 21.4 19.1 34.6 9.2 25.4 24.9 14.1 10.8 1999 100.0 38.5 19.3 19.1 35.3 9.3 26.0 26.2 14.9 11.3 2000 100.0 37.1 18.2 18.9 35.6 9.2 26.3 27.4 15.5 11.8 2001 100.0 35.4 17.1 18.3 35.9 9.2 26.8 28.7 16.3 12.5 2002 100.0 33.6 16.2 17.4 36.2 9.1 27.2 30.2 16.7 13.4 2003 100.0 32.0 15.2 16.8 36.5 9.1 27.4 31.5 17.0 14.5 2004 100.0 30.4 14.1 16.3 36.7 9.0 27.7 32.9 17.1 15.8 2005 100.0 29.0 13.1 15.9 36.3 8.8 27.5 34.8 17.3 17.4 2006 100.0 27.4 11.9 15.5 35.9 8.6 27.4 36.7 17.4 19.3 2007 100.0 26.1 11.0 15.1 35.7 8.6 27.1 38.1 17.1 21.0 2008 100.0 24.6 10.2 14.4 35.2 8.5 26.8 40.1 17.2 23.0 2009 100.0 23.3 9.4 13.8 34.5 8.4 26.2 42.2 17.2 25.0 2010 100.0 22.5 9.0 13.5 34.1 8.3 25.8 43.4 17.1 26.2 2011 100.0 21.6 8.5 13.1 34.0 8.3 25.7 44.4 16.9 27.4 2012 100.0 20.9 8.1 12.7 33.8 8.4 25.5 45.3 16.7 28.6 2013 100.0 20.3 7.8 12.5 33.4 8.3 25.1 46.3 16.5 29.8 2014 100.0 19.2 7.1 12.1 33.2 8.4 24.8 47.7 16.3 31.4 2015 100.0 18.4 6.7 11.7 33.0 8.4 24.5 48.6 16.1 32.5 2016 100.0 17.8 6.4 11.5 32.7 8.4 24.3 49.4 16.0 33.5 2017 100.0 17.3 6.0 11.2 32.5 8.4 24.2 50.2 15.9 34.3 2018 100.0 16.7 5.7 11.0 32.4 8.4 24.0 50.8 15.9 35.0
II. Percentage (%)
Period Total
40

2-11a. Average Monthly Working Hours of Employees of Nonagricultural IndustriesUnit: hour
1980 215 217 187 221 229 205 201 211 210 2151985 204 205 183 205 195 196 201 202 200 2111990 197 200 187 202 190 192 191 192 190 2021993 196 200 193 202 190 190 191 192 189 1991994 197 201 191 202 190 194 195 191 190 1981995 194 200 189 202 187 193 195 188 186 1961996 193 199 189 201 186 195 193 187 184 1961997 194 200 191 202 184 191 192 188 187 1961998 190 196 190 198 182 187 188 184 183 1931999 190 197 186 199 183 184 186 184 183 1912000 190 197 185 199 182 188 188 184 183 1902001 180 184 184 184 173 184 181 177 178 1822002 181 186 188 188 172 182 176 177 177 1812003 181 186 186 188 171 182 176 177 176 1792004 184 189 184 191 172 183 177 179 180 1832005 182 187 181 189 171 185 178 177 178 1812006 181 186 183 187 172 184 178 177 175 1802007 180 186 184 187 171 185 177 176 175 1792008 180 183 184 185 173 187 176 176 176 1792009 177 179 182 179 172 183 175 175 176 1802010 181 187 185 189 173 183 177 176 176 1822011 179 184 182 185 171 179 178 174 174 1792012 178 183 183 184 177 179 178 175 173 1812013 177 183 182 184 175 179 175 173 172 1792014 178 184 181 185 176 180 176 174 173 1802015 175 181 179 182 175 176 172 171 171 1782016 170 174 174 175 172 169 166 166 165 1722017 170 174 170 176 177 168 165 166 165 1722018 169 175 168 176 178 168 166 166 164 173
Source: See Table 2-8a.
Period Industry &Services
Industry Mining &Quarrying
Services TradeManu-facturing
Transport &Storage
Electricity &Gas Supply
WaterSupply &
RemediationServices
Cons-truction
41
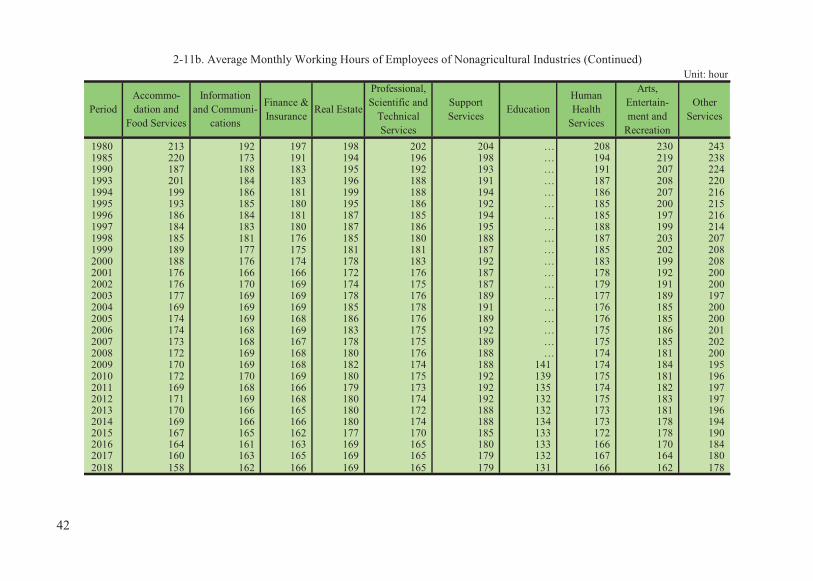
2-11b. Average Monthly Working Hours of Employees of Nonagricultural Industries (Continued)Unit: hour
1980 213 192 197 198 202 204 … 208 230 2431985 220 173 191 194 196 198 … 194 219 2381990 187 188 183 195 192 193 … 191 207 2241993 201 184 183 196 188 191 … 187 208 2201994 199 186 181 199 188 194 … 186 207 2161995 193 185 180 195 186 192 … 185 200 2151996 186 184 181 187 185 194 … 185 197 2161997 184 183 180 187 186 195 … 188 199 2141998 185 181 176 185 180 188 … 187 203 2071999 189 177 175 181 181 187 … 185 202 2082000 188 176 174 178 183 192 … 183 199 2082001 176 166 166 172 176 187 … 178 192 2002002 176 170 169 174 175 187 … 179 191 2002003 177 169 169 178 176 189 … 177 189 1972004 169 169 169 185 178 191 … 176 185 2002005 174 169 168 186 176 189 … 176 185 2002006 174 168 169 183 175 192 … 175 186 2012007 173 168 167 178 175 189 … 175 185 2022008 172 169 168 180 176 188 … 174 181 2002009 170 169 168 182 174 188 141 174 184 1952010 172 170 169 180 175 192 139 175 181 1962011 169 168 166 179 173 192 135 174 182 1972012 171 169 168 180 174 192 132 175 183 1972013 170 166 165 180 172 188 132 173 181 1962014 169 166 166 180 174 188 134 173 178 1942015 167 165 162 177 170 185 133 172 178 1902016 164 161 163 169 165 180 133 166 170 1842017 160 163 165 169 165 179 132 167 164 1802018 158 162 166 169 165 179 131 166 162 178
PeriodAccommo-dation and
Food Services
Informationand Communi-
cations
Finance &Insurance
Arts,Entertain-ment and
Recreation
Real Estate Education OtherServices
Professional,Scientific and
TechnicalServices
SupportServices
HumanHealth
Services
42

2-12a. Average Monthly Earnings of Employees of Nonagricultural IndustriesUnit: NT$
1989 21,247 19,919 21,689 19,431 42,612 23,022 21,433 23,439 21,021 23,369 1990 24,315 22,686 26,522 22,014 47,466 28,249 24,719 26,751 24,692 26,376 1991 26,875 25,362 28,671 24,430 58,395 29,916 28,193 29,032 26,435 29,898 1992 29,436 27,937 31,937 26,942 60,937 31,017 30,825 31,437 28,152 32,272 1993 31,689 30,043 32,875 28,826 64,897 33,927 33,638 33,752 30,548 34,769 1994 33,637 31,833 33,887 30,752 69,330 38,065 34,379 35,802 32,089 36,712 1995 35,355 33,439 35,633 32,494 71,940 39,072 35,278 37,433 34,149 39,260 1996 36,655 34,697 37,354 33,839 79,953 39,304 35,817 38,714 34,905 40,985 1997 38,435 36,179 38,545 35,408 80,437 40,281 37,029 40,787 36,406 42,717 1998 39,603 37,234 40,083 36,438 88,192 41,708 37,886 42,022 37,696 44,076 1999 40,781 38,410 41,432 37,746 91,265 44,729 38,070 43,166 38,695 45,074 2000 41,831 39,505 43,066 38,922 91,805 44,341 38,897 44,143 39,541 45,951 2001 41,952 39,011 44,068 38,420 97,399 46,002 37,746 44,796 39,775 48,019 2002 41,533 38,843 44,804 38,444 93,466 43,917 36,844 44,105 39,152 46,512 2003 42,068 39,858 47,720 39,558 95,191 43,954 37,214 44,152 39,610 45,936 2004 42,684 40,849 46,307 40,666 94,525 42,880 37,916 44,386 39,819 46,884 2005 43,162 41,916 47,671 41,868 91,184 47,647 38,450 44,280 39,546 48,516 2006 43,492 42,515 53,344 42,403 97,230 47,251 39,168 44,349 39,380 48,340 2007 44,411 43,358 50,949 43,240 98,519 44,399 40,310 45,320 39,463 49,095 2008 44,418 43,384 51,333 43,297 89,432 44,521 40,754 45,296 39,956 49,585 2009 42,299 40,338 49,448 39,525 96,285 44,042 40,870 43,867 40,081 47,911 2010 44,646 43,465 52,551 43,152 96,523 45,106 41,598 45,600 41,766 49,012 2011 45,961 44,824 53,978 44,603 95,382 45,828 42,716 46,881 42,562 50,333 2012 46,109 45,309 52,752 45,238 92,871 43,675 42,683 46,747 41,815 50,364 2013 46,174 45,434 54,871 45,448 88,934 44,143 42,540 46,756 42,249 50,021 2014 47,832 46,903 54,093 47,018 94,111 44,919 43,251 48,558 44,377 50,291 2015 49,024 48,373 57,198 48,713 96,595 44,357 43,346 49,526 45,422 51,579 2016 49,266 48,654 55,425 49,162 94,453 43,216 42,839 49,730 45,345 52,540 2017 50,480 49,907 55,098 50,678 94,730 44,286 42,506 50,912 47,260 53,314 2018 52,407 52,005 56,288 52,948 96,054 45,319 43,645 52,708 49,798 54,994
Source: See Table 2-8a.
Manu-facturing
Transport&
Storage
Electricity &Gas Supply
WaterSupply &
RemediationServices
Cons-truction
PeriodIndustry
&Services
IndustryMining
&Quarrying
Services Trade
43

2-12b. Average Monthly Earnings of Employees of Nonagricultural Industries (Continued)Unit: NT$
Education
1989 13,491 32,564 39,248 30,359 26,038 18,896 … 25,147 16,153 14,737 1990 15,448 36,866 39,061 33,984 30,982 22,457 … 29,158 17,888 16,902 1991 17,049 41,579 41,031 39,214 33,345 23,702 … 32,366 18,235 18,631 1992 18,209 44,519 46,380 39,911 37,285 25,708 … 35,670 20,463 21,485 1993 18,950 48,782 50,034 42,402 39,900 27,785 … 37,176 21,124 22,150 1994 20,373 52,229 56,462 42,056 39,730 29,018 … 39,633 22,133 23,205 1995 22,317 54,649 54,658 40,614 41,436 32,927 … 41,623 22,116 25,077 1996 22,198 55,873 56,887 40,445 41,642 33,649 … 44,797 23,532 25,846 1997 23,528 58,831 60,597 40,666 44,042 35,394 … 47,378 24,894 26,929 1998 24,040 61,421 59,546 41,719 45,393 34,814 … 48,920 26,256 29,530 1999 25,117 61,260 60,332 44,429 47,349 34,920 … 51,020 26,524 30,825 2000 26,060 62,759 60,872 43,716 48,628 35,277 … 53,397 27,592 31,335 2001 25,973 62,100 62,657 42,277 48,812 35,579 … 54,484 28,338 29,927 2002 25,687 59,239 65,703 40,896 45,653 34,605 … 53,841 27,889 29,236 2003 24,951 60,292 64,645 40,431 47,411 32,871 … 55,702 27,666 28,947 2004 24,812 59,417 66,671 39,781 49,292 32,707 … 55,341 29,662 29,421 2005 25,121 61,381 65,113 38,819 50,871 32,815 … 55,604 29,898 30,384 2006 24,960 61,134 69,054 38,313 51,721 32,622 … 55,430 31,303 30,203 2007 25,476 63,731 75,824 37,874 53,144 33,102 … 56,613 31,414 29,925 2008 26,699 63,777 71,520 40,340 54,169 32,916 … 58,134 31,931 29,314 2009 27,106 61,888 67,713 39,032 49,426 31,249 22,197 57,858 31,242 29,738 2010 27,788 64,266 74,219 42,093 52,141 32,064 22,459 57,897 32,687 30,832 2011 29,715 66,291 76,920 43,783 54,097 32,855 22,416 59,900 33,236 32,526 2012 30,072 66,962 77,957 41,546 54,950 33,436 22,773 60,261 35,446 32,601 2013 30,459 65,547 77,864 42,165 53,835 33,662 22,923 59,908 36,070 33,020 2014 31,676 66,386 83,085 44,786 55,491 34,689 24,226 61,298 35,829 34,491 2015 32,508 66,595 84,742 44,075 56,132 35,451 24,304 64,100 36,184 33,901 2016 32,498 67,749 85,452 42,897 56,427 35,855 24,876 65,236 36,821 33,497 2017 33,406 69,196 86,425 44,893 57,585 36,178 25,288 65,681 37,535 33,860 2018 34,077 69,909 89,215 47,658 58,773 37,133 26,033 67,014 38,742 34,966
Informationand
Communi-cations
Finance andInsurance
Arts,Entertain-ment and
Recreation
Real Estate OtherServices
Professional,Scientific &TechnicalServices
SupportServices
HumanHealth
ServicesPeriod
Accommo-dation and
Food Services
44

Base: 2016=100
1989 43.13 40.94 39.13 39.52 45.11 53.27 50.03 47.13 46.36 44.48 1990 49.35 46.63 47.85 44.78 50.25 65.37 57.70 53.79 54.45 50.20 1991 54.55 52.13 51.73 49.69 61.82 69.22 65.81 58.38 58.30 56.91 1992 59.75 57.42 57.62 54.80 64.52 71.77 71.96 63.22 62.08 61.42 1993 64.32 61.75 59.31 58.63 68.71 78.51 78.52 67.87 67.37 66.18 1994 68.28 65.43 61.14 62.55 73.40 88.08 80.25 71.99 70.77 69.87 1995 71.76 68.73 64.29 66.10 76.16 90.41 82.35 75.27 75.31 74.72 1997 78.02 74.36 69.54 72.02 85.16 93.21 86.44 82.02 80.29 81.30 1998 80.39 76.53 72.32 74.12 93.37 96.51 88.44 84.50 83.13 83.89 1999 82.78 78.95 74.75 76.78 96.62 103.50 88.87 86.80 85.33 85.79 2000 84.91 81.20 77.70 79.17 97.20 102.60 90.80 88.77 87.20 87.46 2001 85.15 80.18 79.51 78.15 103.12 106.45 88.11 90.08 87.72 91.40 2002 84.30 79.84 80.84 78.20 98.96 101.62 86.01 88.69 86.34 88.53 2003 85.39 81.92 86.10 80.46 100.78 101.71 86.87 88.78 87.35 87.43 2004 86.64 83.96 83.55 82.72 100.08 99.22 88.51 89.25 87.81 89.23 2005 87.61 86.15 86.01 85.16 96.54 110.25 89.75 89.04 87.21 92.34 2006 88.28 87.38 96.25 86.25 102.94 109.34 91.43 89.18 86.85 92.01 2007 90.15 89.11 91.92 87.95 104.30 102.74 94.10 91.13 87.03 93.44 2008 90.16 89.17 92.62 88.07 94.68 103.02 95.13 91.08 88.12 94.38 2009 85.86 82.91 89.22 80.40 101.94 101.91 95.40 88.21 88.39 91.19 2010 90.62 89.33 94.81 87.78 102.19 104.37 97.10 91.70 92.11 93.29 2011 93.29 92.13 97.39 90.73 100.98 106.04 99.71 94.27 93.86 95.80 2012 93.59 93.12 95.18 92.02 98.33 101.06 99.64 94.00 92.22 95.86 2013 93.72 93.38 99.00 92.45 94.16 102.15 99.30 94.02 93.17 95.21 2014 97.09 96.40 97.60 95.64 99.64 103.94 100.96 97.64 97.87 95.72 2015 99.51 99.42 103.20 99.09 102.27 102.64 101.18 99.59 100.17 98.17 2016 100.00 100.00 100.00 100.00 100.00 100.00 100.00 100.00 100.00 100.00 2017 102.46 102.58 99.41 103.08 100.29 102.48 99.22 102.38 104.22 101.47 2018 106.38 106.89 101.56 107.70 101.70 104.87 101.88 105.99 109.82 104.67
Source: See Table 2-8a.
PeriodIndustry
&Services
Industry Mining &Quarrying
2-13a. Indices of Average Earnings of Employees of Nonagricultural Industries
Services TradeManu-facturing
Transport &Storage
Electricity &Gas Supply
WaterSupply &
RemediationServices
Cons-truction
45

Base: 2016=100
1989 41.51 48.07 45.93 70.77 46.14 52.70 38.55 43.87 43.99 1990 47.54 54.42 45.71 79.22 54.91 62.63 44.70 48.58 50.46 1991 52.46 61.37 48.02 91.41 59.09 66.11 49.61 49.52 55.62 1992 56.03 65.71 54.28 93.04 66.08 71.70 54.68 55.57 64.14 1993 58.31 72.00 58.55 98.85 70.71 77.49 56.99 57.37 66.13 1994 62.69 77.09 66.07 98.04 70.41 80.93 60.75 60.11 69.27 1995 68.67 80.66 63.96 94.68 73.43 91.83 63.80 60.06 74.86 1996 68.31 82.47 66.57 94.28 73.80 93.85 68.67 63.91 77.16 1997 72.40 86.84 70.91 94.80 78.05 98.71 72.63 67.61 80.39 1998 73.97 90.66 69.68 97.25 80.45 97.10 74.99 71.31 88.16 1999 77.29 90.42 70.60 103.57 83.91 97.39 78.21 72.03 92.02 2000 80.19 92.63 71.24 101.91 86.18 98.39 81.85 74.94 93.55 2001 79.92 91.66 73.32 98.55 86.50 99.23 83.52 76.96 89.34 2002 79.04 87.44 76.89 95.34 80.91 96.51 82.53 75.74 87.28 2003 76.78 88.99 75.65 94.25 84.02 91.68 85.39 75.14 86.42 2004 76.35 87.70 78.02 92.74 87.36 91.22 84.83 80.56 87.83 2005 77.30 90.60 76.20 90.49 90.15 91.52 85.24 81.20 90.71 2006 76.80 90.24 80.81 89.31 91.66 90.98 84.97 85.01 90.17 2007 78.39 94.07 88.73 88.29 94.18 92.32 86.78 85.32 89.34 2008 82.16 94.14 83.70 94.04 96.00 91.80 89.11 86.72 87.51 2009 83.41 91.35 79.24 90.99 87.59 87.15 88.69 84.85 88.78 2010 85.51 94.86 86.85 98.13 92.40 89.43 88.75 88.77 92.04 2011 91.44 97.85 90.02 102.07 95.87 91.63 91.82 90.26 97.10 2012 92.53 98.84 91.23 96.85 97.38 93.25 92.37 96.27 97.33 2013 93.73 96.75 91.12 98.29 95.41 93.88 91.83 97.96 98.58 2014 97.47 97.99 97.23 104.40 98.34 96.75 93.96 97.31 102.97 2015 100.03 98.30 99.17 102.75 99.48 98.87 98.26 98.27 101.21 2016 100.00 100.00 100.00 100.00 100.00 100.00 100.00 100.00 100.00 2017 102.79 102.14 101.14 104.65 102.05 100.90 100.68 101.94 101.08 2018 104.86 103.19 104.40 111.10 104.16 103.56 102.73 105.22 104.39
OtherServices
Professional,Scientific and
TechnicalServices
SupportServices
Human HealthServices
2-13b. Indices of Average Earnings of Employees of Nonagricultural Industries (Continued)
Period
Accommo-dation and
FoodServices
Informationand
Communi-cations
Finance andInsurance
Arts,Entertain-ment and
Recreation
Real Estate
46

2-14a. Labor Productivity in IndustryBase: 2016=100 A. Indexes
Period Industry Mining &Quarrying
Manufac-turing Food Textile
Mills
WearingApparel &Clothing
Accessories
Pulp Paper& PaperProducts
Printing &Reproductionof Recorded
Media
Petroleum& Coal
Products
ChemicalMaterials
ChemicalProducts
2008 75.98 90.32 74.24 111.20 97.25 118.42 91.27 97.18 94.60 91.44 82.442009 76.86 89.56 75.06 109.12 93.02 98.06 86.67 93.13 97.87 99.06 80.542010 89.66 112.58 88.89 109.08 103.31 110.38 86.95 97.46 88.15 110.09 93.622011 90.70 109.66 90.01 105.91 94.41 98.88 88.72 97.79 83.83 105.14 91.772012 90.58 106.60 89.98 101.33 94.34 97.52 87.38 93.04 87.49 100.63 90.772013 92.66 105.55 92.20 99.23 99.04 100.77 88.46 91.70 92.27 100.64 95.572014 95.93 107.77 95.82 97.99 99.89 103.93 92.01 95.03 92.30 98.99 97.362015 94.96 104.00 95.00 97.04 100.72 100.29 93.32 95.01 95.87 97.93 100.74 2016 100.00 100.00 100.00 100.00 100.00 100.00 100.00 100.00 100.00 100.00 100.00 2017 103.25 102.90 103.53 97.56 97.69 92.00 100.17 94.87 94.85 102.43 104.86 2018 105.37 103.55 105.97 95.67 96.12 81.13 101.39 96.27 97.58 99.08 104.75
B. Percentage Change from Previous Year (%)
Period Industry Mining &Quarrying
Manufac-turing Food Textile
Mills
WearingApparel &Clothing
Accessories
Pulp Paper& PaperProducts
Printing &Reproductionof Recorded
Media
Petroleum& Coal
Products
ChemicalMaterials
ChemicalProducts
2008 -0.18 -2.21 -0.12 -3.47 -3.19 -15.66 1.07 -0.55 -4.29 -6.61 -4.722009 1.16 -0.84 1.10 -1.87 -4.35 -17.19 -5.04 -4.17 3.46 8.33 -2.302010 16.65 25.70 18.43 -0.04 11.06 12.56 0.32 4.65 -9.93 11.13 16.242011 1.16 -2.59 1.26 -2.91 -8.61 -10.42 2.04 0.34 -4.90 -4.50 -1.982012 -0.13 -2.79 -0.03 -4.32 -0.07 -1.38 -1.51 -4.86 4.37 -4.29 -1.092013 2.30 -0.98 2.47 -2.07 4.98 3.33 1.24 -1.44 5.46 0.01 5.292014 3.53 2.10 3.93 -1.25 0.86 3.14 4.01 3.63 0.03 -1.64 1.872015 -1.01 -3.50 -0.86 -0.97 0.83 -3.50 1.42 -0.02 3.87 -1.07 3.472016 5.31 -3.85 5.26 3.05 -0.71 -0.29 7.16 5.25 4.31 2.11 -0.732017 3.25 2.90 3.53 -2.44 -2.31 -8.00 0.17 -5.13 -5.15 2.43 4.862018 2.05 0.63 2.36 -1.94 -1.61 -11.82 1.22 1.48 2.88 -3.27 -0.10
Source: See Table 2-8a.
47

2-14b. Labor Productivity in Industry (Continued)
Period RubberProducts
PlasticProducts
Non-metallicMineralProducts
BasicMetals
FabricatedMetal
Products
ElectronicParts &
Compon-ents
Computer,Electronic &
OpticalProducts
ElectronicEquipment
Machinery&
Equipment
Electricity& GasSupply
WaterSupply &Remedia-
tionServices
2008 109.93 88.63 99.04 89.34 93.74 61.18 61.06 92.76 99.94 103.11 97.382009 102.63 80.83 92.81 84.80 83.76 66.51 57.80 81.66 86.14 98.68 93.662010 116.73 91.19 97.83 97.11 93.04 82.63 80.18 88.64 113.00 102.10 95.952011 115.64 94.41 101.07 100.23 99.31 81.45 105.43 85.25 115.20 105.09 99.112012 108.07 95.72 97.38 94.81 100.17 85.39 87.23 87.50 107.79 100.24 96.942013 104.14 96.06 100.84 99.66 100.17 89.77 90.08 86.39 101.28 101.06 99.022014 102.90 99.56 106.04 100.17 101.73 94.37 96.17 88.86 105.58 101.47 99.452015 104.80 99.59 103.27 93.82 96.70 92.86 99.27 93.47 103.20 96.79 97.712016 100.00 100.00 100.00 100.00 100.00 100.00 100.00 100.00 100.00 100.00 100.002017 99.83 100.13 99.15 101.77 99.57 105.19 102.42 97.07 107.03 98.40 100.022018 95.06 101.76 102.32 103.08 98.50 108.40 114.35 97.75 112.74 96.52 95.09
B. Percentage Change from Previous Year (%)
Period RubberProducts
PlasticProducts
Non-metallicMineralProducts
BasicMetals
FabricatedMetal
Products
ElectronicParts &
Compon-ents
Computer,Electronic &
OpticalProducts
ElectronicEquipment
Machinery& Equip-
ment
Electricity& GasSupply
WaterSupply &Remedia-
tionServices
2008 1.98 -5.61 -2.95 -7.91 -3.53 7.60 7.10 -6.72 -6.41 -3.11 -2.012009 -6.64 -8.80 -6.29 -5.08 -10.65 8.71 -5.34 -11.97 -13.81 -4.30 -3.822010 13.74 12.82 5.41 14.52 11.08 24.24 38.72 8.55 31.18 3.47 2.452011 -0.93 3.53 3.31 3.21 6.74 -1.43 31.49 -3.82 1.95 2.93 3.292012 -6.55 1.39 -3.65 -5.41 0.87 4.84 -17.26 2.64 -6.43 -4.62 -2.192013 -3.64 0.36 3.55 5.12 0.00 5.13 3.27 -1.27 -6.04 0.82 2.152014 -1.19 3.64 5.16 0.51 1.56 5.12 6.76 2.86 4.25 0.41 0.432015 1.85 0.03 -2.61 -6.34 -4.94 -1.60 3.22 5.19 -2.25 -4.61 -1.752016 -4.58 0.41 -3.17 6.59 3.41 7.69 0.74 6.99 -3.10 3.32 2.342017 -0.17 0.13 -0.85 1.77 -0.43 5.19 2.42 -2.93 7.03 -1.60 0.022018 -4.78 1.63 3.20 1.29 -1.07 3.05 11.65 0.70 5.33 -1.91 -4.93
Base: 2016=100 A. Indexes
48
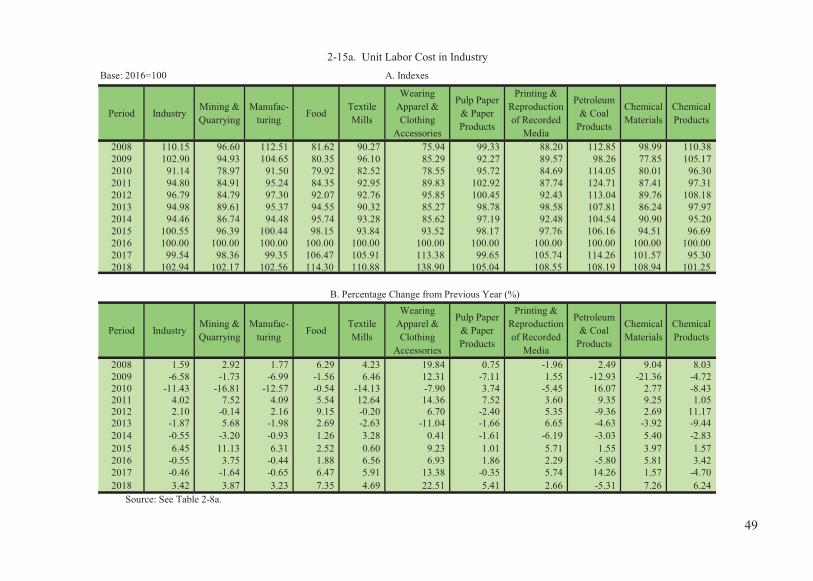
2-15a. Unit Labor Cost in IndustryBase: 2016=100 A. Indexes
Period IndustryMining &Quarrying
Manufac-turing Food
TextileMills
WearingApparel &Clothing
Accessories
Pulp Paper& PaperProducts
Printing &Reproductionof Recorded
Media
Petroleum& Coal
Products
ChemicalMaterials
ChemicalProducts
2008 110.15 96.60 112.51 81.62 90.27 75.94 99.33 88.20 112.85 98.99 110.382009 102.90 94.93 104.65 80.35 96.10 85.29 92.27 89.57 98.26 77.85 105.172010 91.14 78.97 91.50 79.92 82.52 78.55 95.72 84.69 114.05 80.01 96.302011 94.80 84.91 95.24 84.35 92.95 89.83 102.92 87.74 124.71 87.41 97.312012 96.79 84.79 97.30 92.07 92.76 95.85 100.45 92.43 113.04 89.76 108.182013 94.98 89.61 95.37 94.55 90.32 85.27 98.78 98.58 107.81 86.24 97.972014 94.46 86.74 94.48 95.74 93.28 85.62 97.19 92.48 104.54 90.90 95.202015 100.55 96.39 100.44 98.15 93.84 93.52 98.17 97.76 106.16 94.51 96.69 2016 100.00 100.00 100.00 100.00 100.00 100.00 100.00 100.00 100.00 100.00 100.00 2017 99.54 98.36 99.35 106.47 105.91 113.38 99.65 105.74 114.26 101.57 95.30 2018 102.94 102.17 102.56 114.30 110.88 138.90 105.04 108.55 108.19 108.94 101.25
B. Percentage Change from Previous Year (%)
Period IndustryMining &Quarrying
Manufac-turing Food
TextileMills
WearingApparel &Clothing
Accessories
Pulp Paper& PaperProducts
Printing &Reproductionof Recorded
Media
Petroleum& Coal
Products
ChemicalMaterials
ChemicalProducts
2008 1.59 2.92 1.77 6.29 4.23 19.84 0.75 -1.96 2.49 9.04 8.032009 -6.58 -1.73 -6.99 -1.56 6.46 12.31 -7.11 1.55 -12.93 -21.36 -4.722010 -11.43 -16.81 -12.57 -0.54 -14.13 -7.90 3.74 -5.45 16.07 2.77 -8.432011 4.02 7.52 4.09 5.54 12.64 14.36 7.52 3.60 9.35 9.25 1.052012 2.10 -0.14 2.16 9.15 -0.20 6.70 -2.40 5.35 -9.36 2.69 11.172013 -1.87 5.68 -1.98 2.69 -2.63 -11.04 -1.66 6.65 -4.63 -3.92 -9.442014 -0.55 -3.20 -0.93 1.26 3.28 0.41 -1.61 -6.19 -3.03 5.40 -2.832015 6.45 11.13 6.31 2.52 0.60 9.23 1.01 5.71 1.55 3.97 1.572016 -0.55 3.75 -0.44 1.88 6.56 6.93 1.86 2.29 -5.80 5.81 3.422017 -0.46 -1.64 -0.65 6.47 5.91 13.38 -0.35 5.74 14.26 1.57 -4.702018 3.42 3.87 3.23 7.35 4.69 22.51 5.41 2.66 -5.31 7.26 6.24
Source: See Table 2-8a.
49
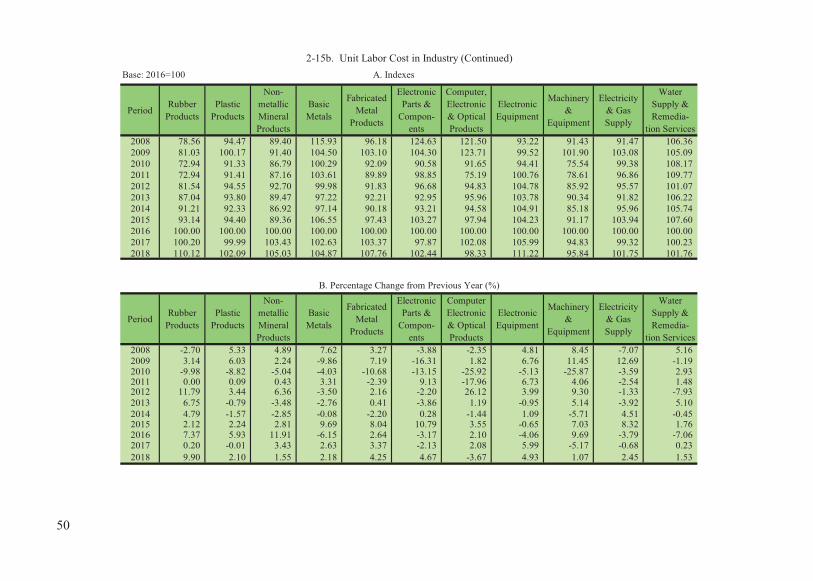
PeriodRubber
ProductsPlastic
Products
Non-metallicMineralProducts
BasicMetals
FabricatedMetal
Products
ElectronicParts &
Compon-ents
Computer,Electronic& OpticalProducts
ElectronicEquipment
Machinery&
Equipment
Electricity& GasSupply
WaterSupply &Remedia-
tion Services2008 78.56 94.47 89.40 115.93 96.18 124.63 121.50 93.22 91.43 91.47 106.362009 81.03 100.17 91.40 104.50 103.10 104.30 123.71 99.52 101.90 103.08 105.092010 72.94 91.33 86.79 100.29 92.09 90.58 91.65 94.41 75.54 99.38 108.172011 72.94 91.41 87.16 103.61 89.89 98.85 75.19 100.76 78.61 96.86 109.772012 81.54 94.55 92.70 99.98 91.83 96.68 94.83 104.78 85.92 95.57 101.072013 87.04 93.80 89.47 97.22 92.21 92.95 95.96 103.78 90.34 91.82 106.222014 91.21 92.33 86.92 97.14 90.18 93.21 94.58 104.91 85.18 95.96 105.742015 93.14 94.40 89.36 106.55 97.43 103.27 97.94 104.23 91.17 103.94 107.602016 100.00 100.00 100.00 100.00 100.00 100.00 100.00 100.00 100.00 100.00 100.002017 100.20 99.99 103.43 102.63 103.37 97.87 102.08 105.99 94.83 99.32 100.232018 110.12 102.09 105.03 104.87 107.76 102.44 98.33 111.22 95.84 101.75 101.76
PeriodRubber
ProductsPlastic
Products
Non-metallicMineralProducts
BasicMetals
FabricatedMetal
Products
ElectronicParts &
Compon-ents
ComputerElectronic& OpticalProducts
ElectronicEquipment
Machinery&
Equipment
Electricity& GasSupply
WaterSupply &Remedia-
tion Services2008 -2.70 5.33 4.89 7.62 3.27 -3.88 -2.35 4.81 8.45 -7.07 5.162009 3.14 6.03 2.24 -9.86 7.19 -16.31 1.82 6.76 11.45 12.69 -1.192010 -9.98 -8.82 -5.04 -4.03 -10.68 -13.15 -25.92 -5.13 -25.87 -3.59 2.932011 0.00 0.09 0.43 3.31 -2.39 9.13 -17.96 6.73 4.06 -2.54 1.482012 11.79 3.44 6.36 -3.50 2.16 -2.20 26.12 3.99 9.30 -1.33 -7.932013 6.75 -0.79 -3.48 -2.76 0.41 -3.86 1.19 -0.95 5.14 -3.92 5.102014 4.79 -1.57 -2.85 -0.08 -2.20 0.28 -1.44 1.09 -5.71 4.51 -0.452015 2.12 2.24 2.81 9.69 8.04 10.79 3.55 -0.65 7.03 8.32 1.762016 7.37 5.93 11.91 -6.15 2.64 -3.17 2.10 -4.06 9.69 -3.79 -7.062017 0.20 -0.01 3.43 2.63 3.37 -2.13 2.08 5.99 -5.17 -0.68 0.232018 9.90 2.10 1.55 2.18 4.25 4.67 -3.67 4.93 1.07 2.45 1.53
B. Percentage Change from Previous Year (%)
Base: 2016=100 A. Indexes
2-15b. Unit Labor Cost in Industry (Continued)
50

3. NATIONAL INCOME


Nominal Real Nominal Real Growth Growth Growth Growth
chained (2011) dollars Rate Rate chained (2011) dollars Rate Rate (%) (%) (%) (%)
1952 17,275 163,081 40.1 12.0 17,271 174,246 40.2 12.51955 30,163 210,886 19.2 7.7 30,160 223,275 19.2 8.71960 63,398 303,175 20.7 7.2 63,371 319,871 21.0 7.31965 114,771 493,331 10.7 11.9 114,577 538,772 10.5 8.51970 231,427 805,982 15.3 11.5 231,015 943,586 15.2 12.81975 601,827 1,280,516 7.4 6.2 598,483 1,474,993 6.9 5.91980 1,522,625 2,176,864 24.9 8.0 1,520,519 2,493,982 24.6 4.91985 2,536,012 3,073,105 4.8 4.8 2,583,166 3,536,894 5.5 4.41990 4,480,288 4,793,163 11.1 5.7 4,597,595 5,970,280 11.2 5.91995 7,396,650 6,877,169 9.0 6.5 7,507,569 8,466,268 8.9 5.91996 8,036,590 7,301,854 8.7 6.2 8,146,092 9,060,843 8.5 7.01997 8,717,241 7,748,223 8.5 6.1 8,806,852 9,757,483 8.1 7.71998 9,381,141 8,074,502 7.6 4.2 9,449,692 10,319,741 7.3 5.81999 9,815,595 8,616,866 4.6 6.7 9,906,113 10,817,030 4.8 4.82000 10,351,260 9,170,116 5.5 6.4 10,490,818 11,538,800 5.9 6.72001 10,158,209 9,054,580 -1.9 -1.3 10,350,233 11,180,872 -1.3 -3.12002 10,680,883 9,559,334 5.2 5.6 10,923,385 11,784,475 5.5 5.42003 10,965,866 9,953,235 2.7 4.1 11,294,739 12,226,885 3.4 3.82004 11,649,645 10,600,793 6.2 6.5 12,021,744 12,900,914 6.4 5.52005 12,092,254 11,174,918 3.8 5.4 12,383,120 13,238,085 3.0 2.62006 12,640,803 11,803,335 4.5 5.6 12,952,502 13,669,529 4.6 3.32007 13,407,062 12,572,550 6.1 6.5 13,739,828 14,186,226 6.1 3.82008 13,150,950 12,661,079 -1.9 0.7 13,465,596 13,489,512 -2.0 -4.92009 12,961,656 12,462,729 -1.4 -1.6 13,375,650 13,517,208 -0.7 0.22010 14,119,213 13,787,642 8.9 10.6 14,548,852 14,718,522 8.8 8.92011 14,312,200 14,312,200 1.4 3.8 14,700,572 14,700,572 1.0 -0.12012 14,686,917 14,607,569 2.6 2.1 15,141,108 14,985,094 3.0 1.92013 15,230,739 14,929,292 3.7 2.2 15,654,588 15,524,725 3.4 3.62014 16,111,867 15,529,606 5.8 4.0 16,582,405 16,349,966 5.9 5.32015 16,770,671 15,654,835 4.1 0.8 17,301,397 17,282,691 4.3 5.72016 17,176,300 15,891,514 2.4 1.5 17,705,994 17,611,917 2.3 1.92017 17,501,181 16,380,812 1.9 3.1 17,965,345 17,896,956 1.5 1.62018 17,793,139 16,812,286 1.7 2.6 18,129,011 17,870,724 0.9 -0.2
Sources: National Statistics, R.O.C. online database(http://statdb.dgbas.gov.tw/pxweb/Dialog/NI.asp) ,retrived May 2019.
3-1. Gross Domestic Product and Gross National Income
Period at currentprices
Amount (NT$ million)Gross Domestic Product (GDP) Gross National Income (GNI)
Amount (NT$ million)
at currentprices
51

Unit: %Terminal
Year 1951 1982 1983 1984 1985 1986 1987 1988 1989 1990 1991 1992 1993 1994 1995 1996 1997 19981952 12.01983 9.5 9.01984 9.5 9.5 10.01985 9.4 7.9 7.4 4.81986 9.4 8.8 8.8 8.1 11.51987 9.5 9.6 9.7 9.6 12.1 12.71988 9.5 9.3 9.4 9.2 10.7 10.3 8.01989 9.5 9.2 9.3 9.1 10.2 9.8 8.4 8.71990 9.4 8.8 8.8 8.5 9.3 8.7 7.5 7.2 5.61991 9.3 8.7 8.7 8.5 9.1 8.7 7.7 7.6 7.0 8.41992 9.3 8.7 8.7 8.5 9.0 8.6 7.8 7.8 7.4 8.3 8.31993 9.3 8.5 8.5 8.3 8.7 8.3 7.6 7.6 7.3 7.8 7.5 6.81994 9.2 8.4 8.4 8.2 8.6 8.2 7.6 7.6 7.3 7.7 7.5 7.1 7.51995 9.2 8.3 8.2 8.1 8.4 8.0 7.5 7.4 7.2 7.5 7.3 6.9 7.0 6.51996 9.1 8.1 8.1 7.9 8.2 7.9 7.3 7.2 7.0 7.3 7.1 6.7 6.7 6.3 6.21997 9.0 8.0 7.9 7.8 8.0 7.7 7.2 7.1 6.9 7.1 6.9 6.6 6.6 6.3 6.1 6.11998 8.9 7.8 7.7 7.5 7.7 7.4 6.9 6.8 6.6 6.7 6.5 6.2 6.1 5.7 5.5 5.2 4.21999 8.9 7.7 7.6 7.5 7.6 7.4 6.9 6.8 6.6 6.7 6.5 6.3 6.2 5.9 5.8 5.7 5.5 6.72000 8.8 7.6 7.5 7.4 7.6 7.3 6.9 6.8 6.6 6.7 6.5 6.3 6.2 6.0 5.9 5.9 5.8 6.62001 8.6 7.1 7.0 6.9 7.0 6.7 6.3 6.1 5.9 6.0 5.7 5.4 5.3 4.9 4.7 4.4 4.0 3.92002 8.6 7.1 7.0 6.8 6.9 6.6 6.2 6.1 5.9 5.9 5.7 5.4 5.3 5.0 4.8 4.6 4.3 4.32003 8.5 6.9 6.8 6.6 6.7 6.5 6.1 6.0 5.8 5.8 5.6 5.3 5.2 4.9 4.7 4.5 4.3 4.32004 8.4 6.9 6.8 6.6 6.7 6.5 6.1 6.0 5.8 5.8 5.6 5.4 5.3 5.1 4.9 4.8 4.6 4.62005 8.4 6.8 6.7 6.6 6.7 6.4 6.1 6.0 5.8 5.8 5.6 5.4 5.3 5.1 5.0 4.8 4.7 4.82006 8.3 6.8 6.7 6.5 6.6 6.4 6.1 5.9 5.8 5.8 5.6 5.4 5.3 5.2 5.0 4.9 4.8 4.92007 8.3 6.8 6.7 6.5 6.6 6.4 6.1 6.0 5.8 5.8 5.7 5.5 5.4 5.3 5.2 5.1 5.0 5.02008 8.1 6.5 6.4 6.3 6.3 6.1 5.8 5.7 5.5 5.5 5.4 5.2 5.1 4.9 4.8 4.7 4.6 4.62009 8.0 6.2 6.1 6.0 6.0 5.8 5.5 5.3 5.2 5.2 5.0 4.8 4.7 4.5 4.3 4.2 4.0 4.02010 8.0 6.4 6.3 6.1 6.2 6.0 5.7 5.6 5.4 5.4 5.3 5.1 5.0 4.9 4.7 4.6 4.5 4.62011 7.9 6.3 6.2 6.0 6.1 5.9 5.6 5.5 5.4 5.3 5.2 5.0 4.9 4.8 4.7 4.6 4.5 4.52012 7.8 6.1 6.0 5.9 5.9 5.7 5.5 5.4 5.2 5.2 5.0 4.9 4.8 4.6 4.5 4.4 4.3 4.32013 7.8 6.0 5.9 5.8 5.8 5.6 5.3 5.2 5.1 5.1 4.9 4.8 4.7 4.5 4.4 4.3 4.2 4.22014 7.7 5.9 5.9 5.7 5.7 5.5 5.3 5.2 5.0 5.0 4.9 4.7 4.6 4.5 4.4 4.3 4.2 4.22015 7.6 5.8 5.7 5.6 5.6 5.4 5.1 5.0 4.9 4.8 4.7 4.6 4.4 4.3 4.2 4.1 4.0 4.02016 7.5 5.7 5.6 5.4 5.4 5.2 5.0 4.9 4.8 4.7 4.6 4.4 4.3 4.2 4.1 4.0 3.9 3.82017 7.4 5.6 5.5 5.4 5.4 5.2 4.9 4.8 4.7 4.7 4.5 4.4 4.3 4.1 4.0 3.9 3.8 3.82018 7.3 5.5 5.4 5.3 5.3 5.1 4.9 4.8 4.6 4.6 4.4 4.3 4.2 4.1 4.0 3.9 3.8 3.7
Initial Year
3-2a. Average Annual Growth Rate of Real GDP
Source: See Table 3-1.52

Unit: %Terminal
Year 1999 2000 2001 2002 2003 2004 2005 2006 2007 2008 2009 2010 2011 2012 2013 2014 2015 2016 20171952198319841985198619871988198919901991199219931994199519961997199819992000 6.42001 2.5 -1.32002 3.5 2.1 5.62003 3.7 2.8 4.8 4.12004 4.2 3.7 5.4 5.3 6.52005 4.4 4.0 5.4 5.3 6.0 5.42006 4.6 4.3 5.4 5.4 5.8 5.5 5.62007 4.8 4.6 5.6 5.6 6.0 5.9 6.1 6.52008 4.4 4.1 4.9 4.8 4.9 4.5 4.2 3.6 0.72009 3.8 3.5 4.1 3.9 3.8 3.3 2.8 1.8 -0.4 -1.62010 4.4 4.2 4.8 4.7 4.8 4.5 4.3 4.0 3.1 4.4 10.62011 4.3 4.1 4.7 4.6 4.6 4.4 4.2 3.9 3.3 4.2 7.2 3.82012 4.1 4.0 4.4 4.3 4.4 4.1 3.9 3.6 3.0 3.6 5.4 2.9 2.12013 4.0 3.8 4.3 4.1 4.1 3.9 3.7 3.4 2.9 3.4 4.6 2.7 2.1 2.22014 4.0 3.8 4.2 4.1 4.1 3.9 3.7 3.5 3.1 3.5 4.5 3.0 2.8 3.1 4.02015 3.8 3.6 4.0 3.9 3.8 3.6 3.4 3.2 2.8 3.1 3.9 2.6 2.3 2.3 2.4 0.82016 3.7 3.5 3.8 3.7 3.7 3.4 3.3 3.0 2.6 2.9 3.5 2.4 2.1 2.1 2.1 1.2 1.52017 3.6 3.5 3.8 3.7 3.6 3.4 3.2 3.0 2.7 2.9 3.5 2.5 2.3 2.3 2.3 1.8 2.3 3.12018 3.6 3.4 3.7 3.6 3.6 3.3 3.2 3.0 2.7 2.9 3.4 2.5 2.3 2.4 2.4 2.0 2.4 2.9 2.6
3-2b. Average Annual Growth Rate of Real GDP (Continued)
Initial Year
53

1951 1982 1983 1984 1985 1986 1987 1988 1989 1990 1991 1992 1993 1994 1995 1996 1997 19981952 12.5 1983 9.8 9.5 1984 9.8 10.4 11.3 1985 9.6 8.4 7.8 4.4 1986 9.8 10.3 10.5 10.2 16.2 1987 9.9 11.1 11.5 11.5 15.3 14.3 1988 9.9 10.9 11.1 11.1 13.4 12.1 9.9 1989 9.9 10.6 10.8 10.7 12.4 11.1 9.5 9.2 1990 9.8 10.0 10.1 9.9 11.0 9.8 8.3 7.5 5.9 1991 9.8 10.0 10.1 9.9 10.8 9.8 8.7 8.3 7.9 9.9 1992 9.8 9.8 9.8 9.6 10.4 9.4 8.5 8.1 7.8 8.7 7.5 1993 9.7 9.5 9.5 9.3 9.9 9.0 8.1 7.8 7.5 8.0 7.0 6.5 1994 9.6 9.2 9.2 9.0 9.5 8.7 7.9 7.6 7.2 7.6 6.8 6.4 6.4 1995 9.5 8.9 8.9 8.7 9.1 8.4 7.6 7.3 7.0 7.2 6.6 6.3 6.1 5.9 1996 9.5 8.8 8.8 8.5 8.9 8.2 7.6 7.3 7.0 7.2 6.7 6.4 6.4 6.5 7.0 1997 9.4 8.7 8.7 8.5 8.8 8.2 7.6 7.3 7.1 7.3 6.8 6.7 6.7 6.9 7.4 7.7 1998 9.3 8.5 8.5 8.3 8.6 8.0 7.4 7.2 7.0 7.1 6.7 6.5 6.5 6.6 6.8 6.7 5.8 1999 9.2 8.3 8.2 8.0 8.3 7.7 7.2 7.0 6.7 6.8 6.4 6.3 6.3 6.2 6.3 6.1 5.3 4.8 2000 9.2 8.2 8.2 8.0 8.2 7.7 7.2 6.9 6.7 6.8 6.5 6.3 6.3 6.3 6.4 6.2 5.7 5.7 2001 8.9 7.6 7.5 7.3 7.5 6.9 6.4 6.1 5.9 5.9 5.5 5.2 5.1 4.9 4.7 4.3 3.5 2.7 2002 8.9 7.5 7.4 7.2 7.3 6.8 6.3 6.1 5.8 5.8 5.5 5.3 5.1 5.0 4.8 4.5 3.8 3.4 2003 8.8 7.3 7.2 7.0 7.1 6.6 6.2 5.9 5.7 5.7 5.3 5.1 5.0 4.8 4.7 4.4 3.8 3.4 2004 8.7 7.2 7.1 6.9 7.0 6.6 6.1 5.9 5.7 5.7 5.3 5.2 5.0 4.9 4.8 4.5 4.1 3.8 2005 8.6 7.0 6.9 6.7 6.8 6.3 5.9 5.7 5.5 5.5 5.1 5.0 4.8 4.7 4.6 4.3 3.9 3.6 2006 8.5 6.9 6.7 6.5 6.6 6.2 5.8 5.6 5.3 5.3 5.0 4.8 4.7 4.6 4.5 4.2 3.8 3.6 2007 8.4 6.7 6.6 6.4 6.5 6.1 5.7 5.5 5.3 5.2 4.9 4.8 4.6 4.5 4.4 4.2 3.8 3.6 2008 8.2 6.3 6.1 5.9 6.0 5.5 5.1 4.9 4.7 4.6 4.3 4.1 4.0 3.8 3.6 3.4 3.0 2.7 2009 8.0 6.0 5.9 5.7 5.7 5.3 4.9 4.7 4.5 4.4 4.1 3.9 3.7 3.6 3.4 3.1 2.8 2.5 2010 8.0 6.1 6.0 5.8 5.9 5.5 5.1 4.9 4.7 4.6 4.3 4.2 4.0 3.9 3.8 3.5 3.2 3.0 2011 7.9 5.9 5.8 5.6 5.6 5.2 4.9 4.7 4.5 4.4 4.1 3.9 3.8 3.6 3.5 3.3 3.0 2.8 2012 7.8 5.8 5.7 5.5 5.5 5.1 4.7 4.5 4.3 4.3 4.0 3.8 3.7 3.6 3.4 3.2 2.9 2.72013 7.7 5.7 5.6 5.4 5.4 5.0 4.7 4.5 4.3 4.2 4.0 3.8 3.7 3.6 3.4 3.2 2.9 2.82014 7.7 5.7 5.6 5.4 5.4 5.1 4.7 4.5 4.4 4.3 4.0 3.9 3.8 3.6 3.5 3.3 3.1 2.92015 7.6 5.7 5.6 5.4 5.4 5.1 4.8 4.6 4.4 4.3 4.1 4.0 3.9 3.7 3.6 3.5 3.2 3.12016 7.6 5.6 5.5 5.3 5.3 5.0 4.7 4.5 4.3 4.2 4.0 3.9 3.8 3.7 3.5 3.4 3.2 3.02017 7.5 5.5 5.3 5.2 5.2 4.9 4.6 4.4 4.2 4.1 3.9 3.8 3.7 3.6 3.5 3.3 3.1 2.92018 7.3 5.3 5.2 5.0 5.0 4.7 4.4 4.2 4.1 4.0 3.8 3.6 3.5 3.4 3.3 3.1 2.9 2.8
TerminalYear
Initial Year
3-3a. Average Annual Growth Rate of Real GNI
Source: See Table 3-1.54
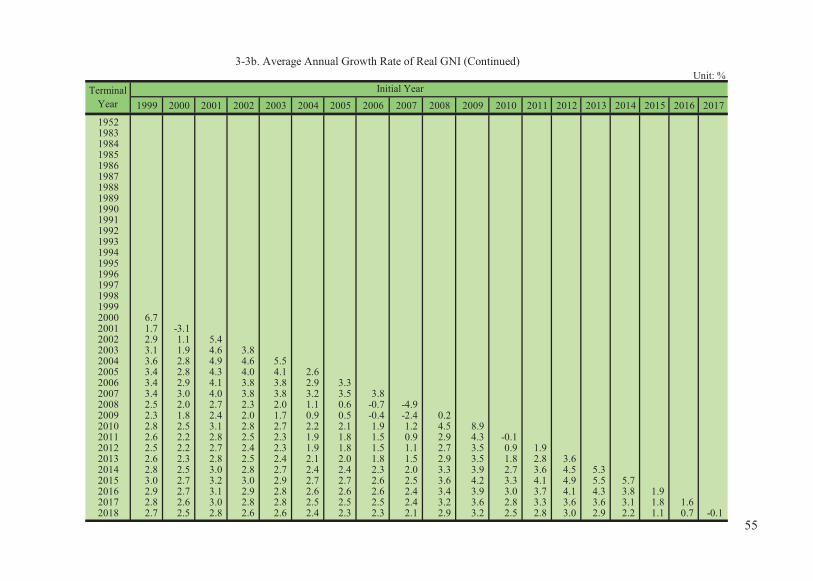
Unit: %
1999 2000 2001 2002 2003 2004 2005 2006 2007 2008 2009 2010 2011 2012 2013 2014 2015 2016 20171952198319841985198619871988198919901991199219931994199519961997199819992000 6.7 2001 1.7 -3.1 2002 2.9 1.1 5.4 2003 3.1 1.9 4.6 3.8 2004 3.6 2.8 4.9 4.6 5.5 2005 3.4 2.8 4.3 4.0 4.1 2.6 2006 3.4 2.9 4.1 3.8 3.8 2.9 3.3 2007 3.4 3.0 4.0 3.8 3.8 3.2 3.5 3.8 2008 2.5 2.0 2.7 2.3 2.0 1.1 0.6 -0.7 -4.9 2009 2.3 1.8 2.4 2.0 1.7 0.9 0.5 -0.4 -2.4 0.2 2010 2.8 2.5 3.1 2.8 2.7 2.2 2.1 1.9 1.2 4.5 8.9 2011 2.6 2.2 2.8 2.5 2.3 1.9 1.8 1.5 0.9 2.9 4.3 -0.1 2012 2.5 2.2 2.7 2.4 2.3 1.9 1.8 1.5 1.1 2.7 3.5 0.9 1.9 2013 2.6 2.3 2.8 2.5 2.4 2.1 2.0 1.8 1.5 2.9 3.5 1.8 2.8 3.6 2014 2.8 2.5 3.0 2.8 2.7 2.4 2.4 2.3 2.0 3.3 3.9 2.7 3.6 4.5 5.3 2015 3.0 2.7 3.2 3.0 2.9 2.7 2.7 2.6 2.5 3.6 4.2 3.3 4.1 4.9 5.5 5.7 2016 2.9 2.7 3.1 2.9 2.8 2.6 2.6 2.6 2.4 3.4 3.9 3.0 3.7 4.1 4.3 3.8 1.9 2017 2.8 2.6 3.0 2.8 2.8 2.5 2.5 2.5 2.4 3.2 3.6 2.8 3.3 3.6 3.6 3.1 1.8 1.6 2018 2.7 2.5 2.8 2.6 2.6 2.4 2.3 2.3 2.1 2.9 3.2 2.5 2.8 3.0 2.9 2.2 1.1 0.7 -0.1
TerminalYear
Initial Year
3-3b. Average Annual Growth Rate of Real GNI (Continued)
55

3-4. Per Capita Gross National Income
US$ NT$
Amount Nominal GrowthRate (%)
Amount Nominal GrowthRate (%)
1952 208 35.1 2,146 35.1 21,651 -16.9 1955 216 14.9 3,363 14.9 24,896 4.8 1960 163 16.4 5,940 16.7 29,983 3.5 1965 229 7.0 9,157 7.2 43,059 5.2 1970 396 11.2 15,841 11.2 64,703 8.8 1975 980 4.9 37,230 5.0 91,755 4.0 1980 2,386 22.3 85,883 22.3 140,867 2.9 1985 3,377 3.4 134,599 4.1 184,294 3.0 1990 8,431 8.0 226,718 10.0 294,408 4.8 1995 13,326 7.9 353,004 8.0 398,082 5.0 1996 13,836 3.8 379,923 7.6 422,586 6.2 1997 14,184 2.5 407,082 7.2 451,023 6.7 1998 12,934 -8.8 432,763 6.3 472,608 4.8 1999 13,947 7.8 450,063 4.0 491,449 4.0 2000 15,142 8.6 472,889 5.1 520,128 5.8 2001 13,703 -9.5 463,282 -2.0 500,462 -3.8 2002 14,062 2.6 486,280 5.0 524,613 4.8 2003 14,544 3.4 500,594 2.9 541,908 3.3 2004 15,879 9.2 530,835 6.0 569,656 5.1 2005 16,930 6.6 544,798 2.6 582,412 2.2 2006 17,446 3.1 567,508 4.2 598,925 2.8 2007 18,256 4.6 599,536 5.6 619,014 3.4 2008 18,564 1.7 585,519 -2.3 586,559 -5.2 2009 17,531 -5.6 579,574 -1.0 585,708 -0.1 2010 19,864 13.3 628,706 8.5 636,038 8.6 2011 21,507 8.3 633,822 0.8 633,822 -0.3 2012 21,967 2.1 650,660 2.7 643,956 1.6 2013 22,526 2.5 670,585 3.1 665,022 3.3 2014 23,330 3.6 708,540 5.7 698,608 5.1 2015 23,109 -1.0 737,393 4.1 736,596 5.4 2016 23,289 0.8 752,936 2.1 748,935 1.7 2017 25,055 7.6 762,681 1.3 759,778 1.4 2018 25,501 1.8 768,959 0.8 757,874 -0.3
Source: See Table 3-1.
PeriodAmount (NT$) Real Growth Rate (%)
At Current Prices Chained (2011) Dollars
56

1952 17,119 39.5 177,522 11.7 1955 29,326 18.5 224,004 8.3 1960 60,483 21.0 313,707 6.7 1965 108,626 10.3 522,557 8.1 1970 216,219 15.2 893,653 12.2 1975 538,409 5.9 1,341,538 4.8 1980 1,363,321 24.1 2,255,578 4.1 1985 2,327,221 5.5 3,184,207 3.7 1990 4,183,419 10.2 5,411,735 5.1 1995 6,719,565 8.3 7,515,245 5.5 1996 7,300,416 8.6 8,027,076 6.8 1997 7,907,557 8.3 8,637,376 7.6 1998 8,396,774 6.2 9,071,268 5.0 1999 8,770,083 4.5 9,462,846 4.3 2000 9,269,557 5.7 10,066,441 6.4 2001 9,015,899 -2.7 9,555,920 -5.1 2002 9,504,407 5.4 10,065,102 5.3 2003 9,885,093 4.0 10,495,939 4.3 2004 10,467,622 5.9 11,084,556 5.6 2005 10,732,710 2.5 11,289,173 1.9 2006 11,117,367 3.6 11,601,475 2.8 2007 11,590,959 4.3 12,034,434 3.7 2008 11,161,869 -3.7 11,203,683 -6.9 2009 10,985,329 -1.6 11,182,646 -0.2 2010 12,194,428 11.0 12,343,643 10.4 2011 12,290,671 0.8 12,290,671 -0.4 2012 12,493,108 1.7 12,490,438 1.6 2013 13,115,430 5.0 12,955,284 3.7 2014 14,018,941 6.9 13,793,650 6.5 2015 14,652,714 4.5 14,604,568 5.9 2016 14,996,482 2.4 14,889,532 2.0 2017 15,279,928 1.9 15,154,316 1.8 2018 15,364,288 0.6 15,099,856 -0.4
Source: See Table 3-1.
3-5. National Income
At Current PricesAmount (NT$ million) Nominal Growth Rate (%) Amount (NT$ million) Real Growth Rate (%)
PeriodChained (2011) Dollars
57

3-6. Per Capita National Income
US$ NT$
Amount Nominal GrowthRate (%) Amount Nominal Growth
Rate (%)1952 207 34.4 2,127 34.5 22,057 7.71955 210 14.1 3,270 14.2 24,978 4.41960 156 16.4 5,670 16.7 29,409 3.01965 217 6.9 8,682 7.0 41,766 4.81970 371 11.1 14,827 11.1 61,281 8.21975 881 3.9 33,493 4.0 83,454 2.91980 2,139 21.7 77,004 21.8 127,401 2.11985 3,042 3.4 121,263 4.0 165,917 2.31990 7,672 7.1 206,294 9.0 266,865 3.91995 11,927 7.2 315,952 7.4 353,365 4.61996 12,399 4.0 340,482 7.8 374,372 5.91997 12,736 2.7 365,513 7.4 399,248 6.61998 11,493 -9.8 384,543 5.2 415,432 4.11999 12,347 7.4 398,450 3.6 429,924 3.52000 13,379 8.4 417,839 4.9 453,759 5.52001 11,936 -10.8 403,556 -3.4 427,728 -5.72002 12,236 2.5 423,111 4.9 448,071 4.82003 12,729 4.0 438,117 3.6 465,191 3.82004 13,826 8.6 462,211 5.5 489,453 5.22005 14,673 6.1 472,188 2.2 496,669 1.52006 14,974 2.1 487,103 3.2 508,314 2.32007 15,401 2.9 505,770 3.8 525,121 3.32008 15,388 -0.1 485,347 -4.0 487,165 -7.22009 14,398 -6.4 476,000 -1.9 484,550 -0.52010 16,650 15.6 526,963 10.7 533,411 10.12011 17,982 8.0 529,918 0.6 529,918 -0.72012 18,125 0.8 536,868 1.3 536,753 1.32013 18,872 4.1 561,817 4.7 554,957 3.42014 19,724 4.5 599,007 6.6 589,381 6.22015 19,571 -0.8 624,505 4.3 622,453 5.62016 19,725 0.8 637,715 2.1 633,167 1.72017 21,310 8.0 648,677 1.7 643,345 1.62018 21,610 1.4 651,690 0.5 640,365 -0.5
Source: See Table 3-1.
PeriodAmount (NT$)
Real Growth Rate(%)
At Current Prices Chained (2011) Dollars
58

Period 2010 2011 2012 2013 2014 2015 2016 2017
National income at market prices 12,194,428 12,290,671 12,493,108 13,115,430 14,018,941 14,652,714 14,996,482 15,279,928 A. Household (1) 9,282,693 9,555,442 9,781,268 9,908,009 10,649,465 10,874,828 11,004,069 11,204,861 1. Compensation of employees 6,166,861 6,465,312 6,615,543 6,724,696 7,069,129 7,343,262 7,516,649 7,758,985
2. Operating surplus, property and entrepreneurial income, net
3,115,832 3,090,130 3,165,725 3,183,313 3,580,336 3,531,566 3,487,420 3,445,876
B. General government 982,345 1,086,864 1,059,721 1,081,257 1,170,895 1,192,156 1,229,508 1,270,324
1. Net taxes on production and imports
728,339 775,113 774,575 819,349 876,923 900,703 956,926 977,477
2. Operating surplus, property and entrepreneurial income, net
254,006 311,751 285,146 261,908 293,972 291,453 272,582 292,847
C. Corporate (2) 1,929,390 1,648,365 1,652,119 2,126,164 2,198,581 2,585,730 2,762,905 2,804,743 1. Operating surplus 3,014,527 2,775,651 2,722,220 3,180,788 3,588,420 3,806,501 3,870,903 3,927,919
2. Property and entrepreneurial income, net
-1,085,137 -1,127,286 -1,070,101 -1,054,624 -1,389,839 -1,220,771 -1,107,998 -1,123,176
Net current transfers -86,172 -109,102 -78,284 -89,550 -84,436 -107,093 -101,903 -125,234 A. Household (1) -698,879 -785,988 -676,684 -733,628 -764,661 -790,169 -937,622 -758,181 B. General government 1,118,203 1,250,616 1,142,449 1,172,284 1,292,002 1,365,014 1,539,781 1,370,991 C. Corporate (2) -505,496 -573,730 -544,049 -528,206 -611,777 -681,938 -704,062 -738,044National disposable income 12,108,256 12,181,569 12,414,824 13,025,880 13,934,505 14,545,621 14,894,579 15,154,694 A. Household (1) 8,583,814 8,769,454 9,104,584 9,174,381 9,884,804 10,084,659 10,066,447 10,446,680 B. General government 2,100,548 2,337,480 2,202,170 2,253,541 2,462,897 2,557,170 2,769,289 2,641,315 C. Corporate (2) 1,423,894 1,074,635 1,108,070 1,597,958 1,586,804 1,903,792 2,058,843 2,066,699
(1) includes private nonprofit institutions serving households. (2) includes quasi-corporate enterprises.
Source: See Table 3-1.
I. Amount (NT$ million)
3-7a. Distribution of National Income
59

Period 2010 2011 2012 2013 2014 2015 2016 2017
National income at market prices 100.0 100.0 100.0 100.0 100.0 100.0 100.0 100.0 A. Household (1) 76.1 77.7 78.3 75.5 76.0 74.2 73.4 73.3 1. Compensation of employees 50.6 52.6 53.0 51.3 50.4 50.1 50.1 50.8
2. Operating surplus, property and entrepreneurial income, net 25.6 25.1 25.3 24.3 25.5 24.1 23.3 22.6
B. General government 8.1 8.8 8.5 8.2 8.4 8.1 8.2 8.3 1. Net taxes on production and imports 6.0 6.3 6.2 6.2 6.3 6.1 6.4 6.4
2. Operating surplus, property and entrepreneurial income, net
2.1 2.5 2.3 2.0 2.1 2.0 1.8 1.9
C. Corporate (2) 15.8 13.4 13.2 16.2 15.7 17.6 18.4 18.4 1. Operating surplus 24.7 22.6 21.8 24.3 25.6 26.0 25.8 25.7
2. Property and entrepreneurial income, net
-8.9 -9.2 -8.6 -8.0 -9.9 -8.3 -7.4 -7.4
Net current transfers -0.7 -0.9 -0.6 -0.7 -0.6 -0.7 -0.7 -0.8 A. Household (1) -5.7 -6.4 -5.4 -5.6 -5.5 -5.4 -6.3 -5.0 B. General government 9.2 10.2 9.1 8.9 9.2 9.3 10.3 9.0 C. Corporate (2) -4.1 -4.7 -4.4 -4.0 -4.4 -4.7 -4.7 -4.8 National disposable income 99.3 99.1 99.4 99.3 99.4 99.3 99.3 99.2 A. Household (1) 70.4 71.4 72.9 70.0 70.5 68.8 67.1 68.4 B. General government 17.2 19.0 17.6 17.2 17.6 17.5 18.5 17.3 C. Corporate (2) 11.7 8.7 8.9 12.2 11.3 13.0 13.7 13.5
II. Percentage (%)
3-7b. Distribution of National Income (Continued)
60
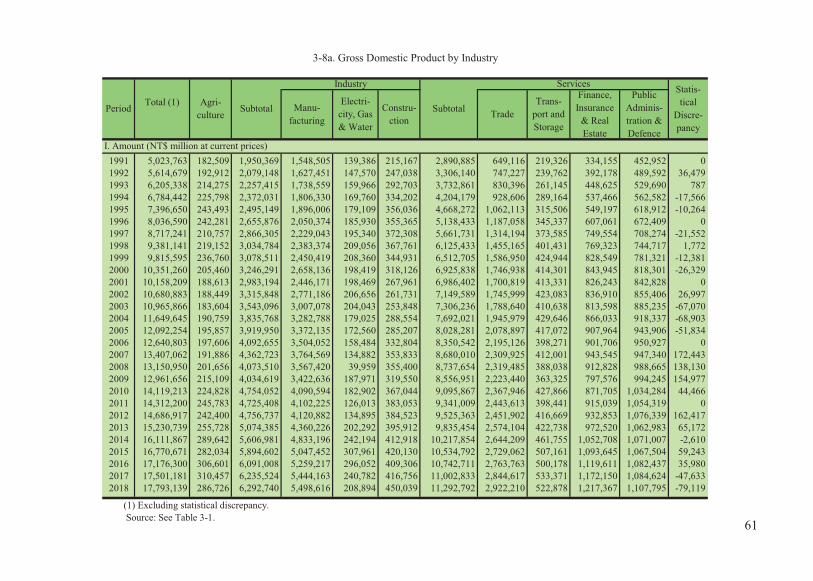
1991 5,023,763 182,509 1,950,369 1,548,505 139,386 215,167 2,890,885 649,116 219,326 334,155 452,952 01992 5,614,679 192,912 2,079,148 1,627,451 147,570 247,038 3,306,140 747,227 239,762 392,178 489,592 36,4791993 6,205,338 214,275 2,257,415 1,738,559 159,966 292,703 3,732,861 830,396 261,145 448,625 529,690 7871994 6,784,442 225,798 2,372,031 1,806,330 169,760 334,202 4,204,179 928,606 289,164 537,466 562,582 -17,5661995 7,396,650 243,493 2,495,149 1,896,006 179,109 356,036 4,668,272 1,062,113 315,506 549,197 618,912 -10,2641996 8,036,590 242,281 2,655,876 2,050,374 185,930 355,365 5,138,433 1,187,058 345,337 607,061 672,409 01997 8,717,241 210,757 2,866,305 2,229,043 195,340 372,308 5,661,731 1,314,194 373,585 749,554 708,274 -21,5521998 9,381,141 219,152 3,034,784 2,383,374 209,056 367,761 6,125,433 1,455,165 401,431 769,323 744,717 1,7721999 9,815,595 236,760 3,078,511 2,450,419 208,360 344,931 6,512,705 1,586,950 424,944 828,549 781,321 -12,3812000 10,351,260 205,460 3,246,291 2,658,136 198,419 318,126 6,925,838 1,746,938 414,301 843,945 818,301 -26,3292001 10,158,209 188,613 2,983,194 2,446,171 198,469 267,961 6,986,402 1,700,819 413,331 826,243 842,828 02002 10,680,883 188,449 3,315,848 2,771,186 206,656 261,731 7,149,589 1,745,999 423,083 836,910 855,406 26,9972003 10,965,866 183,604 3,543,096 3,007,078 204,043 253,848 7,306,236 1,788,640 410,638 813,598 885,235 -67,0702004 11,649,645 190,759 3,835,768 3,282,788 179,025 288,554 7,692,021 1,945,979 429,646 866,033 918,337 -68,9032005 12,092,254 195,857 3,919,950 3,372,135 172,560 285,207 8,028,281 2,078,897 417,072 907,964 943,906 -51,8342006 12,640,803 197,606 4,092,655 3,504,052 158,484 332,804 8,350,542 2,195,126 398,271 901,706 950,927 02007 13,407,062 191,886 4,362,723 3,764,569 134,882 353,833 8,680,010 2,309,925 412,001 943,545 947,340 172,4432008 13,150,950 201,656 4,073,510 3,567,420 39,959 355,400 8,737,654 2,319,485 388,038 912,828 988,665 138,1302009 12,961,656 215,109 4,034,619 3,422,636 187,971 319,550 8,556,951 2,223,440 363,325 797,576 994,245 154,9772010 14,119,213 224,828 4,754,052 4,090,594 182,902 367,044 9,095,867 2,367,946 427,866 871,705 1,034,284 44,4662011 14,312,200 245,783 4,725,408 4,102,225 126,013 383,053 9,341,009 2,443,613 398,441 915,039 1,054,319 02012 14,686,917 242,400 4,756,737 4,120,882 134,895 384,523 9,525,363 2,451,902 416,669 932,853 1,076,339 162,4172013 15,230,739 255,728 5,074,385 4,360,226 202,292 395,912 9,835,454 2,574,104 422,738 972,520 1,062,983 65,1722014 16,111,867 289,642 5,606,981 4,833,196 242,194 412,918 10,217,854 2,644,209 461,755 1,052,708 1,071,007 -2,6102015 16,770,671 282,034 5,894,602 5,047,452 307,961 420,130 10,534,792 2,729,062 507,161 1,093,645 1,067,504 59,2432016 17,176,300 306,601 6,091,008 5,259,217 296,052 409,306 10,742,711 2,763,763 500,178 1,119,611 1,082,437 35,9802017 17,501,181 310,457 6,235,524 5,444,163 240,782 416,756 11,002,833 2,844,617 533,371 1,172,150 1,084,624 -47,6332018 17,793,139 286,726 6,292,740 5,498,616 208,894 450,039 11,292,792 2,922,210 522,878 1,217,367 1,107,795 -79,119
(1) Excluding statistical discrepancy. Source: See Table 3-1.
I. Amount (NT$ million at current prices)
Manu-facturing
Electri-city, Gas& Water
Constru-ction
Trade
3-8a. Gross Domestic Product by Industry
Period Total (1) Agri-culture
Subtotal
Industry
Subtotal
Services Statis-tical
Discre-pancy
PublicAdminis-tration &Defence
Trans-port andStorage
Finance,Insurance
& RealEstate
61

1991 100.0 3.6 38.8 30.8 2.8 4.3 57.5 12.9 4.4 6.7 9.01992 100.0 3.5 37.3 29.2 2.6 4.4 59.3 13.4 4.3 7.0 8.81993 100.0 3.5 36.4 28.0 2.6 4.7 60.2 13.4 4.2 7.2 8.51994 100.0 3.3 34.9 26.6 2.5 4.9 61.8 13.7 4.3 7.9 8.31995 100.0 3.3 33.7 25.6 2.4 4.8 63.0 14.3 4.3 7.4 8.41996 100.0 3.0 33.0 25.5 2.3 4.4 63.9 14.8 4.3 7.6 8.41997 100.0 2.4 32.8 25.5 2.2 4.3 64.8 15.0 4.3 8.6 8.11998 100.0 2.3 32.4 25.4 2.2 3.9 65.3 15.5 4.3 8.2 7.91999 100.0 2.4 31.3 24.9 2.1 3.5 66.3 16.1 4.3 8.4 7.92000 100.0 2.0 31.3 25.6 1.9 3.1 66.7 16.8 4.0 8.1 7.92001 100.0 1.9 29.4 24.1 2.0 2.6 68.8 16.7 4.1 8.1 8.32002 100.0 1.8 31.1 26.0 1.9 2.5 67.1 16.4 4.0 7.9 8.02003 100.0 1.7 32.1 27.3 1.8 2.3 66.2 16.2 3.7 7.4 8.02004 100.0 1.6 32.7 28.0 1.5 2.5 65.6 16.6 3.7 7.4 7.82005 100.0 1.6 32.3 27.8 1.4 2.3 66.1 17.1 3.4 7.5 7.82006 100.0 1.6 32.4 27.7 1.3 2.6 66.1 17.4 3.2 7.1 7.52007 100.0 1.4 33.0 28.4 1.0 2.7 65.6 17.5 3.1 7.1 7.22008 100.0 1.5 31.3 27.4 0.3 2.7 67.1 17.8 3.0 7.0 7.62009 100.0 1.7 31.5 26.7 1.5 2.5 66.8 17.4 2.8 6.2 7.82010 100.0 1.6 33.8 29.1 1.3 2.6 64.6 16.8 3.0 6.2 7.32011 100.0 1.7 33.0 28.7 0.9 2.7 65.3 17.1 2.8 6.4 7.42012 100.0 1.7 32.7 28.4 0.9 2.6 65.6 16.9 2.9 6.4 7.42013 100.0 1.7 33.5 28.8 1.3 2.6 64.9 17.0 2.8 6.4 7.02014 100.0 1.8 34.8 30.0 1.5 2.6 63.4 16.4 2.9 6.5 6.62015 100.0 1.7 35.3 30.2 1.8 2.5 63.0 16.3 3.0 6.5 6.42016 100.0 1.8 35.5 30.7 1.7 2.4 62.7 16.1 2.9 6.5 6.32017 100.0 1.8 35.5 31.0 1.4 2.4 62.7 16.2 3.0 6.7 6.22018 100.0 1.6 35.2 30.8 1.2 2.5 63.2 16.4 2.9 6.8 6.2
II. Percentage (%)
3-8b. Gross Domestic Product by Industry (Continued)
Period Total (1) Agri-culture
Subtotal
Industry
Subtotal
Services
Manu-facturing Trade
Trans-port andStorage
Finance,Insurance
& RealEstate
Electri-city, Gas& Water
PublicAdminis-tration &Defence
Constru-ction
62

1991 5,193,843 240,510 1,484,153 1,108,898 47,998 324,573 3,503,701 830,351 188,170 365,007 685,302 -21,0631992 5,624,580 234,699 1,568,870 1,161,902 54,287 352,387 3,835,275 920,390 202,941 411,038 707,146 14,6981993 6,007,177 242,395 1,648,627 1,206,839 58,768 391,871 4,176,773 990,644 213,006 456,052 741,430 -11,4211994 6,457,362 231,163 1,761,320 1,288,503 63,908 421,231 4,546,415 1,077,155 225,409 521,743 767,845 -21,7411995 6,877,169 240,438 1,860,244 1,371,223 68,807 426,378 4,875,503 1,170,947 240,691 512,663 825,012 -27,3351996 7,301,854 237,281 1,949,826 1,456,896 72,474 418,602 5,240,941 1,263,701 252,073 549,892 875,689 -37,8451997 7,748,223 233,376 2,067,296 1,563,032 76,562 420,796 5,598,896 1,328,030 262,975 668,583 890,362 -54,4891998 8,074,502 215,266 2,123,917 1,607,599 82,495 422,982 5,882,755 1,408,640 271,538 670,143 908,628 -39,9991999 8,616,866 222,622 2,259,476 1,737,651 84,572 418,734 6,309,164 1,516,091 303,336 721,183 932,994 -55,8102000 9,170,116 226,673 2,419,118 1,903,631 84,593 400,941 6,717,163 1,636,740 323,736 731,918 965,064 -69,9592001 9,054,580 215,814 2,248,526 1,772,693 81,100 355,043 6,756,094 1,656,152 311,785 705,635 975,334 -8,6392002 9,559,334 233,119 2,485,515 1,981,324 86,633 366,326 6,965,077 1,710,801 323,734 719,708 972,269 9,2802003 9,953,235 230,479 2,710,707 2,196,618 89,683 354,582 7,169,383 1,758,130 326,719 729,456 995,319 -52,1932004 10,600,793 218,682 2,981,987 2,427,539 96,246 380,506 7,540,578 1,874,235 347,257 784,550 1,005,139 -60,7232005 11,174,918 210,131 3,209,369 2,632,428 100,024 387,444 7,845,845 1,999,600 356,259 820,474 1,019,094 -29,2212006 11,803,335 236,116 3,432,843 2,832,766 100,680 404,365 8,201,724 2,114,749 368,110 846,706 1,017,749 -10,9472007 12,572,550 236,067 3,812,927 3,198,856 93,343 408,647 8,580,356 2,239,312 386,355 907,711 1,004,260 -25,4982008 12,661,079 236,107 3,798,915 3,212,264 92,380 371,359 8,615,420 2,258,083 381,911 875,232 1,013,983 44,4952009 12,462,729 229,968 3,690,398 3,131,574 116,981 333,637 8,527,167 2,215,668 362,849 809,713 1,022,346 50,8272010 13,787,642 235,143 4,458,951 3,841,281 122,593 379,281 9,062,353 2,355,418 390,230 877,986 1,054,022 36,2102011 14,312,200 245,783 4,725,407 4,102,224 126,013 383,053 9,341,010 2,443,612 398,441 915,040 1,054,319 02012 14,607,569 237,912 4,880,960 4,254,944 128,143 377,743 9,459,989 2,470,401 405,716 924,995 1,061,653 28,7082013 14,929,292 241,118 4,962,378 4,327,147 132,140 381,257 9,676,367 2,510,246 436,707 962,000 1,054,799 48,8192014 15,529,606 244,847 5,321,104 4,680,518 134,608 384,152 9,990,909 2,616,354 440,446 1,035,344 1,052,245 -28,3752015 15,654,835 224,229 5,292,173 4,668,067 127,388 380,788 10,114,451 2,625,462 437,979 1,074,561 1,052,753 27,8462016 15,891,514 201,560 5,439,776 4,811,009 133,159 375,089 10,250,324 2,650,702 450,775 1,099,825 1,052,039 5,1182017 16,380,812 218,382 5,689,541 5,067,205 132,657 372,957 10,510,436 2,750,876 477,243 1,155,852 1,061,749 -41,1702018 16,812,286 223,339 5,879,375 5,240,878 134,556 385,315 10,780,923 2,844,942 499,987 1,195,407 1,071,543 -75,960
Note:The chained-dollar estimates are not additive.
I. Amount (NT$ million, chained (2011) dollars)
Manu-facturing
Electri-city, Gas& Water
Constru-ction Trade
3-8c. Gross Domestic Product by Industry (Continued)
Period GDP Agri-culture Subtotal
Industry
Subtotal
ServicesStatis-tical
Discre-pancy
PublicAdminis-tration &Defence
Trans-port andStorage
Finance,Insurance
& RealEstate
63

1992 8.3 -2.4 5.7 4.8 13.1 8.6 9.5 10.8 7.9 12.6 3.21993 6.8 3.3 5.1 3.9 8.3 11.2 8.9 7.6 5.0 11.0 4.81994 7.5 -4.6 6.8 6.8 8.7 7.5 8.8 8.7 5.8 14.4 3.61995 6.5 4.0 5.6 6.4 7.7 1.2 7.2 8.7 6.8 -1.7 7.41996 6.2 -1.3 4.8 6.2 5.3 -1.8 7.5 7.9 4.7 7.3 6.11997 6.1 -1.6 6.0 7.3 5.6 0.5 6.8 5.1 4.3 21.6 1.71998 4.2 -7.8 2.7 2.9 7.7 0.5 5.1 6.1 3.3 0.2 2.11999 6.7 3.4 6.4 8.1 2.5 -1.0 7.2 7.6 11.7 7.6 2.72000 6.4 1.8 7.1 9.6 0.0 -4.2 6.5 8.0 6.7 1.5 3.42001 -1.3 -4.8 -7.1 -6.9 -4.1 -11.4 0.6 1.2 -3.7 -3.6 1.12002 5.6 8.0 10.5 11.8 6.8 3.2 3.1 3.3 3.8 2.0 -0.32003 4.1 -1.1 9.1 10.9 3.5 -3.2 2.9 2.8 0.9 1.4 2.42004 6.5 -5.1 10.0 10.5 7.3 7.3 5.2 6.6 6.3 7.6 1.02005 5.4 -3.9 7.6 8.4 3.9 1.8 4.0 6.7 2.6 4.6 1.42006 5.6 12.4 7.0 7.6 0.7 4.4 4.5 5.8 3.3 3.2 -0.12007 6.5 0.0 11.1 12.9 -7.3 1.1 4.6 5.9 5.0 7.2 -1.32008 0.7 0.0 -0.4 0.4 -1.0 -9.1 0.4 0.8 -1.2 -3.6 1.02009 -1.6 -2.6 -2.9 -2.5 26.6 -10.2 -1.0 -1.9 -5.0 -7.5 0.82010 10.6 2.3 20.8 22.7 4.8 13.7 6.3 6.3 7.5 8.4 3.12011 3.8 4.5 6.0 6.8 2.8 1.0 3.1 3.7 2.1 4.2 0.02012 2.1 -3.2 3.3 3.7 1.7 -1.4 1.3 1.1 1.8 1.1 0.72013 2.2 1.3 1.7 1.7 3.1 0.9 2.3 1.6 7.6 4.0 -0.62014 4.0 1.5 7.2 8.2 1.9 0.8 3.3 4.2 0.9 7.6 -0.22015 0.8 -8.4 -0.5 -0.3 -5.4 -0.9 1.2 0.3 -0.6 3.8 0.02016 1.5 -10.1 2.8 3.1 4.5 -1.5 1.3 1.0 2.9 2.4 -0.12017 3.1 8.3 4.6 5.3 -0.4 -0.6 2.5 3.8 5.9 5.1 0.92018 2.6 2.3 3.3 3.4 1.4 3.3 2.6 3.4 4.8 3.4 0.9
Trans-port andStorage
II. Annual Real Growth Rate (%)
3-8d. Gross Domestic Product by Industry (Continued)
Subtotal
Services
TradePeriod GDP Agri-culture
Subtotal
IndustryFinance,Insurance
& RealEstate
PublicAdminis-tration &Defence
Manu-facturing
Electri-city, Gas& Water
Constru-ction
64

1952 17,271 -4 15,646 12,795 2,851 2,682 1,979 703 18,328 1,386 2,4391955 30,160 -3 27,359 21,773 5,586 4,099 3,502 597 31,458 2,475 3,7701960 63,371 -27 54,974 42,795 12,179 13,126 10,869 2,257 68,100 7,192 11,8941965 114,577 -194 91,270 71,942 19,328 26,874 20,418 6,456 118,144 21,771 25,1441970 231,015 -412 170,408 129,347 41,061 61,133 52,301 8,832 231,541 68,746 68,8601975 598,483 -3,344 433,833 341,153 92,680 187,300 191,565 -4,265 621,133 233,701 253,0071980 1,520,519 -2,106 1,020,568 777,424 243,144 519,811 472,346 47,465 1,540,379 783,272 801,0261985 2,583,166 47,154 1,679,161 1,258,801 420,360 529,447 529,967 -520 2,208,608 1,345,492 1,018,0881990 4,597,595 117,307 3,151,488 2,341,495 809,993 1,142,092 1,111,414 30,678 4,293,580 2,020,064 1,833,3561995 7,507,569 110,919 5,222,163 3,969,187 1,252,976 2,072,405 2,027,897 44,508 7,294,568 3,412,791 3,310,7091996 8,146,092 109,502 5,747,027 4,372,154 1,374,873 2,043,855 2,033,277 10,578 7,790,882 3,692,075 3,446,3671997 8,806,852 89,611 6,239,780 4,743,108 1,496,672 2,317,181 2,231,680 85,501 8,556,961 4,060,689 3,900,4091998 9,449,692 68,551 6,721,983 5,116,403 1,605,580 2,571,393 2,482,879 88,514 9,293,376 4,352,253 4,264,4881999 9,906,113 90,518 6,988,007 5,394,295 1,593,712 2,598,205 2,540,878 57,327 9,586,212 4,554,722 4,325,3392000 10,490,818 139,558 7,330,167 5,706,268 1,623,899 2,815,099 2,722,595 92,504 10,145,266 5,373,337 5,167,3432001 10,350,233 192,024 7,453,287 5,756,645 1,696,642 2,175,715 2,238,591 -62,876 9,629,002 4,942,685 4,413,4782002 10,923,385 242,502 7,703,736 5,953,938 1,749,798 2,241,850 2,285,679 -43,829 9,945,586 5,427,124 4,691,8272003 11,294,739 328,873 7,852,356 6,100,329 1,752,027 2,377,923 2,365,673 12,250 10,230,279 5,924,171 5,188,5842004 12,021,744 372,099 8,293,622 6,490,958 1,802,664 2,954,277 2,853,709 100,568 11,247,899 6,982,430 6,580,6842005 12,383,120 290,866 8,629,892 6,784,327 1,845,565 2,957,842 2,924,286 33,556 11,587,734 7,329,793 6,825,2732006 12,952,502 311,699 8,801,811 6,947,802 1,854,009 3,110,995 3,063,352 47,643 11,912,806 8,316,084 7,588,0872007 13,739,828 332,766 9,119,991 7,197,916 1,922,075 3,221,482 3,205,121 16,361 12,341,473 9,349,494 8,283,9052008 13,465,596 314,646 9,251,350 7,260,169 1,991,181 3,217,027 3,045,433 171,594 12,468,377 9,230,775 8,548,2022009 13,375,650 413,994 9,231,232 7,175,511 2,055,721 2,580,249 2,761,737 -181,488 11,811,481 7,827,336 6,677,1612010 14,548,852 429,639 9,596,399 7,497,682 2,098,717 3,524,645 3,335,881 188,764 13,121,044 10,013,538 9,015,3692011 14,700,572 388,372 9,966,571 7,798,976 2,167,595 3,382,866 3,346,945 35,921 13,349,437 10,419,700 9,456,9372012 15,141,108 454,191 10,289,387 8,035,105 2,254,282 3,304,160 3,282,131 22,029 13,593,547 10,345,375 9,252,0052013 15,654,588 423,849 10,491,022 8,248,385 2,242,637 3,360,196 3,378,731 -18,535 13,851,218 10,579,884 9,200,3632014 16,582,405 470,538 10,931,495 8,588,741 2,342,754 3,521,157 3,493,834 27,323 14,452,652 11,254,123 9,594,9082015 17,301,397 530,726 11,101,939 8,755,829 2,346,110 3,513,112 3,493,267 19,845 14,615,051 10,775,522 8,619,9022016 17,705,994 529,694 11,497,392 9,034,473 2,462,919 3,562,189 3,589,298 -27,109 15,059,581 10,770,722 8,654,0032017 17,965,345 464,164 11,726,640 9,265,072 2,461,568 3,543,176 3,584,358 -41,182 15,269,816 11,356,769 9,125,4042018 18,129,011 335,872 12,130,181 9,543,914 2,586,267 3,793,979 3,743,897 50,082 15,924,160 11,882,549 10,013,570
Gross FixedCapital
Formation
Increase inInventory
Source: See Table 3-1.
I. Amount (NT$ million at current prices)
3-9a. Expenditure on Gross National Income
PeriodGross
NationalIncome
Net FactorIncomefrom the
Rest of theWorld
National Consumption Gross Capital Formation
DomesticDemand
Exports ofGoods &Services
Less:Imports
of Goods& Services
Subtotal Private Govern-ment Subtotal
65

1952 100.0 0.0 90.6 74.1 16.5 15.5 11.5 4.1 106.1 8.0 14.11955 100.0 0.0 90.7 72.2 18.5 13.6 11.6 2.0 104.3 8.2 12.51960 100.0 0.0 86.7 67.5 19.2 20.7 17.2 3.6 107.5 11.3 18.81965 100.0 -0.2 79.7 62.8 16.9 23.5 17.8 5.6 103.1 19.0 21.91970 100.0 -0.2 73.8 56.0 17.8 26.5 22.6 3.8 100.2 29.8 29.81975 100.0 -0.6 72.5 57.0 15.5 31.3 32.0 -0.7 103.8 39.0 42.31980 100.0 -0.1 67.1 51.1 16.0 34.2 31.1 3.1 101.3 51.5 52.71985 100.0 1.8 65.0 48.7 16.3 20.5 20.5 0.0 85.5 52.1 39.41990 100.0 2.6 68.5 50.9 17.6 24.8 24.2 0.7 93.4 43.9 39.91995 100.0 1.5 69.6 52.9 16.7 27.6 27.0 0.6 97.2 45.5 44.11996 100.0 1.3 70.5 53.7 16.9 25.1 25.0 0.1 95.6 45.3 42.31997 100.0 1.0 70.9 53.9 17.0 26.3 25.3 1.0 97.2 46.1 44.31998 100.0 0.7 71.1 54.1 17.0 27.2 26.3 0.9 98.3 46.1 45.11999 100.0 0.9 70.5 54.5 16.1 26.2 25.6 0.6 96.8 46.0 43.72000 100.0 1.3 69.9 54.4 15.5 26.8 26.0 0.9 96.7 51.2 49.32001 100.0 1.9 72.0 55.6 16.4 21.0 21.6 -0.6 93.0 47.8 42.62002 100.0 2.2 70.5 54.5 16.0 20.5 20.9 -0.4 91.0 49.7 43.02003 100.0 2.9 69.5 54.0 15.5 21.1 20.9 0.1 90.6 52.5 45.92004 100.0 3.1 69.0 54.0 15.0 24.6 23.7 0.8 93.6 58.1 54.72005 100.0 2.3 69.7 54.8 14.9 23.9 23.6 0.3 93.6 59.2 55.12006 100.0 2.4 68.0 53.6 14.3 24.0 23.7 0.4 92.0 64.2 58.62007 100.0 2.4 66.4 52.4 14.0 23.4 23.3 0.1 89.8 68.0 60.32008 100.0 2.3 68.7 53.9 14.8 23.9 22.6 1.3 92.6 68.6 63.52009 100.0 3.1 69.0 53.6 15.4 19.3 20.6 -1.4 88.3 58.5 49.92010 100.0 3.0 66.0 51.5 14.4 24.2 22.9 1.3 90.2 68.8 62.02011 100.0 2.6 67.8 53.1 14.7 23.0 22.8 0.2 90.8 70.9 64.32012 100.0 3.0 68.0 53.1 14.9 21.8 21.7 0.1 89.8 68.3 61.12013 100.0 2.7 67.0 52.7 14.3 21.5 21.6 -0.1 88.5 67.6 58.82014 100.0 2.8 65.9 51.8 14.1 21.2 21.1 0.2 87.2 67.9 57.92015 100.0 3.1 64.2 50.6 13.6 20.3 20.2 0.1 84.5 62.3 49.82016 100.0 3.0 64.9 51.0 13.9 20.1 20.3 -0.2 85.1 60.8 48.92017 100.0 2.6 65.3 51.6 13.7 19.7 20.0 -0.2 85.0 63.2 50.82018 100.0 1.9 66.9 52.6 14.3 20.9 20.7 0.3 87.8 65.5 55.2
II. Percentage (%)
National Consumption Gross Capital Formation
3-9b. Expenditure on Gross National Income (Continued)
Subtotal Private Govern-ment
SubtotalGross Fixed
CapitalFormation
Increase inInventory
PeriodGross
NationalIncome
Net FactorIncome fromthe Rest ofthe World
Exports ofGoods &Services
Less: Importsof Goods
& Services
DomesticDemand
66

1952 174,246 -111 197,266 128,673 68,593 21,402 17,133 4,269 218,668 9,912 37,4331955 223,275 -53 257,402 164,205 93,197 22,992 20,288 2,704 280,394 11,388 36,3551960 319,871 -194 356,886 213,377 143,509 50,309 43,465 6,844 407,195 20,628 61,8041965 538,772 -1,241 545,985 356,253 189,732 97,599 81,493 16,106 643,584 56,182 120,5051970 943,586 -2,109 847,958 560,015 287,943 230,247 208,140 22,107 1,078,205 160,036 307,8971975 1,474,993 -9,697 1,230,795 876,097 354,698 454,866 460,873 -6,007 1,685,661 340,455 603,3391980 2,493,982 -3,354 1,900,982 1,332,933 568,049 785,687 742,530 43,157 2,686,669 757,167 1,136,3821985 3,536,894 75,285 2,583,511 1,810,804 772,707 812,566 814,977 -2,411 3,396,077 1,201,174 1,330,1931990 5,970,280 168,363 4,336,331 3,091,545 1,244,786 1,607,525 1,562,934 44,591 5,943,856 2,080,006 2,929,6961995 8,466,268 132,280 6,082,632 4,465,470 1,617,162 2,553,788 2,492,883 60,905 8,636,420 3,194,781 4,545,7941996 9,060,843 126,948 6,513,395 4,782,803 1,730,592 2,596,237 2,573,649 22,588 9,109,632 3,419,531 4,805,0501997 9,757,483 102,689 6,952,672 5,122,902 1,829,770 2,928,209 2,829,582 98,627 9,880,881 3,698,818 5,433,8491998 10,319,741 77,031 7,381,632 5,465,078 1,916,554 3,152,221 3,049,076 103,145 10,533,853 3,788,724 5,855,1501999 10,817,030 101,574 7,619,763 5,751,968 1,867,795 3,224,676 3,144,370 80,306 10,844,439 4,251,131 6,095,0502000 11,538,800 154,869 7,932,871 6,053,427 1,879,444 3,510,035 3,411,605 98,430 11,442,906 5,016,203 6,999,9512001 11,180,872 213,487 8,065,549 6,140,238 1,925,311 2,741,076 2,817,001 -75,925 10,806,625 4,591,478 5,980,1662002 11,784,475 270,147 8,313,590 6,354,159 1,959,431 2,821,496 2,867,682 -46,186 11,135,086 5,125,966 6,362,0602003 12,226,885 367,375 8,482,638 6,536,144 1,946,494 2,914,359 2,901,649 12,710 11,396,997 5,639,604 6,843,1312004 12,900,914 409,490 8,848,259 6,879,689 1,968,570 3,392,108 3,305,326 86,782 12,240,367 6,526,899 8,050,0642005 13,238,085 313,759 9,087,828 7,111,080 1,976,748 3,443,692 3,410,015 33,677 12,531,520 7,024,327 8,283,2342006 13,669,529 333,420 9,202,944 7,238,671 1,964,273 3,504,763 3,461,994 42,769 12,707,707 7,823,471 8,669,5152007 14,186,226 350,310 9,421,422 7,413,894 2,007,528 3,518,560 3,501,589 16,971 12,939,982 8,640,956 8,920,0012008 13,489,512 320,632 9,326,776 7,288,331 2,038,445 3,278,320 3,111,807 166,513 12,605,096 8,688,819 8,551,1942009 13,517,208 423,658 9,393,434 7,289,398 2,104,036 2,644,464 2,837,726 -193,262 12,037,898 7,957,049 7,420,8432010 14,718,522 435,627 9,689,409 7,563,285 2,126,124 3,582,217 3,385,791 196,426 13,271,626 9,999,951 9,500,5882011 14,700,572 388,372 9,966,571 7,798,976 2,167,595 3,382,866 3,346,945 35,921 13,349,437 10,419,700 9,456,9372012 14,985,094 445,579 10,155,354 7,940,907 2,214,447 3,278,497 3,259,477 19,020 13,433,851 10,462,131 9,288,4132013 15,524,725 411,781 10,323,488 8,126,434 2,197,054 3,383,725 3,432,126 -48,401 13,707,132 10,828,138 9,604,4322014 16,349,966 452,196 10,683,152 8,405,582 2,277,570 3,532,996 3,502,539 30,457 14,216,159 11,462,929 10,148,9702015 17,282,691 511,451 10,902,117 8,626,919 2,275,198 3,585,767 3,560,091 25,676 14,487,516 11,420,203 10,259,3942016 17,611,917 504,117 11,187,997 8,830,947 2,357,050 3,608,549 3,644,042 -35,493 14,808,868 11,639,789 10,575,8312017 17,896,956 449,887 11,397,855 9,055,548 2,342,307 3,580,430 3,639,825 -59,395 14,945,409 12,504,304 11,134,4892018 17,870,724 312,335 11,664,124 9,236,074 2,428,050 3,795,433 3,729,729 65,704 15,459,557 12,973,361 11,689,189
Note:The chained-dollar estimates are not additive.
Less:Imports
of Goods& Services
3-9c. Expenditure on Gross National Income (Continued)
National Consumption Gross Capital Formation
SubtotalGross Fixed
CapitalFormation
Increasein
Inventory
PeriodGross
NationalIncome
Net FactorIncomefrom theRest of
the World
DomesticDemand
I. Amount (NT$ million, chained (2011) dollars)
Govern-ment SubtotalPrivate
Exports ofGoods &Services
67

1952 12.5 - 8.9 16.9 15.4 15.3 34.4 - 9.5 1.6 33.51955 8.7 - 7.7 6.3 7.7 18.9 -12.5 - 8.6 28.1 -14.11960 7.3 - 8.7 5.4 1.5 5.8 19.3 - 8.4 13.7 9.71965 8.5 - 6.4 11.8 4.9 12.8 29.3 - 7.4 25.8 23.51970 12.8 - 8.9 10.2 7.7 20.7 18.3 - 11.4 29.9 22.81975 5.9 - 10.2 4.9 13.8 11.4 19.3 - 10.5 -0.9 -6.11980 4.9 - 6.6 5.0 10.6 11.0 15.5 - 7.8 8.9 7.61985 4.4 - 5.8 5.3 6.9 -8.6 -3.7 - 1.9 2.2 -4.31990 5.9 - 10.3 9.1 13.4 7.2 8.8 - 9.5 0.7 5.11995 5.9 - 6.2 3.8 13.5 6.6 7.4 - 6.3 12.7 10.01996 7.0 - 7.1 7.1 7.0 1.7 3.2 - 5.5 7.0 5.71997 7.7 - 6.7 7.1 5.7 12.8 9.9 - 8.5 8.2 13.11998 5.8 - 6.2 6.7 4.7 7.7 7.8 - 6.6 2.4 7.81999 4.8 - 3.2 5.3 -2.5 2.3 3.1 - 2.9 12.2 4.12000 6.7 - 4.1 5.2 0.6 8.8 8.5 - 5.5 18.0 14.82001 -3.1 - 1.7 1.4 2.4 -21.9 -17.4 - -5.6 -8.5 -14.62002 5.4 - 3.1 3.5 1.8 2.9 1.8 - 3.0 11.6 6.42003 3.8 - 2.0 2.9 -0.7 3.3 1.2 - 2.4 10.0 7.62004 5.5 - 4.3 5.3 1.1 16.4 13.9 - 7.4 15.7 17.62005 2.6 - 2.7 3.4 0.4 1.5 3.2 - 2.4 7.6 2.92006 3.3 - 1.3 1.8 -0.6 1.8 1.5 - 1.4 11.4 4.72007 3.8 - 2.4 2.4 2.2 0.4 1.1 - 1.8 10.4 2.92008 -4.9 - -1.0 -1.7 1.5 -6.8 -11.1 - -2.6 0.6 -4.12009 0.2 - 0.7 0.0 3.2 -19.3 -8.8 - -4.5 -8.4 -13.22010 8.9 - 3.2 3.8 1.0 35.5 19.3 - 10.2 25.7 28.02011 -0.1 - 2.9 3.1 2.0 -5.6 -1.1 - 0.6 4.2 -0.52012 1.9 - 1.9 1.8 2.2 -3.1 -2.6 - 0.6 0.4 -1.82013 3.6 - 1.7 2.3 -0.8 3.2 5.3 - 2.0 3.5 3.42014 5.3 - 3.5 3.4 3.7 4.4 2.1 - 3.7 5.9 5.72015 5.7 - 2.0 2.6 -0.1 1.5 1.6 - 1.9 -0.4 1.12016 1.9 - 2.6 2.4 3.6 0.6 2.4 - 2.2 1.9 3.12017 1.6 - 1.9 2.5 -0.6 -0.8 -0.1 - 0.9 7.4 5.32018 -0.1 - 2.3 2.0 3.7 6.0 2.5 - 3.4 3.8 5.0
3-9d. Expenditure on Gross National Income (Continued)National Consumption Gross Capital Formation
PeriodGross
NationalIncome
Net FactorIncomefrom theRest of
the World
Exports ofGoods &Services
Gross FixedCapital
Formation
Increase inInventory
Less:Imports
of Goods& Services
DomesticDemand
II. Annual Real Growth Rate (%)
Subtotal Private Govern-ment Subtotal
68

1981 100.00 38.40 37.13 7.17 22.08 -27.99 61.60 66.10 4.501985 100.00 35.76 54.05 23.08 -17.26 -24.32 64.24 24.74 -39.501986 100.00 50.87 32.81 5.73 23.18 -10.76 49.05 128.91 79.861987 100.00 92.44 41.57 12.76 31.18 6.93 7.56 89.84 82.201988 100.00 178.18 80.80 15.09 39.65 42.52 -78.18 45.39 123.571989 100.00 107.77 79.66 24.69 36.34 -32.91 -7.77 28.69 36.461990 100.00 132.04 83.54 39.47 38.41 -29.38 -32.21 6.02 38.231991 100.00 103.23 48.33 15.91 32.54 6.34 -3.23 70.69 73.921992 100.00 111.10 62.48 6.03 34.26 8.20 -10.98 37.76 48.731993 100.00 100.15 63.53 7.94 38.24 -9.56 0.00 42.50 42.501994 100.00 92.92 61.68 1.34 34.31 -4.41 7.08 30.97 23.901995 100.00 80.00 31.54 33.08 30.92 -15.54 20.00 82.46 62.621996 100.00 88.67 61.65 19.26 14.40 -6.63 11.17 52.59 41.261997 100.00 130.44 63.34 16.04 41.24 9.98 -30.44 61.37 91.821998 100.00 155.58 86.22 19.24 47.27 2.61 -55.58 26.84 82.421999 100.00 43.45 42.56 -6.55 12.35 -5.06 56.55 84.23 27.682000 100.00 71.81 44.86 1.56 34.27 -8.88 28.19 130.06 101.872001 (1) … … … … … … … … …2002 100.00 48.29 35.37 5.39 7.18 0.36 51.89 101.62 49.732003 100.00 57.04 38.83 -2.67 6.07 14.81 42.96 123.54 80.582004 100.00 97.54 44.85 2.76 46.08 3.84 2.30 130.57 128.262005 100.00 45.76 34.50 1.11 14.39 -4.24 54.06 84.32 30.262006 100.00 24.20 17.97 -1.78 6.58 1.42 75.80 122.78 46.802007 100.00 21.17 20.40 4.91 4.29 -8.44 78.83 105.37 26.532008 100.00 -320.00 -130.00 31.43 -380.00 158.57 420.00 55.71 -364.292009 (1) … … … … … … … … …2010 100.00 90.03 19.57 1.60 38.76 30.10 9.97 145.81 135.842011 100.00 13.95 43.42 7.63 -7.11 -30.00 86.05 78.42 -7.632012 100.00 28.64 48.06 16.02 -29.61 -5.83 71.84 14.56 -57.282013 100.00 85.45 58.18 -5.45 53.64 -20.91 14.55 111.82 97.272014 100.00 84.08 46.27 13.43 11.44 12.94 16.17 101.24 85.072015 100.00 211.11 172.84 -2.47 44.44 -3.70 112.35- 32.10- 80.252016 100.00 122.52 81.46 33.11 32.45 -24.50 23.18- 82.12 105.302017 100.00 35.39 43.51 -2.92 -0.65 -4.55 64.94 151.30 86.362018 100.00 106.46 40.30 19.39 19.39 27.38 6.46- 92.40 98.86
Source: See Table 3-1.
(1) Because the 2001 and 2009 economic growth rates were negative, no meaningful value can be attributed to the contribution of these sources of growth.
3-10a. Sources of Economic Growth: Expenditure Side(Contribution to Economic Growth Rate)
Period
EconomicGrowth Rate(Increase inReal GDP)
Domestic Demand Net Exports
Subtotal PrivateConsumption
GovernmentConsumption
Gross FixedCapital
Formation
Increase inInventory
SubtotalExports ofGoods &Services
Less: Importsof Goods &
Services
Unit: %�
69
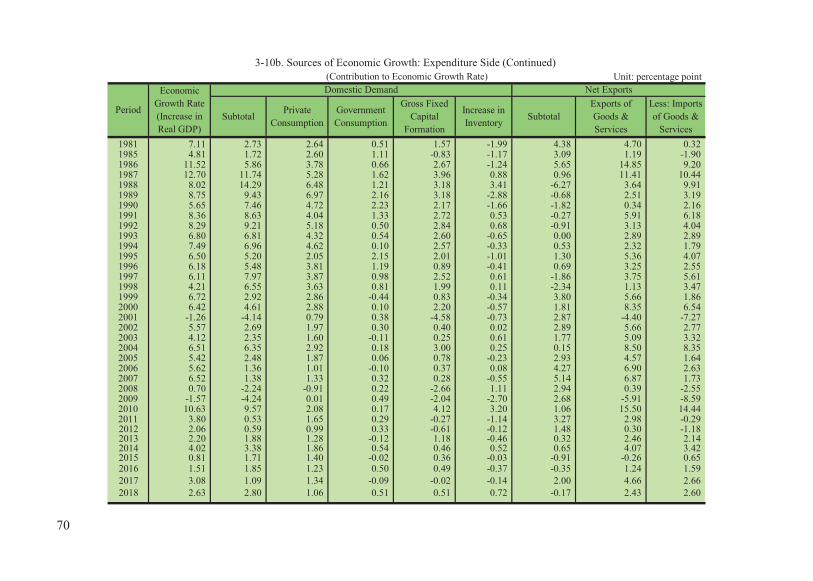
1981 7.11 2.73 2.64 0.51 1.57 -1.99 4.38 4.70 0.321985 4.81 1.72 2.60 1.11 -0.83 -1.17 3.09 1.19 -1.901986 11.52 5.86 3.78 0.66 2.67 -1.24 5.65 14.85 9.201987 12.70 11.74 5.28 1.62 3.96 0.88 0.96 11.41 10.441988 8.02 14.29 6.48 1.21 3.18 3.41 -6.27 3.64 9.911989 8.75 9.43 6.97 2.16 3.18 -2.88 -0.68 2.51 3.191990 5.65 7.46 4.72 2.23 2.17 -1.66 -1.82 0.34 2.161991 8.36 8.63 4.04 1.33 2.72 0.53 -0.27 5.91 6.181992 8.29 9.21 5.18 0.50 2.84 0.68 -0.91 3.13 4.041993 6.80 6.81 4.32 0.54 2.60 -0.65 0.00 2.89 2.891994 7.49 6.96 4.62 0.10 2.57 -0.33 0.53 2.32 1.791995 6.50 5.20 2.05 2.15 2.01 -1.01 1.30 5.36 4.071996 6.18 5.48 3.81 1.19 0.89 -0.41 0.69 3.25 2.551997 6.11 7.97 3.87 0.98 2.52 0.61 -1.86 3.75 5.611998 4.21 6.55 3.63 0.81 1.99 0.11 -2.34 1.13 3.471999 6.72 2.92 2.86 -0.44 0.83 -0.34 3.80 5.66 1.862000 6.42 4.61 2.88 0.10 2.20 -0.57 1.81 8.35 6.542001 -1.26 -4.14 0.79 0.38 -4.58 -0.73 2.87 -4.40 -7.272002 5.57 2.69 1.97 0.30 0.40 0.02 2.89 5.66 2.772003 4.12 2.35 1.60 -0.11 0.25 0.61 1.77 5.09 3.322004 6.51 6.35 2.92 0.18 3.00 0.25 0.15 8.50 8.352005 5.42 2.48 1.87 0.06 0.78 -0.23 2.93 4.57 1.642006 5.62 1.36 1.01 -0.10 0.37 0.08 4.27 6.90 2.632007 6.52 1.38 1.33 0.32 0.28 -0.55 5.14 6.87 1.732008 0.70 -2.24 -0.91 0.22 -2.66 1.11 2.94 0.39 -2.552009 -1.57 -4.24 0.01 0.49 -2.04 -2.70 2.68 -5.91 -8.592010 10.63 9.57 2.08 0.17 4.12 3.20 1.06 15.50 14.442011 3.80 0.53 1.65 0.29 -0.27 -1.14 3.27 2.98 -0.292012 2.06 0.59 0.99 0.33 -0.61 -0.12 1.48 0.30 -1.182013 2.20 1.88 1.28 -0.12 1.18 -0.46 0.32 2.46 2.142014 4.02 3.38 1.86 0.54 0.46 0.52 0.65 4.07 3.422015 0.81 1.71 1.40 -0.02 0.36 -0.03 -0.91 -0.26 0.652016 1.51 1.85 1.23 0.50 0.49 -0.37 -0.35 1.24 1.592017 3.08 1.09 1.34 -0.09 -0.02 -0.14 2.00 4.66 2.662018 2.63 2.80 1.06 0.51 0.51 0.72 -0.17 2.43 2.60
Exports ofGoods &Services
Less: Importsof Goods &
Services
3-10b. Sources of Economic Growth: Expenditure Side (Continued) (Contribution to Economic Growth Rate)
Period
Domestic Demand Net Exports
Subtotal PrivateConsumption
GovernmentConsumption Subtotal
EconomicGrowth Rate(Increase inReal GDP)
Gross FixedCapital
Formation
Increase inInventory
Unit: percentage point�
70

Total PrivateSector
PublicEnterprises
Govern-ment Subtotal Private
SectorPublic
EnterprisesGovern-
ment Subtotal PrivateSector
PublicEnterprises
1989 1,029,656 634,147 188,374 207,135 992,183 604,848 180,200 207,135 37,473 29,299 8,1741990 1,142,092 614,474 260,529 267,089 1,111,414 596,781 247,544 267,089 30,678 17,693 12,9851991 1,303,548 697,062 268,787 337,699 1,239,534 630,419 271,416 337,699 64,014 66,643 -2,6291992 1,583,571 902,225 279,096 402,250 1,491,975 814,077 275,648 402,250 91,596 88,148 3,4481993 1,778,885 1,043,158 253,998 481,729 1,715,984 972,454 261,801 481,729 62,901 70,704 -7,8031994 1,898,164 1,121,120 245,269 531,775 1,843,656 1,075,142 236,739 531,775 54,508 45,978 8,5301995 2,072,405 1,267,199 249,748 555,458 2,027,897 1,227,481 244,958 555,458 44,508 39,718 4,7901996 2,043,855 1,263,281 229,807 550,767 2,033,277 1,255,230 227,280 550,767 10,578 8,051 2,5271997 2,317,181 1,537,905 222,783 556,493 2,231,680 1,458,964 216,223 556,493 85,501 78,941 6,5601998 2,571,393 1,791,608 212,400 567,385 2,482,879 1,680,387 235,107 567,385 88,514 111,221 -22,7071999 2,598,205 1,731,073 280,119 587,013 2,540,878 1,692,572 261,293 587,013 57,327 38,501 18,8262000 2,815,099 1,999,020 252,606 563,473 2,722,595 1,912,030 247,092 563,473 92,504 86,990 5,5142001 2,175,715 1,423,405 237,244 515,066 2,238,591 1,476,445 247,080 515,066 -62,876 -53,040 -9,8362002 2,241,850 1,521,444 247,883 472,523 2,285,679 1,574,934 238,222 472,523 -43,829 -53,490 9,6612003 2,377,923 1,678,715 222,717 476,491 2,365,673 1,657,638 231,544 476,491 12,250 21,077 -8,8272004 2,954,277 2,271,096 198,564 484,617 2,853,709 2,175,729 193,363 484,617 100,568 95,367 5,2012005 2,957,842 2,238,248 220,895 498,699 2,924,286 2,211,671 213,916 498,699 33,556 26,577 6,9792006 3,110,995 2,405,674 223,078 482,243 3,063,352 2,380,410 200,699 482,243 47,643 25,264 22,3792007 3,221,482 2,503,013 224,503 493,966 3,205,121 2,501,225 209,930 493,966 16,361 1,788 14,5732008 3,217,027 2,434,141 239,402 543,484 3,045,433 2,284,331 217,618 543,484 171,594 149,810 21,7842009 2,580,249 1,737,304 248,171 594,774 2,761,737 1,935,945 231,018 594,774 -181,488 -198,641 17,1532010 3,524,645 2,691,655 243,932 589,058 3,335,881 2,496,978 249,845 589,058 188,764 194,677 -5,9132011 3,382,866 2,592,967 221,343 568,556 3,346,945 2,558,491 219,898 568,556 35,921 34,476 1,4452012 3,304,160 2,563,432 229,752 510,976 3,282,131 2,567,030 204,125 510,976 22,029 -3,598 25,6272013 3,360,196 2,683,641 184,095 492,460 3,378,731 2,685,854 200,417 492,460 -18,535 -2,213 -16,3222014 3,521,157 2,837,572 221,415 462,170 3,493,834 2,820,686 210,978 462,170 27,323 16,886 10,4372015 3,513,112 2,896,213 177,909 438,990 3,493,267 2,863,172 191,105 438,990 19,845 33,041 -13,1962016 3,562,189 2,941,488 177,260 443,441 3,589,298 2,960,295 185,562 443,441 -27,109 -18,807 -8,3022017 3,543,176 2,869,378 199,878 473,920 3,584,358 2,927,444 182,994 473,920 -41,182 -58,066 16,8842018 3,793,979 … … … 3,743,897 3,034,432 211,555 497,910 50,082 … …
Source: See Table 3-1.
Gross Fixed Capital Formation
I. Amount (NT$ million)
3-11a. Composition of Gross Capital Formation by Owner
PeriodGross Capital Formation Increase in Inventory
71
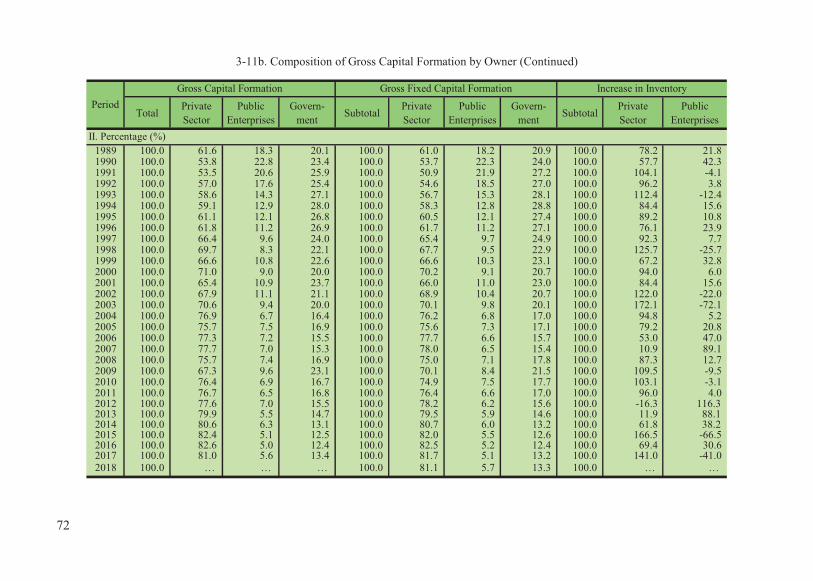
TotalPrivateSector
PublicEnterprises
Govern-ment Subtotal
PrivateSector
PublicEnterprises
Govern-ment Subtotal
PrivateSector
PublicEnterprises
1989 100.0 61.6 18.3 20.1 100.0 61.0 18.2 20.9 100.0 78.2 21.81990 100.0 53.8 22.8 23.4 100.0 53.7 22.3 24.0 100.0 57.7 42.31991 100.0 53.5 20.6 25.9 100.0 50.9 21.9 27.2 100.0 104.1 -4.11992 100.0 57.0 17.6 25.4 100.0 54.6 18.5 27.0 100.0 96.2 3.81993 100.0 58.6 14.3 27.1 100.0 56.7 15.3 28.1 100.0 112.4 -12.41994 100.0 59.1 12.9 28.0 100.0 58.3 12.8 28.8 100.0 84.4 15.61995 100.0 61.1 12.1 26.8 100.0 60.5 12.1 27.4 100.0 89.2 10.81996 100.0 61.8 11.2 26.9 100.0 61.7 11.2 27.1 100.0 76.1 23.91997 100.0 66.4 9.6 24.0 100.0 65.4 9.7 24.9 100.0 92.3 7.71998 100.0 69.7 8.3 22.1 100.0 67.7 9.5 22.9 100.0 125.7 -25.71999 100.0 66.6 10.8 22.6 100.0 66.6 10.3 23.1 100.0 67.2 32.82000 100.0 71.0 9.0 20.0 100.0 70.2 9.1 20.7 100.0 94.0 6.02001 100.0 65.4 10.9 23.7 100.0 66.0 11.0 23.0 100.0 84.4 15.62002 100.0 67.9 11.1 21.1 100.0 68.9 10.4 20.7 100.0 122.0 -22.02003 100.0 70.6 9.4 20.0 100.0 70.1 9.8 20.1 100.0 172.1 -72.12004 100.0 76.9 6.7 16.4 100.0 76.2 6.8 17.0 100.0 94.8 5.22005 100.0 75.7 7.5 16.9 100.0 75.6 7.3 17.1 100.0 79.2 20.82006 100.0 77.3 7.2 15.5 100.0 77.7 6.6 15.7 100.0 53.0 47.02007 100.0 77.7 7.0 15.3 100.0 78.0 6.5 15.4 100.0 10.9 89.12008 100.0 75.7 7.4 16.9 100.0 75.0 7.1 17.8 100.0 87.3 12.72009 100.0 67.3 9.6 23.1 100.0 70.1 8.4 21.5 100.0 109.5 -9.52010 100.0 76.4 6.9 16.7 100.0 74.9 7.5 17.7 100.0 103.1 -3.12011 100.0 76.7 6.5 16.8 100.0 76.4 6.6 17.0 100.0 96.0 4.02012 100.0 77.6 7.0 15.5 100.0 78.2 6.2 15.6 100.0 -16.3 116.3 2013 100.0 79.9 5.5 14.7 100.0 79.5 5.9 14.6 100.0 11.9 88.1 2014 100.0 80.6 6.3 13.1 100.0 80.7 6.0 13.2 100.0 61.8 38.2 2015 100.0 82.4 5.1 12.5 100.0 82.0 5.5 12.6 100.0 166.5 -66.52016 100.0 82.6 5.0 12.4 100.0 82.5 5.2 12.4 100.0 69.4 30.62017 100.0 81.0 5.6 13.4 100.0 81.7 5.1 13.2 100.0 141.0 -41.02018 100.0 … … … 100.0 81.1 5.7 13.3 100.0 … …
II. Percentage (%)
3-11b. Composition of Gross Capital Formation by Owner (Continued)
PeriodGross Capital Formation Gross Fixed Capital Formation Increase in Inventory
72

3-12a. Composition of Fixed Capital Formation by Industry
Subtotal Mining Manufac-turing
Electricity& Gas
Water Supply&
RemediationServices
Construc-tion
Subtotal TradeTransport-
ation &Storage
I. Amount (NT$ million)1981 512,978 15,039 236,826 4,161 149,828 71,837 60 10,940 261,113 22,902 27,6581985 529,967 12,735 200,287 3,532 136,575 47,420 4,944 7,816 316,945 27,465 34,0161990 1,111,414 24,219 409,179 5,161 290,685 89,575 8,751 15,007 678,016 51,069 52,6721995 2,027,897 24,181 755,698 4,661 599,962 109,231 19,427 22,417 1,248,018 110,418 91,9591996 2,033,277 27,542 769,975 4,342 624,315 109,588 12,334 19,396 1,235,760 111,902 80,6431997 2,231,680 26,637 898,108 3,906 743,470 118,936 11,195 20,601 1,306,935 117,952 116,3211998 2,482,879 22,662 998,603 4,369 816,657 141,078 12,589 23,910 1,461,614 129,809 136,4821999 2,540,878 26,501 1,087,174 4,225 885,415 159,778 14,899 22,857 1,427,203 120,518 109,1392000 2,722,595 16,048 1,317,471 3,908 1,134,589 142,621 12,463 23,890 1,389,076 122,910 116,4542001 2,238,591 17,867 977,710 2,957 811,028 131,731 12,260 19,734 1,243,014 107,226 126,3562002 2,285,679 16,086 1,001,985 2,505 839,757 124,770 14,247 20,706 1,267,608 115,587 144,1062003 2,365,673 16,656 1,078,871 2,608 912,871 130,605 13,417 19,370 1,270,146 128,097 158,6422004 2,853,709 13,077 1,423,915 1,900 1,264,882 124,767 10,962 21,404 1,416,717 159,428 199,7842005 2,924,286 16,986 1,456,908 2,318 1,276,000 143,167 12,579 22,844 1,450,392 171,703 210,5562006 3,063,352 13,640 1,606,957 2,336 1,419,939 146,327 14,161 24,194 1,442,755 182,999 156,6152007 3,205,121 8,070 1,739,080 2,697 1,545,012 150,024 14,958 26,389 1,457,971 181,807 146,9252008 3,045,433 9,705 1,565,776 2,506 1,359,359 161,200 16,842 25,869 1,469,952 189,947 83,2032009 2,761,737 11,032 1,299,602 2,531 1,099,424 150,172 22,637 24,838 1,451,103 184,456 82,5122010 3,335,881 15,553 1,753,844 2,535 1,546,034 154,589 23,945 26,741 1,566,484 190,884 108,4152011 3,346,945 8,896 1,679,540 2,468 1,505,322 128,135 19,506 24,109 1,658,509 182,095 114,2662012 3,282,131 16,739 1,595,007 2,390 1,429,644 118,205 20,223 24,545 1,670,385 174,237 112,5382013 3,378,731 24,028 1,680,778 3,550 1,512,792 121,563 17,492 25,381 1,673,925 181,163 125,3842014 3,493,834 24,797 1,721,413 2,430 1,542,599 125,458 24,658 26,268 1,747,624 195,468 150,5942015 3,493,267 20,655 1,738,364 3,163 1,574,093 109,446 24,449 27,213 1,734,248 204,747 157,0622016 3,589,298 18,576 1,842,152 3,114 1,688,221 99,847 23,979 26,991 1,728,570 208,467 160,5472017 3,584,358 21,078 1,775,905 3,017 1,619,351 101,844 24,060 27,633 1,787,375 194,822 165,479
Source: See Table 3-1.
Period Total Agriculture
Industry
73
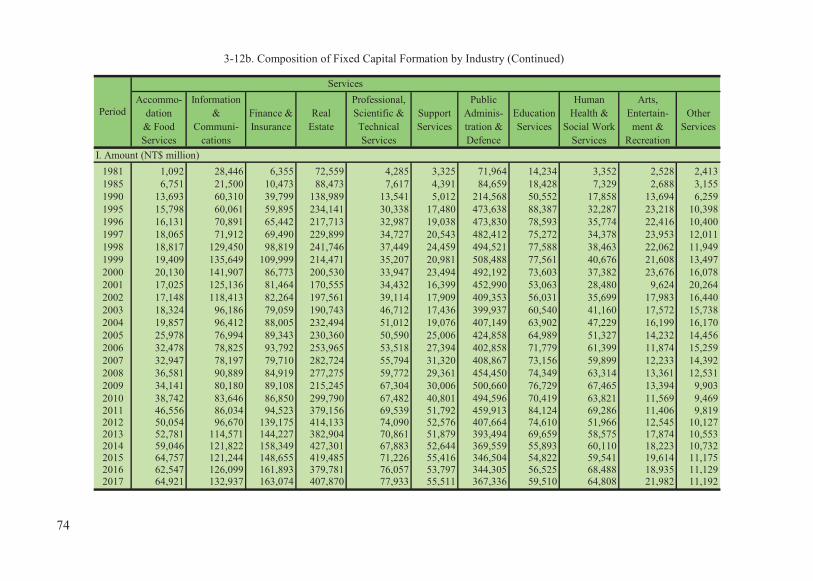
3-12b. Composition of Fixed Capital Formation by Industry (Continued)
Accommo-dation
& FoodServices
Information&
Communi-cations
Finance &Insurance
RealEstate
Professional,Scientific &TechnicalServices
SupportServices
PublicAdminis-tration &Defence
EducationServices
HumanHealth &
Social WorkServices
Arts,Entertain-ment &
Recreation
OtherServices
I. Amount (NT$ million)1981 1,092 28,446 6,355 72,559 4,285 3,325 71,964 14,234 3,352 2,528 2,4131985 6,751 21,500 10,473 88,473 7,617 4,391 84,659 18,428 7,329 2,688 3,1551990 13,693 60,310 39,799 138,989 13,541 5,012 214,568 50,552 17,858 13,694 6,2591995 15,798 60,061 59,895 234,141 30,338 17,480 473,638 88,387 32,287 23,218 10,3981996 16,131 70,891 65,442 217,713 32,987 19,038 473,830 78,593 35,774 22,416 10,4001997 18,065 71,912 69,490 229,899 34,727 20,543 482,412 75,272 34,378 23,953 12,0111998 18,817 129,450 98,819 241,746 37,449 24,459 494,521 77,588 38,463 22,062 11,9491999 19,409 135,649 109,999 214,471 35,207 20,981 508,488 77,561 40,676 21,608 13,4972000 20,130 141,907 86,773 200,530 33,947 23,494 492,192 73,603 37,382 23,676 16,0782001 17,025 125,136 81,464 170,555 34,432 16,399 452,990 53,063 28,480 9,624 20,2642002 17,148 118,413 82,264 197,561 39,114 17,909 409,353 56,031 35,699 17,983 16,4402003 18,324 96,186 79,059 190,743 46,712 17,436 399,937 60,540 41,160 17,572 15,7382004 19,857 96,412 88,005 232,494 51,012 19,076 407,149 63,902 47,229 16,199 16,1702005 25,978 76,994 89,343 230,360 50,590 25,006 424,858 64,989 51,327 14,232 14,4562006 32,478 78,825 93,792 253,965 53,518 27,394 402,858 71,779 61,399 11,874 15,2592007 32,947 78,197 79,710 282,724 55,794 31,320 408,867 73,156 59,899 12,233 14,3922008 36,581 90,889 84,919 277,275 59,772 29,361 454,450 74,349 63,314 13,361 12,5312009 34,141 80,180 89,108 215,245 67,304 30,006 500,660 76,729 67,465 13,394 9,9032010 38,742 83,646 86,850 299,790 67,482 40,801 494,596 70,419 63,821 11,569 9,4692011 46,556 86,034 94,523 379,156 69,539 51,792 459,913 84,124 69,286 11,406 9,8192012 50,054 96,670 139,175 414,133 74,090 52,576 407,664 74,610 51,966 12,545 10,1272013 52,781 114,571 144,227 382,904 70,861 51,879 393,494 69,659 58,575 17,874 10,5532014 59,046 121,822 158,349 427,301 67,883 52,644 369,559 55,893 60,110 18,223 10,7322015 64,757 121,244 148,655 419,485 71,226 55,416 346,504 54,822 59,541 19,614 11,1752016 62,547 126,099 161,893 379,781 76,057 53,797 344,305 56,525 68,488 18,935 11,1292017 64,921 132,937 163,074 407,870 77,933 55,511 367,336 59,510 64,808 21,982 11,192
Period
Services
74

3-12c. Composition of Fixed Capital Formation by Industry (Continued)
Subtotal Mining Manufac-turing
Electricity& Gas
Water Supply&
RemediationServices
Construc-tion Subtotal Trade
Transport-ation &Storage
II. Percentage (%)1981 100.0 2.9 46.2 0.8 29.2 14.0 0.0 2.1 50.9 4.5 5.41985 100.0 2.4 37.8 0.7 25.8 8.9 0.9 1.5 59.8 5.2 6.41990 100.0 2.2 36.8 0.5 26.2 8.1 0.8 1.4 61.0 4.6 4.71995 100.0 1.2 37.3 0.2 29.6 5.4 1.0 1.1 61.5 5.4 4.51996 100.0 1.4 37.9 0.2 30.7 5.4 0.6 1.0 60.8 5.5 4.01997 100.0 1.2 40.2 0.2 33.3 5.3 0.5 0.9 58.6 5.3 5.21998 100.0 0.9 40.2 0.2 32.9 5.7 0.5 1.0 58.9 5.2 5.51999 100.0 1.0 42.8 0.2 34.8 6.3 0.6 0.9 56.2 4.7 4.32000 100.0 0.6 48.4 0.1 41.7 5.2 0.5 0.9 51.0 4.5 4.32001 100.0 0.8 43.7 0.1 36.2 5.9 0.5 0.9 55.5 4.8 5.62002 100.0 0.7 43.8 0.1 36.7 5.5 0.6 0.9 55.5 5.1 6.32003 100.0 0.7 45.6 0.1 38.6 5.5 0.6 0.8 53.7 5.4 6.72004 100.0 0.5 49.9 0.1 44.3 4.4 0.4 0.8 49.6 5.6 7.02005 100.0 0.6 49.8 0.1 43.6 4.9 0.4 0.8 49.6 5.9 7.22006 100.0 0.4 52.5 0.1 46.4 4.8 0.5 0.8 47.1 6.0 5.12007 100.0 0.3 54.3 0.1 48.2 4.7 0.5 0.8 45.5 5.7 4.62008 100.0 0.3 51.4 0.1 44.6 5.3 0.6 0.8 48.3 6.2 2.72009 100.0 0.4 47.1 0.1 39.8 5.4 0.8 0.9 52.5 6.7 3.02010 100.0 0.5 52.6 0.1 46.3 4.6 0.7 0.8 47.0 5.7 3.22011 100.0 0.3 50.2 0.1 45.0 3.8 0.6 0.7 49.6 5.4 3.42012 100.0 0.5 48.6 0.1 43.6 3.6 0.6 0.7 50.9 5.3 3.42013 100.0 0.7 49.7 0.1 44.8 3.6 0.5 0.8 49.5 5.4 3.72014 100.0 0.7 49.3 0.1 44.2 3.6 0.7 0.8 50.0 5.6 4.32015 100.0 0.6 49.8 0.1 45.1 3.1 0.7 0.8 49.6 5.9 4.52016 100.0 0.5 51.3 0.1 47.0 2.8 0.7 0.8 48.2 5.8 4.52017 100.0 0.6 49.5 0.1 45.2 2.8 0.7 0.8 49.9 5.4 4.6
Period Total Agriculture
Industry
75

3-12d. Composition of Fixed Capital Formation by Industry (Continued)
Accommo-dation
& FoodServices
Information &Communi-
cations
Finance &Insurance Real Estate
Professional,Scientific &TechnicalServices
SupportServices
PublicAdminis-tration &Defence
EducationServices
HumanHealth &
Social WorkServices
Arts,Entertain-
ment &Recreation
OtherServices
II. Percentage (%)1981 0.2 5.5 1.2 14.1 0.8 0.6 14.0 2.8 0.7 0.5 0.51985 1.3 4.1 2.0 16.7 1.4 0.8 16.0 3.5 1.4 0.5 0.61990 1.2 5.4 3.6 12.5 1.2 0.5 19.3 4.5 1.6 1.2 0.61995 0.8 3.0 3.0 11.5 1.5 0.9 23.4 4.4 1.6 1.1 0.51996 0.8 3.5 3.2 10.7 1.6 0.9 23.3 3.9 1.8 1.1 0.51997 0.8 3.2 3.1 10.3 1.6 0.9 21.6 3.4 1.5 1.1 0.51998 0.8 5.2 4.0 9.7 1.5 1.0 19.9 3.1 1.5 0.9 0.51999 0.8 5.3 4.3 8.4 1.4 0.8 20.0 3.1 1.6 0.9 0.52000 0.7 5.2 3.2 7.4 1.2 0.9 18.1 2.7 1.4 0.9 0.62001 0.8 5.6 3.6 7.6 1.5 0.7 20.2 2.4 1.3 0.4 0.92002 0.8 5.2 3.6 8.6 1.7 0.8 17.9 2.5 1.6 0.8 0.72003 0.8 4.1 3.3 8.1 2.0 0.7 16.9 2.6 1.7 0.7 0.72004 0.7 3.4 3.1 8.1 1.8 0.7 14.3 2.2 1.7 0.6 0.62005 0.9 2.6 3.1 7.9 1.7 0.9 14.5 2.2 1.8 0.5 0.52006 1.1 2.6 3.1 8.3 1.7 0.9 13.2 2.3 2.0 0.4 0.52007 1.0 2.4 2.5 8.8 1.7 1.0 12.8 2.3 1.9 0.4 0.42008 1.2 3.0 2.8 9.1 2.0 1.0 14.9 2.4 2.1 0.4 0.42009 1.2 2.9 3.2 7.8 2.4 1.1 18.1 2.8 2.4 0.5 0.42010 1.2 2.5 2.6 9.0 2.0 1.2 14.8 2.1 1.9 0.3 0.32011 1.4 2.6 2.8 11.3 2.1 1.5 13.7 2.5 2.1 0.3 0.32012 1.5 2.9 4.2 12.6 2.3 1.6 12.4 2.3 1.6 0.4 0.32013 1.6 3.4 4.3 11.3 2.1 1.5 11.6 2.1 1.7 0.5 0.32014 1.7 3.5 4.5 12.2 1.9 1.5 10.6 1.6 1.7 0.5 0.32015 1.9 3.5 4.3 12.0 2.0 1.6 9.9 1.6 1.7 0.6 0.32016 1.7 3.5 4.5 10.6 2.1 1.5 9.6 1.6 1.9 0.5 0.32017 1.8 3.7 4.5 11.4 2.2 1.5 10.2 1.7 1.8 0.6 0.3
Period
Services
76
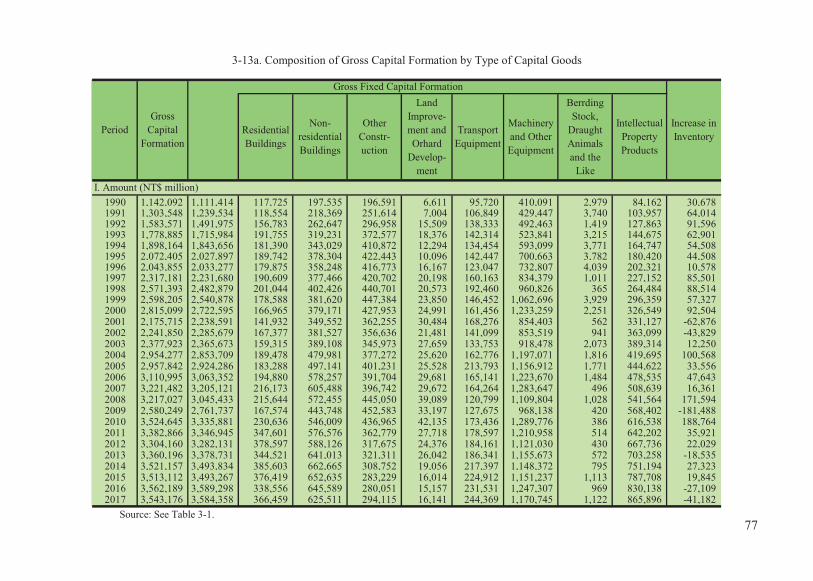
1990 1,142,092 1,111,414 117,725 197,535 196,591 6,611 95,720 410,091 2,979 84,162 30,6781991 1,303,548 1,239,534 118,554 218,369 251,614 7,004 106,849 429,447 3,740 103,957 64,0141992 1,583,571 1,491,975 156,783 262,647 296,958 15,509 138,333 492,463 1,419 127,863 91,5961993 1,778,885 1,715,984 191,755 319,231 372,577 18,376 142,314 523,841 3,215 144,675 62,9011994 1,898,164 1,843,656 181,390 343,029 410,872 12,294 134,454 593,099 3,771 164,747 54,5081995 2,072,405 2,027,897 189,742 378,304 422,443 10,096 142,447 700,663 3,782 180,420 44,5081996 2,043,855 2,033,277 179,875 358,248 416,773 16,167 123,047 732,807 4,039 202,321 10,5781997 2,317,181 2,231,680 190,609 377,466 420,702 20,198 160,163 834,379 1,011 227,152 85,5011998 2,571,393 2,482,879 201,044 402,426 440,701 20,573 192,460 960,826 365 264,484 88,5141999 2,598,205 2,540,878 178,588 381,620 447,384 23,850 146,452 1,062,696 3,929 296,359 57,3272000 2,815,099 2,722,595 166,965 379,171 427,953 24,991 161,456 1,233,259 2,251 326,549 92,5042001 2,175,715 2,238,591 141,932 349,552 362,255 30,484 168,276 854,403 562 331,127 -62,8762002 2,241,850 2,285,679 167,377 381,527 356,636 21,481 141,099 853,519 941 363,099 -43,8292003 2,377,923 2,365,673 159,315 389,108 345,973 27,659 133,753 918,478 2,073 389,314 12,2502004 2,954,277 2,853,709 189,478 479,981 377,272 25,620 162,776 1,197,071 1,816 419,695 100,5682005 2,957,842 2,924,286 183,288 497,141 401,231 25,528 213,793 1,156,912 1,771 444,622 33,5562006 3,110,995 3,063,352 194,880 578,257 391,704 29,681 165,141 1,223,670 1,484 478,535 47,6432007 3,221,482 3,205,121 216,173 605,488 396,742 29,672 164,264 1,283,647 496 508,639 16,3612008 3,217,027 3,045,433 215,644 572,455 445,050 39,089 120,799 1,109,804 1,028 541,564 171,5942009 2,580,249 2,761,737 167,574 443,748 452,583 33,197 127,675 968,138 420 568,402 -181,4882010 3,524,645 3,335,881 230,636 546,009 436,965 42,135 173,436 1,289,776 386 616,538 188,7642011 3,382,866 3,346,945 347,601 576,576 362,779 27,718 178,597 1,210,958 514 642,202 35,9212012 3,304,160 3,282,131 378,597 588,126 317,675 24,376 184,161 1,121,030 430 667,736 22,0292013 3,360,196 3,378,731 344,521 641,013 321,311 26,042 186,341 1,155,673 572 703,258 -18,5352014 3,521,157 3,493,834 385,603 662,665 308,752 19,056 217,397 1,148,372 795 751,194 27,3232015 3,513,112 3,493,267 376,419 652,635 283,229 16,014 224,912 1,151,237 1,113 787,708 19,8452016 3,562,189 3,589,298 338,556 645,589 280,051 15,157 231,531 1,247,307 969 830,138 -27,1092017 3,543,176 3,584,358 366,459 625,511 294,115 16,141 244,369 1,170,745 1,122 865,896 -41,182
Source: See Table 3-1.
3-13a. Composition of Gross Capital Formation by Type of Capital Goods
Increase inInventory
I. Amount (NT$ million)
PeriodGross
CapitalFormation
IntellectualPropertyProducts
Machineryand OtherEquipment
OtherConstr-uction
Non-residentialBuildings
ResidentialBuildings
TransportEquipment
Gross Fixed Capital FormationLand
Improve-ment andOrhard
Develop-ment
BerrdingStock,
DraughtAnimalsand the
Like
77

1990 100.0 97.3 10.3 17.3 17.2 0.6 8.4 35.9 0.3 7.4 2.71991 100.0 95.1 9.1 16.8 19.3 0.5 8.2 32.9 0.3 8.0 4.91992 100.0 94.2 9.9 16.6 18.8 1.0 8.7 31.1 0.1 8.1 5.81993 100.0 96.5 10.8 17.9 20.9 1.0 8.0 29.4 0.2 8.1 3.51994 100.0 97.1 9.6 18.1 21.6 0.6 7.1 31.2 0.2 8.7 2.91995 100.0 97.9 9.2 18.3 20.4 0.5 6.9 33.8 0.2 8.7 2.11996 100.0 99.5 8.8 17.5 20.4 0.8 6.0 35.9 0.2 9.9 0.51997 100.0 96.3 8.2 16.3 18.2 0.9 6.9 36.0 0.0 9.8 3.71998 100.0 96.6 7.8 15.7 17.1 0.8 7.5 37.4 0.0 10.3 3.41999 100.0 97.8 6.9 14.7 17.2 0.9 5.6 40.9 0.2 11.4 2.22000 100.0 96.7 5.9 13.5 15.2 0.9 5.7 43.8 0.1 11.6 3.32001 100.0 102.9 6.5 16.1 16.6 1.4 7.7 39.3 0.0 15.2 -2.92002 100.0 102.0 7.5 17.0 15.9 1.0 6.3 38.1 0.0 16.2 -2.02003 100.0 99.5 6.7 16.4 14.5 1.2 5.6 38.6 0.1 16.4 0.52004 100.0 96.6 6.4 16.2 12.8 0.9 5.5 40.5 0.1 14.2 3.42005 100.0 98.9 6.2 16.8 13.6 0.9 7.2 39.1 0.1 15.0 1.12006 100.0 98.5 6.3 18.6 12.6 1.0 5.3 39.3 0.0 15.4 1.52007 100.0 99.5 6.7 18.8 12.3 5.1 39.8 0.0 15.8 0.52008 100.0 94.7 6.7 17.8 13.8 1.2 3.8 34.5 0.0 16.8 5.32009 100.0 107.0 6.5 17.2 17.5 1.3 4.9 37.5 0.0 22.0 -7.02010 100.0 94.6 6.5 15.5 12.4 1.2 4.9 36.6 0.0 17.5 5.42011 100.0 98.9 10.3 17.0 10.7 0.8 5.3 35.8 0.0 19.0 1.12012 100.0 99.3 11.5 17.8 9.6 0.7 5.6 33.9 0.0 20.2 0.72013 100.0 100.6 10.3 19.1 9.6 0.8 5.5 34.4 0.0 20.9 -0.62014 100.0 99.2 11.0 18.8 8.8 0.5 6.2 32.6 0.0 21.3 0.82015 100.0 99.2 11.0 18.8 8.8 0.5 6.2 32.6 0.0 21.3 0.82016 100.0 99.4 10.7 18.6 8.1 0.5 6.4 32.8 0.0 22.4 0.62017 100.0 100.8 9.5 18.1 7.9 0.4 6.5 35.0 0.0 23.3 -0.8
3-13b. Composition of Gross Capital Formation by Type of Capital Goods (Continued)
Increase inInven-
tory
BerrdingStock,
DraughtAnimalsand the
Like
IntellectualPropertyProducts
II. Percentage (%)
PeriodGross
CapitalFormation
Machineryand OtherEquipment
TransportEquipment
OtherConstr-uction
Non-residentialBuildings
ResidentialBuildings
LandImprove-ment andOrhard
Develop-ment
Gross Fixed Capital Formation
78

1998 2,571,393 2,674,598 847,822 203,324 1,406,820 216,632 -6,059 -98,918 0 1,7721999 2,598,205 2,855,335 929,866 218,545 1,713,499 -6,575 -5,590 -239,159 0 -12,3812000 2,815,099 3,105,474 1,017,589 230,001 1,790,732 67,152 -8,955 -255,091 0 -26,3292001 2,175,715 2,804,480 1,094,486 239,848 1,686,448 -216,302 -4,118 -623,263 1,384 02002 2,241,850 3,106,201 1,141,797 250,184 1,890,881 -176,661 -3,322 -886,539 1,487 26,9972003 2,377,923 3,415,513 1,211,645 265,071 1,981,409 -42,612 -2,377 -967,522 621 -67,0702004 2,954,277 3,668,542 1,330,991 292,034 2,020,804 24,713 -2,514 -642,781 67 -68,9032005 2,957,842 3,667,630 1,403,741 298,503 1,832,641 132,745 -2,285 -654,188 1,481 -51,8342006 3,110,995 4,022,143 1,517,375 317,760 1,998,100 188,908 -1,792 -907,303 2,053 02007 3,221,482 4,322,467 1,637,047 339,379 2,140,364 205,677 -2,335 -1,270,270 823 172,4432008 3,217,027 3,987,872 1,789,976 375,621 1,826,734 -4,459 -2,010 -898,486 8,479 138,1302009 2,580,249 3,918,237 1,862,177 373,167 1,793,115 -110,222 -1,519 -1,489,795 1,651 154,9772010 3,524,645 4,821,815 1,922,696 387,262 2,510,026 1,831 -2,118 -1,337,969 1,549 44,4662011 3,382,866 4,624,899 2,007,532 402,369 2,045,113 169,885 -2,442 -1,238,532 1,059 02012 3,304,160 4,611,020 2,076,628 408,955 2,177,549 -52,112 -1,750 -1,466,815 712 162,4172013 3,360,196 5,008,844 2,069,093 404,893 2,523,954 10,904 -1,812 -1,713,988 -1,980 65,1722014 3,521,157 5,569,084 2,155,763 410,311 2,882,867 120,143 -2,057 -2,043,018 242 -2,6102015 3,513,112 6,033,122 2,188,601 400,839 3,232,622 211,060 -2,027 -2,576,910 316 59,2432016 3,562,189 6,070,719 2,274,754 398,778 3,090,817 306,370 -1,998 -2,541,352 1,160 35,9802017 3,543,176 6,161,104 2,328,704 404,346 3,248,307 179,747 -3,076 -2,566,335 884 -47,633
Total(1)
Gross National Savings
3-14a. The Finance of Gross Capital Formation
Statis-ticalDiscre-pancy
Corporateand Quasi-Corporate
Enterprises
Net National SavingsGross
CapitalFormation Govern-
ment
Period
Provision for CapitalConsumption
Source: See Table 3-1.
Net CapitalTransfersfrom the
Rest of theWorld
NetBorrowingfrom (+) orLending to (-) Abroad
Govern-ment
I. Amount (NT$ million)
(1) Is not equal to the sum of its components due to statistical discrepancy.
(Less)Purchases of
IntangibleAssets
N.E.C. fromthe Rest ofthe World
Net
PrivateSector
(2)
(2) Refers to the sum of Corporate and Quasi-Corporate Enterprises and households.
79

1998 100.0 104.0 33.0 7.9 54.7 8.4 -0.2 -3.8 0.0 0.11999 100.0 109.9 35.8 8.4 65.9 -0.3 -0.2 -9.2 0.0 -0.52000 100.0 110.3 36.1 8.2 63.6 2.4 -0.3 -9.1 0.0 -0.92001 100.0 128.9 50.3 11.0 77.5 -9.9 -0.2 -28.6 0.1 0.02002 100.0 138.6 50.9 11.2 84.3 -7.9 -0.1 -39.5 0.1 1.22003 100.0 143.6 51.0 11.1 83.3 -1.8 -0.1 -40.7 0.0 -2.82004 100.0 124.2 45.1 9.9 68.4 0.8 -0.1 -21.8 0.0 -2.32005 100.0 124.0 47.5 10.1 62.0 4.5 -0.1 -22.1 0.1 -1.82006 100.0 129.3 48.8 10.2 64.2 6.1 -0.1 -29.2 0.1 0.02007 100.0 134.2 50.8 10.5 66.4 6.4 -0.1 -39.4 0.0 5.42008 100.0 124.0 55.6 11.7 56.8 -0.1 -0.1 -27.9 0.3 4.32009 100.0 151.9 72.2 14.5 69.5 -4.3 -0.1 -57.7 0.1 6.02010 100.0 136.8 54.6 11.0 71.2 0.1 -0.1 -38.0 0.0 1.32011 100.0 136.7 59.3 11.9 60.5 5.0 -0.1 -36.6 0.0 0.02012 100.0 139.6 62.8 12.4 65.9 -1.6 -0.1 -44.4 0.0 4.92013 100.0 149.1 61.6 12.0 75.1 0.3 -0.1 -51.0 -0.1 1.92014 100.0 158.2 61.2 11.7 81.9 3.4 -0.1 -58.0 0.0 -0.12015 100.0 171.7 62.3 11.4 92.0 6.0 -0.1 -73.4 0.0 1.72016 100.0 170.4 63.9 11.2 86.8 8.6 -0.1 -71.3 0.0 1.02017 100.0 173.9 65.7 11.4 91.7 5.1 -0.1 -72.4 0.0 -1.3
(Less)Purchases of
IntangibleAssets
N.E.C. fromthe Rest ofthe World
Net
PrivateSector (2)
3-14b. The Finance of Gross Capital Formation (Continued)
Statis-ticalDiscre-pancy
Net National Savings
Period
Net CapitalTransfersfrom the
Rest of theWorld
NetBorrowingfrom (+) orLending to (-) Abroad
II. Percentage (%)
Corporateand Quasi-Corporate
Enterprises
GrossCapital
Formation
Provision for CapitalConsumption
Total (1)
Gross National Savings
Govern-ment
Govern-ment
80
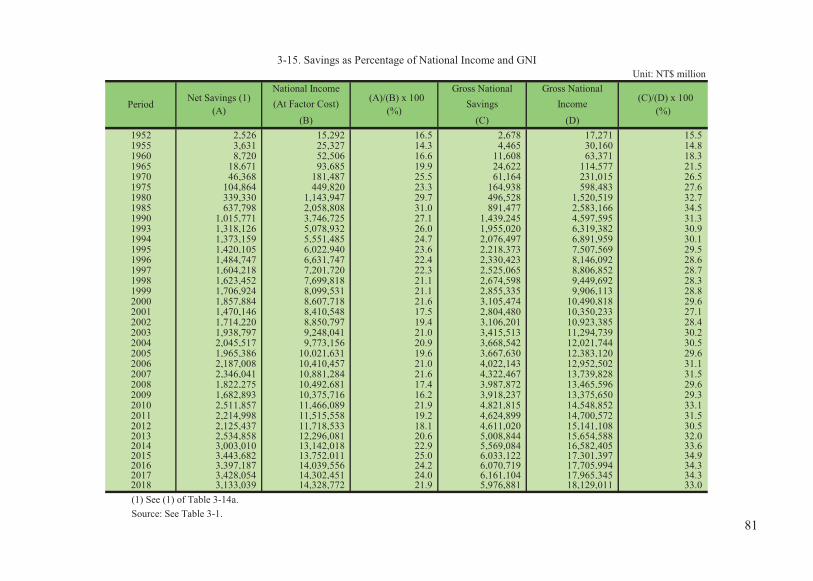
3-15. Savings as Percentage of National Income and GNI
National Income Gross National Gross National(At Factor Cost) Savings Income
(B) (C) (D)1952 2,526 15,292 16.5 2,678 17,271 15.5 1955 3,631 25,327 14.3 4,465 30,160 14.8 1960 8,720 52,506 16.6 11,608 63,371 18.3 1965 18,671 93,685 19.9 24,622 114,577 21.5 1970 46,368 181,487 25.5 61,164 231,015 26.5 1975 104,864 449,820 23.3 164,938 598,483 27.6 1980 339,330 1,143,947 29.7 496,528 1,520,519 32.7 1985 637,798 2,058,808 31.0 891,477 2,583,166 34.5 1990 1,015,771 3,746,725 27.1 1,439,245 4,597,595 31.3 1993 1,318,126 5,078,932 26.0 1,955,020 6,319,382 30.9 1994 1,373,159 5,551,485 24.7 2,076,497 6,891,959 30.1 1995 1,420,105 6,022,940 23.6 2,218,373 7,507,569 29.5 1996 1,484,747 6,631,747 22.4 2,330,423 8,146,092 28.6 1997 1,604,218 7,201,720 22.3 2,525,065 8,806,852 28.7 1998 1,623,452 7,699,818 21.1 2,674,598 9,449,692 28.3 1999 1,706,924 8,099,531 21.1 2,855,335 9,906,113 28.8 2000 1,857,884 8,607,718 21.6 3,105,474 10,490,818 29.6 2001 1,470,146 8,410,548 17.5 2,804,480 10,350,233 27.1 2002 1,714,220 8,850,797 19.4 3,106,201 10,923,385 28.4 2003 1,938,797 9,248,041 21.0 3,415,513 11,294,739 30.2 2004 2,045,517 9,773,156 20.9 3,668,542 12,021,744 30.5 2005 1,965,386 10,021,631 19.6 3,667,630 12,383,120 29.6 2006 2,187,008 10,410,457 21.0 4,022,143 12,952,502 31.1 2007 2,346,041 10,881,284 21.6 4,322,467 13,739,828 31.5 2008 1,822,275 10,492,681 17.4 3,987,872 13,465,596 29.6 2009 1,682,893 10,375,716 16.2 3,918,237 13,375,650 29.3 2010 2,511,857 11,466,089 21.9 4,821,815 14,548,852 33.1 2011 2,214,998 11,515,558 19.2 4,624,899 14,700,572 31.5 2012 2,125,437 11,718,533 18.1 4,611,020 15,141,108 30.5 2013 2,534,858 12,296,081 20.6 5,008,844 15,654,588 32.0 2014 3,003,010 13,142,018 22.9 5,569,084 16,582,405 33.6 2015 3,443,682 13,752,011 25.0 6,033,122 17,301,397 34.9 2016 3,397,187 14,039,556 24.2 6,070,719 17,705,994 34.3 2017 3,428,054 14,302,451 24.0 6,161,104 17,965,345 34.3 2018 3,133,039 14,328,772 21.9 5,976,881 18,129,011 33.0 (1) See (1) of Table 3-14a.Source: See Table 3-1.
Unit: NT$ million
Period Net Savings (1)(A)
(A)/(B) x 100(%)
(C)/(D) x 100(%)
81

2011 2012 2013 2014 2015 2016 2017
A. 14,700,572 15,141,108 15,654,588 16,582,405 17,301,397 17,705,994 17,965,345
Less: Provision for consumption of fixed capital
2,409,901 2,485,583 2,473,986 2,566,074 2,589,440 2,673,532 2,733,050
Net Taxes on Production and Imports 775,113 774,575 819,349 876,923 900,703 956,926 977,477
Statistical discrepancy 0 162,417 65,172 -2,610 59,243 35,980 -47,633
B. National income (at factor cost) 11,515,558 11,718,533 12,296,081 13,142,018 13,752,011 14,039,556 14,302,451
Less: Savings of Corporate andQuasi-Corporate Enterprises
1,074,635 1,108,070 1,597,958 1,586,804 1,903,792 2,058,843 2,066,699
Plus: Other items (1) 515,386 766,067 913,735 834,250 896,747 930,010 1,032,937
C. 10,956,309 11,376,530 11,611,858 12,389,464 12,744,966 12,910,723 13,268,689
Less: Current transfers to rest of the world and residents 1,774,559 1,806,872 1,944,601 2,006,213 2,096,998 2,279,739 2,259,250
Current Taxes on Income, Wealth, etc. 412,296 465,074 492,876 498,447 563,309 564,537 562,759
D. 8,769,454 9,104,584 9,174,381 9,884,804 10,084,659 10,066,447 10,446,680
Less: Consumption expenditure 7,798,976 8,035,105 8,248,385 8,588,741 8,755,829 9,034,473 9,265,072
970,478 1,069,479 925,996 1,296,063 1,328,830 1,031,974 1,181,608
Source: See Table 3-1.
3-16 Household Income, Disposable Income and Net Savings
(1) Other items refers to current transfers from residents and the rest of the world, less business income tax, government net income from property and enterprises, and compulsory fees, fines and penalties.
Unit: NT$ million
Household disposable income
Net savings
Item
Gross national income
Household (personal) income
82

1998 7,326,475 4,496,461 2,137,562 692,452 319,604 898,659 6,108,212 5,116,403 0.84
1999 7,830,681 4,657,766 2,362,763 810,152 333,375 982,945 6,514,361 5,394,295 0.83
2000 8,266,623 4,899,752 2,551,601 815,270 320,561 1,037,544 6,908,518 5,706,268 0.83
2001 8,318,144 4,841,816 2,605,409 870,919 295,432 1,065,316 6,957,396 5,756,645 0.83
2002 8,429,865 4,858,631 2,676,070 895,164 286,464 1,114,245 7,029,156 5,953,938 0.85
2003 8,519,916 5,011,370 2,642,339 866,207 268,276 1,156,040 7,095,600 6,100,329 0.86
2004 8,935,550 5,258,558 2,737,632 939,360 289,392 1,265,675 7,380,483 6,490,958 0.88
2005 9,372,603 5,508,045 2,802,821 1,061,737 377,166 1,368,797 7,626,640 6,784,327 0.89
2006 9,961,909 5,763,949 3,048,069 1,149,891 412,909 1,461,124 8,087,876 6,947,802 0.86
2007 10,367,408 5,932,673 3,205,107 1,229,628 406,721 1,491,182 8,469,505 7,197,916 0.85
2008 10,514,475 6,025,052 3,063,600 1,425,823 436,394 1,517,950 8,560,131 7,260,169 0.85
2009 10,100,756 5,781,000 2,984,994 1,334,762 352,405 1,571,353 8,176,998 7,175,511 0.88
2010 10,616,282 6,166,861 3,115,832 1,333,589 367,987 1,664,481 8,583,814 7,497,682 0.87
2011 10,956,309 6,465,312 3,090,130 1,400,867 412,296 1,774,559 8,769,454 7,798,976 0.89
2012 11,376,530 6,615,543 3,165,725 1,595,262 465,074 1,806,872 9,104,584 8,035,105 0.88
2013 11,611,858 6,724,696 3,183,313 1,703,849 492,876 1,944,601 9,174,381 8,248,385 0.90
2014 12,389,464 7,069,129 3,580,336 1,739,999 498,447 2,006,213 9,884,804 8,588,741 0.87
2015 12,744,966 7,343,262 3,531,566 1,870,138 563,309 2,096,998 10,084,659 8,755,829 0.87
2016 12,910,723 7,516,649 3,487,420 1,906,654 564,537 2,279,739 10,066,447 9,034,473 0.90
2017 13,268,689 7,758,985 3,445,876 2,063,828 562,759 2,259,250 10,446,680 9,265,072 0.89
Source: See Table 3-1.
3-17. Household Income, Disposable Income and Propensity to ConsumeUnit: NT$ million
Period
Household Income
Compensationof EmployeesTotal
Property andEntrepreneurial
Income, Net
TransferReceived
AveragePropensity to
Consume
DirectTaxes
TransferPayment
HouseholdDisposable
Income
ConsumptionExpenditure
83
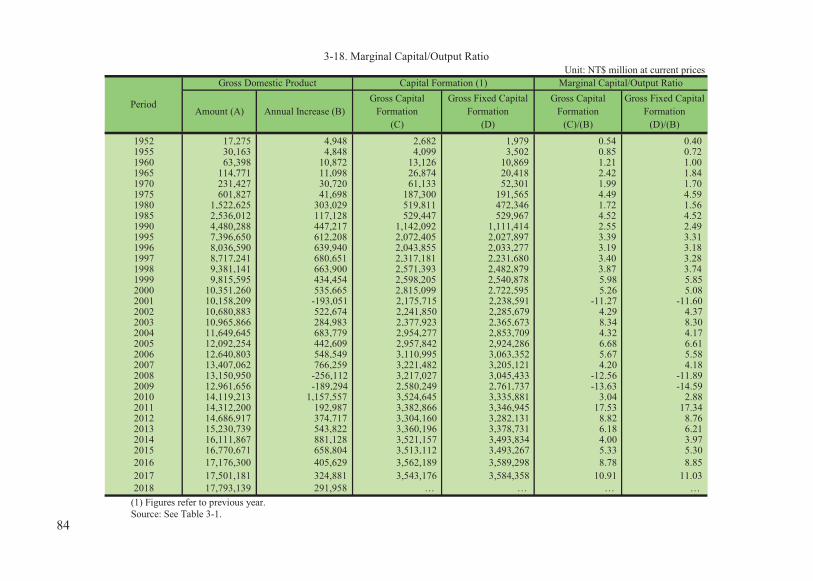
1952 17,275 4,948 2,682 1,979 0.54 0.40 1955 30,163 4,848 4,099 3,502 0.85 0.72 1960 63,398 10,872 13,126 10,869 1.21 1.00 1965 114,771 11,098 26,874 20,418 2.42 1.84 1970 231,427 30,720 61,133 52,301 1.99 1.70 1975 601,827 41,698 187,300 191,565 4.49 4.59 1980 1,522,625 303,029 519,811 472,346 1.72 1.56 1985 2,536,012 117,128 529,447 529,967 4.52 4.52 1990 4,480,288 447,217 1,142,092 1,111,414 2.55 2.49 1995 7,396,650 612,208 2,072,405 2,027,897 3.39 3.31 1996 8,036,590 639,940 2,043,855 2,033,277 3.19 3.18 1997 8,717,241 680,651 2,317,181 2,231,680 3.40 3.28 1998 9,381,141 663,900 2,571,393 2,482,879 3.87 3.74 1999 9,815,595 434,454 2,598,205 2,540,878 5.98 5.852000 10,351,260 535,665 2,815,099 2,722,595 5.26 5.082001 10,158,209 -193,051 2,175,715 2,238,591 -11.27 -11.602002 10,680,883 522,674 2,241,850 2,285,679 4.29 4.372003 10,965,866 284,983 2,377,923 2,365,673 8.34 8.302004 11,649,645 683,779 2,954,277 2,853,709 4.32 4.172005 12,092,254 442,609 2,957,842 2,924,286 6.68 6.612006 12,640,803 548,549 3,110,995 3,063,352 5.67 5.582007 13,407,062 766,259 3,221,482 3,205,121 4.20 4.182008 13,150,950 -256,112 3,217,027 3,045,433 -12.56 -11.892009 12,961,656 -189,294 2,580,249 2,761,737 -13.63 -14.592010 14,119,213 1,157,557 3,524,645 3,335,881 3.04 2.882011 14,312,200 192,987 3,382,866 3,346,945 17.53 17.342012 14,686,917 374,717 3,304,160 3,282,131 8.82 8.762013 15,230,739 543,822 3,360,196 3,378,731 6.18 6.212014 16,111,867 881,128 3,521,157 3,493,834 4.00 3.972015 16,770,671 658,804 3,513,112 3,493,267 5.33 5.302016 17,176,300 405,629 3,562,189 3,589,298 8.78 8.852017 17,501,181 324,881 3,543,176 3,584,358 10.91 11.032018 17,793,139 291,958 … … … …
(1) Figures refer to previous year. Source: See Table 3-1.
3-18. Marginal Capital/Output RatioUnit: NT$ million at current prices
Gross Domestic Product Capital Formation (1) Marginal Capital/Output Ratio
Period Gross Fixed CapitalFormation
(D)
Gross Fixed CapitalFormation
(D)/(B)
Gross CapitalFormation
(C)
Gross CapitalFormation
(C)/(B)Annual Increase (B)Amount (A)
84
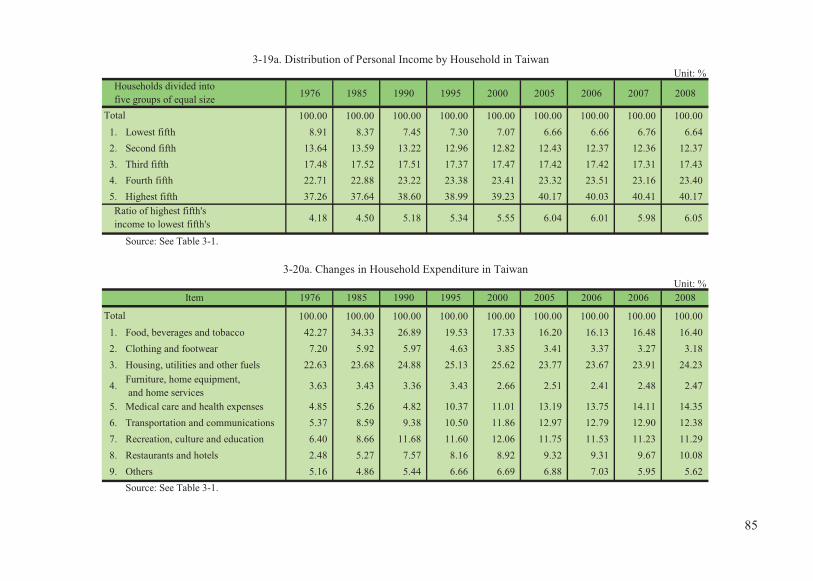
3-19a. Distribution of Personal Income by Household in Taiwan Unit: %
1976 1985 1990 1995 2000 2005 2006 2007 2008
100.00 100.00 100.00 100.00 100.00 100.00 100.00 100.00 100.00 1. Lowest fifth 8.91 8.37 7.45 7.30 7.07 6.66 6.66 6.76 6.64 2. Second fifth 13.64 13.59 13.22 12.96 12.82 12.43 12.37 12.36 12.37 3. Third fifth 17.48 17.52 17.51 17.37 17.47 17.42 17.42 17.31 17.43 4. Fourth fifth 22.71 22.88 23.22 23.38 23.41 23.32 23.51 23.16 23.40 5. Highest fifth 37.26 37.64 38.60 38.99 39.23 40.17 40.03 40.41 40.17
4.18 4.50 5.18 5.34 5.55 6.04 6.01 5.98 6.05
Source: See Table 3-1.
Unit: %
100.00 100.00 100.00 100.00 100.00 100.00 100.00 100.00 100.00 1. Food, beverages and tobacco 42.27 34.33 26.89 19.53 17.33 16.20 16.13 16.48 16.40 2. Clothing and footwear 7.20 5.92 5.97 4.63 3.85 3.41 3.37 3.27 3.18 3. Housing, utilities and other fuels 22.63 23.68 24.88 25.13 25.62 23.77 23.67 23.91 24.23
4. Furniture, home equipment, and home services
3.63 3.43 3.36 3.43 2.66 2.51 2.41 2.48 2.47
5. Medical care and health expenses 4.85 5.26 4.82 10.37 11.01 13.19 13.75 14.11 14.35 6. Transportation and communications 5.37 8.59 9.38 10.50 11.86 12.97 12.79 12.90 12.38 7. Recreation, culture and education 6.40 8.66 11.68 11.60 12.06 11.75 11.53 11.23 11.29 8. Restaurants and hotels 2.48 5.27 7.57 8.16 8.92 9.32 9.31 9.67 10.08 9. Others 5.16 4.86 5.44 6.66 6.69 6.88 7.03 5.95 5.62
Source: See Table 3-1.
2006 2008
Households divided into five groups of equal sizeTotal
Ratio of highest fifth's income to lowest fifth's
19901985 2000
Total
1976Item
3-20a. Changes in Household Expenditure in Taiwan
2005 20061995
85
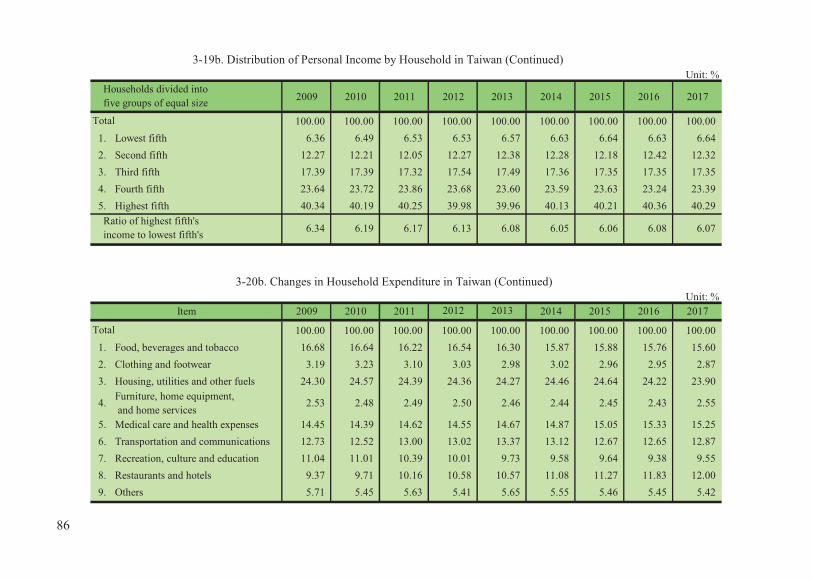
Unit: %
2009 2010 2011 2012 2013 2014 2015 2016 2017
100.00 100.00 100.00 100.00 100.00 100.00 100.00 100.00 100.00 1. Lowest fifth 6.36 6.49 6.53 6.53 6.57 6.63 6.64 6.63 6.64 2. Second fifth 12.27 12.21 12.05 12.27 12.38 12.28 12.18 12.42 12.32 3. Third fifth 17.39 17.39 17.32 17.54 17.49 17.36 17.35 17.35 17.35 4. Fourth fifth 23.64 23.72 23.86 23.68 23.60 23.59 23.63 23.24 23.39 5. Highest fifth 40.34 40.19 40.25 39.98 39.96 40.13 40.21 40.36 40.29
6.34 6.19 6.17 6.13 6.08 6.05 6.06 6.08 6.07
Unit: %2012 2013
100.00 100.00 100.00 100.00 100.00 100.00 100.00 100.00 100.00 1. Food, beverages and tobacco 16.68 16.64 16.22 16.54 16.30 15.87 15.88 15.76 15.60 2. Clothing and footwear 3.19 3.23 3.10 3.03 2.98 3.02 2.96 2.95 2.87 3. Housing, utilities and other fuels 24.30 24.57 24.39 24.36 24.27 24.46 24.64 24.22 23.90
4. Furniture, home equipment, and home services
2.53 2.48 2.49 2.50 2.46 2.44 2.45 2.43 2.55
5. Medical care and health expenses 14.45 14.39 14.62 14.55 14.67 14.87 15.05 15.33 15.25 6. Transportation and communications 12.73 12.52 13.00 13.02 13.37 13.12 12.67 12.65 12.87 7. Recreation, culture and education 11.04 11.01 10.39 10.01 9.73 9.58 9.64 9.38 9.55 8. Restaurants and hotels 9.37 9.71 10.16 10.58 10.57 11.08 11.27 11.83 12.00 9. Others 5.71 5.45 5.63 5.41 5.65 5.55 5.46 5.45 5.42
20162015 2017
3-19b. Distribution of Personal Income by Household in Taiwan (Continued)
3-20b. Changes in Household Expenditure in Taiwan (Continued)
201120102009
Total
Households divided into five groups of equal size
Total
Ratio of highest fifth's income to lowest fifth's
Item 2014
86

4. AGRICULTURE


Unit: 1,000 ha.
Double-Cropping Single-CroppingField Field
1952 876 534 325 209 342 1,521 173.6 1955 873 533 333 200 340 1,508 172.7 1960 869 526 329 197 344 1,600 184.1 1965 890 537 337 199 353 1,680 188.8 1970 905 529 336 193 376 1,656 183.01975 917 516 342 174 401 1,659 180.91980 907 509 361 149 398 1,400 154.41985 888 495 346 148 393 1,257 141.61990 890 477 341 136 413 1,155 129.81994 872 461 329 132 411 1,035 118.71995 873 459 329 130 414 1,036 118.7 1996 872 456 328 128 416 998 114.41997 865 455 325 130 410 995 115.0 1998 859 451 323 128 408 963 112.1 1999 855 444 321 123 411 963 112.6 2000 851 442 317 125 409 904 106.2 2001 849 439 316 123 410 877 103.3 2002 847 435 314 121 412 850 100.4 2003 844 433 319 114 411 797 94.4 2004 836 428 329 99 408 737 88.2 2005 833 426 329 97 408 760 91.2 2006 830 424 328 95 406 751 90.5 2007 826 422 328 95 404 738 89.4 2008 822 421 328 93 402 726 88.3 2009 815 416 330 86 400 721 88.4 2010 813 411 322 88 402 697 85.7 2011 808 406 330 76 402 704 87.1 2012 803 399 326 73 403 695 86.6 2013 800 397 324 72 403 709 88.7 2014 800 393 318 75 404 719 89.9 2015 797 (2) … … … 700 87.9 2016 794 … … … … 736 92.7 2017 793 … … … … 735 92.7
2018(1) 791 … … … … 730 92.3 (1) Preliminary.(2)following international practice, the COA offers data no longer categorizing into paddy field and upland field from 2015. Source: The data are provided by the Council of Agriculture, R.O.C. (Taiwan).
4-1. Area of Cultivated Land
PeriodArea of Total
Cultivated Land(A)
Paddy FieldUpland Field
TotalCrop Area
(B)
Multiple-Cropping Index
(B/A x 100)Total
87

% of Total All PartPopulation Self-owned Self-owned All Self-owned Part Self-owned All Non-self-owned
1955 … … 4,603 2,708 1,084 811 58.8 23.5 17.61960 … … 5,373 3,463 1,157 753 64.5 21.5 14.01965 … … 5,739 3,837 1,179 722 66.9 20.5 12.61970 … … 5,997 4,642 737 618 77.4 12.3 10.31975 5,785 35.8 5,598 4,572 540 486 81.7 9.6 8.71980 5,389 30.3 5,288 4,353 556 379 82.3 10.5 7.21985 4,685 24.3 4,146 3,384 496 266 81.6 12.0 6.41990 4,289 21.1 4,262 3,609 371 282 84.7 8.7 6.61994 3,716 19.0 3,963 3,287 525 151 82.9 13.2 3.81995 7,923 18.5 3,902 3,321 385 196 85.1 9.9 5.01996 3,716 17.4 3,688 3,180 340 168 86.2 9.2 4.61997 3,721 17.3 3,693 3,190 338 165 86.4 9.2 4.51998 3,728 17.0 3,699 3,192 343 165 86.3 9.3 4.51999 3,747 17.0 3,724 3,213 343 167 86.3 9.2 4.52000 3,669 16.5 3,648 3,060 395 194 83.9 10.8 5.32001 3,783 16.9 3,761 3,105 464 192 82.6 12.3 5.12002 3,782 16.9 3,760 3,124 451 185 83.1 12.0 4.92003 3,528 15.7 3,506 2,993 369 144 85.4 10.5 4.12004 3,393 15.0 3,373 2,854 390 129 84.6 11.6 3.82005 3,400 15.0 3,382 2,966 261 155 87.7 7.7 4.62006 3,233 14.2 3,216 2,795 267 154 86.9 8.3 4.82007 3,050 13.3 3,033 2,612 327 94 86.1 10.8 3.12008 3,028 13.2 3,012 2,591 314 107 86.0 10.4 3.52009 2,984 13.0 2,968 2,523 336 108 85.0 11.3 3.72010 2,962 12.8 2,940 2,550 236 154 86.7 8.0 5.22011 2,944 12.7 2,922 2,524 252 146 86.4 8.6 5.02012 2,931 12.6 2,916 2,479 334 103 85.0 11.5 3.52013 2,989 12.9 2,974 2,546 320 108 85.6 10.8 3.62014 3,015 12.9 3,002 2,495 378 129 83.1 12.6 4.32015 2,698 11.6 2,520 2,174 206 140 86.3 8.2 5.62016 2,818 12.0 2,791 2,210 460 121 79.2 16.5 4.32017 2,778 11.9 2,749 2,190 436 123 79.7 15.9 4.5
Source: See Table 4-1.
4-2. Agricultural Population by Owner and TenantUnit: 1,000 persons
End ofYear
Agricultural Population Cultivating Farm HouseholdAll Non-
self-ownedPercentage (%)
88

Area ofCultivated
Land Per Farm Per Capita on Per Agricultural(ha.) Family Farm Employment
1955 873,002 732,555 … 1,667 1.19 … 0.52 1960 869,223 785,592 … 1,742 1.11 … 0.50 1965 889,563 847,242 … 1,748 1.05 … 0.51 1970 905,263 880,274 … 1,681 1.03 … 0.541975 917,111 897,739 5,785 1,681 1.02 0.16 0.551980 907,353 891,115 5,389 1,277 1.02 0.17 0.711985 887,660 779,897 4,685 1,297 1.14 0.19 0.681990 890,090 859,772 4,289 1,064 1.04 0.21 0.841994 812,776 807,791 4,007 976 1.08 0.22 0.891995 873,378 792,125 3,930 954 1.10 0.22 0.921996 872,159 779,427 3,716 918 1.12 0.23 0.971997 864,817 780,246 3,721 878 1.11 0.23 0.981998 858,756 782,136 3,728 822 1.10 0.23 1.04 1999 855,073 787,407 3,747 776 1.09 0.23 1.10 2000 851,495 721,161 3,669 740 1.18 0.23 1.15 2001 848,743 745,812 3,783 706 1.17 0.23 1.20 2002 847,334 748,317 3,782 709 1.13 0.22 1.20 2003 844,097 755,454 3,528 696 1.12 0.24 1.21 2004 835,507 759,716 3,393 642 1.10 0.25 1.30 2005 833,176 767,316 3,400 591 1.09 0.25 1.41 2006 829,527 772,230 3,315 555 1.07 0.25 1.49 2007 825,947 772,977 3,232 543 1.07 0.26 1.52 2008 822,364 772,795 3,152 535 1.06 0.26 1.54 2009 815,462 775,816 3,075 543 1.05 0.27 1.50 2010 813,126 776,724 2,962 550 1.05 0.27 1.48 2011 808,294 775,496 2,907 542 1.04 0.28 1.49 2012 802,876 775,455 2,853 544 1.04 0.28 1.48 2013 799,830 774,963 2,800 544 1.03 0.29 1.47 2014 799,611 774,237 2,748 548 1.03 0.29 1.46 2015 796,618 775,258 2,698 555 1.03 0.30 1.44 2016 794,003 775,472 2,818 557 1.02 0.28 1.43 2017 793,027 775,310 2,778 557 1.02 0.29 1.42
2018(1) 790,680 … … 561 … … 1.41 See (1) of Table 4-1.Source: See Table 4-1.
4-3. Cultivated Land, Agricultural Population and Employment
PeriodNumber of
Farm Families(household)
AgriculturalPopulation
(1,000 persons)
AgriculturalEmployment
(1,000 persons)
Area of Cultivated Land (ha.)
89

Index (2016=100)General Agri- General Agri-Index culture Index culture
1955 31.57 68.78 1,800.36 19.73 9.31 2.87 -0.46 1.23 17.65 3.671960 39.36 82.96 2,926.02 26.89 11.93 0.64 1.41 3.17 4.88 -3.711965 51.72 106.48 4,406.82 36.59 16.20 6.62 6.62 2.54 2.06 7.431970 65.28 118.86 4,281.42 62.90 25.62 6.89 4.46 5.86 8.73 9.861975 73.80 124.81 3,333.08 85.47 29.61 -1.39 -2.98 -9.15 9.66 -5.431980 95.95 131.07 2,357.04 117.53 53.06 1.06 -2.15 -10.01 1.50 5.911985 106.51 126.93 2,061.45 131.14 72.69 3.06 0.77 -9.97 4.28 6.821990 118.77 120.83 829.82 165.86 93.18 2.23 -4.44 -14.44 6.24 7.551994 120.91 122.41 369.56 138.72 114.65 -3.06 -3.51 -24.51 -11.81 5.661995 125.43 124.87 431.36 144.52 120.41 3.74 2.01 16.72 4.18 5.021996 125.62 124.52 355.36 137.76 125.28 0.15 -0.28 -17.62 -4.68 4.041997 123.99 126.51 399.70 140.45 115.96 -1.30 1.60 12.48 1.95 -7.441998 117.18 116.05 506.28 140.60 107.39 -5.49 -8.27 26.66 0.11 -7.391999 118.52 123.93 425.50 137.68 103.50 1.14 6.79 -15.96 -2.08 -3.622000 121.13 118.13 419.78 150.53 109.39 2.20 -4.68 -1.34 9.33 5.692001 119.65 113.02 347.58 153.07 109.73 -1.22 -4.33 -17.20 1.69 0.312002 124.56 119.24 387.73 165.52 107.68 4.10 5.50 11.55 8.13 -1.872003 124.74 116.09 422.24 177.24 105.53 0.14 -2.64 8.90 7.08 -2.002004 119.47 110.34 421.47 164.61 105.39 -4.22 -4.95 -0.18 -7.13 -0.132005 112.61 99.87 329.62 161.24 102.28 -5.74 -9.49 -21.79 -2.05 -2.952006 113.45 109.30 367.10 138.66 104.91 0.75 9.44 11.37 -14.00 2.572007 110.73 102.22 251.54 146.62 102.36 -2.40 -6.48 -31.48 5.74 -2.432008 105.12 101.63 232.71 126.67 97.79 -5.07 -0.58 -7.49 -13.61 -4.462009 103.26 102.60 236.57 115.31 97.41 -1.77 0.95 1.66 -8.97 -0.392010 105.47 105.36 217.25 117.37 98.71 2.14 2.69 -8.17 1.79 1.332011 109.39 111.87 214.50 115.71 102.00 3.72 6.18 -1.27 -1.41 3.332012 107.49 107.25 222.22 118.82 100.55 -1.74 -4.13 3.60 2.69 -1.422013 106.25 106.72 241.48 117.32 98.59 -1.15 -0.49 8.67 -1.26 -1.952014 107.41 110.15 207.19 116.20 98.70 1.09 3.21 -14.20 -0.95 0.112015 103.77 105.12 125.57 110.48 98.14 -3.39 -4.57 -39.39 -4.92 -0.572016 100.00 100.00 100.00 100.00 100.00 -3.63 -4.87 -20.36 -9.49 1.902017 105.70 109.65 84.90 105.18 99.67 5.70 9.65 -15.10 5.18 -0.33
2018(1) 107.38 113.14 59.97 98.82 102.66 1.59 3.18 -29.36 -6.05 3.00See (1) of Table 4-1.Source: See Table 4-1.
4-4. Indices of Agricultural Production
PeriodAnnual Growth Rate (%)
Forestry Fisheries Livestock Forestry Fisheries Livestock
90
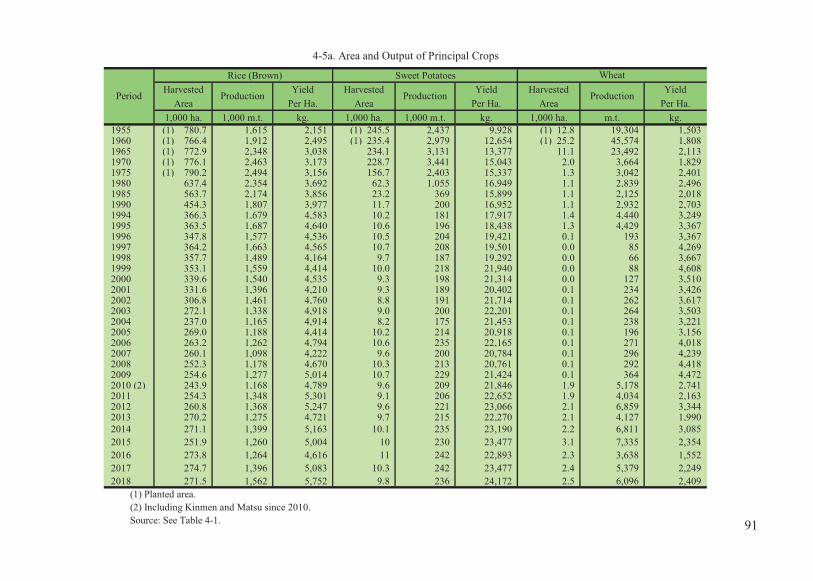
4-5a. Area and Output of Principal Crops
Rice (Brown) Sweet PotatoesHarvested Yield Harvested Yield Harvested Yield
Area Per Ha. Area Per Ha. Area Per Ha.1,000 ha. 1,000 m.t. kg. 1,000 ha. 1,000 m.t. kg. 1,000 ha. m.t. kg.
1955 (1) 780.7 1,615 2,151 (1) 245.5 2,437 9,928 (1) 12.8 19,304 1,503 1960 (1) 766.4 1,912 2,495 (1) 235.4 2,979 12,654 (1) 25.2 45,574 1,808 1965 (1) 772.9 2,348 3,038 234.1 3,131 13,377 11.1 23,492 2,113 1970 (1) 776.1 2,463 3,173 228.7 3,441 15,043 2.0 3,664 1,829 1975 (1) 790.2 2,494 3,156 156.7 2,403 15,337 1.3 3,042 2,401 1980 637.4 2,354 3,692 62.3 1,055 16,949 1.1 2,839 2,496 1985 563.7 2,174 3,856 23.2 369 15,899 1.1 2,125 2,018 1990 454.3 1,807 3,977 11.7 200 16,952 1.1 2,932 2,703 1994 366.3 1,679 4,583 10.2 181 17,917 1.4 4,440 3,249 1995 363.5 1,687 4,640 10.6 196 18,438 1.3 4,429 3,367 1996 347.8 1,577 4,536 10.5 204 19,421 0.1 193 3,367 1997 364.2 1,663 4,565 10.7 208 19,501 0.0 85 4,269 1998 357.7 1,489 4,164 9.7 187 19,292 0.0 66 3,667 1999 353.1 1,559 4,414 10.0 218 21,940 0.0 88 4,608 2000 339.6 1,540 4,535 9.3 198 21,314 0.0 127 3,510 2001 331.6 1,396 4,210 9.3 189 20,402 0.1 234 3,426 2002 306.8 1,461 4,760 8.8 191 21,714 0.1 262 3,617 2003 272.1 1,338 4,918 9.0 200 22,201 0.1 264 3,503 2004 237.0 1,165 4,914 8.2 175 21,453 0.1 238 3,221 2005 269.0 1,188 4,414 10.2 214 20,918 0.1 196 3,156 2006 263.2 1,262 4,794 10.6 235 22,165 0.1 271 4,018 2007 260.1 1,098 4,222 9.6 200 20,784 0.1 296 4,239 2008 252.3 1,178 4,670 10.3 213 20,761 0.1 292 4,418 2009 254.6 1,277 5,014 10.7 229 21,424 0.1 364 4,472 2010 (2) 243.9 1,168 4,789 9.6 209 21,846 1.9 5,178 2,741 2011 254.3 1,348 5,301 9.1 206 22,652 1.9 4,034 2,163 2012 260.8 1,368 5,247 9.6 221 23,066 2.1 6,859 3,344 2013 270.2 1,275 4,721 9.7 215 22,270 2.1 4,127 1,990 2014 271.1 1,399 5,163 10.1 235 23,190 2.2 6,811 3,085 2015 251.9 1,260 5,004 10 230 23,477 3.1 7,335 2,354 2016 273.8 1,264 4,616 11 242 22,893 2.3 3,638 1,552 2017 274.7 1,396 5,083 10.3 242 23,477 2.4 5,379 2,249 2018 271.5 1,562 5,752 9.8 236 24,172 2.5 6,096 2,409
(1) Planted area.(2) Including Kinmen and Matsu since 2010.Source: See Table 4-1.
Period
Wheat
Production Production Production
91

Harvested Yield Harvested Yield Harvested YieldArea Per Ha. Area Per Ha. Area Per Ha.
1,000 ha. m.t. kg. 1,000 ha. m.t. kg. 1,000 ha. m.t. kg.(1) 34.5 24,151 700 (1) 96.0 66,572 693 42.8 14,680 343(1) 59.7 52,653 882 (1) 100.5 102,167 1,017 45.7 17,365 380
53.2 65,709 1,236 103.6 125,817 1,214 34.6 20,730 59942.7 65,174 1,525 87.5 122,198 1,397 33.3 27,648 83141.4 61,920 1,495 64.1 91,470 1,427 31.4 26,092 83015.3 25,934 1,692 53.3 86,126 1,617 27.1 24,479 902
7.1 12,211 1,717 52.9 89,105 1,683 24.3 23,203 9544.2 8,140 1,945 34.4 64,980 1,892 22.7 22,299 9835.7 12,005 2,110 35.2 80,583 2,289 19.7 24,485 1,2433.8 8,894 2,313 39.2 92,225 2,355 19.9 20,892 1,0485.0 9,693 1,921 34.0 79,918 2,353 20.0 23,321 1,1692.0 4,722 2,382 33.3 84,185 2,529 19.6 23,505 1,1980.7 1,463 2,136 30.0 68,325 2,274 19.3 22,641 1,173 0.2 352 2,169 26.5 67,155 2,535 19.1 21,119 1,103 0.2 294 1,912 29.6 79,128 2,670 19.7 20,349 1,033 0.2 328 1,954 25.2 56,087 2,228 17.9 19,837 1,108 0.2 368 2,184 25.4 77,455 3,050 18.3 20,345 1,110 0.2 341 2,195 25.3 73,462 2,908 18.2 20,675 1,138 0.1 280 2,081 21.8 68,302 3,135 17.5 20,192 1,156 0.1 213 2,128 22.1 53,948 2,438 17.1 18,803 1,102
2006 0.1 187 2,202 24.5 71,561 2,918 16.7 19,345 1,156 0.1 147 2,160 23.1 51,885 2,239 15.7 17,502 1,115 0.1 141 1,906 22.5 55,075 2,445 15.2 17,384 1,146 0.1 220 1,785 21.8 56,941 2,617 14.9 16,780 1,128 0.1 204 1,766 20.9 65,036 3,109 14.5 17,467 1,202 0.1 105 1,919 23.4 68,231 2,920 14.1 17,310 1,228 0.1 159 2,001 19.4 56,845 2,926 13.3 14,902 1,120 0.5 879 1,873 18.6 46,809 2,515 11.8 14,718 1,245 0.7 1,173 1,755 21.6 68,513 3,165 11.8 15,200 1,290 1.6 2,725 1,653 20.7 62,083 2,993 11.6 14,405 1,240
2016 2.1 3,061 1,454 21.4 61,832 2,885 11.6 13,018 1,122 3.2 4,674 1,469 21.6 63,287 2,931 11.4 13,443 1,179 3.0 4,404 1,457 21.2 59,471 2,808 11.7 14,738 1,264
20172018
2015
200720082009
2010 (2)2011201220132014
2005
19941995199619971998199920002001200220032004
19851990
197019751980
4-5b. Area and Output of Principal Crops (Continued)
Soybeans Peanuts Tea
Production Production ProductionPeriod
195519601965
92

Harvested Yield Harvested Yield Harvested YieldArea Per Ha. Area Per Ha. Area Per Ha.
1,000 ha. m.t. kg. 1,000 ha. m.t. kg. 1,000 ha. m.t. kg.1955 10.7 84,677 7,934 5.7 70,537 12,437 5.2 30,235 5,7631960 12.7 114,216 8,987 9.7 166,730 17,108 8.1 52,866 6,5271965 27.4 460,094 16,765 11.1 231,005 20,829 14.7 114,434 7,7881970 39.0 461,829 11,838 12.8 338,191 26,525 22.0 209,115 9,5141975 10.8 196,585 18,165 12.2 318,978 26,251 33.0 347,778 10,5491980 9.3 214,323 23,125 7.4 228,804 31,121 32.7 374,383 11,4501985 8.3 198,596 23,950 4.7 149,745 32,024 32.9 418,863 12,7311990 9.5 201,440 21,311 6.1 234,629 38,497 41.5 528,941 12,7521994 8.2 184,287 22,355 6.5 252,234 38,943 38.4 467,980 12,1991995 7.9 172,633 21,932 6.3 256,421 40,614 34.6 472,409 13,6711996 6.5 140,997 21,663 6.3 274,113 43,197 34.2 463,022 13,5381997 8.8 204,736 23,267 6.7 300,686 44,633 35.2 494,701 14,0691998 9.3 215,639 23,140 7.2 316,057 43,837 35.0 481,703 13,776 1999 9.0 212,531 23,718 7.3 348,450 47,474 33.5 486,475 14,522 2000 8.8 198,455 22,464 8.0 357,535 44,960 31.7 440,382 13,888 2001 9.0 204,724 22,830 8.6 388,691 45,144 32.7 463,473 14,188 2002 9.6 226,521 23,663 9.1 416,280 45,717 32.4 459,574 14,193 2003 9.6 223,061 23,316 9.9 447,807 45,350 31.8 529,080 16,656 2004 9.2 189,900 20,754 10.4 458,499 44,175 32.0 547,814 17,121 2005 8.8 148,715 16,808 10.7 439,872 41,213 32.2 471,563 14,624 2006 10.1 214,277 21,214 10.9 491,588 44,909 32.4 548,991 16,953 2009 11.1 241,729 21,629 11.4 476,811 41,930 32.1 473,074 14,744 2008 11.1 207,702 18,703 10.6 452,060 42,595 32.3 563,914 17,453 2009 11.4 172,550 15,104 10.1 434,769 43,256 29.4 539,854 18,357 2010 (2) 13.5 287,895 21,399 9.0 420,172 46,545 27.8 529,689 19,041 2011 13.3 305,740 23,062 8.3 401,367 48,569 26.3 556,944 21,153 2012 12.9 295,265 22,805 8.2 392,211 47,878 25.8 528,255 20,510 2013 13.0 291,292 22,334 8.7 413,465 47,757 25.6 506,131 19,786 2014 13.3 299,900 22,565 9.0 456,243 50,976 25.3 542,788 21,435 2015 14.1 274,066 19,447 9.5 493,998 52,153 25.5 469,504 18,399 2016 15.7 257,559 16,408 10.4 527,161 50,789 26.0 462,638 17,796 2017 15.8 356,017 22,527 10.5 553,531 52,765 25.8 533,806 20,688 2018 15.4 356,238 23,061 8.4 432,084 51,270 25.3 524,091 20,709
4-5c. Area and Output of Principal Crops (Continued)
Period
Bananas Pineapples Citrus Fruits
Production Production Production
93

Harvested YieldArea Per Ha. Production Yield Per Ha. Production Yield Per Ha.
1,000 ha. 1,000 m.t. kg. m.t. kg. m.t. kg.1955 77.9 6,089 78,121 733,160 10,490 14,833 5,2731960 95.5 6,736 70,505 774,376 8,374 17,808 5,7911965 110.7 9,490 85,730 1,005,547 9,533 33,698 6,4651970 86.2 5,991 69,460 588,286 7,123 23,677 6,4671975 99.2 7,687 77,487 715,823 7,510 23,040 5,9201980 107.2 8,851 82,569 829,639 7,911 16,186 6,9531985 82.6 6,823 75,086 662,030 8,150 9,301 6,6631990 65.5 5,581 85,270 475,348 7,326 3,735 6,5531994 60.1 5,275 87,738 467,782 7,783 86 3,4401995 58.1 4,661 80,197 408,093 7,021 … …1996 52.1 4,190 81,211 391,544 7,520 … …1997 47.8 3,902 81,673 347,683 7,277 … …1998 45.3 3,560 78,610 311,699 6,883 … …1999 40.0 3,256 81,337 276,409 6,910 … …2000 37.0 2,894 78,299 259,471 7,021 … …2001 31.6 2,180 68,916 188,862 5,970 … …2002 27.3 1,973 72,203 171,964 6,293 … …2003 22.8 1,696 74,501 151,043 6,636 … …2004 14.1 1,129 80,032 103,867 7,360 … …2005 10.6 875 82,616 75,439 7,119 … …2006 10.3 651 63,502 55,008 5,366 … …2007 9.5 721 72,731 63,142 6,378 … …2008 9.8 707 72,122 58,858 6,003 … …2009 9.5 613 64,510 50,235 5,285 … …
2010 (2) 9.2 665 72,101 55,076 5,968 … …2011 8.7 654 74,936 51,921 5,949 … …2012 8.3 548 65,986 44,684 5,376 … …2013 8.1 506 62,528 43,352 5,362 … …2014 7.4 503 67,547 47,696 6,409 … …2015 8.8 618 70,543 53,683 6,125 … …2016 8.9 527 58,898 37,455 4,187 … …2017 7.6 455 59,996 33,635 4,434 … …2018 8.5 579 67,986 48,334 5,678 … …
(3) Crop year.
4-5d. Area and Output of Principal Crops (Continued)
Period
Sugarcane (3)
Production Refined Sugar Brown Sugar
94

Harvested Yield Harvested Yield Harvested YieldArea Per Ha. Area Per Sq.m. Area Per Ha. ha. m.t. kg. 1,000 sq.m. m.t. kg. ha. m.t. kg.
1955 … … … … … … (1) 3,695 24,772 6,7031960 … … … … … … (1) 6,240 48,315 7,7421965 (1) 9,533 16,776 1,760 8,565 32,430 3.79 (1) 7,317 77,329 10,5691970 (1) 12,588 112,331 8,924 8,290 39,021 4.71 (1) 13,715 225,843 16,4691975 17,384 80,113 4,607 5,906 48,802 8.26 (1) 12,907 210,897 16,3391980 12,428 112,871 9,082 7,945 76,159 9.61 (1) 19,923 341,410 17,1361985 9,903 62,068 6,268 4,318 59,853 13.86 19,575 284,521 14,5351990 3,190 17,924 5,619 1,478 19,780 13.39 19,045 255,371 13,4091994 1,471 7,423 5,051 548 7,136 13.02 18,851 296,491 15,7301995 1,420 7,617 5,364 490 5,945 12.13 18,363 307,743 16,7571996 1,523 7,560 4,971 622 8,387 13.50 19,429 338,401 17,4201997 1,564 7,308 4,672 601 7,222 12.01 18,735 300,004 16,010 1998 1,484 6,344 4,273 498 6,035 12.12 19,034 310,643 16,322 1999 1,538 7,457 4,838 395 4,805 12.18 19,420 382,286 19,685 2000 1,562 7,901 5,050 339 4,315 12.73 17,357 354,856 20,446 2001 1,538 7,365 4,790 403 4,933 12.24 16,842 330,082 19,599 2002 1,430 6,954 4,864 436 5,217 11.97 19,757 434,289 21,982 2003 1,253 6,325 5,046 408 4,883 11.97 15,727 335,919 21,360 2004 1,149 5,900 5,133 458 5,643 12.33 14,700 314,945 21,425 2005 1,055 4,635 4,410 418 5,117 12.24 12,448 212,488 17,273 2006 871 4,413 5,066 380 4,663 12.27 12,346 236,322 19,142 2009 733 3,141 4,286 352 4,304 12.23 13,483 220,773 16,375 2008 685 2,667 3,893 332 3,951 11.88 12,456 203,275 16,320 2009 635 2,479 3,907 325 3,898 12.00 11,799 217,619 18,444 2010 (2) 576 2,657 4,614 257 3,149 12.27 11,604 225,925 19,469 2011 585 3,056 5,220 297 4,097 13.79 11,693 246,643 21,094 2012 614 3,340 5,438 268 3,439 12.83 11,871 243,067 20,475 2013 608 3,328 5,475 242 2,921 12.08 10,748 212,690 19,788 2014 577 3,243 5,622 249 3,110 12.47 10,545 211,330 20,041 2015 575 3,014 5,241 359 4,820 13.42 10,888 217,466 19,974 2016 443 2,021 4,561 372 4,958 13.33 10,717 201,133 18,768 2017 458 2,556 5,585 367 4,945 13.47 10,421 210,661 20,216 2018 469 2,582 5,507 414 5,054 12.20 10,591 220,846 20,852
4-5e. Area and Output of Principal Crops (Continued)
Period
Asparagus Mushrooms Watermelons
Production Production Production
95

Unit: m.t.Calcium Calcium
Ammonium Super-Nitrate phosphate
1955 562,560 284,238 16 537 110,756 32,064 2,518 … 132,4311960 664,872 315,342 39,428 17,295 132,774 45,673 4,955 … 109,4051965 797,446 363,264 47,309 93,715 181,025 51,001 5,139 3,200 52,7931970 678,581 333,689 36,650 63,974 138,435 53,859 7,843 37,268 6,8631975 1,240,827 523,361 26,914 151,403 275,450 93,047 56 169,956 6401980 1,359,808 566,619 23,000 178,126 271,962 88,235 - 231,456 4101985 1,309,872 486,379 34,116 177,304 201,190 94,254 4,435 309,925 1,743 1990 1,358,860 367,112 16,845 198,121 215,524 63,692 5,443 483,839 13,727 1994 1,376,652 343,602 15,585 183,914 163,655 53,751 8,345 601,407 14,738 1995 1,382,139 342,137 16,469 205,923 172,936 56,858 6,232 575,883 11,933 1996 1,391,665 324,612 16,425 205,577 149,429 59,411 6,428 625,980 10,231 1997 1,203,163 272,703 15,037 182,367 122,766 63,518 8,292 534,509 12,263 1998 1,195,734 257,658 10,514 173,169 131,999 66,340 7,254 540,741 15,313 1999 1,213,310 299,556 15,577 161,544 122,598 62,507 6,777 543,246 8,282 2000 1,257,699 334,657 17,197 178,367 137,792 61,621 9,199 518,813 9,252 2001 1,294,910 341,877 17,300 128,509 164,316 58,300 10,548 570,688 13,920 2002 1,248,294 323,116 17,684 127,158 143,076 50,775 10,400 565,892 20,593 2003 1,143,355 186,731 6,630 112,438 135,470 38,702 10,526 624,439 27,940 2004 1,195,465 232,652 6,836 113,914 117,192 43,180 7,714 646,088 35,603 2005 1,141,483 240,192 6,360 84,968 105,458 29,833 7,012 636,019 31,641 2006 1,159,310 218,215 8,606 81,093 120,807 31,842 9,398 677,338 11,844 2007 1,137,444 226,243 6,691 78,358 113,453 30,969 10,280 659,178 11,799 2008 1,030,819 185,123 2,591 77,478 85,924 27,629 1,499 627,140 6,330 2009 1,041,031 195,301 1,019 75,636 76,868 30,244 3,981 652,013 5,969 2010 1,030,819 180,802 523 73,420 74,283 30,210 5,609 661,124 4,848 2011 1,008,025 158,733 438 71,966 68,614 30,909 5,771 653,388 18,206 2012 1,010,607 144,802 264 74,931 63,284 27,565 5,831 679,091 14,839 2013 999,808 122,277 166 61,856 56,679 26,796 7,739 713,367 10,928 2014 972,277 126,619 176 54,399 46,740 19,346 2,604 707,584 14,810 2015 959,623 108,013 252 51,211 36,248 15,940 3,545 710,494 33,920 2016 979,215 102,071 365 45,995 34,432 15,486 3,283 746,995 30,589 2017 920,965 108,317 728 42,861 31,773 14,557 7,750 690,054 24,925 2018 917,417 102,598 1,053 40,524 29,773 14,202 6,273 688,326 34,668
Source: See Table 4-1.
4-6 Allocations of Various Kinds of Chemical Fertilizer
Period Total AmmoniumSulphate
Urea PotassiumChloride
PotassiumSulphate
Compound Others
96
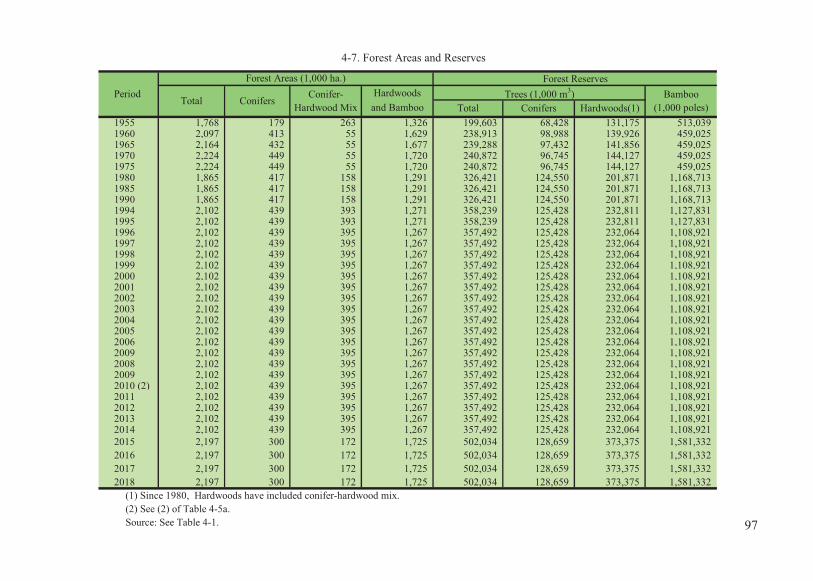
4-7. Forest Areas and Reserves
Forest ReservesHardwoods Trees (1,000 m3)
and Bamboo1955 1,768 179 263 1,326 199,603 68,428 131,175 513,0391960 2,097 413 55 1,629 238,913 98,988 139,926 459,0251965 2,164 432 55 1,677 239,288 97,432 141,856 459,0251970 2,224 449 55 1,720 240,872 96,745 144,127 459,0251975 2,224 449 55 1,720 240,872 96,745 144,127 459,0251980 1,865 417 158 1,291 326,421 124,550 201,871 1,168,7131985 1,865 417 158 1,291 326,421 124,550 201,871 1,168,7131990 1,865 417 158 1,291 326,421 124,550 201,871 1,168,7131994 2,102 439 393 1,271 358,239 125,428 232,811 1,127,831 1995 2,102 439 393 1,271 358,239 125,428 232,811 1,127,8311996 2,102 439 395 1,267 357,492 125,428 232,064 1,108,9211997 2,102 439 395 1,267 357,492 125,428 232,064 1,108,9211998 2,102 439 395 1,267 357,492 125,428 232,064 1,108,9211999 2,102 439 395 1,267 357,492 125,428 232,064 1,108,9212000 2,102 439 395 1,267 357,492 125,428 232,064 1,108,9212001 2,102 439 395 1,267 357,492 125,428 232,064 1,108,9212002 2,102 439 395 1,267 357,492 125,428 232,064 1,108,9212003 2,102 439 395 1,267 357,492 125,428 232,064 1,108,9212004 2,102 439 395 1,267 357,492 125,428 232,064 1,108,9212005 2,102 439 395 1,267 357,492 125,428 232,064 1,108,9212006 2,102 439 395 1,267 357,492 125,428 232,064 1,108,9212009 2,102 439 395 1,267 357,492 125,428 232,064 1,108,9212008 2,102 439 395 1,267 357,492 125,428 232,064 1,108,9212009 2,102 439 395 1,267 357,492 125,428 232,064 1,108,9212010 (2) 2,102 439 395 1,267 357,492 125,428 232,064 1,108,9212011 2,102 439 395 1,267 357,492 125,428 232,064 1,108,9212012 2,102 439 395 1,267 357,492 125,428 232,064 1,108,921 2013 2,102 439 395 1,267 357,492 125,428 232,064 1,108,921 2014 2,102 439 395 1,267 357,492 125,428 232,064 1,108,921 2015 2,197 300 172 1,725 502,034 128,659 373,375 1,581,332 2016 2,197 300 172 1,725 502,034 128,659 373,375 1,581,332 2017 2,197 300 172 1,725 502,034 128,659 373,375 1,581,332 2018 2,197 300 172 1,725 502,034 128,659 373,375 1,581,332
(1) Since 1980, Hardwoods have included conifer-hardwood mix.(2) See (2) of Table 4-5a.Source: See Table 4-1.
Bamboo(1,000 poles)Total Conifers Hardwoods(1)
PeriodForest Areas (1,000 ha.)
Total Conifers Conifer-Hardwood Mix
97
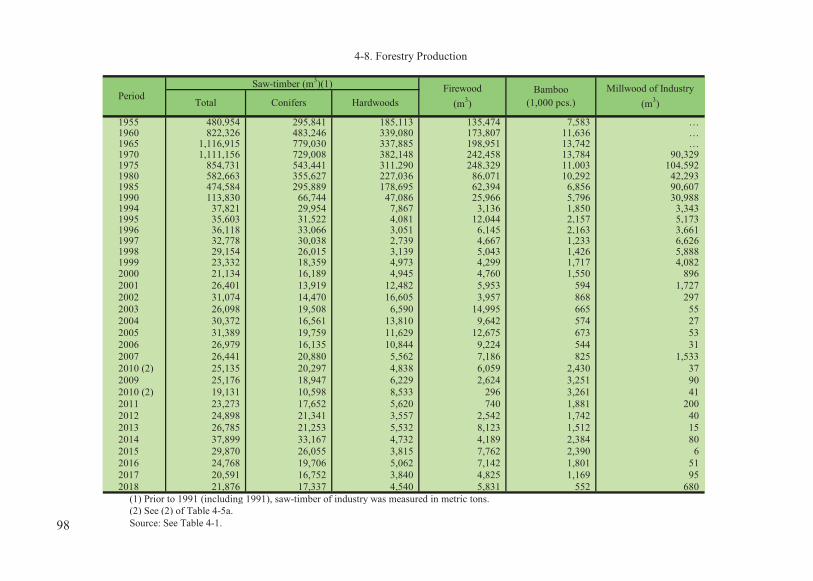
1955 480,954 295,841 185,113 135,474 7,583 …1960 822,326 483,246 339,080 173,807 11,636 …1965 1,116,915 779,030 337,885 198,951 13,742 …1970 1,111,156 729,008 382,148 242,458 13,784 90,3291975 854,731 543,441 311,290 248,329 11,003 104,5921980 582,663 355,627 227,036 86,071 10,292 42,2931985 474,584 295,889 178,695 62,394 6,856 90,6071990 113,830 66,744 47,086 25,966 5,796 30,9881994 37,821 29,954 7,867 3,136 1,850 3,3431995 35,603 31,522 4,081 12,044 2,157 5,1731996 36,118 33,066 3,051 6,145 2,163 3,6611997 32,778 30,038 2,739 4,667 1,233 6,6261998 29,154 26,015 3,139 5,043 1,426 5,888 1999 23,332 18,359 4,973 4,299 1,717 4,082 2000 21,134 16,189 4,945 4,760 1,550 896 2001 26,401 13,919 12,482 5,953 594 1,727 2002 31,074 14,470 16,605 3,957 868 297 2003 26,098 19,508 6,590 14,995 665 55 2004 30,372 16,561 13,810 9,642 574 27 2005 31,389 19,759 11,629 12,675 673 53 2006 26,979 16,135 10,844 9,224 544 31 2007 26,441 20,880 5,562 7,186 825 1,533 2010 (2) 25,135 20,297 4,838 6,059 2,430 37 2009 25,176 18,947 6,229 2,624 3,251 90 2010 (2) 19,131 10,598 8,533 296 3,261 41 2011 23,273 17,652 5,620 740 1,881 200 2012 24,898 21,341 3,557 2,542 1,742 40 2013 26,785 21,253 5,532 8,123 1,512 15 2014 37,899 33,167 4,732 4,189 2,384 80 2015 29,870 26,055 3,815 7,762 2,390 6 2016 24,768 19,706 5,062 7,142 1,801 51 2017 20,591 16,752 3,840 4,825 1,169 95 2018 21,876 17,337 4,540 5,831 552 680
(1) Prior to 1991 (including 1991), saw-timber of industry was measured in metric tons.(2) See (2) of Table 4-5a.Source: See Table 4-1.
4-8. Forestry Production
PeriodSaw-timber (m3)(1) Firewood
(m3)Bamboo
(1,000 pcs.)Millwood of Industry
(m3)Total Conifers Hardwoods
98

Unit: m.t.
1955 180,618 36,413 46,744 49,890 7,257 1,876 38,440 1960 259,140 85,210 91,170 31,761 7,839 1,969 41,191 1965 381,688 135,949 156,566 33,688 10,683 1,326 43,478 1970 613,152 275,971 232,541 30,338 17,891 1,578 54,833 1975 779,950 326,707 293,259 29,540 31,314 2,868 96,263 1980 936,334 350,424 370,905 37,296 29,988 2,701 145,020 1985 1,037,721 413,693 316,417 54,467 36,067 2,409 214,668 1990 1,455,495 766,985 292,391 48,362 36,507 3,494 307,756 1994 1,255,273 683,780 242,272 39,800 33,185 1,456 254,780 1995 1,296,865 709,543 255,981 43,496 33,230 1,211 253,404 1996 1,239,635 668,979 256,654 41,033 34,889 444 237,636 1997 1,363,989 748,256 247,575 40,576 31,354 412 238,835 1998 1,348,152 839,190 209,721 43,609 26,033 467 229,132 1999 1,363,989 854,667 205,645 39,911 24,035 580 239,151 2000 1,357,351 886,859 169,520 44,016 28,282 557 228,117 2001 1,316,904 795,622 158,969 48,923 26,763 609 286,018 2002 1,405,092 823,534 185,030 49,251 28,729 608 317,939 2003 1,498,983 877,663 192,681 63,430 34,386 475 330,348 2004 1,286,010 706,818 196,820 56,070 37,094 255 288,952 2005 1,312,852 752,118 200,730 52,779 34,746 207 272,270 2006 1,282,279 757,896 154,015 54,226 34,411 155 281,575 2007 1,502,375 988,617 134,619 54,110 34,888 241 289,899 2008 1,339,291 828,427 132,594 47,366 37,765 198 292,940 2009 1,087,814 614,614 145,596 45,732 26,760 132 254,980 2010 1,167,080 688,288 128,289 34,731 41,410 77 274,286 2011 1,222,655 702,133 163,579 28,117 38,098 69 290,660 2012 1,256,082 726,775 148,279 33,027 30,390 66 317,543 2013 1,274,282 772,714 125,021 27,566 31,706 29 317,246 2014 1,409,807 899,035 139,929 29,408 29,287 30 312,118 2015 1,299,799 825,023 135,301 25,325 24,737 103 289,311 2016 1,003,861 584,135 138,120 26,215 25,267 88 230,036 2017 1,026,496 556,412 157,727 26,681 26,799 2,624 256,253
2018(1) 1,088,434 621,226 155,089 25,081 24,738 3,738 258,562 (1)The data in 2018 indicates preliminary version.Source: See Table 4-0.
4-9. Fisheries Production
Period Total Far-seaFisheries
OffshoreFisheries
CoastalFisheries
MarineAquaculture
Inland WaterFisheries
InlandAquaculture
99

Unit: head
Number at Number Number at Number Number Number at NumberYear-End Slaughtered Year-End Born Slaughtered Year-End Slaughtered
1955 412,018 17,116 2,799,369 2,081,959 1,770,957 126,856 20,781 1960 420,573 19,459 3,164,571 2,369,051 2,139,633 132,422 29,441 1965 376,745 28,485 2,935,503 2,983,004 2,694,925 156,793 38,430 1970 284,677 54,093 2,900,725 4,251,869 4,319,801 167,727 45,570 1975 249,329 21,408 3,314,823 4,907,420 4,224,657 191,434 49,083 1980 133,813 32,530 4,820,201 6,754,536 7,750,098 183,602 22,088 1985 143,204 24,172 6,673,983 10,986,431 10,380,258 231,159 22,548 1990 154,238 27,328 8,565,250 13,856,175 12,121,873 172,593 24,155 1994 164,270 28,829 10,065,552 15,596,885 13,860,000 310,283 121,881 1995 164,825 33,961 10,508,502 16,975,316 14,180,000 318,404 179,591 1996 163,114 33,168 10,698,366 16,821,874 14,310,000 309,129 222,060 1997 166,393 32,770 7,966,887 12,919,492 11,400,000 315,216 225,781 1998 165,399 29,377 6,538,596 9,153,615 9,800,000 273,217 202,721 1999 165,248 25,840 7,243,194 9,851,753 8,980,000 237,295 183,869 2000 161,700 24,505 7,494,954 10,731,976 9,990,000 202,491 169,365 2001 152,507 25,286 7,164,605 11,301,063 10,420,000 184,717 148,658 2002 149,459 26,517 6,793,941 10,540,165 10,060,000 161,858 139,815 2003 148,870 27,617 6,778,799 10,273,138 9,460,000 155,565 128,851 2004 145,023 25,589 6,818,970 11,894,736 9,410,000 249,362 122,533 2005 137,942 30,226 7,171,536 11,981,992 9,499,457 263,542 133,017 2006 134,793 28,119 7,068,621 11,851,784 9,624,662 267,383 159,060 2007 137,127 27,389 6,620,790 11,614,256 9,418,921 249,374 138,807 2008 140,002 28,404 6,427,597 9,429,539 8,727,229 229,523 129,192 2009 133,713 30,483 6,130,003 9,394,096 8,745,585 206,401 117,161 2010 (1) 140,002 31,701 6,185,952 9,443,562 8,575,777 204,854 105,575 2011 144,312 30,831 6,265,546 9,303,747 8,786,528 190,440 92,582 2012 146,186 30,923 6,004,717 9,400,220 8,965,036 167,103 90,129 2013 147,398 33,449 5,806,237 (2)… 8,720,858 160,850 74,499 2014 145,739 34,357 5,545,010 … 8,067,477 157,778 71,962 2015 149,379 34,360 5,496,216 … 8,229,635 156,045 71,927 2016 146,030 34,074 5,442,381 … 8,144,235 146,000 67,892 2017 147,152 35,121 5,432,676 … 7,947,275 144,733 67,007 2018 150,346 35,278 5,447,283 … 8,073,454 141,533 62,872
(1) See (2) of Table 4-5a.(2) Since 2013, the COA has no longer provided the estimated number of new born piglets.Source: See Table 4-1.
4-10a. Livestock Production
PeriodCattle Hogs Goats
100
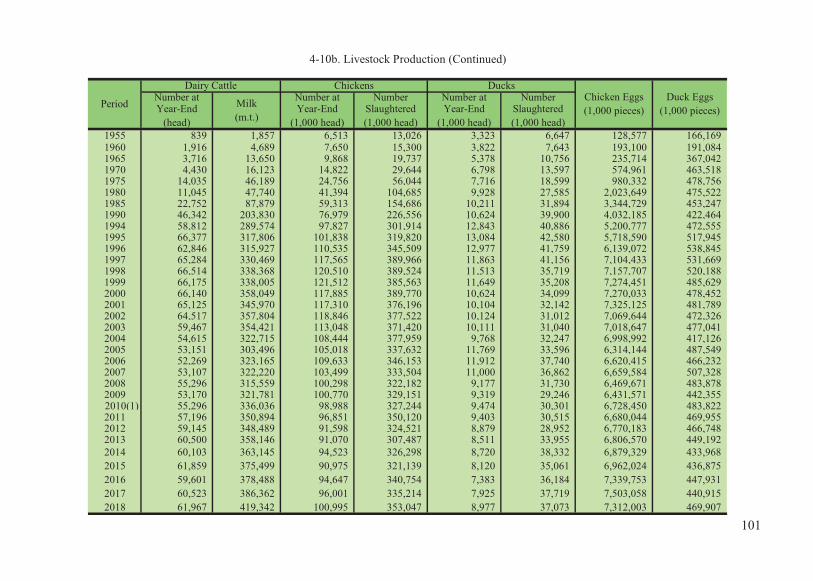
Number at Number at Number Number at NumberYear-End Year-End Slaughtered Year-End Slaughtered
(head) (1,000 head) (1,000 head) (1,000 head) (1,000 head)1955 839 1,857 6,513 13,026 3,323 6,647 128,577 166,1691960 1,916 4,689 7,650 15,300 3,822 7,643 193,100 191,0841965 3,716 13,650 9,868 19,737 5,378 10,756 235,714 367,0421970 4,430 16,123 14,822 29,644 6,798 13,597 574,961 463,5181975 14,035 46,189 24,756 56,044 7,716 18,599 980,332 478,7561980 11,045 47,740 41,394 104,685 9,928 27,585 2,023,649 475,5221985 22,752 87,879 59,313 154,686 10,211 31,894 3,344,729 453,2471990 46,342 203,830 76,979 226,556 10,624 39,900 4,032,185 422,4641994 58,812 289,574 97,827 301,914 12,843 40,886 5,200,777 472,5551995 66,377 317,806 101,838 319,820 13,084 42,580 5,718,590 517,9451996 62,846 315,927 110,535 345,509 12,977 41,759 6,139,072 538,8451997 65,284 330,469 117,565 389,966 11,863 41,156 7,104,433 531,6691998 66,514 338,368 120,510 389,524 11,513 35,719 7,157,707 520,188 1999 66,175 338,005 121,512 385,563 11,649 35,208 7,274,451 485,629 2000 66,140 358,049 117,885 389,770 10,624 34,099 7,270,033 478,452 2001 65,125 345,970 117,310 376,196 10,104 32,142 7,325,125 481,789 2002 64,517 357,804 118,846 377,522 10,124 31,012 7,069,644 472,326 2003 59,467 354,421 113,048 371,420 10,111 31,040 7,018,647 477,041 2004 54,615 322,715 108,444 377,959 9,768 32,247 6,998,992 417,126 2005 53,151 303,496 105,018 337,632 11,769 33,596 6,314,144 487,549 2006 52,269 323,165 109,633 346,153 11,912 37,740 6,620,415 466,232 2007 53,107 322,220 103,499 333,504 11,000 36,862 6,659,584 507,328 2008 55,296 315,559 100,298 322,182 9,177 31,730 6,469,671 483,878 2009 53,170 321,781 100,770 329,151 9,319 29,246 6,431,571 442,355
2010(1) 55,296 336,036 98,988 327,244 9,474 30,301 6,728,450 483,822 2011 57,196 350,894 96,851 350,120 9,403 30,515 6,680,044 469,955 2012 59,145 348,489 91,598 324,521 8,879 28,952 6,770,183 466,748 2013 60,500 358,146 91,070 307,487 8,511 33,955 6,806,570 449,192 2014 60,103 363,145 94,523 326,298 8,720 38,332 6,879,329 433,968 2015 61,859 375,499 90,975 321,139 8,120 35,061 6,962,024 436,875 2016 59,601 378,488 94,647 340,754 7,383 36,184 7,339,753 447,931 2017 60,523 386,362 96,001 335,214 7,925 37,719 7,503,058 440,915 2018 61,967 419,342 100,995 353,047 8,977 37,073 7,312,003 469,907
4-10b. Livestock Production (Continued)
Period
Dairy Cattle Chickens DucksChicken Eggs(1,000 pieces)
Duck Eggs(1,000 pieces)
Milk(m.t.)
101
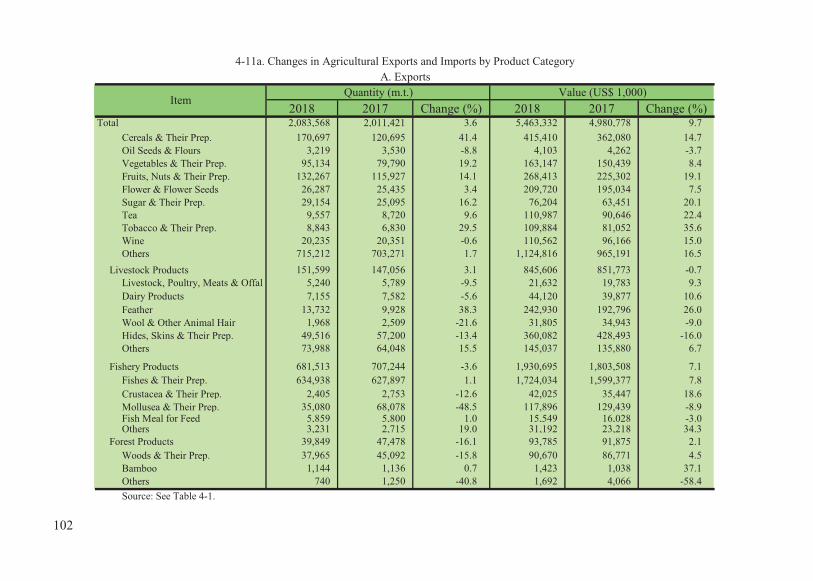
4-11a. Changes in Agricultural Exports and Imports by Product Category
Quantity (m.t.) Value (US$ 1,000)2018 2017 Change (%) 2018 2017 Change (%)
Total 2,083,568 2,011,421 3.6 5,463,332 4,980,778 9.7 Cereals & Their Prep. 170,697 120,695 41.4 415,410 362,080 14.7 Oil Seeds & Flours 3,219 3,530 -8.8 4,103 4,262 -3.7 Vegetables & Their Prep. 95,134 79,790 19.2 163,147 150,439 8.4 Fruits, Nuts & Their Prep. 132,267 115,927 14.1 268,413 225,302 19.1 Flower & Flower Seeds 26,287 25,435 3.4 209,720 195,034 7.5 Sugar & Their Prep. 29,154 25,095 16.2 76,204 63,451 20.1 Tea 9,557 8,720 9.6 110,987 90,646 22.4 Tobacco & Their Prep. 8,843 6,830 29.5 109,884 81,052 35.6 Wine 20,235 20,351 -0.6 110,562 96,166 15.0 Others 715,212 703,271 1.7 1,124,816 965,191 16.5
Livestock Products 151,599 147,056 3.1 845,606 851,773 -0.7 Livestock, Poultry, Meats & Offal 5,240 5,789 -9.5 21,632 19,783 9.3 Dairy Products 7,155 7,582 -5.6 44,120 39,877 10.6 Feather 13,732 9,928 38.3 242,930 192,796 26.0 Wool & Other Animal Hair 1,968 2,509 -21.6 31,805 34,943 -9.0 Hides, Skins & Their Prep. 49,516 57,200 -13.4 360,082 428,493 -16.0 Others 73,988 64,048 15.5 145,037 135,880 6.7
Fishery Products 681,513 707,244 -3.6 1,930,695 1,803,508 7.1 Fishes & Their Prep. 634,938 627,897 1.1 1,724,034 1,599,377 7.8 Crustacea & Their Prep. 2,405 2,753 -12.6 42,025 35,447 18.6 Mollusea & Their Prep. 35,080 68,078 -48.5 117,896 129,439 -8.9 Fish Meal for Feed 5,859 5,800 1.0 15,549 16,028 -3.0 Others 3,231 2,715 19.0 31,192 23,218 34.3
Forest Products 39,849 47,478 -16.1 93,785 91,875 2.1 Woods & Their Prep. 37,965 45,092 -15.8 90,670 86,771 4.5 Bamboo 1,144 1,136 0.7 1,423 1,038 37.1 Others 740 1,250 -40.8 1,692 4,066 -58.4 Source: See Table 4-1.
A. Exports
Item
102
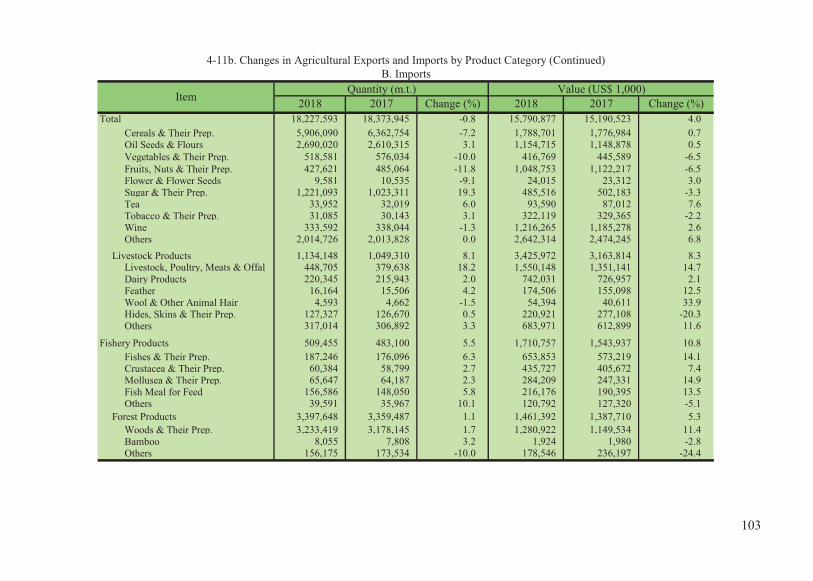
4-11b. Changes in Agricultural Exports and Imports by Product Category (Continued)
Quantity (m.t.) Value (US$ 1,000)2018 2017 Change (%) 2018 2017 Change (%)
Total 18,227,593 18,373,945 -0.8 15,790,877 15,190,523 4.0 Cereals & Their Prep. 5,906,090 6,362,754 -7.2 1,788,701 1,776,984 0.7 Oil Seeds & Flours 2,690,020 2,610,315 3.1 1,154,715 1,148,878 0.5 Vegetables & Their Prep. 518,581 576,034 -10.0 416,769 445,589 -6.5 Fruits, Nuts & Their Prep. 427,621 485,064 -11.8 1,048,753 1,122,217 -6.5 Flower & Flower Seeds 9,581 10,535 -9.1 24,015 23,312 3.0 Sugar & Their Prep. 1,221,093 1,023,311 19.3 485,516 502,183 -3.3 Tea 33,952 32,019 6.0 93,590 87,012 7.6 Tobacco & Their Prep. 31,085 30,143 3.1 322,119 329,365 -2.2 Wine 333,592 338,044 -1.3 1,216,265 1,185,278 2.6 Others 2,014,726 2,013,828 0.0 2,642,314 2,474,245 6.8
Livestock Products 1,134,148 1,049,310 8.1 3,425,972 3,163,814 8.3 Livestock, Poultry, Meats & Offal 448,705 379,638 18.2 1,550,148 1,351,141 14.7 Dairy Products 220,345 215,943 2.0 742,031 726,957 2.1 Feather 16,164 15,506 4.2 174,506 155,098 12.5 Wool & Other Animal Hair 4,593 4,662 -1.5 54,394 40,611 33.9 Hides, Skins & Their Prep. 127,327 126,670 0.5 220,921 277,108 -20.3 Others 317,014 306,892 3.3 683,971 612,899 11.6
Fishery Products 509,455 483,100 5.5 1,710,757 1,543,937 10.8 Fishes & Their Prep. 187,246 176,096 6.3 653,853 573,219 14.1 Crustacea & Their Prep. 60,384 58,799 2.7 435,727 405,672 7.4 Mollusea & Their Prep. 65,647 64,187 2.3 284,209 247,331 14.9 Fish Meal for Feed 156,586 148,050 5.8 216,176 190,395 13.5 Others 39,591 35,967 10.1 120,792 127,320 -5.1
Forest Products 3,397,648 3,359,487 1.1 1,461,392 1,387,710 5.3 Woods & Their Prep. 3,233,419 3,178,145 1.7 1,280,922 1,149,534 11.4 Bamboo 8,055 7,808 3.2 1,924 1,980 -2.8 Others 156,175 173,534 -10.0 178,546 236,197 -24.4
B. Imports
Item
103

104

���� ����


Ore Locality Unit Reserves
Coal Keelung, New Taipei, Taoyuan, Hsinchu, Miaoli, Nantou, Chiayi 1,000 m.t. 102,647
Gold Ruifang, Jinguashi (New Taipei) 1,000 m.t. 5,800
Copper Ruifang, Jinguashi (New Taipei), Qimei (Hualien) 1,000 m.t. 4,700
Pyrites Qixingshan (Taipei), Jinguashi (New Taipei), Tananao (Yilan), Tongmen (Hualien) 1,000 m.t. 1,770
Placer Magnetite Jinshan, Tansui (New Taipei), Chuwei (Taoyuan), Chiayi m.t. 106,000
Limonite Taoyuan, Hsinchu, Taichung, Qixingshan (Taipei) m.t. 754,000
Manganese Simaoshan (Yilan) m.t. 300,000
Ilmenite (10%) Tainan, Chiayi, Hsinchu, Taoyuan, New Taipei m.t. 573,000
Zircon Ore (40%) Tainan, Chiayi, Hsinchu m.t. 71,500
Monazite (2%) Tainan, Chiayi, Hsinchu m.t. 45,000
Sulphur Qixingshan (Taipei), Jinshan (New Taipei), Beitou (Taipei) 1,000 m.t. 896
Asbestos Fengtian (Hualien) m.t. 52,300
Dolomite Hualien 1,000 m.t. 109,471
Marble Yilan, Hualien, Taitung million m.t. 296,942
Talc Yilan, Hualien 1,000 m.t. 1,862
Bauxite Taoyuan, Hsinchu, Taichung 1,000 m.t. 5,000
Limestone Yilan, Hualien, Taitung, Kaohsiung, Tainan, Hsinchu 1,000 m.t. 326,725
Petroleum Miaoli, Hsinchu, Bazhangxi, Chiayi, Shinying, Tainan 1,000 kl 206
Natural Gas Miaoli, Hsinchu, Bazhangxi, Chiayi, Shinying, Tainan million m3 3,595
Source: The data are provided by the Ministry of Economic Affairs, R.O.C.
5-1. Principal Mineral ReservesEnd of 2018
105

Indices (2016 = 100)
1997 45.40 237.50 43.82 63.74 80.96 7.1 -0.05 7.2 6.4 2.61998 46.98 222.92 45.21 68.92 85.35 3.5 -6.1 3.2 8.1 5.41999 50.45 205.04 48.73 71.18 88.97 7.4 -8.0 7.8 3.3 4.22000 54.35 187.72 52.55 75.85 101.48 7.7 -8.5 7.8 6.6 14.12001 49.84 189.11 47.81 76.41 103.68 -8.3 0.7 -9.0 0.7 2.22002 54.08 205.10 52.09 80.05 98.30 8.5 8.5 9.0 4.8 -5.22003 59.00 190.51 57.06 83.48 100.45 9.1 -7.1 9.5 4.3 2.22004 64.55 183.14 62.75 86.28 100.17 9.4 -3.9 10.0 3.4 -0.32005 66.56 165.87 64.75 89.93 100.68 3.1 -9.4 3.2 4.2 0.52006 69.55 157.59 67.74 92.17 103.53 4.5 -5.0 4.6 2.5 2.82007 75.11 130.84 73.38 94.88 103.81 8.0 -17.0 8.3 2.9 0.32008 74.41 124.88 72.73 93.06 101.95 -0.9 -4.6 -0.9 -1.9 -1.82009 68.73 112.73 67.06 90.57 99.65 -7.6 -9.7 -7.8 -2.7 -2.32010 87.72 140.64 86.99 94.68 100.98 27.6 24.8 29.7 4.5 1.32011 90.01 131.07 89.37 96.21 101.18 2.6 -6.8 2.7 1.6 0.22012 90.46 127.63 89.87 96.24 100.58 0.5 -2.6 0.6 0.0 -0.62013 93.36 117.07 92.93 97.61 101.29 3.2 -8.3 3.4 1.4 0.72014 99.34 118.44 99.28 99.08 101.82 6.4 1.2 6.8 1.5 0.52015 98.07 110.70 98.13 96.68 99.50 -1.3 -6.5 -1.2 -2.4 -2.32016 100.00 100.00 100.00 100.00 100.00 2.0 -9.7 1.9 3.4 0.52017 105.00 98.00 105.27 102.22 101.30 5.0 -2.0 5.3 2.2 1.32018 108.83 94.42 109.41 102.62 101.39 3.7 -3.7 3.9 0.4 0.1
Source: See Table 5-1.
MiningElectricity
& Gas Water
5-2. Indices and Growth Rate of Industrial Production
Annual Growth Rate (%)
MiningManufac-
turingManufac-
turingPeriod General
IndexGeneralIndex
Electricity& Gas Water
106

5-3a. Indices of Industrial Production by Sectors
2000 52.55 95.09 105.66 77.38 162.20 521.36 206.33 111.59 186.27 79.822005 64.75 90.56 79.92 63.25 119.41 239.33 126.52 112.72 96.87 73.07 2007 73.38 89.11 81.24 62.88 115.09 194.89 109.84 108.59 100.65 71.73 2008 72.73 86.28 81.54 64.51 103.34 161.86 97.89 100.48 93.78 70.52 2009 67.06 86.25 86.96 68.03 92.12 129.13 80.85 87.05 75.95 63.38 2010 86.99 92.59 95.88 70.34 106.84 140.11 89.33 101.48 90.81 74.42 2011 89.37 93.55 103.52 78.28 99.36 119.67 94.83 109.47 90.45 74.79 2012 89.87 93.95 107.39 82.63 98.54 115.78 94.72 104.54 96.14 78.41 2013 92.93 95.20 101.49 82.11 101.88 115.84 96.30 109.97 93.79 82.87 2014 99.28 95.47 102.60 81.37 103.59 114.11 103.61 112.12 98.34 91.06 2015 98.13 96.36 101.57 81.04 104.74 105.97 100.88 108.57 100.28 94.56 2016 100.00 100.00 100.00 100.00 100.00 100.00 100.00 100.00 100.00 100.00 2017 105.27 100.57 102.81 119.06 97.84 89.27 103.34 97.49 99.96 112.04 2018 109.41 102.15 99.27 116.03 94.79 81.29 107.43 100.52 100.24 126.64
2001 -9.0 0.1 -0.5 5.5 -11.4 -23.7 -8.0 -8.3 -31.5 -13.82005 3.2 1.6 1.6 5.7 -12.5 -16.0 -9.7 -1.4 -4.0 -0.22007 8.3 -1.2 -0.2 5.6 -0.4 -9.9 -10.0 -1.9 4.0 3.32008 -0.9 -3.2 0.4 2.6 -10.2 -17.0 -10.9 -7.5 -6.8 -1.72009 -7.8 0.0 6.7 5.5 -10.9 -20.2 -17.4 -13.4 -19.0 -10.12010 29.7 7.4 10.3 3.4 16.0 8.5 10.5 16.6 19.6 17.42011 2.7 1.0 8.0 11.3 -7.0 -14.6 6.2 7.9 -0.4 0.52012 0.6 0.4 3.7 5.6 -0.8 -3.3 -0.1 -4.5 6.3 4.82013 3.4 1.3 -5.5 -0.6 3.4 0.1 1.7 5.2 -2.4 5.72014 6.8 0.3 1.1 -0.9 1.7 -1.5 7.6 2.0 4.9 9.92015 -1.2 0.9 -1.0 -0.4 1.1 -7.1 -2.6 -3.2 2.0 3.82016 1.9 3.8 -1.6 23.4 -4.5 -5.6 -0.9 -7.9 -0.3 5.82017 5.3 0.6 2.8 19.1 -2.2 -10.7 3.3 -2.5 0.0 12.02018 3.9 1.6 -3.4 -2.5 -3.1 -8.9 4.0 3.1 0.3 13.0
Source: See Table 5-1.
WearingApparel
& ClothingAccessories
Tobacco
Manufactur-ing Not
ElsewhereClassified
Period ManufacturingIndex
TextilesMills
I. Index (Base: 2016 = 100)
II. Annual Growth Rate (%)
Wood &BambooProducts
Non-metallicMineralProducts
FurnitureBeveragesFood
107

5-3b. Indices of Industrial Production by Sectors (Continued)
I. Index (Base: 2016 = 100)2000 80.06 108.87 128.62 75.67 80.13 73.95 - 18.03 49.50 2005 83.96 97.67 117.97 90.06 114.22 90.69 - 33.41 58.96 2007 92.69 98.34 102.40 103.00 88.31 95.49 67.75 51.04 59.55 2008 85.44 94.86 96.71 97.11 73.07 105.22 63.29 55.86 61.91 2009 74.65 74.21 81.10 66.24 71.07 77.15 58.15 54.59 52.42 2010 95.74 91.91 98.18 103.52 92.79 85.14 71.56 76.65 80.86 2011 99.56 99.11 92.94 109.94 101.12 90.80 78.14 76.75 109.64 2012 95.36 99.49 92.40 103.34 98.64 95.71 76.41 81.06 91.37 2013 99.19 101.49 91.65 99.03 95.01 98.26 72.93 86.89 92.12 2014 102.75 105.99 96.33 107.52 107.16 105.76 78.43 96.75 101.83 2015 96.01 101.40 98.19 106.11 103.91 105.76 86.83 95.55 104.13 2016 100.00 100.00 100.00 100.00 100.00 100.00 100.00 100.00 100.00 2017 102.73 100.03 97.94 110.86 100.38 105.72 116.28 108.20 104.49 2018 105.08 100.43 100.47 119.98 94.60 107.30 129.13 113.97 116.50
II. Annual Growth Rate (%)2001 -9.3 -14.6 -16.6 -16.9 -15.8 -15.8 - -19.5 0.52005 -5.1 -3.3 -6.6 4.1 2.3 10.0 - 24.5 -0.22007 1.5 -0.6 -6.7 9.4 -5.7 11.6 4.1 23.1 8.22008 -7.8 -3.5 -5.6 -5.7 -17.3 10.2 -6.6 9.4 4.02009 -12.6 -21.8 -16.1 -31.8 -2.7 -26.7 -8.1 -2.3 -15.32010 28.3 23.9 21.1 56.3 30.6 10.4 23.1 40.4 54.32011 4.0 7.8 -5.3 6.2 9.0 6.7 9.2 0.1 35.62012 -4.2 0.4 -0.6 -6.0 -2.5 5.4 -2.2 5.6 -16.72013 4.0 2.0 -0.8 -4.2 -3.7 2.7 -4.6 7.2 0.82014 3.6 4.4 5.1 8.6 12.8 7.6 7.5 11.4 10.52015 -6.6 -4.3 1.9 -1.3 -3.0 0.0 10.7 -1.2 2.32016 4.2 -1.4 1.8 -5.8 -3.8 -5.5 15.2 4.7 -4.02017 2.7 0.0 -2.1 10.9 0.4 5.7 16.3 8.2 4.52018 2.3 0.4 2.6 8.2 -5.8 1.5 11.1 5.3 11.5
Repair &Installationof IndustrialMachinery
ElectronicParts &
ComponentsPeriod
Computers,Electronic& OpticalProducts
BasicMetals
FabricatedMetal
Products
ElectricalEquipment
Machinery &Equipment
MotorVehicles& Parts
OtherTransport
Equipment &Parts
108

5-3c. Indices of Industrial Production by Sectors (Continued)
2000 381.56 93.97 82.71 64.00 59.87 72.36 66.92 90.75 121.45 2005 295.40 101.41 115.78 116.39 81.24 75.51 70.88 102.75 114.86 2007 233.00 99.76 113.77 111.72 93.40 78.30 74.26 104.40 108.39 2008 207.96 94.52 114.24 102.01 87.07 76.33 75.97 101.99 99.28 2009 183.05 89.73 103.16 102.59 93.06 71.54 81.04 84.65 85.76 2010 200.33 96.30 113.42 98.39 104.84 87.47 86.79 107.99 98.73 2011 178.18 96.90 114.60 91.15 99.42 87.84 88.19 110.07 100.37 2012 164.78 97.59 108.18 97.39 98.90 87.67 93.27 104.29 99.97 2013 160.19 98.32 106.00 98.73 100.13 94.89 96.14 102.29 100.14 2014 159.60 100.83 104.16 98.77 100.41 99.65 92.03 106.97 105.15 2015 122.11 98.91 101.74 98.99 99.80 101.52 95.51 106.41 101.96 2016 100.00 100.00 100.00 100.00 100.00 100.00 100.00 100.00 100.00 2017 103.83 100.22 96.97 95.20 102.67 107.98 99.12 102.79 101.95 2018 97.44 101.32 95.28 97.95 104.56 110.94 102.40 99.38 104.01
2001 -20.1 -8.4 -2.3 14.4 7.8 -10.7 -3.9 -10.0 -8.12005 -4.5 -1.5 8.6 3.8 -0.2 -0.9 -1.1 -4.3 -5.12007 -9.8 1.9 0.6 1.6 12.7 0.1 4.6 4.9 0.02008 -10.8 -5.3 0.4 -8.7 -6.8 -2.5 2.3 -2.3 -8.42009 -12.0 -5.1 -9.7 0.6 6.9 -6.3 6.7 -17.0 -13.62010 9.4 7.3 10.0 -4.1 12.7 22.3 7.1 27.6 15.12011 -11.1 0.6 1.0 -7.4 -5.2 0.4 1.6 1.9 1.72012 -7.5 0.7 -5.6 6.9 -0.5 -0.2 5.8 -5.3 -0.42013 -2.8 0.8 -2.0 1.4 1.2 8.2 3.1 -1.9 0.22014 -0.4 2.6 -1.7 0.0 0.3 5.0 -4.3 4.6 5.02015 -23.5 -1.9 -2.3 0.2 -0.6 1.9 3.8 -0.5 -3.02016 -18.1 1.1 -1.7 1.0 0.2 -1.5 4.7 -6.0 -1.92017 3.8 0.2 -3.0 -4.8 2.7 8.0 -0.9 2.8 2.02018 -6.2 1.1 -1.7 2.9 1.8 2.7 3.3 -3.3 2.0
Printing &Reproductionof Recorded
Media
Petroleum& Coal
ProductsPeriod Rubber
Products
I. Index (Base: 2016 = 100)
II. Annual Growth Rate (%)
ChemicalMaterials
ChemicalProducts
Pharmaceuticals& Medicinal
ChemicalProducts
PlasticProducts
Leather,Fur &
RelatedProducts
Pulp,Paper &
PaperProducts
109
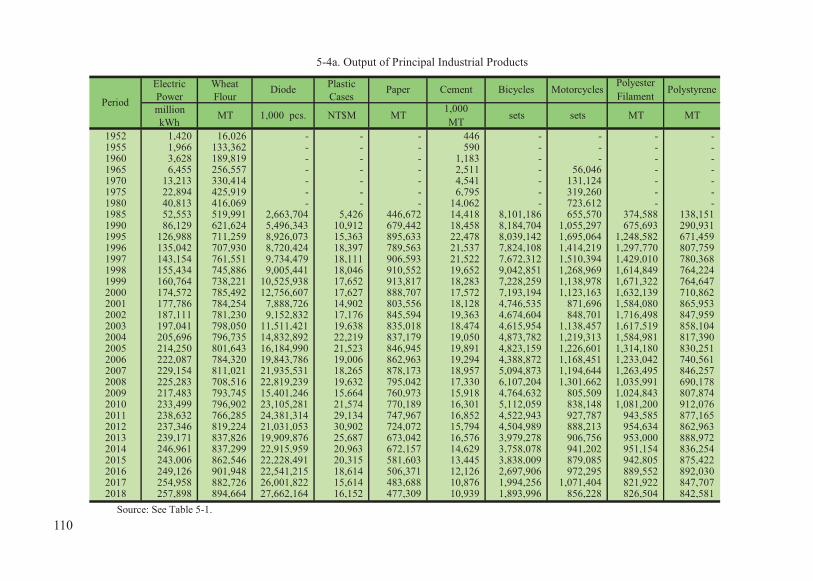
5-4a. Output of Principal Industrial Products
Electric Wheat PlasticPower Flour CasesmillionkWh
1952 1,420 16,026 - - - 446 - - - -1955 1,966 133,362 - - - 590 - - - -1960 3,628 189,819 - - - 1,183 - - - -1965 6,455 256,557 - - - 2,511 - 56,046 - -1970 13,213 330,414 - - - 4,541 - 131,124 - -1975 22,894 425,919 - - - 6,795 - 319,260 - -1980 40,813 416,069 - - - 14,062 - 723,612 - -1985 52,553 519,991 2,663,704 5,426 446,672 14,418 8,101,186 655,570 374,588 138,151 1990 86,129 621,624 5,496,343 10,912 679,442 18,458 8,184,704 1,055,297 675,693 290,931 1995 126,988 711,259 8,926,073 15,363 895,633 22,478 8,039,142 1,695,064 1,248,582 671,459 1996 135,042 707,930 8,720,424 18,397 789,563 21,537 7,824,108 1,414,219 1,297,770 807,759 1997 143,154 761,551 9,734,479 18,111 906,593 21,522 7,672,312 1,510,394 1,429,010 780,368 1998 155,434 745,886 9,005,441 18,046 910,552 19,652 9,042,851 1,268,969 1,614,849 764,224 1999 160,764 738,221 10,525,938 17,652 913,817 18,283 7,228,259 1,138,978 1,671,322 764,647 2000 174,572 785,492 12,756,607 17,627 888,707 17,572 7,193,194 1,123,163 1,632,139 710,862 2001 177,786 784,254 7,888,726 14,902 803,556 18,128 4,746,535 871,696 1,584,080 865,953 2002 187,111 781,230 9,152,832 17,176 845,594 19,363 4,674,604 848,701 1,716,498 847,959 2003 197,041 798,050 11,511,421 19,638 835,018 18,474 4,615,954 1,138,457 1,617,519 858,104 2004 205,696 796,735 14,832,892 22,219 837,179 19,050 4,873,782 1,219,313 1,584,981 817,390 2005 214,250 801,643 16,184,990 21,523 846,945 19,891 4,823,159 1,226,601 1,314,180 830,251 2006 222,087 784,320 19,843,786 19,006 862,963 19,294 4,388,872 1,168,451 1,233,042 740,561 2007 229,154 811,021 21,935,531 18,265 878,173 18,957 5,094,873 1,194,644 1,263,495 846,257 2008 225,283 708,516 22,819,239 19,632 795,042 17,330 6,107,204 1,301,662 1,035,991 690,178 2009 217,483 793,745 15,401,246 15,664 760,973 15,918 4,764,632 805,509 1,024,843 807,874 2010 233,499 796,902 23,105,281 21,574 770,189 16,301 5,112,059 838,148 1,081,200 912,076 2011 238,632 766,285 24,381,314 29,134 747,967 16,852 4,522,943 927,787 943,585 877,165 2012 237,346 819,224 21,031,053 30,902 724,072 15,794 4,504,989 888,213 954,634 862,963 2013 239,171 837,826 19,909,876 25,687 673,042 16,576 3,979,278 906,756 953,000 888,972 2014 246,961 837,299 22,915,959 20,963 672,157 14,629 3,758,078 941,202 951,154 836,254 2015 243,006 862,546 22,228,491 20,315 581,603 13,445 3,838,009 879,085 942,805 875,422 2016 249,126 901,948 22,541,215 18,614 506,371 12,126 2,697,906 972,295 889,552 892,030 2017 254,958 882,726 26,001,822 15,614 483,688 10,876 1,994,256 1,071,404 821,922 847,707 2018 257,898 894,664 27,662,164 16,152 477,309 10,939 1,893,996 856,228 826,504 842,581
Source: See Table 5-1.
PeriodPaper
MT 1,000 pcs. NT$M MT
Diode Polystyrene
MT1,000MT
Motorcycles
sets sets
PolyesterFilament
MT
Cement Bicycles
110

1952 - - - - - - - - -1955 - - - - - - - - -1960 - - - - - - - - -1965 - - - - - - - - -1970 - - - - - - - - -1975 - - - - - - - - -1980 - - - - - - - - -1985 - - - - 1,380,340 - - - 15,105 1990 - 217,233 - - 4,105,441 - 2,244 - 47,301 1995 - 2,269,530 5,298,920 - 6,561,889 - 4,478 13,319 164,104 1996 - 3,785,944 8,540,008 - 6,627,320 - 3,488 21,726 195,497 1997 - 4,669,065 18,373,984 - 8,739,880 - 4,124 76,579 257,560 1998 - 7,020,283 22,822,523 - 9,998,005 - 3,376 424,930 318,029 1999 - 9,952,710 29,387,118 1,298,456 10,617,009 130,016 4,762 2,291,457 367,093 2000 10,400 13,059,784 43,237,280 1,723,102 14,270,855 155,876 7,196 5,002,594 449,991 2001 23,184 14,130,083 44,174,941 1,363,856 9,106,568 202,203 6,188 7,001,310 382,152 2002 48,336 14,346,492 41,497,633 1,860,016 12,784,542 610,693 7,146 7,626,154 480,160 2003 57,280 10,344,208 31,381,776 3,309,852 16,799,798 1,166,064 8,680 9,246,060 562,183 2004 89,327 6,628,142 28,421,670 4,217,204 20,815,118 1,731,622 9,992 10,313,794 559,392 2005 160,886 4,415,887 26,872,056 5,776,703 22,646,129 1,920,772 10,248 10,411,874 641,844 2006 338,213 3,050,526 24,118,814 5,891,770 26,999,440 7,564,813 12,710 11,723,013 685,488 2007 542,240 1,256,527 11,398,721 17,678,830 31,664,833 9,488,503 14,521 11,176,108 622,180 2008 535,223 754,260 7,683,964 21,080,735 32,982,725 8,925,488 14,204 9,469,969 623,585 2009 811,286 373,964 8,998,386 20,294,667 34,784,004 8,761,148 12,886 9,279,881 611,639 2010 1,366,273 327,551 9,890,107 20,658,859 47,453,569 12,223,855 18,611 8,859,285 789,779 2011 1,613,502 3,197,828 6,793,141 20,438,380 48,949,008 12,942,209 17,313 7,523,793 773,741 2012 1,781,733 750,066 6,525,655 18,143,225 54,583,491 12,850,298 17,643 6,898,188 878,630 2013 1,728,669 458,223 4,289,822 13,547,271 60,508,050 13,107,796 18,836 6,551,642 730,412 2014 1,415,069 878,258 3,793,273 12,283,579 68,307,755 14,610,986 21,032 6,331,905 721,207 2015 1,173,922 626,521 3,323,192 10,375,293 69,224,518 12,792,281 21,261 5,070,654 681,512 2016 1,101,214 1,172,723 1,874,803 8,487,543 72,252,278 14,928,569 23,166 4,204,551 594,853 2017 1,282,649 1,747,492 2,211,476 7,420,337 80,166,047 15,854,658 25,468 3,348,123 731,337 2018 1,316,666 1,934,191 2,007,719 7,147,753 80,560,960 18,031,021 26,497 2,688,574 701,684
TFT-LCDPanels
1000 sets
GlobalPositioning
Systems
NetworkCards
sets
5-4b. Output of Principal Industrial Products (Continued)
PeriodIC Packages
FoundryWafers
sets 1000 sq. ft.
PortableComputers
Printed CircuitBoards
ComputerDisksIC Substrate
1,000 pcs. 1,000 pcs. 1,000 pcs.1,000 pcs.pcs.
111

Period Installed Capacity(kW)
System Peak Load(kW)
System Average Load(kW)
Capacity Factor Power Generation (kWh)per Installed kW
1952 331,545 231,675 156,975 50.8 4,5941955 493,414 336,113 224,470 50.1 4,3851960 709,191 635,224 413,019 58.1 5,1041965 1,186,196 1,066,225 736,921 63.6 5,5741970 2,720,261 2,131,400 1,508,300 61.4 5,3771975 5,300,394 3,765,200 2,613,400 53.0 4,6541980 9,055,705 6,702,700 4,646,292 55.3 4,9041985 15,969,794 8,716,300 5,999,518 42.5 3,5731990 16,882,874 14,510,500 9,400,651 58.4 4,9361994 20,983,225 18,610,200 12,588,625 63.2 5,3451995 21,897,970 19,932,900 13,454,251 63.7 5,3721996 23,762,670 21,761,500 14,227,337 63.0 5,3231997 25,735,412 22,237,000 15,096,765 62.2 5,2001998 26,679,782 23,829,800 16,320,113 63.9 5,401 1999 28,480,432 24,205,700 16,639,433 61.4 5,173 2000 29,634,482 25,854,200 17,817,780 61.0 5,140 2001 30,136,062 26,289,800 18,043,197 60.1 5,045 2002 31,915,412 27,116,500 18,938,502 60.5 5,064 2003 33,289,562 28,593,700 19,841,358 60.9 5,090 2004 34,598,032 29,034,300 20,633,553 58.1 4,875 2005 36,121,604 30,942,900 21,651,023 60.7 5,086 2006 37,371,204 32,060,400 22,439,183 60.3 5,048 2007 38,081,524 32,790,800 23,042,916 60.3 5,051 2008 38,633,628 31,320,200 22,796,097 59.0 4,9622009 40,247,048 31,010,700 22,101,056 55.0 4,6102010 40,912,406 33,022,600 23,674,056 58.0 4,8712011 41,400,699 33,786,900 24,319,881 59.2 4,9812012 40,976,907 33,081,400 24,101,571 58.7 5,0342013 41,181,457 33,957,400 24,364,007 58.9 5,0352014 40,787,158 34,821,400 25,025,528 61.5 5,1602015 41,036,658 35,248,400 25,011,855 61.7 5,1992016 42,132,526 35,863,700 25,705,047 62.1 5,3092017 41,883,040 36,258,768 26,378,564 62.8 5,3002018 44,509,052 37,056,902 26,631,108 61.0 5,152(1)Since 1999, including IPPs and hydro power plants entrusted by local government to Taipower for operation. Source: The data are provided by the Taiwan Power Company, R.O.C.
5-5a. Installed Capacity and Operation of the Power System (1)Total System (Hydro, Thermal, Nuclear, Wind and Solar)
112
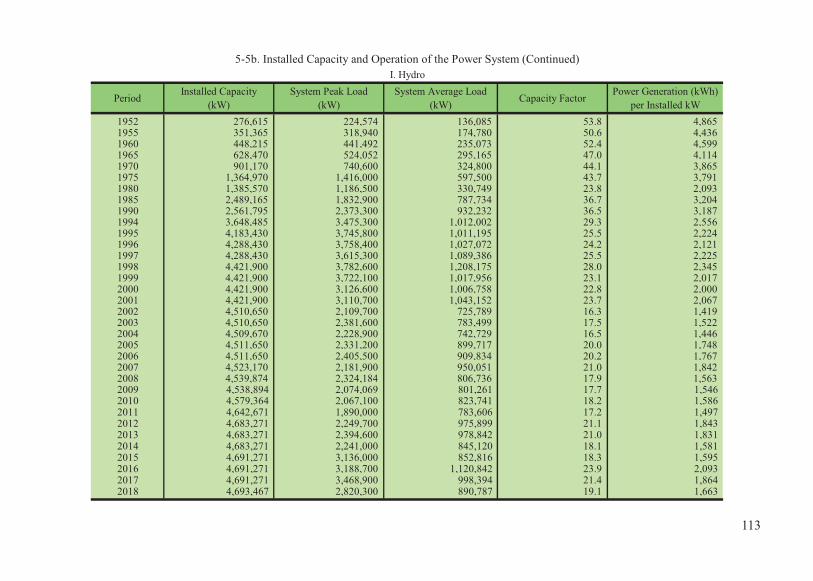
PeriodInstalled Capacity
(kW)System Peak Load
(kW)System Average Load
(kW) Capacity FactorPower Generation (kWh)
per Installed kW1952 276,615 224,574 136,085 53.8 4,8651955 351,365 318,940 174,780 50.6 4,4361960 448,215 441,492 235,073 52.4 4,5991965 628,470 524,052 295,165 47.0 4,1141970 901,170 740,600 324,800 44.1 3,8651975 1,364,970 1,416,000 597,500 43.7 3,7911980 1,385,570 1,186,500 330,749 23.8 2,0931985 2,489,165 1,832,900 787,734 36.7 3,2041990 2,561,795 2,373,300 932,232 36.5 3,1871994 3,648,485 3,475,300 1,012,002 29.3 2,5561995 4,183,430 3,745,800 1,011,195 25.5 2,2241996 4,288,430 3,758,400 1,027,072 24.2 2,1211997 4,288,430 3,615,300 1,089,386 25.5 2,2251998 4,421,900 3,782,600 1,208,175 28.0 2,345 1999 4,421,900 3,722,100 1,017,956 23.1 2,017 2000 4,421,900 3,126,600 1,006,758 22.8 2,000 2001 4,421,900 3,110,700 1,043,152 23.7 2,067 2002 4,510,650 2,109,700 725,789 16.3 1,419 2003 4,510,650 2,381,600 783,499 17.5 1,522 2004 4,509,670 2,228,900 742,729 16.5 1,446 2005 4,511,650 2,331,200 899,717 20.0 1,748 2006 4,511,650 2,405,500 909,834 20.2 1,767 2007 4,523,170 2,181,900 950,051 21.0 1,842 2008 4,539,874 2,324,184 806,736 17.9 1,563 2009 4,538,894 2,074,069 801,261 17.7 1,5462010 4,579,364 2,067,100 823,741 18.2 1,5862011 4,642,671 1,890,000 783,606 17.2 1,4972012 4,683,271 2,249,700 975,899 21.1 1,8432013 4,683,271 2,394,600 978,842 21.0 1,8312014 4,683,271 2,241,000 845,120 18.1 1,5812015 4,691,271 3,136,000 852,816 18.3 1,5952016 4,691,271 3,188,700 1,120,842 23.9 2,0932017 4,691,271 3,468,900 998,394 21.4 1,8642018 4,693,467 2,820,300 890,787 19.1 1,663
5-5b. Installed Capacity and Operation of the Power System (Continued)I. Hydro
113
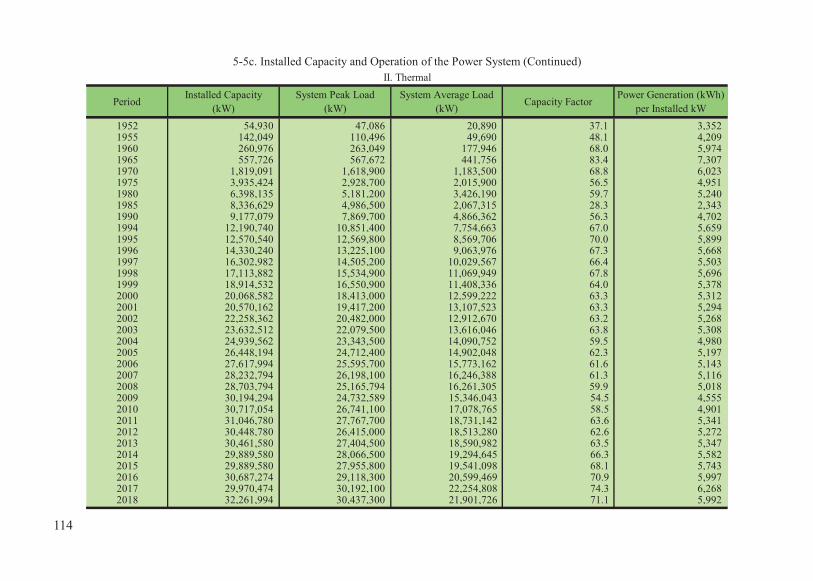
PeriodInstalled Capacity
(kW)System Peak Load
(kW)System Average Load
(kW) Capacity Factor Power Generation (kWh)per Installed kW
1952 54,930 47,086 20,890 37.1 3,3521955 142,049 110,496 49,690 48.1 4,2091960 260,976 263,049 177,946 68.0 5,9741965 557,726 567,672 441,756 83.4 7,3071970 1,819,091 1,618,900 1,183,500 68.8 6,0231975 3,935,424 2,928,700 2,015,900 56.5 4,9511980 6,398,135 5,181,200 3,426,190 59.7 5,2401985 8,336,629 4,986,500 2,067,315 28.3 2,3431990 9,177,079 7,869,700 4,866,362 56.3 4,7021994 12,190,740 10,851,400 7,754,663 67.0 5,6591995 12,570,540 12,569,800 8,569,706 70.0 5,8991996 14,330,240 13,225,100 9,063,976 67.3 5,6681997 16,302,982 14,505,200 10,029,567 66.4 5,5031998 17,113,882 15,534,900 11,069,949 67.8 5,696 1999 18,914,532 16,550,900 11,408,336 64.0 5,378 2000 20,068,582 18,413,000 12,599,222 63.3 5,312 2001 20,570,162 19,417,200 13,107,523 63.3 5,294 2002 22,258,362 20,482,000 12,912,670 63.2 5,268 2003 23,632,512 22,079,500 13,616,046 63.8 5,308 2004 24,939,562 23,343,500 14,090,752 59.5 4,980 2005 26,448,194 24,712,400 14,902,048 62.3 5,197 2006 27,617,994 25,595,700 15,773,162 61.6 5,143 2007 28,232,794 26,198,100 16,246,388 61.3 5,116 2008 28,703,794 25,165,794 16,261,305 59.9 5,018 2009 30,194,294 24,732,589 15,346,043 54.5 4,555 2010 30,717,054 26,741,100 17,078,765 58.5 4,901 2011 31,046,780 27,767,700 18,731,142 63.6 5,341 2012 30,448,780 26,415,000 18,513,280 62.6 5,272 2013 30,461,580 27,404,500 18,590,982 63.5 5,347 2014 29,889,580 28,066,500 19,294,645 66.3 5,582 2015 29,889,580 27,955,800 19,541,098 68.1 5,743 2016 30,687,274 29,118,300 20,599,469 70.9 5,997 2017 29,970,474 30,192,100 22,254,808 74.3 6,268 2018 32,261,994 30,437,300 21,901,726 71.1 5,992
5-5c. Installed Capacity and Operation of the Power System (Continued)II. Thermal
114

Period Installed Capacity(kW)
System Peak Load(kW)
System Average Load(kW)
Capacity Factor Power Generation (kWh)per Installed kW
1977 636,000 284,000 10,435 9.8 8621980 1,272,000 1,192,400 889,353 69.9 6,1421985 5,144,000 4,238,500 3,144,469 67.9 5,7071990 5,144,000 4,772,000 3,602,057 72.9 6,1341994 5,144,000 4,878,000 3,821,960 77.4 6,5091995 5,144,000 4,879,400 3,873,348 78.4 6,5961996 5,144,000 4,918,100 4,136,288 83.6 7,0631997 5,144,000 4,928,200 3,977,812 80.5 6,7741998 5,144,000 4,901,000 4,041,989 81.8 6,883 1999 5,144,000 4,870,600 4,213,133 85.3 7,175 2000 5,144,000 4,951,000 4,211,800 85.2 7,912 2001 5,144,000 4,925,700 3,892,007 78.8 6,628 2002 5,144,000 4,879,500 4,338,960 87.8 7,389 2003 5,144,000 4,946,000 4,266,106 86.3 7,265 2004 5,144,000 4,946,000 4,319,063 87.4 7,375 2005 5,144,000 4,918,200 4,384,005 88.7 7,466 2006 5,144,000 4,951,200 4,374,042 88.5 7,449 2007 5,144,000 4,980,700 4,447,577 90.0 7,574 2008 5,144,000 4,974,230 4,469,542 90.4 7,632 2009 5,144,000 5,026,300 4,564,045 92.3 7,772 2010 5,144,000 5,028,400 4,569,466 92.4 7,782 2011 5,144,000 5,063,000 4,625,825 93.5 7,878 2012 5,144,000 5,076,300 4,427,059 89.5 7,560 2013 5,144,000 5,119,900 4,575,187 92.4 7,791 2014 5,144,000 5,142,200 4,657,655 94.1 7,932 2015 5,144,000 4,530,100 4,000,800 80.9 6,832 2016 5,144,000 4,517,900 3,477,295 70.1 5,922 2017 5,144,000 2,893,000 2,461,241 46.8 4,191 2018 4,508,000 3,851,700 3,042,971 54.5 5,236
5-5d. Installed Capacity and Operation of the Power System (Continued)III. Nuclear
115

Period Installed Capacity(kW)
System Peak Load(kW)
System Average Load(kW)
Capacity Factor Power Generation (kWh)per Installed kW
2007 181,560 148,400 49,126 34.9 3,033 2008 245,960 295,344 68,577 29.1 2,555 2009 369,860 316,166 96,824 28.3 2,481 2010 471,460 451,800 116,650 28.5 2,492 2011 472,200 515,500 174,960 34.7 3,041 2012 566,560 557,700 169,572 31.0 2,719 2013 609,760 595,500 184,622 30.9 2,705 2014 632,760 589,200 169,691 27.0 2,369 2015 642,260 591,100 171,632 26.9 2,358 2016 677,660 597,800 164,678 24.8 2,180 2017 692,560 619,000 193,317 28.2 2,464 2018 701,861 639,600 187,612 27.4 2,368
Period Installed Capacity(kW)
System Peak Load(kW)
System Average Load(kW) Capacity Factor Power Generation (kWh)
per Installed kW
2013 282,846 335,100 34,373 - -2014 437,547 352,600 58,416 - -2015 668,564 677,700 92,553 - -2016 931,218 847,100 121,594 - -2017 1,383,302 1,061,800 184,996 15.7 1,373 2018 2,342,202 1,610,400 303,878 16.3 1,425
Period Installed Capacity(kW)
System Peak Load(kW)
System Average Load(kW) Capacity Factor Power Generation (kWh)
per Installed kW
2016 1,103 2,800 306 - -2017 1,433 700 357 - -2018 1,498 800 658 - -
5-5e. Installed Capacity and Operation of the Power System (Continued)IV. Wind
V. Solar
IV. BioEnergy
116

Geotherma
1952 1,420 1,231 189 - - - - - 1,076 817 259 3441955 1,966 1,531 435 - - - - - 1,497 1,156 341 4691960 3,628 2,065 1,563 - - - - - 3,136 2,545 591 4921965 6,455 2,585 3,870 - - - - - 5,672 4,557 1,115 7831970 13,213 2,846 10,367 - - - - - 11,964 9,242 2,722 1,1971975 22,894 5,235 17,659 - - - - - 21,217 16,095 5,122 1,6251980 40,813 2,905 30,096 7,812 - - - - 37,947 28,816 9,131 2,7861985 52,556 6,900 18,110 27,546 - - - - 47,919 34,927 12,992 2,8731990 82,350 8,167 42,629 31,554 - - - - 74,345 51,841 22,504 5,3551994 110,276 8,865 67,931 33,480 - - - - 98,561 65,214 33,347 6,4351995 117,859 8,858 75,071 33,930 - - - - 105,368 68,931 36,437 6,8481996 124,973 9,022 79,618 36,333 - - - - 111,140 72,114 39,026 7,6701997 132,248 9,543 87,859 34,846 - - - - 118,299 78,238 40,061 7,8201998 142,964 10,584 96,972 35,408 - - - - 128,130 83,049 45,081 8,658 1999 145,761 8,917 99,937 36,907 - - - - 131,726 86,844 44,882 8,622 2000 156,511 8,843 110,672 36,996 - - - - 142,413 94,768 47,645 8,735 2001 158,058 9,138 114,820 34,094 6 - - - 143,623 94,807 48,816 8,610 2002 165,901 6,358 121,526 38,009 8 - - - 151,193 100,435 50,758 9,417 2003 173,810 6,863 129,566 37,371 10 - - - 159,380 106,043 53,336 8,751 2004 181,245 6,524 136,769 37,939 13 - - - 167,478 113,293 54,185 8,937 2005 189,663 7,885 143,295 38,404 79 - - - 175,293 117,648 57,645 9,036 2006 196,567 7,970 150,014 38,317 267 - - - 181,593 123,598 57,996 9,539 2007 201,856 8,322 154,142 38,960 430 - - - 187,075 128,226 58,848 9,590 2008 200,241 7,742 152,636 39,260 602 0.38 - - 186,931 128,644 58,288 9,1712009 193,605 7,019 145,756 39,981 848 1.18 - - 179,239 121,348 57,890 9,418 2010 207,385 7,216 159,112 40,029 1,022 6.25 - - 193,313 134,135 59,179 9,669 2011 213,042 6,864 164,085 40,522 1,533 38.10 - - 198,637 138,161 60,476 10,149 2012 211,708 8,572 162,621 38,887 1,490 138.46 - - 198,391 139,134 59,256 9,360 2013 213,429 8,575 162,857 40,079 1,617 301.11 - - 201,945 142,529 59,416 9,081 2014 219,224 7,403 169,021 40,801 1,486 511.72 - - 205,956 144,579 61,377 8,960 2015 219,104 7,471 174,175 35,143 1,503 810.76 1.35 - 206,491 145,302 61,189 8,146 2016 225,793 9,819 182,996 30,461 1,447 1,068.08 2.69 - 212,531 148,697 63,835 8,685 2017 231,076 8,746 197,453 21,560 1,693 1,620.56 3.13 - 217,213 153,116 64,097 8,827 2018 233,289 7,803 194,518 26,656 1,643 2,661.97 5.76 0.001 219,108 155,640 63,468 9,200
(1) Excluding Taipower use in consumption since 1970. Source: See Table 5-5a.
Power Generation
I. Amount (million kWh)
5-6a. Power Generation and Consumption
Period
Power Consumption
LossTotal Hydro Thermal Nuclear Wind Solar Total (1) IndustryResidential &CommercialCustomers
BioEnergy
117

Residential &Geotherma Commercial
Customers
1952 100.0 86.7 13.3 - - - - - 100.0 75.9 24.1 24.21955 100.0 77.9 22.1 - - - - - 100.0 77.3 22.7 23.91960 100.0 56.9 43.1 - - - - - 100.0 81.2 18.8 13.61965 100.0 40.1 59.9 - - - - - 100.0 80.3 19.7 12.11970 100.0 21.5 78.5 - - - - - 100.0 77.2 22.8 9.11975 100.0 22.9 77.1 - - - - - 100.0 75.9 24.1 7.11980 100.0 7.1 73.7 19.2 - - - - 100.0 75.9 24.1 6.81985 100.0 13.1 34.5 52.4 - - - - 100.0 72.9 27.1 5.51990 100.0 9.9 51.8 38.3 - - - - 100.0 69.7 30.3 6.51994 100.0 8.0 61.6 30.4 - - - - 100.0 66.2 33.8 6.01995 100.0 7.5 63.7 28.8 - - - - 100.0 65.4 34.6 5.81996 100.0 7.2 63.7 29.1 - - - - 100.0 64.9 35.1 6.11997 100.0 7.2 66.4 26.3 - - - - 100.0 66.1 33.9 5.91998 100.0 7.4 67.8 24.8 - - - - 100.0 64.8 35.2 6.1 1999 100.0 6.1 68.6 25.3 - - - - 100.0 65.9 34.1 5.9 2000 100.0 5.7 70.7 23.6 - - - - 100.0 66.5 33.5 5.6 2001 100.0 5.8 72.6 21.6 0.004 - - - 100.0 66.0 34.0 5.4 2002 100.0 3.8 73.3 22.9 0.005 - - - 100.0 66.4 33.6 5.7 2003 100.0 3.9 74.5 21.5 0.006 - - - 100.0 66.5 33.5 5.0 2004 100.0 3.6 75.5 20.9 0.007 - - - 100.0 67.6 32.4 4.9 2005 100.0 4.2 75.6 20.2 0.042 - - - 100.0 67.1 32.9 4.8 2006 100.0 4.1 76.3 19.5 0.136 - - - 100.0 68.1 31.9 4.9 2007 100.0 4.1 76.4 19.3 0.213 - - - 100.0 68.5 31.5 4.8 2008 100.0 3.9 76.2 19.6 0.301 0.000 - - 100.0 68.8 31.2 4.6 2009 100.0 3.6 75.3 20.7 0.438 0.001 - - 100.0 67.7 32.3 4.9 2010 100.0 3.5 76.7 19.3 0.493 0.003 - - 100.0 69.4 30.6 4.7 2011 100.0 3.2 77.0 19.0 0.719 0.018 - - 100.0 69.6 30.4 4.8 2012 100.0 4.0 76.8 18.4 0.704 0.065 - - 100.0 70.1 29.9 4.4 2013 100.0 4.0 76.3 18.8 0.758 0.141 - - 100.0 70.6 29.4 4.3 2014 100.0 3.4 77.1 18.6 0.678 0.233 - - 100.0 70.2 29.8 4.1 2015 100.0 3.4 79.5 16.0 0.686 0.370 0.001 - 100.0 70.4 29.6 3.7 2016 100.0 4.3 81.0 13.5 0.641 0.473 0.001 - 100.0 70.0 30.0 3.8 2017 100.0 3.8 85.4 9.3 0.733 0.701 0.001 - 100.0 70.5 29.5 3.8 2018 100.0 3.3 83.4 11.4 0.704 1.141 0.002 0.00 100.0 71.0 29.0 3.9
BioEnergySolarNuclear Wind Total Industry
II. Percentage (%)
5-6b. Power Generation and Consumption (Continued)
Period
Power Generation Power Consumption Loss of totalpower
generation (%)Total Hydro Thermal
118

1955 1,156 78 111 80 434 35 285 133 1960 2,545 177 202 165 1,001 113 603 284 1965 4,557 296 337 318 1,620 316 1,023 647 1970 9,242 292 630 1,069 3,009 716 1,920 1,606 1975 16,095 339 814 2,629 5,070 1,124 3,136 2,983 1980 28,816 620 1,262 3,874 7,957 2,469 6,843 5,791 1985 34,927 519 1,596 5,014 9,607 2,560 6,891 8,740 1990 51,841 171 2,372 6,304 12,449 3,620 11,799 15,126 1994 65,214 213 2,851 6,952 13,385 4,442 15,628 21,743 1995 68,931 210 2,924 6,844 13,986 4,373 17,414 23,180 1996 72,114 184 2,959 7,103 13,942 4,174 18,928 24,824 1997 78,238 190 2,928 7,471 14,440 4,158 22,545 26,506 1998 83,049 353 2,889 8,123 17,090 4,096 25,103 25,395 1999 86,844 334 2,861 8,375 17,474 3,958 27,473 26,369 2000 94,768 319 3,004 8,640 17,808 3,847 32,137 29,013 2001 94,807 293 2,989 8,083 17,557 3,718 32,597 29,570 2002 100,435 367 3,102 8,315 18,038 3,843 35,926 30,844 2003 106,043 431 3,191 8,133 18,829 3,905 39,166 32,388 2004 113,293 444 3,261 8,016 19,357 4,295 43,849 34,071 2005 117,648 443 3,304 7,296 19,053 4,656 47,721 35,175 2006 123,598 453 3,321 7,056 19,211 4,962 51,832 36,763 2007 128,226 462 3,380 6,891 20,157 5,019 55,110 37,207 2008 128,644 380 3,309 6,367 19,647 4,851 56,565 37,525 2009 121,348 338 3,325 5,711 19,334 4,342 52,169 36,130 2010 134,135 419 3,494 6,236 21,454 4,908 60,574 37,050 2011 138,161 435 3,560 6,029 21,492 5,493 64,207 36,945 2012 139,134 416 3,636 5,792 21,516 5,349 65,446 36,980 2013 142,529 469 3,719 5,793 21,434 5,564 68,178 37,372 2014 144,579 495 3,788 5,645 21,198 5,555 70,134 37,763 2015 145,302 482 3,899 5,514 21,377 5,392 70,253 38,385 2016 148,697 457 4,028 5,271 21,857 5,192 72,825 39,067 2017 153,116 448 4,064 5,050 22,511 5,227 76,062 39,754 2018 155,640 451 4,144 4,874 22,828 5,202 77,821 40,322 (1) Excluding irrigation.Source: See Table 5-5a.
Ceramics Metals &Machinery Others
5-7. Power Consumption by IndustryUnit: million kWh
Period Total (1) Mining Food Textiles Chemicals
119

1955 2,502.9 1,801.5 1,625.3 146.8 25.7 3.7 - - - -1960 4,081.0 2,815.8 2,592.7 197.9 22.9 2.3 - - - -1965 6,308.2 4,029.4 3,482.0 247.9 278.7 20.8 - - - -1970 11,197.3 4,155.2 2,927.5 273.8 852.5 101.5 - - - -1975 16,004.6 4,190.0 2,055.2 503.0 1,417.1 214.8 - - - -1980 33,690.0 3,937.8 1,684.1 279.7 1,762.7 211.4 - - - -1985 39,190.4 3,104.5 1,215.8 573.7 1,194.1 118.1 - 2.8 - -1990 57,879.1 2,347.5 308.9 610.0 1,173.9 182.4 - 2.7 19.6 49.99 1995 78,251.7 1,763.4 153.9 462.7 837.0 62.3 - 0.0 54.6 192.92 1996 81,699.5 1,732.3 96.5 453.4 800.9 59.7 - 0.0 60.4 261.41 1997 86,321.9 1,912.6 64.8 501.5 764.2 50.7 - 0.0 66.0 465.41998 89,903.3 2,118.9 51.8 592.9 781.3 54.0 - 0.0 70.1 568.81999 94,720.9 2,205.2 60.0 482.9 760.6 47.1 - 0.0 73.2 781.52000 101,883.9 2,210.4 54.2 435.9 663.9 37.2 - 0.1 77.3 941.92001 106,548.5 2,627.5 0.0 486.6 754.8 40.6 - 1.2 81.1 1,263.22002 111,630.0 2,547.9 0.0 265.7 788.3 51.1 3.3 1.6 84.3 1,353.72003 119,747.0 2,858.0 0.0 290.1 738.6 45.8 44.5 2.3 87.9 1,648.92004 132,791.7 2,878.7 0.0 306.9 707.0 44.6 52.1 2.5 92.7 1,673.02005 134,148.8 2,708.4 0.0 381.1 486.6 32.4 32.4 8.8 97.5 1,669.62006 136,833.5 2,682.9 0.0 390.8 411.5 23.6 39.1 26.5 102.4 1,688.92007 144,066.4 2,764.6 0.0 422.3 370.5 17.8 49.1 42.2 105.5 1,757.12008 139,288.7 2,784.0 0.0 411.6 317.7 16.1 75.7 56.7 109.5 1,796.82009 136,482.1 2,636.6 0.0 358.3 311.7 16.0 56.5 76.1 113.2 1,704.72010 143,079.0 2,722.8 0.0 401.0 263.3 14.2 54.3 100.6 114.3 1,775.22011 138,916.2 2,807.1 0.0 382.4 293.5 11.3 52.2 149.4 113.2 1,805.12012 141,691.4 3,095.6 0.0 542.0 392.9 11.4 47.8 151.7 114.0 1,835.82013 144,228.5 3,047.9 0.0 518.4 338.7 10.5 44.5 189.1 112.8 1,833.82014 148,591.7 2,913.6 0.0 412.8 337.2 9.1 61.2 196.2 112.2 1,785.12015 146,198.5 2,999.8 0.0 427.3 332.2 9.2 82.5 229.5 113.5 1,805.52016 146,685.7 3,097.9 0.0 627.3 285.8 8.4 77.8 247.5 112.1 1,738.92017 146,635.3 2,966.1 0.0 520.7 236.2 5.4 82.7 326.4 113.1 1,681.62018 148,830.0 2,811.6 0.0 427.0 175.6 4.7 74.3 421.8 46.0 1,662.2
Source: The data are provided by the Bureau of Energy, Ministry of Economic Affairs, R.O.C.
Hydro-ElectricPower
NaturalGas
CrudeOil
Geothermal,Solar and Wind
SolarThermal
Biomass andWaste
5-8a. Supply of Commercial EnergyUnit: 1,000 KLOE
Period TotalDomestic Production
Subtotal Coal RefineryFeedstocks
120

1955 701.4 701.4 - - - -1960 1,265.2 1,265.2 - - - -1965 2,278.8 2,278.8 - - - -1970 7,042.1 6,937.3 104.7 - - -1975 11,814.6 11,738.9 75.7 - - -1980 29,752.1 24,055.7 3,322.1 - - 2,374.41985 36,085.9 20,701.7 7,064.9 - - 8,319.31990 55,531.6 32,137.2 13,020.8 855.6 - 9,518.01995 76,488.3 43,408.1 19,538.1 3,314.7 - 10,227.41996 79,967.2 44,583.8 21,004.6 3,435.5 - 10,943.31997 84,409.4 45,245.5 24,454.1 4,206.2 - 10,503.61998 87,784.4 47,066.0 24,945.9 5,108.1 - 10,664.41999 92,515.7 49,030.9 27,126.6 5,233.0 - 11,125.22000 99,673.5 52,528.5 30,192.9 5,801.6 - 11,150.42001 103,920.9 54,941.4 32,493.4 6,209.4 - 10,276.92002 109,082.0 56,191.2 34,435.6 7,000.7 - 11,454.52003 116,889.0 61,992.8 36,332.4 7,300.7 - 11,263.02004 129,913.0 69,404.0 40,000.0 9,072.7 - 11,436.32005 131,440.4 70,741.7 39,749.8 9,373.0 - 11,575.92006 134,150.6 71,223.0 41,216.6 10,164.4 - 11,546.52007 141,301.9 75,400.1 43,311.2 10,850.4 0.1 11,740.12008 136,504.7 70,614.6 42,187.9 11,878.7 0.0 11,823.52009 133,845.5 71,668.7 38,538.9 11,598.9 0.1 12,039.02010 140,356.2 71,538.5 42,236.0 14,525.8 0.1 12,055.72011 136,109.1 63,943.8 43,982.1 15,986.2 0.1 12,196.92012 138,595.8 67,660.2 42,535.0 16,694.3 0.1 11,706.12013 141,180.6 68,279.1 44,043.7 16,798.9 0.1 12,058.82014 145,678.0 71,772.4 43,940.6 17,689.1 0.1 12,275.82015 143,198.7 70,310.4 43,378.4 18,947.7 0.1 10,562.02016 143,587.7 71,637.3 43,036.9 19,744.2 0.1 9,169.12017 143,669.2 70,950.6 44,246.4 21,971.8 0.1 6,500.22018 146,018.4 71,821.8 43,749.0 22,430.8 0.1 8,016.8
5-8b. Supply of Commercial Energy (Continued)Unit: 1,000 KLOE
PeriodImport
Subtotal Crude Oil andPetroleum Products
Coal LiquefiedNatural Gas
Biomass andWaste
Nuclear
121

Unit: 1,000 KLOE
Electric Power
1955 1,756.7 1,929.8 1,413.1 493.5 23.1 - - - 1960 2,837.7 2,774.2 1,932.9 820.5 20.8 - - - 1965 4,395.4 4,117.5 2,475.2 1,425.8 216.5 - - - 1970 7,849.7 6,605.5 2,751.8 3,226.3 627.4 - - - 1975 10,005.6 10,239.6 1,806.2 7,247.5 1,185.9 - - - 1980 23,233.4 19,408.3 1,713.6 16,121.9 1,572.8 - - - 1985 29,887.6 26,132.6 2,782.9 17,284.4 1,029.0 - - 5,036.31990 43,191.2 36,716.2 4,402.2 22,819.9 1,043.8 320.4 - 8,110.31995 58,916.4 48,761.3 5,045.1 29,158.4 1,484.4 969.7 - 12,049.21996 61,065.3 50,888.7 5,194.2 30,272.3 1,486.4 1,035.6 0.1 12,839.71997 63,608.7 52,843.3 5,848.8 30,574.7 1,471.3 1,019.1 164.8 13,698.61998 64,701.5 55,200.1 5,947.9 31,657.4 1,461.8 1,076.1 209.9 14,776.81999 68,632.1 57,474.1 5,947.5 33,436.6 1,360.7 1,027.5 242.5 15,386.12000 73,111.8 61,184.8 6,712.4 34,819.0 1,325.1 1,095.3 279.3 16,873.72001 77,292.5 65,920.8 6,844.8 39,014.5 1,221.7 1,081.9 397.0 17,255.22002 80,279.8 68,496.5 7,313.7 40,069.8 1,165.8 1,215.3 430.7 18,188.62003 88,143.2 72,380.1 8,191.8 42,056.2 1,209.1 1,124.3 512.6 19,164.42004 99,494.8 75,620.1 8,453.5 43,929.7 1,246.7 1,262.3 535.8 20,065.42005 98,639.4 76,557.4 8,354.8 44,073.4 1,269.2 1,211.2 549.5 20,884.52006 101,261.3 77,443.6 8,916.0 43,635.5 1,205.4 1,263.7 552.3 21,602.42007 107,225.4 82,045.3 9,533.9 46,745.4 1,214.5 1,354.6 563.3 22,321.32008 103,665.6 78,785.0 8,810.6 44,555.9 1,224.5 1,387.5 576.2 21,957.92009 102,098.3 78,392.4 8,277.4 45,430.4 1,233.8 1,410.4 531.3 21,100.22010 107,288.4 83,544.4 9,713.3 47,066.8 1,280.8 1,745.0 581.5 22,696.02011 101,632.2 81,311.9 10,192.6 43,594.0 1,360.2 2,024.9 561.3 23,143.22012 104,641.0 81,496.1 10,084.2 43,644.7 1,367.5 2,338.7 543.1 23,060.12013 107,418.0 84,090.2 10,829.5 45,194.4 1,360.4 2,313.4 537.8 23,432.22014 110,596.3 85,066.4 10,372.7 46,127.1 1,419.8 2,189.7 555.9 24,003.12015 110,311.8 85,215.8 10,362.0 46,234.9 1,425.0 2,371.1 566.8 23,901.82016 110,367.9 85,741.5 10,427.3 46,087.1 1,482.4 2,419.6 520.1 24,418.22017 109,826.2 85,263.4 9,863.1 45,228.2 1,511.7 2,793.7 484.3 24,989.22018 112,535.8 86,825.5 9,774.2 46,331.8 1,597.6 3,076.9 431.6 25,275.3
Source: See Table 5-8a.
5-9a. Final Demand for Commercial Energy
Period Grand Total
Domestic Consumption
Total Coal and ItsProducts
PetroleumProducts
Natural Gas LiquefiedNatural Gas
Biomass andWaste
122

Unit: 1,000 KLOEInter- Inter-
national nationalMarine CivilBunkers Aviation
1955 - - 262.7 169.5 93.2 - - - -111.2 -324.61960 - - 479.9 308.5 171.4 - - - -72.7 -343.61965 - - 375.0 372.1 2.9 - - - 187.3 -284.51970 - - 1,049.9 1,028.7 21.2 - - 1.5 318.2 -125.41975 - - 762.1 750.3 11.8 - - 46.8 -674.6 -368.21980 - - 345.6 340.1 5.5 - 233.8 304.3 2313.9 627.51985 - - 2,084.9 2,078.7 6.2 - 570.1 321.7 174.9 603.41990 19.6 - 590.5 571.5 19.1 - 1,700.4 631.2 3016.0 536.71995 54.6 - 1,921.2 1,921.0 0.2 - 2,644.9 1,439.7 3051.9 1097.41996 60.4 - 2,646.1 2,645.9 0.2 - 2,576.0 1,538.7 2311.4 1104.41997 66.0 - 3,679.1 3,678.4 0.7 - 3,058.2 1,592.1 1412.5 1023.51998 70.1 - 2,252.4 2,251.9 0.4 - 3,383.1 1,691.7 708.3 1466.01999 73.2 - 2,518.3 2,516.9 1.5 - 4,395.6 1,868.9 940.7 1434.52000 77.3 2.7 2,644.1 2,635.8 8.3 - 3,995.2 1,890.9 1737.6 1659.22001 81.1 24.7 4,905.6 4,900.9 4.7 - 2,886.3 1,849.2 735.0 995.42002 84.3 28.2 6,846.2 6,837.3 8.9 - 2,789.6 1,948.3 -880.7 1079.92003 87.9 33.8 11,123.5 11,115.5 8.0 - 3,429.8 1,921.5 -1417.7 706.02004 92.7 34.1 14,784.8 14,782.7 2.1 - 2,771.5 2,193.4 3597.4 527.62005 97.5 117.3 17,215.8 17,181.8 34.0 - 2,720.3 2,271.7 1042.3 -1168.12006 102.4 165.9 16,458.6 16,442.5 16.0 - 2,682.6 2,364.9 1550.7 760.92007 105.5 206.8 19,496.5 19,487.5 9.0 - 2,401.1 2,336.5 410.0 536.02008 109.5 162.9 19,054.2 18,984.6 69.6 - 2,068.2 2,062.4 676.6 1019.22009 113.2 295.8 20,892.2 20,862.4 29.8 - 1,830.9 1,949.0 -1335.8 369.52010 114.3 346.8 18,074.8 17,982.5 92.3 - 1,978.2 2,199.1 -85.7 1577.72011 113.2 322.5 15,543.9 15,464.6 78.3 1.1 1,809.5 2,193.5 -1248.8 2022.12012 114.0 343.7 18,961.1 18,871.9 89.3 - 1,313.3 2,305.6 -366.7 931.52013 112.8 309.7 19,512.7 19,500.5 12.2 - 1,360.0 2,444.7 -1102.1 1112.52014 112.2 285.9 19,542.3 19,485.0 57.3 - 1,303.9 2,666.6 712.5 1304.62015 113.5 240.7 18,861.4 18,860.5 0.8 - 1,219.9 2,840.3 349.0 1825.42016 112.1 274.8 19,298.2 19,297.1 1.2 - 1,439.9 3,052.7 -397.4 1232.92017 113.1 280.2 19,228.8 19,192.3 36.5 - 1,345.6 3,164.7 173.0 650.72018 46.0 292.2 20,524.4 20,504.6 19.7 - 1,303.9 3,234.0 -1,273.4 1,921.4
SolarThermal Heat Total Petroleum
ProductsCoal & ItsProducts
Biomassand
Waste
5-9b. Final Demand for Commercial Energy (Continued)
Period
ExportInventoryChange
Loss andStatistical
Discre-pancy
123

1955 2,607.2 2,598.8 107.2 1,200.8 10.1 160.7 305.8 92.41960 3,886.2 3,881.3 177.7 2,064.5 11.3 200.4 563.9 135.61965 5,850.2 5,708.0 303.0 3,269.0 22.6 256.2 829.3 208.21970 9,618.0 9,361.9 409.1 5,688.8 48.1 382.4 1,609.9 600.51975 15,580.0 15,188.3 734.5 8,603.7 80.6 602.8 2,183.9 1,260.81980 29,088.6 25,534.1 999.5 13,524.0 154.2 810.9 2,199.3 1,775.51985 26,132.6 22,232.5 1,043.2 9,541.6 105.1 588.0 1,025.0 1,306.91990 36,716.2 31,823.4 1,201.2 13,668.5 56.9 768.1 2,645.3 1,619.11995 48,761.3 41,412.6 1,185.2 17,158.5 49.5 768.8 3,772.7 1,964.11996 50,888.7 43,299.0 1,212.5 17,758.8 50.0 774.7 4,000.6 2,118.61997 52,843.3 45,195.9 1,098.6 19,114.3 57.0 772.0 4,240.4 2,216.51998 55,200.1 46,939.3 924.5 19,495.9 68.1 755.9 4,463.0 2,242.21999 57,474.1 48,875.0 933.4 20,663.1 69.8 829.3 4,937.0 2,419.62000 61,184.8 51,666.7 1,060.5 22,343.6 74.7 819.6 5,775.7 2,511.92001 65,920.8 51,826.1 1,090.8 22,113.0 72.4 793.5 5,977.7 2,215.62002 68,496.5 53,673.1 1,101.6 23,438.6 73.2 819.5 6,640.6 2,079.92003 72,380.1 55,581.5 1,237.8 24,379.1 69.9 752.9 7,440.7 1,887.72004 75,620.1 57,966.2 1,304.8 25,486.3 77.9 768.9 8,031.4 2,056.42005 76,557.4 59,101.3 1,177.6 25,668.0 79.1 774.4 8,143.8 1,900.12006 77,443.6 59,703.7 837.6 26,640.3 76.4 746.2 8,792.5 1,740.32007 82,045.3 59,856.2 640.1 27,557.3 78.3 744.8 9,544.3 1,693.62008 78,785.0 56,727.4 738.3 25,694.1 81.0 723.3 8,279.5 1,549.62009 78,392.4 55,100.1 605.3 24,281.0 89.6 719.9 8,320.9 1,349.72010 83,544.4 58,962.0 588.6 27,252.1 99.2 759.2 8,998.8 1,555.62011 81,311.9 59,590.1 598.2 27,751.9 102.1 759.5 8,565.3 1,485.62012 81,496.1 58,764.1 635.4 27,449.3 84.8 762.1 8,286.8 1,507.02013 84,090.2 59,373.7 629.9 27,995.5 82.7 747.9 8,302.0 1,518.32014 85,066.4 59,863.5 659.5 27,605.7 82.9 764.1 8,153.7 1,484.42015 85,215.8 59,550.7 674.0 27,031.8 82.0 767.8 7,973.7 1,362.92016 85,741.5 60,353.8 663.6 27,246.9 75.1 785.0 8,119.9 1,243.22017 85,263.4 60,234.5 650.0 27,262.7 76.1 778.8 7,936.0 1,211.22018 86,825.5 60,560.5 637.8 27,457.1 74.3 782.8 8,134.8 1,225.9
Source: See Table 5-8a.
Food Chemicals Textiles
5-10a. Final Consumption of Commercial Energy by SectorUnit: 1,000 KLOE
Period Grand TotalEnergy Use
TotalAgricultural
SectorIndustrial Sector
Subtotal Mining
124
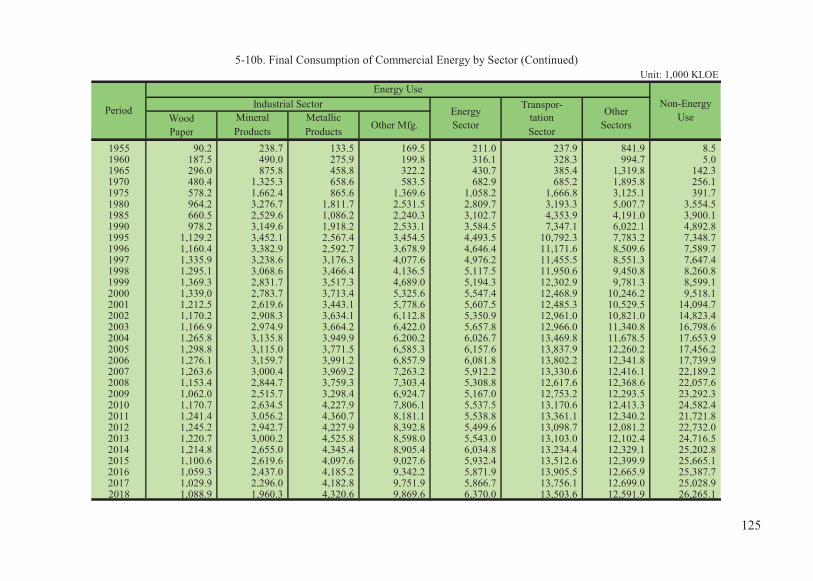
Transpor-Mineral Metallic tationProducts Products Sector
1955 90.2 238.7 133.5 169.5 211.0 237.9 841.9 8.51960 187.5 490.0 275.9 199.8 316.1 328.3 994.7 5.01965 296.0 875.8 458.8 322.2 430.7 385.4 1,319.8 142.31970 480.4 1,325.3 658.6 583.5 682.9 685.2 1,895.8 256.11975 578.2 1,662.4 865.6 1,369.6 1,058.2 1,666.8 3,125.1 391.71980 964.2 3,276.7 1,811.7 2,531.5 2,809.7 3,193.3 5,007.7 3,554.51985 660.5 2,529.6 1,086.2 2,240.3 3,102.7 4,353.9 4,191.0 3,900.11990 978.2 3,149.6 1,918.2 2,533.1 3,584.5 7,347.1 6,022.1 4,892.81995 1,129.2 3,452.1 2,567.4 3,454.5 4,493.5 10,792.3 7,783.2 7,348.71996 1,160.4 3,382.9 2,592.7 3,678.9 4,646.4 11,171.6 8,509.6 7,589.71997 1,335.9 3,238.6 3,176.3 4,077.6 4,976.2 11,455.5 8,551.3 7,647.41998 1,295.1 3,068.6 3,466.4 4,136.5 5,117.5 11,950.6 9,450.8 8,260.81999 1,369.3 2,831.7 3,517.3 4,689.0 5,194.3 12,302.9 9,781.3 8,599.12000 1,339.0 2,783.7 3,713.4 5,325.6 5,547.4 12,468.9 10,246.2 9,518.12001 1,212.5 2,619.6 3,443.1 5,778.6 5,607.5 12,485.3 10,529.5 14,094.72002 1,170.2 2,908.3 3,634.1 6,112.8 5,350.9 12,961.0 10,821.0 14,823.42003 1,166.9 2,974.9 3,664.2 6,422.0 5,657.8 12,966.0 11,340.8 16,798.62004 1,265.8 3,135.8 3,949.9 6,200.2 6,026.7 13,469.8 11,678.5 17,653.92005 1,298.8 3,115.0 3,771.5 6,585.3 6,157.6 13,837.9 12,260.2 17,456.22006 1,276.1 3,159.7 3,991.2 6,857.9 6,081.8 13,802.2 12,341.8 17,739.92007 1,263.6 3,000.4 3,969.2 7,263.2 5,912.2 13,330.6 12,416.1 22,189.22008 1,153.4 2,844.7 3,759.3 7,303.4 5,308.8 12,617.6 12,368.6 22,057.62009 1,062.0 2,515.7 3,298.4 6,924.7 5,167.0 12,753.2 12,293.5 23,292.32010 1,170.7 2,634.5 4,227.9 7,806.1 5,537.5 13,170.6 12,413.3 24,582.42011 1,241.4 3,056.2 4,360.7 8,181.1 5,538.8 13,361.1 12,340.2 21,721.82012 1,245.2 2,942.7 4,227.9 8,392.8 5,499.6 13,098.7 12,081.2 22,732.02013 1,220.7 3,000.2 4,525.8 8,598.0 5,543.0 13,103.0 12,102.4 24,716.52014 1,214.8 2,655.0 4,345.4 8,905.4 6,034.8 13,234.4 12,329.1 25,202.82015 1,100.6 2,619.6 4,097.6 9,027.6 5,932.4 13,512.6 12,399.9 25,665.12016 1,059.3 2,437.0 4,185.2 9,342.2 5,871.9 13,905.5 12,665.9 25,387.72017 1,029.9 2,296.0 4,182.8 9,751.9 5,866.7 13,756.1 12,699.0 25,028.92018 1,088.9 1,960.3 4,320.6 9,869.6 6,370.0 13,503.6 12,591.9 26,265.1
5-10b. Final Consumption of Commercial Energy by Sector (Continued)Unit: 1,000 KLOE
Period
Energy UseNon-Energy
UseIndustrial Sector
EnergySector
OtherSectorsWood
Paper Other Mfg.
125

End Saw Mill Printingof & Wood & Book-
Year Products binding
1952 9,966 4,232 942 866 485 1,103 198 794 174 1,172 1955 16,154 7,358 1,514 1,530 773 1,473 314 1,510 319 1,363 1960 18,788 8,467 1,185 2,093 1,128 1,632 912 2,082 562 727 1965 (2) 24,608 10,929 1,166 3,015 1,349 1,790 1,341 2,493 736 1,789 1970 (3) 15,031 2,668 1,575 3,144 1,217 1,133 1,475 2,269 525 1,025 1975 40,982 6,476 4,404 8,889 3,701 2,377 4,951 6,960 1,001 2,223 1980 55,421 7,177 6,106 11,936 4,846 3,064 7,464 11,220 1,225 2,383 1985 68,145 6,428 7,247 11,606 4,410 3,225 9,476 14,692 2,602 8,459 1990 92,978 6,595 8,761 16,246 4,646 3,746 15,996 26,719 4,163 6,106 1995 97,016 5,972 7,691 14,670 5,373 3,492 17,940 29,343 4,727 7,808 1996 96,756 5,913 7,513 14,452 5,108 3,380 18,363 29,753 4,711 7,563 1997 99,844 6,023 7,666 14,694 5,085 3,414 19,245 31,831 4,844 7,042 1998 98,836 5,854 7,442 14,448 4,842 3,230 19,332 31,528 4,827 7,333 1999 100,682 5,936 7,528 14,590 4,770 3,226 19,879 32,542 4,934 7,277 2000 98,860 5,771 7,210 14,218 4,424 3,120 19,821 32,564 4,921 6,811 2001 97,182 5,780 6,960 13,891 4,145 3,099 19,488 32,490 4,853 6,476 2002 94,338 5,669 6,890 13,785 4,042 3,093 19,229 32,456 4,553 4,621 2003 98,865 6,139 6,924 14,551 3,971 3,082 18,055 35,540 4,973 5,630 2004 90,751 5,889 6,062 13,591 3,397 2,706 17,468 32,742 4,531 4,365 2005 89,883 5,905 5,807 13,509 3,305 2,620 17,586 32,591 4,427 4,133 2006 86,324 5,833 5,499 13,098 3,003 2,580 17,189 31,404 4,241 3,477 2007 86,881 5,918 5,398 13,180 2,900 2,605 18,308 30,425 4,263 3,884 2008 86,331 5,937 5,197 13,129 2,805 2,616 18,728 29,979 4,178 3,762 2009 84,890 5,924 4,988 12,978 2,663 2,618 18,694 29,226 4,111 3,688 2010 84,287 5,969 4,831 12,864 2,541 2,592 18,896 28,982 3,988 3,624 2011 84,099 6,051 4,769 12,836 2,461 2,601 19,337 28,506 3,925 3,613 2012 85,959 6,284 4,819 13,124 2,503 2,689 20,218 28,686 3,971 3,665 2013 87,831 6,489 4,862 13,325 2,600 2,758 21,356 28,776 3,998 3,667 2014 88,008 6,644 4,840 13,220 2,596 2,797 22,056 28,307 3,949 3,599 2015 89,015 6,843 4,869 13,320 2,623 2,798 22,942 28,111 3,943 3,566 2016 90,778 7,137 4,942 13,510 2,730 2,786 24,042 28,089 3,974 3,568 2017 92,956 7,459 4,971 13,775 2,815 2,830 25,126 28,332 4,041 3,607 2018 93,523 7,663 4,901 13,861 2,851 2,825 25,876 27,957 4,021 3,568 (1) Excluding sub-stations of Taiwan Power Company. (2) Revised on the basis of a recheck of data. (3) Re-registrations were in progress: Figures show factories already re-registered. Sources: See Table 5-1.
5-11. Number of Factories Registered (1)
Total Food Textiles Chemicals Ceramics Metals Machinery& Tools Others
126

6. SCIENCE AND TECHNOLOGY


20072008200920102011201220132014201520162017
Notes: GDP and industry value added are based on figures announced by the DGBAS in November 2015. Source: Ministry of Science and Technology, R.O.C. (Taiwan), Indicators of Science and Technology, Taiwan , 2018.
2007 176,177 103,786 19,720 10.1 228,987 136,249 27,294 13.2 2008 185,123 110,461 20,824 10.6 241,366 144,234 28,994 13.9 2009 197,417 119,583 23,329 11.6 256,543 155,216 31,899 15.1 2010 211,413 128,347 25,520 12.2 273,447 165,585 34,613 15.8 2011 222,269 134,762 27,612 12.6 288,726 174,600 37,626 16.3 2012 229,167 140,102 29,003 12.9 296,724 179,830 39,144 16.6 2013 234,248 141,159 29,423 12.9 301,001 180,353 39,599 16.4 2014 240,528 142,983 30,187 12.9 307,933 182,119 40,276 16.4 2015 245,941 145,381 30,951 13.0 313,463 183,571 40,805 16.4 2016 251,042 147,710 31,639 13.1 317,014 185,472 41,551 16.5 2017 255,943 150,384 32,366 13.2 322,596 188,474 42,525 16.6
Notes: See Table 6-1. Source: See Table 6-1.
Researchersper 1,000
Employment
Researchersper 1,000
EmploymentResearchersResearchers Female
ResearchersPersonnelPeriod
Personnel FemaleResearchers
R&D Personnel (FTE) R&D Personnel (Headcount)
513,097
576,709 3.30 7.8
6-2. R&D Personnel Indicators
543,557 3.163.06 8.9 3.15
9.8
3.42
459,549 3.02434,962
485,669 3.013.083.02
416,2242.722.862.91
331,777351,790
2.47 2.332.68
2.96
396,641 2.81
6-1. R&D Expenditure Indicators
R&D Expenditureas a Percentage
of GDP (%)
10.4 2.772.60
10.0
2.84
Business Enterprise R&DExpenditures as a Percentage of
Value Added in Industry (%)Period
368,185
8.3 3.25
R&D Expenditure(NT$ million)
9.1 3.09
Basic Researchas a Percentage of R&D
Expenditure (%)
9.3
10.2
10.0
9.5
127
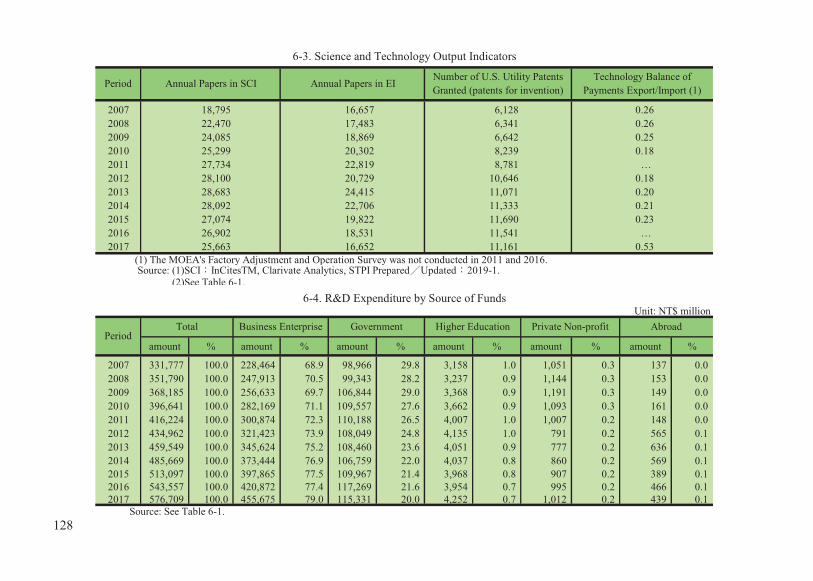
2007 18,795 16,657 6,128 0.262008 22,470 17,483 6,341 0.262009 24,085 18,869 6,642 0.252010 25,299 20,302 8,239 0.182011 27,734 22,819 8,781 …2012 28,100 20,729 10,646 0.182013 28,683 24,415 11,071 0.202014 28,092 22,706 11,333 0.212015 27,074 19,822 11,690 0.232016 26,902 18,531 11,541 …2017 25,663 16,652 11,161 0.53
(1) The MOEA's Factory Adjustment and Operation Survey was not conducted in 2011 and 2016.
(2)See Table 6-1.
amount % amount % amount % amount % amount % amount %
2007 331,777 100.0 228,464 68.9 98,966 29.8 3,158 1.0 1,051 0.3 137 0.02008 351,790 100.0 247,913 70.5 99,343 28.2 3,237 0.9 1,144 0.3 153 0.02009 368,185 100.0 256,633 69.7 106,844 29.0 3,368 0.9 1,191 0.3 149 0.02010 396,641 100.0 282,169 71.1 109,557 27.6 3,662 0.9 1,093 0.3 161 0.02011 416,224 100.0 300,874 72.3 110,188 26.5 4,007 1.0 1,007 0.2 148 0.02012 434,962 100.0 321,423 73.9 108,049 24.8 4,135 1.0 791 0.2 565 0.12013 459,549 100.0 345,624 75.2 108,460 23.6 4,051 0.9 777 0.2 636 0.12014 485,669 100.0 373,444 76.9 106,759 22.0 4,037 0.8 860 0.2 569 0.12015 513,097 100.0 397,865 77.5 109,967 21.4 3,968 0.8 907 0.2 389 0.12016 543,557 100.0 420,872 77.4 117,269 21.6 3,954 0.7 995 0.2 466 0.12017 576,709 100.0 455,675 79.0 115,331 20.0 4,252 0.7 1,012 0.2 439 0.1
Private Non-profit AbroadPeriod
Total
Source: See Table 6-1.
Business Enterprise Government Higher EducationUnit: NT$ million
6-4. R&D Expenditure by Source of Funds
Source: (1)SCI InCitesTM, Clarivate Analytics, STPI Prepared Updated 2019-1.
6-3. Science and Technology Output Indicators
PeriodTechnology Balance of
Payments Export/Import (1)Number of U.S. Utility PatentsGranted (patents for invention)Annual Papers in EIAnnual Papers in SCI
128

amount % amount % amount % amount % amount %
2007 331,777 100.0 229,517 69.2 60,643 18.3 40,400 12.2 1,218 0.4 2008 351,790 100.0 248,868 70.7 58,928 16.8 42,784 12.2 1,209 0.3 2009 368,185 100.0 258,039 70.1 61,587 16.7 47,200 12.8 1,359 0.4 2010 396,641 100.0 283,421 71.5 63,020 15.9 48,777 12.3 1,424 0.4 2011 416,224 100.0 301,477 72.4 62,546 15.0 50,790 12.2 1,410 0.3 2012 434,962 100.0 322,111 74.1 61,172 14.1 50,358 11.6 1,321 0.3 2013 459,549 100.0 346,206 75.3 60,993 13.3 50,895 11.1 1,455 0.3 2014 485,669 100.0 373,019 76.8 60,734 12.5 50,308 10.4 1,608 0.3 2015 513,097 100.0 397,163 77.4 63,603 12.4 50,761 9.9 1,569 0.3 2016 543,557 100.0 419,989 77.3 71,051 13.1 50,904 9.4 1,612 0.3 2017 576,709 100.0 454,116 78.7 69,627 12.1 51,560 8.9 1,406 0.2
Source: See Table 6-1.
amount % amount % % %
2007 331,777 100.0 33,189 10.0 25.7 64.3 2008 351,790 100.0 35,881 10.2 25.5 64.3 2009 368,185 100.0 38,388 10.4 25.5 64.0 2010 396,641 100.0 39,716 10.0 24.8 65.2 2011 416,224 100.0 40,774 9.8 23.8 66.4 2012 434,962 100.0 41,420 9.5 23.5 67.0 2013 459,549 100.0 42,747 9.3 23.3 67.4 2014 485,669 100.0 44,211 9.1 23.1 67.8 2015 513,097 100.0 45,669 8.9 23.2 67.9 2016 543,557 100.0 45,269 8.3 23.0 68.7 2017 576,709 100.0 45,110 7.8 22.9 69.2
Source: See Table 6-1.
213,46585,123
Unit: NT$ million6-5. R&D Expenditure by Sector of Performance
Basic Research
Higher Education
Unit: NT$ million
PeriodGovernmentTotal Business Enterprise Private Non-profit
amount
6-6. R&D Expenditure by Type of R&D
Experimental DevelopmentPeriod amount
Applied ResearchTotal
89,53894,01398,17998,872
102,146106,940
226,370235,784258,747276,578291,396309,862329,408348,495373,315399,322
112,049118,933124,973132,277
129
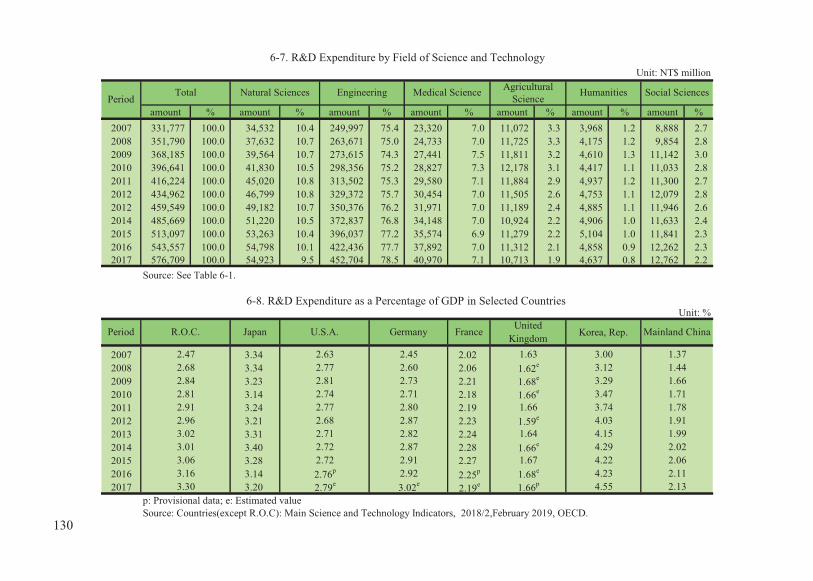
amount % amount % amount % amount % amount % amount % amount %2007 331,777 100.0 34,532 10.4 249,997 75.4 23,320 7.0 11,072 3.3 3,968 1.2 8,888 2.7 2008 351,790 100.0 37,632 10.7 263,671 75.0 24,733 7.0 11,725 3.3 4,175 1.2 9,854 2.8 2009 368,185 100.0 39,564 10.7 273,615 74.3 27,441 7.5 11,811 3.2 4,610 1.3 11,142 3.0 2010 396,641 100.0 41,830 10.5 298,356 75.2 28,827 7.3 12,178 3.1 4,417 1.1 11,033 2.8 2011 416,224 100.0 45,020 10.8 313,502 75.3 29,580 7.1 11,884 2.9 4,937 1.2 11,300 2.7 2012 434,962 100.0 46,799 10.8 329,372 75.7 30,454 7.0 11,505 2.6 4,753 1.1 12,079 2.8 2012 459,549 100.0 49,182 10.7 350,376 76.2 31,971 7.0 11,189 2.4 4,885 1.1 11,946 2.6 2014 485,669 100.0 51,220 10.5 372,837 76.8 34,148 7.0 10,924 2.2 4,906 1.0 11,633 2.4 2015 513,097 100.0 53,263 10.4 396,037 77.2 35,574 6.9 11,279 2.2 5,104 1.0 11,841 2.3 2016 543,557 100.0 54,798 10.1 422,436 77.7 37,892 7.0 11,312 2.1 4,858 0.9 12,262 2.3 2017 576,709 100.0 54,923 9.5 452,704 78.5 40,970 7.1 10,713 1.9 4,637 0.8 12,762 2.2
Source: See Table 6-1.
2007 3.34 2.022008 3.34 2.062009 3.23 2.212010 3.14 2.182011 3.24 2.192012 3.21 2.232013 3.31 2.242014 3.40 2.282015 3.28 2.272016 3.14 2.25p
2017 3.20 2.19e
p: Provisional data; e: Estimated value
2.68
1.66e
3.74
1.64 4.15
2.732.60
2.81
1.62e
3.47
2.96 2.68 2.87
2.81
2.91
2.842.74
Mainland China
6-7. R&D Expenditure by Field of Science and Technology
Korea, Rep.
Unit: %
PeriodTotal Natural Sciences Engineering Medical Science Agricultural Social Sciences
6-8. R&D Expenditure as a Percentage of GDP in Selected Countries
Unit: NT$ million
Japan
HumanitiesScience
Period U.S.A. FranceR.O.C.
2.45
Germany
2.632.47
UnitedKingdom
1.914.03
2.773.29 1.66
1.371.44
2.77 2.801.71
1.68e
2.71
1.63 3.003.12
1.781.66
3.02e 1.66p
2.021.99
4.55 2.13
1.59e
2.91
2.82
2.064.221.673.06 2.72
3.30 2.79e3.16 2.76p
3.02 2.71
2.92 1.68e 4.23 2.11
Source: Countries(except R.O.C): Main Science and Technology Indicators, 2018/2,February 2019, OECD.
3.01 2.72 2.87 1.66e 4.29
130

7. TRANSPORTATION AND COMMUNICATIONS


1952 1.51 - 1.48 - 1.95 - - - 1955 2.27 17.0 2.16 16.1 3.84 23.5 - - 1960 3.72 4.2 3.16 4.6 11.67 1.0 - - 1965 5.07 9.0 4.53 11.6 12.77 -2.6 - - 1970 8.64 12.2 7.95 12.3 18.48 11.7 - - 1975 16.26 15.2 15.59 17.7 25.89 -3.4 - - 1980 25.84 4.4 25.53 4.3 30.28 5.5 - - 1985 32.83 -0.4 32.14 -1.1 42.73 8.3 - - 1990 43.26 1.8 42.24 2.4 57.97 -3.6 - - 1995 70.10 -1.0 69.44 -1.4 82.17 7.0 - - 1996 71.34 1.8 70.56 1.6 85.55 4.1 - - 1997 72.64 1.8 71.57 1.4 92.07 7.6 - - 1998 73.64 1.4 72.30 1.0 98.12 6.6 - - 1999 76.29 3.6 74.85 3.5 102.52 4.5 70.60 - 2000 77.10 1.1 74.94 0.1 116.36 13.5 68.53 -2.92001 75.45 -2.1 73.87 -1.4 104.20 -10.5 86.46 26.22002 76.50 1.4 75.15 1.7 100.99 -3.1 92.24 6.72003 73.75 -3.6 72.48 -3.6 96.81 -4.1 95.25 3.32004 80.62 9.3 79.51 9.7 100.88 4.2 114.79 20.52005 81.16 0.7 80.00 0.6 102.31 1.4 96.04 -16.32006 81.13 0.0 80.18 0.2 98.38 -3.8 89.67 -6.62007 82.07 1.2 81.11 1.2 99.62 1.3 91.13 1.62008 82.72 0.8 81.70 0.7 101.25 1.6 94.37 3.62009 80.89 -2.2 79.77 -2.4 101.28 0.0 92.97 -1.52010 86.38 6.8 85.37 7.0 104.72 3.4 91.02 -2.12011 88.53 2.5 87.44 2.4 108.19 3.3 100.00 9.92012 91.20 3.0 90.38 3.4 106.13 -1.9 102.60 2.62013 94.56 3.7 94.00 4.0 104.78 -1.3 107.56 4.82014 97.21 2.8 96.71 2.9 106.29 1.4 110.02 2.32015 97.09 -0.1 96.78 0.1 102.66 -3.4 110.61 0.52016 100.00 3.0 100.00 3.3 100.00 -2.6 108.52 -1.92017 102.95 3.0 103.31 3.3 96.50 -3.5 103.90 -4.32018 107.47 4.4 108.31 4.8 92.22 -4.4 97.85 -5.8
Source: The data are provided by the Ministry of Transportation and Communications, R.O.C. and the National Communications
Period
7-1. Indices of Transportation and Communications
TelecommunicationsIndex (1)
(2016=100)
Transportation Postal ServiceGeneral Indices(1)
(1) After rebasing base year from 2011 to 2016, the General indexes and the Indexes of Transportation and Postal Service were
Commission, R.O.C.
Index(2011=100)
Growth Rate(%)
Growth Rate(%)
Index(2016=100)
Growth Rate(%)
Index(2016=100)
Growth Rate(%)
revised to 1991.
131

Unit: km
1952 950 950 - - - - 1955 950 950 - - - - 1960 973 973 - - - - - 1965 975 975 - - - - - 1970 1,000 1,000 - - - - - 1975 1,000 1,000 - - - - - 1980 1,091 1,091 - - - - - 1985 1,082 1,082 - - - - - 1990 1,105 1,105 - - - - - 1995 1,157 1,157 - - - - - 1996 1,167 1,156 - - 11 - - 1997 1,177 1,145 - - 32 - - 1998 1,182 1,142 - - 40 - - 1999 1,185 1,129 - - 56 - - 2000 1,190 1,125 - - 65 - - 2001 1,184 1,119 - - 65 - - 2002 1,184 1,119 - - 65 - - 2003 1,182 1,117 - - 65 - - 2004 1,333 1,118 - 148 67 - - 2005 1,336 1,118 - 151 67 - - 2006 1,343 1,118 - 151 74 - - 2007 1,686 1,117 345 150 74 - - 2008 1,724 1,116 345 146 76 41 - 2009 1,652 1,116 345 57 91 43 - 2010 1,743 1,115 345 138 101 44 - 2011 1,742 1,113 345 138 102 44 - 2012 1,764 1,123 345 138 113 45 - 2013 1,765 1,119 345 135 121 45 - 2014 1,766 1,114 345 133 129 45 - 2015 1,771 1,117 345 133 131 45 - 2016 1,777 1,118 350 133 131 45 - 2017 1,835 1,118 350 132 131 53 51 2018 1,836 1,118 350 133 131 53 51
Source: See Table 7-1.
7-2. Route Length of Railway
End of Year Kaohsiung Metro Taoyuan MetroTotal Taiwan RailwayAdministration
High-Speed Rail Taipei MetroProductiveEnterprises (1)
(1) The business lines of Productive Enterprises were damaged in Morakot typhoon and cease operating in 2009.
132

Unit: station
1952 210 210 - - - - - 1955 224 224 - - - - - 1960 242 242 - - - - - 1965 236 236 - - - - - 1970 244 244 - - - - - 1975 240 240 - - - - - 1980 256 256 - - - - - 1985 236 236 - - - - - 1990 219 219 - - - - - 1995 218 218 - - - - - 1996 230 218 - - 12 0 - 1997 248 216 - - 32 0 - 1998 255 216 - - 39 0 - 1999 270 216 - - 54 0 - 2000 276 216 - - 60 0 - 2001 275 215 - - 60 0 - 2002 275 215 - - 60 0 - 2003 276 216 - - 60 0 - 2004 295 216 - 18 61 0 - 2005 297 216 - 18 63 0 - 2006 305 218 - 18 69 0 - 2007 314 219 8 18 69 0 - 2008 349 217 8 17 70 37 - 2009 343 216 8 - 82 37 - 2010 374 217 8 18 94 37 - 2011 381 224 8 18 94 37 - 2012 393 225 8 20 102 38 - 2013 396 223 8 18 109 38 - 2014 405 225 8 18 116 38 - 2015 410 226 11 18 117 38 - 2016 413 228 12 18 117 38 - 2017 448 228 12 18 117 52 212018 461 241 12 18 117 52 21
Kaohsiung Metro
Source: See Table 7-1.
Taipei Metro
7-3. Number of Railway Stations
End of Year Total Taiwan RailwayAdministration High-Speed Rail Productive
Enterprises(1) Taoyuan Metro
(1) See (1) of Table 7-2.
133

Unit: km
Count National Provincial County Rural Exclusive1952 15,619 14,734 - 1,364 2,815 10,555 - - 1955 14,878 14,878 - 1,459 2,927 10,492 - - 1960 15,336 15,336 - 1,956 2,947 10,433 - - 1965 14,836 14,836 - 2,092 2,803 9,719 222 - 19691970 15,615 15,615 - 2,468 2,689 10,127 331 - 1975 17,172 17,172 - 2,737 3,012 11,095 328 - 1980 17,487 17,487 373 3,979 2,330 10,427 378 - 1985 19,857 19,857 382 4,100 2,593 12,394 388 - 1990 20,042 20,042 382 4,159 2,645 12,486 388 - 1995 32,197 20,031 447 4,209 2,531 12,454 390 12,167 1996 32,799 20,139 505 4,246 2,533 12,465 390 12,660 1997 33,649 20,186 549 4,321 2,461 12,465 390 13,463 1998 34,916 20,243 559 4,376 2,451 12,467 390 14,673 1999 35,593 20,343 615 4,424 2,447 12,467 390 15,250 2000 35,771 20,396 629 4,447 2,455 12,475 390 15,375 2001 36,466 20,675 739 4,515 3,401 11,630 390 15,791 2002 37,037 20,836 810 4,573 3,426 11,613 414 16,201 2003 37,310 20,967 893 4,621 3,426 11,613 414 16,343 2004 37,028 21,014 922 4,680 3,359 11,639 414 16,014 2005 37,336 21,079 933 4,720 3,359 11,653 414 16,257 2006 38,297 21,244 975 4,843 3,358 11,654 414 17,053 2007 38,526 21,403 975 5,000 3,360 11,654 414 17,123 2008 39,315 21,492 1,010 5,024 3,484 11,560 414 17,823 2009 39,849 21,781 1,010 5,092 3,518 11,765 396 18,068 2010 40,353 21,821 1,010 5,099 3,551 11,765 396 18,532 2011 41,298 21,847 1,010 5,124 3,551 11,766 396 19,451 2012 42,209 21,860 1,010 5,137 3,551 11,766 396 20,349 2013 42,820 21,926 1,050 5,132 3,573 11,775 396 20,894 2014 41,916 21,575 1,050 5,148 3,619 11,362 396 20,341 2015 41,950 21,587 1,050 5,160 3,619 11,362 396 20,363 2016 43,365 21,618 1,050 5,235 3,633 11,304 396 21,747 2017 43,206 21,710 1,050 5,262 3,602 11,383 413 21,496 2018 43,133 21,678 1,050 5,283 3,656 11,276 413 21,455
Source: See Table 7-1.
End of Year Grand TotalHighway
7-4. Length of Roads
Urban
134
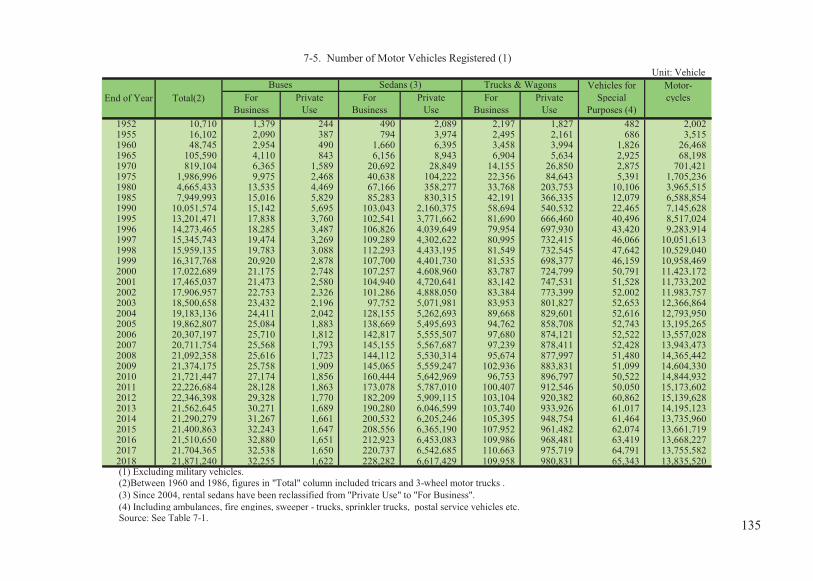
Unit: VehicleVehicles for Motor-
For Private For Private For Private Special cyclesBusiness Use Business Use Business Use Purposes (4)
1952 10,710 1,379 244 490 2,089 2,197 1,827 482 2,002 1955 16,102 2,090 387 794 3,974 2,495 2,161 686 3,515 1960 48,745 2,954 490 1,660 6,395 3,458 3,994 1,826 26,468 1965 105,590 4,110 843 6,156 8,943 6,904 5,634 2,925 68,198 1970 819,104 6,365 1,589 20,692 28,849 14,155 26,850 2,875 701,421 1975 1,986,996 9,975 2,468 40,638 104,222 22,356 84,643 5,391 1,705,236 1980 4,665,433 13,535 4,469 67,166 358,277 33,768 203,753 10,106 3,965,515 1985 7,949,993 15,016 5,829 85,283 830,315 42,191 366,335 12,079 6,588,854 1990 10,051,574 15,142 5,695 103,043 2,160,375 58,694 540,532 22,465 7,145,628 1995 13,201,471 17,838 3,760 102,541 3,771,662 81,690 666,460 40,496 8,517,024 1996 14,273,465 18,285 3,487 106,826 4,039,649 79,954 697,930 43,420 9,283,914 1997 15,345,743 19,474 3,269 109,289 4,302,622 80,995 732,415 46,066 10,051,613 1998 15,959,135 19,783 3,088 112,293 4,433,195 81,549 732,545 47,642 10,529,040 1999 16,317,768 20,920 2,878 107,700 4,401,730 81,535 698,377 46,159 10,958,469 2000 17,022,689 21,175 2,748 107,257 4,608,960 83,787 724,799 50,791 11,423,172 2001 17,465,037 21,473 2,580 104,940 4,720,641 83,142 747,531 51,528 11,733,202 2002 17,906,957 22,753 2,326 101,286 4,888,050 83,384 773,399 52,002 11,983,757 2003 18,500,658 23,432 2,196 97,752 5,071,981 83,953 801,827 52,653 12,366,864 2004 19,183,136 24,411 2,042 128,155 5,262,693 89,668 829,601 52,616 12,793,950 2005 19,862,807 25,084 1,883 138,669 5,495,693 94,762 858,708 52,743 13,195,265 2006 20,307,197 25,710 1,812 142,817 5,555,507 97,680 874,121 52,522 13,557,028 2007 20,711,754 25,568 1,793 145,155 5,567,687 97,239 878,411 52,428 13,943,473 2008 21,092,358 25,616 1,723 144,112 5,530,314 95,674 877,997 51,480 14,365,442 2009 21,374,175 25,758 1,909 145,065 5,559,247 102,936 883,831 51,099 14,604,330 2010 21,721,447 27,174 1,856 160,444 5,642,969 96,753 896,797 50,522 14,844,932 2011 22,226,684 28,128 1,863 173,078 5,787,010 100,407 912,546 50,050 15,173,602 2012 22,346,398 29,328 1,770 182,209 5,909,115 103,104 920,382 60,862 15,139,628 2013 21,562,645 30,271 1,689 190,280 6,046,599 103,740 933,926 61,017 14,195,123 2014 21,290,279 31,267 1,661 200,532 6,205,246 105,395 948,754 61,464 13,735,960 2015 21,400,863 32,243 1,647 208,556 6,365,190 107,952 961,482 62,074 13,661,719 2016 21,510,650 32,880 1,651 212,923 6,453,083 109,986 968,481 63,419 13,668,227 2017 21,704,365 32,538 1,650 220,737 6,542,685 110,663 975,719 64,791 13,755,582 2018 21,871,240 32,255 1,622 228,282 6,617,429 109,958 980,831 65,343 13,835,520
(3) Since 2004, rental sedans have been reclassified from "Private Use" to "For Business". (4) Including ambulances, fire engines, sweeper - trucks, sprinkler trucks, postal service vehicles etc. Source: See Table 7-1.
(1) Excluding military vehicles. (2)Between 1960 and 1986, figures in "Total" column included tricars and 3-wheel motor trucks .
7-5. Number of Motor Vehicles Registered (1)
Trucks & WagonsEnd of Year Total(2)
Buses Sedans (3)
135

Railway (1) Road Railway (1) Road1952 47 409 209 1,813 1955 48 413 189 1,639 1960 51 426 168 1,421 1965 51 412 147 1,175 1970 58 434 141 1,064 1975 61 477 136 1,063 1980 70 486 142 982 1985 73 552 137 1,031 1990 73 557 129 996 1995 75 894 127 1,511 1996 75 911 126 1,528 1997 75 935 124 1,552 1998 77 970 127 1,596 1999 79 989 128 1,615 2000 80 993 129 1,610 2001 78 1,013 126 1,632 2002 77 1,029 124 1,650 2003 79 1,036 126 1,656 2004 89 1,028 141 1,637 2005 87 1,037 138 1,645 2006 88 1,064 140 1,680 2007 107 1,070 168 1,685 2008 106 1,092 166 1,714 2009 108 1,107 169 1,731 2010 106 1,121 165 1,750 2011 106 1,147 164 1,787 2012 106 1,172 165 1,820 2013 106 1,189 164 1,842 2014 107 1,164 165 1,799 2015 109 1,165 167 1,797 2016 108 1,204 167 1,854 2017 112 1,200 172 1,845 2018 111 1,198 171 1,840
Source: See Table 7-1.
7-6. Railway and Road Densities
End of YearMeters Per Square Km Meters Per 1,000 Persons
(1) See (1) of Table 7-2.
136

Passenger Traffic Freight TrafficPeriod Passengers (million) Passenger-Kilometers (million) Tonnage (1,000 mt) Tonne-Kilometers (million)
Total Railway Motor Total Railway Motor Total Railway Motor Total Railway Motor
1952 65 65 - 1,750 1,750 - 10,828 8,231 2,597 1,223 1,159 64 1955 97 97 - 2,550 2,550 - 28,169 22,469 5,700 1,888 1,733 156 1960 121 121 - 3,609 3,609 - 35,542 26,745 8,797 2,388 2,071 317 1965 134 134 - 4,470 4,470 - 45,290 30,192 15,098 3,024 2,415 608 1970 138 138 - 6,212 6,212 - 64,377 28,359 36,018 3,994 2,631 1,364 1975 147 147 - 8,287 8,287 - 105,407 16,534 88,873 6,540 2,702 3,838 1980 140 140 - 7,971 7,971 - 176,943 32,458 144,485 10,407 2,716 7,690 1985 131 131 - 8,309 8,309 - 219,455 29,730 189,725 11,523 2,300 9,223 1990 132 132 - 8,323 8,323 - 273,852 28,054 245,798 13,420 1,877 11,543 1995 1,347 161 1,186 25,650 9,499 16,151 321,296 30,120 291,176 14,391 1,900 12,492 1996 1,338 171 1,167 24,454 9,032 15,421 316,856 27,410 289,446 13,576 1,585 11,991 1997 1,360 197 1,163 23,924 9,507 14,417 303,551 26,571 276,980 13,679 1,514 12,165 1998 1,388 233 1,155 24,604 10,305 14,298 386,527 26,560 359,967 18,831 1,404 17,426 1999 1,459 310 1,149 25,267 11,020 14,247 375,869 25,993 349,875 19,566 1,315 18,251 2000 1,564 460 1,104 27,281 12,624 14,657 365,804 22,261 343,543 19,412 1,179 18,233 2001 1,567 476 1,091 27,505 12,269 15,237 521,587 19,287 502,300 28,820 1,010 27,810 2002 1,557 500 1,057 27,917 12,147 15,770 516,749 18,217 498,533 29,282 941 28,341 2003 1,471 478 992 25,921 11,178 14,744 529,414 16,735 512,680 29,599 864 28,735 2004 1,539 520 1,019 27,828 12,051 15,778 565,675 16,960 548,715 31,938 909 31,029 2005 1,545 531 1,013 28,356 12,255 16,100 581,083 19,251 561,831 32,192 982 31,210 2006 1,568 554 1,014 28,738 12,352 16,386 613,274 19,060 594,214 32,215 997 31,218 2007 1,623 603 1,021 31,748 15,769 15,979 634,945 17,378 617,567 31,437 890 30,547 2008 1,744 690 1,054 34,849 19,066 15,783 620,720 16,583 604,137 31,093 933 30,160 2009 1,757 719 1,039 35,160 19,277 15,882 610,886 14,144 596,742 29,847 776 29,071 2010 1,889 779 1,110 37,238 20,931 16,307 643,274 15,106 628,167 30,504 873 29,632 2011 2,029 864 1,164 39,866 22,826 17,040 652,949 14,451 638,499 30,404 853 29,551 2012 2,117 925 1,191 41,793 24,208 17,586 667,171 13,905 653,265 30,684 833 29,851 2013 2,192 972 1,220 43,250 25,323 17,928 562,597 11,167 551,430 39,203 729 38,474 2014 2,263 1,024 1,239 44,724 26,340 18,384 553,162 11,223 541,939 38,535 683 37,852 2015 2,280 1,063 1,217 44,676 27,111 17,565 542,975 11,117 531,858 38,442 636 37,805 2016 2,317 1,092 1,225 45,328 27,950 17,379 539,678 9,387 530,290 39,097 564 38,533 2017 2,358 1,123 1,235 46,057 29,004 17,053 545,050 7,971 537,079 40,865 515 40,351 2018 2,398 1,154 1,245 46,750 29,624 17,126 568,648 7,878 560,770 44,713 544 44,169
Source: See Table 7-1.
7-7. Railway and Highway Carriers Traffic
137

Total International Cross-Strait
1952 5,133 - - - 26 - -1955 5,563 - - - 68 - -1960 8,276 - - - 122 - -1965 19,510 8,764 - 10,746 615 235 -1970 66,582 26,102 - 40,480 2,533 997 -1975 95,358 29,498 - 65,860 5,678 2,013 -1980 126,898 37,089 - 89,809 11,198 3,759 -1985 144,201 39,459 - 104,742 11,462 4,523 -1990 251,823 60,691 - 191,132 19,888 9,680 -1995 632,888 111,356 - 521,532 45,621 14,954 -1996 700,964 123,931 - 577,033 54,103 16,157 -1997 715,845 135,730 - 580,115 56,303 17,069 -1998 638,344 135,023 - 503,321 51,650 16,440 -1999 616,322 132,343 - 483,979 52,374 17,808 -2000 586,560 138,379 - 448,181 48,407 19,780 -2001 561,910 147,212 - 414,698 46,084 19,501 - 2002 548,555 156,023 - 392,532 44,186 20,063 - 2003 489,171 146,490 - 342,681 37,879 15,913 - 2004 504,862 175,230 - 329,632 44,117 20,756 - 2005 479,499 181,775 - 297,724 44,268 22,485 - 2006 463,506 188,274 - 275,232 43,725 23,774 - 2007 421,479 192,610 - 228,869 39,772 24,432 - 2008 357,982 172,469 2,279 183,234 35,236 22,784 419 2009 335,667 149,131 17,741 168,795 36,059 23,430 3,116 2010 360,409 155,500 33,823 171,086 41,091 25,261 5,845 2011 385,140 160,775 44,562 179,803 42,856 24,959 7,174 2012 404,695 171,610 58,513 174,572 46,860 26,937 8,962 2013 426,635 186,705 60,673 179,257 50,336 30,165 9,220 2014 454,911 198,232 72,500 184,179 55,357 33,096 11,295 2015 481,028 211,890 77,069 192,069 58,156 36,162 11,821 2016 527,025 236,554 74,159 216,312 63,253 40,723 11,256 2017 509,181 242,290 66,509 200,382 65,979 44,034 10,441 2018 547,193 255,180 69,999 222,014 68,904 46,182 10,740
Source: See Table 7-1.
7-8a. Civil Aviation Transportation at Airports
PeriodTotal International
(including H.K. & Macau) Domestic
No. of Flights
1,000Passengers
1,000Passengers
Passenger Traffic
Cross-Strait1,000
Passengers
138

Domestic Transit Total International Cross-Strait Domestic Transit
1955 - - 2.1 - - - -1960 - - 4.6 - - - -1965 380 - 10.7 7.9 - 2.8 -1970 1,536 - 45.9 33.7 - 12.2 -1975 3,664 - 132.8 105.1 - 27.7 -1980 6,150 1,289 237.1 212.2 - 24.9 -1985 5,854 1,085 328.0 302.2 - 25.8 -1990 9,043 1,165 662.1 625.4 - 36.7 -1995 28,773 1,894 836.9 744.4 - 31.4 61.1 1996 35,902 2,044 885.2 791.8 - 29.4 64.0 1997 37,400 1,835 1,015.7 909.9 - 31.2 74.6 1998 33,294 1,916 1,032.8 936.4 - 26.4 70.0 1999 32,534 2,031 1,173.4 1,064.3 - 30.6 78.5 2000 26,650 1,976 1,338.2 1,214.9 - 33.9 89.5 2001 24,614 1,970 1,310.2 1,035.6 - 37.4 237.3 2002 21,890 2,233 1,513.9 1,137.6 - 44.2 332.0 2003 20,052 1,914 1,622.7 1,186.0 - 43.7 393.0 2004 20,995 2,365 1,823.1 1,254.9 - 40.6 527.6 2005 19,294 2,489 1,818.8 1,216.0 - 37.4 565.3 2006 17,365 2,586 1,809.6 1,208.0 - 40.2 561.4 2007 12,711 2,630 1,708.7 1,191.1 - 40.0 477.5 2008 9,850 2,183 1,587.3 1,033.8 1.5 36.7 515.2 2009 9,233 279 1,743.8 866.7 66.3 36.9 773.9 2010 9,733 251 2,335.5 1,017.7 146.2 36.7 1,134.9 2011 10,484 239 2,178.9 951.8 156.8 35.9 1,034.3 2012 10,680 282 2,091.3 930.7 171.4 36.2 953.1 2013 10,547 403 2,084.7 905.7 176.8 35.5 966.6 2014 10,563 402 2,221.7 943.8 200.8 35.1 1,042.0 2015 9,798 374 2,150.6 934.6 201.6 33.2 981.2 2016 10,843 431 2,233.0 996.0 218.7 31.8 986.5 2017 11,097 406 2,416.0 1,077.5 236.2 30.4 1,072.0 2018 11,592 390 2,463.3 1,083.0 233.1 30.0 1,117.2
Note: According to the ACI definition, the statistical classifications below have been revised from 2009: (1) international line and cross-strait passenger is revised to contain transfer passenger (counted twice); (2) the transit is revised to contain direct transit only; (3) the transshipment cargo is revised to be counted twice.
1,000mt
1,000mt
Passenger Traffic
7-8b. Civil Aviation Transportation at Airports (Continued)
1,000Passengers
1,000Passengers
1,000mt
1,000mt
Period
Freight Traffic
1,000mt
139

Grand Keelung Kaohsiung Hualien Taichung Su-ao Anping Taipei Keelung KaohsiungTotal Port Port Port Port Port Port Port Port Port
1952 3,303 1,627 1,528 149 - - - - 1,468 634 767 1955 4,919 2,093 2,648 178 - - - - 2,023 689 1,241 1960 6,892 2,372 4,236 284 - - - - 3,022 830 2,013 1965 12,295 4,115 7,856 324 - - - - 5,851 1,698 3,933 1970 25,016 8,643 15,984 389 - - - - 8,997 2,936 5,820 1975 45,911 16,885 28,221 805 - - - - 14,044 5,901 7,754 1980 116,450 35,186 71,850 3,398 4,747 1,269 - - 43,124 13,651 26,781 1985 183,910 49,936 118,572 3,902 7,917 3,583 - - 73,892 23,460 44,801 1990 301,062 79,615 190,945 5,172 21,261 4,069 - - 114,462 35,194 71,799 1995 420,168 94,442 261,654 9,497 49,170 5,405 - - 156,230 39,061 100,798 1996 432,625 89,407 266,929 9,743 60,436 6,109 - - 162,198 38,036 102,032 1997 483,402 85,406 310,039 11,594 69,783 6,580 - - 182,127 35,330 119,670 1998 494,018 76,149 328,289 12,488 70,803 6,290 - - 188,050 29,265 130,584 1999 534,086 76,542 358,124 14,670 79,238 5,511 - - 209,518 28,390 146,247 2000 566,950 88,336 375,406 15,556 82,014 5,639 - - 223,728 33,122 153,983 2001 552,873 82,418 373,747 15,263 75,368 4,784 1,292 - 221,154 31,741 154,345 2002 606,711 88,911 410,687 17,160 81,508 5,563 2,881 - 243,914 34,456 170,123 2003 635,577 93,104 429,644 18,057 84,574 5,623 4,576 - 254,640 35,170 177,869 2004 696,241 97,766 468,913 21,751 88,902 6,074 5,092 7,743 277,114 36,218 195,393 2005 687,927 99,167 455,426 21,950 88,430 6,522 6,702 9,732 273,389 36,938 190,851 2006 706,506 99,479 464,884 20,072 90,323 6,604 11,150 13,994 279,718 38,102 197,761 2007 710,259 97,210 477,622 19,381 90,795 6,018 7,547 11,685 288,176 39,641 204,603 2008 668,279 91,261 448,992 17,420 89,294 5,003 6,671 9,637 271,531 36,900 193,630 2009 605,746 69,991 397,196 13,730 89,205 5,177 6,686 23,761 244,345 27,777 172,364 2010 655,400 76,675 423,074 14,268 107,031 5,756 1,237 27,360 265,842 30,795 185,097 2011 678,995 75,419 437,642 13,286 107,710 5,482 1,116 38,341 275,469 30,326 191,247 2012 690,802 69,403 440,301 11,226 111,170 5,002 1,173 52,528 284,552 28,258 194,914 2013 705,754 69,381 441,453 13,056 120,509 5,210 1,434 54,712 289,697 28,083 196,040 2014 748,615 72,239 467,809 13,481 122,620 5,220 1,241 66,004 308,440 29,119 209,143 2015 721,386 62,479 450,383 12,551 121,917 4,896 1,163 67,997 295,762 24,806 201,338 2016 733,561 58,622 456,377 9,824 127,240 4,915 1,427 75,157 303,949 23,095 205,106 2017 725,504 60,192 450,043 8,833 128,675 4,307 1,646 71,808 300,139 23,926 202,631 2018 740,852 61,895 458,925 9,034 129,357 4,773 1,445 75,424 308,174 25,178 205,735
(1) The conversion factor from TEUS to Revenue Tons is 36 in containerized cargo. Source: See Table 7-1.
7-9a. Freight Handled at Seaports(1)Unit: 1,000 Revenue Tons
SubtotalPeriodLoadingLoading and Unloading
140
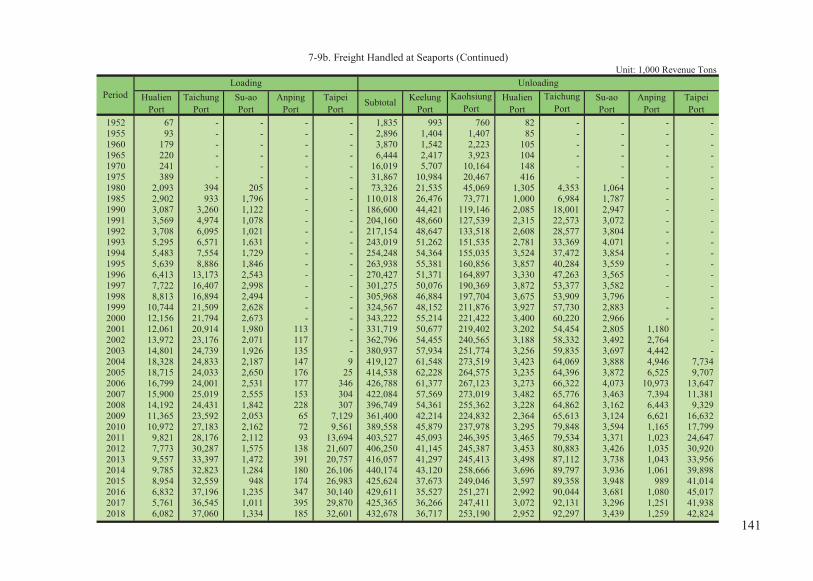
Hualien Taichung Su-ao Anping Taipei Keelung Hualien Su-ao Anping TaipeiPort Port Port Port Port Port Port Port Port Port
1952 67 - - - - 1,835 993 760 82 - - - -1955 93 - - - - 2,896 1,404 1,407 85 - - - -1960 179 - - - - 3,870 1,542 2,223 105 - - - -1965 220 - - - - 6,444 2,417 3,923 104 - - - -1970 241 - - - - 16,019 5,707 10,164 148 - - - -1975 389 - - - - 31,867 10,984 20,467 416 - - - -1980 2,093 394 205 - - 73,326 21,535 45,069 1,305 4,353 1,064 - -1985 2,902 933 1,796 - - 110,018 26,476 73,771 1,000 6,984 1,787 - -1990 3,087 3,260 1,122 - - 186,600 44,421 119,146 2,085 18,001 2,947 - -1991 3,569 4,974 1,078 - - 204,160 48,660 127,539 2,315 22,573 3,072 - -1992 3,708 6,095 1,021 - - 217,154 48,647 133,518 2,608 28,577 3,804 - -1993 5,295 6,571 1,631 - - 243,019 51,262 151,535 2,781 33,369 4,071 - -1994 5,483 7,554 1,729 - - 254,248 54,364 155,035 3,524 37,472 3,854 - -1995 5,639 8,886 1,846 - - 263,938 55,381 160,856 3,857 40,284 3,559 - -1996 6,413 13,173 2,543 - - 270,427 51,371 164,897 3,330 47,263 3,565 - -1997 7,722 16,407 2,998 - - 301,275 50,076 190,369 3,872 53,377 3,582 - -1998 8,813 16,894 2,494 - - 305,968 46,884 197,704 3,675 53,909 3,796 - -1999 10,744 21,509 2,628 - - 324,567 48,152 211,876 3,927 57,730 2,883 - -2000 12,156 21,794 2,673 - - 343,222 55,214 221,422 3,400 60,220 2,966 - -2001 12,061 20,914 1,980 113 - 331,719 50,677 219,402 3,202 54,454 2,805 1,180 -2002 13,972 23,176 2,071 117 - 362,796 54,455 240,565 3,188 58,332 3,492 2,764 -2003 14,801 24,739 1,926 135 - 380,937 57,934 251,774 3,256 59,835 3,697 4,442 -2004 18,328 24,833 2,187 147 9 419,127 61,548 273,519 3,423 64,069 3,888 4,946 7,734 2005 18,715 24,033 2,650 176 25 414,538 62,228 264,575 3,235 64,396 3,872 6,525 9,707 2006 16,799 24,001 2,531 177 346 426,788 61,377 267,123 3,273 66,322 4,073 10,973 13,647 2007 15,900 25,019 2,555 153 304 422,084 57,569 273,019 3,482 65,776 3,463 7,394 11,381 2008 14,192 24,431 1,842 228 307 396,749 54,361 255,362 3,228 64,862 3,162 6,443 9,329 2009 11,365 23,592 2,053 65 7,129 361,400 42,214 224,832 2,364 65,613 3,124 6,621 16,632 2010 10,972 27,183 2,162 72 9,561 389,558 45,879 237,978 3,295 79,848 3,594 1,165 17,799 2011 9,821 28,176 2,112 93 13,694 403,527 45,093 246,395 3,465 79,534 3,371 1,023 24,647 2012 7,773 30,287 1,575 138 21,607 406,250 41,145 245,387 3,453 80,883 3,426 1,035 30,920 2013 9,557 33,397 1,472 391 20,757 416,057 41,297 245,413 3,498 87,112 3,738 1,043 33,956 2014 9,785 32,823 1,284 180 26,106 440,174 43,120 258,666 3,696 89,797 3,936 1,061 39,898 2015 8,954 32,559 948 174 26,983 425,624 37,673 249,046 3,597 89,358 3,948 989 41,014 2016 6,832 37,196 1,235 347 30,140 429,611 35,527 251,271 2,992 90,044 3,681 1,080 45,017 2017 5,761 36,545 1,011 395 29,870 425,365 36,266 247,411 3,072 92,131 3,296 1,251 41,938 2018 6,082 37,060 1,334 185 32,601 432,678 36,717 253,190 2,952 92,297 3,439 1,259 42,824
Unit: 1,000 Revenue Tons7-9b. Freight Handled at Seaports (Continued)
SubtotalPeriod
Loading UnloadingKaohsiung
PortTaichung
Port
141
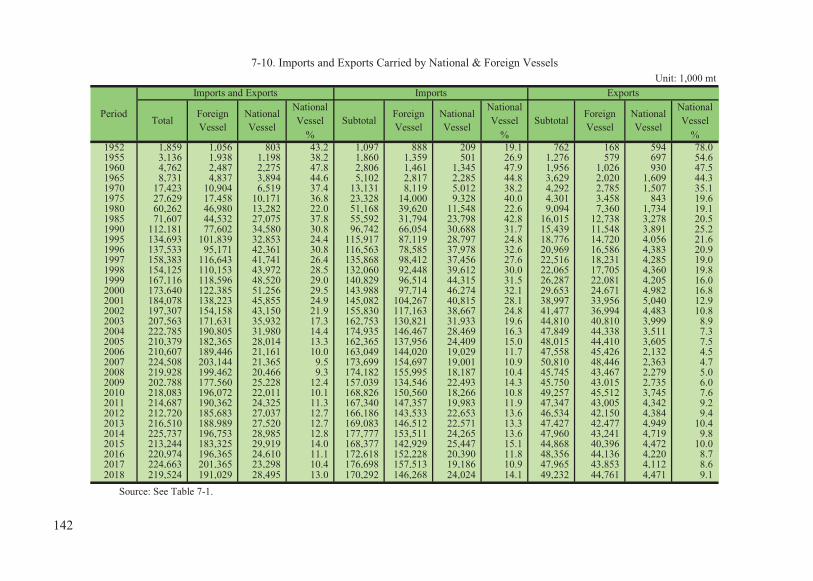
National National NationalVessel Vessel Vessel
% % %1952 1,859 1,056 803 43.2 1,097 888 209 19.1 762 168 594 78.0 1955 3,136 1,938 1,198 38.2 1,860 1,359 501 26.9 1,276 579 697 54.6 1960 4,762 2,487 2,275 47.8 2,806 1,461 1,345 47.9 1,956 1,026 930 47.5 1965 8,731 4,837 3,894 44.6 5,102 2,817 2,285 44.8 3,629 2,020 1,609 44.3 1970 17,423 10,904 6,519 37.4 13,131 8,119 5,012 38.2 4,292 2,785 1,507 35.1 1975 27,629 17,458 10,171 36.8 23,328 14,000 9,328 40.0 4,301 3,458 843 19.6 1980 60,262 46,980 13,282 22.0 51,168 39,620 11,548 22.6 9,094 7,360 1,734 19.1 1985 71,607 44,532 27,075 37.8 55,592 31,794 23,798 42.8 16,015 12,738 3,278 20.5 1990 112,181 77,602 34,580 30.8 96,742 66,054 30,688 31.7 15,439 11,548 3,891 25.2 1995 134,693 101,839 32,853 24.4 115,917 87,119 28,797 24.8 18,776 14,720 4,056 21.6 1996 137,533 95,171 42,361 30.8 116,563 78,585 37,978 32.6 20,969 16,586 4,383 20.9 1997 158,383 116,643 41,741 26.4 135,868 98,412 37,456 27.6 22,516 18,231 4,285 19.0 1998 154,125 110,153 43,972 28.5 132,060 92,448 39,612 30.0 22,065 17,705 4,360 19.8 1999 167,116 118,596 48,520 29.0 140,829 96,514 44,315 31.5 26,287 22,081 4,205 16.0 2000 173,640 122,385 51,256 29.5 143,988 97,714 46,274 32.1 29,653 24,671 4,982 16.8 2001 184,078 138,223 45,855 24.9 145,082 104,267 40,815 28.1 38,997 33,956 5,040 12.9 2002 197,307 154,158 43,150 21.9 155,830 117,163 38,667 24.8 41,477 36,994 4,483 10.8 2003 207,563 171,631 35,932 17.3 162,753 130,821 31,933 19.6 44,810 40,810 3,999 8.9 2004 222,785 190,805 31,980 14.4 174,935 146,467 28,469 16.3 47,849 44,338 3,511 7.3 2005 210,379 182,365 28,014 13.3 162,365 137,956 24,409 15.0 48,015 44,410 3,605 7.5 2006 210,607 189,446 21,161 10.0 163,049 144,020 19,029 11.7 47,558 45,426 2,132 4.5 2007 224,508 203,144 21,365 9.5 173,699 154,697 19,001 10.9 50,810 48,446 2,363 4.7 2008 219,928 199,462 20,466 9.3 174,182 155,995 18,187 10.4 45,745 43,467 2,279 5.0 2009 202,788 177,560 25,228 12.4 157,039 134,546 22,493 14.3 45,750 43,015 2,735 6.0 2010 218,083 196,072 22,011 10.1 168,826 150,560 18,266 10.8 49,257 45,512 3,745 7.6 2011 214,687 190,362 24,325 11.3 167,340 147,357 19,983 11.9 47,347 43,005 4,342 9.2 2012 212,720 185,683 27,037 12.7 166,186 143,533 22,653 13.6 46,534 42,150 4,384 9.4 2013 216,510 188,989 27,520 12.7 169,083 146,512 22,571 13.3 47,427 42,477 4,949 10.4 2014 225,737 196,753 28,985 12.8 177,777 153,511 24,265 13.6 47,960 43,241 4,719 9.8 2015 213,244 183,325 29,919 14.0 168,377 142,929 25,447 15.1 44,868 40,396 4,472 10.0 2016 220,974 196,365 24,610 11.1 172,618 152,228 20,390 11.8 48,356 44,136 4,220 8.7 2017 224,663 201,365 23,298 10.4 176,698 157,513 19,186 10.9 47,965 43,853 4,112 8.6 2018 219,524 191,029 28,495 13.0 170,292 146,268 24,024 14.1 49,232 44,761 4,471 9.1
Source: See Table 7-1.
7-10. Imports and Exports Carried by National & Foreign VesselsUnit: 1,000 mt
ForeignVessel
Period Total
Imports and Exports Imports Exports
NationalVessel
ForeignVessel
NationalVesselSubtotalForeign
VesselNationalVessel Subtotal
142

1952 126 365,306 480,730 2,837 7,0551955 94 288,352 392,841 2,216 8,2161960 83 347,173 503,586 2,795 11,7601965 145 761,058 1,072,678 5,887 27,3051970 170 1,129,916 1,716,431 8,613 44,8001975 168 1,308,683 2,045,276 13,023 93,7711980 178 1,806,216 2,704,909 24,085 136,1961985 227 4,267,129 6,654,260 48,652 299,6911990 254 5,922,976 9,179,151 83,462 479,3481995 270 6,011,431 9,244,182 123,614 568,5291996 284 6,066,699 9,326,984 130,052 610,3501997 285 5,958,906 9,192,129 114,108 567,7061998 285 5,539,486 8,771,344 109,885 519,6241999 290 5,445,290 8,630,749 111,719 557,2012000 288 5,336,130 8,391,652 110,271 527,8912001 280 4,790,827 7,472,055 101,533 359,2952002 272 4,234,607 6,789,777 101,091 312,8232003 267 3,735,331 6,091,318 95,440 247,5602004 272 3,707,112 5,998,971 96,735 195,0662005 270 3,374,761 5,484,290 85,853 180,7102006 258 3,005,203 4,962,058 78,135 154,2452007 262 2,853,241 4,672,289 70,291 125,8472008 267 2,868,332 4,709,741 65,250 129,9502009 267 2,703,834 4,237,587 53,972 113,3432010 278 2,789,176 4,400,330 55,390 114,6072011 290 2,888,558 4,493,037 53,477 126,8592012 288 3,113,599 4,672,453 47,727 97,2302013 295 3,373,753 4,977,349 49,521 107,3432014 304 3,635,946 5,284,951 54,997 116,6432015 313 3,847,758 5,481,654 55,414 121,3822016 278 3,463,074 4,958,454 55,472 122,0862017 283 3,578,719 5,120,324 51,744 111,1272018 267 4,173,822 6,136,249 64,082 143,019
(1) The number of national vessels registered refers to those with a gross tonnage of 100 tons or more, and includes cargo and passenger vessels, but excludes fishing and non-operated vessels. Source: See Table 7-1.
Ton-nautical Mileage(Million Tonne-Nautical Miles)
7-11. Number of R.O.C.- Registered Ships and Volume of Cargo
Period No. of Vessels(1)
Gross Registered Tonnage(GRT) (Tons)
Deadweight Tonnage(DWT) (Tons)
National-FlaggedCargo Tonnage
(1,000 mt)
143
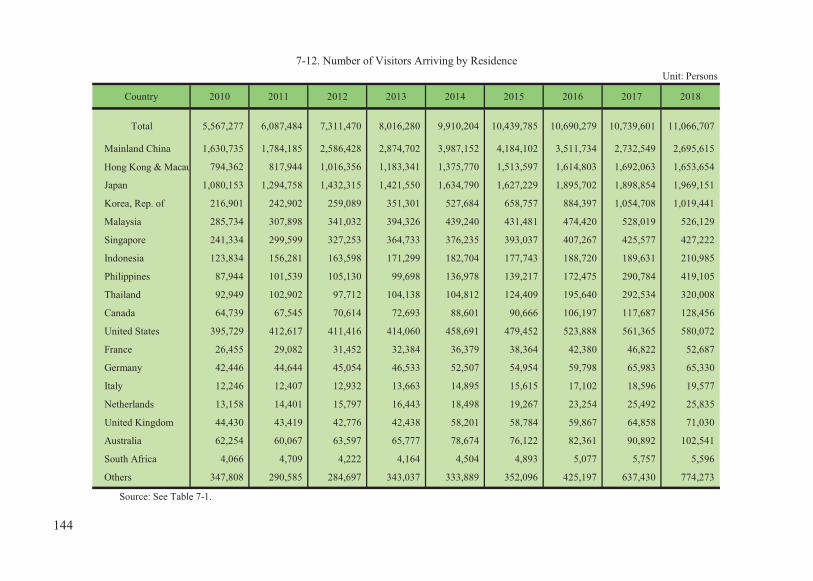
Country 2010 2011 2012 2013 2014 2015 2016 2017 2018
Total 5,567,277 6,087,484 7,311,470 8,016,280 9,910,204 10,439,785 10,690,279 10,739,601 11,066,707
Mainland China 1,630,735 1,784,185 2,586,428 2,874,702 3,987,152 4,184,102 3,511,734 2,732,549 2,695,615
Hong Kong & Macau 794,362 817,944 1,016,356 1,183,341 1,375,770 1,513,597 1,614,803 1,692,063 1,653,654
Japan 1,080,153 1,294,758 1,432,315 1,421,550 1,634,790 1,627,229 1,895,702 1,898,854 1,969,151
Korea, Rep. of 216,901 242,902 259,089 351,301 527,684 658,757 884,397 1,054,708 1,019,441
Malaysia 285,734 307,898 341,032 394,326 439,240 431,481 474,420 528,019 526,129
Singapore 241,334 299,599 327,253 364,733 376,235 393,037 407,267 425,577 427,222
Indonesia 123,834 156,281 163,598 171,299 182,704 177,743 188,720 189,631 210,985
Philippines 87,944 101,539 105,130 99,698 136,978 139,217 172,475 290,784 419,105
Thailand 92,949 102,902 97,712 104,138 104,812 124,409 195,640 292,534 320,008
Canada 64,739 67,545 70,614 72,693 88,601 90,666 106,197 117,687 128,456
United States 395,729 412,617 411,416 414,060 458,691 479,452 523,888 561,365 580,072
France 26,455 29,082 31,452 32,384 36,379 38,364 42,380 46,822 52,687
Germany 42,446 44,644 45,054 46,533 52,507 54,954 59,798 65,983 65,330
Italy 12,246 12,407 12,932 13,663 14,895 15,615 17,102 18,596 19,577
Netherlands 13,158 14,401 15,797 16,443 18,498 19,267 23,254 25,492 25,835
United Kingdom 44,430 43,419 42,776 42,438 58,201 58,784 59,867 64,858 71,030
Australia 62,254 60,067 63,597 65,777 78,674 76,122 82,361 90,892 102,541
South Africa 4,066 4,709 4,222 4,164 4,504 4,893 5,077 5,757 5,596
Others 347,808 290,585 284,697 343,037 333,889 352,096 425,197 637,430 774,273
Source: See Table 7-1.
Unit: Persons7-12. Number of Visitors Arriving by Residence
144

End of Year Total Business Pleasure VisitRelatives
Conference Study Exhibitions MedicalTreatment
Others
1982 1,419,178 145,692 1,104,713 54,620 - 13,766 - - 100,3871985 1,451,659 223,993 900,024 87,445 7,216 16,860 - - 216,1211990 1,934,084 400,362 1,037,866 139,000 12,194 25,664 - - 318,9981995 2,331,934 651,968 940,451 240,009 24,131 28,093 - - 447,2821996 2,358,221 704,450 904,489 241,704 25,931 27,320 - - 454,3271997 2,372,232 750,059 843,008 244,996 28,585 25,399 - - 480,1851998 2,298,706 770,557 762,026 242,223 30,242 24,322 - - 469,3361999 2,411,248 806,159 782,938 257,683 31,194 27,054 - - 506,2202000 2,624,037 900,339 870,929 279,243 34,879 27,808 - - 510,8392001 2,831,035 848,732 1,021,572 332,834 39,390 26,971 - - 561,5362002 2,977,692 831,465 1,028,635 329,751 39,485 61,904 - - 686,4522003 2,248,117 698,792 695,277 280,022 31,545 48,575 - - 493,9062004 2,950,342 920,377 1,031,713 374,008 43,616 37,324 - - 543,3042005 3,378,118 944,487 1,381,637 379,252 49,686 38,717 - - 584,3392006 3,519,827 949,836 1,510,207 377,455 52,634 38,649 - - 591,0462007 3,716,063 930,775 1,648,507 395,760 57,839 41,901 - - 641,2812008 3,845,187 881,431 1,775,229 404,692 59,226 45,229 - - 679,3802009 4,395,004 795,669 2,298,334 413,942 68,925 54,701 - - 763,4332010 5,567,277 937,777 3,246,005 496,627 88,097 62,681 - - 736,0902011 6,087,484 984,845 3,633,856 500,131 81,780 62,829 - - 824,0432012 7,311,470 893,767 4,677,330 444,213 62,988 62,719 15,789 58,444 1,096,2202013 8,016,280 927,262 5,479,099 469,877 61,608 75,938 16,316 100,083 886,0972014 9,910,204 769,665 7,192,095 393,656 63,135 56,562 13,316 60,951 1,360,8242015 10,439,785 758,889 7,505,457 408,034 60,777 59,204 13,749 67,298 1,566,3772016 10,690,279 732,968 7,560,753 428,625 64,704 67,954 14,876 38,260 1,782,1392017 10,739,601 744,402 7,648,509 455,429 66,519 73,135 16,274 30,764 1,704,5692018 11,066,707 738,027 7,594,251 483,052 73,529 76,925 17,355 34,701 2,048,867
Source: See Table 7-1.
Unit: Persons7-13. Number of Visitors Arriving by Visiting Purpose
145

Total By Land By Air By Sea1952 1,544 50,396 3,313 25,962 21,121 1955 2,524 96,249 19,695 39,263 37,291 1960 6,114 116,389 28,705 45,834 41,850 1965 7,008 166,766 33,527 51,608 81,631 1970 8,149 200,200 34,464 56,205 109,531 1975 9,443 500,058 34,610 284,114 181,334 1980 11,534 759,185 35,685 420,467 303,033 1985 12,441 1,490,855 96,157 856,775 537,923 1990 12,700 1,607,639 118,076 936,394 553,169 1995 14,335 1,833,913 123,191 1,126,453 584,269 1996 14,638 1,835,440 123,914 1,127,257 584,269 1997 13,961 1,845,096 122,870 1,137,957 584,269 1998 14,014 1,862,818 125,592 1,152,957 584,269 1999 14,414 1,905,696 125,592 1,195,835 584,269 2000 12,656 1,903,222 123,118 1,195,835 584,269 2001 11,216 1,901,895 113,450 1,204,176 584,269 2002 10,325 1,902,638 114,396 1,203,973 584,269 2003 9,976 1,904,383 116,141 1,203,973 584,269 2004 6,755 1,904,894 116,652 1,203,973 584,269 2005 6,420 1,903,028 114,731 1,203,973 584,324 2006 5,341 1,903,029 114,731 1,203,973 584,325 2007 4,823 1,903,283 114,985 1,203,973 584,325 2008 2,570 1,912,832 115,330 1,203,341 594,161 2009 2,681 1,919,509 118,958 1,205,582 594,969 2010 2,600 1,920,028 119,477 1,205,582 594,969 2011 2,595 1,920,161 119,610 1,205,582 594,969 2012 2,610 1,920,551 120,056 1,205,582 594,913 2013 2,609 1,920,101 119,606 1,205,582 594,913 2014 2,544 1,919,552 119,057 1,205,582 594,913 2015 2,463 1,919,338 118,843 1,205,582 594,913 2016 2,390 1,918,300 117,805 1,205,582 594,913 2017 2,362 1,909,068 110,651 1,205,788 592,629 2018 2,297 1,907,373 108,956 1,205,788 592,629 Sources: The data are provided by the Chunghwa Post Co., Ltd., and the Ministry of Transportation and Communications, R.O.C.
7-14. Postal Establishments and Mail Routes
End of YearMail Routes (km)No. of Postal
Establishments
146

Total Domestic International Total Domestic International Total Domestic International1952 62.3 60.3 2.0 70.4 67.0 3.4 - - -1955 124.8 121.6 3.2 146.8 140.6 6.2 - - -1960 358.5 351.0 7.5 370.4 358.6 11.8 - - -1965 379.5 369.2 10.3 382.2 369.2 13.0 - - -1970 552.8 528.5 24.3 577.3 556.0 21.3 - - - 1975 804.3 756.3 48.0 854.9 814.7 40.2 - - - 1980 923.2 852.2 71.0 958.7 909.5 49.2 56 - 56 1985 1,318.0 1,246.4 71.6 1,363.5 1,289.5 74.0 930 331 599 1990 1,707.7 1,641.2 66.5 1,984.7 1,901.2 83.5 3,709 2,412 1,297 1995 2,141.5 2,073.2 68.3 2,434.8 2,350.4 84.4 5,953 4,384 1,569 1996 2,219.2 2,159.7 59.5 2,563.3 2,475.6 87.7 6,823 5,196 1,627 1997 2,401.4 2,345.5 55.9 2,750.7 2,661.8 88.9 7,528 5,881 1,647 1998 2,589.3 2,536.7 52.6 2,915.7 2,823.7 92.0 8,226 6,514 1,712 1999 2,705.2 2,649.7 55.5 3,052.5 2,956.7 95.8 9,281 7,493 1,788 2000 3,087.9 3,040.2 47.7 3,410.1 3,304.2 105.9 10,435 8,660 1,775 2001 2,891.5 2,850.7 40.8 3,304.7 3,209.5 95.2 7,423 5,950 1,473 2002 2,876.1 2,837.9 38.2 3,316.7 3,227.1 89.6 5,846 4,458 1,388 2003 2,731.3 2,696.9 34.4 3,223.6 3,135.5 88.1 5,854 4,350 1,504 2004 2,815.1 2,779.6 35.5 3,279.2 3,197.9 81.3 5,862 4,346 1,516 2005 2,808.4 2,779.4 29.0 3,256.2 3,186.4 69.8 5,908 4,342 1,566 2006 2,663.0 2,640.0 23.0 3,187.3 3,125.9 61.4 5,674 4,081 1,593 2007 2,670.0 2,649.0 21.0 3,108.5 3,050.0 58.5 5,794 4,117 1,677 2008 2,645.9 2,623.7 22.2 3,185.0 3,132.2 52.8 6,294 4,588 1,706 2009 2,625.8 2,607.6 18.2 2,942.0 2,898.0 44.0 6,497 4,791 1,706 2010 2,728.0 2,700.7 27.3 3,004.6 2,961.8 42.8 6,239 4,461 1,778 2011 2,780.5 2,747.1 33.4 3,173.4 3,130.3 43.1 7,671 5,859 1,812 2012 2,706.4 2,685.9 20.5 3,165.6 3,124.0 41.6 7,653 5,799 1,854 2013 2,700.0 2,673.4 26.6 3,153.1 3,118.9 34.2 7,538 5,633 1,905 2014 2,755.1 2,734.3 20.8 3,053.5 3,023.6 29.9 8,194 6,300 1,894 2015 2,612.1 2,593.1 19.0 2,826.9 2,800.9 26.0 8,859 7,008 1,851 2016 2,504.2 2,479.4 24.8 2,719.0 2,695.8 23.2 9,806 8,127 1,679 2017 2,351.7 2,331.1 20.6 2,505.0 2,480.9 24.1 10,849 9,353 1,496 2018 2,152.0 2,108.7 43.3 2,252.5 2,227.4 25.1 12,457 11,056 1,401
(1) Excluding parcels. Source: See Table 7-14.
Speedpost (1,000 pieces)
7-15a. Volume of Postal Service
DeliveredCorrespondence (million pieces) (1)
Period Accepted
147

Total Domestic International Total Domestic International1952 427 408 19 450 401 491955 650 612 38 640 587 531960 3,568 3,446 122 3,506 3,373 1331965 4,862 4,642 220 4,746 4,574 1721970 6,773 6,312 461 6,803 6,460 343 1975 7,255 6,467 788 7,339 6,805 534 1980 9,624 8,514 1,110 9,474 8,928 546 1985 9,631 8,318 1,313 9,248 8,652 596 1990 11,009 10,198 811 11,273 10,462 811 1995 18,213 17,548 665 18,741 18,121 620 1996 18,319 17,689 630 18,683 18,104 579 1997 18,373 17,795 578 18,736 18,146 590 1998 16,917 16,396 521 17,350 16,862 488 1999 16,147 15,623 524 16,539 16,085 454 2000 17,287 16,743 544 17,842 17,395 447 2001 10,631 10,078 553 10,952 10,605 347 2002 7,973 7,395 578 8,209 7,862 347 2003 8,953 8,376 577 9,181 8,815 366 2004 12,108 11,543 565 12,668 12,259 409 2005 15,767 15,216 551 16,720 16,333 387 2006 17,897 17,321 576 18,901 18,506 395 2007 19,958 19,349 609 21,560 21,152 408 2008 24,268 23,608 660 26,230 25,813 417 2009 25,351 24,657 694 26,980 26,568 412 2010 26,352 25,660 692 29,326 28,901 425 2011 27,214 26,533 681 30,192 29,740 452 2012 27,946 27,244 702 30,601 30,134 467 2013 25,600 24,922 678 28,159 27,669 490 2014 23,562 22,878 684 25,908 25,377 531 2015 24,172 23,450 722 26,559 25,927 632 2016 23,833 23,091 742 26,258 25,617 641 2017 24,605 23,920 685 26,997 26,314 683 2018 25,737 25,069 668 28,456 27,775 681
Period
7-15b. Volume of Postal Service (Continued)
Accepted DeliveredParcels (1,000 pieces)
148

Local Long-Distance International Incoming OutgoingMillionMinutes
MillionMinutes
1,000 Minutes 1,000 Minutes 1,000 Minutes Million Minutes No. ofSubscriptions
No. ofSubscriptions
1952 - - 59 - - 24,609 - 1955 - - 109 - - 33,531 - 1960 - - 119 - - 56,168 - 1965 - - 258 - - 98,520 - 1970 - - 2,131 - - 249,420 - 1975 - - 8,396 - - 774,233 - 1980 - - 22,945 - - 2,322,816 - 1985 - - 58,020 - - 4,227,992 - 1990 - - 241,928 - - 6,300,755 83,482 1995 - - 593,023 - - 9,174,813 772,165 1996 35,919 24,909 700,502 115,163 168,740 10,010,614 970,4731997 44,898 10,979 789,061 151,720 198,069 10,862,327 1,491,6091998 50,648 11,089 860,878 180,643 236,141 3,257 11,500,361 4,727,0451999 54,316 10,152 958,264 214,145 286,034 9,553 12,043,756 11,541,1392000 66,208 9,107 1,058,378 241,113 342,988 15,807 12,642,193 17,873,8292001 61,625 8,022 1,514,416 321,953 509,835 19,156 12,857,775 21,786,3842002 50,034 7,466 2,153,914 473,224 758,784 21,620 13,099,416 24,390,5202003 38,254 7,027 3,076,736 523,942 987,262 24,006 13,355,032 25,799,8392004 30,703 6,505 3,131,670 645,109 1,286,703 26,890 13,529,923 22,760,1442005 24,839 6,057 3,468,293 790,815 1,369,444 28,869 13,615,439 22,170,7022006 21,309 5,554 3,841,016 875,980 1,505,976 29,958 13,473,461 23,249,2622007 19,509 5,002 3,879,449 784,837 1,566,245 31,230 13,302,004 24,301,9712008 17,914 4,694 3,993,877 714,055 1,538,542 33,539 13,082,115 25,412,5142009 16,794 4,401 4,192,733 576,594 1,423,250 36,664 12,820,993 26,958,7722010 15,626 4,490 4,650,852 552,920 1,496,327 39,968 12,696,000 27,839,5272011 14,475 4,322 4,666,714 470,973 1,364,128 42,407 12,687,515 28,861,7622012 13,331 4,446 4,941,466 321,077 1,186,400 43,476 12,411,410 29,585,6742013 12,216 4,290 3,800,525 353,651 873,445 37,579 12,229,395 29,823,0292014 11,086 3,833 2,960,807 310,080 794,239 31,663 12,054,619 30,080,1852015 9,988 3,515 2,330,693 247,510 616,522 26,794 11,885,451 29,369,1082016 9,026 3,211 1,829,726 181,607 427,882 22,648 11,695,027 28,928,5872017 8,005 2,881 1,366,845 153,076 256,131 18,161 11,453,595 28,656,4872018 6,898 2,519 1,088,303 120,018 173,183 14,698 11,208,833 29,219,965
Source: The data are provided by the National Communications Commission, R.O.C.
7-16 Telephone Traffic and Subscriptions
Telephone Volume betweenthe StraitsFixed Telephone Traffic (Outgoing)
Period
Local TelephoneService
MobileTelephone
Service
MobileTelephone Traffic
(Outgoing)
149

Total ADSL FTTx Cable Modem Leased Line Total PWLAN (1) Mobile (2)
2002 2,098,485 1,832,742 - 247,688 18,055 2,110 2,110 -
2003 3,027,293 2,552,164 - 452,459 22,670 15,980 15,980 -
2004 3,717,385 3,169,202 - 526,209 21,974 33,829 33,829 -
2005 4,301,217 3,738,673 - 541,310 21,234 39,672 39,672 -
2006 4,451,852 4,002,365 - 419,912 29,575 3,321,935 53,948 3,267,987
2007 4,744,733 3,657,261 554,966 502,629 29,877 6,578,522 48,956 6,529,566
2008 4,968,120 3,026,166 1,259,041 648,910 34,003 10,841,248 56,254 10,784,994
2009 4,943,665 2,581,593 1,532,164 810,034 19,874 14,266,347 54,050 14,212,297
2010 5,265,026 2,360,485 1,957,840 927,637 19,064 16,579,979 46,573 16,533,406
2011 5,464,082 2,124,588 2,302,158 1,013,796 23,540 17,917,183 51,846 17,865,337
2012 5,561,711 1,820,462 2,633,495 1,081,623 26,131 18,708,463 887,108 17,821,355
2013 5,634,000 1,553,579 2,895,437 1,153,898 31,086 19,477,104 1,377,934 18,099,170
2014 5,669,614 1,360,787 3,096,263 1,208,765 3,799 20,738,470 1,767,005 18,971,465
2015 5,656,330 1,062,190 3,345,238 1,245,418 3,484 21,044,428 1,960,775 19,083,653
2016 5,685,764 865,786 3,525,140 1,292,081 2,757 21,865,412 106,235 21,759,177
2017 5,713,333 743,100 3,620,861 1,346,602 2,770 24,537,495 109,561 24,427,934
2018 5,723,029 628,621 3,673,962 1,417,793 2,653 26,772,122 37,155 26,734,967
(1) The figures before 2016 refer to PWLAN accounts registered. The figures after 2016 refer to PWLAN accounts with actual use.
7-17. Broadband Internet Accounts
(2)The figures refer to mobile-broadband subscriptions with Internet access. Source: See Table 7-16.
End of YearFixed-Broadband Internet Accounts Wireless-Broadband Internet Accounts
150

8. MONEY AND BANKING


8-1a. Principal Financial Indicators
1961 8 20 20 6 14.40 1965 16 44 41 11 11.52 1970 35 101 99 21 9.80 1975 131 345 382 76 10.75 1980 396 958 1,044 197 11.00 1985 750 2,583 1,990 422 5.25 1987 (3) 1,563 3,964 2,455 700 4.50 1990 1,926 6,472 5,064 1,156 7.75 1995 3,163 13,131 12,100 1,638 5.50 1998 3,855 16,697 15,472 1,665 4.75 1999 4,507 18,064 16,025 1,643 4.50 2000 4,492 19,309 16,622 1,583 4.63 2001 5,026 20,136 16,489 1,456 2.13 2002 5,492 20,573 16,078 1,569 1.63 2003 6,553 21,680 16,535 1,619 1.38 2004 7,368 23,148 17,964 1,718 1.75 2005 7,871 24,612 19,360 1,759 2.25 2006 8,223 25,812 20,154 1,883 2.75 2007 8,220 26,053 20,627 1,948 3.38 2008 8,154 27,870 21,332 2,125 2.00 2009 10,512 29,449 21,482 2,304 1.25 2010 11,457 31,006 22,804 2,502 1.63 2011 11,830 32,302 24,173 2,721 1.88 2012 12,418 33,300 25,549 2,902 1.88 2013 13,471 35,062 26,721 3,121 1.88 2014 14,310 37,134 28,111 3,263 1.88 2015 15,293 39,356 29,406 3,452 1.63 2016 16,178 40,717 30,549 3,630 1.38 2017 16,741 42,094 32,023 3,777 1.38 2018 17,716 43,196 33,748 4,055 1.38
(1) The carrying values of the host contracts of structured products issured by banks are excluded from deposits from 2001.(2) Referring to reserves held by deposit money banks and currency outside monetary institutions. (3) The postal savings system is included with monetary institutions after 1987. Source: Central Bank of the Republic of China, Financial Statistics Monthly, Taiwan Area, R.O.C. (Taiwan), May 2019.
Discount Rate(percent per annum)
I. Amount (NT$ billion)
End of Year MonetaryAggregates (M1B)
Reserve Money (2)
Deposits of MonetaryFinancial Institutions
(1)
Loans & Investments ofMonetary Financial
Institutions
151

Deposits of Loans & InvestmentsMonetary Financial of Monetary Financial
Institutions (1) Institutions
1962 5.2 16.9 23.8 7.3 1965 15.7 16.4 20.8 14.1 1970 15.1 19.5 17.7 17.3 1975 28.7 26.9 30.0 16.0 1980 22.7 17.1 26.6 16.7 1985 12.2 22.7 6.4 12.3 1987 (3) 37.7 24.7 16.6 25.0 1990 -6.7 10.3 14.8 3.0 1995 0.8 9.1 10.4 10.8 1998 3.8 8.3 7.8 9.4 1999 16.9 8.2 3.6 11.2 2000 -0.3 6.9 3.7 -4.1 2001 11.9 4.3 -0.8 5.6 2002 9.3 2.2 -2.5 7.7 2003 19.3 5.4 2.8 3.6 2004 12.4 6.8 8.6 6.2 2005 6.8 6.3 7.8 2.5 2006 4.5 4.9 4.1 7.3 2007 -0.03 0.9 2.4 3.9 2008 -0.8 7.0 3.4 8.2 2009 28.9 5.7 0.7 8.3 2010 9.0 5.3 6.2 8.6 2011 3.3 4.2 6.0 7.5 2012 5.0 3.1 5.7 6.7 2013 8.5 5.3 4.6 7.5 2014 6.2 5.9 5.2 4.6 2015 6.9 6.0 4.6 5.8 2016 5.8 3.5 3.9 5.2 2017 3.5 3.4 4.8 4.0 2018 5.8 2.6 5.4 7.4
II. Percentage Change from Previous Year (%)
8-1b. Principal Financial Indicators (Continued)
End of Year Monetary Aggregates(M1B)
Reserve Money(2)
152

Head Offices Branches Head Offices Branches Head Offices Branches Head Offices Branches1987 450 3,057 1 24 868 32 33 74 294 1990 468 3,488 1 24 996 35 43 74 399 1992 494 3,852 1 40 1,212 36 50 74 439 1993 501 4,111 1 41 1,382 37 55 74 482 1994 503 4,410 1 42 1,577 37 57 74 530 1995 503 4,745 1 42 1,807 38 58 73 556 1996 507 4,981 1 42 1,936 41 65 73 595 1997 509 5,181 1 47 2,176 45 69 64 505 1998 501 5,368 1 48 2,404 46 72 54 446 1999 495 5,531 1 52 2,576 41 71 50 416 2000 491 5,636 1 53 2,693 39 70 48 394 2001 448 5,841 1 53 3,005 38 69 39 373 2002 437 5,850 1 52 3,068 36 68 37 358 2003 433 5,930 1 50 3,173 36 69 35 341 2004 428 5,922 1 49 3,189 35 67 32 319 2005 422 5,943 1 46 3,239 36 68 29 295 2006 415 5,970 1 43 3,285 33 64 28 289 2007 417 5,977 1 40 3,313 32 83 27 267 2008 418 5,991 1 38 3,264 32 141 27 271 2009 428 5,973 1 38 3,279 32 133 26 258 2010 425 5,989 1 38 3,334 28 92 26 261 2011 425 6,016 1 38 3,359 28 92 25 255 2012 427 6,034 1 39 3,416 30 51 24 255 2013 428 6,050 1 40 3,442 31 39 24 257 2014 428 6,055 1 40 3,460 30 39 23 246 2015 429 6,048 1 40 3,444 30 39 23 253 2016 429 6,031 1 40 3,434 29 38 23 260 2017 427 6,022 1 39 3,421 29 38 23 268 2018 425 6,001 1 38 3,407 29 38 23 276
Source: See Table 8-1a.
Endof
Year
Total
8-2a. Number of Financial Institutions
Domestic BanksCentralBank
Local Branches of Foreign andMainland Chinese Banks
Credit Co-operativeassociations
153
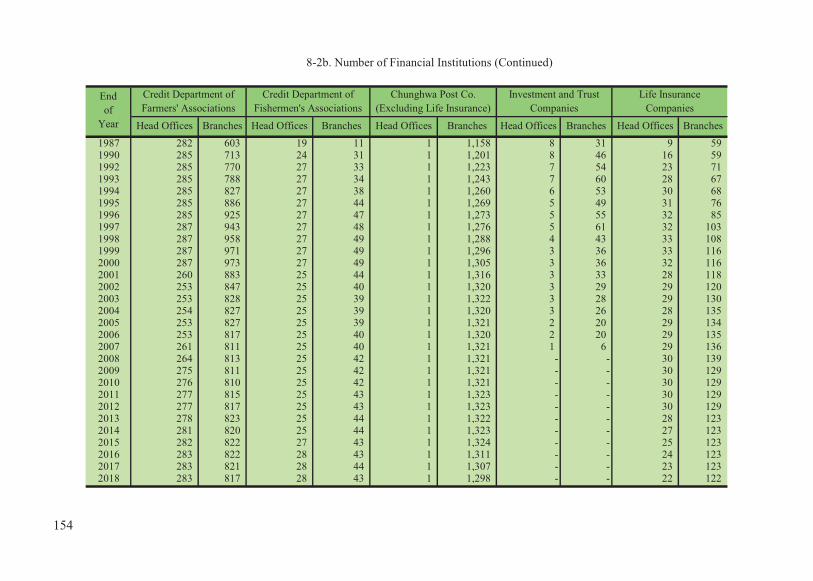
Head Offices Branches Head Offices Branches Head Offices Branches Head Offices Branches Head Offices Branches1987 282 603 19 11 1 1,158 8 31 9 59 1990 285 713 24 31 1 1,201 8 46 16 59 1992 285 770 27 33 1 1,223 7 54 23 71 1993 285 788 27 34 1 1,243 7 60 28 67 1994 285 827 27 38 1 1,260 6 53 30 68 1995 285 886 27 44 1 1,269 5 49 31 76 1996 285 925 27 47 1 1,273 5 55 32 85 1997 287 943 27 48 1 1,276 5 61 32 103 1998 287 958 27 49 1 1,288 4 43 33 108 1999 287 971 27 49 1 1,296 3 36 33 116 2000 287 973 27 49 1 1,305 3 36 32 116 2001 260 883 25 44 1 1,316 3 33 28 118 2002 253 847 25 40 1 1,320 3 29 29 120 2003 253 828 25 39 1 1,322 3 28 29 130 2004 254 827 25 39 1 1,320 3 26 28 135 2005 253 827 25 39 1 1,321 2 20 29 134 2006 253 817 25 40 1 1,320 2 20 29 135 2007 261 811 25 40 1 1,321 1 6 29 136 2008 264 813 25 42 1 1,321 - - 30 139 2009 275 811 25 42 1 1,321 - - 30 129 2010 276 810 25 42 1 1,321 - - 30 129 2011 277 815 25 43 1 1,323 - - 30 129 2012 277 817 25 43 1 1,323 - - 30 129 2013 278 823 25 44 1 1,322 - - 28 123 2014 281 820 25 44 1 1,323 - - 27 123 2015 282 822 27 43 1 1,324 - - 25 123 2016 283 822 28 43 1 1,311 - - 24 123 2017 283 821 28 44 1 1,307 - - 23 123 2018 283 817 28 43 1 1,298 - - 22 122
8-2b. Number of Financial Institutions (Continued)
Investment and TrustCompanies
Life InsuranceCompanies
Credit Department ofFarmers' Associations
Credit Department ofFishermen's Associations
Chunghwa Post Co.(Excluding Life Insurance)
Endof
Year
154

A. Stocks
Loans Investments Total ListedStocks
Short-termBills
CorporateBonds
OverseasDebentures
GovernmentBonds
BeneficiaryCertificates
I. Amount (NT$ billion)1987 3,029 2,652 2,420 232 377 609 289 138 52 0 131 01990 6,105 5,547 4,986 562 558 1,119 529 347 52 3 189 01995 15,143 13,241 11,629 1,612 1,902 3,514 1,498 922 92 131 872 01997 19,555 16,284 13,898 2,385 3,272 5,657 2,656 1,428 323 195 1,055 01998 21,924 17,688 14,785 2,903 4,236 7,140 3,525 1,802 519 195 1,099 01999 23,512 18,729 15,739 2,991 4,783 7,773 4,046 1,505 590 238 1,395 02000 25,449 19,932 16,792 3,141 5,516 8,657 4,856 1,266 707 302 1,525 02001 26,447 20,527 16,992 3,535 5,921 9,455 5,265 1,111 809 363 1,908 02002 27,433 20,952 17,064 3,888 6,482 10,369 5,553 878 1,007 537 2,395 02003 29,352 21,668 17,776 3,892 7,684 11,577 5,856 816 1,177 1,055 2,649 252004 31,710 23,484 19,345 4,138 8,227 12,534 6,160 783 1,216 1,329 2,984 632005 33,979 25,264 20,804 4,460 8,716 13,344 6,544 755 1,192 1,452 3,187 2142006 35,309 26,622 21,624 4,997 8,688 13,786 6,750 726 1,151 1,407 3,410 3422007 36,421 27,587 22,361 5,226 8,833 14,109 6,836 673 1,105 1,521 3,548 4262008 37,402 28,799 23,011 5,789 8,603 14,436 6,932 695 1,139 1,494 3,843 3332009 37,976 29,192 23,144 6,048 8,785 14,857 7,080 656 1,137 1,533 4,186 2642010 39,734 30,868 24,386 6,482 8,866 15,406 7,122 692 1,202 1,598 4,574 2172011 41,700 32,652 25,528 7,124 9,048 16,220 7,430 741 1,351 1,695 4,825 1782012 43,525 34,342 26,337 8,005 9,183 17,299 7,648 1,028 1,620 1,726 5,130 1482013 45,564 36,153 27,344 8,808 9,411 18,360 7,964 1,203 1,865 1,768 5,424 1352014 47,398 37,619 28,593 9,026 9,779 18,987 8,210 1,311 2,013 1,764 5,570 1192015 48,606 38,628 29,458 9,171 9,978 19,384 8,508 1,350 2,004 1,768 5,659 952016 49,802 39,531 30,367 9,164 10,271 19,626 8,713 1,484 1,898 1,738 5,695 982017 51,514 41,308 31,634 9,674 10,206 20,165 8,979 1,713 1,938 1,778 5,661 962018 53,266 43,183 33,089 10,094 10,083 20,465 9,140 1,765 2,023 1,801 5,633 104
(1) Since 2004, bank reverse repos (RS) have been reclassified from “securities investment” to “deposits.” The computation for Reduction of Direct Finance originally should not have included bank RS trade balance, but up to 2003, banks did not report RS related data, which is now untraceable. Hence, to ensure consistency with the 2003 comparison basis, from 2004 this item still excludes the bank RS transaction balance.
Source: Central Bank of the Republic of China (Taiwan), Financial Statistics , May 2019.
8-3a. Non-financial Sector Sources of Funds
Financing through Intermediaries Financingthrough
SecuritiesMarkets (1)
(B)
Securities Issues Loans and Investments End
ofYear
AllSources(A)+(B)
Total(A)
155
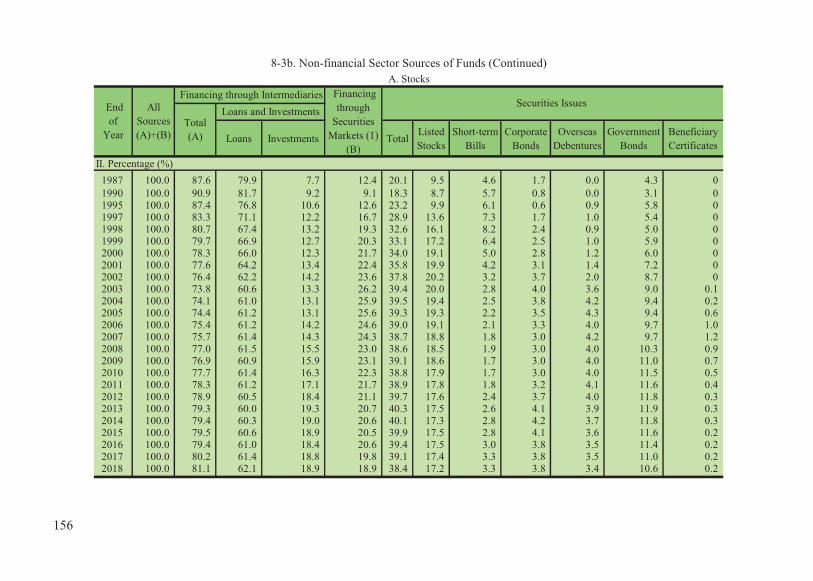
8-3b. Non-financial Sector Sources of Funds (Continued)A. Stocks
Loans Investments Total ListedStocks
Short-termBills
CorporateBonds
OverseasDebentures
GovernmentBonds
BeneficiaryCertificates
II. Percentage (%)1987 100.0 87.6 79.9 7.7 12.4 20.1 9.5 4.6 1.7 0.0 4.3 01990 100.0 90.9 81.7 9.2 9.1 18.3 8.7 5.7 0.8 0.0 3.1 01995 100.0 87.4 76.8 10.6 12.6 23.2 9.9 6.1 0.6 0.9 5.8 01997 100.0 83.3 71.1 12.2 16.7 28.9 13.6 7.3 1.7 1.0 5.4 01998 100.0 80.7 67.4 13.2 19.3 32.6 16.1 8.2 2.4 0.9 5.0 01999 100.0 79.7 66.9 12.7 20.3 33.1 17.2 6.4 2.5 1.0 5.9 02000 100.0 78.3 66.0 12.3 21.7 34.0 19.1 5.0 2.8 1.2 6.0 02001 100.0 77.6 64.2 13.4 22.4 35.8 19.9 4.2 3.1 1.4 7.2 02002 100.0 76.4 62.2 14.2 23.6 37.8 20.2 3.2 3.7 2.0 8.7 02003 100.0 73.8 60.6 13.3 26.2 39.4 20.0 2.8 4.0 3.6 9.0 0.12004 100.0 74.1 61.0 13.1 25.9 39.5 19.4 2.5 3.8 4.2 9.4 0.22005 100.0 74.4 61.2 13.1 25.6 39.3 19.3 2.2 3.5 4.3 9.4 0.62006 100.0 75.4 61.2 14.2 24.6 39.0 19.1 2.1 3.3 4.0 9.7 1.02007 100.0 75.7 61.4 14.3 24.3 38.7 18.8 1.8 3.0 4.2 9.7 1.22008 100.0 77.0 61.5 15.5 23.0 38.6 18.5 1.9 3.0 4.0 10.3 0.92009 100.0 76.9 60.9 15.9 23.1 39.1 18.6 1.7 3.0 4.0 11.0 0.72010 100.0 77.7 61.4 16.3 22.3 38.8 17.9 1.7 3.0 4.0 11.5 0.52011 100.0 78.3 61.2 17.1 21.7 38.9 17.8 1.8 3.2 4.1 11.6 0.42012 100.0 78.9 60.5 18.4 21.1 39.7 17.6 2.4 3.7 4.0 11.8 0.32013 100.0 79.3 60.0 19.3 20.7 40.3 17.5 2.6 4.1 3.9 11.9 0.32014 100.0 79.4 60.3 19.0 20.6 40.1 17.3 2.8 4.2 3.7 11.8 0.32015 100.0 79.5 60.6 18.9 20.5 39.9 17.5 2.8 4.1 3.6 11.6 0.22016 100.0 79.4 61.0 18.4 20.6 39.4 17.5 3.0 3.8 3.5 11.4 0.22017 100.0 80.2 61.4 18.8 19.8 39.1 17.4 3.3 3.8 3.5 11.0 0.22018 100.0 81.1 62.1 18.9 18.9 38.4 17.2 3.3 3.8 3.4 10.6 0.2
Securities Issues Loans and Investments End
ofYear
AllSources(A)+(B)
Total(A)
Financing through Intermediaries Financingthrough
SecuritiesMarkets (1)
(B)
156

8-3c. Non-financial Sector Sources of Funds (Continued)B. Flows
Loans Investments TotalListedStocks
Short-term Bills
CorporateBonds
OverseasDebentures
GovernmentBonds
BeneficiaryCertificates
I. Amount (NT$ billion)1987 525 468 483 -14 56 42 15 -16 5 0 39 0 1990 763 763 592 171 0 171 43 155 6 0 -34 0 1995 1,442 1,305 1,034 271 138 409 113 193 21 22 59 0 1997 2,278 1,670 1,548 122 608 730 501 65 73 48 44 0 1998 1,935 1,404 887 518 531 1,049 435 373 196 1 44 0 1999 1,289 1,041 954 87 248 335 222 -297 71 42 296 0 2000 1,377 1,203 1,053 150 174 324 250 -238 117 64 130 0 2001 665 595 201 394 71 465 76 -156 101 60 383 0 2002 808 425 72 353 383 736 110 -233 199 174 486 0 2003 1,677 716 712 5 961 966 62 -62 170 518 254 25 2004 2,129 1,816 1,570 246 313 728 75 -32 39 274 335 38 2005 1,962 1,780 1,459 322 182 503 76 -29 -24 124 204 152 2006 1,206 1,358 821 537 -151 318 83 -29 -41 -46 223 128 2007 1,048 966 737 229 83 259 23 -52 -47 114 138 84 2008 896 1,212 649 563 -316 242 11 22 34 -27 295 -93 2009 535 392 133 259 143 382 110 -39 -2 39 343 -69 2010 1,842 1,676 1,243 434 166 633 126 36 65 65 388 -48 2011 1,803 1,784 1,141 643 19 651 145 49 149 97 250 -39 2012 1,707 1,690 809 881 17 962 100 287 269 31 305 -30 2013 1,873 1,811 1,007 803 63 895 150 176 246 42 295 -13 2014 1,701 1,466 1,249 218 234 493 113 108 148 -4 146 -16 2015 1,074 1,010 865 145 64 262 163 39 -9 4 89 -24 2016 1,130 903 909 -6 227 178 140 134 -106 -30 36 3 2017 1,658 1,777 1,267 510 -119 484 212 229 40 40 -34 -2 2018 1,795 1,875 1,455 420 -80 343 204 51 85 23 -29 9
Total(A)
Endof
Year
AllSources(A)+(B)
Securities Issues Financing
throughSecuritiesMarkets(1) (B)
Loans and Investments Financing through Intermediaries
157

8-3d. Non-financial Sector Sources of Funds (Continued)B. Flows
Loans Investments Total ListedStocks
Short-termBills
CorporateBonds
OverseasDebentures
GovernmentBonds
BeneficiaryCertificates
II. Percentage (%)1987 100.0 89.3 92.0 -2.7 10.7 8.0 2.8 -3.1 0.9 0.0 7.4 01990 100.0 100.0 77.6 22.4 0.0 22.4 5.7 20.4 0.8 0.0 -4.5 01995 100.0 90.5 71.7 18.8 9.5 28.3 7.8 13.4 1.5 1.5 4.1 01997 100.0 73.3 68.0 5.4 26.7 32.0 22.0 2.8 3.2 2.1 1.9 01998 100.0 72.6 45.8 26.8 27.4 54.2 22.5 19.3 10.1 0.0 2.3 01999 100.0 80.8 74.0 6.8 19.2 26.0 17.3 -23.0 5.5 3.3 23.0 02000 100.0 87.4 76.5 10.9 12.6 23.5 18.2 -17.3 8.5 4.7 9.4 02001 100.0 89.4 30.2 59.2 10.6 69.8 11.4 -23.4 15.2 9.1 57.6 02002 100.0 52.6 8.9 43.7 47.4 91.1 13.6 -28.8 24.6 21.5 60.2 02003 100.0 42.7 42.4 0.3 57.3 57.6 3.7 -3.7 10.1 30.9 15.1 1.52004 100.0 85.3 73.7 11.6 14.7 34.2 3.5 -1.5 1.8 12.9 15.7 1.82005 100.0 90.7 74.3 16.4 9.3 25.6 3.9 -1.5 -1.2 6.3 10.4 7.72006 100.0 112.5 68.0 44.5 -12.5 26.4 6.9 -2.4 -3.4 -3.8 18.4 10.62007 100.0 92.1 70.3 21.8 7.9 24.7 2.1 -5.0 -4.4 10.9 13.2 8.02008 100.0 135.3 72.4 62.8 -35.3 27.0 1.2 2.5 3.8 -3.0 32.9 -10.42009 100.0 73.3 24.9 48.5 26.7 71.4 20.5 -7.3 -0.4 7.3 64.1 -12.82010 100.0 91.0 67.5 23.6 9.0 34.4 6.8 2.0 3.5 3.5 21.1 -2.62011 100.0 98.9 63.3 35.6 1.1 36.1 8.0 2.7 8.3 5.4 13.9 -2.12012 100.0 99.0 47.4 51.6 1.0 56.3 5.9 16.8 15.7 1.8 17.9 -1.82013 100.0 96.7 53.8 42.9 3.3 47.8 8.0 9.4 13.1 2.2 15.7 -0.72014 100.0 86.2 73.4 12.8 13.8 29.0 6.6 6.3 8.7 -0.3 8.6 -1.02015 100.0 94.0 80.6 13.5 6.0 24.4 15.2 3.6 -0.8 0.4 8.3 -2.32016 100.0 79.9 80.4 -0.5 20.1 15.7 12.4 11.9 -9.4 -2.6 3.2 0.32017 100.0 107.2 76.4 30.7 -7.2 29.2 12.8 13.8 2.4 2.4 -2.1 -0.12018 100.0 104.5 81.1 23.4 -4.5 19.1 11.4 2.9 4.7 1.3 -1.6 0.5
Securities Issues Loans and Investments End
ofYear
Total(A)
AllSources(A)+(B)
Financing through Intermediaries Financingthrough
SecuritiesMarkets (1)
(B)
158

8-4. Monetary AggregatesAmount unit: NT$ million
Currency Held Deposit Quasi-by the Public Money money
(A) (B) (D) 1987 (1) 279,878 1,283,261 1,563,139 2,362,347 3,925,486 … … 1990 348,407 1,577,240 1,925,647 4,276,244 6,201,891 -6.6 11.0 1992 427,508 1,998,335 2,425,843 6,387,871 8,813,714 12.4 19.1 1993 461,137 2,336,003 2,797,140 7,373,059 10,170,199 15.3 15.4 1994 497,747 2,641,523 3,139,270 8,563,516 11,702,786 12.2 15.1 1995 506,694 2,656,407 3,163,101 9,642,264 12,805,365 0.8 9.4 1996 498,513 2,927,545 3,426,058 10,547,818 13,973,876 8.3 9.1 1997 510,364 3,204,888 3,715,252 11,379,107 15,094,359 8.4 8.0 1998 513,745 3,341,039 3,854,784 12,531,938 16,386,722 3.8 8.6 1999 611,167 3,896,013 4,507,180 13,237,833 17,745,013 16.9 8.3 2000 527,748 3,964,324 4,492,072 14,405,725 18,897,797 -0.3 6.5 2001 525,659 4,500,201 5,025,860 14,686,637 19,712,497 11.9 4.3 2002 527,278 4,964,311 5,491,589 14,718,897 20,210,486 9.3 2.5 2003 608,205 5,944,627 6,552,832 14,805,445 21,358,277 19.3 5.7 2004 669,848 6,698,152 7,368,000 15,525,077 22,893,077 12.4 7.2 2005 730,367 7,140,781 7,871,148 16,538,930 24,410,078 6.8 6.6 2006 758,721 7,463,905 8,222,626 17,445,600 25,668,226 4.5 5.2 2007 762,627 7,457,350 8,219,977 17,663,127 25,883,104 -0.03 0.8 2008 833,537 7,320,167 8,153,704 19,601,771 27,755,475 -0.8 7.2 2009 912,618 9,598,968 10,511,586 18,843,976 29,355,562 28.9 5.8 2010 995,853 10,461,273 11,457,126 19,497,303 30,954,429 9.0 5.5 2011 1,107,344 10,722,872 11,830,216 20,621,704 32,451,920 3.3 4.8 2012 1,203,212 11,215,168 12,418,380 21,156,024 33,574,404 5.0 3.5 2013 1,329,651 12,141,101 13,470,752 22,048,111 35,518,863 8.5 5.8 2014 1,460,904 12,849,182 14,310,086 23,386,754 37,696,840 6.2 6.1 2015 1,565,415 13,727,172 15,292,587 24,591,408 39,883,995 6.9 5.8 2016 1,680,388 14,497,288 16,177,676 25,124,156 41,301,832 5.8 3.6 2017 1,791,303 14,950,120 16,741,423 26,028,794 42,770,217 3.5 3.6 2018 1,942,602 15,773,384 17,715,986 26,189,214 43,905,200 5.8 2.7
(1) See note (3) of Table 8-1a.Source: See Table 8-1a.
M2End of Year M1B
(C=A+B)M2
(E=C+D)M1B
Annual Growth Rate (%)Monetary Aggregates (M 1B) Monetary Aggregates (M 2)
159

Endof
Year
Claims onGov't
Claims onGov't
Enterprises
Claims onPrivate Sector
Net ForeignAssets
(1)
Quasi-money
GovernmentDeposits
Other Items(Net)
MonetaryAggregates
(M1B)
1990/1989 3,215+ 50,578+ 600,001+ 6,837+ 749,589– 2,407+ 50,584– 137,135– 1991/1990 142,237+ 66,769+ 917,192+ 184,822+ 968,304– 63,673+ 173,623– 232,766+ 1992/1991 207,549+ 54,468+ 1,508,823+ 25,072+ 1,143,323– 133,179– 251,980– 267,430+ 1993/1992 231,416+ 15,670+ 1,303,363+ 21,744+ 985,188– 57,856– 157,852– 371,297+ 1994/1993 156,534+ 16,560– 1,304,655+ 123,071+ 1,190,457– 80,980– 45,867+ 342,130+ 1995/1994 196,171+ 12,065+ 936,435+ 47,605– 1,078,748– 5,914– 11,427+ 23,831+ 1996/1995 342,421+ 9,483– 618,557+ 165,278+ 905,554– 46,738+ 5,000+ 262,957+ 1997/1996 341,427+ 13,620+ 945,219+ 27,864– 831,289– 51,750– 100,169– 289,194+ 1998/1997 162,221+ 2,260– 959,635+ 245,456+ 1,152,831– 13,374+ 86,063– 139,532+ 1999/1998 354,313+ 22,900– 221,888+ 816,080+ 705,895– 106,418– 95,328+ 652,396+ 2000/1999 330,027+ 23,190+ 243,834+ 468,971+ 1,167,892– 8,298– 95,060+ 15,108– 2001/2000 255,686+ 79,908+ 468,288– 820,260+ 280,912– 10,750– 137,884+ 533,788+ 2002/2001 43,520– 17,907+ 385,672– 973,607+ 32,260– 59,309+ 123,642– 465,729+ 2003/2002 45,474+ 45,246– 456,829+ 1,025,622+ 86,548– 39,527– 295,361– 1,061,243+ 2004/2003 117,913– 52,599+ 1,494,269+ 719,117+ 719,632– 4,410+ 617,682– 815,168+ 2005/2004 65,400– 117,067+ 1,344,522+ 627,642+ 1,013,853– 6,718– 500,112– 503,148+ 2006/2005 68,627+ 17,095– 742,175+ 493,211+ 906,670– 29,933+ 58,703– 351,478+ 2007/2006 112,783– 71,797+ 513,984+ 172,633+ 217,527– 30,076– 400,677– 2,649– 2008/2007 119,816+ 281,625+ 303,175+ 1,458,757+ 1,938,644– 16,185– 274,817– 66,273– 2009/2008 428,346+ 81,264– 196,261– 2,148,277+ 757,795+ 57,380– 641,631– 2,357,882+ 2010/2009 114,269+ 60,130+ 1,146,976+ 926,457+ 653,327– 42,164– 606,801– 945,540+ 2011/2010 162,067+ 67,292+ 1,139,847+ 207,066+ 1,124,401– 90,172+ 168,953– 373,090+ 2012/2011 359,645+ 21,203+ 995,073+ 462,713+ 534,320– 28,382+ 744,532– 588,164+ 2013/2012 74,914+ 44,399+ 1,052,451+ 1,068,440+ 892,087– 55,994+ 351,739– 1,052,372+ 2014/2013 223,326+ 51,287– 1,217,939+ 1,068,648+ 1,338,643– 24,719– 255,930– 839,334+ 2015/2014 215,275+ 17,579+ 1,062,854+ 1,218,348+ 1,204,654– 139,303– 187,598– 982,501+ 2016/2015 253,181+ 104,512– 994,190+ 776,302+ 532,748– 58,707– 442,617– 885,089+ 2017/2016 49,393– 48,020+ 1,474,904+ 506,288+ 904,638– 19,087– 492,347– 563,747+ 2018/2017 261,164+ 68,691+ 1,394,958+ 263,938– 160,420– 118,191– 207,701– 974,563+
(1) Excluding valuation changes resulting from the fluctuation of the exchange rates of the N.T. dollar against foreign currencies.Source: See Table 8-1a.
Changes in Monetary Aggregate (NT$ million): (+) Increase in Monetary Aggregate, (-) Decrease in Monetary Aggregate
8-5. Factors Affecting Monetary Aggregate (M 1B)
160

Passbook FixedSavings SavingsDeposits Deposits
1987 2,301,690 199,514 268,742 470,548 448,848 691,509 209,254 13,275 1990 3,818,610 233,214 379,337 528,908 1,107,394 1,162,364 333,341 74,052 1992 5,333,339 254,016 442,230 746,519 1,323,692 1,957,930 526,071 82,881 1993 6,192,673 270,379 532,766 887,202 1,362,527 2,429,277 599,233 111,289 1994 7,166,694 286,471 591,517 1,049,757 1,685,649 2,777,414 648,411 127,475 1995 7,994,877 291,398 544,509 1,159,180 1,855,278 3,310,600 618,377 215,535 1996 8,845,899 286,616 630,351 1,347,636 1,992,117 3,696,675 582,650 309,854 1997 10,283,738 286,812 718,907 1,607,384 2,658,323 3,814,955 627,452 569,905 1998 11,609,415 274,765 774,065 1,741,330 3,202,380 4,389,795 623,535 603,545 1999 12,650,359 314,589 865,079 2,148,557 2,920,679 5,077,514 670,058 653,883 2000 13,677,441 305,361 901,913 2,218,115 2,974,359 5,384,984 715,766 1,176,943 2001 14,549,914 262,907 974,428 2,732,491 2,698,648 5,998,472 764,115 1,118,853 2002 14,962,324 266,924 1,135,873 3,004,532 2,592,899 6,227,899 691,510 1,042,687 2003 15,946,296 302,514 1,432,552 3,581,971 2,462,073 6,286,335 709,255 1,171,596 2004 17,083,597 306,991 1,603,533 4,099,189 2,656,630 6,412,415 682,356 1,322,483 2005 18,176,571 367,518 1,675,419 4,376,876 2,812,712 6,773,599 662,940 1,507,507 2006 19,034,099 353,337 1,742,254 4,633,833 3,043,863 6,826,237 646,800 1,787,775 2007 19,313,771 309,441 1,872,375 4,567,477 3,271,568 6,599,377 641,256 2,052,277 2008 20,993,573 306,201 1,873,651 4,441,902 4,299,186 7,018,205 652,350 2,402,078 2009 22,340,848 325,555 2,451,404 6,012,088 3,977,688 6,559,138 596,183 2,418,792 2010 23,598,177 340,176 2,688,197 6,542,247 4,208,838 6,546,483 697,030 2,575,206 2011 24,783,296 392,811 2,759,715 6,656,912 4,616,645 7,000,791 678,018 2,678,404 2012 25,587,343 395,457 2,855,877 6,989,201 4,557,763 7,256,995 656,739 2,875,311 2013 27,101,027 366,713 3,253,900 7,478,124 4,522,708 7,391,214 613,253 3,475,115 2014 28,747,988 378,682 3,400,682 7,969,593 4,582,146 7,607,719 648,692 4,160,474 2015 30,594,149 372,483 3,789,628 8,439,934 4,729,214 7,844,691 722,199 4,696,000 2016 31,736,168 425,374 3,893,525 8,997,540 4,742,212 7,907,641 767,720 5,002,156 2017 33,018,539 415,796 3,963,343 9,349,156 5,008,086 7,808,032 802,755 5,671,371 2018 33,988,455 446,341 4,172,612 9,893,066 5,119,091 7,734,260 873,309 5,749,776
(1) Beginning Jan. 2010, the carrying value of the host contracts of structured products issued by banks are excluded from deposits.Note: Including the data of domestic banks and the local branches of foreign and Mainland Chinese banks.Source: See Table 8-1a.
ForeignCurrency
Deposits (1)I. Amount (NT$ million)
8-6a. Deposits of All Banks by Account
Endof
YearTotal
CheckingAccounts
PassbookDeposits
Time Deposits(1)
GovernmentDeposits
161

Passbook FixedSavings SavingsDeposits Deposits
1987 100.0 8.7 11.7 20.4 19.5 30.0 9.1 0.6 1990 100.0 6.1 9.9 13.9 29.0 30.4 8.7 1.9 1992 100.0 4.8 8.3 14.0 24.8 36.7 9.9 1.6 1993 100.0 4.4 8.6 14.3 22.0 39.2 9.7 1.8 1994 100.0 4.0 8.3 14.6 23.5 38.8 9.0 1.8 1995 100.0 3.6 6.8 14.5 23.2 41.4 7.7 2.7 1996 100.0 3.2 7.1 15.2 22.5 41.8 6.6 3.5 1997 100.0 2.8 7.0 15.6 25.8 37.1 6.1 5.5 1998 100.0 2.4 6.7 15.0 27.6 37.8 5.4 5.2 1999 100.0 2.5 6.8 17.0 23.1 40.1 5.3 5.2 2000 100.0 2.2 6.6 16.2 21.7 39.4 5.2 8.6 2001 100.0 1.8 6.7 18.8 18.5 41.2 5.3 7.7 2002 100.0 1.8 7.6 20.1 17.3 41.6 4.6 7.0 2003 100.0 1.9 9.0 22.5 15.4 39.4 4.4 7.3 2004 100.0 1.8 9.4 24.0 15.6 37.5 4.0 7.7 2005 100.0 2.0 9.2 24.1 15.5 37.3 3.6 8.3 2006 100.0 1.9 9.2 24.3 16.0 35.9 3.4 9.4 2007 100.0 1.6 9.7 23.6 16.9 34.2 3.3 10.6 2008 100.0 1.5 8.9 21.2 20.5 33.4 3.1 11.4 2009 100.0 1.5 11.0 26.9 17.8 29.4 2.7 10.8 2010 100.0 1.4 11.4 27.7 17.8 27.7 3.0 10.9 2011 100.0 1.6 11.1 26.9 18.6 28.2 2.7 10.8 2012 100.0 1.5 11.2 27.3 17.8 28.4 2.6 11.2 2013 100.0 1.4 12.0 27.6 16.7 27.3 2.3 12.8 2014 100.0 1.3 11.8 27.7 15.9 26.5 2.3 14.5 2015 100.0 1.2 12.4 27.6 15.5 25.6 2.4 15.3 2016 100.0 1.3 12.3 28.4 14.9 24.9 2.4 15.8 2017 100.0 1.3 12.0 28.3 15.2 23.6 2.4 17.2 2018 100.0 1.3 12.3 29.1 15.1 22.8 2.6 16.9
II. Percentage (%)
8-6b. Deposits of All Banks by Account (Continued)
Endof
YearTotal Checking
AccountsPassbookDeposits
Time Deposits(1)
GovernmentDeposits
ForeignCurrency
Deposits (1)
162

GovernmentDeposits
1987 3,964,360 1,283,261 2,362,347 318,752 1990 6,471,499 1,577,240 4,276,244 618,015 1992 9,074,056 1,998,335 6,387,871 687,850 1993 10,454,439 2,336,003 7,373,059 745,377 1994 12,031,396 2,641,523 8,563,516 826,357 1995 13,130,942 2,656,407 9,642,264 832,271 1996 14,260,896 2,927,545 10,547,818 785,533 1997 15,421,618 3,204,888 11,379,107 837,623 1998 16,697,004 3,341,039 12,531,938 824,027 1999 18,064,287 3,896,013 13,237,833 930,441 2000 19,308,786 3,964,324 14,405,725 938,737 2001 20,136,238 4,500,201 14,686,637 949,400 2002 20,573,363 4,964,311 14,718,897 890,155 2003 21,679,769 5,944,627 14,805,445 929,697 2004 23,148,513 6,698,152 15,525,077 925,284 2005 24,611,612 7,140,781 16,538,930 931,901 2006 25,811,473 7,463,905 17,445,600 901,968 2007 26,052,521 7,457,350 17,663,127 932,044 2008 27,870,167 7,320,167 19,601,771 948,229 2009 29,448,553 9,598,968 18,843,976 1,005,609 2010 31,006,349 10,461,273 19,497,303 1,047,773 2011 32,302,177 10,722,872 20,621,704 957,601 2012 33,300,411 11,215,168 21,156,024 929,219 2013 35,062,437 12,141,101 22,048,111 873,225 2014 37,133,880 12,849,182 23,386,754 897,944 2015 39,355,827 13,727,172 24,591,408 1,037,247 2016 40,717,398 14,497,288 25,124,156 1,095,954 2017 42,093,955 14,950,120 26,028,794 1,115,041 2018 43,195,830 15,773,384 26,189,214 1,233,232
Source: See Table 8-1a.
I. Amount (NT$ million)
End of Year Total
8-7a. Total Deposits with Monetary Financial Institutions
Deposit Money Quasi-money
163
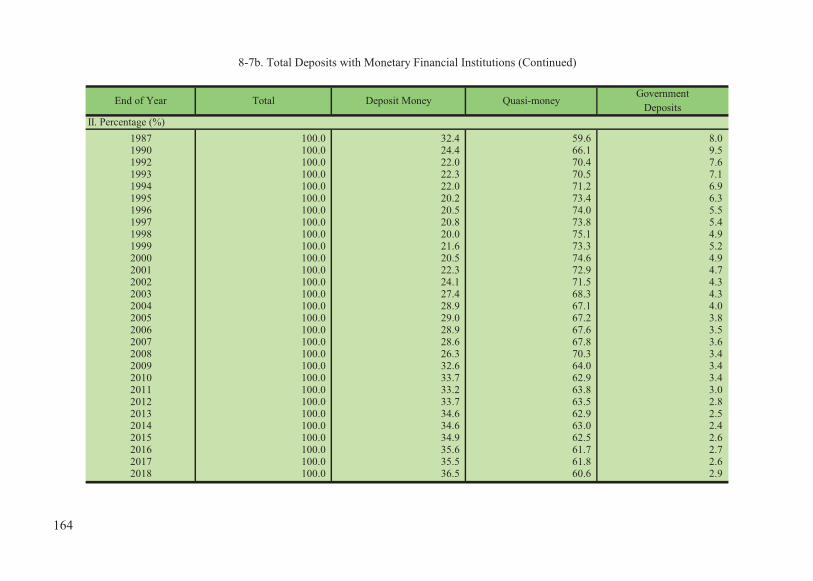
GovernmentDeposits
1987 100.0 32.4 59.6 8.0 1990 100.0 24.4 66.1 9.5 1992 100.0 22.0 70.4 7.6 1993 100.0 22.3 70.5 7.1 1994 100.0 22.0 71.2 6.9 1995 100.0 20.2 73.4 6.3 1996 100.0 20.5 74.0 5.5 1997 100.0 20.8 73.8 5.4 1998 100.0 20.0 75.1 4.9 1999 100.0 21.6 73.3 5.2 2000 100.0 20.5 74.6 4.9 2001 100.0 22.3 72.9 4.7 2002 100.0 24.1 71.5 4.3 2003 100.0 27.4 68.3 4.3 2004 100.0 28.9 67.1 4.0 2005 100.0 29.0 67.2 3.8 2006 100.0 28.9 67.6 3.5 2007 100.0 28.6 67.8 3.6 2008 100.0 26.3 70.3 3.4 2009 100.0 32.6 64.0 3.4 2010 100.0 33.7 62.9 3.4 2011 100.0 33.2 63.8 3.0 2012 100.0 33.7 63.5 2.8 2013 100.0 34.6 62.9 2.5 2014 100.0 34.6 63.0 2.4 2015 100.0 34.9 62.5 2.6 2016 100.0 35.6 61.7 2.7 2017 100.0 35.5 61.8 2.6 2018 100.0 36.5 60.6 2.9
II. Percentage (%)
8-7b. Total Deposits with Monetary Financial Institutions (Continued)
End of Year Total Deposit Money Quasi-money
164

Public Private IndividualsEnterprises Enterprises & All Others
1987 2,301,690 209,254 10,140 47 2,082,249 1990 3,818,610 333,341 16,696 162 3,468,411 1992 5,333,339 526,071 183,241 1,010,900 3,613,127 1993 6,192,673 599,233 208,014 1,133,153 4,252,273 1994 7,166,694 648,411 202,337 1,353,378 4,962,568 1995 7,994,877 618,377 198,505 1,541,867 5,636,128 1996 8,845,899 582,650 218,786 1,815,401 6,229,062 1997 10,283,738 627,452 237,540 2,102,501 7,316,245 1998 11,609,415 623,535 272,959 2,396,257 8,316,664 1999 12,650,359 670,058 273,531 2,621,048 9,085,722 2000 13,677,441 715,766 263,719 3,183,907 9,514,049 2001 14,549,914 764,115 158,724 2,992,014 10,635,061 2002 14,962,324 691,510 144,320 3,103,038 11,023,456 2003 15,946,296 709,255 149,807 3,396,383 11,690,851 2004 17,083,597 682,356 139,598 3,668,909 12,592,734 2005 18,176,571 662,940 150,897 3,880,723 13,482,011 2006 19,034,099 646,800 159,822 4,102,334 14,125,143 2007 19,313,771 641,256 158,000 4,323,403 14,191,112 2008 20,993,573 652,350 170,712 4,975,307 15,195,204 2009 22,340,848 596,183 133,710 5,517,062 16,093,893 2010 23,598,177 697,030 148,579 6,042,860 16,709,708 2011 24,783,296 678,018 151,437 6,339,864 17,613,977 2012 25,587,343 656,739 151,315 6,500,070 18,279,219 2013 27,101,027 613,253 144,366 7,144,613 19,198,795 2014 28,747,988 648,692 112,876 7,714,886 20,271,534 2015 30,594,149 722,199 113,883 8,454,217 21,303,850 2016 31,736,168 767,720 115,359 8,621,991 22,231,098 2017 33,018,539 802,755 129,059 9,156,718 22,930,007 2018 33,988,455 873,309 139,105 9,350,800 23,625,241 Note: Figures up to 1996 are for deposits in domesitc banks, and from 1997 for deposits in all banks (domestic banks and the local branches
of foreign banks).Source: See Table 8-1a.
I. Amount (NT$ million)
8-8a. Deposits with All Banks by Depositor
End of Year Total Government
165

Public Private IndividualsEnterprises Enterprises & All Others
1987 100.0 9.1 0.4 0.0 90.5 1990 100.0 8.7 0.4 0.0 90.8 1992 100.0 9.9 3.4 19.0 67.7 1993 100.0 9.7 3.4 18.3 68.7 1994 100.0 9.0 2.8 18.9 69.2 1995 100.0 7.7 2.5 19.3 70.5 1996 100.0 6.6 2.5 20.5 70.4 1997 100.0 6.1 2.3 20.4 71.1 1998 100.0 5.4 2.4 20.6 71.6 1999 100.0 5.3 2.2 20.7 71.8 2000 100.0 5.2 1.9 23.3 69.6 2001 100.0 5.3 1.1 20.6 73.1 2002 100.0 4.6 1.0 20.7 73.7 2003 100.0 4.4 0.9 21.3 73.3 2004 100.0 4.0 0.8 21.5 73.7 2005 100.0 3.6 0.8 21.4 74.2 2006 100.0 3.4 0.8 21.6 74.2 2007 100.0 3.3 0.8 22.4 73.5 2008 100.0 3.1 0.8 23.7 72.4 2009 100.0 2.7 0.6 24.7 72.0 2010 100.0 3.0 0.6 25.6 70.8 2011 100.0 2.7 0.6 25.6 71.1 2012 100.0 2.6 0.6 25.4 71.4 2013 100.0 2.3 0.5 26.4 70.8 2014 100.0 2.3 0.4 26.8 70.5 2015 100.0 2.4 0.4 27.6 69.6 2016 100.0 2.4 0.4 27.2 70.0 2017 100.0 2.4 0.4 27.7 69.4 2018 100.0 2.6 0.4 27.5 69.5
II. Percentage (%)
8-8b. Deposits with All Banks by Depositor (Continued)
End of Year Total Government
166

Public Private IndividualsEnterprises Enterprises & All Others
1998 11,795,818 1,538,790 365,713 4,778,928 5,112,387 1999 12,537,233 1,724,515 368,757 5,203,737 5,240,224 2000 13,295,437 2,061,110 384,454 5,412,707 5,437,166 2001 13,094,597 2,132,692 460,515 5,157,317 5,344,073 2002 12,872,922 1,932,859 476,744 5,050,185 5,413,134 2003 13,504,740 1,944,921 436,103 5,178,402 5,945,314 2004 14,862,514 1,917,413 456,144 5,544,374 6,944,583 2005 16,098,378 1,782,204 557,852 6,032,762 7,725,560 2006 16,501,113 1,592,716 525,392 6,511,663 7,871,342 2007 16,944,572 1,361,186 591,936 6,903,289 8,088,161 2008 17,378,376 1,252,319 760,190 7,218,230 8,147,637 2009 17,554,377 1,491,377 733,832 6,969,208 8,359,960 2010 18,735,529 1,505,496 791,888 7,559,180 8,878,965 2011 19,819,265 1,537,801 824,558 8,296,101 9,160,805 2012 20,372,531 1,598,606 693,934 8,642,361 9,437,630 2013 20,978,750 1,450,721 704,415 8,903,208 9,920,405 2014 21,935,623 1,439,919 632,234 9,392,309 10,471,160 2015 22,604,057 1,374,314 610,739 9,602,924 11,016,080 2016 23,457,668 1,325,979 515,184 10,200,472 11,416,033 2017 24,483,424 1,253,941 498,042 10,727,460 12,003,981 2018 25,755,375 1,234,790 552,779 11,298,957 12,668,849
Note: Figures up to 1996 are for loans in domesitc banks, and from 1997 for loans in all banks (domestic banks and the local branchesof foreign banks).
Source: See Table 8-1a.
I. Amount (NT$ million)
8-9a. Loans and Discounts at All Banks by Borrower
End of Year Total Government
167
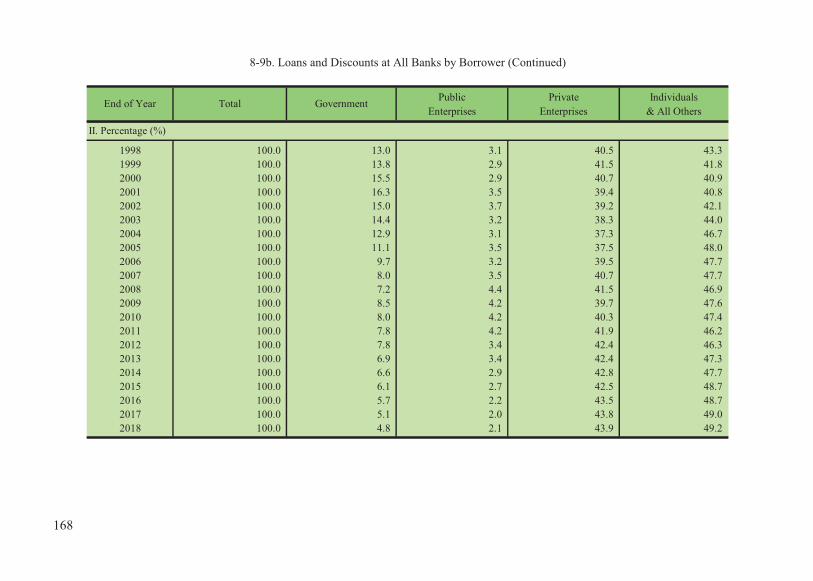
Public Private IndividualsEnterprises Enterprises & All Others
1998 100.0 13.0 3.1 40.5 43.3 1999 100.0 13.8 2.9 41.5 41.8 2000 100.0 15.5 2.9 40.7 40.9 2001 100.0 16.3 3.5 39.4 40.8 2002 100.0 15.0 3.7 39.2 42.1 2003 100.0 14.4 3.2 38.3 44.0 2004 100.0 12.9 3.1 37.3 46.7 2005 100.0 11.1 3.5 37.5 48.0 2006 100.0 9.7 3.2 39.5 47.7 2007 100.0 8.0 3.5 40.7 47.7 2008 100.0 7.2 4.4 41.5 46.9 2009 100.0 8.5 4.2 39.7 47.6 2010 100.0 8.0 4.2 40.3 47.4 2011 100.0 7.8 4.2 41.9 46.2 2012 100.0 7.8 3.4 42.4 46.3 2013 100.0 6.9 3.4 42.4 47.3 2014 100.0 6.6 2.9 42.8 47.7 2015 100.0 6.1 2.7 42.5 48.7 2016 100.0 5.7 2.2 43.5 48.7 2017 100.0 5.1 2.0 43.8 49.0 2018 100.0 4.8 2.1 43.9 49.2
II. Percentage (%)
8-9b. Loans and Discounts at All Banks by Borrower (Continued)
End of Year Total Government
168

Public Private IndividualsEnterprises Enterprises & All Others
1998 792,253 144,790 -29,746 387,518 289,691 1999 741,415 185,725 3,044 424,809 127,837 2000 758,204 336,595 15,697 208,970 196,942 2001 -200,840 71,582 76,061 -255,390 -93,0932002 -221,675 -199,833 16,229 -107,132 69,0612003 631,818 12,062 -40,641 128,217 532,1802004 1,357,774 -27,508 20,041 365,972 999,2692005 1,235,864 -135,209 101,708 488,388 780,9772006 402,735 -189,488 -32,460 478,901 145,7822007 443,459 -231,530 66,544 391,626 216,8192008 433,804 -108,867 168,254 314,941 59,4762009 176,001 239,058 -26,358 -249,022 212,3232010 1,181,152 14,119 58,056 589,972 519,0052011 1,083,736 32,305 32,670 736,921 281,8402012 553,266 60,805 -130,624 346,260 276,8252013 606,219 -147,885 10,481 260,847 482,7752014 956,873 -10,802 -72,181 489,101 550,7552015 668,434 -65,605 -21,495 210,615 544,9202016 853,611 -48,335 -95,555 597,548 399,9532017 1,025,756 -72,038 -17,142 526,988 587,9482018 1,271,951 -19,151 54,737 571,497 664,868
III. Amount of Increase over Previous Year (NT$ million)
8-9c. Loans and Discounts at All Banks by Borrower (Continued)
End of Year Total Government
169

Public Private IndividualsEnterprises Enterprises & All Others
1998 7.2 10.4 -7.5 8.8 6.01999 6.3 12.1 0.8 8.9 2.52000 6.1 19.5 4.3 4.0 3.82001 -1.5 3.5 19.8 -4.7 -1.72002 -1.7 -9.4 3.5 -2.1 1.32003 4.9 0.62 -8.5 2.5 9.82004 10.1 -1.4 4.6 7.1 16.82005 8.3 -7.1 22.3 8.8 11.32006 2.5 -10.6 -5.8 7.9 1.92007 2.7 -14.5 12.7 6.0 2.82008 2.6 -8.0 28.4 4.6 0.72009 1.0 19.1 -3.5 -3.5 2.62010 6.7 1.0 7.9 8.5 6.22011 5.8 2.2 4.1 9.8 3.22012 2.8 4.0 -15.8 4.2 3.02013 3.0 -9.3 1.5 3.0 5.12014 4.6 -0.7 -10.3 5.5 5.62015 3.1 -4.6 -3.4 2.2 5.22016 3.8 -3.5 -15.7 6.2 3.62017 4.4 -5.4 -3.3 5.2 5.22018 5.2 -1.5 11.0 5.3 5.5
IV. Percentage Change from Previous Year (%)
8-9d. Loans and Discounts at All Banks by Borrower (Continued)
End of Year Total Government
170

1987 2,304,761 1,814,235 120,135 199,393 163,420 5,095 -1990 4,649,393 3,614,271 195,494 492,089 341,335 4,161 -1992 7,276,102 5,699,778 255,529 767,277 548,612 2,865 -1993 8,438,995 6,546,085 263,390 921,294 701,077 5,108 -1994 9,904,368 7,781,837 280,618 1,020,449 816,967 2,457 -1995 10,802,769 8,536,855 325,236 1,036,354 899,530 2,754 -1996 11,205,171 9,027,472 349,531 962,537 860,117 3,474 -1997 12,510,156 10,595,268 408,297 739,606 760,036 4,909 -1998 13,177,329 11,405,939 389,879 655,281 717,790 6,400 -1999 13,760,055 12,148,297 388,936 546,814 670,106 3,862 -2000 14,428,909 12,896,175 399,262 491,716 635,114 4,602 -2001 14,036,644 12,715,129 379,468 387,332 547,766 4,909 -2002 13,731,393 12,504,851 368,071 360,137 491,978 4,316 -2003 14,332,857 13,131,103 373,637 357,067 462,010 9,040 -2004 15,867,752 14,598,731 430,393 353,256 475,174 9,497 701 2005 17,158,349 15,776,663 485,828 345,938 528,161 20,612 1,147 2006 17,598,943 16,055,994 539,950 358,499 606,904 34,367 3,229 2007 18,021,730 16,390,786 590,747 344,089 676,296 18,237 1,575 2008 18,470,098 16,739,070 680,047 343,760 698,718 7,069 1,434 2009 18,599,228 17,069,669 507,317 328,797 689,440 3,056 949 2010 19,852,506 18,312,190 477,299 336,123 719,108 7,046 740 2011 20,960,771 19,232,380 631,168 340,178 749,317 6,580 1,148 2012 21,650,271 19,944,503 538,989 363,051 800,046 3,154 528 2013 22,404,430 20,561,070 558,005 392,251 876,467 16,035 602 2014 23,472,558 21,387,250 729,780 405,061 947,933 2,244 291 2015 24,276,983 22,031,026 807,557 428,810 1,003,523 5,802 264 2016 25,122,090 22,715,933 931,408 442,026 1,025,856 6,609 257 2017 26,298,188 23,644,124 1,124,237 456,504 1,063,103 10,219 -2018 27,659,920 24,776,982 1,265,910 478,158 1,119,623 19,247 -(1) Since 1997, data for Medium Business Banks has been incorporated into data for Domestic Banks.(2) The time series begins from Oct. 2004 when money market mutual funds were first issued, and ends in May 2017 after the liquidation
procedure of Yuanta Commercial Bank Money Market Common Trust Fund was completed.Source: See Table 8-1a.
Unit: NT$ million8-10. Loans of Other Monetary Financial Institutions
Chunghwa PostCo.
Money MarketMutual Funds (2)End of Year Total
Local Branchesof
Foreign Banks
CreditCooperativeAssociations
Domestic Banks(1)
Credit Departmentsof Farmers' and
Fishermen'sAssociations
171

Investment and Life InsuranceTrust Companies Companies
(1) (2)1987 307,305 136,970 170,335 1990 729,325 362,403 366,922 1992 889,267 325,028 564,239 1993 1,046,760 361,091 685,669 1994 1,228,814 276,617 952,197 1995 1,396,714 260,731 1,135,983 1996 1,605,523 266,438 1,339,085 1997 1,829,959 264,510 1,565,449 1998 2,031,475 205,034 1,826,441 1999 2,304,746 156,301 2,148,445 2000 2,597,310 104,938 2,492,372 2001 3,036,611 117,107 2,919,504 2002 3,610,635 116,233 3,494,402 2003 4,266,848 118,842 4,148,006 2004 4,994,776 121,233 4,873,543 2005 5,820,036 115,552 5,704,484 2006 6,544,534 110,374 6,434,160 2007 7,153,668 13,559 7,140,109 2008 7,842,007 - 7,842,007 2009 8,973,000 - 8,973,000 2010 10,224,292 - 10,224,292 2011 11,182,235 - 11,182,235 2012 12,547,269 - 12,547,269 2013 14,129,560 - 14,129,560 2014 15,557,494 - 15,557,494 2015 17,178,532 - 17,178,532 2016 18,944,639 - 18,944,639 2017 20,760,292 - 20,760,292 2018 22,706,152 - 22,706,152
(1) Beginning Dec. 2008, there are no longer trust and investment companies in operation. (2) Referring to life insurance reserves. Source: See Table 8-1a.
8-11. Major Liabilities of Other Financial InstitutionsUnit: NT$ million
End of Year Total
172

Investment and Life InsuranceTrust Companies Companies
(1)1987 115,530 71,001 44,529 1990 336,193 203,556 132,637 1992 427,977 233,222 194,755 1993 539,301 276,074 263,227 1994 561,222 220,537 340,685 1995 620,948 215,982 404,966 1996 662,136 219,851 442,285 1997 796,007 245,992 550,015 1998 862,490 193,996 668,494 1999 898,137 127,417 770,720 2000 976,350 89,939 886,411 2001 1,030,897 68,428 962,469 2002 1,028,714 50,501 978,213 2003 995,443 53,683 941,760 2004 984,711 62,521 922,190 2005 1,007,872 61,844 946,028 2006 1,093,818 61,786 1,032,032 2007 1,165,453 6,095 1,159,358 2008 1,252,269 - 1,252,269 2009 1,189,617 - 1,189,617 2010 1,181,451 - 1,181,451 2011 1,193,671 - 1,193,671 2012 1,244,507 - 1,244,507 2013 1,444,775 - 1,444,775 2014 1,558,186 - 1,558,186 2015 1,543,315 - 1,543,315 2016 1,495,752 - 1,495,752 2017 1,476,852 - 1,476,852 2018 1,468,548 - 1,468,548
(1) See note (1) of Table 8-11.Source: See Table 8-1a.
8-12. Loans of Other Financial InstitutionsUnit: NT$ million
End of Year Total
173
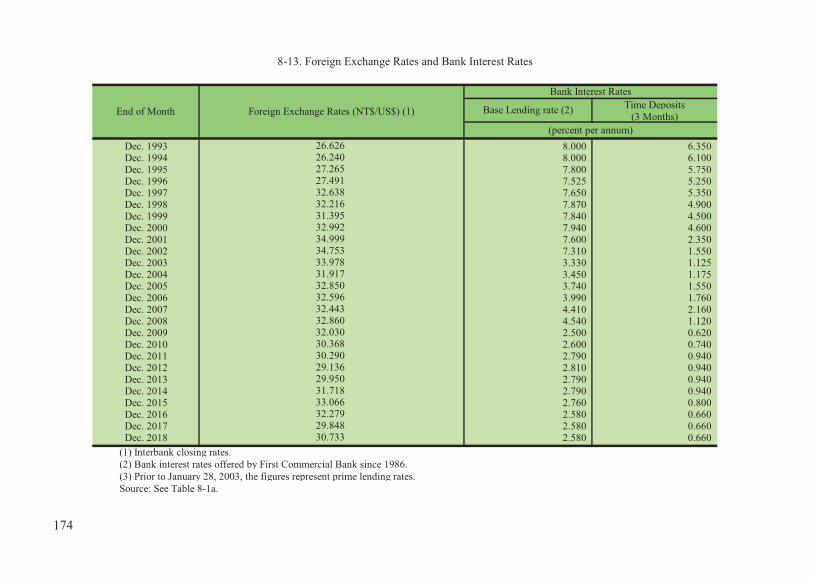
Time Deposits(3 Months)
Dec. 1993 8.000 6.350Dec. 1994 8.000 6.100Dec. 1995 7.800 5.750Dec. 1996 7.525 5.250Dec. 1997 7.650 5.350Dec. 1998 7.870 4.900Dec. 1999 7.840 4.500Dec. 2000 7.940 4.600Dec. 2001 7.600 2.350Dec. 2002 7.310 1.550Dec. 2003 3.330 1.125Dec. 2004 3.450 1.175Dec. 2005 3.740 1.550Dec. 2006 3.990 1.760Dec. 2007 4.410 2.160Dec. 2008 4.540 1.120Dec. 2009 2.500 0.620Dec. 2010 2.600 0.740Dec. 2011 2.790 0.940Dec. 2012 2.810 0.940Dec. 2013 2.790 0.940Dec. 2014 2.790 0.940Dec. 2015 2.760 0.800Dec. 2016 2.580 0.660Dec. 2017 2.580 0.660Dec. 2018 2.580 0.660
(1) Interbank closing rates.(2) Bank interest rates offered by First Commercial Bank since 1986. (3) Prior to January 28, 2003, the figures represent prime lending rates.Source: See Table 8-1a.
32.279
32.850
27.491
30.368
32.86032.44332.596
32.030
32.638
32.99231.395
8-13. Foreign Exchange Rates and Bank Interest Rates
End of Month
Bank Interest Rates
Base Lending rate (2)
(percent per annum)
Foreign Exchange Rates (NT$/US$) (1)
30.733
32.216
33.06631.71829.95029.13630.290
31.917
34.999
33.97834.753
29.848
26.626
27.26526.240
174

9. PUBLIC FINANCE

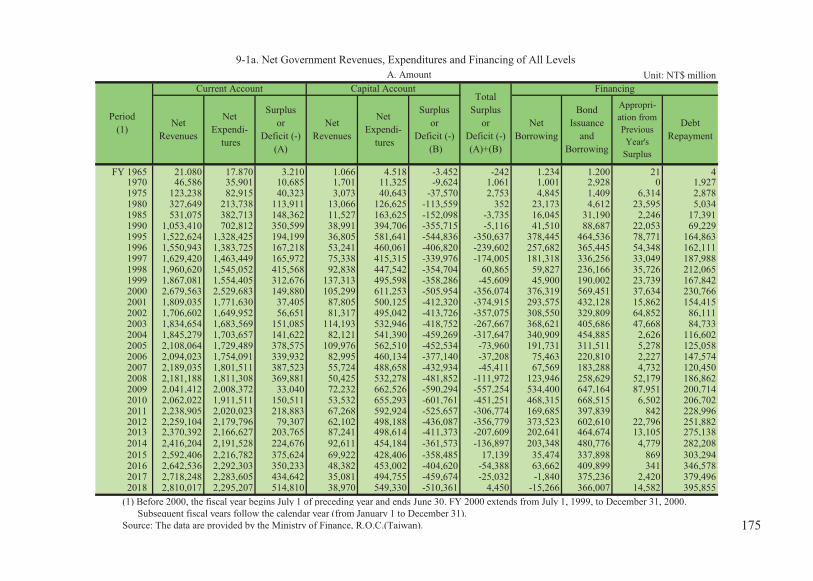
Unit: NT$ million
FY 1965 21,080 17,870 3,210 1,066 4,518 -3,452 -242 1,234 1,200 21 41970 46,586 35,901 10,685 1,701 11,325 -9,624 1,061 1,001 2,928 0 1,9271975 123,238 82,915 40,323 3,073 40,643 -37,570 2,753 4,845 1,409 6,314 2,8781980 327,649 213,738 113,911 13,066 126,625 -113,559 352 23,173 4,612 23,595 5,0341985 531,075 382,713 148,362 11,527 163,625 -152,098 -3,735 16,045 31,190 2,246 17,3911990 1,053,410 702,812 350,599 38,991 394,706 -355,715 -5,116 41,510 88,687 22,053 69,2291995 1,522,624 1,328,425 194,199 36,805 581,641 -544,836 -350,637 378,445 464,536 78,771 164,8631996 1,550,943 1,383,725 167,218 53,241 460,061 -406,820 -239,602 257,682 365,445 54,348 162,1111997 1,629,420 1,463,449 165,972 75,338 415,315 -339,976 -174,005 181,318 336,256 33,049 187,9881998 1,960,620 1,545,052 415,568 92,838 447,542 -354,704 60,865 59,827 236,166 35,726 212,0651999 1,867,081 1,554,405 312,676 137,313 495,598 -358,286 -45,609 45,900 190,002 23,739 167,8422000 2,679,563 2,529,683 149,880 105,299 611,253 -505,954 -356,074 376,319 569,451 37,634 230,7662001 1,809,035 1,771,630 37,405 87,805 500,125 -412,320 -374,915 293,575 432,128 15,862 154,4152002 1,706,602 1,649,952 56,651 81,317 495,042 -413,726 -357,075 308,550 329,809 64,852 86,1112003 1,834,654 1,683,569 151,085 114,193 532,946 -418,752 -267,667 368,621 405,686 47,668 84,7332004 1,845,279 1,703,657 141,622 82,121 541,390 -459,269 -317,647 340,909 454,885 2,626 116,6022005 2,108,064 1,729,489 378,575 109,976 562,510 -452,534 -73,960 191,731 311,511 5,278 125,0582006 2,094,023 1,754,091 339,932 82,995 460,134 -377,140 -37,208 75,463 220,810 2,227 147,5742007 2,189,035 1,801,511 387,523 55,724 488,658 -432,934 -45,411 67,569 183,288 4,732 120,4502008 2,181,188 1,811,308 369,881 50,425 532,278 -481,852 -111,972 123,946 258,629 52,179 186,8622009 2,041,412 2,008,372 33,040 72,232 662,526 -590,294 -557,254 534,400 647,164 87,951 200,7142010 2,062,022 1,911,511 150,511 53,532 655,293 -601,761 -451,251 468,315 668,515 6,502 206,7022011 2,238,905 2,020,023 218,883 67,268 592,924 -525,657 -306,774 169,685 397,839 842 228,9962012 2,259,104 2,179,796 79,307 62,102 498,188 -436,087 -356,779 373,523 602,610 22,796 251,8822013 2,370,392 2,166,627 203,765 87,241 498,614 -411,373 -207,609 202,641 464,674 13,105 275,1382014 2,416,204 2,191,528 224,676 92,611 454,184 -361,573 -136,897 203,348 480,776 4,779 282,2082015 2,592,406 2,216,782 375,624 69,922 428,406 -358,485 17,139 35,474 337,898 869 303,2942016 2,642,536 2,292,303 350,233 48,382 453,002 -404,620 -54,388 63,662 409,899 341 346,5782017 2,718,248 2,283,605 434,642 35,081 494,755 -459,674 -25,032 -1,840 375,236 2,420 379,4962018 2,810,017 2,295,207 514,810 38,970 549,330 -510,361 4,450 -15,266 366,007 14,582 395,855
(1) Before 2000, the fiscal year begins July 1 of preceding year and ends June 30. FY 2000 extends from July 1, 1999, to December 31, 2000. Subsequent fiscal years follow the calendar year (from January 1 to December 31).
Source: The data are provided by the Ministry of Finance, R.O.C.(Taiwan).
NetRevenues
NetExpendi-
tures
Surplusor
Deficit (-) (B)
9-1a. Net Government Revenues, Expenditures and Financing of All Levels
Period(1)
Current Account Capital AccountTotal
Surplusor
Deficit (-)(A)+(B)
Financing
NetRevenues
NetExpendi-
tures
DebtRepayment
A. Amount
NetBorrowing
BondIssuance
andBorrowing
Appropri-ation fromPreviousYear's
Surplus
Surplusor
Deficit (-)(A)
175

Unit: %
FY 1970 10.8 15.6 130.2 4.61975 14.6 32.1 22.7 67.51980 21.9 38.5 66.7 36.81985 5.6 11.7 -10.6 0.01990 18.3 21.6 26.1 -37.31995 5.6 14.2 -39.5 -12.31996 1.9 4.2 44.7 -20.91997 5.1 5.8 41.5 -9.71998 20.3 5.6 23.2 7.81999 -4.8 0.6 47.9 10.72000 43.5 62.7 -23.3 23.32001 -32.5 -30.0 -16.6 -18.22002 -5.7 -6.9 -7.4 -1.02003 7.5 2.0 40.4 7.72004 0.6 1.2 -28.1 1.62005 14.2 1.5 33.9 3.92006 -0.7 1.4 -24.5 -18.22007 4.5 2.7 -32.9 6.22008 -0.4 0.5 -9.5 8.92009 -6.4 10.9 43.2 24.52010 1.0 -4.8 -25.9 -1.12011 8.6 5.7 25.7 -9.52012 0.9 7.9 -7.7 -16.02013 4.9 -0.6 40.5 0.12014 1.9 1.1 6.2 -8.92015 7.3 1.2 -24.5 -5.72016 1.9 3.4 -30.8 5.72017 2.9 -0.4 -27.5 9.22018 3.4 0.5 11.1 11.0
9-1b. Net Government Revenues and Expenditures of All Levels (Continued)
Net Expenditures
Current Account Capital AccountPeriod
(1) Net Revenues
Net Expenditures
Net Revenues
B. Growth Rate
176

FY 1955 6,077 4,174 921 250 155 145 432 1960 11,699 6,915 1,886 1,144 271 389 1,094 1965 22,146 11,974 3,273 3,109 822 1,536 1,432 1970 48,287 30,657 6,007 4,937 2,183 2,333 2,169 1975 126,311 84,389 13,115 14,227 6,487 4,084 4,009 1980 340,715 237,187 24,162 33,106 15,573 14,594 16,093 1985 542,603 353,109 41,738 76,779 27,764 13,597 29,616 1990 1,092,401 794,812 52,921 121,418 36,830 42,907 43,512 1995 1,559,429 1,170,856 61,408 141,956 87,304 51,630 46,276 1996 1,604,184 1,141,838 55,959 181,094 91,857 69,587 63,850 1997 1,704,759 1,213,274 58,179 180,797 98,451 94,908 59,149 1998 2,053,458 1,339,605 57,448 361,574 107,086 134,321 53,424 1999 2,004,394 1,299,740 55,322 324,851 105,884 162,729 55,869 2000 2,784,863 1,852,451 77,316 458,420 171,956 131,854 92,865 2001 1,896,841 1,200,278 57,563 346,581 118,927 108,082 65,410 2002 1,787,919 1,190,874 346 260,869 170,097 94,260 71,473 2003 1,948,847 1,220,116 - 417,621 118,506 126,803 65,801 2004 1,927,400 1,353,410 - 289,974 127,658 93,954 62,404 2005 2,218,040 1,531,297 - 375,663 132,069 122,804 56,207 2006 2,177,018 1,556,652 - 325,939 133,624 97,408 63,396 2007 2,244,758 1,685,875 - 291,799 141,225 70,826 55,032 2008 2,231,614 1,710,617 - 264,918 140,992 64,674 50,412 2009 2,113,644 1,483,518 - 330,928 133,410 86,342 79,446 2010 2,115,554 1,565,847 - 286,479 139,479 69,617 54,132 2011 2,306,173 1,703,989 - 293,954 137,926 81,488 88,817 2012 2,321,205 1,733,350 - 298,007 162,670 78,490 48,689 2013 2,457,632 1,768,817 - 275,040 258,960 108,062 46,755 2014 2,508,815 1,917,609 - 271,916 143,098 125,983 50,209 2015 2,662,328 2,076,623 - 262,085 177,017 98,200 48,403 2016 2,690,918 2,165,967 - 254,953 142,376 67,579 60,043 2017 2,753,329 2,187,690 - 271,421 180,231 55,373 58,614 2018 2,848,987 2,299,208 - 273,238 156,961 61,922 57,658
(1) See (1) of Table 9-1a. (2) Excluding Financial Enterprises Business Tax, Health and Welfare Surcharge on Tobacco. After FY 2013, taxes include Specifically
Selected Goods and Services Tax, starting from 2017, taxes excludes revenues for long-term care services development fund. Source: See Table 9-1a.
9-2a. Net Government Revenues of All Levels by Source
I. Amount (NT$ million)
Period(1)
Total Taxes(2)
Monopolies Fees, Fines &Indemnities
Public Properties OthersSurplus of PublicEnterprises
177

FY1955 100.0 68.7 15.2 4.1 2.6 2.4 7.1 1960 100.0 59.1 16.1 9.8 2.3 3.3 9.4 1965 100.0 54.1 14.8 14.0 3.7 6.9 6.5 1970 100.0 63.5 12.4 10.2 4.5 4.8 4.5 1975 100.0 66.8 10.4 11.3 5.1 3.2 3.2 1980 100.0 69.6 7.1 9.7 4.6 4.3 4.7 1985 100.0 65.1 7.7 14.2 5.1 2.5 5.5 1990 100.0 72.8 4.8 11.1 3.3 4.0 4.0 1995 100.0 75.1 3.9 9.1 5.6 3.4 2.9 1996 100.0 71.2 3.5 11.3 5.7 4.3 4.0 1997 100.0 71.2 3.4 10.6 5.8 5.5 3.5 1998 100.0 65.2 2.8 17.6 5.3 6.5 2.6 1999 100.0 64.8 2.8 16.2 5.3 8.2 2.8 2000 100.0 66.5 2.8 16.5 6.1 4.8 3.3 2001 100.0 63.3 3.0 18.3 6.3 5.7 3.5 2002 100.0 66.6 0.02 14.6 9.5 5.2 4.0 2003 100.0 62.6 - 21.4 6.1 6.5 3.4 2004 100.0 70.2 - 15.0 6.6 4.9 3.3 2005 100.0 69.0 - 16.9 6.0 5.6 2.6 2006 100.0 71.5 - 15.0 6.2 4.5 2.9 2007 100.0 75.1 - 13.0 6.3 3.2 2.4 2008 100.0 76.7 - 11.9 6.3 2.9 2.3 2009 100.0 70.2 - 15.7 6.4 4.1 3.7 2010 100.0 74.0 - 13.5 6.6 3.3 2.6 2011 100.0 73.9 - 12.7 6.0 3.5 3.8 2012 100.0 74.7 - 12.8 7.0 3.4 2.1 2013 100.0 72.0 - 11.2 10.5 4.3 2.0 2014 100.0 76.4 - 10.8 5.7 5.0 2.1 2015 100.0 78.0 - 9.8 6.6 3.7 1.9 2016 100.0 80.5 - 9.5 5.3 2.5 2.2 2017 100.0 79.5 - 9.9 6.6 2.0 2.0 2018 100.0 80.7 - 9.6 5.5 2.2 2.0
II.percentage(%)
Period(1) Total
9-2b. Net Government Revenues of All Levels by Source (Continued)
Taxes(2) Monopolies Fees, Fines &
Indemnities Public Properties OthersSurplus of PublicEnterprises
178

FY 1955 6,414 981 3,173 892 690 - 435 - - 243 1960 12,080 1,408 5,962 1,648 1,692 - 839 - 16 515 1965 22,387 2,865 9,190 2,794 4,270 - 1,699 - 967 602 1970 47,226 6,349 17,628 7,992 8,795 - 4,712 - 756 994 1975 123,558 19,377 30,231 20,741 37,486 - 12,657 - 957 2,109 1980 340,363 32,031 103,141 52,846 108,860 - 38,224 - 1,827 3,434 1985 546,338 61,968 135,243 111,522 138,021 34,279 14,001 40,462 6,032 4,810 1990 1,097,518 125,786 210,974 227,271 302,281 96,207 31,248 76,246 16,755 10,749 1995 1,910,066 222,403 269,960 357,487 438,152 231,766 65,309 118,121 194,890 11,978 1996 1,843,786 243,973 284,926 374,401 329,135 290,002 68,035 137,118 106,061 10,135 1997 1,878,764 244,757 291,920 375,822 295,035 294,982 68,614 179,723 115,630 12,280 1998 1,992,593 257,265 312,286 411,513 335,012 282,767 74,850 187,673 115,896 15,331 1999 2,050,004 279,113 286,571 429,127 351,103 280,452 90,310 180,582 140,910 11,836 2000 3,140,936 468,033 357,757 655,109 474,895 531,809 106,102 265,079 270,252 11,900 2001 2,271,755 328,736 247,597 430,078 398,792 396,981 109,597 175,722 171,565 12,687 2002 2,144,994 325,815 225,243 437,756 405,257 323,615 71,702 170,988 170,966 13,652 2003 2,216,514 331,885 237,946 464,186 400,910 346,911 90,061 173,223 159,667 11,726 2004 2,245,047 334,797 253,019 469,544 412,870 347,557 95,008 179,665 139,331 13,254 2005 2,291,999 341,874 247,472 473,243 430,476 357,762 100,704 191,531 132,639 16,298 2006 2,214,226 345,237 234,699 484,827 341,944 370,303 88,849 196,963 138,331 13,072 2007 2,290,169 343,950 255,854 492,625 383,298 372,202 87,282 200,677 139,380 14,901 2008 2,343,585 350,500 262,150 495,515 432,335 368,136 82,157 202,228 134,697 15,867 2009 2,670,898 357,412 297,746 581,535 601,896 388,562 91,639 205,291 129,484 17,333 2010 2,566,804 368,420 286,929 554,254 517,039 415,356 89,388 201,002 119,615 14,801 2011 2,612,947 376,015 288,889 588,555 473,801 446,922 88,872 213,039 121,120 15,735 2012 2,677,984 388,759 303,903 595,622 403,945 540,440 85,380 218,355 124,937 16,643 2013 2,665,241 381,641 292,646 599,058 393,669 536,912 104,932 209,680 128,453 18,250 2014 2,645,712 380,634 291,418 618,139 399,261 517,143 84,293 213,708 125,171 15,945 2015 2,645,189 382,543 304,636 634,781 352,780 532,096 82,498 218,504 120,640 16,712 2016 2,745,305 385,293 314,847 664,723 394,635 548,538 91,967 208,057 121,036 16,209 2017 2,778,361 382,968 304,632 691,268 389,523 563,844 124,648 198,495 107,339 15,642 2018 2,844,538 401,529 308,571 675,439 452,368 588,006 106,720 189,213 106,239 16,453
(1) See (1) of Table 9-1a.(2) Debt repayment is excluded. Source: See Table 9-1a.
9-3a. Net Government Expenditures of All Levels by Administrative Affair
EconomicDevelopment
I. Amount (NT$ million)
Period(1) Total National
DefenseSocial
WelfareObligations
(2) OthersRetirement andCondolence
CommunityDevelopment &Environmental
Protection
GeneralAdminis-
tration
Education,Science &
Culture
179

FY 1955 100.0 15.3 49.5 13.9 10.8 - 6.8 - - 3.8 1960 100.0 11.7 49.4 13.6 14.0 - 6.9 - 0.1 4.31965 100.0 12.8 41.1 12.5 19.1 - 7.6 - 4.3 2.71970 100.0 13.4 37.3 16.9 18.6 - 10.0 - 1.6 2.11975 100.0 15.7 24.5 16.8 30.3 - 10.2 - 0.8 1.71980 100.0 9.4 30.3 15.5 32.0 - 11.2 - 0.5 1.01985 100.0 11.3 24.8 20.4 25.3 6.3 2.6 7.4 1.1 0.91990 100.0 11.5 19.2 20.7 27.5 8.8 2.8 6.9 1.5 1.11995 100.0 11.6 14.1 18.7 22.9 12.1 3.4 6.2 10.2 0.81996 100.0 13.2 15.5 20.3 17.9 15.7 3.7 7.4 5.8 0.51997 100.0 13.0 15.5 20.0 15.7 15.7 3.7 9.6 6.2 0.61998 100.0 12.9 15.7 20.7 16.8 14.2 3.8 9.4 5.8 0.71999 100.0 13.6 14.0 20.9 17.1 13.7 4.4 8.8 6.9 0.62000 100.0 14.9 11.4 20.9 15.1 16.9 3.4 8.4 8.6 0.42001 100.0 14.5 10.9 18.9 17.6 17.5 4.8 7.7 7.6 0.52002 100.0 15.2 10.5 20.4 18.9 15.1 3.3 8.0 8.0 0.62003 100.0 15.0 10.7 20.9 18.1 15.7 4.1 7.8 7.2 0.52004 100.0 14.9 11.3 20.9 18.4 15.5 4.2 8.0 6.2 0.62005 100.0 14.9 10.8 20.6 18.8 15.6 4.4 8.4 5.8 0.72006 100.0 15.6 10.6 21.9 15.4 16.7 4.0 8.9 6.2 0.72007 100.0 15.0 11.2 21.5 16.7 16.3 3.8 8.8 6.1 0.62008 100.0 15.0 11.2 21.1 18.4 15.7 3.5 8.6 5.7 0.82009 100.0 13.4 11.1 21.8 22.5 14.5 3.4 7.7 4.8 0.82010 100.0 14.4 11.2 21.6 20.1 16.2 3.5 7.8 4.7 0.52011 100.0 14.4 11.1 22.5 18.1 17.1 3.4 8.2 4.6 0.62012 100.0 14.5 11.3 22.2 15.1 20.2 3.2 8.2 4.7 0.62013 100.0 14.3 11.0 22.5 14.8 20.1 3.9 7.9 4.8 0.72014 100.0 14.4 11.0 23.4 15.1 19.5 3.2 8.1 4.7 0.62015 100.0 14.5 11.5 24.0 13.3 20.1 3.1 8.3 4.6 0.62016 100.0 14.0 11.5 24.2 14.4 20.0 3.3 7.6 4.4 0.62017 100.0 13.8 11.0 24.9 14.0 20.3 4.5 7.1 3.9 0.52018 100.0 14.1 10.8 23.7 15.9 20.7 3.8 6.7 3.7 0.6
II. Percentage (%)
CommunityDevelopment &Environmental
Protection
Social Welfare
9-3b. Net Government Expenditures of All Levels by Administrative Affair (Continued)
Period(1) Total National
DefenseEconomic
Development
Retirementand
Condolence
Obligation(2) Others
GeneralAdminis-
tration
Education,Science &
Culture
180

FY 1955 - 6,414 -1960 - 12,080 -1965 108,650 22,387 20.6 1970 214,759 47,226 22.0 1975 566,688 123,558 21.8 1980 1,363,545 340,363 25.0 1985 2,476,902 546,338 22.1 1990 4,267,101 1,097,518 25.7 1995 7,058,829 1,910,066 27.1 1996 7,723,799 1,843,786 23.9 1997 8,331,981 1,878,764 22.5 1998 9,095,135 1,992,593 21.9 1999 9,628,012 2,050,004 21.3 2000 15,342,421 3,140,936 20.5 2001 10,158,209 2,271,755 22.4 2002 10,680,883 2,144,994 20.1 2003 10,965,866 2,216,514 20.2 2004 11,649,645 2,245,047 19.3 2005 12,092,254 2,291,999 19.0 2006 12,640,803 2,214,226 17.5 2007 13,407,062 2,290,169 17.1 2008 13,150,950 2,343,585 17.8 2009 12,961,656 2,670,898 20.6 2010 14,119,213 2,566,804 18.2 2011 14,312,200 2,612,947 18.3 2012 14,686,917 2,677,984 18.2 2013 15,230,739 2,665,241 17.5 2014 16,111,867 2,645,712 16.4 2015 16,770,671 2,645,189 15.8 2016 17,176,300 2,745,305 16.0 2017 17,501,181 2,778,361 15.9 2018 17,793,139 2,844,538 16.0
(1) See (1) of Table 9-1a.Source: See Table 9-1a.
9-4. Net Government Expenditures of All Levels as a Percentage of GDPUnit: NT$ million
Period(1)
Percentage (%)(B/A x 100)
Gross Domestic Product(A)
Net Government Expenditureof All Levels (B)
181
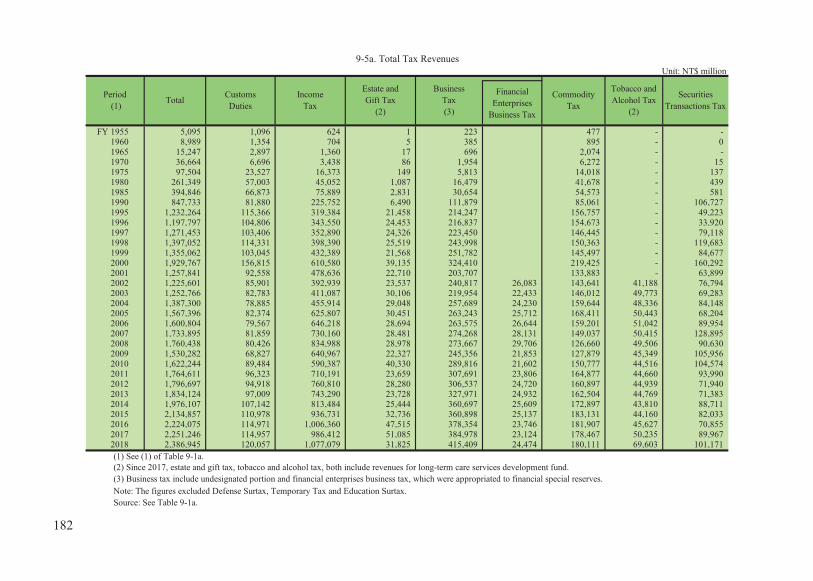
Unit: NT$ million
FinancialEnterprises
Business Tax
FY 1955 5,095 1,096 624 1 223 477 - - 1960 8,989 1,354 704 5 385 895 - 0 1965 15,247 2,897 1,360 17 696 2,074 - - 1970 36,664 6,696 3,438 86 1,954 6,272 - 15 1975 97,504 23,527 16,373 149 5,813 14,018 - 137 1980 261,349 57,003 45,052 1,087 16,479 41,678 - 439 1985 394,846 66,873 75,889 2,831 30,654 54,573 - 581 1990 847,733 81,880 225,752 6,490 111,879 85,061 - 106,727 1995 1,232,264 115,366 319,384 21,458 214,247 156,757 - 49,223 1996 1,197,797 104,806 343,550 24,453 216,837 154,673 - 33,920 1997 1,271,453 103,406 352,890 24,326 223,450 146,445 - 79,118 1998 1,397,052 114,331 398,390 25,519 243,998 150,363 - 119,683 1999 1,355,062 103,045 432,389 21,568 251,782 145,497 - 84,677 2000 1,929,767 156,815 610,580 39,135 324,410 219,425 - 160,292 2001 1,257,841 92,558 478,636 22,710 203,707 133,883 - 63,899 2002 1,225,601 85,901 392,939 23,537 240,817 26,083 143,641 41,188 76,794 2003 1,252,766 82,783 411,087 30,106 219,954 22,433 146,012 49,773 69,283 2004 1,387,300 78,885 455,914 29,048 257,689 24,230 159,644 48,336 84,148 2005 1,567,396 82,374 625,807 30,451 263,243 25,712 168,411 50,443 68,204 2006 1,600,804 79,567 646,218 28,694 263,575 26,644 159,201 51,042 89,954 2007 1,733,895 81,859 730,160 28,481 274,268 28,131 149,037 50,415 128,895 2008 1,760,438 80,426 834,988 28,978 273,667 29,706 126,660 49,506 90,630 2009 1,530,282 68,827 640,967 22,327 245,356 21,853 127,879 45,349 105,956 2010 1,622,244 89,484 590,387 40,330 289,816 21,602 150,777 44,516 104,574 2011 1,764,611 96,323 710,191 23,659 307,691 23,806 164,877 44,660 93,990 2012 1,796,697 94,918 760,810 28,280 306,537 24,720 160,897 44,939 71,940 2013 1,834,124 97,009 743,290 23,728 327,971 24,932 162,504 44,769 71,383 2014 1,976,107 107,142 813,484 25,444 360,697 25,609 172,897 43,810 88,711 2015 2,134,857 110,978 936,731 32,736 360,898 25,137 183,131 44,160 82,033 2016 2,224,075 114,971 1,006,360 47,515 378,354 23,746 181,907 45,627 70,855 2017 2,251,246 114,957 986,412 51,085 384,978 23,124 178,467 50,235 89,967 2018 2,386,945 120,057 1,077,079 31,825 415,409 24,474 180,111 69,603 101,171 (1) See (1) of Table 9-1a.
Note: The figures excluded Defense Surtax, Temporary Tax and Education Surtax.Source: See Table 9-1a.
Tobacco andAlcohol Tax
(2)
SecuritiesTransactions Tax
(2) Since 2017, estate and gift tax, tobacco and alcohol tax, both include revenues for long-term care services development fund. (3) Business tax include undesignated portion and financial enterprises business tax, which were appropriated to financial special reserves.
9-5a. Total Tax Revenues
Period (1) Total Customs
DutiesIncome
Tax
Estate andGift Tax
(2)
BusinessTax(3)
CommodityTax
182

9-5b. Total Tax Revenues (Continued)Unit: NT$ million
FY 1955 - 315 147 53 68 1,170 921 - - 1960 - 440 168 77 51 3,024 1,886 - - 1965 - 872 336 155 142 3,423 3,273 - - 1970 - 3,038 1,235 347 451 7,124 6,007 - - 1975 - 6,234 2,896 1,330 1,191 12,720 13,115 - - 1980 - 26,999 6,822 4,586 3,477 33,566 24,162 - - 1985 - 46,094 16,807 8,076 4,934 45,796 41,738 - - 1990 - 105,556 24,505 16,482 8,394 22,087 52,921 - - 1995 - 193,615 35,871 30,446 17,616 16,872 61,408 - - 1996 - 158,134 38,850 36,367 17,153 13,093 55,959 - - 1997 - 174,783 41,594 39,070 15,506 12,684 58,179 - - 1998 - 173,803 43,800 41,996 14,347 13,374 57,448 - - 1999 1,204 148,313 45,661 43,216 13,097 9,290 55,322 - - 2000 2,484 215,533 48,436 46,689 15,267 13,386 77,316 - - 2001 1,862 93,182 48,056 44,688 8,493 8,603 57,563 - - 2002 2,864 98,069 46,464 45,886 10,262 8,594 346 8,298 - 2003 4,806 111,803 48,013 47,765 11,600 9,565 - 10,217 - 2004 8,272 133,893 49,323 49,904 12,937 9,645 - 9,661 - 2005 6,342 135,370 50,877 51,863 13,178 10,447 - 10,387 - 2006 4,072 131,208 52,494 52,548 14,014 10,708 - 17,508 - 2007 5,758 133,691 53,883 53,271 13,637 10,652 - 19,888 - 2008 6,692 116,082 55,343 53,255 12,696 11,400 - 20,115 - 2009 3,750 112,367 56,347 53,050 13,066 10,130 - 24,911 - 2010 4,556 136,357 58,203 54,052 13,815 10,581 - 34,795 - 2011 5,860 141,982 59,467 55,380 12,640 11,075 - 34,609 2,206 2012 4,298 143,849 61,796 56,534 11,693 11,578 - 34,352 4,275 2013 2,669 174,081 63,013 57,759 13,560 12,012 - 35,057 5,318 2014 2,862 173,175 64,673 59,326 12,535 13,061 - 32,889 5,401 2015 3,783 184,598 69,422 61,679 13,827 13,592 - 33,097 4,192 2016 3,706 177,274 72,963 63,016 11,376 12,963 - 34,363 2,826 2017 4,190 188,638 76,724 64,077 12,789 14,232 - 32,178 2,317 2018 6,100 182,437 78,588 64,830 13,366 15,710 - 28,186 2,474
FuturesTransactions
Tax
Tobacco &Wine
Monopoly Revenue
Health andWelfare
Surchargeon Tobacco
SpecificallySelected Goods
and ServicesTax
Period(1)
LandTax
HouseTax
VechicleLicense
Tax
DeedTax
OtherTax
183

Unit: %
FinancialEnterprises
Business TaxFY 1955 100.0 21.5 12.2 0.0 4.4 - 9.4 - -
1960 100.0 15.1 7.8 0.1 4.3 - 10.0 - 0.01965 100.0 19.0 8.9 0.1 4.6 - 13.6 - - 1970 100.0 18.3 9.4 0.2 5.3 - 17.1 - 0.01975 100.0 24.1 16.8 0.2 6.0 - 14.4 - 0.11980 100.0 21.8 17.2 0.4 6.3 - 15.9 - 0.21985 100.0 16.9 19.2 0.7 7.8 - 13.8 - 0.11990 100.0 9.7 26.6 0.8 13.2 - 10.0 - 12.61995 100.0 9.4 25.9 1.7 17.4 - 12.7 - 4.01996 100.0 8.7 28.7 2.0 18.1 - 12.9 - 2.81997 100.0 8.1 27.8 1.9 17.6 - 11.5 - 6.21998 100.0 8.2 28.5 1.8 17.5 - 10.8 - 8.61999 100.0 7.6 31.9 1.6 18.6 - 10.7 - 6.22000 100.0 8.1 31.6 2.0 16.8 - 11.4 - 8.32001 100.0 7.4 38.1 1.8 16.2 - 10.6 - 5.12002 100.0 7.0 32.1 1.9 19.6 2.1 11.7 3.4 6.32003 100.0 6.6 32.8 2.4 17.6 1.8 11.7 4.0 5.52004 100.0 5.7 32.9 2.1 18.6 1.7 11.5 3.5 6.12005 100.0 5.3 39.9 1.9 16.8 1.6 10.7 3.2 4.42006 100.0 5.0 40.4 1.8 16.5 1.7 9.9 3.2 5.62007 100.0 4.7 42.1 1.6 15.8 1.6 8.6 2.9 7.42008 100.0 4.6 47.4 1.6 15.5 1.7 7.2 2.8 5.12009 100.0 4.5 41.9 1.5 16.0 1.4 8.4 3.0 6.92010 100.0 5.5 36.4 2.5 17.9 1.3 9.3 2.7 6.42011 100.0 5.5 40.2 1.3 17.4 1.3 9.3 2.5 5.32012 100.0 5.3 42.3 1.6 17.1 1.4 9.0 2.5 4.02013 100.0 5.3 40.5 1.3 17.9 1.4 8.9 2.4 3.92014 100.0 5.4 41.2 1.3 18.3 1.3 8.7 2.2 4.52015 100.0 5.2 43.9 1.5 16.9 1.2 8.6 2.1 3.82016 100.0 5.2 45.2 2.1 17.0 1.1 8.2 2.1 3.22017 100.0 5.1 43.8 2.3 17.1 1.0 7.9 2.2 4.02018 100.0 5.0 45.1 1.3 17.4 1.0 7.5 2.9 4.2
(1) See (1) of Table 9-1a. (2) See (2) of Table 9-5a. (3) See (3) of Table 9-5a.Note: See Table 9-5a.Source: See Table 9-1a.
9-6a. Structure of Total Tax Revenues
SecuritiesTransactions
Tax
Period (1) Total Customs
Duties
Tobacco andAlcohol Tax
(2)
IncomeTax
Estate andGift Tax
(2)
BusinessTax(3)
CommodityTax
184

Unit: %
FY 1955 - 6.2 2.9 1.0 1.3 23.0 18.1 - - 1960 - 4.9 1.9 0.9 0.6 33.6 21.0 - - 1965 - 5.7 2.2 1.0 0.9 22.4 21.5 - - 1970 - 8.3 3.4 0.9 1.2 19.4 16.4 - - 1975 - 6.4 3.0 1.4 1.2 13.0 13.5 - - 1980 - 10.3 2.6 1.8 1.3 12.8 9.2 - - 1985 - 11.7 4.3 2.0 1.2 11.6 10.6 - - 1990 - 12.5 2.9 1.9 1.0 2.6 6.2 - - 1995 - 15.7 2.9 2.5 1.4 1.4 5.0 - - 1996 - 13.2 3.2 3.0 1.4 1.1 4.7 - - 1997 - 13.7 3.3 3.1 1.2 1.0 4.6 - - 1998 - 12.4 3.1 3.0 1.0 1.0 4.1 - - 1999 0.1 10.9 3.4 3.2 1.0 0.7 4.1 - - 2000 0.1 11.2 2.5 2.4 0.8 0.7 4.0 - - 2001 0.1 7.4 3.8 3.6 0.7 0.7 4.6 - - 2002 0.2 8.0 3.8 3.7 0.8 0.7 0.0 0.7 - 2003 0.4 8.9 3.8 3.8 0.9 0.8 - 0.8 - 2004 0.6 9.7 3.6 3.6 0.9 0.7 - 0.7 - 2005 0.4 8.6 3.2 3.3 0.8 0.7 - 0.7 - 2006 0.3 8.2 3.3 3.3 0.9 0.7 - 1.1 - 2007 0.3 7.7 3.1 3.1 0.8 0.6 - 1.1 - 2008 0.4 6.6 3.1 3.0 0.7 0.6 - 1.1 - 2009 0.2 7.3 3.7 3.5 0.9 0.7 - 1.6 - 2010 0.3 8.4 3.6 3.3 0.9 0.7 - 2.1 - 2011 0.3 8.0 3.4 3.1 0.7 0.6 - 2.0 0.1 2012 0.2 8.0 3.4 3.1 0.7 0.6 - 1.9 0.2 2013 0.1 9.5 3.4 3.1 0.7 0.7 - 1.9 0.3 2014 0.1 8.8 3.3 3.0 0.6 0.7 - 1.7 0.3 2015 0.2 8.6 3.3 2.9 0.6 0.6 - 1.6 0.2 2016 0.2 8.0 3.3 2.8 0.5 0.6 - 1.5 0.1 2017 0.2 8.4 3.4 2.8 0.6 0.6 - 1.4 0.1 2018 0.3 7.6 3.3 2.7 0.6 0.7 - 1.2 0.1
OtherTax
Tobacco &Wine
Monopoly Revenue
Health andWelfare
Surchargeon Tobacco
FuturesTransactions
Tax
9-6b. Structure of Total Tax Revenues (Continued)
SpecificallySelected Goods
and ServicesTax
Period(1)
LandTax
HouseTax
VechicleLicense
Tax
DeedTax
185

Amount % Amount % Amount %FY 1955 5,095 100.0 1,427 28.0 3,668 72.0
1960 8,989 100.0 2,132 23.7 6,857 76.3 1965 15,247 100.0 3,362 22.1 11,885 77.9 1970 36,664 100.0 8,662 23.6 28,002 76.4 1975 97,504 100.0 27,692 28.4 69,812 71.6 1980 261,349 100.0 85,535 32.7 175,814 67.3 1985 394,846 100.0 150,164 38.0 244,682 62.0 1990 847,733 100.0 481,862 56.8 365,871 43.2 1995 1,232,264 100.0 645,722 52.4 586,542 47.6 1996 1,197,797 100.0 620,387 51.8 577,410 48.2 1997 1,271,453 100.0 692,493 54.5 578,960 45.5 1998 1,397,052 100.0 780,054 55.8 616,998 44.2 1999 1,355,062 100.0 747,112 55.1 607,950 44.9 2000 1,929,767 100.0 1,091,822 56.6 837,946 43.4 2001 1,257,841 100.0 716,872 57.0 540,969 43.0 2002 1,225,601 100.0 650,962 53.1 574,639 46.9 2003 1,252,766 100.0 686,725 54.8 566,041 45.2 2004 1,387,300 100.0 773,547 55.8 613,753 44.2 2005 1,567,396 100.0 930,238 59.3 637,159 40.7 2006 1,600,804 100.0 966,661 60.4 634,143 39.6 2007 1,733,895 100.0 1,094,508 63.1 639,386 36.9 2008 1,760,438 100.0 1,145,415 65.1 615,023 34.9 2009 1,530,282 100.0 954,779 62.4 575,503 37.6 2010 1,622,244 100.0 948,214 58.5 674,030 41.5 2011 1,764,611 100.0 1,047,790 59.4 716,820 40.6 2012 1,796,697 100.0 1,082,668 60.3 714,029 39.7 2013 1,834,124 100.0 1,091,726 59.5 742,398 40.5 2014 1,976,107 100.0 1,180,883 59.8 795,224 40.2 2015 2,134,857 100.0 1,323,137 62.0 811,720 38.0 2016 2,224,075 100.0 1,390,047 62.5 834,028 37.5 2017 2,251,246 100.0 1,409,806 62.6 841,440 37.4 2018 2,386,945 100.0 1,490,565 62.4 896,380 37.6
(1) See (1) of Table 9-1a.(2) Including Income Tax, Mining Concession Tax, Estate and Gift Tax, Securities Transactions Tax, Futures Transactions Tax, Agricultural
Land Tax, Land Value Tax, Land Value Increment Tax, House Tax, Deed Tax and Education Surtax.Source: See Table 9-1a.
Amount unit: NT$ million9-7. Total Tax Revenues by Direct and Indirect Taxes
Period (1)
Total Direct Taxes (2) Indirect Taxes
186

AmountGrowth Rate
(%) % to GDP% to Net Gov.
Exp. of Alllevels (2)
Per Capita TaxBurden (NT$)
FY 1955 - 12,080 10,431 8,989 - - 74.4 862 1965 108,650 22,387 12,257 15,247 18.7 14.0 68.1 1,244 1970 214,759 47,226 14,335 36,664 11.9 17.1 77.6 2,558 1975 566,688 123,558 15,852 97,504 9.7 17.2 78.9 6,151 1980 1,363,545 340,363 17,479 261,349 18.5 19.2 76.8 14,952 1985 2,476,902 546,338 19,013 394,846 3.0 15.9 72.3 20,767 1990 4,267,101 1,097,518 20,107 847,733 25.1 19.9 77.2 42,161 1995 7,058,829 1,910,066 21,178 1,232,264 9.3 17.5 64.5 58,186 1996 7,723,799 1,843,786 21,357 1,197,797 -2.8 15.5 65.0 56,084 1997 8,331,981 1,878,764 21,525 1,271,453 6.1 15.3 67.7 59,069 1998 9,095,135 1,992,593 21,743 1,397,052 9.9 15.4 70.1 64,253 1999 9,628,012 2,050,004 21,929 1,355,062 -3.0 14.1 66.1 61,793 2000 15,342,421 3,140,936 22,092 1,929,767 42.4 12.6 61.4 87,351 2001 10,158,209 2,271,755 22,340 1,257,841 -34.8 12.4 55.4 56,304 2002 10,680,883 2,144,994 22,457 1,225,601 -2.6 11.5 55.5 54,575 2003 10,965,866 2,216,514 22,554 1,252,766 2.2 11.4 55.0 55,545 2004 11,649,645 2,245,047 22,640 1,387,300 10.7 11.9 60.3 61,277 2005 12,092,254 2,291,999 22,723 1,567,396 13.0 13.0 66.8 68,978 2006 12,640,803 2,214,226 22,815 1,600,804 2.1 12.7 70.3 70,165 2007 13,407,062 2,290,169 22,902 1,733,895 8.3 12.9 73.6 75,709 2008 13,150,950 2,343,585 22,994 1,760,438 1.5 13.4 73.0 76,561 2009 12,961,656 2,670,898 23,070 1,530,282 -13.1 11.8 55.5 66,332 2010 14,119,213 2,566,804 23,138 1,622,244 6.0 11.5 61.0 70,112 2011 14,312,200 2,612,947 23,180 1,764,611 8.8 12.3 65.2 76,126 2012 14,686,917 2,677,984 23,262 1,796,697 1.8 12.2 64.7 77,237 2013 15,230,739 2,665,241 23,344 1,834,124 2.1 12.0 66.4 78,569 2014 16,111,867 2,645,712 23,392 1,976,107 7.7 12.3 72.5 84,478 2015 16,770,671 2,645,189 23,462 2,134,857 8.0 12.7 78.5 90,992 2016 17,176,300 2,745,305 23,508 2,224,075 4.2 12.9 78.9 94,609 2017 17,501,181 2,778,361 23,552 2,251,246 1.2 12.9 78.7 95,586 2018 17,793,139 2,844,538 23,574 2,386,945 6.0 13.4 80.8 101,253
(1) See (1) of Table 9-1a.(2) This ratio excludes Financial Enterprises Business Tax & Health and Welfare Surcharge on Tobacco; from 2011 till 2013, tax revenues ratio
excludes the Specifically Selected Goods and Services Tax, starting from 2017, tax revenues ratio excludes revenues for long-term care services development fund.
Population(Mid of CurrentYear; Thousand
Persons)
9-8. Tax Revenues IndexUnit: NT$ million
Period (1)
Tax RevenuesGross Domestic
Product
Net GovernmentExpenditure of
All Levels
187

188

��������


1952 10.59 14.95 … … …1955 14.30 19.02 … … …1960 20.91 29.26 13.07 … …1965 23.26 32.38 14.71 … …1970 28.71 35.54 18.21 … …1975 47.00 60.87 32.36 … …1980 69.95 92.08 49.05 98.55 121.44 1985 82.52 95.67 59.44 100.04 128.49 1990 93.47 87.21 66.25 77.32 109.46 1995 107.55 94.63 79.67 84.75 117.75 1997 112.51 93.26 82.87 81.49 122.17 1998 116.18 93.81 84.26 82.09 128.98 1999 113.91 89.55 84.41 78.73 117.98 2000 112.88 91.17 85.47 82.36 116.95 2001 112.19 89.95 85.46 81.33 117.32 2002 111.73 89.99 85.29 81.66 115.57 2003 110.17 92.22 85.05 85.86 113.84 2004 109.89 98.71 86.42 93.21 115.68 2005 108.21 99.31 88.42 95.48 112.83 2006 107.10 104.91 88.95 103.89 115.65 2007 106.64 111.69 90.55 113.19 119.76 2008 103.87 117.44 93.74 123.19 117.20 2009 104.00 107.19 92.92 111.37 109.47 2010 102.40 113.04 93.82 119.21 111.68 2011 100.00 117.92 95.15 128.33 111.78 2012 100.54 116.55 96.99 126.69 109.97 2013 102.02 113.72 97.76 121.05 107.70 2014 103.75 113.08 98.93 118.52 107.81 2015 107.13 103.07 98.63 103.18 102.78 2016 108.08 100.00 100.00 100.00 100.00 2017 106.84 100.90 100.62 101.36 98.54 2018 105.74 104.56 101.98 107.57 99.97 Source:1. Directorate-General of Budget, Accounting and Statistics, Executive Yuan, R.O.C. (Taiwan), https://www.stat.gov.tw 2. See Table 3-1.
10-1. Price Indices
Period Wholesale Price Index(Base: 2016=100)
Consumer Price Index(Base: 2016=100)
Import Price Index(Base: 2016=100)
Export Price Index(Base: 2016=100)
GDP Deflator(Base: 2011=100)
189

Base: 2016=100Agriculture,
Forestry,Livestock &
FisheryProducts
1981 99.11 51.33 53.43 76.01 25.24 38.74 59.81 106.26 66.91 77.57 1985 95.67 48.40 53.13 58.44 21.34 41.05 53.37 103.45 63.08 77.88 1990 87.21 47.65 53.94 54.60 26.57 40.24 34.92 95.94 60.22 77.05 1995 94.63 60.28 62.01 72.91 41.75 53.54 31.12 103.80 69.73 74.89 1996 93.68 63.28 66.22 71.84 44.79 58.68 34.81 101.90 73.53 75.07 1997 93.26 56.42 62.18 52.24 44.02 56.74 39.16 101.88 69.56 75.97 1998 93.81 61.56 68.46 58.46 43.23 55.94 36.54 102.35 68.25 76.81 1999 89.55 64.89 62.89 72.62 48.98 64.20 41.89 96.34 66.40 76.29 2000 91.17 58.09 60.09 56.72 49.75 59.84 52.07 98.06 62.69 75.64 2001 89.95 55.42 60.38 52.03 52.74 52.32 51.84 96.85 64.75 77.03 2002 89.99 55.56 57.58 56.98 55.21 52.06 54.55 96.67 66.29 93.27 2003 92.22 59.78 61.16 64.44 61.16 53.88 62.50 98.33 67.35 93.93 2004 98.71 67.16 69.70 71.66 73.69 59.02 78.06 104.34 71.88 94.20 2005 99.31 67.56 71.56 71.14 76.90 57.35 99.73 103.28 71.88 95.11 2006 104.91 65.29 69.55 65.47 82.91 57.80 120.24 108.41 75.05 95.51 2007 111.69 71.31 79.09 70.16 96.02 57.95 136.06 114.71 81.82 95.78 2008 117.44 86.54 92.90 87.78 92.51 73.78 180.34 117.13 90.85 97.49 2009 107.19 80.82 81.30 84.84 82.53 76.08 134.55 108.00 88.66 98.49 2010 113.04 85.04 85.71 86.86 94.48 81.53 159.24 112.95 94.63 98.27 2011 117.92 95.24 95.97 92.57 94.74 95.88 200.52 115.54 100.33 98.58 2012 116.55 96.14 97.27 87.23 88.62 101.77 202.59 113.51 100.98 101.64 2013 113.72 90.88 91.20 89.39 95.79 91.57 194.34 110.75 101.47 102.49 2014 113.08 95.24 91.36 102.65 102.91 95.94 181.45 110.19 103.01 101.94 2015 103.07 93.66 90.41 99.56 101.69 94.55 114.81 102.58 99.87 100.27 2016 100.00 100.00 100.00 100.00 100.00 100.00 100.00 100.00 100.00 100.00 2017 100.90 95.68 91.95 98.11 103.22 101.77 122.24 100.20 99.79 98.25 2018 104.56 92.42 84.62 98.07 108.70 104.70 155.20 102.85 99.87 99.09
Source: See Table 10-1.
ForestProducts
FisheryProducts Foods Beverages
10-2a. Group Indices of Wholesale Prices
Poultry &LivestockProducts
Period GeneralIndex Farm
Products
Quarryingand Mineral
Products
Manu-facturingProducts
190

10-2b. Group Indices of Wholesale Prices (Continued)
1981 43.89 79.76 71.17 44.59 54.38 72.03 89.85 83.54 78.34 102.93 1985 43.89 76.11 80.34 48.50 49.83 72.61 83.47 76.95 79.85 100.29 1990 43.89 71.78 75.28 54.80 53.99 78.32 53.91 68.02 73.86 100.14 1995 43.59 81.61 81.72 61.85 65.57 101.86 53.66 84.68 79.76 104.86 1996 44.27 80.21 85.59 62.57 67.41 91.14 55.01 75.27 79.86 107.35 1997 45.37 84.27 89.39 66.27 70.73 89.82 59.57 73.83 82.38 104.35 1998 45.74 85.38 100.50 71.97 71.68 88.35 55.41 71.43 85.27 110.66 1999 45.74 80.03 97.46 68.41 72.75 88.17 55.13 68.40 82.78 104.29 2000 45.74 81.71 95.28 68.19 70.75 93.79 73.20 77.39 80.53 100.26 2001 45.74 81.83 96.92 74.72 73.92 85.12 73.56 74.60 80.28 99.68 2002 60.14 80.70 93.86 72.53 74.61 84.37 73.48 75.32 81.17 98.89 2003 60.55 82.28 92.27 73.33 76.28 87.11 81.93 82.93 82.64 100.51 2004 61.66 84.05 89.65 74.84 80.06 89.74 93.15 98.32 86.06 111.70 2005 61.25 83.49 86.64 74.92 78.59 87.89 108.30 102.50 86.66 111.95 2006 66.66 84.70 87.00 77.16 81.19 89.19 128.74 109.44 88.89 115.10 2007 68.62 87.95 87.26 81.12 85.69 94.62 144.45 118.95 91.96 121.58 2008 68.32 89.90 84.40 80.84 88.94 103.45 174.44 124.37 97.87 130.23 2009 74.31 90.58 87.21 80.43 86.40 95.08 130.28 107.32 100.25 129.08 2010 78.42 95.81 85.17 84.93 92.96 107.62 154.05 123.48 101.61 123.06 2011 80.84 105.56 88.05 86.59 93.63 107.34 182.66 135.72 104.62 119.52 2012 87.40 103.47 92.69 89.70 94.11 102.23 192.24 128.41 104.69 116.90 2013 89.97 102.72 93.53 93.37 98.54 100.61 189.22 126.16 101.70 107.01 2014 95.19 102.97 96.33 100.93 101.89 100.83 182.25 123.85 100.57 105.03 2015 97.35 101.83 101.31 99.69 102.01 101.20 119.31 104.95 99.57 99.18 2016 100.00 100.00 100.00 100.00 100.00 100.00 100.00 100.00 100.00 100.00 2017 112.43 97.51 95.12 99.16 96.76 102.05 114.40 105.41 97.24 94.44 2018 121.28 99.19 94.81 98.62 99.65 106.58 139.09 112.53 98.76 94.95
PeriodTobacco Textile
Products
Non-metallicMineralProducts
ChemicalProducts &
MedicalGoods
Rubber&
PlasticProducts
WearingApparel &Clothing
Accessories
Leather, Fur& RelatedProducts
Wood &BambooProducts
Pulp, Paper,Paper Products
& PrintedMatter
Petroleum&
CoalProducts
191

1981 68.15 66.70 332.14 … … 77.61 69.49 59.57 71.80 99.10 1985 62.01 67.08 331.40 … … 77.69 72.33 59.37 70.58 96.21 1990 60.51 68.19 275.46 - - 81.95 80.59 64.00 59.88 75.13 1995 63.95 70.28 265.44 296.61 88.39 92.23 90.31 69.36 75.40 75.04 1996 59.72 70.88 262.76 293.83 86.42 88.74 89.39 70.02 79.19 75.05 1997 60.82 70.81 252.64 282.62 85.70 87.21 88.55 72.17 82.21 75.96 1998 60.34 74.13 238.03 274.60 87.84 95.40 92.46 80.63 89.84 76.27 1999 55.08 69.45 206.46 238.08 81.86 94.51 92.38 77.36 85.24 75.47 2000 57.67 70.66 205.43 220.19 79.07 92.14 92.27 74.58 83.54 77.04 2001 55.19 71.75 191.56 217.16 80.11 92.72 91.84 77.92 85.46 77.14 2002 59.26 73.55 177.77 208.48 79.07 91.82 90.72 78.98 85.27 76.83 2003 69.72 78.61 162.21 197.41 78.37 93.14 92.11 80.01 84.41 77.58 2004 94.64 91.38 156.85 181.48 81.25 93.86 92.59 83.37 85.34 78.22 2005 98.48 93.28 140.81 162.55 82.98 91.40 90.68 84.30 84.20 79.10 2006 118.36 95.99 136.77 155.35 95.32 91.69 90.21 85.42 86.64 82.95 2007 144.25 106.03 130.79 149.29 100.30 93.20 91.37 86.94 88.14 86.71 2008 159.40 114.09 115.96 135.91 101.72 96.92 93.75 91.27 86.68 94.12 2009 116.38 102.14 114.61 135.47 98.00 102.79 97.76 93.08 89.00 102.49 2010 140.63 106.86 109.34 125.45 103.20 101.55 97.40 91.41 88.76 105.70 2011 147.07 108.39 101.43 118.13 105.46 102.82 98.76 92.36 91.09 106.58 2012 132.71 104.25 101.23 118.20 104.27 104.12 99.88 94.32 92.89 113.76 2013 123.26 102.62 99.90 113.45 101.99 99.12 99.03 94.45 96.43 121.72 2014 122.99 104.22 101.18 107.74 101.81 98.83 99.34 96.73 98.48 128.94 2015 105.64 101.72 101.32 103.36 100.61 97.83 99.34 100.45 99.76 113.45 2016 100.00 100.00 100.00 100.00 100.00 100.00 100.00 100.00 100.00 100.00 2017 112.60 101.41 96.16 96.09 98.58 95.54 97.38 97.13 96.98 99.35 2018 120.59 103.87 95.31 92.14 99.52 96.28 97.76 98.63 98.70 102.68
TransportEquipmentand Parts
BasicMetals
Computer,Electronic& OpticalProducts
ElectricalEquipment
10-2c. Group Indices of Wholesale Prices (Continued)
WaterSupply,
Electricity &Gas
Furniture& Fixtures
MiscellaneousProducts
FabricatedMetal
Products
ElectronicParts &
Components
Machineryand
Equipment
Period
192

Base: 2016=100Agriculture,
Forestry,Livestock &
FisheryProducts
1985 97.40 94.72 96.93 85.78 86.36 101.81 99.39 97.55 94.33 99.99 1990 99.40 94.10 103.89 75.60 97.33 98.15 118.57 99.35 97.19 99.68 1995 107.38 105.00 105.12 108.46 96.85 101.73 111.66 107.68 106.88 99.32 1996 99.00 104.98 106.79 98.53 107.28 109.60 111.86 98.17 105.45 100.24 1997 99.55 89.16 93.90 72.72 98.28 96.69 112.50 99.98 94.60 101.20 1998 100.59 109.11 110.10 111.91 98.21 98.59 93.31 100.46 98.12 101.11 1999 95.46 105.41 91.86 124.22 113.30 114.77 114.64 94.13 97.29 99.32 2000 101.81 89.52 95.55 78.11 101.57 93.21 124.30 101.79 94.41 99.15 2001 98.66 95.40 100.48 91.73 106.01 87.43 99.56 98.77 103.29 101.84 2002 100.04 100.25 95.36 109.51 104.68 99.50 105.23 99.81 102.38 121.08 2003 102.48 107.60 106.22 113.09 110.78 103.50 114.57 101.72 101.60 100.71 2004 107.04 112.35 113.96 111.20 120.49 109.54 124.90 106.11 106.73 100.29 2005 100.61 100.60 102.67 99.27 104.36 97.17 127.76 98.98 100.00 100.97 2006 105.64 96.64 97.19 92.03 107.82 100.78 120.57 104.97 104.41 100.42 2007 106.46 109.22 113.72 107.16 115.81 100.26 113.16 105.81 109.02 100.28 2008 105.15 121.36 117.46 125.11 96.34 127.32 132.54 102.11 111.04 101.79 2009 91.27 93.39 87.51 96.65 89.21 103.12 74.61 92.21 97.59 101.03 2010 105.46 105.22 105.42 102.38 114.48 107.16 118.35 104.58 106.73 99.78 2011 104.32 111.99 111.97 106.57 100.28 117.60 125.92 102.29 106.02 100.32 2012 98.84 100.94 101.35 94.23 93.54 106.14 101.03 98.24 100.65 103.10 2013 97.57 94.53 93.76 102.48 108.09 89.98 95.93 97.57 100.49 100.84 2014 99.44 104.80 100.18 114.83 107.43 104.77 93.37 99.49 101.52 99.46 2015 91.15 98.34 98.96 96.99 98.81 98.55 63.27 93.09 96.95 98.36 2016 97.02 106.77 110.61 100.44 98.34 105.76 87.10 97.48 100.13 99.73 2017 100.90 95.68 91.95 98.11 103.22 101.77 122.24 100.20 99.79 98.25 2018 103.63 92.42 92.03 99.96 108.70 102.88 126.96 102.85 100.08 100.85
Source: See Table 10-1.
FisheryProducts
Period GeneralIndex
Quarryingand Mineral
Products
10-3a. Group Link Indices of Wholesale Prices
Foods Beverages
Manu-facturingProducts
FarmProducts
Poultry &LivestockProducts
ForestProducts
193

10-3b. Group Link Indices of Wholesale Prices (Continued)
1985 100.00 93.70 101.52 94.60 93.81 94.94 98.73 96.03 99.38 98.11 1990 100.00 101.18 102.95 104.90 105.20 97.94 107.39 94.04 99.97 99.62 1995 100.46 108.22 106.84 107.38 104.03 119.27 105.48 120.97 109.35 99.83 1996 101.56 98.28 104.74 101.16 102.81 89.48 102.52 88.89 100.13 102.37 1997 102.48 105.06 104.44 105.91 104.93 98.55 108.29 98.09 103.16 97.21 1998 100.82 101.32 112.43 108.60 101.34 98.36 93.02 96.75 103.51 106.05 1999 100.00 93.73 96.98 95.05 101.49 99.80 99.49 95.76 97.08 94.24 2000 100.00 102.10 97.76 99.68 97.25 106.37 132.78 113.14 97.28 96.14 2001 100.00 100.15 101.72 109.58 104.48 90.76 100.49 96.39 99.69 99.42 2002 131.48 98.62 96.84 97.07 100.93 99.12 99.89 100.97 101.11 99.21 2003 100.68 101.96 98.31 101.10 102.24 103.25 111.50 110.10 101.81 101.64 2004 101.83 102.15 97.16 102.06 104.96 103.02 113.69 118.56 104.14 111.13 2005 99.34 99.33 96.64 100.11 98.16 97.94 116.26 104.25 100.70 100.22 2006 108.83 101.45 100.42 102.99 103.31 101.48 118.87 106.77 102.57 102.81 2007 102.94 103.84 100.30 105.13 105.54 106.09 112.20 108.69 103.45 105.63 2008 99.56 102.22 96.72 99.65 103.79 109.33 120.76 104.56 106.43 107.11 2009 108.77 100.76 103.33 99.49 97.14 91.91 74.68 86.29 102.43 99.12 2010 105.53 105.77 97.66 105.59 107.59 113.19 118.25 115.06 101.36 95.34 2011 103.09 110.18 103.38 101.95 100.72 99.74 118.57 109.91 102.96 97.12 2012 108.11 98.02 105.27 103.59 100.51 95.24 105.24 94.61 100.07 97.81 2013 102.94 99.28 100.91 104.09 104.71 98.42 98.43 98.25 97.14 91.54 2014 105.80 100.24 102.99 108.10 103.40 100.22 96.32 98.17 98.89 98.15 2015 102.27 98.89 105.17 98.77 100.12 100.37 65.47 84.74 99.01 94.43 2016 102.72 98.20 98.71 100.31 98.03 98.81 83.82 95.28 100.43 100.83 2017 112.43 97.51 95.12 99.16 96.76 102.05 114.40 105.41 97.24 94.44 2018 107.87 101.72 99.67 99.46 102.99 104.44 121.58 106.75 101.56 100.54
Non-metallicMineralProducts
ChemicalProducts &
MedicalGoods
Rubber &Plastic
Products
Period Tabacoo TextileProducts
WearingApparel &Clothing
Accessories
Leather,Fur &
RelatedProducts
Wood &BambooProducts
Pulp, Paper,Paper
Products &Printed Matter
Petroleum &Coal
Products
194

10-3c. Group Link Indices of Wholesale Prices (Continued)
1985 96.38 99.13 99.26 ���������������� ���������������� 100.21 100.19 99.20 99.79 98.31 1990 94.15 99.87 100.72 ���������������� ���������������� 102.57 100.65 104.42 101.22 99.97 1995 112.91 105.99 99.99 99.64 105.70 104.85 103.64 106.56 107.93 100.67 1996 93.39 100.85 98.99 99.06 97.77 96.22 98.98 100.95 105.03 100.01 1997 101.84 99.90 96.15 96.18 99.17 98.28 99.06 103.07 103.81 101.21 1998 99.21 104.69 94.22 97.16 102.50 109.39 104.42 111.72 109.28 100.41 1999 91.28 93.69 86.74 86.70 93.19 99.07 99.91 95.94 94.88 98.95 2000 104.70 101.74 99.50 92.49 96.59 97.49 99.88 96.41 98.01 102.08 2001 95.70 101.54 93.25 98.62 101.32 100.63 99.53 104.48 102.30 100.13 2002 107.37 102.51 92.80 96.00 98.70 99.03 98.78 101.36 99.78 99.60 2003 117.65 106.88 91.25 94.69 99.11 101.44 101.53 101.30 98.99 100.98 2004 135.74 116.24 96.70 91.93 103.67 100.77 100.52 104.20 101.10 100.82 2005 104.06 102.08 89.77 89.57 102.13 97.38 97.94 101.12 98.66 101.13 2006 120.19 102.91 97.13 95.57 114.87 100.32 99.48 101.33 102.90 104.87 2007 121.87 110.46 95.63 96.10 105.22 101.65 101.29 101.78 101.73 104.53 2008 110.50 107.60 88.66 91.04 101.42 103.99 102.60 104.98 98.34 108.55 2009 73.01 89.53 98.84 99.68 96.34 106.06 104.28 101.98 102.68 108.89 2010 120.84 104.62 95.40 92.60 105.31 98.79 99.63 98.21 99.73 103.13 2011 104.58 101.43 92.77 94.17 102.19 101.25 101.40 101.04 102.63 100.83 2012 90.24 96.18 99.80 100.06 98.87 101.26 101.13 102.12 101.98 106.74 2013 92.88 98.44 98.69 95.98 97.81 95.20 99.15 100.14 103.81 107.00 2014 99.78 101.56 101.28 94.97 99.82 99.71 100.31 102.41 102.13 105.93 2015 85.89 97.60 100.14 95.93 98.82 98.99 100.00 103.85 101.30 87.99 2016 94.66 98.31 98.70 96.75 99.39 102.22 100.66 99.55 100.24 88.14 2017 112.60 101.41 96.16 96.09 98.58 95.54 97.38 97.13 96.98 99.35 2018 107.10 102.43 99.12 95.89 100.95 100.77 100.39 101.54 101.77 103.35
Period
WaterSupply,
Electricity& Gas
BasicMetals
FabricatedMetal
Products
ElectronicParts &
Components
Machineryand
Equipment
Computer,Electronic &
OpticalProducts
ElectricalEquipment
Furnitureand Fixtures
Miscellane-ous
Products
TransportEquipmentand Parts
195
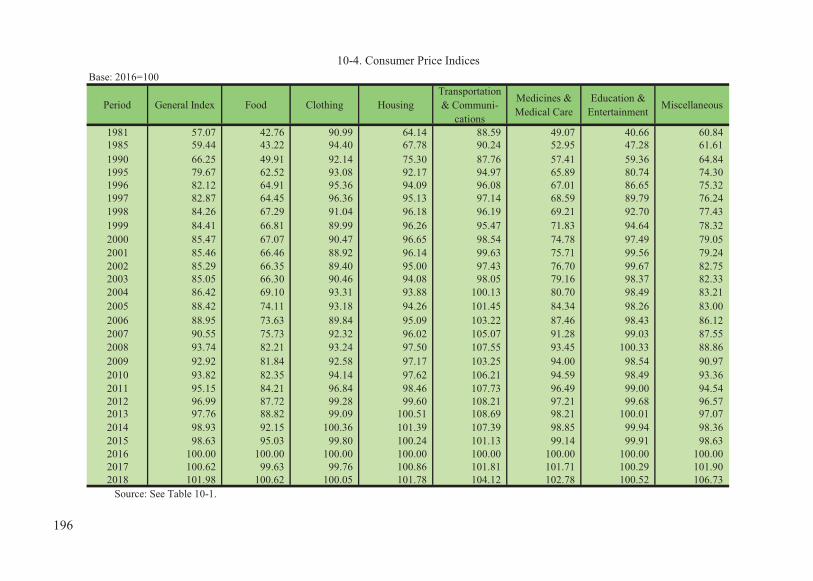
Base: 2016=100
Period General Index Food Clothing HousingTransportation& Communi-
cations
Medicines &Medical Care
Education &Entertainment
Miscellaneous
1981 57.07 42.76 90.99 64.14 88.59 49.07 40.66 60.84 1985 59.44 43.22 94.40 67.78 90.24 52.95 47.28 61.61 1990 66.25 49.91 92.14 75.30 87.76 57.41 59.36 64.84 1995 79.67 62.52 93.08 92.17 94.97 65.89 80.74 74.30 1996 82.12 64.91 95.36 94.09 96.08 67.01 86.65 75.32 1997 82.87 64.45 96.36 95.13 97.14 68.59 89.79 76.24 1998 84.26 67.29 91.04 96.18 96.19 69.21 92.70 77.43 1999 84.41 66.81 89.99 96.26 95.47 71.83 94.64 78.32 2000 85.47 67.07 90.47 96.65 98.54 74.78 97.49 79.05 2001 85.46 66.46 88.92 96.14 99.63 75.71 99.56 79.24 2002 85.29 66.35 89.40 95.00 97.43 76.70 99.67 82.75 2003 85.05 66.30 90.46 94.08 98.05 79.16 98.37 82.33 2004 86.42 69.10 93.31 93.88 100.13 80.70 98.49 83.21 2005 88.42 74.11 93.18 94.26 101.45 84.34 98.26 83.00 2006 88.95 73.63 89.84 95.09 103.22 87.46 98.43 86.12 2007 90.55 75.73 92.32 96.02 105.07 91.28 99.03 87.55 2008 93.74 82.21 93.24 97.50 107.55 93.45 100.33 88.86 2009 92.92 81.84 92.58 97.17 103.25 94.00 98.54 90.97 2010 93.82 82.35 94.14 97.62 106.21 94.59 98.49 93.36 2011 95.15 84.21 96.84 98.46 107.73 96.49 99.00 94.54 2012 96.99 87.72 99.28 99.60 108.21 97.21 99.68 96.57 2013 97.76 88.82 99.09 100.51 108.69 98.21 100.01 97.07 2014 98.93 92.15 100.36 101.39 107.39 98.85 99.94 98.36 2015 98.63 95.03 99.80 100.24 101.13 99.14 99.91 98.63 2016 100.00 100.00 100.00 100.00 100.00 100.00 100.00 100.00 2017 100.62 99.63 99.76 100.86 101.81 101.71 100.29 101.90 2018 101.98 100.62 100.05 101.78 104.12 102.78 100.52 106.73
Source: See Table 10-1.
10-4. Consumer Price Indices
196

Period General Index Food Clothing HousingTransportation& Communi-
cations
Medicines &Medical Care
Education &Entertainment Miscellaneous
1985 99.83 97.96 99.44 100.28 100.76 103.38 104.26 99.69 1990 104.12 103.55 100.16 105.64 102.45 103.16 107.67 102.51 1995 103.66 104.30 103.68 103.50 102.37 101.59 104.93 103.15 1996 103.08 103.82 102.45 102.08 101.17 101.70 107.32 101.37 1997 100.91 99.29 101.05 101.11 101.10 102.36 103.62 101.22 1998 101.68 104.41 94.48 101.10 99.02 100.90 103.24 101.56 1999 100.18 99.29 98.85 100.08 99.25 103.79 102.09 101.15 2000 101.26 100.39 100.53 100.41 103.22 104.11 103.01 100.93 2001 99.99 99.09 98.29 99.47 101.11 101.24 102.12 100.24 2002 99.80 99.83 100.54 98.81 97.79 101.31 100.11 104.43 2003 99.72 99.92 101.19 99.03 100.64 103.21 98.70 99.49 2004 101.61 104.22 103.15 99.79 102.12 101.95 100.12 101.07 2005 102.31 107.25 99.86 100.40 101.32 104.51 99.77 99.75 2006 100.60 99.35 96.42 100.88 101.74 103.70 100.17 103.76 2007 101.80 102.85 102.76 100.98 101.79 104.37 100.61 101.66 2008 103.52 108.56 101.00 101.54 102.36 102.38 101.31 101.50 2009 99.13 99.55 99.29 99.66 96.00 100.59 98.22 102.37 2010 100.97 100.62 101.69 100.46 102.87 100.63 99.95 102.63 2011 101.42 102.26 102.87 100.86 101.43 102.01 100.52 101.26 2012 101.93 104.17 102.52 101.16 100.45 100.75 100.69 102.15 2013 100.79 101.25 99.81 100.91 100.44 101.03 100.33 100.52 2014 101.20 103.75 101.28 100.88 98.80 100.65 99.93 101.33 2015 99.70 103.13 99.44 98.87 94.17 100.29 99.97 100.27 2016 101.39 105.23 100.20 99.76 98.88 100.87 100.09 101.39 2017 100.62 99.63 99.76 100.86 101.81 101.71 100.29 101.90 2018 101.35 100.99 100.29 100.91 102.27 101.05 100.23 104.74 Source: See Table 10-1.
10-5. Consumer Price Link Indices
197

Base: 2016=100
Period GeneralIndex
AnimalProducts
VegetableProducts
PreparedFoodstuffs,Beverages,Spirits &Tobacco
MineralProducts
Products ofThe
Chemical orAllied
Industries
Plastics,Rubber &ArticlesThereof
Leather &ArticlesThereof
Wood &Articles of
Wood
1981 106.24 51.47 73.89 50.83 … 83.66 72.02 43.80 49.47 1985 100.04 54.42 62.68 44.28 … 80.24 72.72 49.72 49.31 1990 77.32 45.42 50.08 38.77 … 68.71 60.58 49.93 43.96 1995 84.75 45.74 54.48 43.75 … 83.89 72.36 50.54 56.35 1996 82.64 44.71 66.18 48.82 … 75.57 71.52 49.61 58.85 1997 81.49 47.11 58.95 51.35 … 74.25 69.99 54.44 61.63 1998 82.09 49.73 59.36 60.13 34.83 72.94 71.13 58.47 63.12 1999 78.73 45.61 50.93 56.60 39.81 69.81 65.72 55.25 66.03 2000 82.36 46.70 48.56 53.81 53.98 81.63 68.53 57.75 64.43 2001 81.33 49.71 51.93 57.92 53.02 77.49 67.24 68.56 68.48 2002 81.66 49.40 55.40 61.22 55.65 78.90 67.42 66.46 69.08 2003 85.86 52.93 64.37 61.05 63.55 87.55 72.68 70.42 72.77 2004 93.21 57.69 75.41 62.87 80.16 99.71 82.79 73.09 79.51 2005 95.48 58.57 65.32 64.35 103.07 99.53 93.33 70.59 79.29 2006 103.89 66.16 67.78 71.50 123.75 106.38 95.22 73.65 82.06 2007 113.19 81.82 96.78 73.44 139.63 115.54 101.35 80.97 88.94 2008 123.19 76.90 124.38 74.06 186.58 121.04 109.99 78.16 90.17 2009 111.37 70.94 99.49 78.91 138.43 108.55 110.57 80.29 84.70 2010 119.21 81.86 106.70 85.98 165.16 117.75 120.99 90.61 93.38 2011 128.33 93.43 123.60 89.06 209.19 128.06 125.68 90.53 93.55 2012 126.69 91.09 124.88 92.16 211.89 124.11 118.77 92.07 93.04 2013 121.05 98.66 120.82 92.92 202.16 120.55 110.07 97.31 98.36 2014 118.52 102.68 117.34 96.91 189.87 118.46 106.89 110.65 102.55 2015 103.18 96.04 105.18 97.92 117.23 104.64 101.39 103.27 102.50 2016 100.00 100.00 100.00 100.00 100.00 100.00 100.00 100.00 100.00 2017 101.36 104.62 94.44 97.96 121.96 101.42 99.01 99.24 97.39 2018 107.57 105.97 94.56 96.95 154.41 103.83 102.85 96.98 102.06
Source: See Table 10-1.
10-6a. Import Price Indices
198

Period
Woodpulp,Paper &ArticlesThereof
Textiles &TextileArticles
StoneMaterials,Glass &
Glassware
Basic Metals &ArticlesThereof
Machinery,Electrical
Equipment, TVImage & SoundRecorders, Etc
TransportationEquipment
Optical, Measuring,Medical Instruments,Musical Instruments
& Parts Thereof
MiscellaneousManufactured
Articles
1981 … 92.38 … 53.98 … 62.88 … …1985 … 83.52 … 49.07 … 64.26 … …1990 … 74.83 … 50.02 … 60.48 … …1995 … 78.67 … 52.27 … 80.85 … …1996 … 72.69 … 49.01 … 75.17 … …1997 … 74.59 … 51.12 … 71.70 … …1998 78.08 79.91 194.16 52.92 157.75 76.07 122.54 91.17 1999 75.83 73.31 178.06 47.57 147.74 80.12 120.96 89.66 2000 84.91 72.02 171.44 49.80 140.30 84.60 119.32 86.42 2001 79.24 75.07 183.86 49.87 136.47 84.81 113.05 88.52 2002 78.57 77.18 148.74 51.88 131.50 81.76 113.92 89.23 2003 82.60 81.18 139.74 60.41 128.80 84.28 114.74 91.74 2004 89.64 81.01 158.57 80.84 125.34 86.77 112.66 91.24 2005 88.15 78.14 138.99 85.31 116.57 83.13 103.64 89.87 2006 93.03 79.17 134.71 114.14 114.05 81.53 101.71 90.33 2007 104.41 83.50 136.84 142.21 112.46 83.14 101.94 87.95 2008 108.88 83.86 145.59 150.33 106.69 88.47 100.22 94.42 2009 98.55 85.94 157.64 110.70 112.85 98.05 104.71 101.56 2010 113.71 95.92 159.29 135.26 107.78 100.03 102.89 99.53 2011 111.27 116.74 150.78 141.03 104.60 102.97 100.15 98.42 2012 101.88 103.57 138.07 127.23 105.88 104.18 100.83 100.06 2013 100.18 98.99 111.00 117.90 101.23 102.24 98.35 95.85 2014 102.40 99.62 103.01 118.46 100.00 102.33 99.35 95.56 2015 101.74 101.09 92.25 105.25 99.05 98.85 97.47 98.39 2016 100.00 100.00 100.00 100.00 100.00 100.00 100.00 100.00 2017 99.06 96.39 91.30 107.38 94.65 95.00 95.15 95.50 2018 108.60 98.25 90.00 113.23 94.60 96.39 95.21 97.02
10-6b. Import Price Indices (Continued)
199

Period GeneralIndex
AnimalProducts
VegetableProducts
PreparedFoodstuffs,Beverages,Spirits &Tobacco
MineralProducts
Products ofThe Chemical
or AlliedIndustries
Plastics,Rubber &ArticlesThereof
Leather &ArticlesThereof
Wood &Articles of
Wood
1982 98.88 105.63 87.24 92.13 … 97.53 101.90 97.90 104.65 1985 98.51 99.42 95.04 89.64 … 99.32 100.12 100.04 94.70 1990 102.36 99.21 95.90 105.38 … 94.89 99.18 103.50 102.30 1995 110.15 109.24 109.57 106.71 … 122.09 118.72 111.37 99.52 1996 97.51 97.75 121.48 111.59 … 90.08 98.84 98.16 104.44 1997 98.61 105.37 89.08 105.18 … 98.25 97.86 109.74 104.72 1998 100.74 105.56 100.70 117.10 … 98.24 101.63 107.40 102.42 1999 95.91 91.72 85.80 94.13 114.30 95.71 92.39 94.49 104.61 2000 104.61 102.39 95.35 95.07 135.59 116.93 104.28 104.52 97.58 2001 98.75 106.45 106.94 107.64 98.22 94.93 98.12 118.72 106.29 2002 100.41 99.38 106.68 105.70 104.96 101.82 100.27 96.94 100.88 2003 105.14 107.15 116.19 99.72 114.20 110.96 107.80 105.96 105.34 2004 108.56 108.99 117.15 102.98 126.14 113.89 113.91 103.79 109.26 2005 102.44 101.53 86.62 102.35 128.58 99.82 112.73 96.58 99.72 2006 108.81 112.96 103.77 111.11 120.06 106.88 102.03 104.33 103.49 2007 108.95 123.67 142.79 102.71 112.83 108.61 106.44 109.94 108.38 2008 108.83 93.99 128.52 100.84 133.62 104.76 108.52 96.53 101.38 2009 90.41 92.25 79.99 106.55 74.19 89.68 100.53 102.73 93.93 2010 107.04 115.39 107.25 108.96 119.31 108.48 109.42 112.85 110.25 2011 107.65 114.13 115.84 103.58 126.66 108.76 103.88 99.91 100.18 2012 98.72 97.50 101.04 103.48 101.29 96.92 94.50 101.70 99.45 2013 95.55 108.31 96.75 100.82 95.41 97.13 92.67 105.69 105.72 2014 97.91 104.07 97.12 104.29 93.92 98.27 97.11 113.71 104.26 2015 87.06 93.53 89.64 101.04 61.74 88.33 94.85 93.33 99.95 2016 96.92 104.12 95.08 102.12 85.30 95.57 98.63 96.83 97.56 2017 101.36 104.62 94.44 97.96 121.96 101.42 99.01 99.24 97.39 2018 106.13 101.29 100.13 98.97 126.61 102.38 103.88 97.72 104.80
Source: See Table 10-1.
10-7a. Import Price Link Indices
200

Period
Woodpulp,Paper &ArticlesThereof
Textiles &TextileArticles
StoneMaterials,Glass &
Glassware
Base Metals &Articles of Base
Metal
Machinery,Electrical
Equipment, TVImage & SoundRecorders, Etc
TransportationEquipment
Optical,Measuring,
MedicalInstruments,
MusicalInstruments &Parts Thereof
MiscellaneousManufactured
Articles
1982 … 96.56 … 90.83 … 101.36 … …1985 … 93.79 … 98.44 … 98.69 … …1990 … 101.24 … 95.32 … 107.07 … …1995 … 113.21 … 116.14 … 106.24 … …1996 … 92.40 … 93.77 … 92.97 … …1997 … 102.61 … 104.32 … 95.38 … …1998 … 107.13 … 103.50 … 106.09 … …1999 97.12 91.74 91.71 89.89 93.65 105.32 98.71 98.34 2000 111.97 98.24 96.28 104.69 94.96 105.59 98.64 96.39 2001 93.32 104.23 107.24 100.14 97.27 100.25 94.75 102.43 2002 99.15 102.81 80.90 104.03 96.36 96.40 100.77 100.80 2003 105.13 105.18 93.95 116.44 97.95 103.08 100.72 102.81 2004 108.52 99.79 113.48 133.82 97.31 102.95 98.19 99.45 2005 98.34 96.46 87.65 105.53 93.00 95.81 91.99 98.50 2006 105.54 101.32 96.92 133.79 97.84 98.08 98.14 100.51 2007 112.23 105.47 101.58 124.59 98.61 101.97 100.23 97.37 2008 104.28 100.43 106.39 105.71 94.87 106.41 98.31 107.36 2009 90.51 102.48 108.28 73.64 105.77 110.83 104.48 107.56 2010 115.38 111.61 101.05 122.19 95.51 102.02 98.26 98.00 2011 97.85 121.71 94.66 104.27 97.05 102.94 97.34 98.88 2012 91.56 88.72 91.57 90.21 101.22 101.18 100.68 101.67 2013 98.33 95.58 80.39 92.67 95.61 98.14 97.54 95.79 2014 102.22 100.64 92.80 100.47 98.78 100.09 101.02 99.70 2015 99.36 101.48 89.55 88.85 99.05 96.60 98.11 102.96 2016 98.29 98.92 108.40 95.01 100.96 101.16 102.60 101.64 2017 99.06 96.39 91.30 107.38 94.65 95.00 95.15 95.50 2018 109.63 101.93 98.58 105.45 99.95 101.46 100.06 101.59
10-7b.Import Price Link Indices (Continued)
201

Base: 2016=100
Period GeneralIndex
AnimalProducts
PreparedFood-stuffs
BeveragesSpirits &Tobacco
MineralProducts
Productsof The
Chemicalor AlliedIndustries
Plastics,Rubber &ArticlesThereof
Woodpulp, Paper& Articles
Thereof
Textiles &TextileArticles
StoneMaterialsGlass &Glass-ware
BasicMetals &ArticlesThereof
MachineryElectrical
EquipmentTV Image& Sound
Recorders,Etc
Trans-portationEquip-ment
Optical,Measuring,
MedicalInstruments,
MusicalInstruments
& Parts
Miscella-neous
Manufac-tured
Articles
1981 128.23 - - - 101.36 76.91 - 69.55 - 76.92 - 67.71 - -1985 128.49 - - - 92.05 77.23 - 72.29 - 76.25 - 75.94 - -1990 109.46 - - - 69.74 66.27 - 64.34 - 67.21 - 84.62 - -1995 117.75 - - - 70.10 76.14 - 75.13 - 69.30 - 85.47 - -1996 119.72 - - - 72.58 71.07 - 76.11 - 70.55 - 86.60 - -1997 122.17 - - - 74.96 73.79 - 81.13 - 72.34 - 88.42 - -1998 128.98 71.04 68.94 36.05 81.45 80.16 82.73 87.99 162.35 78.76 207.56 99.87 166.93 94.72 1999 117.98 81.93 68.05 44.48 79.10 75.38 83.76 82.36 135.92 71.48 179.99 97.06 153.80 89.57 2000 116.95 64.45 51.52 69.53 85.15 77.89 86.93 82.08 136.45 72.22 175.09 92.88 146.53 86.16 2001 117.32 56.85 47.59 64.11 87.12 78.28 81.63 84.35 133.29 73.62 172.85 92.36 151.88 89.22 2002 115.57 57.98 49.01 67.41 86.05 78.16 86.58 83.77 116.44 75.40 166.21 91.39 148.27 88.74 2003 113.84 62.22 49.99 76.56 91.22 83.08 88.05 85.25 112.36 83.15 153.48 93.15 152.05 87.99 2004 115.68 70.65 53.83 87.50 104.25 94.09 89.20 85.66 130.41 99.35 144.79 90.57 154.21 87.79 2005 112.83 66.36 61.92 115.29 104.22 96.41 86.68 84.48 119.39 103.65 133.95 86.76 138.15 87.23 2006 115.65 69.40 64.00 138.34 109.84 100.73 87.62 85.95 111.77 112.99 132.78 86.16 132.59 88.63 2007 119.76 67.73 71.76 158.07 122.72 107.57 92.69 89.92 117.34 129.15 129.05 89.84 131.17 89.47 2008 117.20 80.75 78.38 204.29 123.40 114.19 102.48 90.89 115.56 133.38 117.75 90.17 117.02 90.09 2009 109.47 77.49 90.05 135.68 108.61 102.46 91.30 93.99 109.69 110.74 117.13 95.05 111.15 93.86 2010 111.68 86.38 87.90 161.47 126.66 113.28 109.09 100.02 124.22 123.25 111.22 92.67 108.03 90.24 2011 111.78 106.94 85.82 203.32 137.01 120.79 106.03 107.14 122.12 124.37 103.57 93.68 100.89 89.58 2012 109.97 114.76 90.43 211.26 126.16 116.85 99.97 103.73 114.34 114.73 103.47 94.89 100.47 91.78 2013 107.70 93.23 93.25 203.30 126.70 114.56 98.35 102.18 102.28 110.40 102.01 94.65 99.33 91.99 2014 107.81 97.21 97.45 191.11 124.94 113.85 99.80 102.77 99.99 112.08 102.41 95.86 100.95 93.94 2015 102.78 93.05 100.08 121.83 104.64 103.18 101.15 101.69 97.92 104.73 101.59 98.73 104.00 98.73 2016 100.00 100.00 100.00 100.00 100.00 100.00 100.00 100.00 100.00 100.00 100.00 100.00 100.00 100.00 2017 98.54 101.44 93.87 115.98 102.41 105.52 101.46 96.64 95.32 103.63 96.13 95.90 95.01 95.29 2018 99.97 107.20 95.04 145.55 110.05 111.05 106.06 99.07 95.18 108.60 94.33 95.75 92.62 95.72
Source: See Table 10-1.
10-8. Export Price Indices
202

Period GeneralIndex
AnimalProducts
PreparedFood-stuffs,
Beverages,Spirits &Tobacco
MineralProducts
Productsof The
Chemicalor AlliedIndustries
Plastics,Rubber &ArticlesThereof
Woodpulp, Paper& Articles
Thereof
Textiles& TextileArticles
StoneMaterials,Glass &
Glassware
BasicMetals &ArticlesThereof
MachineryElectrical
EquipmentTV Image& Sound
Recorders,Etc
Trans-portationEquip-ment
Optical,Measuring,
MedicalInstruments,
MusicalInstruments
& Parts
Miscella-neous
Manufac-tured
Articles
1982 129.57 … … … 95.97 78.01 … 99.19 … 100.64 … 105.95 … …1985 128.49 … … … 100.21 77.23 … 99.55 … 101.40 … 101.76 … …1990 109.46 … … … 100.90 66.27 … 101.79 … 100.63 … 105.67 … …1995 117.75 … … … 104.97 76.14 … 111.02 … 106.70 … 102.26 … …1996 119.72 … … … 103.54 71.07 … 101.30 … 101.80 … 101.32 … …1997 122.17 … … … 103.28 73.79 … 106.60 … 102.54 … 102.10 … …1998 105.57 … … … 108.66 108.63 … 108.46 … 108.87 … 112.95 … …1999 91.47 115.33 98.71 123.38 97.11 94.04 101.25 93.60 83.72 90.76 86.72 97.19 92.13 94.56 2000 99.13 78.66 75.71 156.32 107.65 103.33 103.78 99.66 100.39 101.04 97.28 95.69 95.27 96.19 2001 100.32 88.21 92.37 92.20 102.31 100.50 93.90 102.77 97.68 101.94 98.72 99.44 103.65 103.55 2002 98.51 101.99 102.98 105.15 98.77 99.85 106.06 99.31 87.36 102.42 96.16 98.95 97.62 99.46 2003 98.50 107.31 102.00 113.57 106.01 106.29 101.70 101.77 96.50 110.28 92.34 101.93 102.55 99.15 2004 101.62 113.55 107.68 114.29 114.28 113.25 101.31 100.48 116.06 119.48 94.34 97.23 101.42 99.77 2005 97.54 93.93 115.03 131.76 99.97 102.47 97.17 98.62 91.55 104.33 92.51 95.79 89.59 99.36 2006 102.50 104.58 103.36 119.99 105.39 104.48 101.08 101.74 93.62 109.01 99.13 99.31 95.98 101.60 2007 103.55 97.59 112.13 114.26 111.73 106.79 105.79 104.62 104.98 114.30 97.19 104.27 98.93 100.95 2008 97.86 119.22 109.23 129.24 100.55 106.15 110.56 101.08 98.48 103.28 91.24 100.37 89.21 100.69 2009 93.40 95.96 114.89 66.42 88.01 89.73 89.09 103.41 94.92 83.03 99.47 105.41 94.98 104.18 2010 102.02 111.47 97.61 119.01 116.62 110.56 119.49 106.42 113.25 111.30 94.95 97.50 97.19 96.14 2011 100.09 123.80 97.63 125.92 108.17 106.63 97.19 107.12 98.31 100.91 93.12 101.09 93.39 99.27 2012 98.38 107.31 105.37 103.91 92.08 96.74 94.28 96.82 93.63 92.25 99.90 101.29 99.58 102.46 2013 97.94 81.24 103.12 96.23 100.43 98.04 98.38 98.51 89.45 96.23 98.59 99.75 98.87 100.23 2014 100.10 104.27 104.50 94.00 98.61 99.38 101.47 100.58 97.76 101.52 100.39 101.28 101.63 102.12 2015 95.33 95.72 102.70 63.75 83.75 90.63 101.35 98.95 97.93 93.44 99.20 102.99 103.02 105.10 2016 97.30 107.47 99.92 82.08 95.57 96.92 98.86 98.34 102.12 95.48 98.43 101.29 96.15 101.29 2017 98.54 101.44 93.87 115.98 102.41 105.52 101.46 96.64 95.32 103.63 96.13 95.90 95.01 95.29 2018 101.45 105.68 101.25 125.50 107.46 105.24 104.53 102.51 99.85 104.80 98.13 99.84 97.48 100.45
Source: See Table 10-1.
10-9. Export Price Link Indices
203
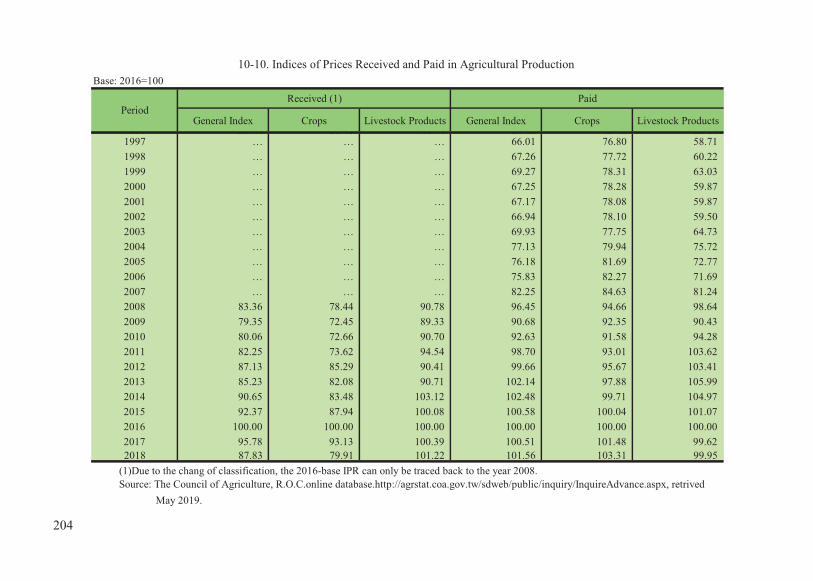
Base: 2016=100
Received (1) Paid
General Index Crops Livestock Products General Index Crops Livestock Products1984 66 03 63 28 98 25 60 56 59 79 60 841997 … … … 66.01 76.80 58.71 1998 … … … 67.26 77.72 60.22 1999 … … … 69.27 78.31 63.03 2000 … … … 67.25 78.28 59.87 2001 … … … 67.17 78.08 59.87 2002 … … … 66.94 78.10 59.50 2003 … … … 69.93 77.75 64.73 2004 … … … 77.13 79.94 75.72 2005 … … … 76.18 81.69 72.77 2006 … … … 75.83 82.27 71.69 2007 … … … 82.25 84.63 81.24 2008 83.36 78.44 90.78 96.45 94.66 98.64 2009 79.35 72.45 89.33 90.68 92.35 90.43 2010 80.06 72.66 90.70 92.63 91.58 94.28 2011 82.25 73.62 94.54 98.70 93.01 103.62 2012 87.13 85.29 90.41 99.66 95.67 103.41 2013 85.23 82.08 90.71 102.14 97.88 105.99 2014 90.65 83.48 103.12 102.48 99.71 104.97 2015 92.37 87.94 100.08 100.58 100.04 101.07 2016 100.00 100.00 100.00 100.00 100.00 100.00 2017 95.78 93.13 100.39 100.51 101.48 99.62 2018 87.83 79.91 101.22 101.56 103.31 99.95
(1)Due to the chang of classification, the 2016-base IPR can only be traced back to the year 2008.Source: The Council of Agriculture, R.O.C.online database.http://agrstat.coa.gov.tw/sdweb/public/inquiry/InquireAdvance.aspx, retrived
May 2019.
Period
10-10. Indices of Prices Received and Paid in Agricultural Production
204
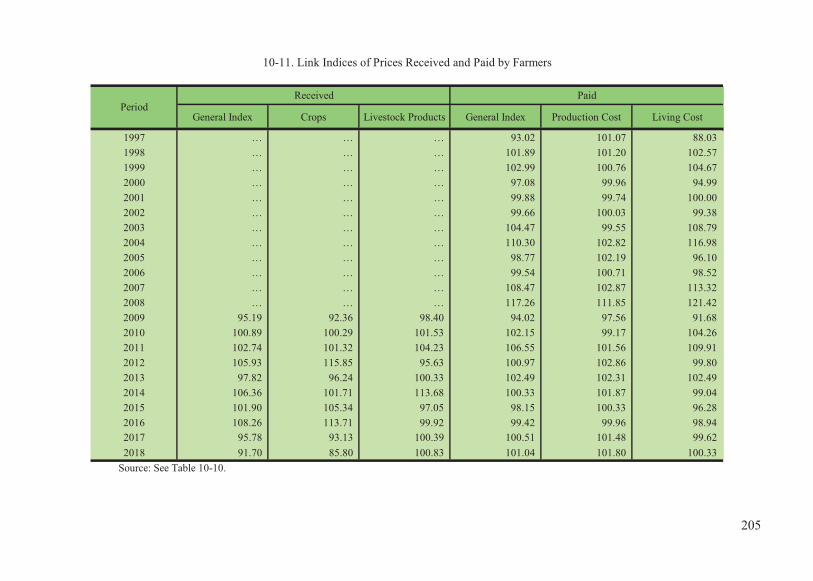
Received Paid
General Index Crops Livestock Products General Index Production Cost Living Cost#VALUE! #VALUE! #VALUE! 117 17 127 09 109 62
1997 … … … 93.02 101.07 88.03 1998 … … … 101.89 101.20 102.57 1999 … … … 102.99 100.76 104.67 2000 … … … 97.08 99.96 94.99 2001 … … … 99.88 99.74 100.00 2002 … … … 99.66 100.03 99.38 2003 … … … 104.47 99.55 108.79 2004 … … … 110.30 102.82 116.98 2005 … … … 98.77 102.19 96.10 2006 … … … 99.54 100.71 98.52 2007 … … … 108.47 102.87 113.32 2008 … … … 117.26 111.85 121.42 2009 95.19 92.36 98.40 94.02 97.56 91.68 2010 100.89 100.29 101.53 102.15 99.17 104.26 2011 102.74 101.32 104.23 106.55 101.56 109.91 2012 105.93 115.85 95.63 100.97 102.86 99.80 2013 97.82 96.24 100.33 102.49 102.31 102.49 2014 106.36 101.71 113.68 100.33 101.87 99.04 2015 101.90 105.34 97.05 98.15 100.33 96.28 2016 108.26 113.71 99.92 99.42 99.96 98.94 2017 95.78 93.13 100.39 100.51 101.48 99.62 2018 91.70 85.80 100.83 101.04 101.80 100.33
Source: See Table 10-10.
Period
10-11. Link Indices of Prices Received and Paid by Farmers
205

206

11. EXTERNAL TRADE


Unit: US$ million2003 2004 2005 2006 2007 2008 2009 2010
A. Current Account 28,250 17,249 14,926 23,137 32,013 24,801 40,650 36,832Goods: Exports 160,798 192,668 206,356 234,756 258,394 269,621 215,469 289,382Goods: Imports 126,695 167,794 181,847 203,326 219,943 240,470 176,098 252,368 Balance on Goods 34,103 24,874 24,509 31,430 38,451 29,151 39,371 37,014Services: Credit 13,056 15,948 18,137 18,780 22,031 23,340 20,504 26,663Services: Debt 25,638 30,732 32,457 32,719 34,818 34,870 29,604 37,711 Balance on Goods and Services 21,521 10,090 10,189 17,491 25,664 17,621 30,271 25,966Primary Income: Credit 12,878 15,337 17,356 19,338 23,500 23,277 20,351 23,265Primary Income: Debit 3,430 4,353 8,355 9,757 13,368 13,299 7,827 9,689 Balance on Goods, Services, and Primary income 30,969 21,074 19,190 27,072 35,796 27,599 42,795 39,542Secondary Income: Credit 2,673 3,170 3,463 3,837 4,690 5,519 4,945 5,278Secondary Income: Debit 5,392 6,995 7,727 7,772 8,473 8,317 7,090 7,988
B. Capital Account (1) -18 -2 -46 -63 -25 -270 -50 -49Capital Account: Credit 1 6 1 4 3 3 2 5Capital Account: Debit 19 8 47 67 28 273 52 54 Balance on Current and Capital Account 28,232 17,247 14,880 23,074 31,988 24,531 40,600 36,783
C. Financial Account -7,735 -7,317 -2,340 19,601 38,932 1,641 -13,488 339Direct Investment: Assets 5,682 7,145 6,028 7,399 11,107 10,287 5,877 11,574
Equity and Investment Fund Shares 5,635 7,102 5,971 6,863 11,157 10,320 5,901 11,634Debt Instruments 47 43 57 536 -50 -33 -24 -60
Direct investment: Liabilities 453 1,898 1,625 7,424 7,769 5,432 2,805 2,492Equity and Investment Fund Shares 395 1,943 1,493 7,034 6,738 4,874 3,685 2,779Debt Instruments 58 -45 132 390 1,031 558 -880 -287
Portfolio Investment: Assets 34,763 21,823 33,902 40,779 44,966 -3,527 31,699 33,487Equity and Investment Fund Shares 9,850 8,167 12,464 18,467 35,697 4,573 21,197 12,274Debt Securities 24,913 13,656 21,438 22,312 9,269 -8,100 10,502 21,213
(1) Excludes components that have been classified in the categories of Group E.
Source: The Central Bank of China, R.O.C. (Taiwan), Financial Statistics Monthly, Republic of China (Taiwan), May 2019.
11-1a. Balance of Payments
Note: Numbers with a positive sign refer to proceeds or payments in the cases of the current account and the capital account, to an increase in financial assets or liabilities. Numbers with a negative sign denote a decrease in the aforesaid items.
207

Unit: US$ million2003 2004 2005 2006 2007 2008 2009 2010
Portfolio Investment: Liabilities 29,566 17,154 31,045 21,814 4,904 -15,777 21,372 12,823 Equity and Investment Fund Shares 25,197 14,092 34,826 22,662 5,599 -15,418 19,427 9,986 Debt securities 4,369 3,062 -3,781 -848 -695 -359 1,945 2,837Financial Derivatives And Employee Stock Options 108 695 965 965 289 -1,589 -852 -577 Assets -632 -1,036 -947 -1,930 -3,691 -7,938 -5,344 -4,497 Liabilities -740 -1,731 -1,912 -2,895 -3,980 -6,349 -4,492 -3,920Other Investment: Assets -3,939 -408 6,254 1,266 6,847 -10,621 -25,663 -12,317 Central bank 0 0 0 0 0 0 0 0 Deposit-taking corporations, except the central bank 1,994 6,754 9,421 5,525 10,158 16,726 -707 -1,212 General government -33 -32 0 4 -11 -7 2 -13 Other sectors -5,900 -7,130 -3,167 -4,263 -3,300 -27,340 -24,958 -11,092Other investment: liabilities 14,330 17,520 16,819 1,570 11,604 3,254 372 16,513 Central bank 0 898 9,250 -3,311 -7,300 -3,116 0 0 Deposit-taking corporations, except the central bank 11,391 13,957 5,343 1,996 16,119 -49 -9,757 15,099 General government -5 0 0 0 0 0 0 0 Other sectors 2,944 2,665 2,226 2,885 2,785 6,419 10,129 1,414 Balance on Current, Capital, and Financial Account 35,967 24,564 17,220 3,473 -6,944 22,890 54,088 36,444
D. Net Errors And Omissions 1,125 2,032 2,836 2,613 2,924 3,384 38 3,729E. Reserves and Related Items 37,092 26,596 20,056 6,086 -4,020 26,274 54,126 40,173
Reserve Assets 37,092 26,596 20,056 6,086 -4,020 26,274 54,126 40,173 Net Credit and Loans from the IMF 0 0 0 0 0 0 0 0 Total Exceptional Financing 0 0 0 0 0 0 0 0
11-1b. Balance of Payments (Continued)
208

Unit: US$ million2011 2012 2013 2014 2015 2016 2017 2018
A. Current Account 37,878 43,168 49,872 60,525 73,143 71,594 83,521 71,873Goods: Exports 325,762 388,344 382,096 378,961 336,880 309,965 349,835 352,229Goods: Imports 286,120 338,773 327,539 318,771 263,785 239,318 268,966 284,796 Balance on Goods 39,642 49,571 54,557 60,190 73,095 70,647 80,869 67,433Services: Credit 30,643 34,546 36,461 41,578 41,311 41,870 45,922 50,926Services: Debt 41,895 52,927 51,663 52,907 51,652 51,704 53,847 56,902 Balance on Goods and Services 28,390 31,190 39,355 48,861 62,754 60,813 72,944 61,457Primary Income: Credit 24,833 25,022 24,609 29,211 28,886 29,469 34,230 39,081Primary Income: Debit 11,654 10,429 11,089 14,754 15,114 15,524 19,544 25,299 Balance on Goods, Services, and Primary income 41,569 45,783 52,875 63,318 76,526 74,758 87,630 75,239Secondary Income: Credit 5,566 5,509 6,179 6,661 6,603 6,915 7,217 7,651Secondary Income: Debit 9,257 8,124 9,182 9,454 9,986 10,079 11,326 11,017
B. Capital Account (1) -36 -24 67 -8 -5 -9 -12 63Capital Account: Credit 3 4 103 29 15 17 14 86Capital Account: Debit 39 28 36 37 20 26 26 23 Balance on Current and Capital Account 37,842 43,144 49,939 60,517 73,138 71,585 83,509 71,936
C. Financial Account 32,027 31,501 41,089 50,556 65,233 58,565 71,529 55,234Direct Investment: Assets 12,766 13,137 14,285 12,711 14,709 17,946 11,552 18,025
Equity and Investment Fund Shares 12,669 13,153 14,282 12,690 13,649 16,913 10,736 17,398Debt Instruments 97 -16 3 21 1,060 1,033 816 627
Direct investment: Liabilities -1,957 3,207 3,598 2,828 2,391 9,261 3,291 6,998Equity and Investment Fund Shares -2,012 3,341 3,643 2,933 2,478 7,342 4,781 7,195Debt Instruments 55 -134 -45 -105 -87 1,919 -1,490 -197
Portfolio Investment: Assets 19,503 45,710 37,082 57,096 56,340 81,463 81,817 68,801Equity and Investment Fund Shares 2,078 16,933 6,095 20,328 6,922 6,445 14,998 6,297Debt Securities 17,425 28,777 30,987 36,768 49,418 75,018 66,819 62,504
11-1c. Balance of Payments (Continued)
209

Unit: US$ million2011 2012 2013 2014 2015 2016 2017 2018
Portfolio Investment: Liabilities -16,188 3,214 7,953 13,055 1,228 4,343 3,958 -15,175 Equity and Investment Fund Shares -14,924 2,908 9,591 13,792 3,744 7,025 4,284 -14,385 Debt securities -1,264 306 -1,638 -737 -2,516 -2,682 -326 -790Financial Derivatives And Employee Stock Options -1,038 -391 -838 -546 2,195 1,700 -503 1,638 Assets -5,777 -4,771 -6,055 -5,977 -11,227 -11,166 -11,505 -16,748 Liabilities -4,739 -4,380 -5,217 -5,431 -13,422 -12,866 -11,002 -18,386Other Investment: Assets 7,988 -5,312 47,505 11,964 -16,305 -6,820 12,233 -19,214 Central bank 0 0 0 0 0 0 0 0 Deposit-taking corporations, except the central bank 25,352 4,967 61,069 36,125 -3,232 6,761 8,496 -10,121 General government 13 -3 1 -8 9 6 -6 9 Other sectors -17,377 -10,276 -13,565 -24,153 -13,082 -13,587 3,743 -9,102Other investment: liabilities 25,337 15,222 45,394 14,786 -11,913 22,120 26,321 22,193 Central bank 0 0 0 0 0 0 0 0 Deposit-taking corporations, except the central bank 22,334 10,575 41,391 9,638 -15,385 12,881 19,149 11,097 General government 0 0 2 2 2 5 -6 5 Other sectors 3,003 4,647 4,001 5,146 3,470 9,234 7,178 11,091 Balance on Current, Capital, and Financial Account 5,815 11,643 8,850 9,961 7,905 13,020 11,980 16,702
D. Net Errors And Omissions 424 3,841 2,468 3,054 7,106 -2,357 487 -4,203E. Reserves and Related Items 6,239 15,484 11,318 13,015 15,011 10,663 12,467 12,499
Reserve Assets 6,239 15,484 11,318 13,015 15,011 10,663 12,467 12,499 Net Credit and Loans from the IMF 0 0 0 0 0 0 0 0 Total Exceptional Financing 0 0 0 0 0 0 0 0
11-1d. Balance of Payments (Continued)
210

Exports Imports Exports Imports Exports Imports
1994 29.06 31.27 50.66 45.39 57.35 68.90 83.23 42.17 1995 34.89 37.94 52.90 49.74 65.96 76.27 86.48 45.75 1996 37.58 38.93 55.00 50.32 68.32 77.38 88.30 48.56 1997 41.18 45.30 59.05 58.49 69.75 77.44 90.06 53.18 1998 43.69 48.45 59.78 60.95 73.09 79.50 91.94 54.96 1999 46.35 49.46 61.95 62.61 74.81 79.00 94.70 58.67 2000 54.61 60.42 66.85 68.90 81.69 87.68 93.17 62.28 2001 48.96 50.05 56.92 61.42 86.01 81.48 105.56 60.09 2002 53.33 53.85 61.96 66.30 86.07 81.21 105.97 65.66 2003 58.58 60.62 63.50 70.83 92.27 85.58 107.81 68.45 2004 68.82 77.82 67.95 81.89 101.27 95.03 106.57 72.42 2005 71.98 80.83 72.63 83.81 99.10 96.44 102.75 74.63 2006 81.94 90.84 79.20 86.06 103.46 105.55 98.02 77.63 2007 91.04 99.20 85.36 88.30 106.66 112.34 94.95 81.04 2008 90.17 103.87 82.47 84.05 109.34 123.56 88.49 72.98 2009 75.52 79.19 74.90 75.54 100.82 104.82 96.18 72.04 2010 97.44 109.25 91.96 95.06 105.96 114.93 92.20 84.79 2011 101.78 113.89 91.61 90.93 111.10 125.25 88.70 81.26 2012 100.40 110.53 91.58 88.79 109.63 124.49 88.06 80.65 2013 102.24 110.96 95.51 92.87 107.04 119.48 89.59 85.57 2014 107.19 114.75 99.70 97.76 107.51 117.38 91.59 91.32 2015 100.09 101.15 98.05 100.34 102.08 100.81 101.26 99.29 2016 100.00 100.00 100.00 100.00 100.00 100.00 100.00 100.00 2017 106.92 106.29 107.72 105.02 99.26 101.21 98.07 105.64 2018 112.10 116.21 111.09 107.27 100.90 108.34 93.13 103.47
Note:(1) From Jan. 2016, the Compilation of Customs Trade Statistics adopts the United Nations' International Merchandise Trade Statistics (IMTS) Compilers Manual, 2010. Under IMTS Criteria, all figures are compiled according to the general trade system.
(2) The index has been adapted to chain-linking method. Source: The Ministry of Finance, R.O.C. Online database of Ministry of Finance, R.O.C., retrieved June 2019.
I. Reference Year: 2016
11-2a. Indices of Foreign Trade
PeriodValue Index Quantum Index Unit Value Index Net Terms
of TradeIncome Terms
of Trade
211

Exports Imports Exports Imports Exports Imports
1994 9.74 11.12 5.72 0.75 3.78 10.28 -5.90 -0.52 1995 20.06 21.33 4.42 9.58 15.01 10.70 3.90 8.49 1996 7.71 2.61 3.97 1.17 3.58 1.46 2.10 6.14 1997 9.58 16.36 7.36 16.24 2.09 0.08 1.99 9.51 1998 6.10 6.95 1.24 4.21 4.79 2.66 2.09 3.35 1999 6.09 2.08 3.63 2.72 2.35 -0.63 3.00 6.75 2000 17.82 22.16 7.91 10.05 9.20 10.99 -1.62 6.15 2001 -10.35 -17.16 -14.85 -10.86 5.29 -7.07 13.30 -3.52 2002 8.93 7.59 8.85 7.95 0.07 -0.33 0.39 9.27 2003 9.84 12.57 2.49 6.83 7.20 5.38 1.74 4.25 2004 17.48 28.37 7.01 15.61 9.75 11.04 -1.15 5.80 2005 4.59 3.87 6.89 2.34 -2.14 1.48 -3.58 3.05 2006 13.84 12.38 9.05 2.68 4.40 9.45 -4.60 4.02 2007 11.11 9.20 7.78 2.60 3.09 6.43 -3.13 4.39 2008 -0.96 4.71 -3.39 -4.81 2.51 9.99 -6.80 -9.95 2009 -16.25 -23.76 -9.18 -10.12 -7.79 -15.17 8.69 -1.29 2010 29.03 37.96 22.78 25.84 5.10 9.65 -4.14 17.70 2011 4.45 4.25 -0.38 -4.34 4.85 8.98 -3.80 -4.16 2012 -1.36 -2.95 -0.03 -2.35 -1.32 -0.61 -0.72 -0.75 2013 1.83 0.39 4.29 4.60 -2.36 -4.02 1.74 6.10 2014 4.84 3.42 4.39 5.27 0.44 -1.76 2.23 6.72 2015 -6.62 -11.85 -1.65 2.64 -5.05 -14.12 10.56 8.73 2016 -0.09 -1.14 1.99 -0.34 -2.04 -0.80 -1.24 0.72 2017 6.92 6.29 7.72 5.02 -0.74 1.21 -1.93 5.64 2018 4.84 9.33 3.13 2.14 1.65 7.04 -5.04 -2.05
II. Change from previous year (%)
11-2b. Indices of Foreign Trade (Continued)
PeriodValue Index Quantum Index Unit Value Index Net Terms
of TradeIncome Terms
of Trade
212

11-3. Export and Import Foreign Exchange Proceeds & PaymentsUnit: US$ million
Foreign Exchange Export Proceeds Foreign Exchange Import Payments
Sold for N.T.Dollars
Retained withExporters Total
Purchased with N.T.Dollars
Non-purchasedfrom Banks Total
1990 49,483 18,961 68,444 44,451 12,806 57,257 1995 54,808 65,125 119,933 59,634 45,031 104,665 1996 49,747 73,762 123,509 54,638 51,279 105,917 1997 44,773 83,380 128,153 52,970 60,257 113,227 1998 31,251 91,708 122,959 47,267 65,935 113,202 1999 34,399 103,815 138,214 44,949 74,379 119,328 2000 35,572 125,558 161,130 49,859 98,587 148,446 2001 25,371 111,861 137,232 38,316 80,595 118,911 2002 24,668 117,820 142,488 36,373 85,838 122,211 2003 24,418 138,736 163,154 39,236 106,090 145,326 2004 27,268 176,786 204,054 47,620 145,683 193,303 2005 26,832 185,450 212,282 48,079 162,494 210,573 2006 26,200 196,725 222,924 47,735 170,425 218,160 2007 27,374 225,654 253,028 49,821 183,784 233,605 2008 27,067 250,036 277,103 55,016 215,444 270,460 2009 19,122 195,251 214,374 38,744 152,132 190,876 2010 22,771 256,836 279,607 48,141 209,972 258,113 2011 26,299 290,156 316,455 54,102 240,730 294,832 2012 23,557 280,088 303,645 51,801 236,407 288,208 2013 22,053 291,299 313,352 47,675 235,905 283,580 2014 23,461 302,451 325,912 49,136 237,436 286,572 2015 19,245 262,080 281,325 42,468 170,586 213,054 2016 16,477 239,661 256,138 40,209 155,073 195,282 2017 16,141 265,481 281,622 44,180 172,478 216,658 2018 17,783 287,110 304,893 47,036 193,502 240,538
Source: See Table 11-1a.
Period
213

Total Exports Imports Balance Total Exports Imports Balance
2001 7,964,018 4,270,700 3,693,318 577,382 236,200 126,612 109,588 17,0242002 8,670,440 4,692,990 3,977,450 715,540 250,890 135,774 115,116 20,6592003 9,686,721 5,206,099 4,480,623 725,476 281,593 151,345 130,249 21,0962004 11,890,747 6,148,896 5,741,852 407,044 355,197 183,643 171,554 12,089
2005 12,385,931 6,427,175 5,958,755 468,420 385,199 199,761 185,438 14,3232006 14,067,899 7,351,935 6,715,964 635,972 432,346 225,904 206,442 19,4622007 15,497,420 8,169,680 7,327,740 841,940 471,907 248,792 223,115 25,6772008 15,764,285 8,099,233 7,665,053 434,180 502,518 258,051 244,467 13,5852009 12,639,969 6,784,756 5,855,213 929,543 383,260 205,663 177,598 28,0652010 16,868,144 8,777,894 8,090,249 687,645 534,282 278,008 256,274 21,7342011 17,654,919 9,194,198 8,460,721 733,478 600,985 312,923 288,062 24,8612012 17,280,886 9,069,839 8,211,047 858,792 583,733 306,409 277,324 29,0852013 17,478,564 9,235,715 8,242,848 992,867 589,438 311,428 278,010 33,4182014 18,208,362 9,683,403 8,524,959 1,158,444 601,942 320,092 281,850 38,2422015 16,556,704 9,042,128 7,514,576 1,527,553 522,563 285,344 237,219 48,1242016 16,462,546 9,033,549 7,428,996 1,604,553 510,889 280,321 230,568 49,7532017 17,555,133 9,658,687 7,896,446 1,762,242 576,515 317,249 259,266 57,983
2018 18,759,906 10,126,334 8,633,572 1,492,762 622,241 335,909 286,333 49,576
Note : (1) Merchandise exports are given at f.o.b. prices and merchandise imports at c.i.f. prices in this table and the following tables in this section. (2) From Jan. 2016, the Compilation of Customs Trade Statistics adopts the United Nations' International Merchandise Trade Statistics (IMTS) Compilers Manual, 2010. Under IMTS Criteria, all figures are compiled according to the general trade system. Source: See Table 11-2a.
11-4. Foreign Trade (Customs Statistics)(1)(2)
PeriodValue (NT$ million) Value (US$ million)
214

Total Exports Imports Total Exports Imports
2001 356,474 191,159 165,315 10,572 5,667 4,905
2002 385,985 208,919 177,065 11,169 6,044 5,125
2003 429,325 230,740 198,586 12,481 6,708 5,773
2004 525,051 271,512 253,539 15,684 8,109 7,575
2005 544,921 282,765 262,157 16,947 8,789 8,158
2006 616,379 322,122 294,257 18,943 9,898 9,045
2007 676,228 356,483 319,745 20,592 10,856 9,736
2008 685,472 352,176 333,297 21,851 11,221 10,630
2009 547,697 293,987 253,710 16,607 8,911 7,695
2010 728,931 379,323 349,608 23,088 12,014 11,074
2011 761,201 396,412 364,788 25,912 13,492 12,420
2012 742,613 389,759 352,854 25,085 13,167 11,917
2013 748,718 395,624 353,093 25,249 13,340 11,909
2014 778,014 413,756 364,258 25,720 13,677 12,043
2015 705,654 385,380 320,275 22,272 12,161 10,110
2016 700,059 384,146 315,913 21,725 11,920 9,805
2017 745,266 410,039 335,227 24,475 13,468 11,007
2018 795,583 429,444 366,138 26,388 14,245 12,143
Source: See Table 11-2a.
11-5. Exports and Imports Per Capita
PeriodValue (NT$) Value (US$)
215

Unit:%
High Mid Low High Mid Low High Mid Low High Mid Low
2001 100.0 30.5 43.1 26.4 36.8 56.8 6.4 55.9 29.8 14.3 20.7 47.9 31.4
2002 100.0 31.2 42.6 26.2 40.0 54.2 5.8 57.1 29.8 13.1 21.1 46.4 32.5
2003 100.0 32.0 43.4 24.6 45.3 49.3 5.4 57.7 30.7 11.6 22.3 45.8 31.9
2004 100.0 32.4 43.5 24.1 50.9 44.4 4.6 58.3 31.4 10.3 23.8 45.5 30.6
2005 100.0 32.3 43.1 24.7 55.2 40.5 4.2 57.8 33.0 9.2 26.1 44.7 29.1
2006 100.0 31.9 43.9 24.3 59.5 36.6 3.9 59.6 32.0 8.3 25.8 46.9 27.4
2007 100.0 32.3 41.6 26.2 61.9 34.4 3.7 59.0 33.3 7.8 28.2 44.7 27.2
2008 100.0 32.3 39.9 27.8 62.3 34.0 3.7 57.2 35.5 7.2 30.3 42.7 27.1
2009 100.0 30.7 43.7 25.6 61.5 34.7 3.8 59.5 33.3 7.2 28.4 45.8 25.8
2010 100.0 31.6 43.4 25.0 62.0 34.5 3.5 60.8 32.6 6.6 27.6 45.0 27.5
2011 100.0 30.1 43.7 26.3 60.4 36.0 3.6 59.1 34.3 6.5 28.7 44.8 26.5
2012 100.0 30.2 43.2 26.6 61.0 35.2 3.9 57.7 35.4 6.9 29.2 45.7 25.1
2013 100.0 29.2 44.1 26.8 62.5 33.7 3.8 58.7 34.5 6.8 29.4 45.9 24.8
2014 100.0 29.7 45.7 24.6 62.2 33.9 3.9 59.4 33.5 7.1 27.8 48.3 23.9
2015 100.0 31.8 49.0 19.2 58.8 36.9 4.3 60.4 31.9 7.7 23.9 51.9 24.2
2016 100.0 30.3 51.9 17.8 59.5 36.5 4.0 62.2 30.5 7.3 22.7 54.8 22.5
2017 100.0 28.3 53.7 18.0 60.8 35.5 3.7 63.0 30.0 7.0 22.7 55.8 21.5
2018 100.0 27.6 53.0 19.5 61.0 35.3 3.7 62.4 30.5 7.0 24.2 55.6 20.3
Source: See Table 11-2a.
11-6a. Standard and Characteristic Classification of Exported Commodities
Period TotalDegree of Labor
IntensityDegree of Capital
IntensityDegree of Energy
IntensityDegree of Technical
Intensity
(By Intensity of Input Factor)
216

Unit:%
High Mid Low High Mid Low High Mid Low High Mid Low
2001 100.0 36.8 51.9 11.3 36.9 59.3 3.8 60.2 26.1 13.7 28.3 42.7 28.9
2002 100.0 34.9 53.4 11.7 37.8 58.3 3.9 60.9 25.6 13.6 28.8 44.2 27.0
2003 100.0 35.9 52.1 12.0 40.7 55.7 3.6 59.1 27.6 13.3 31.3 43.3 25.4
2004 100.0 37.4 49.8 12.8 40.8 55.3 3.9 56.2 31.3 12.6 33.6 41.4 25.0
2005 100.0 36.1 49.5 14.4 42.8 53.2 4.0 55.2 32.4 12.3 36.0 41.3 22.8
2006 100.0 34.1 49.9 16.0 44.5 51.0 4.5 54.7 33.5 11.8 37.8 42.8 19.4
2007 100.0 33.4 48.5 18.1 45.1 50.2 4.7 53.6 34.6 11.9 40.2 41.7 18.2
2008 100.0 30.2 45.1 24.7 47.9 47.3 4.9 50.5 37.6 11.9 46.9 38.5 14.6
2009 100.0 33.1 49.0 18.0 44.5 50.7 4.7 54.3 33.7 12.1 40.4 42.4 17.2
2010 100.0 34.3 47.6 18.1 44.6 51.2 4.2 53.5 35.0 11.5 40.7 41.0 18.3
2011 100.0 32.2 46.7 21.1 45.5 50.0 4.4 53.3 34.9 11.8 43.6 39.8 16.7
2012 100.0 31.2 48.5 20.3 43.6 51.8 4.6 54.7 33.9 11.5 45.1 38.5 16.4
2013 100.0 30.6 48.8 20.5 44.3 50.7 5.1 54.6 34.2 11.2 44.5 38.7 16.7
2014 100.0 32.2 48.9 19.0 43.8 50.4 5.8 54.8 34.1 11.2 42.5 40.0 17.6
2015 100.0 36.4 47.5 16.1 43.6 49.4 7.0 52.2 35.9 11.9 34.6 45.9 19.5
2016 100.0 35.1 49.8 15.2 44.6 49.0 6.4 52.9 35.7 11.4 31.9 49.4 18.8
2017 100.0 33.8 50.8 15.5 45.6 48.4 6.0 54.8 33.4 11.8 33.7 48.2 18.1
2018 100.0 32.5 51.6 15.9 46.1 48.2 5.6 56.6 32.1 11.4 35.7 47.4 16.9
11-6b. Standard and Characteristic Classification of Imported Commodities (Continued)
Period TotalDegree of Labor
IntensityDegree of Capital
IntensityDegree of Energy
IntensityDegree of Technical
Intensity
(By Intensity of Input Factor)
217

Total CapitalGoods
IntermediateProducts
ConsumerGoods
Others Total CapitalGoods
IntermediateProducts
ConsumerGoods
Others
2001 126,612.2 20,564.8 81,799.0 23,982.6 265.9 100.0 16.2 64.6 18.9 0.2
2002 135,774.4 22,895.4 89,587.0 22,913.7 378.4 100.0 16.9 66.0 16.9 0.3
2003 151,344.9 23,753.1 104,133.7 23,016.3 441.7 100.0 15.7 68.8 15.2 0.3
2004 183,642.5 26,485.2 133,416.3 23,238.7 502.4 100.0 14.4 72.6 12.7 0.3
2005 199,760.9 27,317.7 149,297.4 22,069.1 1,076.7 100.0 13.7 74.7 11.0 0.5
2006 225,904.2 26,845.8 174,361.5 23,660.3 1,036.6 100.0 11.9 77.2 10.5 0.5
2007 248,792.0 28,473.1 195,512.4 23,803.6 1,003.0 100.0 11.4 78.6 9.6 0.4
2008 258,051.4 29,017.2 203,673.7 24,237.3 1,123.3 100.0 11.2 78.9 9.4 0.4
2009 205,662.5 21,769.5 161,906.3 20,914.9 1,071.8 100.0 10.6 78.7 10.2 0.5
2010 278,008.2 29,958.9 217,386.6 29,444.0 1,218.6 100.0 10.8 78.2 10.6 0.4
2011 312,922.9 34,373.8 240,758.3 36,513.7 1,277.2 100.0 11.0 76.9 11.7 0.4
2012 306,409.2 34,843.5 238,077.3 32,189.2 1,299.2 100.0 11.4 77.7 10.5 0.4
2013 311,428.0 33,210.9 244,493.9 32,078.7 1,644.5 100.0 10.7 78.5 10.3 0.5
2014 320,092.1 34,896.6 251,858.9 31,635.2 1,701.3 100.0 10.9 78.7 9.9 0.5
2015 285,343.6 34,246.5 220,782.0 28,544.1 1,771.0 100.0 12.0 77.4 10.0 0.6
2016 280,321.4 34,842.9 217,336.4 26,412.6 1,729.5 100.0 12.4 77.5 9.4 0.6
2017 317,249.1 39,600.4 248,138.0 27,669.8 1,840.8 100.0 12.5 78.2 8.7 0.6
2018 335,908.6 42,136.9 263,473.7 28,460.5 1,837.5 100.0 12.5 78.4 8.5 0.5
Source: See Table 11-2a.
Period
11-7. Composition of Exports
Value (US$ million) Percentage Distribution (%)
218

Total CapitalGoods
Agricultural& Industrial
Raw Materials
ConsumerGoods Others Total Capital
Goods
Agricultural& Industrial
Raw Materials
ConsumerGoods Others
2001 109,587.9 25,380.5 71,924.1 10,790.3 1,493.0 100.0 23.2 65.6 9.8 1.4
2002 115,115.8 24,497.0 77,840.6 10,983.7 1,794.6 100.0 21.3 67.6 9.5 1.6
2003 130,248.5 24,494.4 92,139.1 12,181.6 1,433.5 100.0 18.8 70.7 9.4 1.1
2004 171,554.0 34,609.1 121,123.1 14,326.7 1,495.2 100.0 20.2 70.6 8.4 0.9
2005 185,437.6 33,482.4 133,610.7 16,633.1 1,711.4 100.0 18.1 72.1 9.0 0.9
2006 206,442.3 33,346.6 154,626.9 17,064.1 1,404.7 100.0 16.2 74.9 8.3 0.7
2007 223,115.4 34,345.7 168,985.6 18,350.1 1,433.9 100.0 15.4 75.7 8.2 0.6
2008 244,466.7 31,192.8 192,583.6 19,150.6 1,539.7 100.0 12.8 78.8 7.8 0.6
2009 177,597.8 23,707.7 134,189.3 18,046.6 1,654.2 100.0 13.3 75.6 10.2 0.9
2010 256,274.0 39,140.1 191,828.1 23,185.1 2,120.8 100.0 15.3 74.9 9.0 0.8
2011 288,062.2 37,497.6 220,673.4 27,479.1 2,412.3 100.0 13.0 76.6 9.5 0.8
2012 277,323.8 34,913.9 212,031.4 28,218.2 2,160.3 100.0 12.6 76.5 10.2 0.8
2013 278,009.7 36,742.4 208,395.2 29,712.5 3,159.7 100.0 13.2 75.0 10.7 1.1
2014 281,849.7 38,479.4 207,797.1 31,469.0 4,104.1 100.0 13.7 73.7 11.2 1.5
2015 237,219.1 38,053.6 162,614.9 32,002.0 4,548.6 100.0 16.0 68.6 13.5 1.9
2016 230,568.1 42,659.7 153,095.6 31,524.8 3,288.0 100.0 18.5 66.4 13.7 1.4
2017 259,266.4 42,476.2 179,072.6 34,015.3 3,702.3 100.0 16.4 69.1 13.1 1.4
2018 286,332.9 43,315.1 203,458.4 36,063.3 3,496.1 100.0 15.1 71.1 12.6 1.2
Source: See Table 11-2a.
11-8. Composition of Imports
Period
Value (US$ million) Percentage Distribution (%)
219

Exports Imports Balance Exports Imports Balance Exports Imports Balance Exports Imports Balance
2001 126,612 109,588 17,024+ 28,128 19,091 9,037+ 28,789 1,863 26,926+ 13,033 26,105 13,072-
2002 135,774 115,116 20,659+ 27,375 19,024 8,351+ 33,049 1,753 31,296+ 12,395 27,610 15,215-
2003 151,345 130,249 21,096+ 26,577 17,795 8,783+ 30,982 1,740 29,242+ 12,479 33,102 20,623-
2004 183,643 171,554 12,089+ 28,815 22,619 6,196+ 33,068 2,110 30,959+ 13,953 44,324 30,370-
2005 199,761 185,438 14,323+ 29,165 21,886 7,279+ 34,220 1,901 32,319+ 15,249 46,685 31,436-
2006 225,904 206,442 19,462+ 32,475 23,839 8,635+ 37,669 1,695 35,974+ 16,509 46,849 30,340-
2007 248,792 223,115 25,677+ 32,165 27,642 4,523+ 38,274 1,635 36,639+ 16,167 46,710 30,543-
2008 258,051 244,467 13,585+ 30,981 27,593 3,388+ 33,055 1,353 31,702+ 17,857 47,088 29,231-
2009 205,663 177,598 28,065+ 23,707 19,201 4,506+ 29,797 1,048 28,749+ 14,632 36,751 22,120-
2010 278,008 256,274 21,734+ 31,675 26,799 4,876+ 38,270 1,567 36,704+ 18,645 52,910 34,266-
2011 312,923 288,062 24,861+ 36,558 27,767 8,791+ 40,726 1,586 39,141+ 19,242 53,149 33,906-
2012 306,409 277,324 29,085+ 33,224 25,701 7,523+ 38,495 2,585 35,910+ 19,624 48,342 28,718-
2013 311,428 278,010 33,418+ 32,630 28,410 4,220+ 41,183 1,585 39,598+ 19,391 43,690 24,299-
2014 320,092 281,850 38,242+ 35,114 30,036 5,078+ 43,795 1,735 42,060+ 20,142 41,984 21,842-
2015 285,344 237,219 48,124+ 34,543 29,196 5,347+ 39,130 1,468 37,663+ 19,592 38,865 19,273-
2016 280,321 230,568 49,753+ 33,523 28,597 4,926+ 38,398 1,331 37,067+ 19,551 40,622 21,071-
2017 317,249 259,266 57,983+ 36,942 30,237 6,705+ 41,232 1,512 39,720+ 20,782 41,943 21,161-
2018 335,909 286,333 49,576+ 39,693 34,716 4,978+ 41,590 1,409 40,181+ 23,082 44,136 21,054-
Source: See Table 11-2a.
Note: Due to the rounding of figures to the nearest whole number, some of the balances in this table may not precisely correspond to the difference between the figures for imports and exports.
I. Amount (US$ million)
11-9a. Commodity Trade with Major Trading Partners
PeriodTotal U.S.A. Hong Kong Japan
220

Exports Imports Balance Exports Imports Balance Exports Imports Balance Exports Imports Balance
2001 4,236 3,386 850+ 4,531 4,309 222+ 2,210 2,199 11+ 4,256 1,533 2,722+
2002 4,648 3,566 1,082+ 3,884 4,500 616- 2,384 2,194 191+ 3,837 1,448 2,389+
2003 5,318 3,891 1,427+ 4,284 5,068 784- 2,659 2,396 263+ 4,221 1,306 2,916+
2004 6,813 4,330 2,483+ 4,612 5,975 1,363- 3,364 2,812 552+ 4,810 2,198 2,612+
2005 8,107 4,982 3,124+ 4,470 6,304 1,834- 3,872 2,916 956+ 4,399 2,056 2,343+
2006 9,379 5,119 4,259+ 5,022 6,299 1,277- 4,633 3,355 1,278+ 4,419 2,334 2,085+
2007 10,613 4,778 5,835+ 5,195 7,208 2,013- 5,262 3,630 1,633+ 4,426 2,769 1,657+
2008 11,783 4,860 6,923+ 5,759 7,738 1,980- 4,975 3,262 1,713+ 4,588 2,348 2,240+
2009 8,699 4,814 3,884+ 4,727 5,745 1,018- 3,873 2,701 1,172+ 4,246 1,868 2,378+
2010 12,198 7,675 4,523+ 6,551 8,603 2,053- 5,355 3,840 1,515+ 5,305 3,255 2,049+
2011 16,980 8,022 8,957+ 6,940 9,884 2,944- 6,230 4,405 1,825+ 4,645 2,963 1,682+
2012 20,206 8,172 12,034+ 5,697 8,122 2,425- 6,665 3,709 2,956+ 4,438 3,616 822+
2013 19,609 8,606 11,003+ 5,671 8,497 2,826- 6,432 3,793 2,639+ 4,498 4,669 171-
2014 20,702 8,436 12,267+ 6,222 9,634 3,412- 6,195 4,410 1,784+ 5,090 3,192 1,898+
2015 17,407 7,171 10,236+ 6,007 8,764 2,757- 5,770 4,043 1,727+ 4,183 2,808 1,376+
2016 16,152 7,518 8,634+ 5,929 8,573 2,645- 5,491 3,818 1,672+ 4,469 4,145 324+
2017 17,625 8,716 8,909+ 6,453 9,200 2,747- 6,382 4,359 2,023+ 4,978 3,476 1,502+
2018 17,364 8,412 8,952+ 7,059 9,965 2,906- 6,168 4,581 1,587+ 5,884 3,883 2,001+
I. Amount (US$ million)
11-9b. Commodity Trade with Major Trading Partners (Continued)
Singapore Germany Thailand NetherlandsPeriod
221

Exports Imports Balance Exports Imports Balance Exports Imports Balance Exports Imports Balance
2001 3,141 4,237 1,096- 3,372 1,481 1,891+ 3,379 6,763 3,384- 1,378 3,092 1,715-
2002 3,224 4,181 957- 2,983 1,401 1,582+ 3,978 7,785 3,807- 1,605 2,840 1,235-
2003 3,187 4,789 1,602- 2,930 1,468 1,461+ 4,741 8,795 4,054- 1,905 2,736 830-
2004 4,245 5,467 1,222- 3,427 1,792 1,635+ 5,689 11,769 6,080- 2,292 3,434 1,142-
2005 4,310 5,258 948- 3,260 1,757 1,504+ 5,945 13,357 7,412- 2,410 4,735 2,325-
2006 4,979 6,118 1,139- 3,509 1,857 1,651+ 7,253 15,095 7,842- 2,747 5,364 2,617-
2007 5,421 6,321 900- 3,622 1,995 1,627+ 7,939 15,165 7,226- 3,301 6,164 2,863-
2008 5,548 6,917 1,368- 3,638 1,941 1,697+ 8,815 13,190 4,375- 3,633 8,350 4,717-
2009 4,082 4,701 618- 3,022 1,291 1,731+ 7,445 10,558 3,113- 2,430 6,008 3,578-
2010 5,975 7,861 1,887- 3,670 1,808 1,862+ 10,902 16,224 5,321- 3,237 9,036 5,800-
2011 6,924 8,793 1,869- 4,646 2,118 2,528+ 12,630 18,186 5,556- 3,744 10,991 7,248-
2012 6,600 7,981 1,381- 5,076 2,069 3,007+ 12,137 15,305 3,167- 3,756 9,462 5,706-
2013 8,243 8,255 11- 4,330 1,923 2,407+ 12,223 16,163 3,939- 3,834 8,106 4,272-
2014 8,671 8,961 290- 4,247 1,983 2,264+ 12,988 15,289 2,301- 3,696 7,586 3,890-
2015 7,197 6,733 464+ 3,905 1,992 1,913+ 12,879 13,450 571- 3,440 6,858 3,418-
2016 7,815 6,281 1,533+ 3,643 1,844 1,799+ 12,788 14,650 1,862- 3,087 6,089 3,003-
2017 10,369 7,182 3,187+ 3,786 1,945 1,841+ 14,733 16,894 2,161- 3,102 8,219 5,117-
2018 10,602 9,245 1,357+ 3,858 2,075 1,783+ 15,981 19,530 3,549- 3,595 9,556 5,961-
I. Amount (US$ million)
11-9c. Commodity Trade with Major Trading Partners (Continued)
Malaysia United Kingdom Korea, Rep. of AustraliaPeriod
222
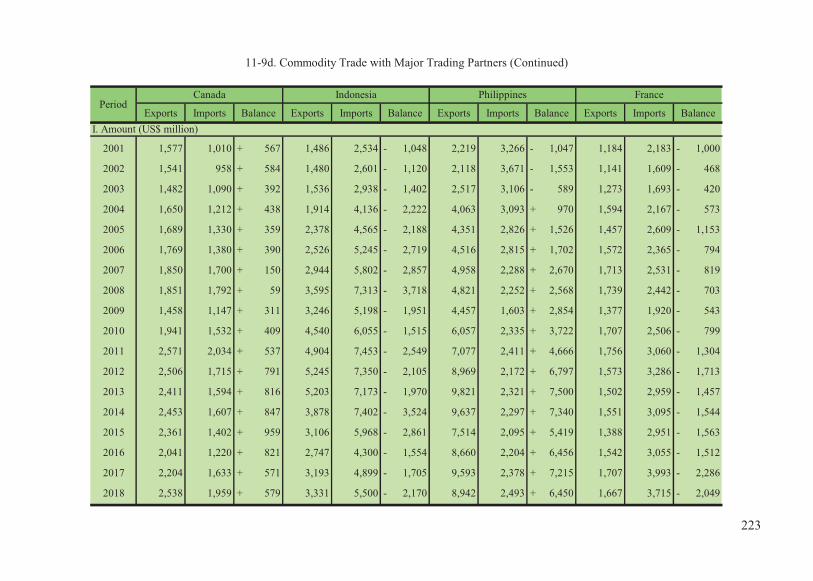
Exports Imports Balance Exports Imports Balance Exports Imports Balance Exports Imports Balance
2001 1,577 1,010 567+ 1,486 2,534 1,048- 2,219 3,266 1,047- 1,184 2,183 1,000-
2002 1,541 958 584+ 1,480 2,601 1,120- 2,118 3,671 1,553- 1,141 1,609 468-
2003 1,482 1,090 392+ 1,536 2,938 1,402- 2,517 3,106 589- 1,273 1,693 420-
2004 1,650 1,212 438+ 1,914 4,136 2,222- 4,063 3,093 970+ 1,594 2,167 573-
2005 1,689 1,330 359+ 2,378 4,565 2,188- 4,351 2,826 1,526+ 1,457 2,609 1,153-
2006 1,769 1,380 390+ 2,526 5,245 2,719- 4,516 2,815 1,702+ 1,572 2,365 794-
2007 1,850 1,700 150+ 2,944 5,802 2,857- 4,958 2,288 2,670+ 1,713 2,531 819-
2008 1,851 1,792 59+ 3,595 7,313 3,718- 4,821 2,252 2,568+ 1,739 2,442 703-
2009 1,458 1,147 311+ 3,246 5,198 1,951- 4,457 1,603 2,854+ 1,377 1,920 543-
2010 1,941 1,532 409+ 4,540 6,055 1,515- 6,057 2,335 3,722+ 1,707 2,506 799-
2011 2,571 2,034 537+ 4,904 7,453 2,549- 7,077 2,411 4,666+ 1,756 3,060 1,304-
2012 2,506 1,715 791+ 5,245 7,350 2,105- 8,969 2,172 6,797+ 1,573 3,286 1,713-
2013 2,411 1,594 816+ 5,203 7,173 1,970- 9,821 2,321 7,500+ 1,502 2,959 1,457-
2014 2,453 1,607 847+ 3,878 7,402 3,524- 9,637 2,297 7,340+ 1,551 3,095 1,544-
2015 2,361 1,402 959+ 3,106 5,968 2,861- 7,514 2,095 5,419+ 1,388 2,951 1,563-
2016 2,041 1,220 821+ 2,747 4,300 1,554- 8,660 2,204 6,456+ 1,542 3,055 1,512-
2017 2,204 1,633 571+ 3,193 4,899 1,705- 9,593 2,378 7,215+ 1,707 3,993 2,286-
2018 2,538 1,959 579+ 3,331 5,500 2,170- 8,942 2,493 6,450+ 1,667 3,715 2,049-
11-9d. Commodity Trade with Major Trading Partners (Continued)
I. Amount (US$ million)
FrancePeriod
Canada Indonesia Philippines
223

Exports Imports Balance Exports Imports Balance Exports Imports Balance Exports Imports Balance
2001 348 2,750 2,402- 574 446 127+ 5,021 5,970 950- 17,751 17,368 383+
2002 339 2,410 2,072- 475 586 112- 10,690 8,041 2,649+ 18,628 18,936 309-
2003 364 4,283 3,919- 458 919 461- 23,210 11,096 12,114+ 21,222 22,040 818-
2004 433 5,568 5,135- 718 1,338 620- 36,723 16,891 19,831+ 25,459 30,321 4,863-
2005 499 7,449 6,951- 1,019 1,221 202- 44,056 20,162 23,895+ 28,904 33,439 4,534-
2006 532 9,760 9,227- 1,288 1,069 219+ 52,377 24,909 27,468+ 32,732 40,975 8,244-
2007 735 10,403 9,668- 1,724 1,347 377+ 62,928 28,221 34,707+ 39,554 46,806 7,253-
2008 997 15,202 14,205- 2,747 2,198 549+ 67,516 31,580 35,936+ 44,154 57,047 12,893-
2009 675 8,677 8,003- 1,408 1,323 85+ 54,843 24,554 30,289+ 31,539 38,491 6,952-
2010 1,003 11,863 10,860- 1,908 2,456 548- 77,950 36,255 41,694+ 41,120 53,692 12,572-
2011 1,691 13,876 12,185- 2,366 3,027 661- 85,244 44,095 41,150+ 48,049 64,242 16,193-
2012 1,851 14,799 12,947- 1,994 3,126 1,132- 82,666 41,431 41,235+ 45,686 68,382 22,696-
2013 1,814 15,636 13,822- 1,840 2,820 981- 84,122 43,345 40,777+ 46,670 68,464 21,793-
2014 2,027 13,722 11,695- 1,676 2,354 678- 84,738 49,254 35,484+ 47,269 68,872 21,603-
2015 1,696 7,327 5,631- 1,170 2,268 1,098- 73,410 45,266 28,144+ 40,646 48,594 7,948-
2016 1,225 5,796 4,571- 954 1,951 996- 73,879 43,991 29,888+ 38,428 44,582 6,154-
2017 1,092 6,865 5,773- 1,265 2,598 1,333- 88,981 50,043 38,939+ 42,827 53,172 10,345-
2018 781 8,632 7,851- 1,345 1,642 297- 96,756 53,783 42,973+ 45,671 61,100 15,429-
11-9e. Commodity Trade with Major Trading Partners (Continued)
I. Amount (US$ million)
OthersPeriod
Saudi Arabia Brazil Mainland China
224

2001 100.0 22.2 22.7 10.3 3.3 3.6 1.7 3.4 2.5 2.7
2002 100.0 20.2 24.3 9.1 3.4 2.9 1.8 2.8 2.4 2.2
2003 100.0 17.6 20.5 8.2 3.5 2.8 1.8 2.8 2.1 1.9
2004 100.0 15.7 18.0 7.6 3.7 2.5 1.8 2.6 2.3 1.9
2005 100.0 14.6 17.1 7.6 4.1 2.2 1.9 2.2 2.2 1.6
2006 100.0 14.4 16.7 7.3 4.2 2.2 2.1 2.0 2.2 1.6
2007 100.0 12.9 15.4 6.5 4.3 2.1 2.1 1.8 2.2 1.5
2008 100.0 12.0 12.8 6.9 4.6 2.2 1.9 1.8 2.2 1.4
2009 100.0 11.5 14.5 7.1 4.2 2.3 1.9 2.1 2.0 1.5
2010 100.0 11.4 13.8 6.7 4.4 2.4 1.9 1.9 2.1 1.3
2011 100.0 11.7 13.0 6.1 5.4 2.2 2.0 1.5 2.2 1.5
2012 100.0 10.8 12.6 6.4 6.6 1.9 2.2 1.4 2.2 1.7
2013 100.0 10.5 13.2 6.2 6.3 1.8 2.1 1.4 2.6 1.4
2014 100.0 11.0 13.7 6.3 6.5 1.9 1.9 1.6 2.7 1.3
2015 100.0 12.1 13.7 6.9 6.1 2.1 2.0 1.5 2.5 1.4
2016 100.0 12.0 13.7 7.0 5.8 2.1 2.0 1.6 2.8 1.3
2017 100.0 11.6 13.0 6.6 5.6 2.0 2.0 1.6 3.3 1.2
2018 100.0 11.8 12.4 6.9 5.2 2.1 1.8 1.8 3.2 1.1
UnitedKingdom
II. Percentage (%)
11-9f. Commodity Trade with Major Trading Partners (Continued)A. Exports
Period Total U.S.A. HongKong
Japan Singapore Germany Thailand Netherlands Malaysia
225

2001 2.7 1.1 1.2 1.2 1.8 0.9 0.3 0.5 4.0 14.0
2002 2.9 1.2 1.1 1.1 1.6 0.8 0.2 0.3 7.9 13.7
2003 3.1 1.3 1.0 1.0 1.7 0.8 0.2 0.3 15.3 14.0
2004 3.1 1.2 0.9 1.0 2.2 0.9 0.2 0.4 20.0 13.9
2005 3.0 1.2 0.8 1.2 2.2 0.7 0.2 0.5 22.1 14.5
2006 3.2 1.2 0.8 1.1 2.0 0.7 0.2 0.6 23.2 14.5
2007 3.2 1.3 0.7 1.2 2.0 0.7 0.3 0.7 25.3 15.9
2008 3.4 1.4 0.7 1.4 1.9 0.7 0.4 1.1 26.2 17.1
2009 3.6 1.2 0.7 1.6 2.2 0.7 0.3 0.7 26.7 15.3
2010 3.9 1.2 0.7 1.6 2.2 0.6 0.4 0.7 28.0 14.8
2011 4.0 1.2 0.8 1.6 2.3 0.6 0.5 0.8 27.2 15.4
2012 4.0 1.2 0.8 1.7 2.9 0.5 0.6 0.7 27.0 14.9
2013 3.9 1.2 0.8 1.7 3.2 0.5 0.6 0.6 27.0 15.0
2014 4.1 1.2 0.8 1.2 3.0 0.5 0.6 0.5 26.5 14.8
2015 4.5 1.2 0.8 1.1 2.6 0.5 0.6 0.4 25.7 14.2
2016 4.6 1.1 0.7 1.0 3.1 0.6 0.4 0.3 26.4 13.7
2017 4.6 1.0 0.7 1.0 3.0 0.5 0.3 0.4 28.0 13.5
2018 4.8 1.1 0.8 1.0 2.7 0.5 0.2 0.4 28.8 13.6
II. Percentage (%)
A. Exports
Period Korea,Rep. of
MainlandChina
11-9g. Commodity Trade with Major Trading Partners (Continued)
Brazil OthersAustralia SaudiArabia
Canada Indonesia Philippines France
226
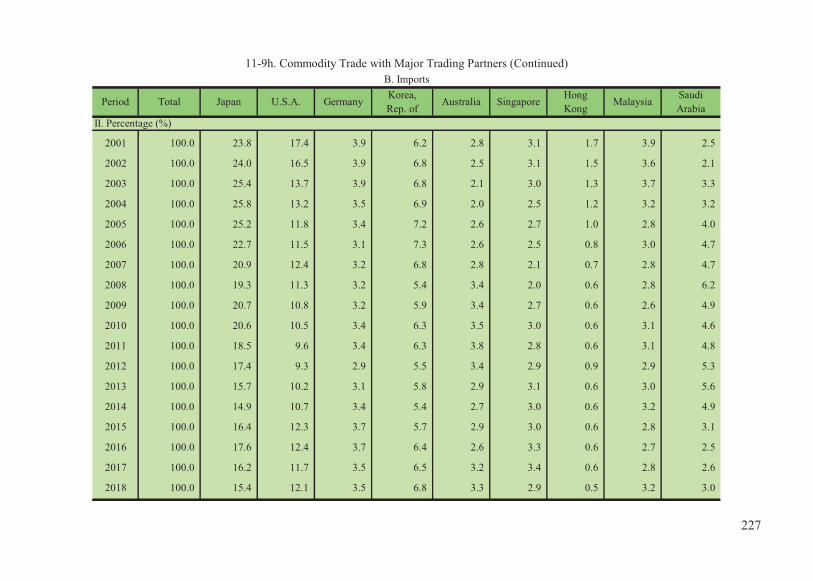
2001 100.0 23.8 17.4 3.9 6.2 2.8 3.1 1.7 3.9 2.5
2002 100.0 24.0 16.5 3.9 6.8 2.5 3.1 1.5 3.6 2.1
2003 100.0 25.4 13.7 3.9 6.8 2.1 3.0 1.3 3.7 3.3
2004 100.0 25.8 13.2 3.5 6.9 2.0 2.5 1.2 3.2 3.2
2005 100.0 25.2 11.8 3.4 7.2 2.6 2.7 1.0 2.8 4.0
2006 100.0 22.7 11.5 3.1 7.3 2.6 2.5 0.8 3.0 4.7
2007 100.0 20.9 12.4 3.2 6.8 2.8 2.1 0.7 2.8 4.7
2008 100.0 19.3 11.3 3.2 5.4 3.4 2.0 0.6 2.8 6.2
2009 100.0 20.7 10.8 3.2 5.9 3.4 2.7 0.6 2.6 4.9
2010 100.0 20.6 10.5 3.4 6.3 3.5 3.0 0.6 3.1 4.6
2011 100.0 18.5 9.6 3.4 6.3 3.8 2.8 0.6 3.1 4.8
2012 100.0 17.4 9.3 2.9 5.5 3.4 2.9 0.9 2.9 5.3
2013 100.0 15.7 10.2 3.1 5.8 2.9 3.1 0.6 3.0 5.6
2014 100.0 14.9 10.7 3.4 5.4 2.7 3.0 0.6 3.2 4.9
2015 100.0 16.4 12.3 3.7 5.7 2.9 3.0 0.6 2.8 3.1
2016 100.0 17.6 12.4 3.7 6.4 2.6 3.3 0.6 2.7 2.5
2017 100.0 16.2 11.7 3.5 6.5 3.2 3.4 0.6 2.8 2.6
2018 100.0 15.4 12.1 3.5 6.8 3.3 2.9 0.5 3.2 3.0
Period Total Japan U.S.A. Germany Australia Singapore Malaysia
II. Percentage (%)
11-9h. Commodity Trade with Major Trading Partners (Continued)B. ImportsKorea,Rep. of
HongKong
SaudiArabia
227

2001 2.3 1.4 2.0 0.9 1.4 2.0 0.4 5.4 3.0 15.8
2002 2.3 1.2 1.4 0.8 1.3 1.9 0.5 7.0 3.2 16.4
2003 2.3 1.1 1.3 0.8 1.0 1.8 0.7 8.5 2.4 16.9
2004 2.4 1.0 1.3 0.7 1.3 1.6 0.8 9.8 1.8 17.7
2005 2.5 0.9 1.4 0.7 1.1 1.6 0.7 10.9 1.5 18.0
2006 2.5 0.9 1.1 0.7 1.1 1.6 0.5 12.1 1.4 19.8
2007 2.6 0.9 1.1 0.8 1.2 1.6 0.6 12.6 1.0 21.0
2008 3.0 0.8 1.0 0.7 1.0 1.3 0.9 12.9 0.9 23.3
2009 2.9 0.7 1.1 0.6 1.1 1.5 0.7 13.8 0.9 21.7
2010 2.4 0.7 1.0 0.6 1.3 1.5 1.0 14.1 0.9 21.0
2011 2.6 0.7 1.1 0.7 1.0 1.5 1.1 15.3 0.8 22.3
2012 2.7 0.7 1.2 0.6 1.3 1.3 1.1 14.9 0.8 24.7
2013 2.6 0.7 1.1 0.6 1.7 1.4 1.0 15.6 0.8 24.6
2014 2.6 0.7 1.1 0.6 1.1 1.6 0.8 17.5 0.8 24.4
2015 2.5 0.8 1.2 0.6 1.2 1.7 1.0 19.1 0.9 20.5
2016 1.9 0.8 1.3 0.5 1.8 1.7 0.8 19.1 1.0 19.3
2017 1.9 0.8 1.5 0.6 1.3 1.7 1.0 19.3 0.9 20.5
2018 1.9 0.7 1.3 0.7 1.4 1.6 0.6 18.8 0.9 21.3
MainlandChina
Philippines Others
II. Percentage (%)
Period Indonesia UnitedKingdom
BrazilFrance Canada Netherlands Thailand
11-9i. Commodity Trade with Major Trading Partners (Continued)B. Imports
228

Exports Imports Balance Exports Imports Balance Exports Imports Balance
2001 126,612 109,588 17,024+ 67,484 58,180 9,304+ 19,989 15,168 4,821+
2002 135,774 115,116 20,659+ 78,464 63,320 15,144+ 18,808 14,851 3,957+
2003 151,345 130,249 21,096+ 91,689 73,924 17,765+ 20,765 16,459 4,306+
2004 183,643 171,554 12,089+ 116,171 97,596 18,575+ 23,820 21,520 2,300+
2005 199,761 185,438 14,323+ 130,123 105,458 24,665+ 23,642 22,142 1,499+
2006 225,904 206,442 19,462+ 148,272 118,014 30,258+ 26,151 21,918 4,233+
2007 248,792 223,115 25,677+ 165,945 123,172 42,773+ 28,751 23,996 4,755+
2008 258,051 244,467 13,585+ 171,341 126,940 44,401+ 30,024 24,982 5,042+
2009 205,663 177,598 28,065+ 141,604 100,173 41,431+ 22,726 19,776 2,949+
2010 278,008 256,274 21,734+ 193,556 145,461 48,096+ 29,546 26,934 2,612+
2011 312,923 288,062 24,861+ 216,697 160,932 55,765+ 31,427 30,775 652+
2012 306,409 277,324 29,085+ 215,667 149,624 66,043+ 28,897 29,507 610-
2013 311,428 278,010 33,418+ 221,886 148,190 73,696+ 27,906 31,012 3,106-
2014 320,092 281,850 38,242+ 227,572 153,817 73,755+ 29,122 32,045 2,923-
2015 285,344 237,219 48,124+ 201,677 136,448 65,228+ 25,964 28,499 2,535-
2016 280,321 230,568 49,753+ 200,709 138,219 62,490+ 26,221 28,924 2,704-
2017 317,249 259,266 57,983+ 229,712 153,572 76,139+ 29,155 31,423 2,268-
2018 335,909 286,333 49,576+ 241,895 168,082 73,814+ 31,570 34,577 3,006-
Source: See Table 11-2a.
11-10a. Foreign Trade with Various ContinentsUnit: US$ million
PeriodTotal Asia Europe
229

Exports Imports Balance Exports Imports Balance Exports Imports Balance
2001 29,706 20,104 9,602+ 1,793 491 1,302+ 1,446 1,054 391+
2002 28,917 19,987 8,930+ 1,789 466 1,323+ 1,145 1,448 303-
2003 28,060 18,893 9,168+ 1,694 494 1,200+ 1,198 1,929 731-
2004 30,466 23,837 6,630+ 1,802 649 1,152+ 1,613 2,977 1,363-
2005 30,855 23,221 7,634+ 1,793 667 1,126+ 2,183 2,967 784-
2006 34,244 25,223 9,022+ 2,133 958 1,175+ 2,520 3,406 886-
2007 34,016 29,347 4,669+ 2,358 1,185 1,173+ 3,228 3,923 695-
2008 32,834 29,393 3,440+ 2,774 1,321 1,453+ 4,439 5,236 798-
2009 25,168 20,354 4,814+ 1,755 825 930+ 2,682 3,196 514-
2010 33,617 28,344 5,273+ 2,423 1,526 897+ 3,594 5,522 1,928-
2011 39,131 29,816 9,315+ 2,488 1,627 860+ 4,533 6,152 1,618-
2012 35,730 27,431 8,300+ 2,751 1,587 1,164+ 4,184 5,903 1,719-
2013 35,041 30,025 5,016+ 2,745 2,364 381+ 3,906 5,371 1,465-
2014 37,568 31,667 5,901+ 2,990 2,045 945+ 3,611 5,064 1,453-
2015 36,905 30,620 6,284+ 3,192 1,518 1,675+ 2,778 4,398 1,621-
2016 35,565 29,844 5,721+ 2,867 1,561 1,305+ 2,291 3,689 1,399-
2017 39,147 31,892 7,256+ 3,088 1,628 1,459+ 2,630 4,638 2,008-
2018 42,233 36,707 5,526+ 3,341 1,796 1,545+ 2,753 3,619 867-
11-10b. Foreign Trade with Various Continents (Continued)
PeriodNorth America South AmericaCentral America
Unit: US$ million
230

Exports Imports Balance Exports Imports Balance Exports Imports Balance Exports Imports Balance
2001 1,191 2,667 1,475- 2,254 6,611 4,357- 1,746 3,545 1,798- 1,003 1,768 765-
2002 1,186 2,139 953- 2,426 7,261 4,835- 1,954 3,287 1,334- 1,087 2,356 1,269-
2003 1,385 2,718 1,333- 2,768 10,434 7,666- 2,473 3,242 769- 1,312 2,155 844-
2004 1,550 4,143 2,593- 3,752 14,046 10,294- 2,906 4,060 1,154- 1,563 2,726 1,164-
2005 1,668 3,618 1,950- 4,231 19,177 14,947- 3,040 5,402 2,362- 2,228 2,786 558-
2006 2,096 5,548 3,452- 4,554 24,931 20,377- 3,395 6,124 2,729- 2,540 320 2,219+
2007 2,158 6,182 4,023- 5,671 27,839 22,168- 4,053 7,144 3,091- 2,612 329 2,283+
2008 2,889 8,005 5,117- 5,803 38,997 33,194- 4,531 9,209 4,678- 3,417 382 3,034+
2009 2,255 3,832 1,577- 4,625 22,573 17,949- 2,944 6,590 3,645- 1,904 277 1,626+
2010 2,251 7,016 4,764- 6,269 31,436 25,167- 4,046 9,914 5,868- 2,705 121 2,584+
2011 2,968 10,600 7,632- 7,590 36,058 28,468- 4,597 11,991 7,394- 3,494 113 3,381+
2012 3,647 9,485 5,838- 7,401 43,305 35,904- 4,801 10,375 5,574- 3,333 108 3,224+
2013 3,385 8,257 4,872- 7,614 43,647 36,034- 5,027 9,051 4,024- 3,918 93 3,825+
2014 2,831 7,387 4,556- 8,324 40,321 31,997- 4,669 9,434 4,765- 3,405 70 3,336+
2015 2,453 3,379 926- 7,000 23,813 16,812- 4,262 8,469 4,207- 1,113 75 1,038+
2016 1,921 3,031 1,110- 5,942 17,712 11,770- 3,844 7,502 3,658- 962 85 877+
2017 1,878 3,755 1,877- 6,400 22,199 15,799- 4,043 10,065 6,022- 1,196 94 1,102+
2018 2,113 2,541 429- 6,068 27,614 21,546- 4,435 11,294 6,859- 1,501 102 1,399+
11-10c. Foreign Trade with Various Continents (Continued)Unit: US$ million
PeriodOceania Other RegionsAfrica Middle East
231

(By CCC) Unit: US$ million
Period Total FisheryProducts
PreparedFoodstuffs; Beverages,Spirits and TobaccoProducts
MineralProducts Chemicals
Plastic andArticlesThereof
Rubber andArticlesThereof
Textiles andTextileArticles
Articles ofStone, Plaster,
Cement;CeramicProducts;
Glass andGlassware
Base Metalsand Articles
of Base Metal
2001 126,612.2 1,038.6 503.0 1,945.1 4,271.4 6,986.0 1,039.5 12,646.8 892.5 11,360.8
2002 135,774.4 1,132.8 481.7 2,317.1 4,838.5 7,702.0 1,139.8 12,163.1 939.6 12,571.7
2003 151,344.9 1,239.7 490.0 3,573.0 5,919.6 8,732.7 1,309.0 11,893.0 994.4 14,386.9
2004 183,642.5 1,403.8 550.2 5,761.8 8,067.2 11,084.4 1,567.6 12,563.5 1,224.1 18,425.2
2005 199,760.9 1,439.9 565.5 9,279.5 10,213.8 12,880.0 1,858.2 11,834.2 1,253.2 20,467.4
2006 225,904.2 1,149.6 577.9 11,269.0 11,421.9 13,946.1 1,984.9 11,785.9 1,405.3 24,035.3
2007 248,792.0 1,121.0 655.4 14,207.8 15,030.9 16,717.9 2,233.9 11,609.9 1,463.7 27,843.5
2008 258,051.4 1,400.5 770.7 19,187.0 17,524.0 17,231.9 2,516.3 10,888.6 1,495.9 28,327.6
2009 205,662.5 1,089.0 831.4 11,686.8 14,162.8 14,654.7 1,921.1 9,336.7 1,381.5 19,407.1
2010 278,008.2 1,355.3 1,099.7 14,865.9 19,568.5 19,700.0 2,633.8 11,307.1 1,939.1 25,994.4
2011 312,922.9 1,704.7 1,319.8 18,150.1 22,783.6 22,012.2 3,318.5 12,714.8 2,617.7 30,316.5
2012 306,409.2 1,914.0 1,519.4 22,375.2 21,194.6 21,178.3 3,180.4 11,843.7 2,948.4 28,248.2
2013 311,428.0 1,714.8 1,791.6 24,314.5 21,826.9 22,104.0 2,871.4 11,726.7 2,684.5 27,748.2
2014 320,092.1 1,779.9 1,912.5 21,437.6 22,186.6 21,599.0 2,760.6 11,615.4 2,720.2 29,121.7
2015 285,343.6 1,612.3 1,855.1 12,075.3 18,180.7 18,627.2 2,503.6 10,824.8 2,354.1 25,474.7
2016 280,321.4 1,554.5 1,917.8 10,959.3 17,150.7 17,572.7 2,348.7 9,930.0 2,275.2 24,531.7
2017 317,249.1 1,744.1 2,207.0 11,804.6 19,375.9 20,275.7 2,700.7 10,076.4 2,364.4 29,044.4
2018 335,908.6 1,839.3 2,488.3 14,529.7 22,151.4 22,441.0 2,837.0 10,076.1 2,446.1 31,643.0
Note: CCC refers to the Customs Import Tariff and Import and Export Commodity Classification of the Republic of China.Source: See Table 11-2a.
11-11a. Value of Principal Exports
232

11-11b. Value of Principal Exports (Continued)(By CCC)
PeriodParts of
ElectronicProduct
MachineryElectrical
MachineryProducts
Information,Communica-
tion andAudio-video
Products
DomesticAppliances
Vehicles,Aircraft,
Vessels & AssociatedTransport
Equipment
Optical,Precision
Instruments;Clocks and Watches;Musical
instruments
Toys, Gamesand Sports Requisites;Parts and
AccessoriesThereof
Furniture Others
2001 21,070.2 10,099.3 6,463.6 31,388.9 932.3 4,495.4 3,565.7 1,739.9 1,312.2 4,861.0
2002 23,420.5 11,569.6 7,820.1 31,176.0 910.1 4,874.9 4,951.2 1,731.9 1,198.8 4,835.0
2003 28,406.2 12,801.4 8,335.5 30,881.2 842.0 5,722.0 7,994.0 1,733.8 1,196.6 4,893.9
2004 37,415.0 15,396.5 10,637.7 31,611.1 729.1 6,553.2 12,240.3 1,854.5 1,265.7 5,291.6
2005 41,233.1 15,744.2 11,601.1 29,974.9 780.9 7,329.0 14,354.1 1,820.0 1,281.8 5,850.1
2006 52,464.1 16,584.0 13,221.1 29,874.2 840.0 7,409.6 18,423.3 1,774.6 1,287.1 6,450.3
2007 55,342.3 17,647.1 17,099.8 28,747.6 835.8 8,050.0 19,957.4 1,850.2 1,353.8 7,024.0
2008 55,342.2 17,996.9 15,999.8 25,810.0 894.2 9,121.2 21,880.6 1,802.6 1,353.0 8,508.4
2009 50,032.7 12,545.7 11,785.8 21,696.7 685.5 7,747.4 16,120.5 1,517.7 1,088.0 7,971.4
2010 69,091.5 18,630.2 14,342.1 31,205.3 711.7 9,339.8 23,659.7 1,896.3 1,354.8 9,313.0
2011 75,472.5 22,545.1 12,548.3 36,761.8 745.7 10,304.4 23,966.2 2,039.5 1,468.4 12,133.1
2012 75,216.2 22,513.2 12,853.6 31,553.4 711.2 11,114.3 23,443.9 2,181.8 1,542.3 10,877.1
2013 80,595.4 21,548.1 13,725.9 31,073.0 673.4 11,043.1 22,723.1 2,168.6 1,539.6 9,555.2
2014 90,159.3 22,910.9 13,280.2 31,007.1 714.2 11,699.1 21,184.1 2,262.9 1,666.1 10,074.7
2015 85,912.7 21,515.5 11,830.6 30,478.9 654.3 11,772.6 16,416.7 2,118.4 1,637.9 9,498.2
2016 92,798.0 21,149.4 9,520.2 30,181.4 594.8 10,837.6 15,239.1 2,115.2 1,584.3 8,060.8
2017 107,199.7 25,564.9 10,449.8 34,106.2 588.8 10,891.5 16,738.0 2,159.0 1,665.2 8,292.8
2018 110,770.9 27,390.7 10,933.1 35,330.3 603.6 11,262.3 16,400.7 2,256.2 1,736.5 8,772.4
Unit: US$ million
233
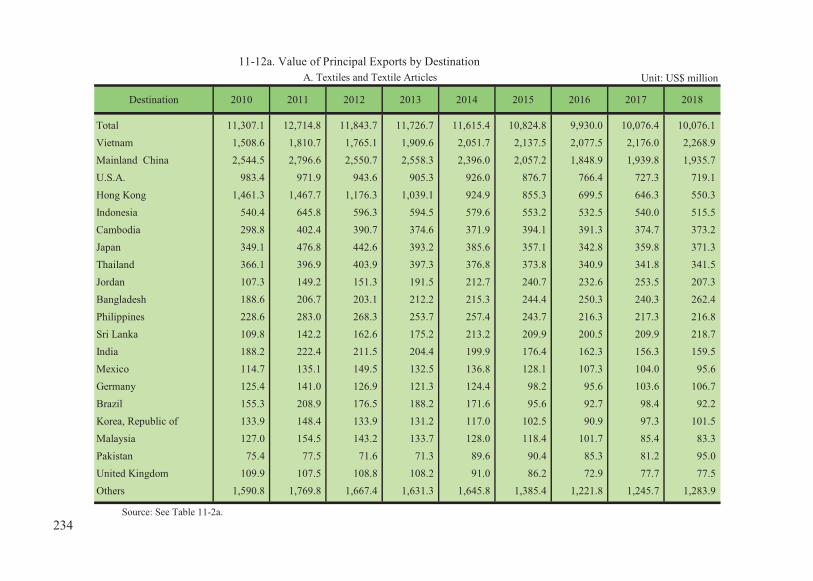
Unit: US$ million
Destination 2010 2011 2012 2013 2014 2015 2016 2017 2018
Total 11,307.1 12,714.8 11,843.7 11,726.7 11,615.4 10,824.8 9,930.0 10,076.4 10,076.1 Vietnam 1,508.6 1,810.7 1,765.1 1,909.6 2,051.7 2,137.5 2,077.5 2,176.0 2,268.9 Mainland China 2,544.5 2,796.6 2,550.7 2,558.3 2,396.0 2,057.2 1,848.9 1,939.8 1,935.7 U.S.A. 983.4 971.9 943.6 905.3 926.0 876.7 766.4 727.3 719.1 Hong Kong 1,461.3 1,467.7 1,176.3 1,039.1 924.9 855.3 699.5 646.3 550.3 Indonesia 540.4 645.8 596.3 594.5 579.6 553.2 532.5 540.0 515.5 Cambodia 298.8 402.4 390.7 374.6 371.9 394.1 391.3 374.7 373.2 Japan 349.1 476.8 442.6 393.2 385.6 357.1 342.8 359.8 371.3 Thailand 366.1 396.9 403.9 397.3 376.8 373.8 340.9 341.8 341.5 Jordan 107.3 149.2 151.3 191.5 212.7 240.7 232.6 253.5 207.3 Bangladesh 188.6 206.7 203.1 212.2 215.3 244.4 250.3 240.3 262.4 Philippines 228.6 283.0 268.3 253.7 257.4 243.7 216.3 217.3 216.8 Sri Lanka 109.8 142.2 162.6 175.2 213.2 209.9 200.5 209.9 218.7 India 188.2 222.4 211.5 204.4 199.9 176.4 162.3 156.3 159.5 Mexico 114.7 135.1 149.5 132.5 136.8 128.1 107.3 104.0 95.6 Germany 125.4 141.0 126.9 121.3 124.4 98.2 95.6 103.6 106.7 Brazil 155.3 208.9 176.5 188.2 171.6 95.6 92.7 98.4 92.2 Korea, Republic of 133.9 148.4 133.9 131.2 117.0 102.5 90.9 97.3 101.5 Malaysia 127.0 154.5 143.2 133.7 128.0 118.4 101.7 85.4 83.3 Pakistan 75.4 77.5 71.6 71.3 89.6 90.4 85.3 81.2 95.0 United Kingdom 109.9 107.5 108.8 108.2 91.0 86.2 72.9 77.7 77.5 Others 1,590.8 1,769.8 1,667.4 1,631.3 1,645.8 1,385.4 1,221.8 1,245.7 1,283.9
Source: See Table 11-2a.
11-12a. Value of Principal Exports by DestinationA. Textiles and Textile Articles
234

B. Plastics and Articles Thereof; Rubber and Articles ThereofDestination 2010 2011 2012 2013 2014 2015 2016 2017 2018
Total 22,333.8 25,330.7 24,358.7 24,975.4 24,359.5 21,130.8 19,921.4 22,976.4 25,278.0Mainland China 8,225.8 8,830.3 8,621.7 9,130.5 8,540.0 6,962.9 6,488.7 7,779.3 8,520.4United States 1,833.3 2,095.1 2,223.2 2,274.8 2,439.8 2,542.4 2,451.2 2,704.8 2,783.9Hong Kong 3,066.2 2,758.3 2,200.7 1,954.6 1,781.0 1,449.9 1,238.4 1,482.1 1,487.1Japan 1,237.7 1,699.9 1,747.6 1,623.7 1,522.4 1,304.7 1,226.6 1,462.8 1,915.6Vietnam 809.8 1,036.9 989.2 1,110.5 1,234.2 1,136.0 1,140.1 1,323.4 1,591.8India 687.3 693.0 691.1 776.9 747.6 696.2 679.5 710.1 854.7Korea, Republic of 308.8 455.5 494.6 495.7 521.2 457.3 464.9 601.2 654.3Malaysia 454.6 585.5 557.3 540.8 549.4 530.6 485.8 547.5 617.5Others 5,710.3 7,176.2 6,833.4 7,067.8 7,023.8 6,050.9 5,746.2 6,365.3 6,852.8
C. Base Metals and Articles of Base MetalDestination 2010 2011 2012 2013 2014 2015 2016 2017 2018
Total 25,994.4 30,316.5 28,248.2 27,748.2 29,121.7 25,474.7 24,531.7 29,044.4 31,643.0Mainland China 5,363.0 5,847.1 5,189.1 5,011.8 5,056.7 4,675.2 4,510.7 5,828.2 6,044.0U.S.A. 3,951.3 4,637.7 5,005.7 4,933.8 5,717.8 5,360.1 5,097.2 5,768.7 6,340.4Japan 1,713.6 2,218.5 2,076.3 1,954.4 2,087.1 1,794.7 1,762.9 2,158.9 2,297.6Vietnam 1,072.5 1,265.0 1,031.4 1,090.3 1,237.9 1,032.0 1,147.7 1,407.1 1,431.3Thailand 967.4 1,184.7 1,270.0 1,265.3 1,214.1 1,109.3 1,126.2 1,168.4 1,203.8Korea, Republic of 962.9 1,183.6 925.6 994.8 956.9 747.5 724.2 1,023.3 909.4Germany 644.5 897.3 773.7 807.8 905.1 789.4 811.2 894.5 1,001.8Malaysia 965.9 1,058.1 979.7 922.3 894.5 759.8 729.0 875.4 981.9Hong Kong 1,884.4 1,807.4 1,322.2 1,161.5 1,060.9 799.6 653.4 685.1 707.1Australia 723.2 766.1 770.2 708.6 710.5 607.3 588.0 670.3 774.5Others 7,745.7 9,450.9 8,904.4 8,897.4 9,280.2 7,799.9 7,381.1 8,564.5 9,951.1
11-12b. Value of Principal Exports by Destination (Continued)Unit: US$ million
Unit: US$ million
235

Destination 2010 2011 2012 2013 2014 2015 2016 2017 2018
Total 50,703.0 56,398.9 58,393.5 64,132.7 72,722.7 70,038.6 78,171.9 92,307.8 95,906.5Mainland China 11,627.1 12,977.3 12,405.6 13,299.4 15,473.8 14,798.8 19,932.3 26,408.9 30,404.6Hong Kong 14,940.8 15,801.9 17,031.8 20,096.0 22,664.7 20,372.9 23,160.1 24,793.4 25,185.7Singapore 6,907.2 10,343.6 11,342.5 11,765.8 13,187.5 11,587.3 10,954.6 12,775.9 11,691.4Japan 5,665.1 3,898.7 4,057.4 4,635.8 5,009.7 6,446.5 6,741.2 6,869.5 7,246.5Korea, Republic of 4,276.6 5,578.3 5,996.9 6,112.3 6,686.1 7,312.6 6,560.2 6,811.4 6,508.0Malaysia 1,612.3 1,799.1 1,890.0 2,240.6 2,462.3 2,203.2 3,375.9 5,360.1 5,313.1Philippines 1,825.7 1,867.3 1,663.4 1,691.9 2,058.2 2,037.1 2,224.6 2,793.2 2,817.6U.S.A. 1,240.6 1,405.9 1,205.4 1,355.8 1,448.3 1,544.0 1,328.8 1,420.5 1,504.7Others 2,607.6 2,726.8 2,800.5 2,935.0 3,732.2 3,736.3 3,894.2 5,074.9 5,234.8
Destination 2010 2011 2012 2013 2014 2015 2016 2017 2018
Total 5,374.6 6,170.3 5,955.5 5,789.8 5,813.8 5,480.5 4,925.8 5,544.7 5,591.8Mainland China 1,774.4 2,488.5 2,551.4 2,332.1 2,461.0 2,316.0 1,959.0 2,465.9 2,514.0Hong Kong 1,122.5 1,014.2 917.1 881.4 802.4 705.8 569.5 687.5 792.4U.S.A. 407.7 431.9 451.7 470.7 450.6 479.5 453.3 465.8 454.0Korea, Republic of 395.4 458.3 483.5 461.0 455.2 346.9 355.6 378.3 380.2Malaysia 264.3 351.0 232.5 299.0 314.3 287.3 316.3 321.0 356.8Japan 228.9 209.8 185.5 193.9 218.0 245.9 258.8 236.9 155.0Germany 140.1 151.9 150.8 129.7 130.4 121.7 120.4 139.2 135.9Philippines 205.1 184.0 191.1 173.1 148.9 127.9 113.9 121.5 113.4Thailand 157.6 151.4 141.1 124.2 125.3 160.4 104.4 111.9 110.5Mexico 35.6 48.0 67.4 80.7 84.8 88.7 91.6 100.9 98.4Others 643.1 681.3 583.4 644.0 622.8 600.4 583.1 515.9 481.3
D. Electronic Integrated Circuits Unit: US$ million
E. Printed Circuits Unit: US$ million
11-12c. Value of Principal Exports by Destination (Continued)
236

F. Products of Iron or Non-Alloy Steel
Destination 2010 2011 2012 2013 2014 2015 2016 2017 2018
Total 5,879.9 6,979.8 6,459.4 6,381.6 6,537.5 4,903.3 4,673.3 5,728.8 6,411.5 Mainland China 1,194.8 1,216.1 1,003.9 997.1 1,017.4 720.2 647.7 771.9 804.4 Vietnam 464.1 552.5 442.4 499.7 586.3 453.4 564.9 723.3 766.5 U.S.A. 313.1 396.2 520.3 486.1 789.1 642.6 654.4 702.1 442.9 Japan 505.5 689.2 584.6 546.4 595.5 435.7 391.5 519.2 560.2 Malaysia 522.6 525.7 504.9 505.3 473.8 404.0 383.7 463.8 546.4 Thailand 317.4 403.3 433.6 491.2 432.2 356.0 387.2 300.6 303.6 Korea, Republic of 310.0 444.6 295.5 209.1 142.8 113.9 136.6 289.6 199.0 Others 2,252.4 2,752.2 2,674.3 2,646.8 2,500.4 1,777.5 1,507.4 1,958.2 2,788.6
G. Machine Tools for Metal or Metal Carbides
Destination 2010 2011 2012 2013 2014 2015 2016 2017 2018
Total 2,972.0 4,008.4 4,265.3 3,556.8 3,771.1 3,205.4 2,894.5 3,339.6 3,655.4 Mainland China 1,261.0 1,420.7 1,454.1 1,139.7 1,229.2 956.4 890.5 1,131.7 1,154.7 U.S.A. 162.9 352.7 531.8 402.0 414.8 378.8 346.6 369.9 477.7 Turkey 115.3 199.8 204.0 175.4 208.4 172.2 146.1 142.5 159.2 Germany 67.0 143.6 131.6 118.9 129.7 114.8 109.8 123.6 117.0 Thailand 123.1 176.9 266.0 225.2 168.4 115.9 107.2 121.0 138.1 India 136.9 141.7 116.1 86.3 97.4 93.4 92.8 110.1 158.1 Vietnam 65.6 88.2 71.0 69.5 86.4 102.1 98.9 108.1 122.6 Korea, Republic of 91.3 103.9 86.1 97.5 88.6 86.3 71.3 99.6 78.6 Others 948.9 1,380.7 1,404.5 1,242.2 1,348.3 1,185.5 1,031.4 1,133.0 1,249.4
11-12d. Value of Principal Exports by Destination (Continued)Unit: US$ million
Unit: US$ million
237
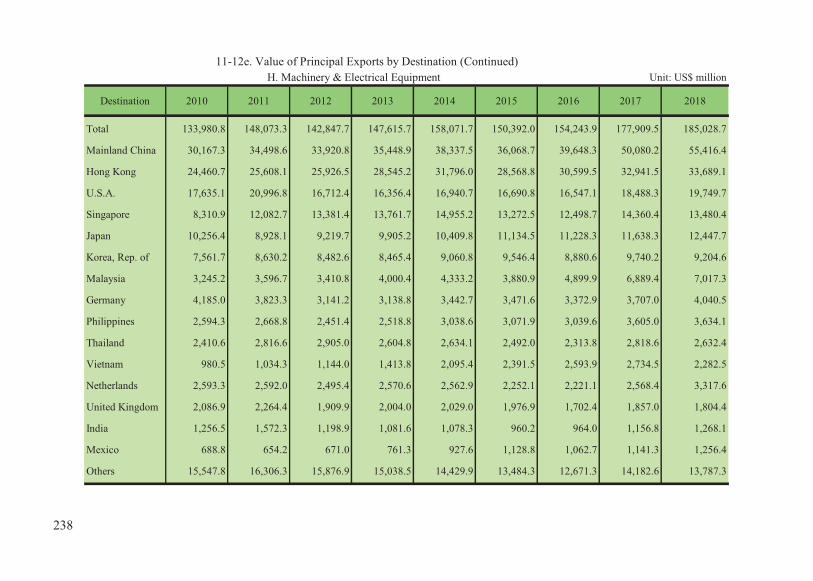
Destination 2010 2011 2012 2013 2014 2015 2016 2017 2018
Total 133,980.8 148,073.3 142,847.7 147,615.7 158,071.7 150,392.0 154,243.9 177,909.5 185,028.7
Mainland China 30,167.3 34,498.6 33,920.8 35,448.9 38,337.5 36,068.7 39,648.3 50,080.2 55,416.4
Hong Kong 24,460.7 25,608.1 25,926.5 28,545.2 31,796.0 28,568.8 30,599.5 32,941.5 33,689.1
U.S.A. 17,635.1 20,996.8 16,712.4 16,356.4 16,940.7 16,690.8 16,547.1 18,488.3 19,749.7
Singapore 8,310.9 12,082.7 13,381.4 13,761.7 14,955.2 13,272.5 12,498.7 14,360.4 13,480.4
Japan 10,256.4 8,928.1 9,219.7 9,905.2 10,409.8 11,134.5 11,228.3 11,638.3 12,447.7
Korea, Rep. of 7,561.7 8,630.2 8,482.6 8,465.4 9,060.8 9,546.4 8,880.6 9,740.2 9,204.6
Malaysia 3,245.2 3,596.7 3,410.8 4,000.4 4,333.2 3,880.9 4,899.9 6,889.4 7,017.3
Germany 4,185.0 3,823.3 3,141.2 3,138.8 3,442.7 3,471.6 3,372.9 3,707.0 4,040.5
Philippines 2,594.3 2,668.8 2,451.4 2,518.8 3,038.6 3,071.9 3,039.6 3,605.0 3,634.1
Thailand 2,410.6 2,816.6 2,905.0 2,604.8 2,634.1 2,492.0 2,313.8 2,818.6 2,632.4
Vietnam 980.5 1,034.3 1,144.0 1,413.8 2,095.4 2,391.5 2,593.9 2,734.5 2,282.5
Netherlands 2,593.3 2,592.0 2,495.4 2,570.6 2,562.9 2,252.1 2,221.1 2,568.4 3,317.6
United Kingdom 2,086.9 2,264.4 1,909.9 2,004.0 2,029.0 1,976.9 1,702.4 1,857.0 1,804.4
India 1,256.5 1,572.3 1,198.9 1,081.6 1,078.3 960.2 964.0 1,156.8 1,268.1
Mexico 688.8 654.2 671.0 761.3 927.6 1,128.8 1,062.7 1,141.3 1,256.4
Others 15,547.8 16,306.3 15,876.9 15,038.5 14,429.9 13,484.3 12,671.3 14,182.6 13,787.3
11-12e. Value of Principal Exports by Destination (Continued)Unit: US$ millionH. Machinery & Electrical Equipment
238

Unit: US$ million
Item 2010 2011 2012 2013 2014 2015 2016 2017 2018
Total 31,675 36,558 33,224 32,630 35,114 34,543 33,523 36,942 39,693Live Animals; Animal Products 146 159 155 130 144 145 149 175 135Vegetable Products 61 71 75 83 94 93 92 99 100Animal or Vegetable Fats and Oils and their Cleavage Products 14 14 17 16 18 16 15 16 18Prepared Foodstuffs; Beverages, Spirits and Tobacco Products 159 187 206 224 231 228 247 270 301
Mineral Products 494 294 293 32 144 173 56 117 215Chemicals 818 870 969 930 1,122 994 1,022 1,247 1,300Plastics & Articles Thereof; Rubber & Articles Thereof 1,833 2,095 2,223 2,275 2,440 2,542 2,451 2,705 2,784Fur and Articles Thereof 44 55 63 58 59 61 55 53 58Wood and Articles Thereof 35 41 39 41 37 42 41 44 38Pulp, Paper and Printing Products 122 130 160 163 165 182 192 199 219
Textiles and Textile Articles 983 972 944 905 926 877 766 727 719
Footwear, Headgear, Umbrellas; Artificial Flowers; Articles of Human Hair
81 88 86 74 88 99 94 99 104
Articles of Stone, Plaster, Cement; Ceramic Products; Glass & Glassware
219 247 251 265 278 291 271 283 317
Pearls, Precious Stones, Precious Metals; Imitation Jewellery; Coin
125 149 118 136 151 129 101 76 91
Base Metals and Articles of Base Metal 3,951 4,638 5,006 4,934 5,718 5,360 5,097 5,769 6,340
Machinery & Electrical Equipment 17,635 20,997 16,712 16,356 16,941 16,691 16,547 18,488 19,750
Vehicles, Aircraft, Vessels & Associated Transport Equipment 2,263 2,540 2,816 2,808 3,038 3,159 2,996 3,122 3,424
Optical, Precision Instruments; Clocks and Watches; Musical Instruments
1,058 1,293 1,254 1,372 1,517 1,367 1,261 1,247 1,440
Others 1,634 1,717 1,836 1,827 2,004 2,095 2,070 2,207 2,339
Source: See Table 11-2a.
11-13a. Exports by Countries of DestinationA. United States
239

Unit: US$ million
Item 2010 2011 2012 2013 2014 2015 2016 2017 2018
Total 18,645 19,242 19,624 19,391 20,142 19,592 19,551 20,782 23,082Live Animals; Animal Products 563 633 697 493 510 474 518 593 615
Vegetable Products 165 185 199 186 179 169 164 169 188
Animal or Vegetable Fats and Oils and their Cleavage Products 10 16 19 17 12 10 8 7 9
Prepared Foodstuffs; Beverages, Spirits and Tobacco Products 97 96 83 64 66 76 67 75 88
Mineral Products 129 183 363 268 346 129 227 124 607
Chemicals 1,367 1,570 1,469 1,443 1,628 1,399 1,289 1,396 1,601
Plastics & Articles Thereof; Rubber & Articles Thereof 1,238 1,700 1,748 1,624 1,522 1,305 1,227 1,463 1,916
Fur and Articles Thereof 33 42 49 41 39 39 30 29 29
Wood and Articles Thereof 54 63 60 66 56 39 36 27 31
Pulp, Paper and Printing Products 85 97 130 89 72 67 88 115 114
Textiles and Textile Articles 349 477 443 393 386 357 343 360 371
Footwear, Headgear, Umbrellas; Artificial Flowers; Articles of Human Hair
35 38 42 42 45 40 38 36 39
Articles of Stone, Plaster, Cement; Ceramic Products; Glass & Glassware
435 467 568 472 396 273 258 268 299
Pearls, Precious Stones, Precious Metals; Imitation Jewellery; Coin
260 399 290 236 240 249 266 221 264
Base Metals and Articles of Base Metal 1,714 2,219 2,076 1,954 2,087 1,795 1,763 2,159 2,298
Machinery & Electrical Equipment 10,256 8,928 9,220 9,905 10,410 11,135 11,228 11,638 12,448
Vehicles, Aircraft, Vessels & Associated Transport Equipment 530 655 630 621 643 589 535 558 560
Optical, Precision Instruments; Clocks and Watches; Musical Instruments
827 861 877 790 818 808 837 896 953
Others 500 613 660 686 688 639 631 648 654
11-13b. Exports by Countries of Destination (Continued)B. Japan
240
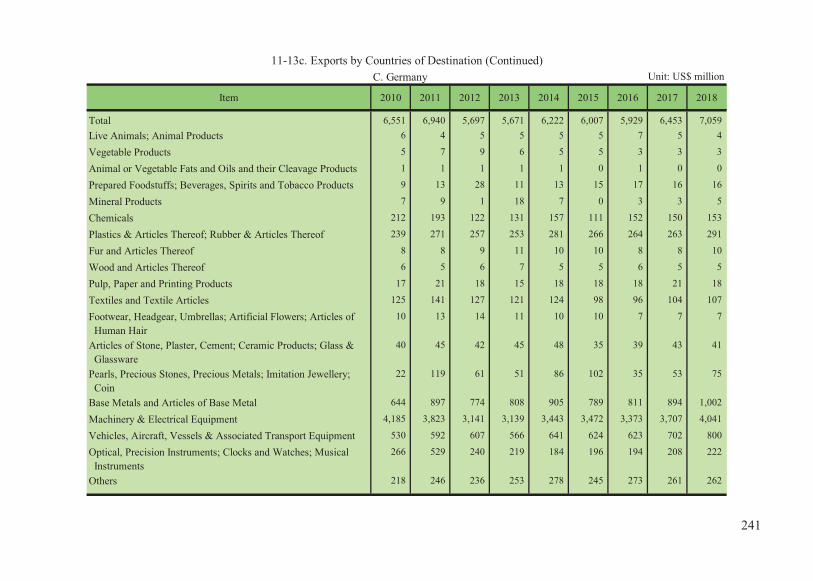
C. Germany
Item 2010 2011 2012 2013 2014 2015 2016 2017 2018
Total 6,551 6,940 5,697 5,671 6,222 6,007 5,929 6,453 7,059Live Animals; Animal Products 6 4 5 5 5 5 7 5 4
Vegetable Products 5 7 9 6 5 5 3 3 3
Animal or Vegetable Fats and Oils and their Cleavage Products 1 1 1 1 1 0 1 0 0
Prepared Foodstuffs; Beverages, Spirits and Tobacco Products 9 13 28 11 13 15 17 16 16
Mineral Products 7 9 1 18 7 0 3 3 5
Chemicals 212 193 122 131 157 111 152 150 153
Plastics & Articles Thereof; Rubber & Articles Thereof 239 271 257 253 281 266 264 263 291
Fur and Articles Thereof 8 8 9 11 10 10 8 8 10
Wood and Articles Thereof 6 5 6 7 5 5 6 5 5
Pulp, Paper and Printing Products 17 21 18 15 18 18 18 21 18
Textiles and Textile Articles 125 141 127 121 124 98 96 104 107
Footwear, Headgear, Umbrellas; Artificial Flowers; Articles of Human Hair
10 13 14 11 10 10 7 7 7
Articles of Stone, Plaster, Cement; Ceramic Products; Glass & Glassware
40 45 42 45 48 35 39 43 41
Pearls, Precious Stones, Precious Metals; Imitation Jewellery; Coin
22 119 61 51 86 102 35 53 75
Base Metals and Articles of Base Metal 644 897 774 808 905 789 811 894 1,002
Machinery & Electrical Equipment 4,185 3,823 3,141 3,139 3,443 3,472 3,373 3,707 4,041
Vehicles, Aircraft, Vessels & Associated Transport Equipment 530 592 607 566 641 624 623 702 800
Optical, Precision Instruments; Clocks and Watches; Musical Instruments
266 529 240 219 184 196 194 208 222
Others 218 246 236 253 278 245 273 261 262
11-13c. Exports by Countries of Destination (Continued)Unit: US$ million
241

Unit: US$ million
Item 2010 2011 2012 2013 2014 2015 2016 2017 2018
Total 3,670 4,646 5,076 4,330 4,247 3,905 3,643 3,786 3,858Live Animals; Animal Products 4 3 2 2 2 2 2 2 1
Vegetable Products 3 4 5 4 4 5 4 4 4Animal or Vegetable Fats and Oils and their Cleavage Products 0 0 0 0 0 0 0 0 0
Prepared Foodstuffs; Beverages, Spirits and Tobacco Products 7 7 10 11 15 15 15 18 21Mineral Products 0 129 0 121 68 0 0 0 0
Chemicals 48 63 78 76 105 69 76 73 97
Plastics & Articles Thereof; Rubber & Articles Thereof 218 237 237 232 245 233 227 233 247Fur and Articles Thereof 9 10 10 8 9 8 6 7 9
Wood and Articles Thereof 4 3 3 2 2 2 1 2 2Pulp, Paper and Printing Products 8 9 11 10 10 10 10 9 10
Textiles and Textile Articles 110 107 109 108 91 86 73 78 78Footwear, Headgear, Umbrellas; Artificial Flowers; Articles of Human Hair
7 9 8 8 10 8 9 8 8
Articles of Stone, Plaster, Cement; Ceramic Products; Glass & Glassware
21 37 44 32 36 25 22 22 23
Pearls, Precious Stones, Precious Metals; Imitation Jewellery; Coin
22 584 1,475 496 189 48 71 21 50
Base Metals and Articles of Base Metal 452 510 479 473 567 530 503 622 712
Machinery & Electrical Equipment 2,087 2,264 1,910 2,004 2,029 1,977 1,702 1,857 1,804
Vehicles, Aircraft, Vessels & Associated Transport Equipment 398 385 410 444 496 518 518 510 484Optical, Precision Instruments; Clocks and Watches; Musical Instruments
77 91 88 92 135 140 194 115 109
Others 195 192 197 207 234 228 208 202 200
11-13d. Exports by Countries of Destination (Continued)D. United Kingdom
242

Unit: US$ million
Item 2010 2011 2012 2013 2014 2015 2016 2017 2018
Total 77,950 85,244 82,666 84,122 84,738 73,410 73,879 88,981 96,756Live Animals; Animal Products 73 170 212 258 292 251 193 269 401
Vegetable Products 38 46 51 77 84 135 139 174 198
Animal or Vegetable Fats and Oils and their Cleavage Products 18 22 27 25 15 12 11 14 12
Prepared Foodstuffs; Beverages, Spirits and Tobacco Products 158 217 302 472 513 450 450 529 619
Mineral Products 902 975 1,228 1,230 1,642 1,486 1,306 1,221 1,134
Chemicals 10,070 12,094 10,868 11,227 10,568 8,098 7,547 8,658 9,989Plastics & Articles Thereof; Rubber & Articles Thereof 8,226 8,830 8,622 9,130 8,540 6,963 6,489 7,779 8,520
Fur and Articles Thereof 225 208 219 229 303 164 139 121 94
Wood and Articles Thereof 30 35 44 48 55 41 40 58 56
Pulp, Paper and Printing Products 403 418 413 345 346 321 308 416 543
Textiles and Textile Articles 2,545 2,797 2,551 2,558 2,396 2,057 1,849 1,940 1,936Footwear, Headgear, Umbrellas; Artificial Flowers; Articles of Human Hair
83 80 76 85 81 71 54 64 57
Articles of Stone, Plaster, Cement; Ceramic Products; Glass & Glassware
590 978 1,178 1,006 1,146 966 999 1,053 1,036
Pearls, Precious Stones, Precious Metals; Imitation Jewellery; Coin
55 89 92 70 108 136 133 158 192
Base Metals and Articles of Base Metal 5,363 5,847 5,189 5,012 5,057 4,675 4,511 5,828 6,044
Machinery & Electrical Equipment 30,167 34,499 33,921 35,449 38,338 36,069 39,648 50,080 55,416Vehicles, Aircraft, Vessels & Associated Transport Equipment 862 660 746 1,051 947 1,011 896 574 592
Optical, Precision Instruments; Clocks and Watches; Musical Instruments
17,687 16,736 16,311 15,140 13,518 9,715 8,431 9,284 9,178
Others 455 542 616 709 790 788 736 759 738
11-13e. Exports by Countries of Destination (Continued)E. Mainland China
243

Item 2010 2011 2012 2013 2014 2015 2016 2017 2018
Total 38,270 40,726 38,495 41,183 43,795 39,130 38,398 41,232 41,590Live Animals; Animal Products 72 62 75 78 86 92 79 75 79Vegetable Products 34 47 50 57 65 67 65 67 74
Animal or Vegetable Fats and Oils and their Cleavage Products 15 17 16 20 8 3 2 2 1
Prepared Foodstuffs; Beverages, Spirits and Tobacco Products 145 177 203 229 248 228 227 267 287Mineral Products 1,009 1,349 2,297 3,000 2,390 1,664 611 672 741Chemicals 799 815 661 705 742 712 652 608 657Plastics & Articles Thereof; Rubber & Articles Thereof 3,066 2,758 2,201 1,955 1,781 1,450 1,238 1,482 1,487Fur and Articles Thereof 211 203 207 187 190 166 91 80 71
Wood and Articles Thereof 6 4 4 4 6 3 3 3 2Pulp, Paper and Printing Products 169 150 153 145 127 117 106 109 112
Textiles and Textile Articles 1,461 1,468 1,176 1,039 925 855 700 646 550Footwear, Headgear, Umbrellas; Artificial Flowers; Articles of Human Hair
53 54 46 40 35 27 25 26 24
Articles of Stone, Plaster, Cement; Ceramic Products; Glass & Glassware
173 283 281 311 269 271 214 210 212
Pearls, Precious Stones, Precious Metals; Imitation Jewellery; Coin
1,979 3,024 1,289 747 1,062 1,350 528 412 337
Base Metals and Articles of Base Metal 1,884 1,807 1,322 1,161 1,061 800 653 685 707Machinery & Electrical Equipment 24,461 25,608 25,927 28,545 31,796 28,569 30,600 32,941 33,689Vehicles, Aircraft, Vessels & Associated Transport Equipment 260 436 277 104 135 232 133 222 332Optical, Precision Instruments; Clocks and Watches; Musical Instruments
2,056 2,078 1,962 2,494 2,487 2,157 2,114 2,337 1,864
Others 415 386 348 362 383 367 356 389 363
11-13f. Exports by Countries of Destination (Continued)Unit: US$ million F. Hong Kong
244
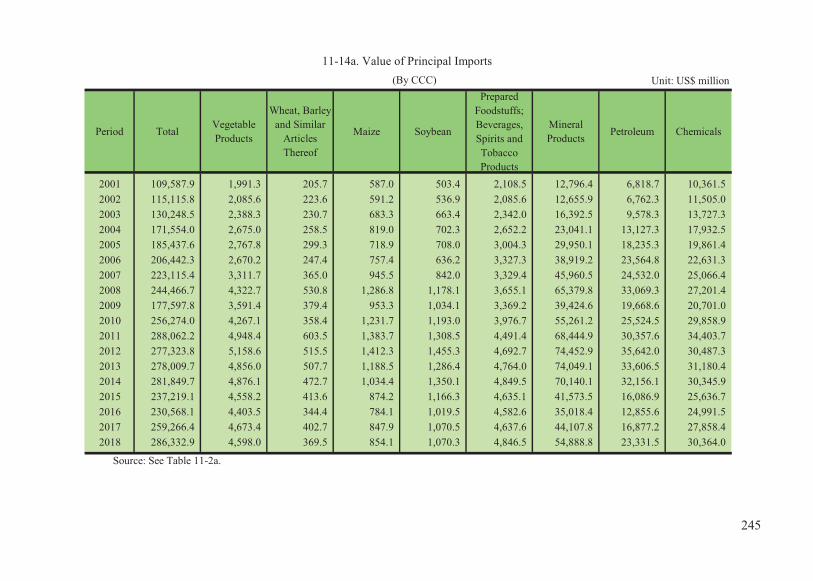
Unit: US$ million
Period TotalVegetableProducts
Wheat, Barleyand Similar
ArticlesThereof
Maize Soybean
PreparedFoodstuffs;Beverages,Spirits andTobaccoProducts
MineralProducts Petroleum Chemicals
2001 109,587.9 1,991.3 205.7 587.0 503.4 2,108.5 12,796.4 6,818.7 10,361.5 2002 115,115.8 2,085.6 223.6 591.2 536.9 2,085.6 12,655.9 6,762.3 11,505.0 2003 130,248.5 2,388.3 230.7 683.3 663.4 2,342.0 16,392.5 9,578.3 13,727.3 2004 171,554.0 2,675.0 258.5 819.0 702.3 2,652.2 23,041.1 13,127.3 17,932.5 2005 185,437.6 2,767.8 299.3 718.9 708.0 3,004.3 29,950.1 18,235.3 19,861.4 2006 206,442.3 2,670.2 247.4 757.4 636.2 3,327.3 38,919.2 23,564.8 22,631.3 2007 223,115.4 3,311.7 365.0 945.5 842.0 3,329.4 45,960.5 24,532.0 25,066.4 2008 244,466.7 4,322.7 530.8 1,286.8 1,178.1 3,655.1 65,379.8 33,069.3 27,201.4 2009 177,597.8 3,591.4 379.4 953.3 1,034.1 3,369.2 39,424.6 19,668.6 20,701.0 2010 256,274.0 4,267.1 358.4 1,231.7 1,193.0 3,976.7 55,261.2 25,524.5 29,858.9 2011 288,062.2 4,948.4 603.5 1,383.7 1,308.5 4,491.4 68,444.9 30,357.6 34,403.7 2012 277,323.8 5,158.6 515.5 1,412.3 1,455.3 4,692.7 74,452.9 35,642.0 30,487.3 2013 278,009.7 4,856.0 507.7 1,188.5 1,286.4 4,764.0 74,049.1 33,606.5 31,180.4 2014 281,849.7 4,876.1 472.7 1,034.4 1,350.1 4,849.5 70,140.1 32,156.1 30,345.9 2015 237,219.1 4,558.2 413.6 874.2 1,166.3 4,635.1 41,573.5 16,086.9 25,636.7 2016 230,568.1 4,403.5 344.4 784.1 1,019.5 4,582.6 35,018.4 12,855.6 24,991.5 2017 259,266.4 4,673.4 402.7 847.9 1,070.5 4,637.6 44,107.8 16,877.2 27,858.4 2018 286,332.9 4,598.0 369.5 854.1 1,070.3 4,846.5 54,888.8 23,331.5 30,364.0
Source: See Table 11-2a.
(By CCC)
11-14a. Value of Principal Imports
245

Period
Plastics andArticlesThereof;
Rubber andArticlesThereof
Wood andArticles of
Wood
Pulp, Paperand Printing
Products
Textiles andTextileArticles
Articles of Stone,Plaster, Cement;
CeramicProducts; Glassand Glassware
Pearls, PreciousStones, PreciousMetals; ImitationJewellery; Coin
Base Metalsand Articles
of Base Metal
Iron and Steeland Articles
Thereof
2001 3,431.8 849.6 1,800.9 2,400.8 984.0 979.5 7,872.1 3,813.1
2002 3,768.3 914.8 1,725.9 2,510.0 997.3 847.0 9,278.1 4,878.5
2003 4,174.0 975.3 1,948.1 2,437.1 1,243.7 1,027.1 11,415.6 6,297.8
2004 5,528.0 1,247.5 2,215.0 2,722.1 1,791.6 1,455.4 18,599.0 10,841.8
2005 6,204.5 1,241.2 2,273.0 2,643.7 2,160.4 1,764.7 18,937.3 10,625.6
2006 6,672.6 1,238.5 2,333.8 2,748.9 2,292.4 2,359.1 23,307.5 10,277.7
2007 6,949.4 1,319.5 2,506.0 2,685.3 2,659.7 3,014.8 26,885.3 12,754.6
2008 7,169.4 1,312.1 2,761.1 2,716.0 2,895.5 3,378.6 29,161.7 16,518.3
2009 5,962.6 883.1 2,030.8 2,207.8 2,362.4 3,243.2 15,286.3 7,685.2
2010 8,829.3 1,304.4 2,712.2 2,935.3 3,706.3 4,757.9 24,522.5 12,534.5
2011 10,097.0 1,401.6 2,944.8 3,626.4 3,749.9 6,224.2 27,252.1 14,492.8
2012 9,552.8 1,322.8 2,819.6 3,443.8 3,632.6 6,282.5 23,319.1 12,499.0
2013 8,987.5 1,459.7 2,703.3 3,375.7 3,299.3 4,682.9 21,986.2 11,353.9
2014 9,173.8 1,577.7 2,534.9 3,501.0 3,176.4 5,264.3 23,351.0 11,923.5
2015 7,984.9 1,361.2 2,303.7 3,512.1 2,816.4 4,889.7 19,235.5 8,730.1
2016 7,568.2 1,179.7 2,239.3 3,340.6 2,559.1 3,501.5 16,824.7 7,798.2
2017 8,383.3 1,210.7 2,482.5 3,366.6 2,672.6 3,315.2 20,503.8 9,349.3
2018 8,956.8 1,321.1 2,677.4 3,677.6 2,850.9 3,412.3 22,453.1 11,069.0
11-14b. Value of Principal Imports (Continued) (By CCC) Unit: US$ million
246
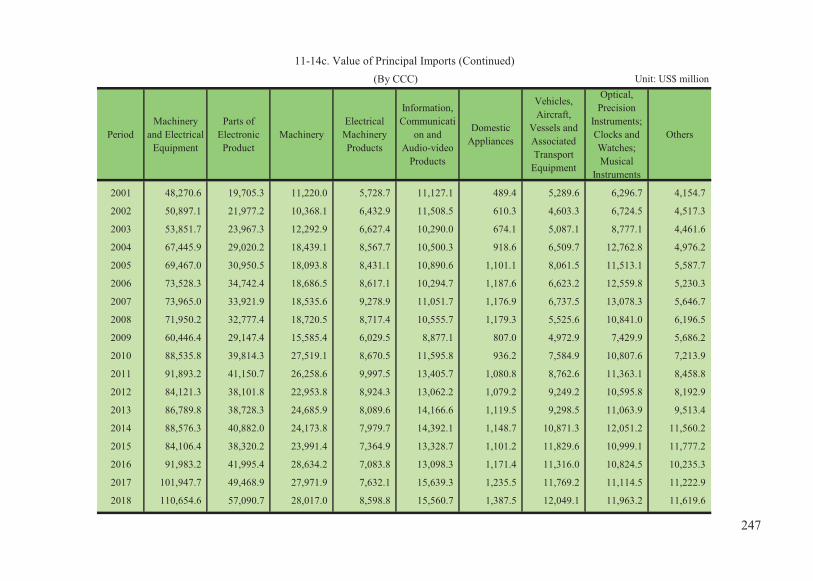
PeriodMachinery
and ElectricalEquipment
Parts ofElectronicProduct
MachineryElectrical
MachineryProducts
Information,Communicati
on andAudio-video
Products
DomesticAppliances
Vehicles,Aircraft,
Vessels andAssociatedTransport
Equipment
Optical,Precision
Instruments;Clocks andWatches;Musical
Instruments
Others
2001 48,270.6 19,705.3 11,220.0 5,728.7 11,127.1 489.4 5,289.6 6,296.7 4,154.7
2002 50,897.1 21,977.2 10,368.1 6,432.9 11,508.5 610.3 4,603.3 6,724.5 4,517.3
2003 53,851.7 23,967.3 12,292.9 6,627.4 10,290.0 674.1 5,087.1 8,777.1 4,461.6
2004 67,445.9 29,020.2 18,439.1 8,567.7 10,500.3 918.6 6,509.7 12,762.8 4,976.2
2005 69,467.0 30,950.5 18,093.8 8,431.1 10,890.6 1,101.1 8,061.5 11,513.1 5,587.7
2006 73,528.3 34,742.4 18,686.5 8,617.1 10,294.7 1,187.6 6,623.2 12,559.8 5,230.3
2007 73,965.0 33,921.9 18,535.6 9,278.9 11,051.7 1,176.9 6,737.5 13,078.3 5,646.7
2008 71,950.2 32,777.4 18,720.5 8,717.4 10,555.7 1,179.3 5,525.6 10,841.0 6,196.5
2009 60,446.4 29,147.4 15,585.4 6,029.5 8,877.1 807.0 4,972.9 7,429.9 5,686.2
2010 88,535.8 39,814.3 27,519.1 8,670.5 11,595.8 936.2 7,584.9 10,807.6 7,213.9
2011 91,893.2 41,150.7 26,258.6 9,997.5 13,405.7 1,080.8 8,762.6 11,363.1 8,458.8
2012 84,121.3 38,101.8 22,953.8 8,924.3 13,062.2 1,079.2 9,249.2 10,595.8 8,192.9
2013 86,789.8 38,728.3 24,685.9 8,089.6 14,166.6 1,119.5 9,298.5 11,063.9 9,513.4
2014 88,576.3 40,882.0 24,173.8 7,979.7 14,392.1 1,148.7 10,871.3 12,051.2 11,560.2
2015 84,106.4 38,320.2 23,991.4 7,364.9 13,328.7 1,101.2 11,829.6 10,999.1 11,777.2
2016 91,983.2 41,995.4 28,634.2 7,083.8 13,098.3 1,171.4 11,316.0 10,824.5 10,235.3
2017 101,947.7 49,468.9 27,971.9 7,632.1 15,639.3 1,235.5 11,769.2 11,114.5 11,222.9
2018 110,654.6 57,090.7 28,017.0 8,598.8 15,560.7 1,387.5 12,049.1 11,963.2 11,619.6
(By CCC) Unit: US$ million
11-14c. Value of Principal Imports (Continued)
247

Unit: US$ million
Origin 2010 2011 2012 2013 2014 2015 2016 2017 2018
Total 1193.0 1308.5 1455.3 1286.4 1350.1 1166.3 1019.5 1070.5 1070.2U.S.A. 730.4 728.4 716.3 616.0 760.7 667.5 514.4 594.2 901.5Brazil 402.0 537.8 720.2 591.5 534.2 450.8 467.7 433.1 129.6Others 60.6 42.2 18.7 78.9 55.2 48.0 37.5 43.2 39.1
Unit: US$ million
Origin 2010 2011 2012 2013 2014 2015 2016 2017 2018
Total 358.4 603.5 515.5 507.7 472.7 413.6 344.4 402.7 369.4U.S.A. 239.2 465.8 367.0 393.9 360.1 309.8 263.6 321.0 289.9Australia 103.8 123.4 121.7 89.4 90.0 80.7 66.7 71.6 58.8India 0.0 4.8 20.2 16.5 9.0 4.9 0.5 0.0 0.0Others 15.3 9.5 6.6 7.9 13.5 18.2 13.5 10.1 20.8
Unit: US$ million
Origin 2010 2011 2012 2013 2014 2015 2016 2017 2018
Total 1231.7 1383.7 1412.3 1188.5 1034.4 874.1 784.1 847.9 854.1U.S.A. 794.0 882.4 363.2 182.6 479.7 386.0 476.2 487.4 649.6Brazil 311.7 334.2 707.7 579.0 350.4 478.8 303.2 273.2 141.8India 8.0 36.2 85.3 88.3 21.2 1.6 0.8 4.4 1.6Thailand 0.2 0.6 0.5 1.2 1.2 1.2 1.3 6.8 0.9Australia 0.1 0.0 10.1 1.0 0.8 1.0 1.4 0.8 0.4Others 117.6 130.3 245.6 336.3 181.0 5.5 1.3 75.3 59.8
Source: See Table 11-2a.
11-15a. Value of Principal Imports by OriginA. Soybean
B. Wheat
C. Maize
248

Unit: US$ millionOrigin 2010 2011 2012 2013 2014 2015 2016 2017 2018
Total 6,713.2 8,945.2 7,960.5 6,859.4 6,048.7 4,891.7 4,519.3 6,792.4 8,056.0Australia 3,330.3 4,186.3 3,458.7 3,155.9 2,986.7 2,535.8 2,620.8 3,737.4 4,511.5Indonesia 2,026.8 2,754.9 2,856.8 2,326.6 2,061.3 1,534.0 1,076.5 1,280.7 1,467.5Russia 164.7 506.3 394.0 309.6 490.3 510.9 433.3 809.1 1,133.3Canada 156.2 298.9 291.6 208.3 176.5 129.9 159.7 377.4 496.0other 1,035.1 1,198.9 959.5 859.1 333.9 181.1 228.9 587.8 447.7
Unit: US$ millionOrigin 2010 2011 2012 2013 2014 2015 2016 2017 2018
Total 25,524.5 30,357.6 35,642.0 33,606.5 32,156.1 16,086.9 12,855.6 16,877.2 23,331.5Saudi Arabia 9,005.1 10,339.4 11,152.6 12,137.1 10,562.1 5,099.5 4,105.6 5,226.0 7,001.9Kuwait 5,281.5 7,073.4 7,526.8 7,175.9 5,976.5 3,468.9 2,593.9 3,271.0 4,775.4United Arab 1,263.0 1,800.4 2,435.5 2,220.1 2,819.2 1,409.6 748.2 1,648.7 2,063.5Angola 2,723.4 5,663.1 4,999.2 3,845.3 2,916.5 1,335.6 1,302.9 1,468.5 286.6Iraq 1,931.8 949.3 2,617.1 2,641.9 3,478.0 1,361.0 927.5 1,223.8 1,763.1Oman 1,202.5 673.8 3,922.6 3,265.7 3,405.4 2,103.9 900.3 1,100.2 1,625.5other 4,117.3 3,858.2 2,988.2 2,320.6 2,998.3 1,308.3 2,277.1 2,939.0 5,815.4
Unit: US$ millionOrigin 2010 2011 2012 2013 2014 2015 2016 2017 2018
Total 24,522.4 27,252.1 23,319.1 21,986.2 23,351.0 19,235.5 16,824.6 20,503.8 22,453.1Mainland China 2,761.8 4,475.9 3,640.1 4,465.0 5,740.2 4,345.9 4,093.2 4,604.8 4,379.6Japan 6,039.5 6,403.5 5,895.5 5,686.2 5,350.3 4,241.0 3,767.1 4,526.7 4,958.3Australia 1,586.5 1,678.3 1,181.3 1,061.9 1,006.4 1,689.9 1,035.7 1,358.6 1,243.4Korea, Republic of 1,889.3 1,826.2 1,496.9 1,367.0 1,185.9 1,075.6 1,007.6 1,134.7 1,195.6United States 1,753.9 2,297.0 2,000.1 1,643.3 1,501.2 966.8 848.3 913.4 1,378.6Chile 1,811.5 1,829.0 1,582.2 1,329.9 1,400.2 1,090.1 653.7 881.6 827.7India 294.0 408.1 319.2 484.6 500.8 411.0 467.6 878.5 640.6other 8,386.0 8,334.0 7,204.0 5,948.4 6,666.0 5,415.1 4,951.6 6,205.5 7,829.3
11-15b. Value of Principal Imports by Origin (Continued)
F. Base Metals and Articles of Base Metal
E. Petroleum
D. Coal
249

Origin 2010 2011 2012 2013 2014 2015 2016 2017 2018
Total 7,584.9 8,762.6 9,249.2 9,298.5 10,871.3 11,829.6 11,316.0 11,769.2 12,049.1 Japan 2,294.3 2,643.8 2,705.2 2,724.6 2,548.9 2,580.9 2,756.6 2,779.3 3,087.7 U.S.A. 1,787.0 1,504.6 1,565.2 1,717.3 2,687.1 3,439.3 2,820.2 2,383.6 2,315.9 Germany 1,504.5 2,104.7 1,810.8 1,767.3 2,079.8 2,086.5 1,769.3 2,066.0 2,024.1 France 227.5 318.7 684.9 481.4 508.4 553.0 713.8 1,279.6 836.6 Mainland China 708.9 811.6 922.8 996.9 1,079.2 1,116.6 1,022.1 967.3 1,037.0 United Kingdom 117.2 170.6 165.4 185.5 251.7 280.8 267.5 301.8 275.8 Korea, Rep. of 214.5 229.2 256.0 271.8 280.6 263.6 226.2 233.0 210.8 Others 731.2 979.5 1,138.9 1,153.6 1,435.5 1,508.8 1,740.3 1,758.6 2,261.1
Origin 2010 2011 2012 2013 2014 2015 2016 2017 2018
Total 29,858.9 34,403.7 30,487.3 31,180.4 30,345.9 25,636.7 24,991.5 27,858.4 30,364.0Japan 8,695.9 9,365.2 8,340.8 7,807.2 7,156.9 6,024.8 6,268.3 6,793.9 7,648.6Mainland China 4,127.9 4,924.8 4,234.0 4,459.1 5,019.5 4,574.5 4,387.1 4,355.8 4,486.9U.S.A. 3,604.0 4,078.2 3,813.8 4,065.2 3,900.4 3,476.1 3,497.8 3,638.3 4,044.9Korea, Rep. of 2,731.2 3,565.5 2,848.0 3,010.7 2,726.0 2,120.3 2,088.6 2,612.7 3,216.1Germany 2,271.4 2,279.1 2,103.3 2,441.0 2,467.6 2,228.7 2,080.1 2,255.8 2,318.5France 551.8 638.9 611.8 699.2 762.1 672.0 706.7 794.5 869.5Saudi Arabia 1,073.9 1,489.3 1,627.7 1,559.0 1,302.1 798.2 584.5 750.2 801.0Singapore 673.1 675.5 505.8 589.6 583.9 525.2 447.8 677.6 725.1Others 6,129.8 7,387.1 6,402.0 6,549.4 6,427.4 5,217.0 4,930.7 5,979.7 6,253.3
11-15c. Value of Principal Imports by Origin (Continued)
Unit: US$ million
Unit: US$ millionG.Vehicles, Aircraft, Vessels and Associated Transport Equipment
H. Chemicals
250
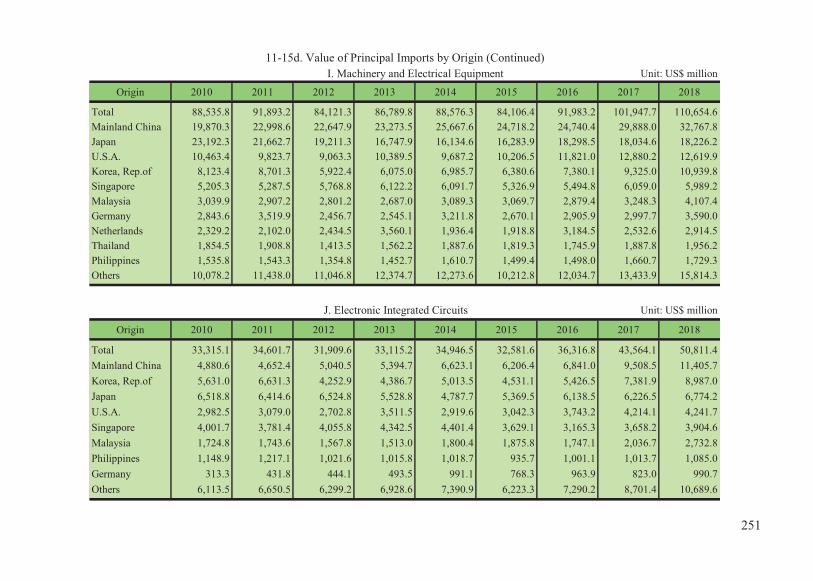
Origin 2010 2011 2012 2013 2014 2015 2016 2017 2018
Total 88,535.8 91,893.2 84,121.3 86,789.8 88,576.3 84,106.4 91,983.2 101,947.7 110,654.6Mainland China 19,870.3 22,998.6 22,647.9 23,273.5 25,667.6 24,718.2 24,740.4 29,888.0 32,767.8Japan 23,192.3 21,662.7 19,211.3 16,747.9 16,134.6 16,283.9 18,298.5 18,034.6 18,226.2U.S.A. 10,463.4 9,823.7 9,063.3 10,389.5 9,687.2 10,206.5 11,821.0 12,880.2 12,619.9Korea, Rep.of 8,123.4 8,701.3 5,922.4 6,075.0 6,985.7 6,380.6 7,380.1 9,325.0 10,939.8Singapore 5,205.3 5,287.5 5,768.8 6,122.2 6,091.7 5,326.9 5,494.8 6,059.0 5,989.2Malaysia 3,039.9 2,907.2 2,801.2 2,687.0 3,089.3 3,069.7 2,879.4 3,248.3 4,107.4Germany 2,843.6 3,519.9 2,456.7 2,545.1 3,211.8 2,670.1 2,905.9 2,997.7 3,590.0Netherlands 2,329.2 2,102.0 2,434.5 3,560.1 1,936.4 1,918.8 3,184.5 2,532.6 2,914.5Thailand 1,854.5 1,908.8 1,413.5 1,562.2 1,887.6 1,819.3 1,745.9 1,887.8 1,956.2Philippines 1,535.8 1,543.3 1,354.8 1,452.7 1,610.7 1,499.4 1,498.0 1,660.7 1,729.3Others 10,078.2 11,438.0 11,046.8 12,374.7 12,273.6 10,212.8 12,034.7 13,433.9 15,814.3
Origin 2010 2011 2012 2013 2014 2015 2016 2017 2018
Total 33,315.1 34,601.7 31,909.6 33,115.2 34,946.5 32,581.6 36,316.8 43,564.1 50,811.4Mainland China 4,880.6 4,652.4 5,040.5 5,394.7 6,623.1 6,206.4 6,841.0 9,508.5 11,405.7Korea, Rep.of 5,631.0 6,631.3 4,252.9 4,386.7 5,013.5 4,531.1 5,426.5 7,381.9 8,987.0Japan 6,518.8 6,414.6 6,524.8 5,528.8 4,787.7 5,369.5 6,138.5 6,226.5 6,774.2U.S.A. 2,982.5 3,079.0 2,702.8 3,511.5 2,919.6 3,042.3 3,743.2 4,214.1 4,241.7Singapore 4,001.7 3,781.4 4,055.8 4,342.5 4,401.4 3,629.1 3,165.3 3,658.2 3,904.6Malaysia 1,724.8 1,743.6 1,567.8 1,513.0 1,800.4 1,875.8 1,747.1 2,036.7 2,732.8Philippines 1,148.9 1,217.1 1,021.6 1,015.8 1,018.7 935.7 1,001.1 1,013.7 1,085.0Germany 313.3 431.8 444.1 493.5 991.1 768.3 963.9 823.0 990.7Others 6,113.5 6,650.5 6,299.2 6,928.6 7,390.9 6,223.3 7,290.2 8,701.4 10,689.6
11-15d. Value of Principal Imports by Origin (Continued)Unit: US$ million
Unit: US$ million
I. Machinery and Electrical Equipment
J. Electronic Integrated Circuits
251
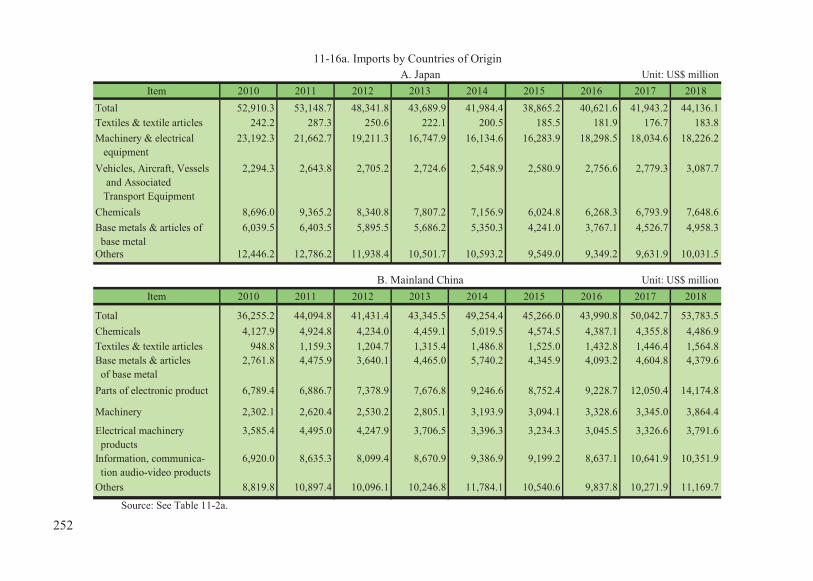
Item 2010 2011 2012 2013 2014 2015 2016 2017 2018Total 52,910.3 53,148.7 48,341.8 43,689.9 41,984.4 38,865.2 40,621.6 41,943.2 44,136.1Textiles & textile articles 242.2 287.3 250.6 222.1 200.5 185.5 181.9 176.7 183.8Machinery & electrical equipment
23,192.3 21,662.7 19,211.3 16,747.9 16,134.6 16,283.9 18,298.5 18,034.6 18,226.2
Vehicles, Aircraft, Vessels and Associated Transport Equipment
2,294.3 2,643.8 2,705.2 2,724.6 2,548.9 2,580.9 2,756.6 2,779.3 3,087.7
Chemicals 8,696.0 9,365.2 8,340.8 7,807.2 7,156.9 6,024.8 6,268.3 6,793.9 7,648.6Base metals & articles of base metal
6,039.5 6,403.5 5,895.5 5,686.2 5,350.3 4,241.0 3,767.1 4,526.7 4,958.3
Others 12,446.2 12,786.2 11,938.4 10,501.7 10,593.2 9,549.0 9,349.2 9,631.9 10,031.5
Item 2010 2011 2012 2013 2014 2015 2016 2017 2018
Total 36,255.2 44,094.8 41,431.4 43,345.5 49,254.4 45,266.0 43,990.8 50,042.7 53,783.5Chemicals 4,127.9 4,924.8 4,234.0 4,459.1 5,019.5 4,574.5 4,387.1 4,355.8 4,486.9Textiles & textile articles 948.8 1,159.3 1,204.7 1,315.4 1,486.8 1,525.0 1,432.8 1,446.4 1,564.8Base metals & articles of base metal
2,761.8 4,475.9 3,640.1 4,465.0 5,740.2 4,345.9 4,093.2 4,604.8 4,379.6
Parts of electronic product 6,789.4 6,886.7 7,378.9 7,676.8 9,246.6 8,752.4 9,228.7 12,050.4 14,174.8
Machinery 2,302.1 2,620.4 2,530.2 2,805.1 3,193.9 3,094.1 3,328.6 3,345.0 3,864.4
Electrical machinery products
3,585.4 4,495.0 4,247.9 3,706.5 3,396.3 3,234.3 3,045.5 3,326.6 3,791.6
Information, communica- tion audio-video products
6,920.0 8,635.3 8,099.4 8,670.9 9,386.9 9,199.2 8,637.1 10,641.9 10,351.9
Others 8,819.8 10,897.4 10,096.1 10,246.8 11,784.1 10,540.6 9,837.8 10,271.9 11,169.7
Source: See Table 11-2a.
11-16a. Imports by Countries of OriginUnit: US$ million
Unit: US$ million
A. Japan
B. Mainland China
252

Item 2010 2011 2012 2013 2014 2015 2016 2017 2018Total 26,799.0 27,767.2 25,701.1 28,410.0 30,036.4 29,196.2 28,597.2 30,236.8 34,715.6Vegetable products 2,121.0 2,433.1 1,919.6 1,673.5 2,063.3 1,835.7 1,756.7 1,934.1 2,333.5Chemicals 3,604.0 4,078.2 3,813.8 4,065.2 3,900.4 3,476.1 3,497.8 3,638.3 4,044.9Plastics, rubber & articles thereof
999.0 1,249.3 1,065.7 1,057.9 1,107.5 1,019.9 882.9 1,036.1 1,124.5
Parts of electronic product 3,155.6 3,231.2 2,874.6 3,687.0 3,087.1 3,226.6 3,880.9 4,317.4 4,348.0Machinery 6,351.6 5,558.4 5,114.6 5,613.1 5,532.6 6,101.9 6,999.8 7,546.5 7,206.9Vehicles, aircraft, vessels & associated transport equipment
1,787.0 1,504.6 1,565.2 1,717.3 2,687.1 3,439.3 2,820.2 2,383.6 2,315.9
Precision, measuring, checking, medical or surgical instruments
1,854.3 1,846.3 1,754.2 1,732.6 1,742.4 2,053.3 2,101.1 2,015.3 2,188.2
Others 6,926.4 7,866.0 7,593.2 8,863.3 9,915.9 8,043.4 6,657.9 7,365.4 11,153.6
Item 2010 2011 2012 2013 2014 2015 2016 2017 2018
Total 16,223.5 18,186.4 15,304.6 16,162.5 15,289.1 13,450.2 14,650.5 16,894.2 19,529.5Mineral products 794.7 1,366.8 2,365.9 2,764.3 1,643.2 1,386.5 1,930.3 1,523.0 1,770.1Chemicals 2,731.2 3,565.5 2,848.0 3,010.7 2,726.0 2,120.3 2,088.6 2,612.7 3,216.1Plastics, rubber & articles thereof
706.8 723.3 676.7 664.8 694.1 562.0 479.1 533.1 573.6
Base metals & articles of base metal
1,889.3 1,826.2 1,496.9 1,367.0 1,185.9 1,075.6 1,007.6 1,134.7 1,195.6
Machinery & electrical equipment
8,123.4 8,701.3 5,922.4 6,075.0 6,985.7 6,380.6 7,380.1 9,325.0 10,939.8
Others 1,978.1 2,003.3 1,994.8 2,280.9 2,054.2 1,925.2 1,764.8 1,765.7 1,834.3
11-16b. Imports by Countries of Origin (Continued)Unit: US$ million
Unit: US$ million
C. United States
D. Republic of Korea
253

Item 2010 2011 2012 2013 2014 2015 2016 2017 2018
Total 11,862.9 13,875.7 14,798.5 15,636.1 13,722.0 7,327.0 5,795.9 6,865.4 8,632.2Mineral products 10,636.4 12,146.3 12,757.5 13,652.8 11,761.0 6,021.9 4,857.1 5,704.4 7,343.1
Chemicals 1,073.9 1,489.3 1,627.7 1,559.0 1,302.1 798.2 584.5 750.2 801.0
Plastics, rubber & articles thereof
108.2 203.4 330.6 335.7 366.7 260.7 201.6 226.0 251.0
Base metals & articles of base metal
37.6 31.7 77.6 85.7 286.3 242.0 148.7 177.3 231.7
Others 6.8 5.0 5.0 2.9 5.9 4.1 4.1 7.6 5.4
Item 2010 2011 2012 2013 2014 2015 2016 2017 2018
Total 9,036.5 10,991.3 9,462.2 8,105.5 7,586.2 6,857.8 6,089.4 8,219.1 9,555.8Live animals; animal products
276.6 370.6 351.7 335.5 376.0 319.0 325.3 363.9 338.2
Vegetable products 155.3 196.7 207.7 167.4 163.9 150.7 153.5 159.9 145.2
Mineral products 6,296.4 8,013.9 7,018.5 5,855.8 5,337.9 4,176.5 4,045.7 5,807.3 7,331.4
Chemicals 189.8 205.2 193.3 177.1 168.2 147.4 151.5 140.7 112.8
Base metals & articles of base metal
1,586.5 1,678.3 1,181.3 1,061.9 1,006.4 1,689.9 1,035.7 1,358.6 1,243.4
Others 531.9 526.6 509.8 507.9 533.9 374.3 377.9 388.7 384.7
11-16c. Imports by Countries of Origin (Continued)Unit: US$ million
Unit: US$ million
E. Saudi Arabia
F. Australia
254
12. EXTERNAL RESOURCES
AND
OUTWARD INVESTMENT

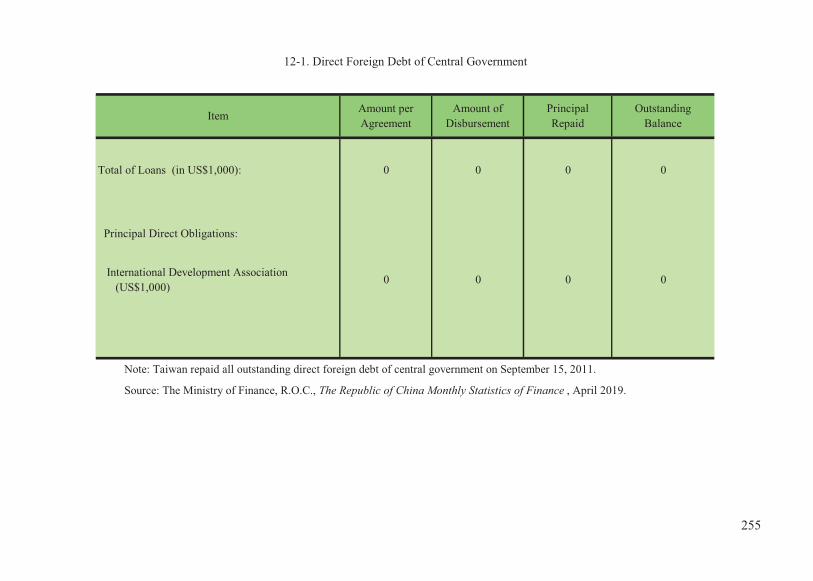
Total of Loans (in US$1,000): 0 0 0 0
Principal Direct Obligations:
International Development Association (US$1,000)
0 0 0 0
Note: Taiwan repaid all outstanding direct foreign debt of central government on September 15, 2011.
Source: The Ministry of Finance, R.O.C., The Republic of China Monthly Statistics of Finance , April 2019.
12-1. Direct Foreign Debt of Central Government
Item Amount perAgreement
Amount ofDisbursement
PrincipalRepaid
OutstandingBalance
255

Cases Amount Cases Amount Cases Amount Cases AmountTotal (1952-2018) 55,179 169,122,966 3,216 4,204,135 50,735 162,731,040 1,228 2,187,791
1952 5 1,067 5 1,067 0 0 - -1955 5 4,599 3 176 2 4,423 - -1960 14 15,473 6 1,135 8 14,338 - -1965 66 41,610 30 6,470 36 35140 - -1970 151 139,866 80 29,733 71 110,133 - -1975 87 130,175 44 47,235 43 82,940 - -1980 110 465,964 39 222,584 71 243,380 - -1985 174 702,459 67 41,757 107 660,702 - -1990 461 2,301,772 85 220,115 376 2,081,657 - -1995 413 2,925,340 43 168,554 370 2,756,786 - -1996 500 2,460,836 52 170,451 448 2,290,385 - -1997 683 4,266,629 44 387,463 639 3,879,166 - -1998 1,140 3,738,758 81 184,721 1,059 3,554,037 - -1999 1,089 4,231,404 36 132,380 1,053 4,099,024 - -2000 1,410 7,607,755 40 50,383 1,370 7,557,372 - -2001 1,178 5,128,518 33 47,223 1,145 5,081,295 - -2002 1,142 3,271,749 25 44,958 1,117 3,226,791 - -2003 1,078 3,575,674 22 14,917 1,056 3,560,757 - -2004 1,149 3,952,147 19 13,739 1,130 3,938,408 - -2005 1,131 4,228,068 12 10,318 1,119 4,217,750 - -2006 1,846 13,969,247 30 45,264 1,816 13,923,983 - -2007 2,267 15,361,173 29 20,949 2,238 15,340,224 - -2008 1,845 8,237,115 17 33,680 1,828 8,203,435 - -2009 1,734 4,835,377 15 8,898 1,696 4,788,993 23 37,486 2010 2,121 3,905,911 22 12,886 2,020 3,798,680 79 94,345 2011 2,388 5,007,059 19 51,533 2,264 4,903,901 105 51,625 2012 2,876 5,890,564 34 11,662 2,704 5,547,319 138 331,583 2013 3,344 5,282,930 20 8,971 3,186 4,924,480 138 349,479 2014 3,713 6,104,655 43 18,811 3,534 5,751,213 136 334,631 2015 3,959 5,040,914 49 14,844 3,740 4,782,003 170 244,067 2016 3,572 11,284,689 33 10,827 3,381 11,026,234 158 247,628 2017 3,555 7,778,896 28 9,400 3,387 7,503,791 140 265,705 2018 3,762 11,671,476 31 11,772 3,590 11,428,462 141 231,242
Note: The same investor increase of investment in the invested enterprise is not counted in the cases.
investment from the Mainland China Area, Outward Investment, and Investment to the Mainland China Area ,April 2019.
Source: Investment Commission, Ministry of Economic Affairs, R.O.C., Statistics on Overseas Chinese & Foreign Investment,
Mainland China
12-2. Approved Investment in Taiwan from Overseas Chinese, Foreign Nationals, and Mainland China
Period
Unit: US$1,000Total Overseas Chinese Foreign Nationals
256

Cases Amount Cases Amount Cases Amount Cases Amount Cases AmountTotal (1952-2018) 3,216 4,204,135 1,357 1,060,391 257 197,682 199 1,141,127 1,403 1,804,935
1952 5 1,067 5 1,067 0 0 0 0 0 0 1955 3 176 1 30 1 141 0 0 1 5 1960 6 1,135 4 714 0 194 0 0 2 227 1965 30 6,470 19 2,707 2 304 4 2,138 5 1,321 1970 80 29,733 51 8,343 10 1,243 8 7,747 11 12,400 1975 44 47,235 21 29,532 6 2,969 6 5,996 11 8,738 1980 39 222,584 15 17,949 3 3,061 1 7,745 20 193,829 1985 67 41,757 23 11,216 3 888 5 15,572 36 14,081 1990 85 220,115 32 47,111 5 12,146 3 91,806 45 69,052 1995 43 168,554 17 47,701 1 3,404 3 82,708 22 34,741 1996 52 170,451 32 34,848 0 432 0 116,504 20 18,667 1997 44 387,463 22 73,521 3 2,964 1 260,832 18 50,146 1998 81 184,721 4 18,763 6 4,306 2 70,389 69 91,263 1999 36 132,380 6 85,986 1 5,693 3 5,690 26 35,011 2000 40 50,383 5 27,322 5 2,544 0 236 30 20,281 2001 33 47,223 4 17,943 1 133 0 357 28 28,791 2002 25 44,958 3 1,418 2 567 2 406 18 42,566 2003 22 14,917 4 3,685 0 384 0 70 18 10,778 2004 19 13,739 5 2,595 1 413 1 363 12 10,369 2005 12 10,318 0 653 1 1,235 1 277 10 8,153 2006 30 45,264 0 4,637 6 3,218 4 5,016 20 32,393 2007 29 20,949 1 679 2 3,080 1 1,115 25 16,074 2008 17 33,680 0 1,741 2 3,861 1 13,135 14 14,943 2009 15 8,898 1 550 0 0 0 1,819 14 6,528 2010 22 12,886 0 2,953 2 510 1 1,904 19 7,519 2011 19 51,533 0 23 2 164 0 562 17 50,785 2012 34 11,662 0 45 0 65 1 1,261 33 10,291 2013 20 8,971 0 676 2 151 1 1,966 17 6,178 2014 43 18,811 0 115 0 1,456 1 2,196 42 15,002 2015 49 14,844 0 52 0 236 0 0 49 14,556 2016 33 10,827 0 0 4 428 0 279 29 10,120 2017 28 9,400 0 0 0 193 0 0 28 9,207 2018 31 11,772 0 0 1 213 0 0 30 11,559
Note: See Table 12-2Source: See Table 12-2
12-3. Approved Investment in Taiwan from Overseas Chinese by AreaUnit: US$1,000
Period Total Hong Kong Japan Philippines Others
257

Cases Amount Cases Amount Cases Amount Cases Amount Cases AmountTotal (1952-2018) 50,735 162,731,040 6,133 23,364,780 10,231 21,037,587 4,754 52,563,636 29,617 65,765,038
1952 0 0 0 0 0 0 0 0 0 0 1955 2 4,423 2 4,423 0 0 0 0 0 0 1960 8 14,338 5 14,029 3 309 0 0 0 0 1965 36 35,140 17 31,104 14 2,081 1 43 4 1,912 1970 71 110,133 16 68,783 51 28,531 4 11,694 0 1,125 1975 43 82,940 12 41,857 22 23,234 2 4,193 7 13,656 1980 71 243,380 15 110,093 35 86,081 11 14,428 10 32,778 1985 107 660,702 42 332,760 32 145,236 12 100,010 21 82,696 1990 376 2,081,657 61 540,366 179 826,801 49 282,681 87 431,809 1995 370 2,756,786 67 1,275,623 157 569,414 39 334,887 107 576,862 1996 448 2,290,385 63 474,016 171 545,344 55 199,961 159 1,071,064 1997 639 3,879,166 104 454,319 166 851,139 80 405,812 289 2,167,896 1998 1,059 3,554,037 208 867,198 228 535,371 131 367,416 492 1,784,052 1999 1,053 4,099,024 207 1,114,693 230 508,434 109 460,175 507 2,015,722 2000 1,370 7,557,372 206 1,315,518 312 730,325 130 1,213,388 722 4,298,141 2001 1,145 5,081,295 147 915,597 241 684,724 129 1,184,003 628 2,296,970 2002 1,117 3,226,791 152 573,646 211 608,106 120 612,317 634 1,432,722 2003 1,056 3,560,757 153 678,091 203 725,689 90 643,932 610 1,513,045 2004 1,130 3,938,408 157 352,312 227 826,517 118 964,618 628 1,794,962 2005 1,119 4,217,750 133 799,230 213 723,164 122 684,833 651 2,010,522 2006 1,816 13,923,983 266 857,378 307 1,587,874 199 7,509,586 1,044 3,969,145 2007 2,238 15,340,224 293 3,138,438 356 996,553 236 7,096,351 1,353 4,108,882 2008 1,828 8,203,435 275 2,848,297 298 435,806 195 2,139,358 1,060 2,779,975 2009 1,696 4,788,993 277 260,599 266 238,961 136 2,085,094 1,017 2,204,338 2010 2,020 3,798,680 228 315,394 338 399,984 174 1,230,653 1,280 1,852,648 2011 2,264 4,903,901 295 689,764 439 444,703 183 715,806 1,347 3,053,628 2012 2,704 5,547,319 285 401,957 619 414,265 238 1,721,532 1,562 3,009,565 2013 3,186 4,924,480 293 580,633 616 408,533 265 686,183 2,012 3,249,132 2014 3,534 5,751,213 264 143,445 488 547,307 267 1,477,948 2,515 3,582,513 2015 3,740 4,782,003 253 127,655 471 453,161 294 1,025,481 2,722 3,175,706 2016 3,381 11,026,234 239 138,174 454 346,447 345 7,268,612 2,343 3,273,001 2017 3,387 7,503,791 268 211,717 418 640,449 273 3,396,929 2,428 3,254,696 2018 3,590 11,428,462 255 261,243 524 1,525,189 313 6,767,254 2,498 2,874,776
Note: See Table 12-2Source: See Table 12-2
12-4. Approved Investment in Taiwan from Foreign Nationals by AreaUnit: US$1,000
Period Total U.S.A. Japan Europe Others
258

Cases Amount Cases Amount Cases Amount
Total 53,951 166,935,175 3,216 4,204,135 50,735 162,731,040
1. Agriculture, Forestry, Fishery and Animal Husbandry 201 211,803 73 28,057 128 183,746
2. Food, Beverage, and Tobacco Manufacturing 900 2,142,003 127 74,701 773 2,067,302
3. Textile Mills 251 860,546 76 225,997 175 634,549
4. Chemicals 1,081 7,881,118 121 108,263 960 7,772,855
5. Rubber and Plastic Products Manufacturing 647 1,362,224 153 64,382 494 1,297,842
6. Non-metallic Mineral Products Manufacturing 370 3,975,950 105 299,650 265 3,676,300
7. Basic Metal and Fabricated Metal Manufacturing 1,291 5,267,643 118 133,593 1,173 5,134,050
8. Machinery and Equipment Manufacturing 1,645 6,191,285 84 69,329 1,561 6,121,956
9. Electronic Parts and Components Manufacturing 3,221 28,534,355 30 18,470 3,191 28,515,885
10. Computer, Electronic and Optical Products 1,768 7,258,944 38 58,692 1,730 7,200,252
11. Electrical Equipment Manufacturing 1,544 6,466,418 179 161,751 1,365 6,304,667
12. Construction 1,086 1,841,036 174 143,671 912 1,697,365
13. Wholesale and Retail Trade 16,457 17,452,432 313 103,006 16,144 17,349,426
14. Transportation and Storage 693 1,852,832 102 201,736 591 1,651,096
15. Accommodation and Food Services 3,500 2,286,148 469 122,754 3,031 2,163,394
16. Information and Communications 3,021 8,030,494 39 64,031 2,982 7,966,464
17. Finance, Insurance and Real Estate 6,427 47,895,284 203 1,446,745 6,224 46,448,539
18. Professional, Scientific and Technical Services 4,743 7,161,400 308 606,125 4,435 6,555,274
19. Others 5,105 10,263,260 504 273,182 4,601 9,990,078
Note: See Table 12-2Source: See Table 12-2
12-5. Approved Investment in Taiwan from Overseas Chinese and Foreign Nationals by Industry
IndustryForeign
(1952-2018)Total Overseas Chinese
Unit: US$1,000�
259

Total Americas Asia Europe OthersCases Amount Cases Amount Cases Amount Cases Amount Cases Amount
Total (1952-2018) 16,440 138,655,062 5,573 17,404,095 5,759 53,512,046 905 9,147,428 4,203 58,591,493 1952 0 0 0 0 0 0 0 0 0 0 1955 0 0 0 0 0 0 0 0 0 0 1960 0 0 0 0 0 0 0 0 0 0 1965 7 971 0 0 7 971 0 0 0 0 1970 5 527 0 0 5 527 0 0 0 0 1975 5 2,419 0 854 5 1,565 0 0 0 0 1980 17 42,105 8 35,130 6 3,170 1 1,000 2 2,805 1985 23 41,334 16 35,830 6 4,206 0 891 1 407 1990 315 1,552,206 137 838,711 154 602,910 21 96,176 3 14,409 1995 339 1,356,878 134 787,105 175 467,721 16 59,890 14 42,162 1996 470 2,165,404 245 1,442,953 197 661,717 15 21,375 13 39,359 1997 759 2,893,826 521 1,915,948 204 818,743 26 131,235 8 27,900 1998 896 3,296,302 609 2,636,946 225 580,819 51 33,903 11 44,634 1999 774 3,269,013 555 2,267,710 153 836,378 49 82,382 17 82,543 2000 1,391 5,077,062 1,094 3,946,021 222 851,065 46 125,432 29 154,544 2001 1,387 4,391,654 1,080 3,460,901 221 814,981 45 46,870 41 68,902 2002 925 3,370,046 654 2,475,574 183 530,055 31 154,416 57 210,001 2003 714 3,968,588 402 2,731,271 188 1,063,915 40 76,724 84 96,678 2004 658 3,382,022 372 1,881,380 183 1,275,089 35 61,913 68 163,640 2005 521 2,447,449 263 1,618,228 168 430,673 33 299,314 57 99,234 2006 478 4,315,426 236 2,336,558 175 1,390,621 31 463,800 36 124,447 2007 464 6,469,978 207 3,162,956 167 2,366,606 20 418,200 70 522,216 2008 387 4,466,491 140 2,116,235 156 2,046,998 35 137,688 56 165,571 2009 251 3,005,554 89 1,959,069 117 765,457 16 99,541 29 181,487 2010 247 2,823,451 84 1,290,803 118 1,391,363 13 50,603 32 90,682 2011 306 3,696,827 110 1,781,012 140 1,723,918 14 39,251 42 152,646 2012 321 8,098,641 88 468,700 192 7,151,518 26 71,488 15 406,935 2013 373 5,232,266 143 819,235 176 2,894,581 25 168,902 29 1,349,548 2014 493 7,293,683 192 3,426,017 228 2,482,274 27 936,295 46 449,097 2015 462 10,745,195 149 3,454,444 226 4,660,671 40 2,511,362 47 118,718 2016 496 12,123,094 176 3,274,714 225 7,488,020 38 1,136,968 57 223,393 2017 502 11,573,208 182 6,950,494 233 3,569,422 35 232,715 52 820,577 2018 638 14,294,562 83 2,038,975 366 3,648,830 36 1,287,424 153 7,319,333
Note: See Table 12-2Source: See Table 12-2
Unit: US$1,000
Period
12-6. Approved Outward Investment by Area
260

Cases Amount
16,440 138,655,062 1. Agriculture, Forestry, Fishery and Animal Husbandry 61 103,368
2. Food, Beverage, and Tobacco Manufacturing 182 681,967
3. Textile Mills 333 2,849,937
4. Chemicals 622 3,418,754
5. Rubber and Plastic Products Manufacturing 248 2,263,307
6. Non-metallic Mineral Products Manufacturing 214 1,198,165
7. Basic Metal and Fabricated Metal Manufacturing 277 8,501,733
8. Machinery and Equipment Manufacturing 243 1,516,024
9. Electronic Parts and Components Manufacturing 1,844 16,347,101
10. Computer, Electronic and Optical Products 1,451 3,667,285
11. Electrical Equipment Manufacturing 365 1,279,249
12. Construction 99 227,008
13. Wholesale and Retail Trade 2,951 9,773,956
14. Transportation and Storage 180 3,183,673
15. Accommodation and Food Services 68 254,959
16. Information and Communications 1,660 3,103,769
17. Finance, Insurance and Real Estate 3,092 69,398,688
18. Professional, Scientific and Technical Services 400 1,384,221
19. Others 2,150 9,501,897 Note: See Table 12-2Source: See Table 12-2
Total
Industry
(1952-2018)12-7. Approved Outward Investment by Industry
Unit: US$1,000�
261
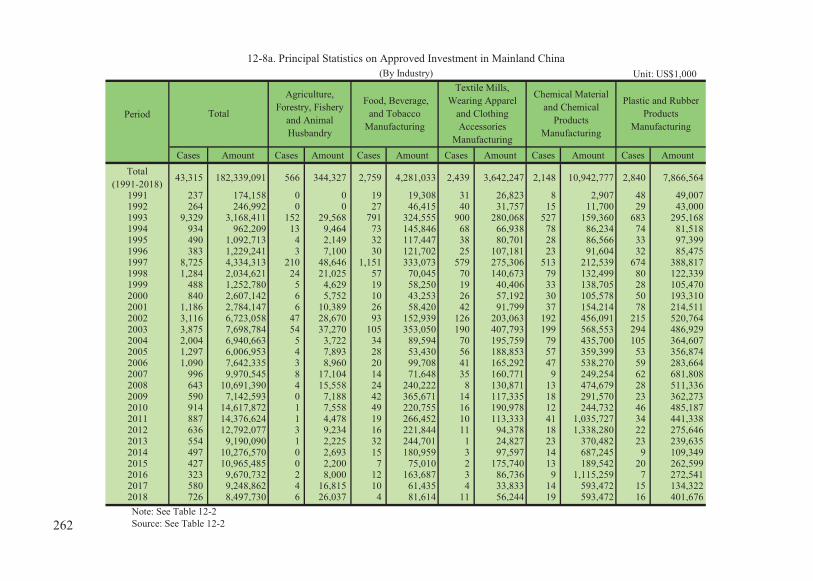
Period
Cases Amount Cases Amount Cases Amount Cases Amount Cases Amount Cases AmountTotal
(1991-2018)43,315 182,339,091 566 344,327 2,759 4,281,033 2,439 3,642,247 2,148 10,942,777 2,840 7,866,564
1991 237 174,158 0 0 19 19,308 31 26,823 8 2,907 48 49,0071992 264 246,992 0 0 27 46,415 40 31,757 15 11,700 29 43,0001993 9,329 3,168,411 152 29,568 791 324,555 900 280,068 527 159,360 683 295,1681994 934 962,209 13 9,464 73 145,846 68 66,938 78 86,234 74 81,5181995 490 1,092,713 4 2,149 32 117,447 38 80,701 28 86,566 33 97,3991996 383 1,229,241 3 7,100 30 121,702 25 107,181 23 91,604 32 85,4751997 8,725 4,334,313 210 48,646 1,151 333,073 579 275,306 513 212,539 674 388,8171998 1,284 2,034,621 24 21,025 57 70,045 70 140,673 79 132,499 80 122,3391999 488 1,252,780 5 4,629 19 58,250 19 40,406 33 138,705 28 105,4702000 840 2,607,142 6 5,752 10 43,253 26 57,192 30 105,578 50 193,3102001 1,186 2,784,147 6 10,389 26 58,420 42 91,799 37 154,214 78 214,5112002 3,116 6,723,058 47 28,670 93 152,939 126 203,063 192 456,091 215 520,7642003 3,875 7,698,784 54 37,270 105 353,050 190 407,793 199 568,553 294 486,9292004 2,004 6,940,663 5 3,722 34 89,594 70 195,759 79 435,700 105 364,6072005 1,297 6,006,953 4 7,893 28 53,430 56 188,853 57 359,399 53 356,8742006 1,090 7,642,335 3 8,960 20 99,708 41 165,292 47 538,270 59 283,6642007 996 9,970,545 8 17,104 14 71,648 35 160,771 9 249,254 62 681,8082008 643 10,691,390 4 15,558 24 240,222 8 130,871 13 474,679 28 511,3362009 590 7,142,593 0 7,188 42 365,671 14 117,335 18 291,570 23 362,2732010 914 14,617,872 1 7,558 49 220,755 16 190,978 12 244,732 46 485,1872011 887 14,376,624 1 4,478 19 266,452 10 113,333 41 1,035,727 34 441,3382012 636 12,792,077 3 9,234 16 221,844 11 94,378 18 1,338,280 22 275,6462013 554 9,190,090 1 2,225 32 244,701 1 24,827 23 370,482 23 239,6352014 497 10,276,570 0 2,693 15 180,959 3 97,597 14 687,245 9 109,3492015 427 10,965,485 0 2,200 7 75,010 2 175,740 13 189,542 20 262,5992016 323 9,670,732 2 8,000 12 163,687 3 86,736 9 1,115,259 7 272,5412017 580 9,248,862 4 16,815 10 61,435 4 33,833 14 593,472 15 134,3222018 726 8,497,730 6 26,037 4 81,614 11 56,244 19 593,472 16 401,676Note: See Table 12-2Source: See Table 12-2
Chemical Materialand Chemical
ProductsManufacturing
12-8a. Principal Statistics on Approved Investment in Mainland China(By Industry)
Agriculture,Forestry, Fishery
and AnimalHusbandry
Total Food, Beverage,
and TobaccoManufacturing
Textile Mills,Wearing Apparel
and ClothingAccessories
Manufacturing
Plastic and RubberProducts
Manufacturing
Unit: US$1,000�
262
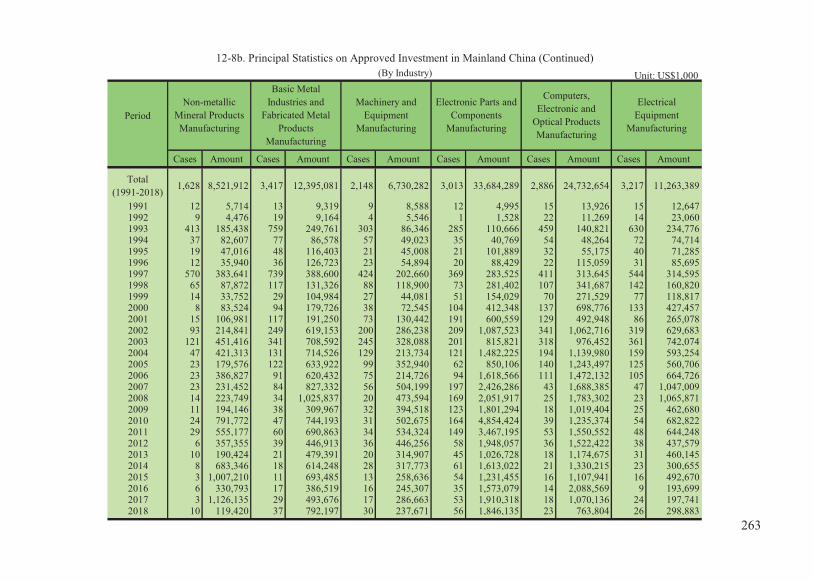
Period
Cases Amount Cases Amount Cases Amount Cases Amount Cases Amount Cases Amount
Total(1991-2018) 1,628 8,521,912 3,417 12,395,081 2,148 6,730,282 3,013 33,684,289 2,886 24,732,654 3,217 11,263,389
1991 12 5,714 13 9,319 9 8,588 12 4,995 15 13,926 15 12,6471992 9 4,476 19 9,164 4 5,546 1 1,528 22 11,269 14 23,0601993 413 185,438 759 249,761 303 86,346 285 110,666 459 140,821 630 234,7761994 37 82,607 77 86,578 57 49,023 35 40,769 54 48,264 72 74,7141995 19 47,016 48 116,403 21 45,008 21 101,889 32 55,175 40 71,2851996 12 35,940 36 126,723 23 54,894 20 88,429 22 115,059 31 85,6951997 570 383,641 739 388,600 424 202,660 369 283,525 411 313,645 544 314,5951998 65 87,872 117 131,326 88 118,900 73 281,402 107 341,687 142 160,8201999 14 33,752 29 104,984 27 44,081 51 154,029 70 271,529 77 118,8172000 8 83,524 94 179,726 38 72,545 104 412,348 137 698,776 133 427,4572001 15 106,981 117 191,250 73 130,442 191 600,559 129 492,948 86 265,0782002 93 214,841 249 619,153 200 286,238 209 1,087,523 341 1,062,716 319 629,6832003 121 451,416 341 708,592 245 328,088 201 815,821 318 976,452 361 742,0742004 47 421,313 131 714,526 129 213,734 121 1,482,225 194 1,139,980 159 593,2542005 23 179,576 122 633,922 99 352,940 62 850,106 140 1,243,497 125 560,7062006 23 386,827 91 620,432 75 214,726 94 1,618,566 111 1,472,132 105 664,7262007 23 231,452 84 827,332 56 504,199 197 2,426,286 43 1,688,385 47 1,047,0092008 14 223,749 34 1,025,837 20 473,594 169 2,051,917 25 1,783,302 23 1,065,8712009 11 194,146 38 309,967 32 394,518 123 1,801,294 18 1,019,404 25 462,6802010 24 791,772 47 744,193 31 502,675 164 4,854,424 39 1,235,374 54 682,8222011 29 555,177 60 690,863 34 534,324 149 3,467,195 53 1,550,552 48 644,2482012 6 357,355 39 446,913 36 446,256 58 1,948,057 36 1,522,422 38 437,5792013 10 190,424 21 479,391 20 314,907 45 1,026,728 18 1,174,675 31 460,1452014 8 683,346 18 614,248 28 317,773 61 1,613,022 21 1,330,215 23 300,6552015 3 1,007,210 11 693,485 13 258,636 54 1,231,455 16 1,107,941 16 492,6702016 6 330,793 17 386,519 16 245,307 35 1,573,079 14 2,088,569 9 193,6992017 3 1,126,135 29 493,676 17 286,663 53 1,910,318 18 1,070,136 24 197,7412018 10 119,420 37 792,197 30 237,671 56 1,846,135 23 763,804 26 298,883
ElectricalEquipment
Manufacturing
(By Industry)12-8b. Principal Statistics on Approved Investment in Mainland China (Continued)
Basic MetalIndustries and
Fabricated MetalProducts
Manufacturing
Computers,Electronic and
Optical ProductsManufacturing
Electronic Parts andComponents
Manufacturing
Machinery andEquipment
Manufacturing
Non-metallicMineral ProductsManufacturing
Unit: US$1,000�
263

Period
Cases Amount Cases Amount Cases Amount Cases Amount Cases Amount Cases Amount
Total(1991-2018)
3,461 12,545,724 282 1,104,253 1,017 2,470,958 612 18,171,827 959 2,263,190 9,923 21,378,585
1991 1 200 0 0 0 0 0 0 0 0 54 20,7241992 0 0 0 0 0 0 0 0 0 0 84 59,0771993 170 70,755 35 4,992 15 3,340 18 4,046 58 7,667 3,131 981,0841994 31 21,136 8 14,650 5 2,558 1 28 20 3,295 231 148,5871995 32 56,190 6 14,212 4 1,475 1 100 7 2,321 124 197,3771996 23 30,285 5 16,440 2 11,200 7 16,675 5 3,008 84 231,8311997 287 124,902 15 30,283 26 4,601 39 67,755 93 8,473 2,081 953,2521998 47 85,370 2 11,524 18 9,871 6 1,701 12 21,119 297 296,4481999 26 19,748 5 8,049 12 7,347 3 19,435 7 2,103 63 121,4462000 45 57,916 3 9,401 46 53,491 0 0 14 7,670 96 199,2032001 110 117,211 8 16,512 106 55,077 17 3,512 19 6,713 126 268,5312002 199 146,957 14 68,086 132 88,028 29 71,649 73 43,443 585 1,043,2142003 255 175,404 30 25,597 86 65,402 90 279,616 71 18,507 914 1,258,2202004 320 183,070 27 20,972 97 51,222 29 85,615 52 47,709 405 897,6612005 143 274,288 14 99,039 79 106,252 19 48,363 50 25,519 223 666,2962006 150 312,778 15 104,781 43 81,166 12 102,237 18 123,672 183 844,3992007 138 411,902 8 36,136 62 151,269 17 131,595 20 58,497 173 1,275,8982008 72 499,106 8 57,527 58 324,465 7 284,583 17 224,058 119 1,304,7162009 82 743,150 9 31,210 27 106,845 4 65,917 8 17,011 116 852,4152010 166 1,115,494 8 23,076 32 333,066 50 1,628,660 33 200,225 142 1,356,8812011 149 1,232,720 11 94,265 23 282,532 46 1,669,426 44 175,290 136 1,618,7042012 159 1,271,788 21 63,310 20 118,636 44 3,063,717 24 274,987 85 901,6752013 151 1,035,940 6 24,904 21 222,877 29 2,190,283 39 163,385 83 1,024,5592014 113 1,095,575 3 18,807 26 113,267 45 1,984,251 42 209,937 68 917,6292015 116 679,942 5 42,278 12 116,468 25 3,105,420 41 263,995 73 1,260,8952016 84 535,112 1 71,974 9 49,335 23 1,456,539 23 68,568 53 1,025,0152017 183 1,059,867 6 37,801 23 64,061 20 1,222,193 66 141,600 91 798,7942018 209 1,188,919 9 158,425 33 47,106 31 668,512 103 144,418 726 854,054
12-8c. Principal Statistics on Approved Investment in Mainland China (Continued)(By Industry)
Transportation andStorage
Wholesale andRetail Trade
Information andCommunication
Finance, Insuranceand Real Estate Others
Professional,Scientific and
Technical Services
Unit: US$1,000�
264

13. EDUCATION AND CULTURE


Number of Number of Number of Number ofSchools Personnel Students Graduates
1955-56 2,165 49,666 1,535,455 209,563 1960-61 2,961 76,993 2,375,328 329,672 1965-66 3,371 101,674 3,117,397 513,120 1970-71 4,036 137,844 3,991,574 774,045 1975-76 4,540 167,459 4,449,009 953,641 1980-81 5,097 193,722 4,597,765 1,013,340 1985-86 6,285 219,889 4,942,310 1,060,780 1990-91 6,743 246,220 5,279,864 1,169,877 1995-96 7,224 279,032 5,226,219 1,248,253 1996-97 7,357 285,743 5,191,219 1,247,121 1997-98 7,562 290,997 5,195,241 1,212,340 1998-99 7,731 297,950 5,215,773 1,205,087
1999-2000 7,915 305,681 5,241,641 1,237,248 2000-01 8,071 313,293 5,303,001 1,218,495 2001-02 8,158 317,715 5,354,091 1,251,011 2002-03 8,222 319,286 5,376,947 1,269,569 2003-04 8,252 321,768 5,385,135 1,246,864 2004-05 8,184 321,658 5,372,346 1,279,163 2005-06 8,287 324,690 5,319,364 1,262,636 2006-07 8,254 323,795 5,286,885 1,265,274 2007-08 8,202 326,026 5,243,062 1,275,265 2008-09 8,097 328,500 5,165,817 1,260,435 2009-10 8,060 328,309 5,065,962 1,230,261 2010-11 8,196 331,349 4,965,690 1,213,645 2011-12 8,100 332,640 4,860,022 1,217,508 2012-13 11,496 373,596 5,007,275 1,171,773 2013-14 11,426 375,976 4,859,558 1,121,216 2014-15 11,078 376,845 4,729,465 1,110,531 2015-16 10,948 374,061 4,616,078 1,059,904 2016-17 10,882 369,937 4,504,363 1,001,893 2017-18 10,884 369,448 4,403,690 990,824 2018-19 10,902 371,349 4,325,121 …
Note: (1) The figures in Tables 13-1 to 13-12 cover Taiwan, Kinmen and Matsu. (2) After the "Early Childhood Education and Care Act" came into effect on January 1, 2012, kindergartens and child-care
centers have been administered as preschools. Data for preschools prior to the school year 2011 is only that for kindergartens. (3) The Senior High School Education Act has come into effect on August 1, 2014. Senior secondary continuing schools and
evening divisions should be transformed into Continuing Education affiliated to senior secondary school after this Act has implemented. Therefore, the senior secondary continuing schools should be contributed to the number of the senior high school.
Source: The data are provided by the Ministry of Education, R.O.C. (Taiwan).
School Year
13-1. Number of Schools, Personnel, Students and GraduatesUnit: Schools; Persons
265

1955-56 2,165 15 - - - 250 1,446 413 41 1960-61 2,961 27 - - - 363 1,843 675 53 1965-66 3,371 56 - - - 551 2,143 555 66 1970-71 4,036 92 - - - 885 2,319 570 170 1974-75 4,400 100 - - - 968 2,354 660 318 1975-76 4,540 101 - - - 977 2,376 762 324 1980-81 5,097 104 - - - 1,023 2,428 1,186 356 1985-86 6,285 105 - - - 1,052 2,486 2,210 432 1990-91 6,743 121 45 76 - 1,086 2,487 2,505 544 1995-96 7,224 134 53 81 - 1,123 2,523 2,581 863 1996-97 7,357 137 57 80 - 1,138 2,519 2,660 903 1997-98 7,562 139 58 81 - 1,151 2,540 2,777 955 1998-99 7,731 137 58 79 - 1,158 2,557 2,874 1,005
1999-2000 7,915 141 58 83 - 1,171 2,583 3,005 1,015 2000-01 8,071 150 65 85 - 1,174 2,600 3,150 997 2001-02 8,158 154 68 86 - 1,181 2,611 3,234 978 2002-03 8,222 154 68 86 - 1,188 2,627 3,275 978 2003-04 8,252 158 70 88 - 1,192 2,638 3,306 958 2004-05 8,184 159 70 89 - 1,196 2,646 3,252 931 2005-06 8,287 162 70 92 - 1,203 2,655 3,351 916 2006-07 8,254 163 70 93 - 1,210 2,651 3,329 901 2007-08 8,202 164 71 93 - 1,216 2,651 3,283 888 2008-09 8,097 162 69 93 - 1,217 2,654 3,195 869 2009-10 8,060 164 71 93 - 1,226 2,658 3,154 858 2010-11 8,196 165 71 92 2 1,231 2,661 3,283 856 2011-12 8,100 165 71 92 2 1,233 2,659 3,195 848 2012-13 11,496 165 71 91 3 1,235 2,657 6,611 828 2013-14 11,426 164 70 91 3 1,237 2,650 6,560 815 2014-15 11,078 161 71 88 2 1,241 2,644 6,468 564 2015-16 10,948 161 71 87 3 1,239 2,633 6,362 553 2016-17 10,882 163 71 87 5 1,242 2,630 6,310 537 2017-18 10,884 162 70 87 5 1,243 2,630 6,323 526 2018-19 10,902 159 70 83 6 1,250 2,631 6,348 514
Note: (1) From school year 2010, the data for higher education in Tables 13-2 to 13-12 includes that for religious colleges. (2) See note (2) of Table 13-1. (3) See note (3) of Table 13-1. The evening division and the practical technical program should be affiliated to the senior secondary school.
Source: See Table 13-1.
13-2. Number of Schools by Levels of EducationUnit: Schools
University &College
Higher EducationTechnicalCollege
School Year ReiligiousCollege
SecondaryEducation
PrimaryEducation
PreschoolEducation OthersTotal
266

PreschoolTeaching Non-teaching Teaching Non-teaching Teaching Non-teaching Education
1955-56 49,666 1,650 1,759 10,200 3,599 27,061 3,378 1,163 856 1960-61 76,993 3,149 2,359 16,712 5,550 41,397 4,047 2,575 1,204 1965-66 101,674 5,622 3,789 26,378 6,909 53,522 1,088 2,681 1,685 1970-71 137,844 10,377 6,146 44,283 10,058 59,489 1,214 3,059 3,218 1975-76 167,459 13,606 7,497 60,384 12,552 62,803 1,407 4,733 4,477 1980-81 193,722 16,495 8,926 69,698 13,353 69,141 1,609 8,565 5,935 1985-86 219,889 20,848 10,260 76,563 14,844 72,287 2,349 17,349 5,389 1990-91 246,220 27,579 9,542 84,260 15,031 82,583 3,247 19,032 4,946 1995-96 279,032 36,348 11,009 96,222 16,556 87,934 5,076 19,911 5,976 1996-97 285,743 37,779 11,634 98,437 16,756 90,127 5,095 19,805 6,110 1997-98 290,997 38,806 12,133 99,411 16,986 92,104 5,308 20,019 6,230 1998-99 297,950 40,149 13,172 98,857 17,194 95,029 5,323 21,750 6,476
1999-2000 305,681 41,949 14,176 98,709 17,402 98,745 6,056 22,297 6,347 2000-01 313,293 43,391 15,068 98,677 17,539 101,581 6,277 24,482 6,278 2001-02 317,715 44,769 15,595 98,609 17,590 103,501 7,114 24,222 6,315 2002-03 319,286 46,042 16,469 97,710 17,111 104,300 6,909 24,453 6,292 2003-04 321,768 47,472 17,401 97,738 17,105 103,803 7,018 25,228 6,003 2004-05 321,658 48,649 17,858 97,432 16,933 102,882 7,081 25,066 5,757 2005-06 324,690 49,601 18,701 98,499 17,019 101,662 7,558 26,086 5,564 2006-07 323,795 50,388 19,408 100,498 17,007 100,692 7,304 23,728 4,770 2007-08 326,026 51,128 20,385 102,333 16,907 101,360 7,349 21,847 4,717 2008-09 328,500 51,501 23,041 103,006 17,076 100,206 7,489 21,393 4,788 2009-10 328,309 50,658 23,794 104,064 17,234 99,155 7,681 20,911 4,812 2010-11 331,349 50,710 27,292 105,128 17,334 99,562 7,925 18,660 4,738 2011-12 332,640 50,353 29,834 104,583 17,111 98,559 8,046 19,456 4,698 2012-13 373,596 50,184 30,469 106,197 17,155 97,466 8,322 59,125 4,678 2013-14 375,976 50,056 30,689 107,338 17,415 97,436 8,621 59,848 4,573 2014-15 376,845 49,376 30,734 107,853 17,729 98,580 8,805 60,434 3,334 2015-16 374,061 48,723 30,704 105,734 17,628 97,368 8,936 61,617 3,351 2016-17 369,937 48,143 31,169 102,638 17,614 95,081 8,985 62,942 3,365 2017-18 369,448 47,462 31,606 100,732 17,445 94,403 9,032 65,410 3,358 2018-19 371,349 46,858 31,644 99,380 17,282 95,664 9,096 68,126 3,299
Note: (1) Since 1961-62, school principals and directors of school affairs have been classified as teachers. (2) See note (2) of Table 13-1. (3) See note (3) of Table 13-2. The personnel of senior secondary continuing schools should be contributed to the personnel
number of the senior secondary school.Source: See Table 13-1.
13-3. Number of School Personnel by Levels of EducationUnit: Persons
School Year TotalHigher Education Secondary Education Primary Education
Others
267

Senior JuniorVocational
SchoolVocational
School1955-56 29,969 4,456 639 483 895 155 2,284 24,127 1,039 347 1960-61 45,834 7,509 1,262 1,070 888 166 4,123 35,944 1,883 498 1965-66 59,028 13,049 2,419 1,677 906 79 7,968 43,338 1,833 808 1970-71 75,808 23,144 3,842 3,994 6 21 15,281 48,404 2,075 2,185 1975-76 86,558 30,324 4,004 6,367 - 45 19,908 49,322 2,796 4,116 1980-81 94,409 34,408 3,854 7,737 - 6 22,811 50,345 4,592 5,064 1985-86 103,164 36,703 3,981 9,224 - - 23,498 52,732 7,668 6,061 1990-91 111,322 40,519 4,325 9,897 - - 26,297 56,120 8,112 6,571 1995-96 116,327 44,606 5,638 11,114 - - 27,854 55,554 8,645 7,522 2000-01 124,238 44,761 8,252 9,956 - - 26,553 62,443 10,034 7,000 2005-06 124,355 45,155 10,280 8,129 - - 26,746 62,634 10,713 5,853 2006-07 124,136 45,880 10,393 8,148 - - 27,339 62,011 10,282 5,963 2007-08 124,322 46,469 10,372 8,208 - - 27,889 61,655 10,173 6,025 2008-09 123,114 46,677 10,211 8,342 - - 28,124 60,630 9,820 5,987 2009-10 121,986 46,956 10,112 8,512 - - 28,332 59,478 9,602 5,950 2010-11 120,979 46,966 10,082 8,738 - - 28,146 58,652 9,492 5,869 2011-12 119,618 46,605 10,119 8,847 - - 27,639 57,986 9,335 5,692 2012-13 108,340 46,510 10,110 8,932 - - 27,468 56,391 - 5,439 2013-14 106,299 46,495 9,975 8,881 - - 27,639 54,641 - 5,163
2014-15 104,304 49,036 8,156 8,810 1,676 1,051 2,092 27,251 53,541 - 1,727 2015-16 101,603 47,502 8,233 8,760 1,528 1,006 1,923 26,052 52,404 - 1,697
2016-17 98,654 45,909 8,343 8,761 1,387 993 1,788 24,637 51,097 - 1,648 2017-18 96,527 44,593 8,352 8,605 1,255 970 1,650 23,761 50,311 - 1,623 2018-19 95,588 43,223 8,288 8,328 1,101 944 1,522 23,040 50,767 - 1,598
Note: Accoding to the Senior High School Education Act, there are five programs in the senior secondary school-general education,vocational education, comprehensive high school, practical technical program and continuing education.
Source: See Table 13-1.
13-4. Number of Classes in Elementary and Secondary Schools
PrimaryEducation
PreschoolEducation
PracticalTechnicalProgram
VocationalEducation
Others
Unit: Classes
SchoolYear
GeneralEducation
TotalSeniorHigh
School
JuniorHigh
School
Compre-hensive
High School
PrimaryEducation
Secondary EducationSenior Secondary School
Others
Secondary Education
NormalSchool
Junior HighSchool
SchoolYear Total
PreschoolEducation
ContinuingEducation
268

1955-56 1,535,455 18,174 169 13,460 4,545 213,540 1,244,029 46,390 13,322 1960-61 2,375,328 35,060 437 26,735 7,888 355,274 1,888,783 79,702 16,509 1965-66 3,117,397 85,346 993 54,819 29,534 663,753 2,257,720 78,878 31,700 1970-71 3,991,574 203,473 2,295 92,850 108,328 1,154,589 2,445,405 91,984 96,123 1975-76 4,449,009 289,435 3,912 135,297 150,226 1,505,993 2,364,961 117,990 170,630 1980-81 4,597,765 342,528 6,306 153,088 183,134 1,605,567 2,233,706 178,216 237,748 1985-86 4,942,310 428,576 12,418 179,334 236,824 1,678,767 2,321,700 234,674 278,593 1990-91 5,279,864 576,623 22,372 239,082 315,169 1,818,301 2,354,113 237,285 293,542 1995-96 5,226,219 751,347 42,097 314,499 394,751 1,935,613 1,971,439 240,368 327,452 1996-97 5,191,219 795,547 44,873 337,837 412,837 1,908,935 1,934,756 235,830 316,151 1997-98 5,195,241 856,186 48,619 373,702 433,865 1,874,747 1,905,690 230,781 327,837 1998-99 5,215,773 915,921 53,870 409,705 452,346 1,814,202 1,910,681 238,787 336,182 1999-2000 5,241,641 994,283 67,233 470,030 457,020 1,756,034 1,927,179 232,610 331,535 2000-01 5,303,001 1,092,102 83,861 564,059 444,182 1,713,489 1,925,981 243,090 328,339 2001-02 5,354,091 1,187,225 103,213 677,171 406,841 1,684,449 1,925,491 246,303 310,623 2002-03 5,376,947 1,240,292 122,130 770,915 347,247 1,679,959 1,918,034 241,180 297,482 2003-04 5,385,135 1,270,194 143,567 837,602 289,025 1,676,970 1,913,000 240,926 284,045 2004-05 5,372,346 1,285,867 160,401 894,528 230,938 1,692,721 1,883,533 237,155 273,070 2005-06 5,319,364 1,296,558 177,024 938,648 180,886 1,703,414 1,831,873 224,219 263,300 2006-07 5,286,885 1,313,993 193,424 966,591 153,978 1,707,038 1,798,393 201,815 265,646 2007-08 5,243,062 1,326,029 204,225 987,914 133,890 1,707,331 1,754,095 191,773 263,834 2008-09 5,165,817 1,337,455 213,700 1,006,102 117,653 1,704,855 1,677,439 185,668 260,400 2009-10 5,065,962 1,336,659 217,152 1,010,952 108,555 1,706,325 1,593,398 182,049 247,531 2010-11 4,965,690 1,343,723 219,252 1,021,682 102,789 1,682,958 1,519,746 183,901 235,362 2011-12 4,860,022 1,352,225 217,890 1,033,035 101,300 1,641,633 1,457,004 189,792 219,368 2012-13 5,007,275 1,355,490 215,930 1,038,136 101,424 1,617,009 1,373,366 459,653 201,757 2013-14 4,859,558 1,346,221 208,908 1,035,654 101,659 1,585,444 1,297,120 448,189 182,584 2014-15 4,729,465 1,340,012 203,564 1,037,178 99,270 1,622,099 1,252,762 444,457 70,135 2015-16 4,616,078 1,332,637 199,815 1,035,356 97,466 1,540,014 1,214,360 462,115 66,952 2016-17 4,504,363 1,309,670 198,452 1,015,534 95,684 1,463,325 1,173,885 492,781 64,702 2017-18 4,403,690 1,274,191 197,270 986,083 90,838 1,398,737 1,146,661 521,904 62,197 2018-19 4,325,121 1,245,260 196,547 962,055 86,658 1,321,282 1,158,557 539,404 60,618
Note: (1) See note (2) of Table 13-1. (2) See note (1) of Table 13-2. (3) See note of Table 13-4.
Source: See Table 13-1.
SecondaryEducationBachelor
ProgramJunior
College
PrimaryEducation
PreschoolEducation Others
I. Number of Students (persons)
13-5a. Number of Students by Levels of Education
School Year TotalHigher Education
GraduateSchool
269
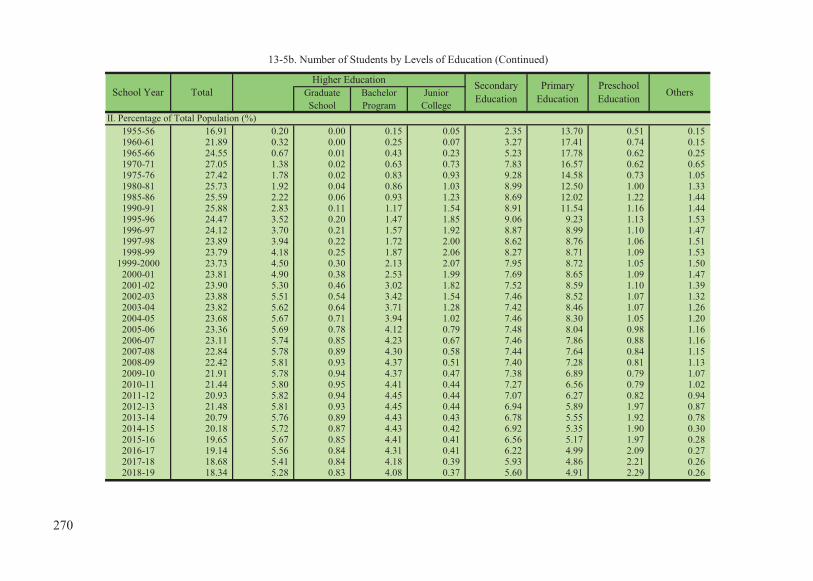
1955-56 16.91 0.20 0.00 0.15 0.05 2.35 13.70 0.51 0.15 1960-61 21.89 0.32 0.00 0.25 0.07 3.27 17.41 0.74 0.15 1965-66 24.55 0.67 0.01 0.43 0.23 5.23 17.78 0.62 0.25 1970-71 27.05 1.38 0.02 0.63 0.73 7.83 16.57 0.62 0.65 1975-76 27.42 1.78 0.02 0.83 0.93 9.28 14.58 0.73 1.05 1980-81 25.73 1.92 0.04 0.86 1.03 8.99 12.50 1.00 1.33 1985-86 25.59 2.22 0.06 0.93 1.23 8.69 12.02 1.22 1.44 1990-91 25.88 2.83 0.11 1.17 1.54 8.91 11.54 1.16 1.44 1995-96 24.47 3.52 0.20 1.47 1.85 9.06 9.23 1.13 1.53 1996-97 24.12 3.70 0.21 1.57 1.92 8.87 8.99 1.10 1.47 1997-98 23.89 3.94 0.22 1.72 2.00 8.62 8.76 1.06 1.51 1998-99 23.79 4.18 0.25 1.87 2.06 8.27 8.71 1.09 1.53
1999-2000 23.73 4.50 0.30 2.13 2.07 7.95 8.72 1.05 1.50 2000-01 23.81 4.90 0.38 2.53 1.99 7.69 8.65 1.09 1.47 2001-02 23.90 5.30 0.46 3.02 1.82 7.52 8.59 1.10 1.39 2002-03 23.88 5.51 0.54 3.42 1.54 7.46 8.52 1.07 1.32 2003-04 23.82 5.62 0.64 3.71 1.28 7.42 8.46 1.07 1.26 2004-05 23.68 5.67 0.71 3.94 1.02 7.46 8.30 1.05 1.20 2005-06 23.36 5.69 0.78 4.12 0.79 7.48 8.04 0.98 1.16 2006-07 23.11 5.74 0.85 4.23 0.67 7.46 7.86 0.88 1.16 2007-08 22.84 5.78 0.89 4.30 0.58 7.44 7.64 0.84 1.15 2008-09 22.42 5.81 0.93 4.37 0.51 7.40 7.28 0.81 1.13 2009-10 21.91 5.78 0.94 4.37 0.47 7.38 6.89 0.79 1.07 2010-11 21.44 5.80 0.95 4.41 0.44 7.27 6.56 0.79 1.02 2011-12 20.93 5.82 0.94 4.45 0.44 7.07 6.27 0.82 0.94 2012-13 21.48 5.81 0.93 4.45 0.44 6.94 5.89 1.97 0.87 2013-14 20.79 5.76 0.89 4.43 0.43 6.78 5.55 1.92 0.78 2014-15 20.18 5.72 0.87 4.43 0.42 6.92 5.35 1.90 0.30 2015-16 19.65 5.67 0.85 4.41 0.41 6.56 5.17 1.97 0.28 2016-17 19.14 5.56 0.84 4.31 0.41 6.22 4.99 2.09 0.27 2017-18 18.68 5.41 0.84 4.18 0.39 5.93 4.86 2.21 0.26 2018-19 18.34 5.28 0.83 4.08 0.37 5.60 4.91 2.29 0.26
JuniorCollege
TotalHigher Education Secondary
EducationPrimary
EducationPreschoolEducation
II. Percentage of Total Population (%)
13-5b. Number of Students by Levels of Education (Continued)
OthersGraduateSchool
School Year BachelorProgram
270
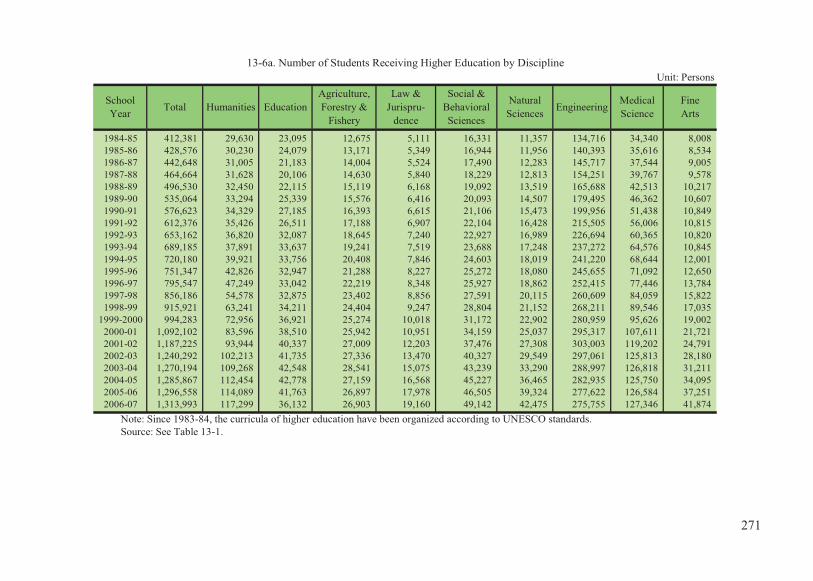
1984-85 412,381 29,630 23,095 12,675 5,111 16,331 11,357 134,716 34,340 8,008 1985-86 428,576 30,230 24,079 13,171 5,349 16,944 11,956 140,393 35,616 8,534 1986-87 442,648 31,005 21,183 14,004 5,524 17,490 12,283 145,717 37,544 9,005 1987-88 464,664 31,628 20,106 14,630 5,840 18,229 12,813 154,251 39,767 9,578 1988-89 496,530 32,450 22,115 15,119 6,168 19,092 13,519 165,688 42,513 10,217 1989-90 535,064 33,294 25,339 15,576 6,416 20,093 14,507 179,495 46,362 10,607 1990-91 576,623 34,329 27,185 16,393 6,615 21,106 15,473 199,956 51,438 10,849 1991-92 612,376 35,426 26,511 17,188 6,907 22,104 16,428 215,505 56,006 10,815 1992-93 653,162 36,820 32,087 18,645 7,240 22,927 16,989 226,694 60,365 10,820 1993-94 689,185 37,891 33,637 19,241 7,519 23,688 17,248 237,272 64,576 10,845 1994-95 720,180 39,921 33,756 20,408 7,846 24,603 18,019 241,220 68,644 12,001 1995-96 751,347 42,826 32,947 21,288 8,227 25,272 18,080 245,655 71,092 12,650 1996-97 795,547 47,249 33,042 22,219 8,348 25,927 18,862 252,415 77,446 13,784 1997-98 856,186 54,578 32,875 23,402 8,856 27,591 20,115 260,609 84,059 15,822 1998-99 915,921 63,241 34,211 24,404 9,247 28,804 21,152 268,211 89,546 17,035
1999-2000 994,283 72,956 36,921 25,274 10,018 31,172 22,902 280,959 95,626 19,002 2000-01 1,092,102 83,596 38,510 25,942 10,951 34,159 25,037 295,317 107,611 21,721 2001-02 1,187,225 93,944 40,337 27,009 12,203 37,476 27,308 303,003 119,202 24,791 2002-03 1,240,292 102,213 41,735 27,336 13,470 40,327 29,549 297,061 125,813 28,180 2003-04 1,270,194 109,268 42,548 28,541 15,075 43,239 33,290 288,997 126,818 31,211 2004-05 1,285,867 112,454 42,778 27,159 16,568 45,227 36,465 282,935 125,750 34,095 2005-06 1,296,558 114,089 41,763 26,897 17,978 46,505 39,324 277,622 126,584 37,251 2006-07 1,313,993 117,299 36,132 26,903 19,160 49,142 42,475 275,755 127,346 41,874
Note: Since 1983-84, the curricula of higher education have been organized according to UNESCO standards.Source: See Table 13-1.
Engineering MedicalScience
FineArts
13-6a. Number of Students Receiving Higher Education by DisciplineUnit: Persons
SchoolYear Total Humanities Education
Agriculture,Forestry &
Fishery
Law &Jurispru-
dence
Social &BehavioralSciences
NaturalSciences
271
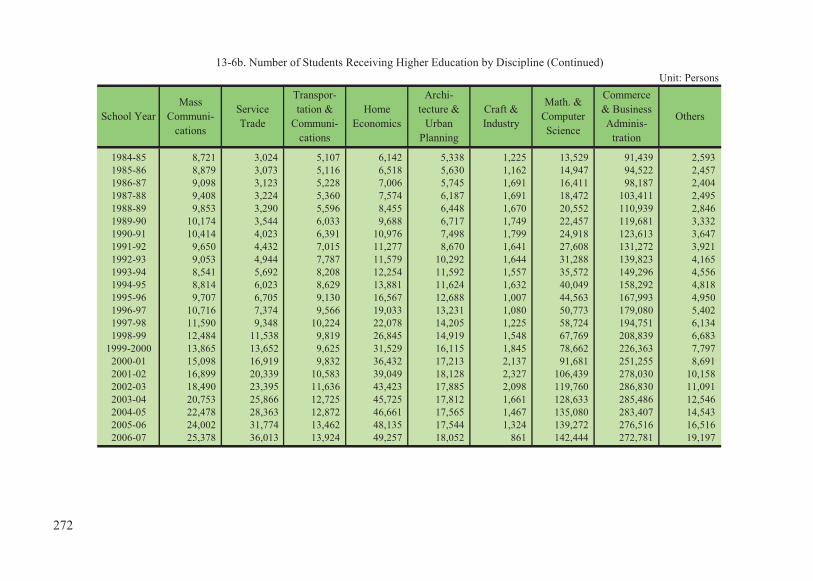
1984-85 8,721 3,024 5,107 6,142 5,338 1,225 13,529 91,439 2,593 1985-86 8,879 3,073 5,116 6,518 5,630 1,162 14,947 94,522 2,457 1986-87 9,098 3,123 5,228 7,006 5,745 1,691 16,411 98,187 2,404 1987-88 9,408 3,224 5,360 7,574 6,187 1,691 18,472 103,411 2,495 1988-89 9,853 3,290 5,596 8,455 6,448 1,670 20,552 110,939 2,846 1989-90 10,174 3,544 6,033 9,688 6,717 1,749 22,457 119,681 3,332 1990-91 10,414 4,023 6,391 10,976 7,498 1,799 24,918 123,613 3,647 1991-92 9,650 4,432 7,015 11,277 8,670 1,641 27,608 131,272 3,921 1992-93 9,053 4,944 7,787 11,579 10,292 1,644 31,288 139,823 4,165 1993-94 8,541 5,692 8,208 12,254 11,592 1,557 35,572 149,296 4,556 1994-95 8,814 6,023 8,629 13,881 11,624 1,632 40,049 158,292 4,818 1995-96 9,707 6,705 9,130 16,567 12,688 1,007 44,563 167,993 4,950 1996-97 10,716 7,374 9,566 19,033 13,231 1,080 50,773 179,080 5,402 1997-98 11,590 9,348 10,224 22,078 14,205 1,225 58,724 194,751 6,134 1998-99 12,484 11,538 9,819 26,845 14,919 1,548 67,769 208,839 6,683
1999-2000 13,865 13,652 9,625 31,529 16,115 1,845 78,662 226,363 7,797 2000-01 15,098 16,919 9,832 36,432 17,213 2,137 91,681 251,255 8,691 2001-02 16,899 20,339 10,583 39,049 18,128 2,327 106,439 278,030 10,158 2002-03 18,490 23,395 11,636 43,423 17,885 2,098 119,760 286,830 11,091 2003-04 20,753 25,866 12,725 45,725 17,812 1,661 128,633 285,486 12,546 2004-05 22,478 28,363 12,872 46,661 17,565 1,467 135,080 283,407 14,543 2005-06 24,002 31,774 13,462 48,135 17,544 1,324 139,272 276,516 16,516 2006-07 25,378 36,013 13,924 49,257 18,052 861 142,444 272,781 19,197
Craft &Industry
Math. &ComputerScience
Commerce& BusinessAdminis-
tration
Others
13-6b. Number of Students Receiving Higher Education by Discipline (Continued)Unit: Persons
School YearMass
Communi-cations
ServiceTrade
Transpor-tation &
Communi-cations
HomeEconomics
Archi-tecture &
UrbanPlanning
272

1998-99 915,921 38,901 89,362 302,177 24,097 99,671 35,273 - 1999-2000 994,283 42,043 101,447 311,783 24,843 108,469 39,718 -
2000-01 1,092,102 43,376 116,805 329,981 25,430 123,371 46,284 - 2001-02 1,187,225 46,141 130,709 342,534 26,466 136,578 52,498 22 2002-03 1,240,292 47,689 141,601 338,950 26,587 146,394 59,203 60 2003-04 1,270,194 48,794 151,423 335,296 27,515 150,405 65,143 91 2004-05 1,285,867 49,401 157,526 335,469 26,377 151,491 70,794 107 2005-06 1,296,558 48,828 162,564 333,933 25,579 154,506 77,759 121 2006-07 1,313,993 44,185 171,173 335,422 25,478 155,805 87,684 194 2007-08 1,326,029 43,984 175,866 334,726 26,528 156,399 96,825 1,419 2008-09 1,337,455 43,179 181,884 332,207 26,802 155,400 108,005 2,349 2009-10 1,336,659 41,936 187,703 323,649 27,513 155,471 117,535 2,256 2010-11 1,343,723 41,135 192,243 318,605 27,728 155,225 128,688 2,041 2011-12 1,352,225 40,693 198,330 310,950 28,338 153,773 141,779 1,592 2012-13 1,355,490 39,682 203,199 301,021 28,325 154,532 154,801 1,710 2013-14 1,346,221 38,704 206,932 290,798 27,991 154,628 163,774 1,592 2014-15 1,340,012 38,704 209,320 283,167 27,659 155,873 170,297 1,469 2015-16 1,332,637 38,600 210,522 277,364 27,601 157,310 173,797 1,352 2016-17 1,309,670 38,816 207,963 270,730 27,343 159,253 171,808 1,264
2017-18 1,274,191 35,969 211,647 59,334 240,979 64,641 80,510 251,675 16,325 150,911 160,931 1,2692018-19 1,245,260 35,701 207,323 58,234 231,777 62,300 83,239 244,825 16,700 150,391 153,271 1,499
Note: (1) Students were reclassified according to The Classification of Educational Level and Academic Disciplines in the R.O.C. (4th edition) in July2007, and the data were adjusted back to 1998-99. Since 2017-18, the data were classified by the R.O.C. standard educational classification-fields of study (5th edition).
(2) See note (1) of Table 13-2.
Engineering,Manufacturing
&Construction
Agriculture,Forestry,
Fisheries &VeterinaryMedicine
Health &Social
WelfareServices Unspeci-
fied
115,618
NaturalSciences,
Mathematics& Statistics
Information& Communi-
cationTechnologies
132,409127,162122,335
SchoolYear Total Edu-
cation
Humani-ties &Arts
SocialSciences,
Journalism& Library
Information
Business,Admini-stration& Law
329,393
143,646142,053141,447140,686140,715138,001
118,519129,471137,283140,722143,095144,856
326,361323,756316,875
346,636345,576339,149337,372336,055334,219
333,758350,337354,244353,980350,173349,196
Unit: Persons
Unspeci-fied
SchoolYear
246,340274,698302,425
80,10091,282104,430
Total Edu-cation
Humani-ties &Arts
13-6c. Number of Students Receiving Higher Education by Discipline (Continued)
Agriculture Health &Welfare Services
Engineering,Manufacturing
&Construction
Social Sciences,Business& Law
Science
273

Nursing & HomeMidwifery Economics
1952-53 139,388 21,046 71,900 6,350 40,092 14,735 8,868 12,877 1,189 441 1,9821955-56 213,540 30,169 116,192 6,782 60,397 23,206 11,279 18,905 1,724 592 4,5601960-61 355,274 57,512 205,853 7,572 84,337 24,765 13,030 36,612 1,963 1,083 6,5711965-66 663,753 116,197 426,822 3,159 117,575 26,776 17,396 58,555 3,441 1,936 9,4711970-71 1,154,589 178,537 799,223 924 175,905 19,231 63,084 76,748 4,937 5,193 6,7121975-76 1,505,993 185,181 1,036,357 2,040 282,415 13,218 127,698 120,579 6,416 9,287 5,1481980-81 1,605,567 180,665 1,075,532 232 349,138 15,191 163,982 140,615 6,252 11,000 10,9111985-86 1,678,767 194,757 1,062,226 - 421,784 18,376 209,701 149,833 6,022 12,196 25,0481990-91 1,818,301 209,010 1,160,180 - 449,111 17,801 202,978 159,119 5,677 15,664 46,1691995-96 1,935,613 255,387 1,156,814 - 523,412 19,288 222,614 199,211 8,071 24,809 47,6762000-01 1,713,489 356,589 929,534 - 427,366 15,293 179,620 167,646 7,182 18,615 35,9612005-06 1,703,414 420,608 951,202 - 331,604 9,321 141,826 135,571 4,408 2,600 33,8862007-08 1,707,331 414,557 953,277 - 339,497 9,594 139,940 147,618 3,635 - 33,3842008-09 1,704,855 406,316 951,976 - 346,563 9,718 139,893 155,117 3,428 - 32,7392009-10 1,706,325 403,183 948,534 - 354,608 9,881 138,703 163,973 3,619 - 32,4832010-11 1,682,958 400,642 919,802 - 362,514 9,868 138,354 172,176 3,642 - 32,1392011-12 1,641,633 401,958 873,226 - 366,449 10,612 129,116 123,089 2,454 - 93,9762012-13 1,617,009 402,689 844,884 - 369,436 10,775 128,263 123,486 2,400 - 96,2732013-14 1,585,444 393,313 831,925 - 360,206 10,974 124,482 117,883 2,376 - 95,561
Note: The study classification of vocational high schools was redefined as of school year 2011. Starting in school year 2011, the statistics are based on the updated version.
Agri-cultural Industrial
Commer-cial
MarineProducts
Nursing &Midwifery
HomeEconomics
Others
2014-15 1,622,099 803,233 311,213 65,042 10,919 119,050 110,977 2,282 - 93,360 9,349 37,741 58,9332015-16 1,540,014 747,724 309,410 57,481 10,618 117,489 106,457 2,171 - 90,714 9,905 35,696 52,3492016-17 1,463,325 687,212 311,077 50,737 10,532 116,320 104,157 2,126 - 88,532 10,517 34,794 47,3212017-18 1,398,737 653,273 310,239 44,929 10,386 112,586 98,814 2,030 - 81,397 10,436 33,041 41,6062018-19 1,321,282 624,407 300,704 38,118 10,068 105,365 91,688 2,044 - 71,918 9,767 31,079 36,124
Note: See note of Table 13-4. Source: See Table 13-1.
1,187
High SchoolSchoolYear Industrial Commer-
cial
- 69
Others
Vocational School
13-7. Number of Students Receiving High School, Normal and Vocational Education
Subtotal Agri-cultural
NormalSchoolTotal
-
Senior Junior
Unit: Persons
-
Vocational EducationSchoolYear
Total
5,668
3,049
7,2028,2398,930
6081,7031,743
MarineProducts
131313
3,9925,326
5,9496,335
JuniorHigh
SchoolGeneral
Edu.
Compre-hensive
HighSchool
Senior Secondary School
PracticalTechnicalProgram
Conti-nuingEdu.
274

% of Elementary % of Junior High % of Senior HighSchool Graduates School Graduates School GraduatesEnrolled in Junior Enrolled in Senior Enrolled in Schools of
High Schools High Schools Higher Education1952-53 34.85 56.96 26.27 1955-56 43.94 63.13 44.27 1960-61 52.24 75.88 43.41 1965-66 58.23 78.52 38.30 1970-71 78.59 82.66 41.92 1975-76 89.47 65.82 39.80 1980-81 96.14 65.16 44.64 1985-86 98.73 71.31 40.19 1990-91 99.77 84.70 48.58 1995-96 99.75 89.17 56.58 1998-99 99.60 93.94 67.43
1999-2000 99.89 94.73 74.35 2000-01 99.79 95.31 74.77 2001-02 99.15 95.97 77.13 2002-03 99.70 95.48 81.21 2003-04 99.44 95.74 82.20 2004-05 99.42 96.03 86.01 2005-06 99.31 94.88 88.44 2006-07 99.54 96.23 91.13 2007-08 99.66 96.26 93.61 2008-09 99.78 95.38 95.32 2009-10 99.85 97.63 95.56 2010-11 99.89 98.15 95.24 2011-12 99.91 97.67 94.67 2012-13 99.91 99.15 94.75 2013-14 99.85 99.39 95.50 2014-15 99.95 99.52 95.70 2015-16 99.99 99.59 95.50 2016-17 100.00 99.75 95.80 2017-18 100.00 99.78 95.95 2018-19 100.00 99.80 94.30
Note: The senior high school in this table means the general education and the comprehensive high school of senior secondary school. Source: See Table 13-1.
13-8. Percentage of Graduates Enrolled in Next Higher Level of Schools
School Year
275

1952-53 6 35 46 53 20 48 1955-56 7 40 48 52 21 46 1960-61 10 51 47 53 21 46 1965-66 15 59 51 52 25 42 1970-71 24 64 50 51 26 41 1975-76 27 66 50 48 25 38 1980-81 28 67 47 44 23 32 1985-86 29 69 46 44 22 32 1990-91 30 69 45 42 22 29 1995-96 31 70 43 35 20 22 1998-99 32 71 40 32 18 20
1999-2000 32 71 39 31 18 20 2000-01 32 72 38 31 17 19 2001-02 33 72 38 30 17 19 2002-03 33 73 38 30 17 18 2003-04 33 73 38 30 17 18 2004-05 33 73 38 30 17 18 2005-06 33 73 38 29 17 18 2006-07 33 73 37 29 17 18 2007-08 34 73 37 28 17 17 2008-09 34 73 37 28 17 17 2009-10 34 73 36 27 17 16 2010-11 34 74 36 26 16 15 2011-12 34 73 35 25 16 15 2012-13 34 73 35 24 16 14 2013-14 34 73 34 24 15 13 2014-15 34 73 33 23 15 13 2015-16 34 73 32 23 14 12 2016-17 34 73 32 23 14 12 2017-18 34 73 31 23 13 12 2018-19 35 73 31 23 13 12 Source: See Table 13-1.
PrimaryEducation
SecondaryEducation
Number of Schools per 1,000 Km2 Number of Students per Class
13-9. Availability of Schools and Teachers
Number of Students per TeacherSchool Year Primary
EducationSecondaryEducation
PrimaryEducation
SecondaryEducation
276

1976-77 2,899 3,660 5,669 9,067 10,479 14,706 27,530 1980-81 6,821 8,506 12,855 20,190 24,276 33,658 61,006 1985-86 18,878 13,354 21,230 29,869 34,342 56,888 97,666 1990-91 34,788 29,979 42,250 57,642 66,350 66,050 188,484 1993-94 38,789 48,717 62,081 72,530 81,901 85,954 204,795 1994-95 45,405 54,391 67,887 73,647 87,037 83,786 195,870 1995-96 47,606 62,699 76,342 84,310 95,863 87,792 198,611 1998-99 55,652 75,615 102,568 90,260 109,726 95,998 160,713
1999-2000 60,056 75,197 111,984 91,905 116,637 109,253 162,184 2000-01 61,992 75,759 117,126 91,995 109,854 91,499 169,906 2001-02 66,556 75,845 115,182 88,553 96,246 116,784 152,275 2002-03 69,943 76,248 115,155 86,846 101,556 113,948 158,866 2003-04 73,858 77,948 118,957 90,576 104,846 140,618 160,950 2004-05 76,415 82,651 122,832 92,219 106,153 131,820 164,518 2005-06 75,323 87,715 125,973 92,386 105,644 121,804 171,965 2006-07 83,445 91,402 127,391 94,434 103,513 104,737 175,263 2007-08 94,736 95,223 125,188 101,160 107,324 135,348 180,800 2008-09 101,228 101,684 122,951 101,326 109,831 103,589 170,602 2009-10 112,565 107,419 122,542 102,905 109,495 95,345 171,821 2010-11 121,863 114,929 129,198 101,022 108,854 92,674 170,506 2011-12 115,015 105,047 107,942 111,317 178,065 2012-13 111,875 106,609 110,890 104,439 185,097 2013-14 117,475 95,288 182,901 2014-15 120,957 96,370 184,910 2015-16 123,481 105,393 187,271 2016-17 124,135 106,305 190,852 2017-18 123,940 100,271 199,952
Note: (1) The educational expenditure of the elementary school and the junior high school could not be seperated from each other since school year 2011.
(2) see note (3) of Table 13-1.Source: See Table 13-1.
JuniorCollege
University &College
179,022 123,666
13-10. Educational Expenditure Per Student at All LevelsUnit: NT$
School Year Pre-SchoolEducation
ElementarySchool
Jr. HighSchool
Sr. HighSchool
Sr. VocationalSchool
133,897 (1)
154,893147,529
110,012 (2)
186,344 129,367
169,428 120,022160,701 113,728
277

1952-61 558 77 10 11 19 82 47 178 22 60 52 Average
1962 1,833 279 44 38 85 306 229 575 42 225 10 1963 2,125 274 55 56 70 398 265 693 56 250 8 1964 2,514 354 73 52 84 541 315 715 83 291 6 1965 2,339 383 72 54 76 501 315 553 94 281 10 1966 2,189 336 67 48 54 445 372 521 107 234 5 1969 3,444 480 58 138 69 728 741 717 116 397 - 1970 2,056 240 23 50 27 318 515 553 86 244 - 1971 2,558 329 33 74 43 500 625 607 79 268 - 1972 2,149 260 23 79 41 473 532 439 88 214 - 1973 1,966 254 29 60 43 350 502 425 97 206 - 1974 2,285 237 32 37 55 442 596 568 98 220 - 1975 2,301 325 32 79 55 448 537 528 96 201 - 1976 3,641 489 56 89 66 790 802 927 180 242 - 1977 3,852 567 73 112 69 928 732 935 198 238 - 1978 4,756 682 77 169 97 1,228 827 1,218 213 245 - 1979 5,801 869 112 150 127 1,662 853 1,390 296 342 - 1980 5,933 903 115 156 112 1,761 846 1,421 279 340 - 1981 5,363 807 123 166 88 1,498 720 1,439 255 267 - 1982 5,925 768 97 103 105 1,510 856 2,058 205 223 -
Source: See Table 13-1.
NaturalSciences
Engi-neering
MedicalScience
SocialSciences
Agri-culture
Edu-cation
FineArts Law Others
13-11a. Students Studying AbroadUnit: Persons
Period Total Hu-manities
278

1983 (1) 5,690 116 104 724 445 977 91 515 275 230 1984 5,410 73 89 659 337 867 61 439 258 235 1985 5,979 78 113 768 459 967 112 471 331 226 1986 7,016 87 125 862 473 1,199 120 517 393 287 1987 6,599 54 144 781 390 1,044 103 453 384 279 1988 7,122 79 159 902 452 1,163 116 482 484 284 1989 3,900 28 99 453 263 675 49 257 306 187 1990 (2) 94 6 0 13 9 8 5 6 2 21 1991 103 11 2 13 19 9 5 8 4 5 1992 111 10 6 20 16 5 4 11 3 15 1993 148 11 12 23 18 9 6 11 2 13 1994 125 9 10 19 17 8 11 13 3 14 1995 108 7 7 12 16 11 7 9 0 4 1996 89 8 7 10 14 4 6 11 2 6 1997 97 6 7 6 18 6 9 12 3 5 1998 85 9 9 10 8 3 9 4 0 7 1999 59 8 8 5 7 6 6 3 0 7 2000 (3) 134 7 14 12 12 13 9 13 1 11 2001 142 6 11 9 19 12 8 17 0 7 2002 132 5 7 4 9 10 8 15 4 8 2003 108 8 7 2 19 15 4 19 1 7 2004 133 14 8 14 13 9 8 17 8 8 2005 227 5 32 4 34 31 5 28 15 32 2006 93 3 9 1 24 9 4 10 2 12
Note: (1) Since the school year 1983, curricula in Taiwan's institutions of higher learning have been organized according to ISCED of UNESCO. (2) Students studying abroad without government scholarships have been excluded since July 1989. (3) Since the school year 2000, the figures refer to the number of students passing examinations of government sponsorship for overseas study.
Social &BehavioralSciences
Commerce &Business
Administration
Law &Juris-
prudence
NaturalSciences
Math. &ComputerScience
MedicalScience
13-11b. Students Studying Abroad (Continued)Unit: Persons
Period Total Education FineArts Humanities
279

1983 (1) 18 1,571 79 225 49 79 39 129 24 0 1984 11 1,606 105 229 60 68 42 142 129 0 1985 3 1,759 111 238 61 103 27 143 9 0 1986 16 2,056 122 270 72 95 40 151 131 0 1987 0 2,017 110 218 76 107 37 146 256 0 1988 15 1,936 121 247 89 88 38 153 314 0 1989 13 1,065 60 137 31 59 30 73 115 0 1990 (2) 0 14 1 6 0 0 0 2 1 0 1991 0 16 1 8 0 0 0 2 0 0 1992 0 11 0 5 1 2 2 0 0 0 1993 0 21 0 13 1 3 0 1 4 0 1994 1 11 0 5 0 1 0 0 3 0 1995 0 17 0 14 0 1 0 1 2 0 1996 0 5 1 6 1 2 0 2 4 0 1997 0 5 2 7 0 2 0 1 8 0 1998 0 7 2 11 0 0 1 1 4 0 1999 0 2 0 1 0 1 0 0 5 0 2000 (3) 0 4 0 5 1 1 0 2 4 25 2001 0 6 1 4 0 2 0 1 12 27 2002 0 3 4 6 0 1 0 1 6 41 2003 0 14 3 4 0 0 0 1 4 0 2004 1 14 4 4 0 1 0 3 7 0 2005 0 20 5 5 0 0 0 6 5 0 2006 0 5 2 2 0 1 0 3 6 0
(4) The figures for 2000-2002 include those not categorized by major at the time they were awarded a government scholarship, including post-doctoral researchers, short-term researchers, and participants in special programs to foster short-term researchers in key technologies.
HomeEconomics
Transpor-tation &Commu-nications
TourismService
MassCommu-nications
Others UnclassifiableMajors (4)
13-11c. Students Studying Abroad (Continued)Unit: Persons
Period Craft &Industry
Engi-neering
Archi-tecture
& UrbanPlanning
Agri-culture,Forestry
& Fishery
280

2007 (5) 92 6 10 7 2 9 10 0 2008 103 4 23 6 2 7 10 0 2009 115 8 22 7 3 2 7 0 2010 122 6 24 8 4 6 7 0 2011 135 7 33 11 2 7 14 0 2012 135 7 32 11 3 9 15 0 2013 100 2 18 4 1 3 7 0 2014 101 3 21 5 1 2 9 0 2015 100 6 25 7 2 6 4 0 2016 101 3 21 8 5 4 6 0
(5) The figures refer to the number of students passing government scholarship examination and are reclassified according to The Classification of Educational Level and Academic Disciplines in the R.O.C. (4th edition) in July 2007.
2017 (6) 115 5 26 25 18 15 2 11 3 6 4 - 2018 119 10 30 26 13 15 5 7 3 8 2 -
(6) The figures refer to the number of students passing government scholarship examination and are based by the R.O.C. standard educational Classification-fields of study (5th edition).
Services Unspeci-fied
13-11d. Students Studying Abroad (Continued)Unit: Persons
Total Edu-cation
Humani-ties &
ArtsAgriculture Health &
Welfare
Engineering,Manufacturing& Construction
Agriculture,Forestry,
Fisheries &VeterinaryMedicine
Health &Social
Welfare
54484647
5245
SocialSciences,
Journalism& Library
Information
Science
13201219
Social Sciences,Business & Law
3135
Period
Period Total Edu-cation
NaturalSciences,
Mathematics& Statistics
Information& Communi-
cationTechnologies
15119
Humani-ties &
Arts
43
Business,Admini-
stration &Law
56
Services Unspeci-fied
8511
Engineering,Manufacturing& Construction
281

2007 193 961 44 1,8752008 198 982 40 1,8292009 189 1,018 39 1,8712010 193 1,078 42 1,9072011 207 1,121 38 1,9242012 209 1,183 37 1,9852013 212 1,181 35 2,0112014 220 1,240 35 1,9972015 234 1,238 32 2,0362016 241 1,238 29 2,0572017 246 1,244 32 2,0912018 252 1,247 32 2,155
Source: The data are provided by the Minister of Culture, R.O.C.(Taiwan).
Unit : event / person-time
Total VisualArt Crafts Design Music Drama Dance
TraditionalNarrative& Musical
Performance
Movie, TV&
Broadcast
Folk &CulturalAssets
Literature& Books Others Mixed
type
2007 46,412 5,151 2,430 702 7,561 2,756 1,558 185 8,716 3,538 7,672 3,550 2,593 120,794,0002008 50,705 5,513 2,812 767 8,204 3,537 1,548 201 9,356 3,821 8,122 4,114 2,710 137,351,0002009 55,267 6,082 2,624 793 8,159 3,706 1,606 202 10,427 3,982 10,392 4,333 2,961 162,909,0002010 57,289 6,016 2,609 1,042 8,074 3,760 1,751 268 11,610 4,217 10,879 2,341 4,722 172,832,0002011 59,300 5,766 2,736 1,179 8,431 3,820 1,902 221 11,579 4,052 12,772 4,234 2,608 200,634,0002012 64,534 5,935 2,696 1,262 8,541 4,066 2,014 139 12,356 4,324 15,927 4,391 2,883 228,304,0002013 66,389 6,156 3,024 1,320 8,742 3,954 1,823 139 12,450 4,738 16,855 4,443 2,745 254,307,0002014 64,685 5,419 2,285 1,005 8,566 4,013 1,418 164 12,569 5,411 18,191 2,897 2,747 263,297,0002015 53,908 5,928 2,345 1,249 9,034 4,206 1,285 115 6,910 5,409 13,163 1,776 2,488 247,187,0002016 56,107 5,701 2,090 1,457 8,003 3,859 1,137 146 7,984 5,517 17,226 274 2,713 257,250,0002017 58,195 6,226 2,428 1,734 8,932 4,121 1,223 159 7,685 5,629 16,878 195 2,985 263,037,0002018 55,839 6,388 2,598 1,649 9,016 3,780 1,207 126 7,336 5,455 15,145 106 3,033 238,489,000
Source: The data are provided by the Minister of Culture, R.O.C.(Taiwan).
Newspapers Periodicals
13-13. Arts and Cultural Activities in Taiwan
End of Year
13-12. Number of Newspapers, Periodicals, News Agencies and Publishing Corporations
Year
Activities
Attendances
News Agencies Publishing Corporations
282

14. HEALTH AND MEDICAL CARE


End ofYear Total Physicians
Doctors ofChinese
Medicine
Dentists &Assistants
Pharmacists&
AssistantsNurses
RegisteredProfessionalMidwives
MedicalTechnologists& Technicians
Medical RadiationTechnologists
& RadiologicalTechnicians
1955 10,343 3,998 1,629 925 1,008 974 1,809 … …1960 12,427 4,811 1,688 1,034 1,386 1,484 2,024 … …1965 13,017 5,062 1,594 1,015 1,547 1,611 2,188 … …1970 13,646 5,092 1,384 1,017 2,482 2,071 1,600 … …1975 26,597 9,148 1,575 1,412 6,882 4,919 2,661 … …1980 42,417 11,748 1,590 2,090 11,932 11,659 2,904 494 …1985 66,278 15,039 1,892 3,433 16,300 24,248 2,408 1,982 976 1990 91,153 19,921 2,372 5,580 17,944 38,357 1,891 3,657 1,431 1995 118,248 24,465 3,030 7,131 19,224 56,743 842 4,722 1,793 1996 123,829 24,790 2,992 7,332 19,667 61,494 774 5,034 1,453 1997 137,829 25,730 3,299 7,650 21,246 69,665 782 5,389 2,266 1998 144,070 27,168 3,461 7,993 22,761 71,215 704 5,583 2,485 1999 152,385 28,216 3,546 8,304 23,937 75,603 649 6,015 2,500 2000 159,212 29,585 3,733 8,656 24,404 79,176 558 6,230 2,761 2001 165,855 30,562 3,979 9,012 24,891 82,763 518 6,542 3,152 2002 175,444 31,532 4,101 9,273 25,355 89,568 490 6,725 3,410 2003 183,103 32,390 4,266 9,618 25,033 95,271 476 7,055 3,557 2004 192,611 33,360 4,588 9,935 26,079 101,465 459 7,122 3,704 2005 199,734 34,093 4,610 10,202 26,750 104,786 397 7,323 3,880 2006 206,959 34,899 4,743 10,458 27,412 109,153 368 7,457 4,052 2007 214,748 35,849 4,862 10,783 28,040 113,832 347 7,642 4,211 2008 223,623 37,142 5,112 11,136 28,741 118,785 308 7,896 4,443 2009 233,553 37,880 5,290 11,393 29,587 125,081 258 8,203 4,651 2010 241,156 38,887 5,354 11,697 30,001 128,955 208 8,377 4,913 2011 250,258 40,002 5,570 12,032 31,300 133,336 134 8,579 5,133 2012 258,283 40,938 5,740 12,431 32,015 137,641 120 8,751 5,341 2013 265,759 41,965 5,977 12,834 32,668 140,915 132 9,006 5,507 2014 271,555 42,961 6,156 13,213 33,162 142,708 149 9,132 5,774 2015 280,508 44,006 6,298 13,536 33,516 148,223 150 9,261 5,952 2016 289,174 44,849 6,441 13,945 33,908 153,509 154 9,400 6,164 2017 299,782 46,356 6,692 14,413 34,526 159,621 164 9,561 6,416 2018 312,887 47,471 6,880 14,751 34,838 167,803 179 9,698 6,629
Source: The data are provided by the Ministry of Health and Welfare, R.O.C. (Taiwan).
14-1a. Health WorkforceUnit: Persons
283

End ofYear Dietitians
PhysicalTherapists& TherapyTechnicians
OccupationalTherapists &
TherapyTechnicians
ClinicalPsychologists
CounselingPsychologists
RespiratoryTherapists
Speech-Language
PathologistsAudiologists
DentalTechnologists& Technicians
Optician &Technicians
(1)
1955 … … … … … … … … … …1960 … … … … … … … … … …1965 … … … … … … … … … …1970 … … … … … … … … … …1975 … … … … … … … … … …1980 … … … … … … … … … …1985 … … … … … … … … … …1990 … … … … … … … … … …1995 298 … … … … … … … … …1996 293 … … … … … … … … …1997 515 1,287 … … … … … … … …1998 575 1,720 405 … … … … … … …1999 656 2,290 669 … … … … … … …2000 743 2,620 746 … … … … … … …2001 778 2,790 868 … … … … … … …2002 845 3,084 1,061 … … … … … … …2003 895 3,373 1,169 … … … … … … …2004 978 3,614 1,307 … … … … … … …2005 1,056 3,742 1,447 379 170 899 … … … …2006 1,137 3,901 1,526 478 278 1,097 … … … …2007 1,239 4,172 1,744 524 325 1,178 … … … …2008 1,379 4,457 1,882 584 423 1,335 … … … …2009 1,563 4,867 2,105 643 524 1,508 … … … …2010 1,687 5,214 2,287 696 671 1,657 434 118 0 …2011 1,824 5,608 2,496 757 836 1,810 498 157 186 …2012 2,050 5,878 2,660 832 1,000 1,892 554 181 259 …2013 2,234 6,203 2,806 925 1,122 1,950 676 233 606 …2014 2,304 6,435 2,948 998 1,298 2,040 708 259 1,310 …2015 2,392 6,811 3,076 1,064 1,513 2,086 770 271 1,583 …2016 2,525 7,181 3,274 1,182 1,644 2,140 813 284 1,761 …2017 2,631 7,581 3,427 1,282 1,801 2,197 892 307 1,853 62 2018 3,061 8,222 3,843 1,387 2,255 2,244 993 346 2,026 261
(1) Optician & Technicians were added since 2017.
Unit: Persons14-1b. Health Workforce (Continued)
284

1955 35.8 8,878 6.4 1,584 2,902 1960 33.1 9,919 5.5 1,661 2,686 1965 32.9 11,578 5.4 1,901 2,851 1970 (1) 32.7 13,187 5.6 2,240 2,494 1975 3.9 1,732 3.4 1,492 526 1980 3.3 1,624 2.7 1,323 446 1985 3.0 1,553 2.1 1,130 258 1990 2.8 1,578 1.6 913 228 1995 2.2 1,326 1.3 777 190 1996 2.2 1,293 1.3 775 187 1997 2.1 1,250 1.2 749 179 1998 2.0 1,237 1.2 716 176 1999 2.0 1,243 1.1 696 180 2000 2.0 1,232 1.1 669 176 2001 2.0 1,227 1.0 649 175 2002 2.0 1,236 1.0 632 169 2003 1.9 1,204 1.0 617 166 2004 1.9 1,179 1.0 598 158 2005 1.9 1,172 0.9 588 156 2006 1.8 1,162 0.9 577 154 2007 1.8 1,154 0.9 564 152 2008 1.8 1,142 0.9 545 151 2009 1.8 1,139 0.8 536 148 2010 1.7 1,119 0.8 524 146 2011 1.7 1,099 0.8 510 145 2012 1.7 1,088 0.8 500 145 2013 1.7 1,076 0.8 488 147 2014 1.6 1,063 0.7 477 145 2015 1.6 1,059 0.7 467 145 2016 1.6 1,052 0.7 459 144 2017 1.6 1,042 0.7 444 143 2018 1.6 1,034 0.7 434 141
(1) Figures for years prior to 1971 refer to provincial, county and city health and medical care facilities; figures for 1971 and after refer to all public and private hospitals and clinics.(2) Including Chinese medicine doctors.Source: See Table 14-1a.
14-2. Availability of Medical Care
End of YearArea Served by Each
Health & Medical Facility(km2)
Persons Servedby Each Health
& Medical Facility
Area Served byEach Physician
(km2) (2)
Persons Served byEach Physician
(2)Persons Per Bed
285

Unit: Persons
1998 … 0 … 0 0 74 334 12 41999 … 0 … 0 0 49 65 13 112000 … 0 … 0 0 43 140 16 32001 … 0 … 0 0 59 270 43 112002 … 0 … 1 0 54 5,388 46 182003 … 0 347 0 0 40 145 26 152004 … 0 0 0 0 38 427 24 192005 … 0 0 0 0 35 306 20 132006 0 0 0 0 0 43 1,074 13 102007 0 0 0 0 0 34 2,179 20 62008 0 0 0 0 0 33 714 19 112009 0 0 0 0 0 80 1,052 2 62010 0 0 0 0 0 33 1,896 7 122011 0 0 0 0 0 49 1,702 5 62012 0 0 0 1 0 26 1,478 6 82013 0 0 0 1 0 19 860 6 92014 0 0 0 0 0 25 15,732 3 82015 0 0 0 0 0 29 43,784 3 32016 0 0 0 0 0 14 744 8 62017 0 0 0 0 0 16 343 12 4
2018(2) 0 0 0 0 0 17 533 6 8 (1)Calculation for these diseases were based on confirmed cases.
Source: See Table 14-1a.
(2)The case amount of these diseases contained imported ones, including 13 typhoid fever, 350 dengue fever, one meningococcal meningitis and seven paratyphoid fever.
14-3a. Incidence of Communicable Diseases(1)
Dengue Fever ParatyphoidFeverPeriod Smallpox Plague SARS Rabies Diphtheria Typhoid
FeverMeningococcal
Meningitis
286

Unit: Persons
1998 0 116 425 21 0 49 9 163 …1999 0 59 210 55 0 32 1 103 02000 0 63 321 322 0 42 6 68 02001 0 101 1,327 303 0 29 10 257 12002 0 84 436 289 0 28 24 212 02003 0 65 246 121 0 34 6 160 02004 0 56 156 96 0 18 0 204 02005 0 61 174 120 0 26 7 257 02006 0 66 139 125 0 26 4 189 02007 0 51 246 145 0 13 10 203 02008 0 74 90 227 0 18 16 236 02009 0 45 91 190 0 11 48 234 02010 0 49 172 262 0 21 12 110 02011 0 45 203 256 0 17 33 104 02012 0 51 155 258 0 12 9 99 02013 0 25 155 270 0 13 8 139 02014 0 29 132 300 0 19 26 117 02015 0 19 186 350 0 8 29 171 02016 0 41 225 314 0 13 14 1,133 02017 0 61 162 378 0 7 6 369 0
2018 (3) 0 66 172 334 0 7 40 88 0
14-3b. Incidence of Communicable Diseases (Continued)
AcuteHepatitis
AMeasles EHEC Infection
(3)The case amount of these diseases contained imported ones, including 59 shigellosis, 171 amoebiasis, seven malaria, 12 measles, and 33 acute hepatitis A. (4)No wild poliovirus was detected since 1984. Nationwide surveillance of acute flaccid paralysis (AFP) was used for detecting cases of poliomyelitis after implementing the “Eradication Program for Measles, Congenital Rubella Syndrome, Poliomyelitis and Neonatal Tetanus” in 1992. AFP cases aged 15 years and above had been excluded since 2005.
Malaria
Indigenous ImportedAmoebiasisShigellosis
AcuteFlaccid
Paralysis(4)
PoliomyelitisPeriod
287
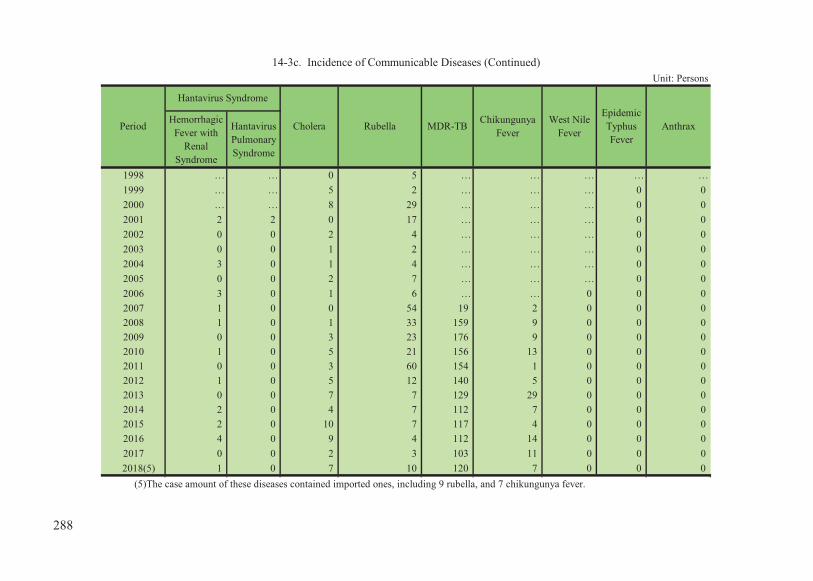
Unit: Persons
HemorrhagicFever with
RenalSyndrome
HantavirusPulmonarySyndrome
1998 … … 0 5 … … … … …1999 … … 5 2 … … … 0 02000 … … 8 29 … … … 0 02001 2 2 0 17 … … … 0 02002 0 0 2 4 … … … 0 02003 0 0 1 2 … … … 0 02004 3 0 1 4 … … … 0 02005 0 0 2 7 … … … 0 02006 3 0 1 6 … … 0 0 02007 1 0 0 54 19 2 0 0 02008 1 0 1 33 159 9 0 0 02009 0 0 3 23 176 9 0 0 02010 1 0 5 21 156 13 0 0 02011 0 0 3 60 154 1 0 0 02012 1 0 5 12 140 5 0 0 02013 0 0 7 7 129 29 0 0 02014 2 0 4 7 112 7 0 0 02015 2 0 10 7 117 4 0 0 02016 4 0 9 4 112 14 0 0 02017 0 0 2 3 103 11 0 0 0
2018(5) 1 0 7 10 120 7 0 0 0
14-3c. Incidence of Communicable Diseases (Continued)
ChikungunyaFever
Period Cholera Rubella West NileFever
MDR-TB
Hantavirus SyndromeEpidemicTyphusFever
Anthrax
(5)The case amount of these diseases contained imported ones, including 9 rubella, and 7 chikungunya fever.
288

1998 34 21 22 14,169 0 411 2 0 01999 19 20 24 13,496 0 377 4 0 12000 47 24 13 13,910 0 226 4 0 02001 6 19 33 14,486 3 355 152 4 12002 18 15 19 16,758 0 417 156 9 12 2003 26 13 25 15,042 0 327 167 11 11 2004 21 16 32 16,784 0 378 195 12 18 2005 38 16 35 16,472 0 321 172 4 21 2006 14 14 29 15,378 0 245 154 5 112007 41 10 37 14,480 1 202 153 1 12 2008 41 18 17 14,265 1 231 124 4 14 2009 90 12 18 13,336 0 152 131 1 9 2010 61 12 33 13,237 0 172 41 1 7 2011 77 10 22 12,634 0 163 34 0 12 2012 54 17 32 12,338 0 97 34 0 9 2013 51 24 16 11,528 0 97 10 0 9 2014 78 9 18 11,326 0 120 205 1 9 2015 70 12 30 10,711 0 125 217 2 8 2016 17 14 23 10,328 0 118 207 2 16 2017 34 11 25 9,759 1 151 325 0 13
2018 (6) 30 4 37 9,179 0 143 510 0 10 (6) The case amount of these diseases contained imported ones, including 2 pertussis, 10 acute hepatitis B and 7 acute hepatitis C. (7) Calculation for tetanus and mumps were based on reported cases only.
14-3d. Incidence of Communicable Diseases (Continued)Unit: Persons
TuberculosisCongenital
RubellaSyndrome
AcuteHepatitis B
AcuteHepatitis C
AcuteHepatitis D
AcuteHepatitis EPeriod Pertussis Tetanus
(7)Japanese
Encephalitis
289

Unit: Persons
1998 0 270 20 31 2,407 … 91 … …1999 0 261 22 31 3,038 … 163 … 35 2000 0 375 63 45 3,875 … 361 … 291 2001 0 444 40 49 4,256 … 443 … 393 2002 0 665 72 41 4,182 … 838 … 162 2003 0 676 109 22 3,947 … 1,626 … 70 2004 0 1,081 106 20 5,209 … 1,978 … 50 2005 10 1,158 38 12 5,305 … 1,515 … 142 2006 9 971 56 16 5,808 … 1,437 … 11 2007 10 1,208 56 16 5,798 … 1,442 0 12 2008 22 1,145 69 12 6,526 … 1,621 0 373 2009 18 1,068 84 14 6,668 … 2,137 0 29 2010 13 1,125 102 12 6,482 … 2,265 0 16 2011 10 1,171 97 9 6,372 … 1,978 0 59 2012 10 1,061 88 3 5,896 … 1,983 0 153 2013 5 1,170 115 10 6,346 … 2,155 0 12 2014 1 880 135 4 6,986 … 2,622 0 6 2015 2 773 153 3 7,471 … 3,587 0 62016 0 616 114 14 8,725 1 4,469 0 332017 0 636 188 6 9,835 0 4,601 0 24
2018 (9) 0 600 211 5 9,808 0 4,209 0 36
(9)The case amount of these diseases contained imported ones, including 11 cases of Legionnaires' disease were imported. (8)Calculation for tetanus and mumps were based on reported cases only.
14-3e. Incidence of Communicable Diseases (Continued)
PeriodAcute
HepatitisUnspecified
Mumps(8)
Legionnaires'Disease
InvasiveHaemophilus
InfluenzaeType b Infection
Syphilis Gonorrhea NeonatalTetanus
Enteroviruses Infection
with SevereComplications
CongenitalSyphilis
290
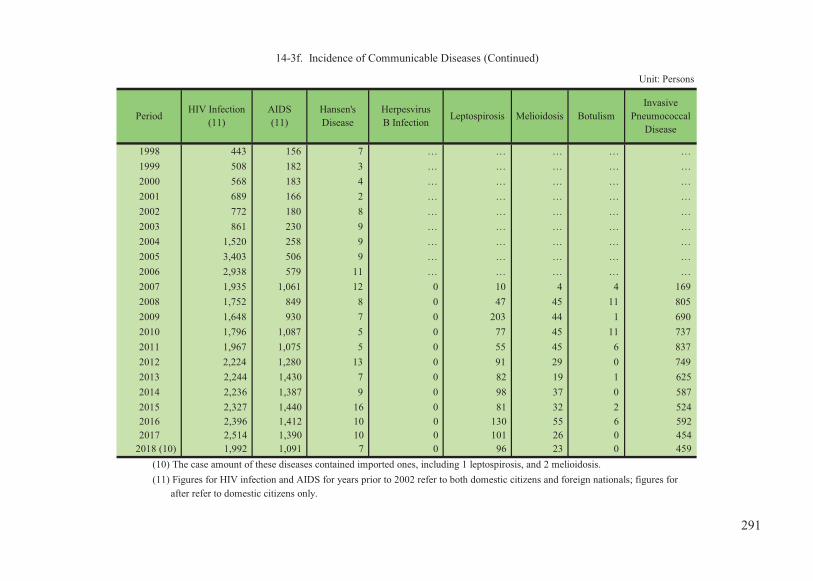
Unit: Persons
1998 443 156 7 … … … … …1999 508 182 3 … … … … …2000 568 183 4 … … … … …2001 689 166 2 … … … … …2002 772 180 8 … … … … …2003 861 230 9 … … … … …2004 1,520 258 9 … … … … …2005 3,403 506 9 … … … … …2006 2,938 579 11 … … … … …2007 1,935 1,061 12 0 10 4 4 169 2008 1,752 849 8 0 47 45 11 805 2009 1,648 930 7 0 203 44 1 690 2010 1,796 1,087 5 0 77 45 11 737 2011 1,967 1,075 5 0 55 45 6 837 2012 2,224 1,280 13 0 91 29 0 749 2013 2,244 1,430 7 0 82 19 1 6252014 2,236 1,387 9 0 98 37 0 5872015 2,327 1,440 16 0 81 32 2 5242016 2,396 1,412 10 0 130 55 6 5922017 2,514 1,390 10 0 101 26 0 454
2018 (10) 1,992 1,091 7 0 96 23 0 459
(11) Figures for HIV infection and AIDS for years prior to 2002 refer to both domestic citizens and foreign nationals; figures for
14-3f. Incidence of Communicable Diseases (Continued)
PeriodHIV Infection
(11)AIDS(11)
Hansen'sDisease
HerpesvirusB Infection Leptospirosis Melioidosis Botulism
InvasivePneumococcal
Disease
(10) The case amount of these diseases contained imported ones, including 1 leptospirosis, and 2 melioidosis.
after refer to domestic citizens only.
291

Unit: Persons
1998 � � � � 321 � � �1999 � � � � 302 � � 2 2000 � � � � 270 � � 4 2001 � � � � 235 � � 7 2002 � � � � 237 � � 5 2003 � � � � 271 � � 16 2004 � � � � 368 � � 19 2005 � � � � 462 � � 33 2006 � � � � 384 � � 25 2007 17 6 1 0 510 � 2 26 2008 91 31 2 0 492 � 3 22 2009 89 40 0 0 353 � 7 1,134 2010 89 42 0 0 402 � 5 882 2011 35 26 0 1 322 � 5 1,481 2012 53 37 1 0 460 � 12 1,595 2013 48 27 0 0 538 � 15 9652014 42 21 2 0 414 55 12 1,7212015 43 35 2 0 494 54 13 8572016 45 13 2 0 488 40 10 2,0842017 18 38 1 0 422 32 21 1,359
2018 (12) 20 22 3 0 386 54 17 1,196
14-3g. Incidence of Communicable Diseases (Continued)
Period Q Fever EndemicTyphus Fever Lyme Disease Tularemia Scrub Typhus Complicated
Varicella ToxoplasmosisSevere
ComplicatedInfluenza
(12) The case amount of these diseases contained imported ones, including 2 Q Fever, 1 endemic typhus fever,3 Lyme disease, 2 scrub typhus, 1 toxoplasmosis, and 5 severe complicated influenza.
292

1998 … … … … … 0 … … … … …1999 … … … … … 0 0 … … … …2000 … … … … … 0 0 … … … …2001 … … … … … 0 0 … … … …2002 … … … … … 0 0 … … … …2003 … … … … … 0 0 … … … …2004 … … … … … 0 0 … … … …2005 … … … … … 0 0 … … … …2006 … … … 0 0 0 0 0 … … …2007 0 … … 0 0 0 0 0 … … …2008 0 … … 0 0 0 0 0 … … …2009 3 … … 0 0 0 0 0 … … …2010 0 … … 0 0 0 0 0 … … …2011 0 … … 0 0 0 0 0 … … …2012 0 0 … 0 0 0 0 0 0 … …2013 0 0 … 0 0 0 0 0 0 … …2014 0 0 … 0 0 0 0 0 0 0 …2015 0 1 … 0 0 0 0 0 0 0 …2016 0 0 … 0 0 0 0 0 0 0 132017 0 0 … 0 0 0 0 0 0 1 4
2018 (13) 0 0 168 0 0 0 0 0 0 0 3
14-3h. Incidence of Communicable Diseases (Continued)
Period Creutzfeldt-Jakob Disease Brucellosis Rift Valley
Fever
MarburgHaemorrhagic
FeverYellow Fever Ebola Virus
Disease Lassa Fever
Middle EastRespiratorySyndrome
CoronavirusInfections
Zika VirusInfection
Unit: Persons
(14)Taiwan CDC has listed listeriosis as a Category IV Communicable Disease since January 1, 2018.
NovelInfluenza A
VirusInfections
(13)The case amount of these diseases contained imported ones, including 1 listeriosis and 3 Zika virus infection.
Listeriosis(14)
293
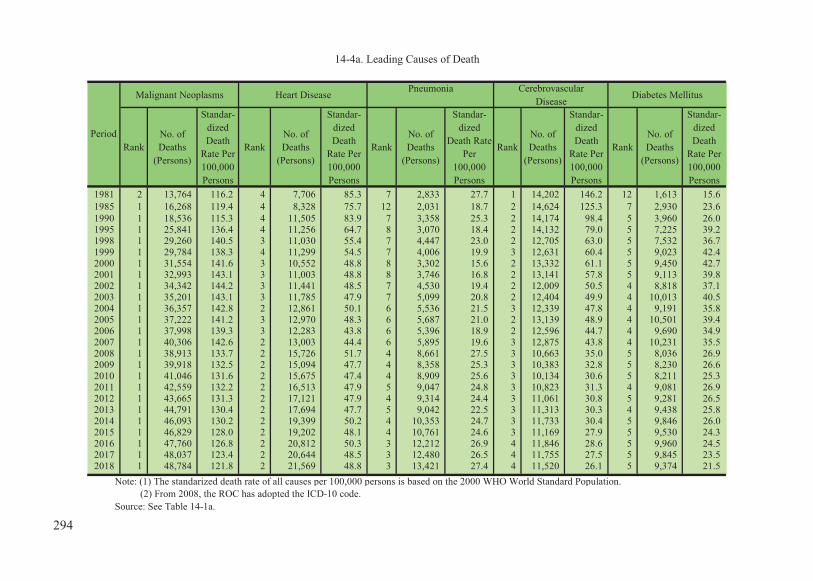
Malignant Neoplasms Heart Disease Pneumonia CerebrovascularDisease
Diabetes Mellitus
RankNo. ofDeaths
(Persons)
Standar-dizedDeath
Rate Per100,000Persons
RankNo. ofDeaths
(Persons)
Standar-dizedDeath
Rate Per100,000Persons
RankNo. ofDeaths
(Persons)
Standar-dized
Death RatePer
100,000Persons
RankNo. ofDeaths
(Persons)
Standar-dizedDeath
Rate Per100,000Persons
RankNo. ofDeaths
(Persons)
Standar-dizedDeath
Rate Per100,000Persons
1981 2 13,764 116.2 4 7,706 85.3 7 2,833 27.7 1 14,202 146.2 12 1,613 15.61985 1 16,268 119.4 4 8,328 75.7 12 2,031 18.7 2 14,624 125.3 7 2,930 23.61990 1 18,536 115.3 4 11,505 83.9 7 3,358 25.3 2 14,174 98.4 5 3,960 26.01995 1 25,841 136.4 4 11,256 64.7 8 3,070 18.4 2 14,132 79.0 5 7,225 39.21998 1 29,260 140.5 3 11,030 55.4 7 4,447 23.0 2 12,705 63.0 5 7,532 36.71999 1 29,784 138.3 4 11,299 54.5 7 4,006 19.9 3 12,631 60.4 5 9,023 42.42000 1 31,554 141.6 3 10,552 48.8 8 3,302 15.6 2 13,332 61.1 5 9,450 42.72001 1 32,993 143.1 3 11,003 48.8 8 3,746 16.8 2 13,141 57.8 5 9,113 39.82002 1 34,342 144.2 3 11,441 48.5 7 4,530 19.4 2 12,009 50.5 4 8,818 37.12003 1 35,201 143.1 3 11,785 47.9 7 5,099 20.8 2 12,404 49.9 4 10,013 40.52004 1 36,357 142.8 2 12,861 50.1 6 5,536 21.5 3 12,339 47.8 4 9,191 35.82005 1 37,222 141.2 3 12,970 48.3 6 5,687 21.0 2 13,139 48.9 4 10,501 39.42006 1 37,998 139.3 3 12,283 43.8 6 5,396 18.9 2 12,596 44.7 4 9,690 34.92007 1 40,306 142.6 2 13,003 44.4 6 5,895 19.6 3 12,875 43.8 4 10,231 35.52008 1 38,913 133.7 2 15,726 51.7 4 8,661 27.5 3 10,663 35.0 5 8,036 26.92009 1 39,918 132.5 2 15,094 47.7 4 8,358 25.3 3 10,383 32.8 5 8,230 26.62010 1 41,046 131.6 2 15,675 47.4 4 8,909 25.6 3 10,134 30.6 5 8,211 25.32011 1 42,559 132.2 2 16,513 47.9 5 9,047 24.8 3 10,823 31.3 4 9,081 26.92012 1 43,665 131.3 2 17,121 47.9 4 9,314 24.4 3 11,061 30.8 5 9,281 26.52013 1 44,791 130.4 2 17,694 47.7 5 9,042 22.5 3 11,313 30.3 4 9,438 25.82014 1 46,093 130.2 2 19,399 50.2 4 10,353 24.7 3 11,733 30.4 5 9,846 26.0 2015 1 46,829 128.0 2 19,202 48.1 4 10,761 24.6 3 11,169 27.9 5 9,530 24.32016 1 47,760 126.8 2 20,812 50.3 3 12,212 26.9 4 11,846 28.6 5 9,960 24.52017 1 48,037 123.4 2 20,644 48.5 3 12,480 26.5 4 11,755 27.5 5 9,845 23.52018 1 48,784 121.8 2 21,569 48.8 3 13,421 27.4 4 11,520 26.1 5 9,374 21.5
Note: (1) The standarized death rate of all causes per 100,000 persons is based on the 2000 WHO World Standard Population. (2) From 2008, the ROC has adopted the ICD-10 code.Source: See Table 14-1a.
Period
14-4a. Leading Causes of Death
294

Accidents & AdverseEffects Hypertensive Disease Nephritis, Nephrotic
Syndrome & NephrosisChronic Liver Disease
& Cirrhosis Suicide
RankNo. ofDeaths
(Persons)
Standar-dizedDeath
Rate Per100,000Persons
RankNo. ofDeaths
(Persons)
Standar-dized Death
Rate Per100,000Persons
RankNo. ofDeaths
(Persons)
Standar-dized
Death RatePer
100,000Persons
RankNo. ofDeaths
(Persons)
Standar-dizedDeath
Rate Per100,000Persons
RankNo. ofDeaths
(Persons)
Standar-dizedDeath
Rate Per100,000Persons
1981 3 11,616 73.9 5 3,146 35.4 10 2,329 21.3 6 3,075 26.1 11 2,037 14.11985 3 11,284 66.5 5 3,460 31.6 10 2,207 17.6 6 3,153 22.9 9 2,281 14.21990 3 13,927 74.1 8 2,993 21.8 10 2,304 15.8 6 3,606 21.9 13 1,359 7.41995 3 12,983 62.6 9 2,616 15.3 7 3,519 19.9 6 4,456 22.8 11 1,618 7.81998 4 10,973 50.2 9 2,273 11.5 8 3,435 17.2 6 4,940 23.2 10 2,177 9.81999 2 12,960 58.7 10 1,856 9.0 8 3,474 16.8 6 5,180 23.5 9 2,281 10.02000 4 10,515 46.5 11 1,602 7.5 7 3,872 17.9 6 5,174 22.6 9 2,471 10.62001 4 9,513 41.5 10 1,766 7.9 7 4,056 17.9 6 5,239 22.3 9 2,781 11.72002 5 8,489 36.3 10 1,947 8.2 8 4,168 17.7 6 4,795 19.9 9 3,053 12.52003 5 8,191 34.5 10 1,844 7.4 8 4,306 17.5 6 5,185 20.9 9 3,195 12.82004 5 8,452 35.0 10 1,806 7.0 8 4,680 18.2 7 5,351 20.8 9 3,468 13.62005 5 8,365 34.0 10 1,891 7.0 8 4,822 17.9 7 5,621 21.3 9 4,282 16.62006 5 8,011 31.9 10 1,816 6.4 8 4,712 16.8 7 5,049 18.6 9 4,406 16.8 2007 5 7,130 27.9 10 1,977 6.6 8 5,099 17.3 7 5,160 18.4 9 3,933 14.7 2008 6 7,077 27.0 12 3,507 11.2 10 4,012 13.2 8 4,917 17.1 9 4,128 15.2 2009 6 7,358 27.7 11 3,721 11.5 10 3,999 12.5 8 4,918 16.6 9 4,063 14.7 2010 6 6,669 24.4 9 4,174 12.2 10 4,105 12.4 8 4,912 16.1 11 3,889 13.8 2011 6 6,726 24.1 9 4,631 12.9 10 4,368 12.6 8 5,153 16.5 12 3,507 12.3 2012 6 6,873 23.8 8 4,986 13.3 10 4,327 12.1 9 4,975 15.6 11 3,766 13.1 2013 6 6,619 22.4 8 5,033 12.9 10 4,489 11.9 9 4,843 14.8 11 3,565 12.0 2014 6 7,118 23.7 8 5,459 13.5 10 4,868 12.5 9 4,962 14.8 11 3,546 11.8 2015 6 7,033 22.8 8 5,536 13.2 9 4,762 11.8 10 4,688 13.6 11 3,675 12.1 2016 6 7,206 23.1 8 5,881 13.5 9 5,226 12.4 10 4,738 13.4 12 3,765 12.3 2017 6 6,965 21.9 8 6,072 13.3 9 5,381 12.4 10 4,554 12.6 11 3,871 12.5 2018 6 6,846 21.1 8 5,991 12.8 9 5,523 12.3 10 4,315 11.6 11 3,865 12.5
14-4b. Leading Causes of Death (Continued)
Period
295

Carbo-hydrate
(gm)1952 2,078.2 49.0 35.5 385.6 233.7 872.6 8.5 4,310.4 1.12 0.47 11.3 91.3 1955 2.247.2 53.2 37.2 411.7 262.6 948.0 8.8 4,319.8 1.15 0.52 12.1 89.2 1960 2.390.0 57.1 40.9 435.4 278.7 1,004.8 9.4 4,548.7 1.22 0.54 13.2 95.2 1965 2,410.6 61.2 46.7 423.6 282.6 1,042.1 9.7 3,728.6 1.39 0.58 13.9 79.6 1970 2,661.7 72.2 63.5 438.5 372.8 1,187.8 12.0 4,261.5 1.45 0.74 15.4 93.7 1975 2,721.7 74.7 67.5 440.4 423.8 1,229.3 12.9 4,695.8 1.52 0.80 15.5 116.1 1980 2,811.8 78.2 85.6 420.5 478.2 1,258.2 13.6 6,344.7 1.68 0.95 16.3 131.2 1985 2,553.4 81.1 83.4 375.9 458.5 1,212.7 11.3 7,325.0 1.49 1.16 15.8 132.8 1990 2,836.8 92.7 109.6 377.2 557.7 1,312.3 13.0 6,492.6 1.56 1.34 16.6 131.6 1995 2,968.9 98.2 126.1 368.1 642.8 1,380.2 14.1 7,435.6 1.66 1.56 16.6 140.2 1996 2,968.7 98.3 126.6 366.9 640.2 1,355.8 14.2 7,845.0 1.61 1.55 16.6 142.5 1997 3,042.1 101.4 130.9 372.9 650.9 1,383.1 14.1 7,676.0 1.62 1.62 17.2 156.2 1998 2,886.8 95.6 121.0 361.0 585.7 1,295.0 12.7 7,498.6 1.56 1.53 16.9 139.7 1999 2,964.7 97.6 127.0 365.7 613.6 1,325.5 13.2 8,044.5 1.55 1.58 17.4 164.7 2000 2,936.8 96.2 123.5 367.8 596.6 1,292.4 13.1 7,612.7 1.56 1.54 16.7 148.9 2001 2,792.5 92.0 117.0 350.0 571.9 1,230.4 12.4 7,193.4 1.51 1.49 15.9 146.8 2002 2,866.4 94.8 124.4 349.7 610.5 1,283.0 13.2 7,773.6 1.56 1.54 16.4 158.2 2003 2,908.3 96.1 124.8 358.0 594.9 1,266.6 13.3 7,461.3 1.55 1.51 16.4 153.9 2004 2,830.1 91.9 120.0 352.8 570.6 1,214.3 12.6 7,280.5 1.52 1.46 15.8 151.2 2005 2,891.2 91.6 126.5 353.6 563.5 1,195.4 12.7 7,003.4 1.51 1.41 15.2 138.5 2006 2,673.1 80.7 114.2 337.5 483.6 1,077.7 10.8 8,996.1 1.40 1.39 14.9 151.3 2007 2,693.7 82.6 114.8 338.7 473.3 1,083.5 10.7 8,317.3 1.38 1.36 15.0 138.4 2008 2,505.6 76.3 103.8 322.6 433.0 1,004.1 10.2 8,194.6 1.29 1.23 14.1 138.0 2009 2,596.3 77.6 107.5 335.4 459.7 1,022.4 10.4 8,760.4 1.34 1.27 14.3 135.4 2010 2,602.0 78.3 110.7 329.0 446.4 1,023.2 10.4 8,548.8 1.32 1.30 14.7 141.7 2011 2,591.8 80.6 107.6 331.2 463.9 1,045.6 10.7 8,876.8 1.34 1.34 14.9 144.9 2012 2,649.3 80.5 111.2 337.8 457.6 1,040.6 10.8 9,260.1 1.33 1.30 14.8 138.2 2013 2,572.5 78.8 103.7 336.9 457.1 1,029.1 10.6 9,386.7 1.30 1.30 14.4 138.0 2014 2,685.6 80.7 113.4 342.0 466.3 1,054.1 10.8 9,771.4 1.33 1.33 14.9 138.5 2015 2,741.1 84.8 115.3 347.6 509.1 1,105.2 11.4 9,818.2 1.41 1.34 14.7 134.1 2016 2,700.9 83.4 114.0 341.8 520.1 1,096.5 11.7 10,150.9 1.40 1.32 14.5 132.2 2017 2,769.6 85.6 117.0 350.7 541.1 1,134.1 12.3 10,428.3 1.44 1.39 14.8 142.6
Source: The data are provided by the Council of Agriculture, Executive Yuan, R.O.C.(Taiwan).
14-5. Food Intake Per Capita Per Day
Period Energy(kcal)
Protein(gm)
Fat (gm)
Calcium(mg)
Iron(mg)
Thiamine(mg)
Niacin(mg)
Phos-Phorus(mg)
VitaminA Value
(i.u.)
Ribo-flavin(mg)
AscorbicAcid(mg)
296

1961 30.8 ������������������� 11.37 3.70 ������������� 62.64 67.18 1965 38.3 75.6 10.31 3.52 ������������� 65.10 69.71 1970 43.7 93.6 9.30 3.96 ������������� 66.66 71.56 1975 50.3 147.6 16.47 18.85 ������������� 68.27 73.42 1980 77.6 191.1 23.82 22.22 ������������� 69.57 74.55 1985 83.1 232.0 34.42 38.47 73.02 70.82 75.81 1990 86.8 287.9 44.79 43.80 73.79 71.33 76.75 1995 91.1 335.5 55.37 52.62 74.53 71.85 77.74 1997 91.2 363.3 63.39 55.41 75.54 72.97 78.61 1998 92.4 375.4 65.70 56.80 75.76 73.12 78.93 1999 92.1 388.2 68.98 55.65 75.90 73.33 78.98 2000 92.8 397.5 71.47 56.78 76.46 73.83 79.56 2001 92.5 407.4 74.02 56.98 76.75 74.07 79.92 2002 93.4 406.4 77.90 59.23 77.19 74.58 80.24 2003 93.5 422.0 81.00 60.31 77.35 74.77 80.33 2004 93.8 431.3 84.89 63.18 77.48 74.68 80.75 2005 93.7 439.1 87.72 64.29 77.42 74.50 80.80 2006 94.6 446.9 90.47 65.12 77.90 74.86 81.41 2007 94.5 456.2 93.54 65.61 78.38 75.46 81.72 2008 94.6 459.0 97.07 66.37 78.57 75.59 81.94 2009 94.9 468.3 101.02 67.79 79.01 76.03 82.34 2010 94.9 471.5 104.12 68.61 79.18 76.13 82.55 2011 95.4 476.1 107.75 69.09 79.15 75.96 82.63 2012 95.5 480.0 110.78 69.01 79.51 76.43 82.82 2013 95.8 481.8 113.70 68.21 80.02 76.91 83.36 2014 95.7 498.5 115.88 68.91 79.84 76.72 83.19 2015 95.7 504.9 119.41 69.03 80.20 77.01 83.62 2016 96.4 513.8 122.84 69.31 80.00 76.81 83.42 2017 96.1 522.0 127.18 69.83 80.39 77.28 83.70 2018 ������������ ������������ 132.64 71.02 �������� �������� ���������
Sources: 1. National Statistics, R.O.C. online database. http://www.stat.gov.tw 2. The data are provided by the Ministry of the Interior, and the Ministry of Health and Welfare, R.O.C. (Taiwan) 3. Data of Living Space doesn't include Kinmen and Lienchiang County. 4. The 2013 figures for Life Expectancy at Birth are preliminary data.
14-6. Social Indicators
Period
Percentageof PopulationServed by Tap
Water
Living SpacePer Capita
(sq. ft.)
Life Expectancy at Birth
Total
Number of HealthWorkforce inInstitutions per
10,000 Population
Number of Bedsin Hospitals and
Clinics per 10,000Population Male Female
297

298

15. SOCIAL AFFAIRS


1979 31,499 31,499 258 509 16,735 123 1,060 1980 39,480 39,480 322 557 20,527 134 1,694 1981 48,716 48,716 359 602 24,682 155 2,439 1982 56,310 56,310 405 585 27,921 170 3,096 1983 67,621 67,621 585 600 33,085 170 3,809 1984 83,630 83,630 671 595 40,190 170 4,886 1985 102,269 102,228 842 622 46,734 175 6,233 1986 127,447 127,406 977 639 57,394 180 8,195 1987 161,416 161,317 1,113 657 71,978 185 10,236 1988 203,061 202,767 2,203 702 86,009 191 12,750 1989 240,995 240,706 2,352 705 97,873 200 15,224 1990 265,786 265,497 2,397 707 103,333 199 18,007 1991 295,096 294,807 2,313 727 110,160 206 21,037 1992 333,871 333,582 2,210 782 117,129 216 24,871 1993 369,091 368,803 2,163 873 121,874 216 29,462 1994 400,425 400,137 2,270 902 124,120 218 33,649 1995 (1) 386,494 386,206 2,088 818 119,901 219 33,515 1996 379,353 379,065 2,002 746 115,331 218 32,828 1997 381,520 381,231 1,917 708 113,006 222 33,160 1998 385,691 385,402 1,858 706 111,054 227 34,342 1999 390,888 390,599 1,772 701 109,448 232 35,357 2000 398,316 398,027 1,750 648 108,437 236 36,133 2001 399,592 399,303 1,739 604 105,933 245 35,971
(1) Ordinary medical insurance was placed under the administration of the National Health Insurance Program in March 1995.Source: The data are provided by the Bureau of Labor Insurance,Ministry of Labor, R.O.C. (Taiwan).
I. Insured Units
End of Year
15-1a. Units and Persons Insured under Labor and Farmers' Insurance Schemes
Labor Insurance
Subtotal Mining andQuarrying Manufacturing Electricity,
Gas and Water Construction
Agriculture,Forestry, Fishery
and AnimalHusbandry
Total
299

1979 2,997 2,218 923 - 6,676 - - 1980 4,883 2,479 1,463 - 7,421 - - 1981 7,482 2,773 1,894 - 8,330 - - 1982 10,120 3,026 2,113 - 8,874 - - 1983 13,739 3,294 2,462 - 9,877 - - 1984 19,368 3,641 3,084 - 11,025 - - 1985 27,065 4,060 3,915 - 12,582 - 41 1986 36,619 4,453 4,868 - 14,081 - 41 1987 49,535 5,014 6,405 - 16,194 - 99 1988 66,799 5,882 8,900 - 19,331 - 294 1989 83,580 6,649 12,058 - 22,065 - 289 1990 94,893 7,208 14,346 - 24,407 - 289 1991 108,336 7,755 17,126 - 27,147 - 289 1992 125,498 8,406 23,980 - 30,490 - 289 1993 140,820 8,964 28,987 - 35,444 - 288 1994 153,223 8,974 12,931 20,426 40,862 2,562 288
1995 (1) 147,495 9,061 12,459 20,191 37,902 2,557 288 1996 146,348 9,270 11,854 20,425 37,467 2,576 288 1997 148,465 9,542 12,036 21,435 38,103 2,637 289 1998 150,391 9,816 11,843 22,898 39,842 2,425 289 1999 153,070 10,122 11,406 24,478 41,563 2,450 289 2000 156,205 10,382 10,996 27,008 43,714 2,518 289 2001 157,102 10,586 10,472 27,865 45,868 2,918 289
(2) "Commerce" has been changed to "Trade and Catering" since 1997.
I. Insured Units
End of Year
15-1b. Units and Persons Insured under Labor and Farmers' Insurance Schemes (Continued)
Transport,Storage and
Communications
BusinessServices
Social, Personaland RelatedCommunity
Services
PublicAdministration
Farmers'Health
Insurance
Trade andCatering
(2)
Finance,Insurance and
Real Estate
Labor Insurance
300

1979 2,283,516 2,283,516 163,112 39,948 1,387,284 30,902 73,174 1980 2,538,125 2,538,125 168,382 39,832 1,498,444 34,050 92,704 1981 2,781,512 2,781,512 168,949 38,492 1,600,587 36,520 119,333 1982 2,950,119 2,950,119 178,395 35,926 1,630,703 37,147 141,248 1983 3,322,977 3,322,977 190,033 31,090 1,844,622 36,963 162,878 1984 3,693,276 3,693,276 200,022 26,924 2,029,474 36,210 192,189 1985 4,150,211 4,049,472 205,869 25,964 2,128,620 34,921 247,228 1986 4,825,334 4,711,969 215,110 24,441 2,482,047 33,829 309,656 1987 5,539,754 5,321,733 229,976 21,497 2,732,102 32,881 375,074 1988 6,656,618 5,980,157 224,887 19,208 2,902,353 33,260 464,229 1989 7,893,816 6,549,661 245,769 16,280 2,972,502 32,902 538,747 1990 8,424,274 6,852,978 256,580 14,473 2,957,212 34,165 599,841 1991 8,935,121 7,281,445 260,870 13,716 3,054,590 33,255 668,081 1992 9,404,035 7,708,868 269,813 13,658 3,076,198 33,066 748,458 1993 9,852,671 8,144,183 281,131 14,192 3,130,810 32,785 847,161 1994 10,234,623 8,496,883 288,429 13,651 3,161,729 32,062 914,187 1995 (1) 9,435,250 7,635,063 272,027 11,279 2,864,376 31,510 793,186 1996 9,246,592 7,434,299 278,707 10,271 2,786,830 30,397 736,981 1997 9,313,177 7,500,917 286,688 10,338 2,803,502 29,997 722,238 1998 9,403,778 7,597,386 301,482 8,464 2,788,895 29,645 722,882 1999 9,539,030 7,738,971 314,676 8,108 2,831,181 29,434 711,285 2000 9,695,289 7,915,789 326,154 7,341 2,863,182 29,598 694,087 2001 9,545,981 7,779,127 341,439 6,360 2,690,549 29,021 676,786
II. Persons
Agriculture,Forestry, Fishery
and AnimalHusbandry
TotalEnd of Year
15-1c. Units and Persons Insured under Labor and Farmers' Insurance Schemes (Continued)
Labor Insurance
Subtotal Mining andQuarrying
Manufacturing Electricity,Gas and Water
Construction
301

1979 95,724 271,655 53,024 - 168,693 - - 1980 128,633 286,177 70,388 - 219,515 - - 1981 171,897 299,189 81,260 - 265,285 - - 1982 209,943 310,810 89,910 - 316,037 - - 1983 260,962 324,655 103,821 - 367,953 - - 1984 328,249 338,478 118,713 - 423,017 - - 1985 406,840 368,290 134,001 - 497,739 - 100,739 1986 510,759 401,525 155,403 - 579,199 - 113,365 1987 651,849 425,727 186,893 - 665,734 - 218,021 1988 823,801 468,499 249,826 - 794,094 - 676,461 1989 986,849 508,914 337,137 - 910,561 - 1,344,155 1990 1,090,874 527,377 377,068 - 995,388 - 1,571,296 1991 1,207,988 546,332 416,167 - 1,080,446 - 1,653,676 1992 1,348,836 568,856 483,978 - 1,166,005 - 1,695,167 1993 1,465,316 586,579 535,841 - 1,250,368 - 1,708,488 1994 1,528,824 591,056 317,470 274,270 1,274,477 100,728 1,737,740
1995 (1) 1,310,625 544,085 315,580 244,056 1,148,155 100,184 1,800,187 1996 1,275,283 527,639 321,811 242,060 1,122,436 101,884 1,812,293 1997 1,297,616 522,130 342,748 258,737 1,109,747 117,176 1,812,260 1998 1,324,682 521,719 365,004 284,220 1,137,945 112,448 1,806,392 1999 1,361,790 522,838 374,210 310,187 1,161,769 113,493 1,800,059 2000 1,415,559 531,573 380,347 359,344 1,190,696 117,908 1,779,500 2001 1,406,212 523,369 373,678 371,024 1,223,069 137,620 1,766,854
II. Persons
Finance,Insurance and
Real Estate
End of Year
15-1d. Units and Persons Insured under Labor and Farmers' Insurance Schemes (Continued)
Transport,Storage and
Communications
BusinessServices
Social, Personaland RelatedCommunity
Services
PublicAdministration
Farmers'Health
Insurance
Trade andCatering
(2)
Labor Insurance
302

SubtotalAgriculture, Forestry,Fishery and Animal
Husbandry
Mining andQuarrying Manufacturing
I. Insured Units 2002 (3) 404,741 404,452 1,606 566 104,217
2003 414,081 413,792 1,645 541 103,506 2004 429,319 429,030 1,626 512 103,765 2005 452,187 451,899 1,562 495 104,269 2006 462,521 462,233 1,465 463 104,009 2007 467,322 467,035 1,475 460 103,208 2008 468,918 468,631 1,446 457 101,362 2009 476,483 476,196 1,574 441 99,954
Electricity, Gas andWater
Construction TradeAccommodation and
Catering Transportation,Storage and
CommunicationsI. Insured Units 2002 (3) 247 35,990 155,357 6,728 10,738
2003 251 36,223 159,580 7,174 10,882 2004 248 36,908 166,270 7,926 11,098 2005 248 38,871 176,951 9,205 11,434 2006 249 40,707 180,802 9,977 11,636 2007 253 41,305 181,919 10,415 11,724 2008 250 41,322 182,142 10,908 11,681 2009 251 41,585 185,029 11,861 11,784
(3) From 2002, the figures are based on the seventh revised edition (Jan. 2001) of the R.O.C.'s Standard Industrial Classification System.
15-1e. Units and Persons Insured under Labor and Farmers' Insurance Schemes (Continued)
End of Year Total
End of Year
Labor Insurance
Labor Insurance
303

Finance andInsurance
Real Estate and Rentaland
Leasing
Professional,Scientific and
Technical Services
EducationalServices
Health Care andSocial Welfare
Services
I. Insured Units 2002 (3) 4,921 6,942 25,114 9,515 15,296
2003 5,214 7,239 26,376 10,002 16,404 2004 5,662 8,164 28,154 10,601 17,723 2005 5,809 9,401 30,333 11,644 19,483 2006 5,752 10,350 31,111 12,307 20,276 2007 5,896 10,962 31,931 12,628 21,026 2008 5,983 11,048 32,567 13,009 21,909 2009 6,070 11,209 33,838 13,407 22,948
Cultural, Sporting andRecreational
Services
OtherServices
PublicAdministration
I. Insured Units 2002 (3) 4,887 19,493 2,835
2003 5,161 20,765 2,829 2004 5,308 22,264 2,801 2005 5,371 24,035 2,788 2006 5,374 24,966 2,789 2007 5,347 25,701 2,785 2008 5,342 26,406 2,799 2009 5,519 27,931 2,795
288288
287
289289289
287287
End of Year
End of Year
15-1f. Units and Persons Insured under Labor and Farmers' Insurance Schemes (Continued)
Labor Insurance
Labor InsuranceFarmers' Health
Insurance
304

SubtotalAgriculture, Forestry,Fishery and Animal
Husbandry
Mining andQuarrying Manufacturing
II. Persons 2002 (3) 9,606,400 7,857,842 355,547 5,856 2,700,285
2003 9,812,692 8,102,570 361,899 5,556 2,745,176 2004 10,018,477 8,341,927 362,052 5,511 2,810,895 2005 10,186,790 8,540,755 362,903 5,141 2,795,322 2006 10,304,068 8,681,145 364,891 4,951 2,832,438 2007 10,400,815 8,799,405 366,020 4,799 2,864,413 2008 10,368,612 8,795,248 363,635 4,641 2,771,609 2009 10,570,267 9,029,279 374,572 4,599 2,758,917
Electricity, Gas andWater
Construction Trade Accommodation andCatering
Transportation, Storageand Communications
II. Persons 2002 (3) 28,640 678,839 1,233,981 260,381 504,982
2003 28,667 674,535 1,298,189 263,978 496,157 2004 28,029 682,428 1,376,668 277,649 501,756 2005 28,093 695,733 1,437,245 304,613 514,012 2006 28,602 707,363 1,454,666 320,431 510,395 2007 28,547 708,254 1,466,515 331,200 503,350 2008 28,918 699,744 1,467,431 347,339 494,580 2009 29,298 708,793 1,490,436 372,282 500,792
Labor Insurance
Labor Insurance
15-1g. Units and Persons Insured under Labor and Farmers' Insurance Schemes (Continued)
End of Year Total
End of Year
305

Finance andInsurance
Real Estate and Rentaland
Leasing
Professional,Scientific and
Technical Services
EducationalServices
Health Care andSocial Welfare
Services
II. Persons 2002 (3) 324,878 76,400 298,201 117,470 228,953
2003 329,100 82,453 325,787 124,974 245,579 2004 339,268 92,369 345,262 131,515 263,647 2005 353,038 101,566 366,999 139,170 282,729 2006 350,533 107,631 370,682 150,216 295,754 2007 358,920 113,475 383,680 158,164 309,502 2008 358,212 113,367 393,076 173,153 327,871 2009 351,390 117,864 416,616 221,656 352,554
Cultural, Sporting andRecreational
Services
OtherServices
PublicAdministration
II. Persons 2002 (3) 149,684 770,346 123,399
2003 153,551 800,396 166,573 2004 153,961 830,009 140,908 2005 154,348 872,112 127,731 2006 153,836 898,989 129,767 2007 151,417 926,611 124,538 2008 150,609 958,548 142,515 2009 154,934 1,037,172 137,404 1,540,988
1,622,923
1,573,364
15-1h. Units and Persons Insured under Labor and Farmers' Insurance Schemes (Continued)
Labor Insurance
End of Year
Labor Insurance
End of Year Farmers' HealthInsurance
1,601,410
1,748,5581,710,122
1,646,0351,676,550
306

Item 2010 2011 2012 2013 2014 2015 2016 2017 2018A. Labor Insurance (4) 489,844 503,646 508,930 517,325 527,270 537,221 544,826 553,170 561,761
Agriculture, Forestry, Fishing and Animal Husbandry 1,465 1,513 1,717 2,412 2,752 2,771 2,908 3,048 3,128
Mining and Quarrying 433 430 402 393 393 387 374 358 345Manufacturing 100,519 101,500 100,697 100,611 100,784 100,947 100,529 100,307 100,613Electricity and Gas Supply 239 245 255 273 282 305 338 368 405Water Supply and Remediation Activities 3,409 3,543 3,664 3,759 3,775 3,798 3,864 3,948 4,072
Construction 42,835 44,014 44,589 45,665 46,786 48,013 48,951 49,791 50,689Wholesale and Retail Trade 189,605 193,678 194,105 195,039 196,780 198,265 199,183 199,953 200,140Transportation and Storage 9,621 9,789 9,906 10,034 10,108 10,266 10,330 10,431 10,576Accommodation and Food Service Activities 13,015 14,624 16,157 17,496 19,328 21,316 23,748 26,447 28,455
Information and Communication 9,433 9,716 9,958 10,204 10,462 10,906 11,420 11,890 12,397Financial and Insurance Activities 6,888 6,983 7,007 7,021 7,193 7,387 7,478 7,660 7,846Real Estate Activities 10,731 11,658 12,354 13,443 14,400 14,641 14,431 14,554 14,867Professional, Scientific and Technical Activities 28,845 30,153 30,909 31,963 33,062 34,135 34,878 35,734 36,734
Support Service Activities 12,241 12,750 13,110 13,537 13,902 14,483 15,103 15,586 16,115Public Administration and Defence; Compulsory Social Security 2,724 2,771 2,741 2,718 2,684 2,701 2,686 2,649 2,645
Education 13,728 13,861 14,566 16,333 16,624 16,709 16,758 16,868 17,000Human Health and Social Work Activities 23,947 25,042 25,000 24,134 24,721 25,610 26,429 27,292 28,343
Art, Entertainment and Recreation 2,197 2,319 2,385 2,543 2,718 3,111 3,345 3,680 3,923Other Service Activities 17,969 19,057 19,408 19,747 20,516 21,470 22,073 22,606 23,468
B. Farmers' Health Insurance 287 287 287 287 287 287 287 287 287Total, A plus B 490,131 503,933 509,217 517,612 527,557 537,508 545,113 553,457 562,048
(4) The figures during 2010 to 2012 are based on the Standard Industrial Classification System of the Republic of China (Rev.8). Those during 2013 to 2015 are based on Rev.9, and those from 2016 are based on Rev.10.
15-1i. Units and Persons Insured under Labor and Farmers' Insurance Schemes (Continued)I. Insured Units
307

Item 2010 2011 2012 2013 2014 2015 2016 2017 2018A. Labor Insurance (4) 9,397,608 9,725,761 9,709,511 9,745,794 9,920,361 10,073,327 10,165,434 10,272,071 10,372,358
Agriculture, Forestry, Fishing and Animal Husbandry 376,611 379,175 371,016 365,851 365,121 364,003 359,299 352,469 345,266
Mining and Quarrying 4,642 4,807 4,528 3,919 3,852 3,781 3,732 3,700 3,715Manufacturing 2,919,504 3,009,229 2,988,953 3,119,315 3,169,135 3,170,894 3,167,226 3,185,084 3,181,554Electricity and Gas Supply 24,447 24,756 24,852 24,811 24,790 24,250 25,012 25,125 25,065Water Supply and Remediation Activities 55,285 54,207 55,352 52,706 52,790 49,375 48,154 47,605 49,510
Construction 718,498 731,551 703,017 686,142 685,346 684,171 673,447 664,052 662,840Wholesale and Retail Trade 1,560,513 1,638,980 1,661,156 1,681,402 1,722,026 1,757,714 1,790,771 1,815,323 1,833,057Transportation and Storage 441,202 448,820 438,620 429,500 428,669 434,558 433,210 431,120 429,107Accommodation and Food Service Activities 396,810 430,275 444,950 459,102 485,437 510,595 534,341 555,022 573,073
Information and Communication 214,145 225,663 233,883 239,097 247,195 266,121 273,823 284,956 305,820Financial and Insurance Activities 361,216 366,271 368,257 371,081 374,359 379,306 386,075 389,249 391,759Real Estate Activities 116,335 124,012 127,397 138,248 144,399 144,239 141,181 141,678 144,374Professional, Scientific and Technical Activities 323,396 338,060 344,576 352,248 360,589 370,282 380,670 389,385 401,252
Support Service Activities 310,489 322,210 331,981 341,878 350,173 356,246 373,508 387,907 399,742Defence; Compulsory Social Security 142,207 145,899 133,629 132,289 128,974 129,761 129,355 129,037 131,025
Education 218,433 232,532 254,265 279,421 294,063 319,878 318,753 331,673 337,354Human Health and Social Work Activities 369,748 392,299 400,698 398,161 412,667 431,474 452,421 472,770 494,266
Art, Entertainment and 88,429 92,567 90,800 90,968 93,279 97,522 100,064 101,215 104,785Other Service Activities 755,698 764,448 731,581 579,655 577,497 579,157 574,392 564,701 558,794
B. Farmers' Health Insurance 1,508,284 1,479,148 1,454,728 1,409,634 1,349,903 1,284,649 1,235,745 1,174,749 1,130,275Total, A plus B 10,905,892 11,204,909 11,164,239 11,155,428 11,270,264 11,357,976 11,401,179 11,446,820 11,502,633
15-1j. Units and Persons Insured under Labor and Farmers' Insurance Schemes (Continued)II. Persons
308
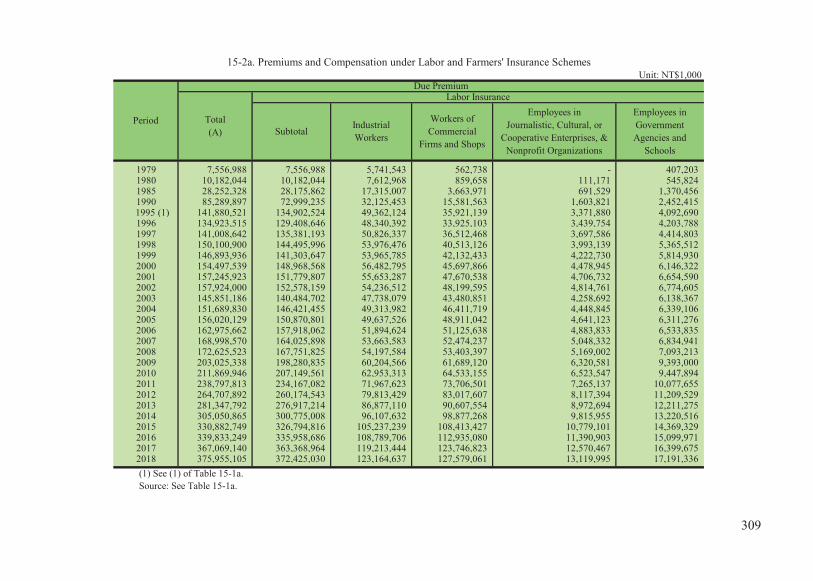
1979 7,556,988 7,556,988 5,741,543 562,738 - 407,203 1980 10,182,044 10,182,044 7,612,968 859,658 111,171 545,824 1985 28,252,328 28,175,862 17,315,007 3,663,971 691,529 1,370,456 1990 85,289,897 72,999,235 32,125,453 15,581,563 1,603,821 2,452,415
1995 (1) 141,880,521 134,902,524 49,362,124 35,921,139 3,371,880 4,092,690 1996 134,923,515 129,408,646 48,340,392 33,925,103 3,439,754 4,203,788 1997 141,008,642 135,381,193 50,826,337 36,512,468 3,697,586 4,414,803 1998 150,100,900 144,495,996 53,976,476 40,513,126 3,993,139 5,365,512 1999 146,893,936 141,303,647 53,965,785 42,132,433 4,222,730 5,814,930 2000 154,497,539 148,968,568 56,482,795 45,697,866 4,478,945 6,146,322 2001 157,245,923 151,779,807 55,653,287 47,670,538 4,706,732 6,654,590 2002 157,924,000 152,578,159 54,236,512 48,199,595 4,814,761 6,774,605 2003 145,851,186 140,484,702 47,738,079 43,480,851 4,258,692 6,138,367 2004 151,689,830 146,421,455 49,313,982 46,411,719 4,448,845 6,339,106 2005 156,020,129 150,870,801 49,637,526 48,911,042 4,641,123 6,311,276 2006 162,975,662 157,918,062 51,894,624 51,125,638 4,883,833 6,533,835 2007 168,998,570 164,025,898 53,663,583 52,474,237 5,048,332 6,834,941 2008 172,625,523 167,751,825 54,197,584 53,403,397 5,169,002 7,093,213 2009 203,025,338 198,280,835 60,204,566 61,689,120 6,320,581 9,393,000 2010 211,869,946 207,149,561 62,953,313 64,533,155 6,523,547 9,447,894 2011 238,797,813 234,167,082 71,967,623 73,706,501 7,265,137 10,077,655 2012 264,707,892 260,174,543 79,813,429 83,017,607 8,117,394 11,209,529 2013 281,347,792 276,917,214 86,877,110 90,607,554 8,972,694 12,211,275 2014 305,050,865 300,775,008 96,107,632 98,877,268 9,815,955 13,220,516 2015 330,882,749 326,794,816 105,237,239 108,413,427 10,779,101 14,369,329 2016 339,833,249 335,958,686 108,789,706 112,935,080 11,390,903 15,099,971 2017 367,069,140 363,368,964 119,213,444 123,746,823 12,570,467 16,399,675 2018 375,955,105 372,425,030 123,164,637 127,579,061 13,119,995 17,191,336 (1) See (1) of Table 15-1a.Source: See Table 15-1a.
15-2a. Premiums and Compensation under Labor and Farmers' Insurance SchemesUnit: NT$1,000
Due PremiumLabor Insurance
Period Total(A) Subtotal Industrial
Workers
Workers ofCommercial
Firms and Shops
Employees inJournalistic, Cultural, or
Cooperative Enterprises, &Nonprofit Organizations
Employees inGovernmentAgencies and
Schools
309

1979 - - 449,211 236,326 159,967 - 1980 - 2,151 620,896 249,543 179,832 - 1985 - 24,737 4,003,599 616,935 489,628 76,466 1990 209,888 39,366 18,104,093 1,673,420 1,209,217 12,290,662
1995 (1) 111,551 59,564 36,428,782 2,407,354 3,147,440 6,977,997 1996 106,344 63,260 33,735,435 2,472,924 3,121,647 5,514,869 1997 106,327 69,313 33,628,170 2,736,811 3,389,379 5,627,449 1998 105,841 72,726 33,659,311 3,079,213 3,730,651 5,604,904 1999 101,365 62,857 28,590,527 2,736,269 3,676,753 5,590,289 2000 98,160 82,261 28,806,960 2,924,204 4,251,055 5,528,971 2001 92,036 84,570 29,283,400 3,114,275 4,520,379 5,466,116 2002 88,526 86,088 30,284,791 3,375,267 4,718,014 5,345,841 2003 76,176 86,140 30,819,325 3,575,829 4,311,243 5,366,484 2004 71,315 88,352 31,529,201 3,627,822 4,591,113 5,268,375 2005 64,279 92,177 32,705,268 3,653,505 4,854,606 5,149,328 2006 53,950 93,284 34,420,443 3,699,747 5,212,708 5,057,600 2007 48,089 104,357 36,508,492 3,832,283 5,511,586 4,972,672 2008 42,727 100,307 38,032,123 3,951,589 5,761,882 4,873,698 2009 46,032 136,143 48,242,931 4,892,188 7,356,273 4,744,503 2010 46,167 133,728 50,745,577 5,107,974 7,658,205 4,720,385 2011 48,113 155,993 56,660,272 5,741,727 8,544,060 4,630,731 2012 56,391 165,996 61,829,806 6,404,614 9,559,778 4,533,350 2013 61,186 182,245 60,666,806 6,851,203 10,487,141 4,430,578 2014 97,687 200,414 63,502,342 7,449,695 11,503,498 4,275,857 2015 108,415 210,406 67,006,855 8,053,325 12,616,721 4,087,933 2016 109,893 196,982 66,086,806 8,121,601 13,227,745 3,874,563 2017 126,903 205,815 67,919,693 8,586,876 14,599,268 3,700,176 2018 140,983 195,043 67,213,147 8,610,437 15,210,391 3,530,075
15-2b. Premiums and Compensation under Labor and Farmers' Insurance Schemes (Continued)Unit: NT$1,000
Period Persons ReceivingTraining in VocationalTraining Organizations
Craft WorkersClass A Members
of Fishermen'sAssociations
Labor Insurance
Workers Employedin FisheryProduction
Due Premium
VoluntaryInsured Persons
Farmers' Health
Insurance
310
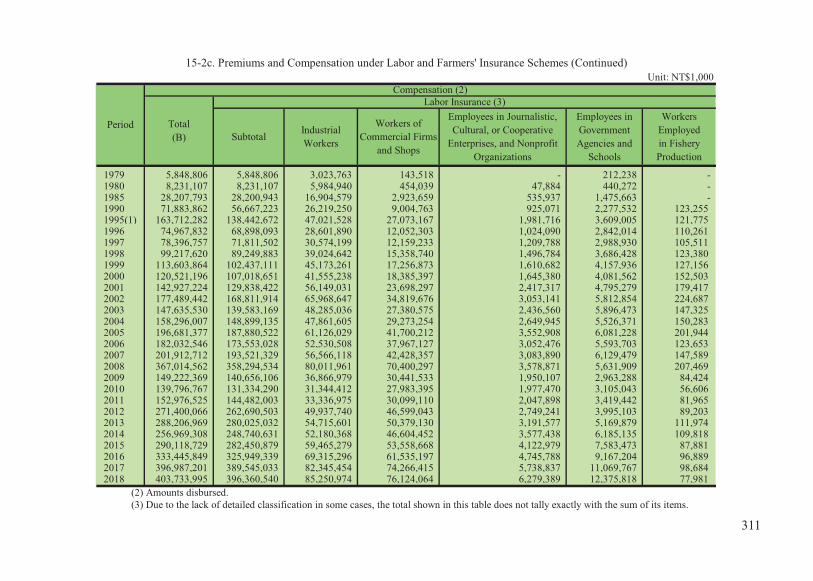
1979 5,848,806 5,848,806 3,023,763 143,518 - 212,238 - 1980 8,231,107 8,231,107 5,984,940 454,039 47,884 440,272 - 1985 28,207,793 28,200,943 16,904,579 2,923,659 535,937 1,475,663 - 1990 71,883,862 56,667,223 26,219,250 9,004,763 925,071 2,277,532 123,255 1995(1) 163,712,282 138,442,672 47,021,528 27,073,167 1,981,716 3,609,005 121,775 1996 74,967,832 68,898,093 28,601,890 12,052,303 1,024,090 2,842,014 110,261 1997 78,396,757 71,811,502 30,574,199 12,159,233 1,209,788 2,988,930 105,511 1998 99,217,620 89,249,883 39,024,642 15,358,740 1,496,784 3,686,428 123,380 1999 113,603,864 102,437,111 45,173,261 17,256,873 1,610,682 4,157,936 127,156 2000 120,521,196 107,018,651 41,555,238 18,385,397 1,645,380 4,081,562 152,503 2001 142,927,224 129,838,422 56,149,031 23,698,297 2,417,317 4,795,279 179,417 2002 177,489,442 168,811,914 65,968,647 34,819,676 3,053,141 5,812,854 224,687 2003 147,635,530 139,583,169 48,285,036 27,380,575 2,436,560 5,896,473 147,325 2004 158,296,007 148,899,135 47,861,605 29,273,254 2,649,945 5,526,371 150,283 2005 196,681,377 187,880,522 61,126,029 41,700,212 3,552,908 6,081,228 201,944 2006 182,032,546 173,553,028 52,530,508 37,967,127 3,052,476 5,593,703 123,653 2007 201,912,712 193,521,329 56,566,118 42,428,357 3,083,890 6,129,479 147,589 2008 367,014,562 358,294,534 80,011,961 70,400,297 3,578,871 5,631,909 207,469 2009 149,222,369 140,656,106 36,866,979 30,441,533 1,950,107 2,963,288 84,424 2010 139,796,767 131,334,290 31,344,412 27,983,395 1,977,470 3,105,043 56,606 2011 152,976,525 144,482,003 33,336,975 30,099,110 2,047,898 3,419,442 81,965 2012 271,400,066 262,690,503 49,937,740 46,599,043 2,749,241 3,995,103 89,203 2013 288,206,969 280,025,032 54,715,601 50,379,130 3,191,577 5,169,879 111,974 2014 256,969,308 248,740,631 52,180,368 46,604,452 3,577,438 6,185,135 109,818 2015 290,118,729 282,450,879 59,465,279 53,558,668 4,122,979 7,583,473 87,881 2016 333,445,849 325,949,339 69,315,296 61,535,197 4,745,788 9,167,204 96,889 2017 396,987,201 389,545,033 82,345,454 74,266,415 5,738,837 11,069,767 98,684 2018 403,733,995 396,360,540 85,250,974 76,124,064 6,279,389 12,375,818 77,981
(2) Amounts disbursed. (3) Due to the lack of detailed classification in some cases, the total shown in this table does not tally exactly with the sum of its items.
Labor Insurance (3)Compensation (2)
15-2c. Premiums and Compensation under Labor and Farmers' Insurance Schemes (Continued)Unit: NT$1,000
Period Total(B) Subtotal
IndustrialWorkers
Workers ofCommercial Firms
and Shops
Employees in Journalistic,Cultural, or Cooperative
Enterprises, and NonprofitOrganizations
Employees inGovernmentAgencies and
Schools
WorkersEmployedin FisheryProduction
311

1979 - 256,716 237,788 49,668 - 1,708,182 1980 652 756,076 430,779 116,464 - 1,950,937 1985 16,012 4,963,437 1,044,851 336,804 6,850 44,535 1990 20,527 14,511,684 2,536,128 1,049,012 15,216,639 13,406,035
1995 (1) 25,704 46,596,857 9,636,212 2,376,707 25,269,610 -21,831,7611996 5,510 20,360,374 2,801,428 1,100,223 6,069,739 59,955,683 1997 5,937 20,829,513 2,556,364 1,374,675 6,585,255 62,611,885 1998 3,853 25,369,290 2,708,969 1,477,346 9,967,737 50,883,280 1999 8,904 28,716,804 3,605,048 1,779,807 11,166,753 33,290,072 2000 4,823 30,152,273 4,080,282 1,842,379 13,502,545 33,976,343 2001 15,228 35,603,725 4,640,124 2,338,417 13,088,802 14,318,699 2002 26,122 48,906,737 5,264,286 4,734,061 8,677,528 -19,565,4422003 10,334 46,644,420 4,868,972 3,912,464 8,052,361 -1,784,3442004 15,225 53,322,658 5,665,070 4,431,216 9,396,872 -6,606,1772005 16,512 62,935,838 6,451,715 5,792,859 8,800,855 -40,661,2482006 21,741 60,788,826 7,210,273 6,254,393 8,479,518 -19,056,8842007 142,793 71,554,953 6,591,361 6,835,952 8,391,384 -32,914,1422008 276,501 177,912,650 11,003,776 9,224,492 8,720,028 -194,389,0392009 129,395 57,329,218 4,946,931 5,916,536 8,566,263 53,802,9702010 217,809 56,029,165 4,308,260 6,255,627 8,462,478 72,073,1792011 253,811 64,812,709 4,265,119 6,115,567 8,494,522 85,821,2882012 408,859 143,759,509 7,048,409 8,062,968 8,709,562 -6,692,1732013 531,077 149,732,733 7,568,555 8,582,214 8,181,937 -6,859,1772014 513,989 124,708,265 6,809,543 7,996,992 8,228,677 48,081,5572015 570,123 140,565,727 7,752,711 8,680,735 7,667,850 40,764,0202016 652,273 161,745,859 9,225,526 9,394,136 7,496,510 6,387,4002017 794,063 192,661,099 11,633,233 10,856,317 7,442,168 -29,918,0602018 861,266 192,169,892 12,188,759 10,932,344 7,373,454 -27,778,889
15-2d. Premiums and Compensation under Labor and Farmers' Insurance Schemes (Continued)Unit: NT$1,000
Period
Labor Insurance (3)
Craft WorkersClass A Members
of Fishermen'sAssociations
VoluntaryInsuredPersons
Persons ReceivingTraining in
Vocational TrainingOrganizations
ComparisonAmount(A)-(B)
Farmers'Health
Insurance
Compensation (2)
312

1980 24,207,282 24,207,282 1,412,263 859,955 14,806,644 355,988 754,868 1981 27,016,035 27,016,035 1,455,699 787,383 16,138,436 404,540 981,639 1982 30,113,350 30,113,350 1,525,596 721,849 17,483,295 417,900 1,266,267 1983 32,350,354 32,350,354 1,501,938 662,152 18,433,618 418,221 1,498,007 1984 36,583,405 36,583,405 1,585,434 560,260 20,860,423 429,663 1,773,137 1985 40,559,282 40,554,648 1,678,147 512,130 22,486,105 431,722 2,231,195 1986 43,040,001 42,267,120 1,672,319 469,659 22,959,698 388,751 2,600,954 1987 54,372,433 52,851,053 1,919,728 442,953 28,674,174 416,818 3,459,293 1988 52,438,073 50,135,154 1,683,502 304,187 26,685,396 344,510 3,419,460 1989 81,397,747 72,921,823 2,640,820 304,896 36,867,241 458,133 5,398,478 1990 76,685,474 59,701,501 2,299,123 175,759 27,782,811 338,081 4,744,424 1991 81,094,231 63,404,375 2,589,698 149,707 28,816,454 339,115 5,321,276 1992 157,863,396 118,835,141 4,701,503 232,207 50,768,488 607,440 10,180,711 1993 147,002,892 110,611,851 4,370,071 172,625 44,729,961 465,123 10,047,700 1994 170,417,171 126,358,657 5,162,056 222,867 49,032,728 570,962 12,060,360 1995 (1) 79,281,430 57,903,636 2,412,022 172,169 21,802,826 254,148 5,621,683 1996 623,980 562,285 24,318 1,421 211,742 2,034 60,599 1997 591,476 540,870 23,627 1,114 199,065 1,922 55,758 1998 722,483 626,074 24,927 1,553 264,598 2,132 73,614 1999 777,646 689,926 28,455 7,544 302,456 2,522 71,038 2000 875,039 777,038 30,683 2,187 373,778 3,641 71,049 2001 1,222,745 1,125,901 31,510 1,882 548,427 3,668 87,220
(1) See (1) of Table 15-1a.(2) See (3) of Table 15-2c.Source: See Table 15-1a.
Construction
I. Cases
Agriculture,Forestry, Fishery
and AnimalHusbandry
15-3a. Compensation from Labor and Farmers' Insurance Schemes by Industry
Labor Insurance (2)
Subtotal Mining andQuarrying
Manufacturing Electricity,Gas and Water
PeriodTotal
Compensation
313

1980 899,006 2,655,142 462,180 - 2,001,236 - - 1981 1,184,593 2,927,848 595,249 - 2,540,648 - - 1982 1,640,551 3,177,650 712,347 - 3,167,895 - - 1983 1,994,169 3,376,455 808,362 - 3,657,432 - - 1984 2,496,218 3,612,574 943,220 - 4,322,476 - - 1985 3,152,710 3,880,977 1,118,267 - 5,063,395 - 4,634 1986 3,575,779 3,945,855 1,195,908 - 5,458,197 - 772,881 1987 4,908,377 4,532,967 1,510,915 - 6,985,828 - 1,521,380 1988 5,228,666 4,138,309 1,510,414 - 6,820,710 - 2,302,919 1989 8,512,953 5,806,643 2,543,048 - 10,389,611 - 8,475,924 1990 7,801,047 4,769,448 2,582,647 - 9,208,161 - 16,983,973 1991 8,332,251 5,011,082 2,825,672 - 10,019,120 - 17,689,856 1992 17,469,933 9,143,338 5,965,814 - 19,765,707 - 39,028,255 1993 17,038,858 8,335,068 5,866,366 - 19,586,079 - 36,391,041 1994 19,803,415 9,200,818 4,036,510 3,466,150 20,980,218 1,822,573 44,058,514 1995 (1) 9,321,918 4,139,510 1,900,504 1,656,411 9,802,292 820,153 21,377,794 1996 86,380 42,691 19,607 15,863 91,454 6,176 61,695 1997 79,695 40,931 19,278 14,658 85,239 6,954 50,606 1998 82,453 47,883 19,970 15,372 85,622 7,950 96,409 1999 86,733 48,162 23,703 17,170 94,087 8,056 87,720 2000 96,111 49,120 27,424 20,081 95,242 7,722 98,001 2001 170,597 62,839 43,277 45,423 121,775 9,283 96,844
I. Cases
15-3b. Compensation from Labor and Farmers' Insurance Schemes by Industry (Continued)
Transport,Storage and
Communications
BusinessServices
Social, Personaland RelatedCommunity
Services
PublicAdministration
Trade andCatering
Labor Insurance (2)
Finance,Insurance and
Real Estate
Period
Compensation
Farmers'Health
Insurance
314

1980 8,231,107 8,231,107 537,472 474,027 4,417,309 127,963 338,567 1981 11,626,083 11,626,083 715,157 597,684 6,091,706 176,340 558,272 1982 15,024,701 15,024,701 898,851 743,206 7,486,403 231,565 806,029 1983 17,799,425 17,799,425 882,769 1,129,032 8,717,976 267,189 984,656 1984 22,283,706 22,283,706 1,061,191 1,195,904 10,805,595 324,703 1,301,633 1985 28,207,793 28,200,943 1,374,564 1,190,428 13,616,046 382,294 1,778,206 1986 31,442,647 30,920,294 1,840,949 1,222,113 14,308,249 395,929 2,072,128 1987 39,507,709 38,435,166 1,725,792 1,515,107 17,897,828 441,004 2,743,252 1988 44,094,801 42,446,510 1,872,965 1,307,711 19,755,560 480,157 3,118,048 1989 59,422,476 53,488,063 2,531,949 1,087,397 24,076,626 570,114 4,297,323 1990 71,883,862 56,667,223 3,207,316 783,200 24,463,300 592,955 4,746,348 1991 82,069,651 65,808,939 5,948,453 560,149 27,074,989 683,636 5,586,160 1992 124,864,465 96,502,092 5,604,890 583,061 39,566,154 854,899 8,389,231 1993 130,549,934 103,241,626 5,959,806 528,115 40,893,087 891,997 9,433,276 1994 161,601,280 128,346,763 7,727,440 621,811 48,540,690 1,339,663 12,304,748
1995 (1) 163,712,282 138,442,672 11,351,122 836,392 49,910,081 910,737 13,968,760 1996 74,967,832 68,898,093 3,697,055 561,479 27,051,906 1,043,060 6,414,421 1997 78,396,757 71,811,502 3,521,223 522,409 28,565,711 1,063,095 6,687,263 1998 99,217,620 89,249,883 3,805,742 507,812 35,028,431 1,084,702 8,170,987 1999 113,603,864 102,437,111 4,903,282 1,984,922 38,906,204 1,329,881 9,319,089 2000 120,521,196 107,018,651 5,414,231 637,504 40,502,599 1,341,010 9,391,749 2001 142,927,224 129,838,422 6,086,234 535,232 54,298,151 1,402,023 11,025,238
Construction
II. Amount (NT$1,000)
Agriculture,Forestry, Fishery
and AnimalHusbandry
15-3c. Compensation from Labor and Farmers' Insurance Schemes by Industry (Continued)
Labor Insurance (2)
Subtotal Mining andQuarrying
Manufacturing Electricity,Gas and Water
PeriodTotal
Compensation
315

1980 321,771 1,061,398 131,125 - 821,475 - - 1981 575,647 1,381,484 208,268 - 1,321,524 - - 1982 895,862 1,800,342 308,841 - 1,853,603 - - 1983 1,126,669 2,060,048 413,406 - 2,217,680 - - 1984 1,597,764 2,552,648 524,888 - 2,919,381 - - 1985 2,267,157 3,091,404 706,062 - 3,794,781 - 6,850 1986 2,609,637 3,392,178 794,704 - 4,284,407 - 522,353 1987 3,694,318 3,942,923 1,014,679 - 5,460,263 - 1,072,543 1988 4,403,139 4,355,160 1,149,572 - 6,004,196 - 1,648,291 1989 6,142,468 5,365,758 1,664,747 - 7,751,680 - 5,934,413 1990 6,787,216 5,670,422 2,014,563 - 8,401,902 - 15,216,639 1991 7,553,124 6,398,697 2,423,591 - 9,580,140 - 16,260,712 1992 13,119,894 8,968,627 4,241,243 - 15,174,093 - 28,362,373 1993 14,382,624 9,894,799 4,830,524 - 16,427,398 - 27,308,308 1994 17,998,014 12,480,691 3,406,410 3,031,701 18,750,506 2,145,089 33,254,517
1995 (1) 20,035,325 13,550,081 3,171,198 3,193,521 19,767,083 1,748,373 25,269,610 1996 8,278,744 8,151,729 1,810,833 1,327,047 9,192,909 1,368,910 6,069,739 1997 8,370,872 8,710,525 2,053,641 1,339,997 9,226,312 1,743,104 6,585,255 1998 10,099,793 12,896,014 2,648,179 1,687,008 11,047,277 2,273,487 9,967,737 1999 11,262,500 14,710,318 2,983,346 1,993,407 12,619,999 2,423,521 11,166,753 2000 11,624,435 12,117,777 3,372,215 2,251,293 12,954,051 2,292,975 13,502,545 2001 14,740,480 15,079,403 4,443,620 3,142,509 16,436,544 2,647,400 13,088,802
II. Amount (NT$1,000)
Finance,Insurance and
Real Estate
Period
Compensation
Farmers'Health
Insurance
15-3d. Compensation from Labor and Farmers' Insurance Schemes by Industry (Continued)
Transport,Storage and
Communications
BusinessServices
Social, Personaland RelatedCommunity
Services
PublicAdministration
Trade andCatering
Labor Insurance (2)
316
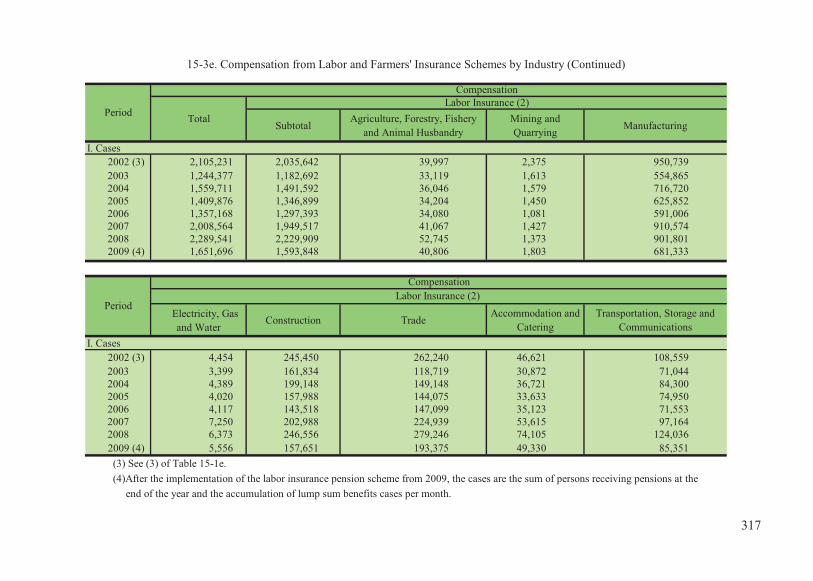
SubtotalAgriculture, Forestry, Fishery
and Animal HusbandryMining andQuarrying Manufacturing
I. Cases 2002 (3) 2,105,231 2,035,642 39,997 2,375 950,739
2003 1,244,377 1,182,692 33,119 1,613 554,865 2004 1,559,711 1,491,592 36,046 1,579 716,720 2005 1,409,876 1,346,899 34,204 1,450 625,852 2006 1,357,168 1,297,393 34,080 1,081 591,006 2007 2,008,564 1,949,517 41,067 1,427 910,574 2008 2,289,541 2,229,909 52,745 1,373 901,801
2009 (4) 1,651,696 1,593,848 40,806 1,803 681,333
Electricity, Gasand Water
Construction Trade Accommodation andCatering
Transportation, Storage andCommunications
I. Cases 2002 (3) 4,454 245,450 262,240 46,621 108,559
2003 3,399 161,834 118,719 30,872 71,044 2004 4,389 199,148 149,148 36,721 84,300 2005 4,020 157,988 144,075 33,633 74,950 2006 4,117 143,518 147,099 35,123 71,553 2007 7,250 202,988 224,939 53,615 97,164 2008 6,373 246,556 279,246 74,105 124,036
2009 (4) 5,556 157,651 193,375 49,330 85,351
end of the year and the accumulation of lump sum benefits cases per month.
(3) See (3) of Table 15-1e.(4)After the implementation of the labor insurance pension scheme from 2009, the cases are the sum of persons receiving pensions at the
15-3e. Compensation from Labor and Farmers' Insurance Schemes by Industry (Continued)
Period
Compensation
TotalLabor Insurance (2)
Period
CompensationLabor Insurance (2)
317
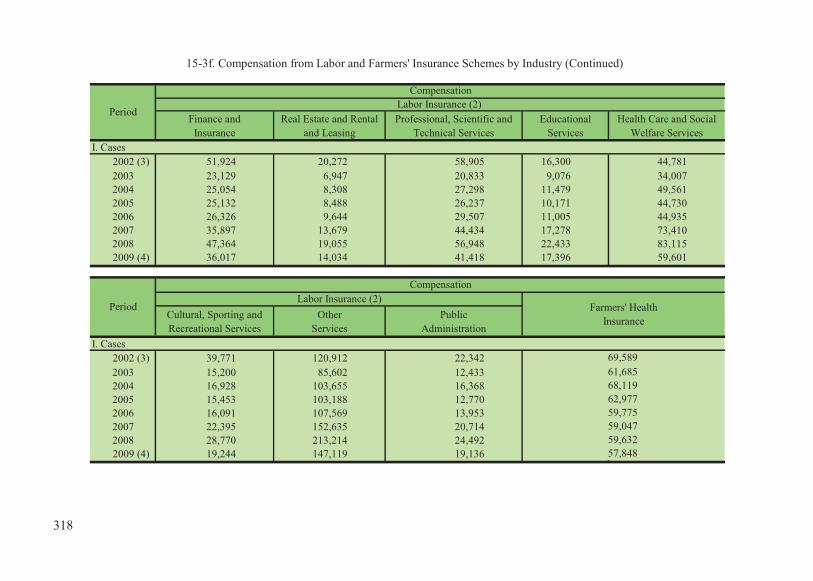
Finance andInsurance
Real Estate and Rentaland Leasing
Professional, Scientific andTechnical Services
EducationalServices
Health Care and SocialWelfare Services
I. Cases 2002 (3) 51,924 20,272 58,905 16,300 44,781
2003 23,129 6,947 20,833 9,076 34,007 2004 25,054 8,308 27,298 11,479 49,561 2005 25,132 8,488 26,237 10,171 44,730 2006 26,326 9,644 29,507 11,005 44,935 2007 35,897 13,679 44,434 17,278 73,410 2008 47,364 19,055 56,948 22,433 83,115
2009 (4) 36,017 14,034 41,418 17,396 59,601
Cultural, Sporting andRecreational Services
OtherServices
PublicAdministration
I. Cases 2002 (3) 39,771 120,912 22,342
2003 15,200 85,602 12,433 2004 16,928 103,655 16,368 2005 15,453 103,188 12,770 2006 16,091 107,569 13,953 2007 22,395 152,635 20,714 2008 28,770 213,214 24,492
2009 (4) 19,244 147,119 19,136
15-3f. Compensation from Labor and Farmers' Insurance Schemes by Industry (Continued)
Period
CompensationLabor Insurance (2)
Period
CompensationLabor Insurance (2)
Farmers' HealthInsurance
59,63257,848
69,58961,68568,11962,97759,77559,047
318
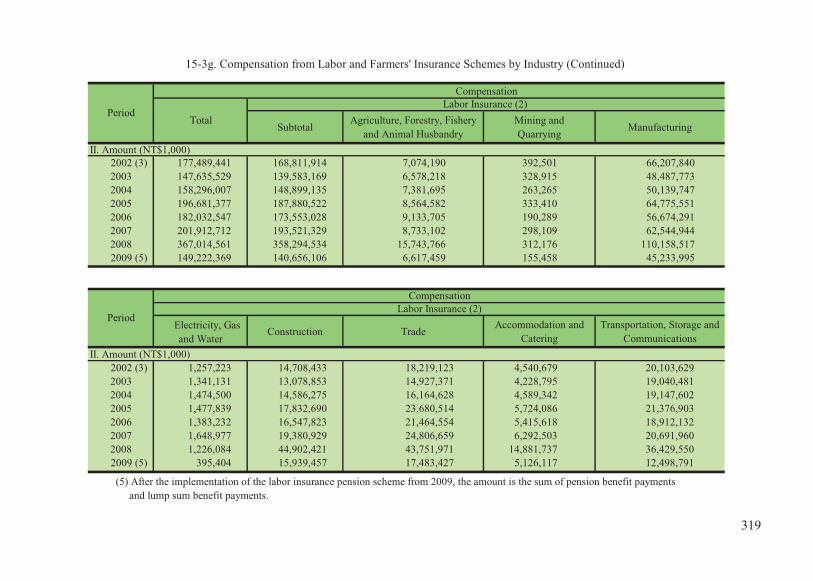
SubtotalAgriculture, Forestry, Fishery
and Animal HusbandryMining andQuarrying Manufacturing
II. Amount (NT$1,000) 2002 (3) 177,489,441 168,811,914 7,074,190 392,501 66,207,840
2003 147,635,529 139,583,169 6,578,218 328,915 48,487,773 2004 158,296,007 148,899,135 7,381,695 263,265 50,139,747 2005 196,681,377 187,880,522 8,564,582 333,410 64,775,551 2006 182,032,547 173,553,028 9,133,705 190,289 56,674,291 2007 201,912,712 193,521,329 8,733,102 298,109 62,544,944 2008 367,014,561 358,294,534 15,743,766 312,176 110,158,517
2009 (5) 149,222,369 140,656,106 6,617,459 155,458 45,233,995
Electricity, Gasand Water
Construction Trade Accommodation andCatering
Transportation, Storage andCommunications
II. Amount (NT$1,000) 2002 (3) 1,257,223 14,708,433 18,219,123 4,540,679 20,103,629
2003 1,341,131 13,078,853 14,927,371 4,228,795 19,040,481 2004 1,474,500 14,586,275 16,164,628 4,589,342 19,147,602 2005 1,477,839 17,832,690 23,680,514 5,724,086 21,376,903 2006 1,383,232 16,547,823 21,464,554 5,415,618 18,912,132 2007 1,648,977 19,380,929 24,806,659 6,292,503 20,691,960 2008 1,226,084 44,902,421 43,751,971 14,881,737 36,429,550
2009 (5) 395,404 15,939,457 17,483,427 5,126,117 12,498,791
(5) After the implementation of the labor insurance pension scheme from 2009, the amount is the sum of pension benefit payments and lump sum benefit payments.
15-3g. Compensation from Labor and Farmers' Insurance Schemes by Industry (Continued)
Period
Compensation
TotalLabor Insurance (2)
Period
CompensationLabor Insurance (2)
319

Finance andInsurance
Real Estate and Rentaland Leasing
Professional, Scientificand Technical Services Educational Services
Health Care and SocialWelfare Services
II. Amount (NT$1,000) 2002 (3) 4,831,392 1,608,465 3,780,720 1,533,393 2,049,292
2003 3,597,069 1,315,785 2,934,884 1,547,132 2,126,379 2004 3,996,354 1,431,807 3,279,798 1,584,925 2,151,040 2005 5,129,042 1,985,655 4,489,001 1,751,618 2,772,129 2006 4,704,360 2,373,328 4,378,638 1,670,118 2,597,837 2007 5,035,763 2,058,998 5,170,072 2,036,079 2,960,334 2008 7,650,166 3,840,882 8,361,894 2,371,866 3,908,379
2009 (5) 3,943,330 1,703,169 3,558,402 1,131,404 2,171,444
Cultural, Sporting andRecreational Services Other Services Public Administration
II. Amount (NT$1,000) 2002 (3) 3,391,793 15,924,804 3,186,734
2003 2,554,159 14,104,497 3,390,718 2004 2,547,873 16,878,044 3,278,732 2005 3,298,052 21,341,270 3,326,903 2006 3,386,617 21,490,681 3,219,477 2007 3,422,888 24,771,052 3,628,125 2008 6,120,050 55,224,056 3,364,412
2009 (5) 2,413,542 20,609,490 1,641,911
9,396,8728,800,8558,479,5188,391,3848,720,0288,566,263
8,677,5288,052,361
15-3h. Compensation from Labor and Farmers' Insurance Schemes by Industry (Continued)
Period
CompensationLabor Insurance (2)
Period
CompensationLabor Insurance (2)
Farmers' HealthInsurance
320

Subtotal
Agriculture,Forestry,Fishing &
AnimalHusbandry
Mining &Quarrying
Manufac-turing
Electricity& GasSupply
WaterSupply &Remedi-
ationActivities
Construc-tion
Wholesale& Retail
Trade
Transpor-tation &Storage
Accommo-dation &
FoodService
ActivitiesI. Cases2010 2,501,350 2,444,938 56,697 1,825 938,473 7,047 19,982 263,041 316,982 119,454 88,8352013 2,389,842 2,337,385 66,583 1,467 906,833 6,297 17,369 239,294 296,470 128,683 97,5722014 2,723,858 2,671,479 75,284 1,585 999,956 7,492 18,845 267,586 351,143 142,566 114,7352015 2,885,496 2,836,438 81,851 1,604 1,045,141 8,365 18,547 280,954 377,475 155,105 126,7982016 3,083,892 3,036,698 91,147 1,806 1,084,804 9,294 18,348 301,492 407,705 168,194 140,0272017 3,340,788 3,294,402 104,536 1,843 1,176,849 10,632 19,560 319,820 438,174 181,176 153,6602018 3,661,667 3,616,149 115,478 2,033 1,263,358 11,487 21,219 339,489 489,353 194,059 175,182
Information& Commu-
nication
Financial &InsuranceActivities
Real EstateActivities
Profes-sional,
Scientific&
TechnicalActivities
SupportService
Activities
PublicAdmini-
stration &Defence;Compul-
sory SocialSecurity
Education
HumanHealth &
Social WorkActivities
Art,Entertain-ment &
Recreation
OtherService
Activities
I. Cases2010 31,186 57,222 19,902 55,868 60,945 35,409 33,334 104,041 19,567 169,154 56,4122013 29,986 53,387 22,038 53,090 66,230 29,177 34,962 90,143 20,696 163,059 52,4572014 36,629 63,679 26,570 64,205 78,305 36,930 43,947 109,684 24,334 184,904 52,3792015 40,434 69,027 30,112 67,670 86,930 40,226 46,886 112,611 25,872 196,009 49,0582016 44,540 76,005 33,461 75,947 97,603 44,574 54,002 120,268 29,402 212,336 47,1942017 50,229 84,890 35,483 82,572 104,739 50,038 59,516 130,368 31,818 228,787 46,3862018 60,352 96,376 39,045 94,307 121,431 57,003 68,246 148,592 34,700 248,330 45,518
(6) See (4) of Table 15-1i.
Endof
Year
Labor Insurance (2) (6)
Farmers'Health
Insurance
15-3i. Compensation from Labor and Farmers' Insurance Schemes by Industry (Continued)
Endof
YearTotal
Labor Insurance (2) (6)
321
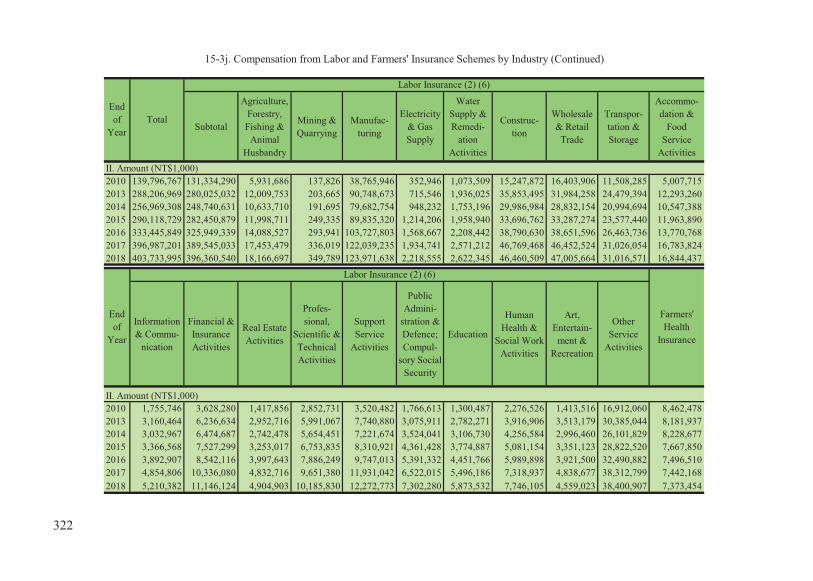
Subtotal
Agriculture,Forestry,Fishing &
AnimalHusbandry
Mining &Quarrying
Manufac-turing
Electricity& GasSupply
WaterSupply &Remedi-
ationActivities
Construc-tion
Wholesale& Retail
Trade
Transpor-tation &Storage
Accommo-dation &
FoodService
ActivitiesII. Amount (NT$1,000)2010 139,796,767 131,334,290 5,931,686 137,826 38,765,946 352,946 1,073,509 15,247,872 16,403,906 11,508,285 5,007,7152013 288,206,969 280,025,032 12,009,753 203,665 90,748,673 715,546 1,936,025 35,853,495 31,984,258 24,479,394 12,293,2602014 256,969,308 248,740,631 10,633,710 191,695 79,682,754 948,232 1,753,196 29,986,984 28,832,154 20,994,694 10,547,3882015 290,118,729 282,450,879 11,998,711 249,335 89,835,320 1,214,206 1,958,940 33,696,762 33,287,274 23,577,440 11,963,8902016 333,445,849 325,949,339 14,088,527 293,941 103,727,803 1,568,667 2,208,442 38,790,630 38,651,596 26,463,736 13,770,7682017 396,987,201 389,545,033 17,453,479 336,019 122,039,235 1,934,741 2,571,212 46,769,468 46,452,524 31,026,054 16,783,8242018 403,733,995 396,360,540 18,166,697 349,789 123,971,638 2,218,555 2,622,345 46,460,509 47,005,664 31,016,571 16,844,437
Information& Commu-
nication
Financial &InsuranceActivities
Real EstateActivities
Profes-sional,
Scientific &TechnicalActivities
SupportService
Activities
PublicAdmini-
stration &Defence;Compul-
sory SocialSecurity
Education
HumanHealth &
Social WorkActivities
Art,Entertain-
ment &Recreation
OtherService
Activities
II. Amount (NT$1,000)2010 1,755,746 3,628,280 1,417,856 2,852,731 3,520,482 1,766,613 1,300,487 2,276,526 1,413,516 16,912,060 8,462,4782013 3,160,464 6,236,634 2,952,716 5,991,067 7,740,880 3,075,911 2,782,271 3,916,906 3,513,179 30,385,044 8,181,9372014 3,032,967 6,474,687 2,742,478 5,654,451 7,221,674 3,524,041 3,106,730 4,256,584 2,996,460 26,101,829 8,228,6772015 3,366,568 7,527,299 3,253,017 6,753,835 8,310,921 4,361,428 3,774,887 5,081,154 3,351,123 28,822,520 7,667,8502016 3,892,907 8,542,116 3,997,643 7,886,249 9,747,013 5,391,332 4,451,766 5,989,898 3,921,500 32,490,882 7,496,5102017 4,854,806 10,336,080 4,832,716 9,651,380 11,931,042 6,522,015 5,496,186 7,318,937 4,838,677 38,312,799 7,442,1682018 5,210,382 11,146,124 4,904,903 10,185,830 12,272,773 7,302,280 5,873,532 7,746,105 4,559,023 38,400,907 7,373,454
Endof
Year
Labor Insurance (2) (6)
Farmers'Health
Insurance
15-3j. Compensation from Labor and Farmers' Insurance Schemes by Industry (Continued)
Endof
YearTotal
Labor Insurance (2) (6)
322
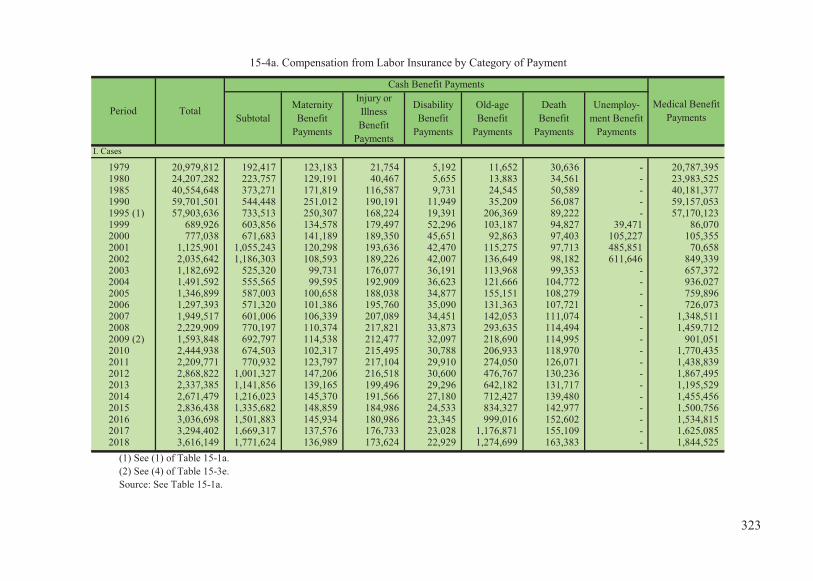
1979 20,979,812 192,417 123,183 21,754 5,192 11,652 30,636 - 20,787,395 1980 24,207,282 223,757 129,191 40,467 5,655 13,883 34,561 - 23,983,525 1985 40,554,648 373,271 171,819 116,587 9,731 24,545 50,589 - 40,181,377 1990 59,701,501 544,448 251,012 190,191 11,949 35,209 56,087 - 59,157,053 1995 (1) 57,903,636 733,513 250,307 168,224 19,391 206,369 89,222 - 57,170,123 1999 689,926 603,856 134,578 179,497 52,296 103,187 94,827 39,471 86,070 2000 777,038 671,683 141,189 189,350 45,651 92,863 97,403 105,227 105,355 2001 1,125,901 1,055,243 120,298 193,636 42,470 115,275 97,713 485,851 70,658 2002 2,035,642 1,186,303 108,593 189,226 42,007 136,649 98,182 611,646 849,339 2003 1,182,692 525,320 99,731 176,077 36,191 113,968 99,353 - 657,372 2004 1,491,592 555,565 99,595 192,909 36,623 121,666 104,772 - 936,027 2005 1,346,899 587,003 100,658 188,038 34,877 155,151 108,279 - 759,896 2006 1,297,393 571,320 101,386 195,760 35,090 131,363 107,721 - 726,073 2007 1,949,517 601,006 106,339 207,089 34,451 142,053 111,074 - 1,348,511 2008 2,229,909 770,197 110,374 217,821 33,873 293,635 114,494 - 1,459,712 2009 (2) 1,593,848 692,797 114,538 212,477 32,097 218,690 114,995 - 901,051 2010 2,444,938 674,503 102,317 215,495 30,788 206,933 118,970 - 1,770,435 2011 2,209,771 770,932 123,797 217,104 29,910 274,050 126,071 - 1,438,839 2012 2,868,822 1,001,327 147,206 216,518 30,600 476,767 130,236 - 1,867,495 2013 2,337,385 1,141,856 139,165 199,496 29,296 642,182 131,717 - 1,195,529 2014 2,671,479 1,216,023 145,370 191,566 27,180 712,427 139,480 - 1,455,456 2015 2,836,438 1,335,682 148,859 184,986 24,533 834,327 142,977 - 1,500,756 2016 3,036,698 1,501,883 145,934 180,986 23,345 999,016 152,602 - 1,534,815 2017 3,294,402 1,669,317 137,576 176,733 23,028 1,176,871 155,109 - 1,625,085 2018 3,616,149 1,771,624 136,989 173,624 22,929 1,274,699 163,383 - 1,844,525
(1) See (1) of Table 15-1a.(2) See (4) of Table 15-3e.Source: See Table 15-1a.
Old-ageBenefit
Payments
DeathBenefit
Payments
Unemploy-ment Benefit
Payments
I. Cases
15-4a. Compensation from Labor Insurance by Category of Payment
Period Total
Cash Benefit Payments
Medical BenefitPaymentsSubtotal
MaternityBenefit
Payments
Injury orIllnessBenefit
Payments
DisabilityBenefit
Payments
323

1979 5,848,806 2,692,181 465,148 71,743 211,063 1,071,688 872,538 - 3,156,625 1980 8,231,107 3,543,791 592,031 109,046 246,952 1,381,795 1,213,968 - 4,687,316 1985 28,200,943 10,253,804 1,862,738 465,208 821,449 3,757,409 3,347,000 - 17,947,139 1990 56,667,223 25,063,722 4,643,707 790,731 1,054,928 9,875,556 8,698,800 - 31,603,501 1995(1) 138,442,672 92,360,494 5,391,278 1,225,742 3,336,340 64,277,837 18,129,298 - 46,082,178 1999 102,437,111 101,428,197 3,131,457 2,273,835 13,019,655 62,340,483 20,146,397 516,371 1,008,914 2000 107,018,651 100,882,032 3,366,031 2,625,701 11,123,781 61,129,249 20,972,751 1,664,519 6,136,619 2001 129,838,422 129,371,377 2,934,533 2,591,119 10,956,959 84,137,766 20,925,560 7,825,440 467,046 2002 168,811,914 166,941,630 2,689,447 2,481,261 10,246,352 120,668,543 20,651,908 10,204,120 1,870,284 2003 139,583,169 137,798,924 2,492,707 2,450,510 8,771,951 103,200,785 20,882,972 - 1,784,244 2004 148,899,135 147,071,314 2,514,024 2,681,654 8,682,816 111,330,077 21,862,742 - 1,827,821 2005 187,880,522 185,965,543 2,573,172 2,715,772 8,413,751 149,647,800 22,615,048 - 1,914,979 2006 173,553,028 171,672,482 2,642,336 2,934,663 8,929,945 134,399,188 22,766,349 - 1,880,547 2007 193,521,329 190,280,831 2,816,589 3,046,989 8,569,992 152,534,198 23,313,063 - 3,240,498 2008 358,294,534 356,287,174 2,968,860 3,326,565 8,623,458 317,143,713 24,224,578 - 2,007,360 2009(3) 140,656,106 137,755,627 3,083,185 3,440,002 7,974,511 100,611,189 22,646,740 - 2,900,479 2010 131,334,290 128,199,631 2,755,303 3,678,508 7,485,163 91,434,891 22,845,767 - 3,134,658 2011 144,482,003 141,555,493 3,355,471 3,865,797 7,272,310 103,190,865 23,871,050 - 2,926,510 2012 262,690,503 259,325,709 4,031,613 3,894,128 7,719,435 219,523,485 24,157,048 - 3,364,794 2013 280,025,032 277,338,051 3,891,028 3,535,433 7,329,888 239,127,229 23,454,473 - 2,686,981 2014 248,740,631 245,830,267 6,136,700 3,395,961 6,867,837 205,530,171 23,899,598 - 2,910,364 2015 282,450,879 279,438,284 8,629,259 3,357,937 5,974,976 237,426,925 24,049,187 - 3,012,596 2016 325,949,339 323,173,412 8,629,649 3,321,385 5,799,534 280,160,735 25,262,109 - 2,775,927 2017 389,545,033 386,598,773 8,373,729 3,176,732 5,720,758 343,998,367 25,329,187 - 2,946,260 2018 396,360,540 393,198,215 8,483,832 3,074,892 5,652,740 348,917,926 27,068,824 - 3,162,325
(3) See (5) of Table 15-3g.
Old-ageBenefit
Payments
DeathBenefit
Payments
Unemploy-ment Benefit
Payments
II. Amount (NT$1,000)
15-4b. Compensation from Labor Insurance by Category of Payment (Continued)
Period Total
Cash Benefit PaymentsMedicalBenefit
PaymentsSubtotalMaternity
BenefitPayments
Injury orIllness Benefit
Payments
DisabilityBenefit
Payments
324
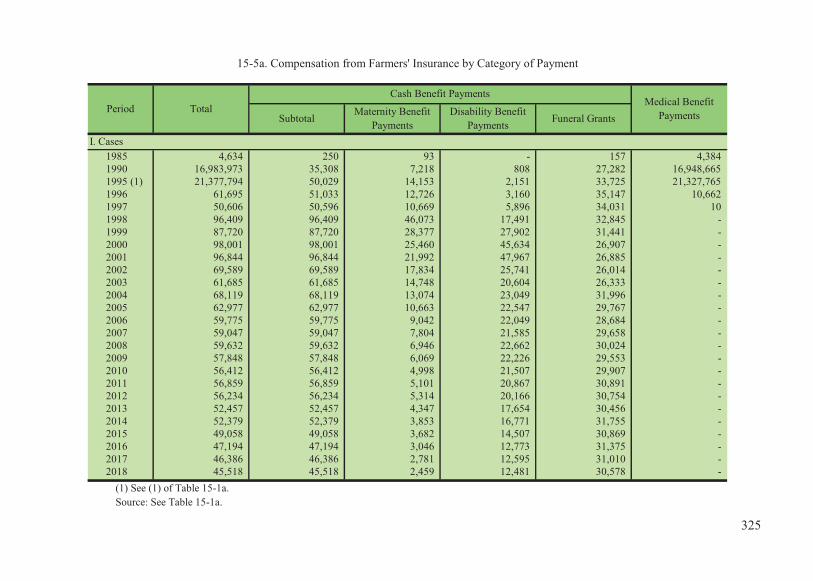
1985 4,634 250 93 - 157 4,384 1990 16,983,973 35,308 7,218 808 27,282 16,948,665 1995 (1) 21,377,794 50,029 14,153 2,151 33,725 21,327,765 1996 61,695 51,033 12,726 3,160 35,147 10,662 1997 50,606 50,596 10,669 5,896 34,031 10 1998 96,409 96,409 46,073 17,491 32,845 - 1999 87,720 87,720 28,377 27,902 31,441 - 2000 98,001 98,001 25,460 45,634 26,907 - 2001 96,844 96,844 21,992 47,967 26,885 - 2002 69,589 69,589 17,834 25,741 26,014 - 2003 61,685 61,685 14,748 20,604 26,333 - 2004 68,119 68,119 13,074 23,049 31,996 - 2005 62,977 62,977 10,663 22,547 29,767 - 2006 59,775 59,775 9,042 22,049 28,684 - 2007 59,047 59,047 7,804 21,585 29,658 - 2008 59,632 59,632 6,946 22,662 30,024 - 2009 57,848 57,848 6,069 22,226 29,553 - 2010 56,412 56,412 4,998 21,507 29,907 - 2011 56,859 56,859 5,101 20,867 30,891 - 2012 56,234 56,234 5,314 20,166 30,754 - 2013 52,457 52,457 4,347 17,654 30,456 - 2014 52,379 52,379 3,853 16,771 31,755 - 2015 49,058 49,058 3,682 14,507 30,869 - 2016 47,194 47,194 3,046 12,773 31,375 - 2017 46,386 46,386 2,781 12,595 31,010 - 2018 45,518 45,518 2,459 12,481 30,578 -
(1) See (1) of Table 15-1a.Source: See Table 15-1a.
Medical BenefitPayments
Cash Benefit Payments
I. Cases
15-5a. Compensation from Farmers' Insurance by Category of Payment
Subtotal Funeral GrantsMaternity BenefitPayments
Disability BenefitPayments
Period Total
325
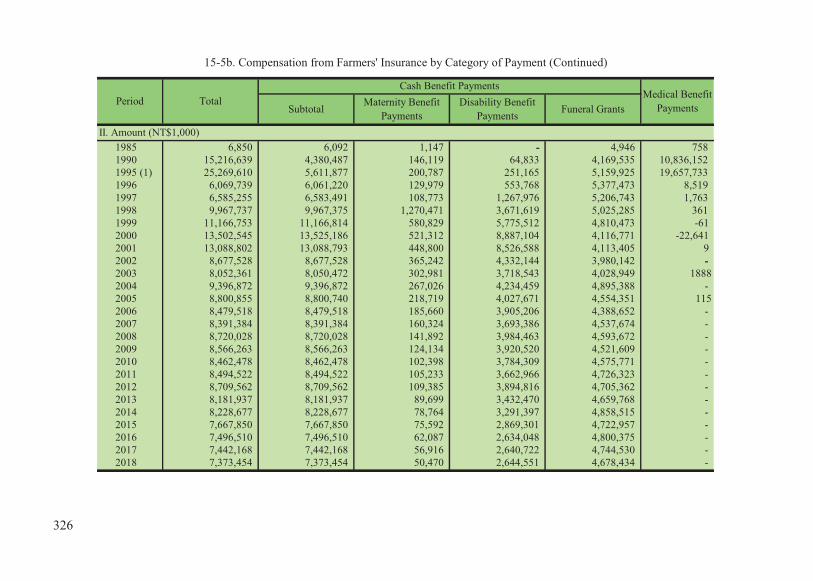
1985 6,850 6,092 1,147 - 4,946 758 1990 15,216,639 4,380,487 146,119 64,833 4,169,535 10,836,152 1995 (1) 25,269,610 5,611,877 200,787 251,165 5,159,925 19,657,733 1996 6,069,739 6,061,220 129,979 553,768 5,377,473 8,519 1997 6,585,255 6,583,491 108,773 1,267,976 5,206,743 1,763 1998 9,967,737 9,967,375 1,270,471 3,671,619 5,025,285 361 1999 11,166,753 11,166,814 580,829 5,775,512 4,810,473 -61 2000 13,502,545 13,525,186 521,312 8,887,104 4,116,771 -22,641 2001 13,088,802 13,088,793 448,800 8,526,588 4,113,405 9 2002 8,677,528 8,677,528 365,242 4,332,144 3,980,142 - 2003 8,052,361 8,050,472 302,981 3,718,543 4,028,949 1888 2004 9,396,872 9,396,872 267,026 4,234,459 4,895,388 - 2005 8,800,855 8,800,740 218,719 4,027,671 4,554,351 115 2006 8,479,518 8,479,518 185,660 3,905,206 4,388,652 - 2007 8,391,384 8,391,384 160,324 3,693,386 4,537,674 - 2008 8,720,028 8,720,028 141,892 3,984,463 4,593,672 - 2009 8,566,263 8,566,263 124,134 3,920,520 4,521,609 - 2010 8,462,478 8,462,478 102,398 3,784,309 4,575,771 - 2011 8,494,522 8,494,522 105,233 3,662,966 4,726,323 - 2012 8,709,562 8,709,562 109,385 3,894,816 4,705,362 - 2013 8,181,937 8,181,937 89,699 3,432,470 4,659,768 - 2014 8,228,677 8,228,677 78,764 3,291,397 4,858,515 - 2015 7,667,850 7,667,850 75,592 2,869,301 4,722,957 - 2016 7,496,510 7,496,510 62,087 2,634,048 4,800,375 - 2017 7,442,168 7,442,168 56,916 2,640,722 4,744,530 - 2018 7,373,454 7,373,454 50,470 2,644,551 4,678,434 -
Medical BenefitPayments
Cash Benefit Payments
II. Amount (NT$1,000)
15-5b. Compensation from Farmers' Insurance by Category of Payment (Continued)
Subtotal Funeral GrantsMaternity Benefit
PaymentsDisability Benefit
PaymentsPeriod Total
326

End of Year
GovernmentEmployee Insurance
(GEI)
HealthInsurance
for Govern-ment
Employees'Dependents(HIGED)
RetiredGovern-
mentEmployeeInsurance(RGEI)
HealthInsurancefor Retired
Govern-ment
Employees(HIRGE)
HealthInsurance forSpouses of
RetiredGovernmentEmployees(HISRGE)
Insurance for
Teaching and
Administra-tive Staff of
Private Schools
(ITASPS)
HealthInsurance forDependents ofTeaching and
AdministrativeStaff of Private
Schools(HIDTASPS)
Health Insurance for Retired
Teaching and Administrative Staff of Private
Schools and their Spouses
(HIRTASPS) & (HISRTASPS)
Health Insurancefor Retired
Employees andTheir Dependents
of GovernmentOrganizations and
Private Schools(HIRETDGOPS)
1960 3,763 0 0 0 0 0 0 0 0 1965 3,909 0 600 0 0 0 0 0 0 1970 4,626 0 1,245 0 0 0 0 0 0 1975 4,875 0 1,691 0 0 0 0 0 0 1980 5,250 0 1,856 0 0 199 0 0 0 1985 (1) 5,528 5,439 1,446 3,804 3,273 308 0 83 0 1986 5,558 5,455 1,270 3,970 3,433 307 0 106 0 1987 5,593 5,487 1,183 4,305 3,831 308 0 141 0 1988 5,653 5,539 1,128 4,464 4,037 309 0 154 0 1989 5,693 5,662 1,087 4,226 3,803 309 0 165 0 1990 5,754 5,700 1,052 4,248 3,802 316 274 174 0 1991 5,804 5,740 1,027 4,336 3,892 318 295 181 0 1992 6,256 6,243 1,000 4,488 4,026 318 311 183 0 1993 6,566 6,553 981 4,890 4,362 320 316 197 0 1994 (2) 6,690 6,676 949 0 0 322 320 0 5,245 1995 (3) 6,818 0 780 0 0 326 0 0 0 1996 7,145 0 709 0 0 327 0 0 0 1997 7,569 0 666 0 0 329 0 0 0 1998 (4) 7,129 0 609 0 0 335 0 0 0
Source: The data are provided by the Central Trust of China, R.O.C.(Taiwan).
policies was transferred to the Bureau of National Health Insurance while the Government Employee Insurance Department stillimplements the enrollment and cash benefits of the GEI, ITASPS and RGEI.
(4) Government Employee Insurance (GEI) and Insurance for Teaching and Administrative Staff of Private Schools (ITASPS)were integrated as Government Employee and School Staff Insurance (GESSI) from May 31, 1999. For data on theseprograms from 1999 onward, please refer to Tables 15-11 to 15-15.
(3) After the implementation of National Health Insurance on March 1, 1995, the administration of medical care benefits provided by all the
15-6. Units Insured under Government Employee Insurance and Related Insurance Programs
(1) No new policies were issued under Insurance for Retired Teaching and Administrative Staff of Private Schools as from July 1985. Old policy-holders as well as the newly retired can take out policies issued under HIRTASPS.
(2) HIRGE, HISRGE, HIRTASPS and HISRTASPS were integrated as HIRETDGOPS from April 1, 1994.
327

Unit: Persons
Endof
YearTotal
Govern-ment
EmployeeInsurance
(GEI)
HealthInsurance
for Govern-ment
Employees'Depen-dents
(HIGED)
RetiredGovern-
mentEmployeeInsurance(RGEI)
HealthInsurancefor Retired
Govern-ment
Employees(HIRGE)
HealthInsurance
for Spousesof RetiredGovern-
mentEmployees(HISRGE)
Insurancefor
Teaching &Administra-tive Staff of
PrivateSchools
(ITASPS)
HealthInsurance for
Dependents ofTeaching andAdministra-tive Staff of
PrivateSchools
(HIDTASPS)
HealthInsurance for
RetiredTeaching &
AdministrativeStaff of Private
Schools andTheir Spouses
(HIRTASPS) & (HISRTASPS)
Health Insurancefor Retired
Employees andTheir
Dependents ofGovernment
Organizationsand Private
Schools(HIRETDGOPS)
1960 203,909 203,909 0 0 0 0 0 0 0 0 1965 241,955 240,261 0 1,694 0 0 0 0 0 0 1970 298,667 293,531 0 5,136 0 0 0 0 0 0 1975 367,053 359,034 0 8,019 0 0 0 0 0 0 1980 435,455 415,191 0 9,212 0 0 11,052 0 0 0 1982 652,509 443,783 176,030 9,327 0 0 23,369 0 0 0 1983 664,039 452,881 176,937 9,637 0 0 24,584 0 0 0 1984 683,927 468,577 179,573 9,922 0 0 25,673 0 182 0 1985 (1) 754,928 475,663 180,360 4,952 41,406 26,087 26,277 0 183 0 1986 778,066 483,473 180,739 4,222 49,976 32,241 26,974 0 441 0 1987 815,179 489,772 179,688 3,632 68,080 45,649 27,723 0 635 0 1988 832,098 496,175 176,749 3,352 73,877 53,045 28,110 0 790 0 1989 1,041,853 515,387 385,632 3,155 62,332 45,973 28,529 0 845 0 1990 1,078,449 536,775 390,239 2,921 64,913 47,490 31,213 3,954 944 0 1991 1,103,236 549,615 388,012 2,747 68,041 49,331 33,883 10,529 1,078 0 1992 1,707,301 560,127 950,307 2,579 70,490 50,880 36,075 35,690 1,153 0 1993 1,759,843 572,122 976,771 2,409 74,085 53,389 39,442 40,271 1,354 0 1994 (2) 1,793,094 581,047 982,642 2,193 0 0 42,864 44,038 0 140,310 1995 (3) 634,543 588,354 0 1,710 0 0 44,479 0 0 0 1996 645,592 597,895 0 1,510 0 0 46,187 0 0 0 1997 649,267 600,026 0 1,363 0 0 47,878 0 0 0 1998 (4) 625,774 574,364 0 1,208 0 0 50,202 0 0 0
Source: See Table 15-6.
15-7. Persons Insured under Government Employee Insurance and Related Insurance Programs
(1) (2) (3) (4) See (1) (2) (3) (4) of Table 15-6.
328

Total(A)
PremiumsRegis-trationFees
Others Total(B)
MedicalExpenses
CashBenefits
Refundof Pre-miums
Re-serveFund
Costs ofAdminis-
trationOthers Amount
(C=A-B)
Percen-tage
(C/B x100)
1960 90,503 86,850 3,653 0 142,882 113,478 13,794 145 8,047 6,079 1,339 -52,379 -37 1965 185,077 173,408 4,369 7,300 204,812 138,753 36,910 336 16,793 11,914 106 -19,735 -10 1969 383,171 366,161 4,885 12,125 377,618 206,195 119,140 524 29,728 21,339 692 5,553 1 1970 445,587 427,161 5,419 13,007 437,546 241,746 154,817 646 14,857 24,639 841 8,041 2 1975 837,326 800,445 24,253 12,628 907,493 451,203 405,330 5 0 50,757 198 -70,167 -8 1978 1,498,631 1,467,619 26,731 4,281 1,638,125 639,808 927,916 0 0 68,204 2,197 -139,494 -9 1979 1,846,849 1,814,869 27,246 4,734 2,181,323 768,214 1,326,516 0 0 84,938 1,655 -334,474 -15 1980 2,418,933 2,388,160 28,129 2,644 2,801,925 1,002,394 1,688,145 0 0 102,930 8,456 -382,992 -14 1981 3,396,851 3,363,892 30,176 2,783 4,028,089 1,371,576 2,529,390 0 0 121,633 5,490 -631,238 -16 1982 3,718,804 3,660,475 55,188 3,141 4,625,764 1,565,612 2,914,438 0 0 129,595 16,119 -906,960 -20 1983 3,856,418 3,766,679 65,603 24,136 4,743,226 1,841,569 2,748,870 0 0 124,523 28,264 -886,808 -19 1984 4,176,563 4,096,035 67,664 12,864 5,268,715 2,213,083 2,889,961 0 0 137,868 27,803 -1,092,152 -21 1985 4,936,648 4,849,081 72,721 14,846 6,313,264 2,541,691 3,581,829 0 0 159,649 30,095 -1,376,616 -22 1986 5,430,401 5,371,443 52,887 6,071 7,066,195 2,681,821 4,185,739 0 0 167,457 31,178 -1,635,794 -23 1987 5,866,620 5,830,197 28,385 8,038 8,082,435 2,921,858 4,954,077 0 0 179,887 26,613 -2,215,815 -27 1988 6,691,347 6,658,964 28,551 3,832 9,561,922 3,040,493 6,301,870 0 0 195,377 24,183 -2,870,576 -30 1989 7,664,792 7,611,338 26,717 26,736 11,409,135 3,114,116 8,013,131 0 0 231,090 50,797 -3,744,343 -33 1990 9,358,592 9,273,093 25,903 59,596 13,065,701 3,582,106 9,155,112 0 0 276,280 52,203 -3,707,109 -28 1991 10,787,888 10,666,962 25,935 94,992 16,646,282 4,125,732 12,184,263 0 0 294,606 41,681 -5,858,394 -35 1992 11,854,254 11,775,290 26,372 52,592 15,525,502 4,639,799 10,510,020 0 0 323,708 51,975 -3,671,248 -24 1993 13,190,083 13,033,881 36,586 119,616 17,635,634 5,068,021 12,190,672 0 0 348,688 28,253 -4,445,551 -25 1994 14,237,829 14,112,286 35,970 89,573 20,321,930 5,824,210 14,064,439 0 0 378,263 55,018 -6,084,101 -30 1995 9,232,039 9,050,723 4,534 176,782 15,877,717 1,308,173 13,954,267 0 0 247,958 367,319 -6,645,678 -42 1996 8,692,318 8,463,670 0 228,649 14,981,002 0 13,980,502 0 0 200,947 799,553 -6,288,684 -42 1997 9,825,788 9,783,592 0 42,196 16,718,266 0 15,457,435 0 0 195,493 1,065,338 -6,892,478 -41 1998 (1) 12,146,498 12,135,826 0 10,671 19,481,262 0 18,024,803 0 0 192,278 1,264,180 -7,334,764 -38
Source: See Table 15-6.(1) See (4) of Table 15-6.
15-8. Receipts and Expenditures of Government Employee InsuranceUnit: NT$1,000
Period
Receipts Expenditures Surplus or Deficit
329

Illness & FuneralInjury Grant
1960 1,951,389 64,436 1,886,953 3,088 69 0 475 2,544 1965 2,108,600 59,407 2,049,193 5,174 215 1,032 604 3,323 1970 2,692,028 91,225 2,600,803 8,645 362 2,624 791 4,868 1972 3,211,275 96,335 3,114,940 11,661 497 5,248 860 5,056 1973 3,204,162 97,302 3,106,860 14,063 423 7,362 891 5,387 1975 2,968,790 98,463 2,870,327 10,942 347 3,703 898 5,994 1977 3,163,905 107,908 3,055,997 12,598 368 4,467 1,002 6,761 1978 3,192,962 117,555 3,075,407 13,545 335 5,243 1,070 6,897 1979 3,256,056 117,177 3,138,879 14,273 408 5,709 1,005 7,151 1980 3,359,820 118,443 3,241,377 15,160 372 6,012 1,064 7,712 1981 3,585,908 129,908 3,456,000 16,897 388 7,633 1,070 7,806 1982 3,690,496 169,338 3,521,158 17,824 455 8,008 1,025 8,336 1983 3,941,279 163,038 3,778,241 17,670 492 7,465 1,022 8,691 1984 4,115,385 166,955 3,948,430 17,716 529 7,206 1,029 8,952 1985 4,323,954 167,861 4,156,093 18,390 549 7,657 1,032 9,152 1986 4,438,739 165,217 4,273,522 19,337 556 8,218 994 9,569 1987 4,678,226 169,034 4,509,192 20,292 653 8,888 1,050 9,701 1988 4,784,723 185,468 4,599,255 22,252 684 10,023 1,029 10,516 1989 4,698,494 179,193 4,519,301 23,692 616 11,080 1,010 10,986 1990 5,157,462 190,604 4,966,858 23,653 717 10,569 979 11,388 1991 5,683,017 200,752 5,482,265 27,198 771 13,532 966 11,929 1992 6,565,333 213,789 6,351,544 23,663 806 9,645 902 12,310 1993 7,052,061 222,409 6,829,652 24,765 854 10,371 849 12,691 1994 7,950,473 227,901 7,722,572 26,310 883 11,305 810 13,312 1995 (1) 1,657,583 33,863 1,623,720 26,268 857 10,545 831 14,035 1996 0 0 0 25,969 798 9,852 858 14,461 1997 0 0 0 26,606 975 10,452 825 14,354 1998 (2) 0 0 0 27,959 1,148 11,677 791 14,343
Source: See Table 15-6.
Death
I. Person-Visits (Free Medical Care), Cases (Cash Benefits)
(1) (2) See (3) (4) of Table 15-6.
15-9a. Medical Care and Cash Benefits under Government Employee Insurance
PeriodFree Medical Care Cash Benefits
Total Maternity Total Disability Old Age
330

Illness & FuneralInjury Grant
1960 127,272 113,478 12,095 101,384 13,794 854 0 8,890 4,051 1965 175,663 138,753 13,151 125,602 36,910 2,373 7,353 18,413 8,770 1970 396,563 241,746 21,397 220,350 154,817 9,669 68,350 49,952 26,847 1972 626,491 305,176 25,905 279,271 321,315 14,354 215,692 59,743 31,526 1973 754,405 313,091 26,419 286,672 441,314 12,078 331,337 62,861 35,038 1975 856,533 451,203 44,009 407,194 405,330 13,344 251,763 91,252 48,972 1977 1,192,121 551,948 56,811 495,137 640,173 15,017 445,088 115,432 64,636 1978 1,567,724 639,808 71,904 567,904 927,916 17,629 681,308 149,705 79,274 1979 2,094,730 768,214 89,274 678,940 1,326,516 26,133 1,027,938 172,597 99,848 1980 2,690,539 1,002,394 127,148 875,246 1,688,145 27,927 1,308,786 221,160 130,272 1981 3,900,966 1,371,576 175,816 1,195,760 2,529,390 38,066 2,021,376 297,375 172,573 1982 4,480,050 1,565,612 216,385 1,349,227 2,914,438 50,656 2,370,412 296,183 197,187 1983 4,590,439 1,841,569 257,200 1,584,369 2,748,870 45,787 2,195,797 299,865 207,421 1984 5,103,044 2,213,083 287,704 1,925,379 2,889,961 52,648 2,291,421 318,849 227,043 1985 6,123,520 2,541,691 308,438 2,233,253 3,581,829 61,869 2,891,549 361,678 266,732 1986 6,867,560 2,681,821 293,064 2,388,757 4,185,739 71,061 3,422,652 378,467 313,559 1987 7,875,935 2,921,858 319,103 2,602,755 4,954,077 79,929 4,111,286 425,157 337,705 1988 9,342,363 3,040,493 333,800 2,706,693 6,301,870 89,468 5,297,750 499,784 414,868 1989 11,127,247 3,114,116 346,425 2,767,691 8,013,131 98,905 6,873,145 545,032 496,049 1990 12,737,218 3,582,106 401,728 3,180,378 9,155,112 120,484 7,826,989 601,747 605,892 1991 16,309,995 4,125,732 409,913 3,715,820 12,184,263 130,908 10,672,510 659,707 721,138 1992 15,149,819 4,639,799 439,305 4,200,494 10,510,020 149,644 8,892,173 655,082 813,121 1993 17,258,693 5,068,021 452,510 4,615,512 12,190,672 173,595 10,438,797 666,201 912,078 1994 19,888,649 5,824,210 530,923 5,293,286 14,064,439 197,884 12,157,715 688,429 1,020,411 1995(1) 15,262,440 1,308,173 109,169 1,199,004 13,954,267 215,155 11,913,069 693,489 1,132,554 1996 13,980,502 0 0 0 13,980,502 235,444 11,745,899 771,480 1,227,679 1997 15,457,435 0 0 0 15,457,435 376,979 13,041,188 766,748 1,272,519 1998(2) 18,024,803 0 0 0 18,024,803 449,829 15,487,795 770,495 1,316,684
Old Age Death
II. Amount (NT$1,000)
15-9b. Medical Care and Cash Benefits under Government Employee Insurance (Continued)
Period TotalMedical Expenses Cash Benefits
Subtotal Maternity Subtotal Disability
331

Unit: NT$1,000
Registration Medical Cash Costs ofFees Expenses Benefits Administration
1960 86,850 3,653 113,478 13,794 6,079 - 52,379 1965 173,745 4,376 138,760 36,915 11,914 - 19,404 1970 432,800 5,592 253,639 167,612 25,033 0 1975 813,077 25,582 488,435 425,981 51,462 - 95,500 1978 1,487,661 28,285 696,428 954,041 69,146 - 177,129 1979 1,837,116 28,827 836,314 1,353,821 85,981 - 381,323 1980 2,424,358 29,686 1,098,372 1,723,425 104,479 - 447,105 1981 3,546,205 32,701 1,534,639 2,584,016 128,142 - 652,980 1982 4,149,805 66,972 1,945,896 2,977,760 145,866 - 854,630 1983 4,536,664 88,477 2,536,131 2,822,484 150,458 - 862,219 1984 4,927,788 91,707 3,098,544 2,974,101 165,897 -1,190,991 1985 6,120,743 103,611 3,882,157 3,660,676 200,869 -1,497,943 1986 7,378,707 83,748 4,844,414 4,246,362 229,966 -1,772,085 1987 8,359,078 48,496 5,669,510 5,020,088 258,059 -2,542,133 1988 9,713,012 49,502 6,057,413 6,379,610 284,894 -2,961,674 1989 12,513,207 53,320 7,748,563 8,102,513 373,264 -3,659,539 1990 16,111,894 62,484 10,152,558 9,269,380 479,494 -3,677,168 1991 18,612,093 66,599 12,216,248 12,310,552 514,075 -6,249,200 1992 22,830,086 74,040 15,459,397 10,663,075 616,383 -3,786,653 1993 27,872,479 110,163 18,866,451 12,411,089 747,951 -3,852,698 1994 30,326,688 109,316 22,162,485 14,323,023 812,713 -6,712,546 1995 (2) 12,376,050 15,143 4,825,669 14,288,197 356,732 -7,239,481 1996 9,176,207 0 0 14,303,281 217,995 -5,807,240 1997 10,545,706 0 0 15,827,933 211,012 -6,404,273 1998 (3) 12,945,332 0 0 18,459,826 205,075 -6,827,499
(2) (3) See (3) (4) of Table 15-6.Source: See Table 15-6.
15-10. Major Receipts and Expenditures of Government Employee Insurance and Related Insurance Programs
PeriodMajor Receipts (1) Major Expenditures (1)
Surplusor DeficitPremiums
of Private Schools (from 1986), and Health Insurance for Retired Employees and their Dependents of Government Organizations and Private Schools (from 1994).
(1) Including the data of Government Employee Insurance (from 1958), Health Insurance for Government Employees' Dependents (from 1982), Retired Government Employee Insurance (from 1965), Health Insurance for Retired Government Employees (from 1985), Health Insurance for Spouses of Retired Government Employees (from 1985), Insurance for Teaching and Administrative Staff of Private Schools (from 1980), Insurance for Retired Teaching and Administrative Staff of Private Schools (1984~1985), Health Insurance for Spouses of Teaching and Administrative Staff of Private Schools (from 1990), Health Insurance for Retired Teaching and Administrative Staff of Private Schools (from 1986), Health Insurance for Spouses of Retired Teaching and Administrative Staff
332

Government Employee and School Staff Insurance(GESSI)
Retired Government Employee Insurance(RGEI)
1999 (1) 7,385 553 2000 7,436 517 2005 7,324 371 2010 7,392 231 2011 7,531 210 2012 7,515 188 2013 7,491 173 2014 7,447 115 2015 7,448 103 2016 7,438 83 2017 7,422 76 2018 7,396 65
Government Employee and School Staff Insurance(GESSI)
Retired Government Employee Insurance(RGEI)
1999 (1) 623,016 1,100 2000 629,395 985 2005 591,158 634 2010 597,583 372 2011 593,949 334 2012 593,846 303 2013 593,760 258 2014 587,459 150 2015 582,725 125 2016 578,624 100 2017 584,469 89 2018 589,483 78
(1) See (4) of Table 15-6.Source: Department of Government Employees Insurance, Bank of Taiwan.
15-11. Units and Persons Insured under Government Employee and School Staff Insurance and Retired Government Employee Insurance
End of YearInsured Units
End of YearInsured Persons
333

Total Premium Service FeeIncome
InvestmentIncome
Gain onValuation of
FinancialInstrument
(2)
Gain on F/Aat FV throughProfit or Loss
(3)
Gain onF/Liab at FV
through Profitor Loss
(3)
ForeignExchange
Gain (2)
ExpectedCredit
ImpairmentGain(4)
1999 8,101,572 8,000,506 - 19,238 - - - - -2000 14,560,695 13,931,071 - 11,376 - - - - -2005 19,890,068 16,744,093 - 1,647,474 258,368 - - - -2006 23,006,951 16,468,839 - 2,410,289 1,898,707 - - 35,915 -2007 25,756,000 16,677,444 - 5,589,677 750,155 - - 248,599 -2008 23,727,238 16,926,336 - 3,575,844 657,375 - - - -2009 41,912,750 17,165,917 32,031 3,777,542 19,328,073 - - 172,682 -2010 27,767,933 17,417,350 152,375 5,345,784 3,451,922 - - - -2011 25,151,297 17,694,632 135,279 4,438,628 158,389 - - 838,664 -2012 31,552,391 17,991,298 108,895 4,103,147 7,316,963 - - - -2013 36,151,850 20,862,453 44,415 - - 12,588,812 - 781,786 -2014 36,864,274 20,948,418 4,140 - - 11,428,200 - 2,601,422 -2015 29,750,594 20,917,837 8,039 - - 7,972,486 - 852,232 -2016 38,271,018 22,778,804 16,057 - - 15,476,157 - - -2017 49,482,059 23,477,880 4,667 - - 25,999,512 - - -2018 37,482,014 24,863,074 11,342 - - 8,565,142 - 1,827,970 10,768
(3) Since 2013 began to adopt International Financial Reporting Standards (IFRSs).(4) Since 2018 began to adopt the IFRS 9.Source: See Table 15-11.
(2) In conformity with Statements of Financial Accounting Standards (SFAS) No. 34, which came into effect on January 1, 2006, and overseas investment newly added to this insurance reserve, "Gain on Valuation of Financial Instrument", "Loss on Valuation of Financial Instrument", "Foreign Exchange Gain" and "Foreign Exchange Loss" are disclosed; and in accordance therewith, the 2000-2005 items "Gain on Market Price Recovery of Short-Term Investments" and "Unrealized Decline in Market Value of Short-Term Investments" are reclassified as "Gain on Valuation of Financial Instrument" and "Loss on Valuation of Financial Instrument", respectively.
15-12a. Receipts and Expenditures of Government Employee and School Staff Insurance (1) Unit NT$1,000
Period
Receipts
(1) See (4) of Table 15-6.
334

InterestIncome
Other Income(5)
Total CashBenefits
Reserve forOld AgeBenefit
(6)
InvestmentLoss
Loss onValuation of
FinancialInstrument (2)
Service FeeExpenses
Reserve
1999 81,754 73 2,585,160 1,373,280 1,192,075 8,577 10,998 - -2000 617,855 394 4,927,829 2,796,558 2,075,730 5,171 48,196 - -2005 1,236,106 4,028 4,702,423 4,103,122 - 591,598 - - -2006 2,019,300 173,901 4,875,214 3,989,540 - 873,591 - - -2007 2,489,239 887 5,416,611 4,350,526 - 818,428 209,251 - -2008 2,567,427 256 28,709,542 5,020,950 - 2,079,256 21,225,238 - -2009 1,436,503 2 7,661,784 5,859,649 - 1,247,558 512,131 - -2010 1,398,902 1,599 13,629,203 7,594,759 - 1,775,454 8,199 - -2011 1,885,691 14 21,624,667 8,965,770 - 798,423 11,820,061 - -2012 2,032,087 2 14,917,562 10,440,428 - 2,780,477 2,901 - -2013 1,873,818 566 14,231,379 11,283,025 - - - 21,701 5112014 1,882,093 1 12,989,042 11,925,877 - - - 28,247 -2015 1,890,091 219 26,113,535 16,243,256 - - - 14,719 -2016 1,916,260 1 21,345,215 16,551,336 - - - 24,723 -2017 1,946,753 1 21,215,919 14,853,512 - - - 20,078 -2018 2,203,716 1 36,112,312 14,651,557 - - - 13,284 -
(6) Including unrealized liability of cash benefit before amendment and interest expenses. Article 5 of the GESSI Act, as amended on January 19, 2005, stipulates that all the surplus should be transferred to insurance reserve, so with effect from 2005, monthly provision is no longer made on the basis of insurance premium revenue and reference contribution rate.
15-12b. Receipts and Expenditures of Government Employee and School Staff Insurance (Continued) Unit NT$1,000
Period
Receipts Expenditure
(5) "Other Income" in 2006 includes $173,421,000 for "Cumulative Effect of Changes in Accounting Principles" arising due to the starting application of SFAS No. 34.
335

OtherExpenses
Loss on F/Aat FV throughProfit or Loss
(3)
Loss onF/Liab at FV
through Profitor Loss
(3)
ForeignExchange
Loss (2)
ExpectedCredit
ImpairmentLoss(4)
Total Adminis-trative
Expense(8)
Compensatedby the
Treasury(6)
1999 - - - - - 3,064,566 - - 12,453,833
2000 - - - - - 9,632,867 - - 21,311,832
2005 7,704 - - - - 15,187,645 35,969,899 254,725 35,715,175
2006 12,083 - - - - 18,131,737 21,036,690 250,830 20,785,859
2007 38,406 - - - - 20,339,389 18,177,239 237,320 17,939,919
2008 35,620 - - 348,478 - -4,982,304 16,140,948 212,863 15,928,085
2009 42,447 - - - - 34,250,967 15,002,516 216,824 14,785,692
2010 42,836 - - 4,207,956 - 14,138,729 17,873,989 217,070 17,656,919
2011 40,412 - - - - 3,526,630 18,625,879 221,200 18,404,678
2012 42,227 - - 1,651,528 - 16,634,829 18,531,190 219,715 18,311,476
2013 19,911 2,846,662 17,813 41,756 - 21,920,471 15,705,408 222,799 15,482,609
2014 23,992 977,928 23,827 9,171 - 23,875,232 12,961,380 228,068 12,733,312
2015 25,173 9,820,855 9,532 - - 5,527,369 16,975,993 224,628 16,751,365
2016 18,630 1,885,397 - 2,865,129 - 18,842,064 13,754,978 224,247 13,530,731
2017 21,721 1,085,529 - 5,235,079 - 30,212,894 10,453,135 225,730 10,227,405
2018 34,082 21,397,595 - - 15,792 1,369,702 8,894,526 228,117 8,666,409(7) Surpluses are transferred to reserve.(8) "Administrative Expense" was paid by the Central Supervisory institution - Ministry of Civil Service by means of budget. All unfunded expense was absorbed by our bank that assumes the role of insurance agency and implementing government policy.
15-12c. Receipts and Expenditures of Government Employee and School Staff Insurance (Continued) Unit NT$1,000
PeriodSurplus or
Deficit(7)
Government Subsidies
336
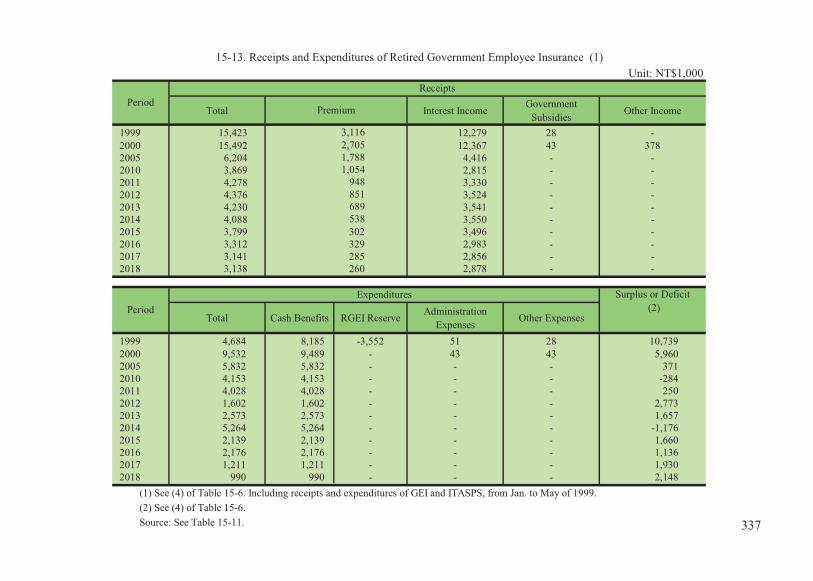
Unit: NT$1,000
Total Interest Income GovernmentSubsidies Other Income
1999 15,423 12,279 28 - 2000 15,492 12,367 43 378 2005 6,204 4,416 - - 2010 3,869 2,815 - - 2011 4,278 3,330 - - 2012 4,376 3,524 - - 2013 4,230 3,541 - - 2014 4,088 3,550 - - 2015 3,799 302 3,496 - - 2016 3,312 329 2,983 - - 2017 3,141 285 2,856 - - 2018 3,138 260 2,878 - -
Total Cash Benefits RGEI Reserve AdministrationExpenses Other Expenses
1999 4,684 8,185 -3,552 51 28 10,739 2000 9,532 9,489 - 43 43 5,960 2005 5,832 5,832 - - - 371 2010 4,153 4,153 - - - -284 2011 4,028 4,028 - - - 250 2012 1,602 1,602 - - - 2,773 2013 2,573 2,573 - - - 1,657 2014 5,264 5,264 - - - -1,176 2015 2,139 2,139 - - - 1,660 2016 2,176 2,176 - - - 1,136 2017 1,211 1,211 - - - 1,930 2018 990 990 - - - 2,148
(1) See (4) of Table 15-6. Including receipts and expenditures of GEI and ITASPS, from Jan. to May of 1999.(2) See (4) of Table 15-6. Source: See Table 15-11.
15-13. Receipts and Expenditures of Retired Government Employee Insurance (1)
PeriodReceipts
Premium
3,116 2,705 1,788
PeriodExpenditures Surplus or Deficit
(2)
1,054 948 851 689 538
337

Dependent's Dependent's
Funeral Total Old Age Death Funeral
Allowance Allowance
1999 29,956 741 13,364 732 15,119 - - 20,242,547 300,289 17,788,038 723,979 1,430,241 - -
2000 32,172 1,480 14,365 716 15,611 - - 22,102,778 519,769 19,355,494 742,477 1,485,038 - -
2001 37,594 1,078 21,180 614 14,722 - - 30,466,793 399,394 27,961,491 663,453 1,442,455 - -
2002 38,582 1,076 21,079 670 15,757 - - 31,771,108 370,808 29,105,762 733,109 1,561,428 - -
2003 36,424 1,007 19,999 588 14,830 - - 29,750,090 341,887 27,266,218 657,551 1,484,434 - -
2004 37,718 1,067 20,837 591 15,223 - - 32,041,385 331,359 29,538,911 641,975 1,529,140 - -
2005 43,425 1,081 26,924 574 14,846 - - 38,811,295 355,489 36,274,085 635,418 1,546,303 - -
2006 30,486 1,038 14,929 589 13,930 - - 23,513,155 355,851 21,009,265 680,588 1,467,450 - -
2007 29,146 1,056 13,520 542 14,028 - - 21,374,009 347,635 18,921,039 618,806 1,486,529 - -
2008 28,723 1,041 12,852 556 14,274 - - 20,303,193 340,748 17,785,186 638,654 1,538,605 - -
2009 31,919 1,030 12,897 531 14,751 2,710 - 20,370,541 345,954 17,602,882 635,639 1,601,003 185,063 -
2010 36,286 1,029 16,333 537 14,768 3,619 - 24,967,855 355,476 22,016,132 639,026 1,624,451 332,772 -
2011 37,873 946 17,365 530 15,233 3,799 - 26,948,055 337,497 23,927,578 643,314 1,706,088 333,578 -
2012 38,838 951 17,989 499 15,112 4,287 - 28,243,546 361,344 25,142,386 621,749 1,739,988 378,080 -
2013 37,991 885 16,896 511 15,117 4,582 - 26,404,134 320,252 23,276,649 643,599 1,755,975 407,659 -
2014 44,908 866 18,029 541 15,731 5,175 4,566 24,422,758 327,761 20,865,515 681,202 1,834,970 444,792 268,518
2015 55,559 787 22,954 487 15,182 5,929 10,220 32,782,800 302,713 28,976,625 619,539 1,775,481 497,877 610,565
2016 53,365 828 20,356 509 15,624 6,036 10,012 29,850,547 324,413 25,909,044 649,935 1,838,895 520,070 608,190
2017 48,897 830 16,788 492 15,155 6,151 9,481 24,900,744 313,684 21,045,386 631,179 1,796,786 534,112 579,597
2018 46,039 751 14,638 502 15,335 6,055 8,758 23,211,334 294,712 19,317,585 661,150 1,861,460 532,565 543,862
(1) See (4) of Table 15-6.
Source: See Table 15-11. (2)Parental leave allowance shall be paid each month from the day of oarental leave, with a maximum of 6 installments.
15-14. Cash Benefits under Government Employee and School Staff Insurance (1)
Period
Cases Amount (NT$1,000)
DisabilityParental Leave
Allowance Maternity DisabilityParental Leave
Allow-ance(2)
MaternityTotal Old Age Death
338

Dependent's Dependent's
Total Disability Old Age Death Funeral Total Disability Old Age Death Funeral
Allowance Allowance
1999 (1) 108 4 30 71 3 8,185 334 2,368 5,437 47
2000 106 6 15 81 4 9,489 479 1,430 7,542 38
2004 59 3 6 48 2 4,559 231 418 3,883 27
2005 60 3 1 55 1 5,832 119 41 5,670 2
2006 65 4 5 53 3 6,056 126 648 5,242 40
2007 53 - 5 43 5 4,379 - 618 3,706 55
2008 44 1 1 41 1 4,543 57 12 4,466 8
2009 40 - 2 38 - 4,043 - 36 4,007 -
2010 39 - 1 38 - 4,153 - 135 4,018 -
2011 38 1 1 35 1 4,028 147 88 3,787 6
2012 24 1 - 22 1 1,602 21 - 1,575 7
2013 33 - - 30 3 2,573 - - 2,543 30
2014 72 3 44 23 2 5,264 177 3,223 1,849 15
2015 29 3 7 18 1 2,139 78 335 1,714 12
2016 22 - 2 20 - 2,176 - 129 2,047 -
2017 13 - 1 12 - 1,211 - 57 1,154 -
2018 11 - - 10 1 990 - - 984 6
(1) See (4) of Table 15-6.Source: See Table 15-11.
15-15. Cash Benefits under Retired Government Employee Insurance
Period
Cases Amount (NT$1,000)
339
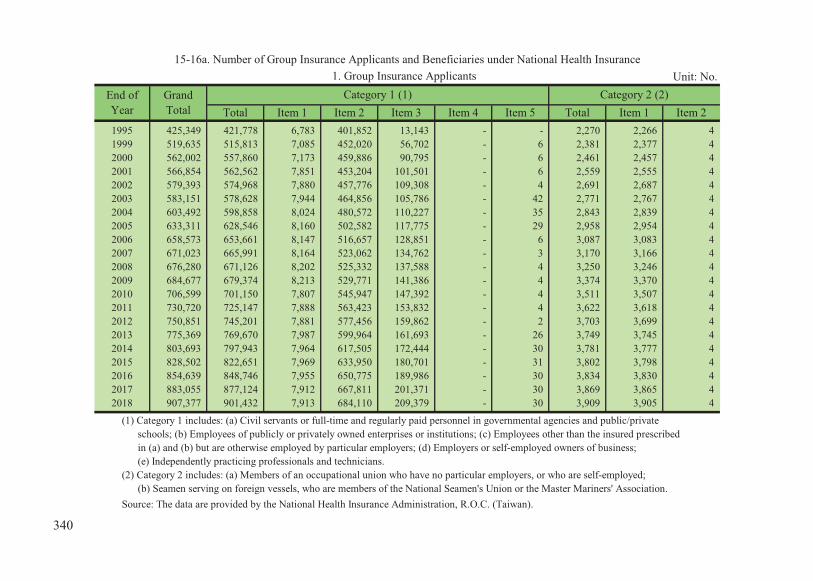
Unit: No.
1995 425,349 421,778 6,783 401,852 13,143 - - 2,270 2,266 4 1999 519,635 515,813 7,085 452,020 56,702 - 6 2,381 2,377 4 2000 562,002 557,860 7,173 459,886 90,795 - 6 2,461 2,457 4 2001 566,854 562,562 7,851 453,204 101,501 - 6 2,559 2,555 4 2002 579,393 574,968 7,880 457,776 109,308 - 4 2,691 2,687 4 2003 583,151 578,628 7,944 464,856 105,786 - 42 2,771 2,767 4 2004 603,492 598,858 8,024 480,572 110,227 - 35 2,843 2,839 4 2005 633,311 628,546 8,160 502,582 117,775 - 29 2,958 2,954 4 2006 658,573 653,661 8,147 516,657 128,851 - 6 3,087 3,083 4 2007 671,023 665,991 8,164 523,062 134,762 - 3 3,170 3,166 4 2008 676,280 671,126 8,202 525,332 137,588 - 4 3,250 3,246 4 2009 684,677 679,374 8,213 529,771 141,386 - 4 3,374 3,370 4 2010 706,599 701,150 7,807 545,947 147,392 - 4 3,511 3,507 4 2011 730,720 725,147 7,888 563,423 153,832 - 4 3,622 3,618 4 2012 750,851 745,201 7,881 577,456 159,862 - 2 3,703 3,699 4 2013 775,369 769,670 7,987 599,964 161,693 - 26 3,749 3,745 4 2014 803,693 797,943 7,964 617,505 172,444 - 30 3,781 3,777 4 2015 828,502 822,651 7,969 633,950 180,701 - 31 3,802 3,798 4 2016 854,639 848,746 7,955 650,775 189,986 - 30 3,834 3,830 4 2017 883,055 877,124 7,912 667,811 201,371 - 30 3,869 3,865 4 2018 907,377 901,432 7,913 684,110 209,379 - 30 3,909 3,905 4
Source: The data are provided by the National Health Insurance Administration, R.O.C. (Taiwan).
15-16a. Number of Group Insurance Applicants and Beneficiaries under National Health Insurance 1. Group Insurance Applicants
End ofYear
GrandTotal
Category 1 (1) Category 2 (2)Total Item 1 Item 2 Item 3
(2) Category 2 includes: (a) Members of an occupational union who have no particular employers, or who are self-employed; (b) Seamen serving on foreign vessels, who are members of the National Seamen's Union or the Master Mariners' Association.
Item 4 Item 5 Total Item 1 Item 2
(1) Category 1 includes: (a) Civil servants or full-time and regularly paid personnel in governmental agencies and public/private schools; (b) Employees of publicly or privately owned enterprises or institutions; (c) Employees other than the insured prescribed in (a) and (b) but are otherwise employed by particular employers; (d) Employers or self-employed owners of business; (e) Independently practicing professionals and technicians.
340

Unit: No.
1995 344 305 39 1 … … - 458 498 18 480 1999 346 306 40 2 … … - 526 567 12 555 2000 346 306 40 2 … … - 537 796 12 784 2001 346 306 40 3 … … - 559 825 12 813 2002 346 306 40 8 … … - 571 809 12 797 2003 345 306 39 8 … … - 575 824 28 796 2004 346 307 39 8 … … - 574 863 28 835 2005 346 307 39 8 … … - 577 876 28 848 2006 346 307 39 8 … … - 585 886 28 858 2007 345 306 39 8 7 1 - 588 921 28 893 2008 345 306 39 9 7 2 - 599 951 28 923 2009 345 306 39 9 7 2 - 619 956 25 931 2010 345 306 39 9 7 2 - 620 964 25 939 2011 345 306 39 9 7 2 - 613 984 25 959 2012 345 306 39 9 7 2 - 604 989 24 965 2013 345 306 39 14 9 2 3 585 1,006 24 982 2014 345 306 39 13 9 2 2 578 1,033 22 1,011 2015 345 306 39 13 9 2 2 563 1,128 21 1,107 2016 345 306 39 13 9 2 2 559 1,142 21 1,121 2017 344 305 39 13 9 2 2 552 1,153 21 1,132 2018 344 305 39 13 9 2 2 550 1,129 20 1,109
15-16b. Number of Group Insurance Applicants and Beneficiaries under National Health Insurance (Continued) 1. Group Insurance Applicants
End of YearCategory 3 (3) Category 4 (4) Category 5
(5)Category 6 (6)
Total Item 1 Item 2 Item 2
(3) Category 3 includes: (a) Members of the Farmers' Association or the Irrigation Association, or workers aged over fifteen who are actually engaged in agricultural activities; (b) Class A members of the Fishers Association who are either self-employed or have no particular employers, or workers aged over fifteen who are actually engaged in fishery activities.(4) Category 4 includes: (a) Military servicemen whose compulsory service terms are over two months or who are summoned to serve in military for more than two months, military school students who receive grants from the government, military servicemen's dependents who lost their support recognized by the Ministry of Defense, and military decedent's families who are receiving pensions due to the death of their decedents. (b) Men at age for enlisting in the military, who are currently in military-substitute service. (c) Those who are serving sentences in correctional institutions or receiving punishments from police and military court-martial. However, this is not applicable to those who are serving sentences of less than two months or are under parole.(5) Category 5 includes: Members of a household of low-income families as defined by the Social Support Law.(6) Category 6 includes: (a) Veterans, household representatives of survivors of veterans; (b) Representatives or heads of household other than the insured or their dependents prescribed in Categories 1 to 5 and Category 6 (a).
Total Item 1 Item 2 Item 3 Total Item 1
341

1995 19,123,278 10,437,339 1,200,289 8,507,771 428,809 300,470 - 4,029,716 4,029,494 222 1999 21,089,859 11,236,257 1,246,959 9,080,776 493,914 414,514 94 3,799,093 3,798,648 445 2000 21,400,826 11,465,521 1,257,699 9,251,834 530,161 425,752 75 3,750,883 3,750,167 716 2001 21,653,555 11,447,046 1,444,154 8,988,288 592,511 422,023 70 3,772,174 3,771,589 585 2002 21,869,478 11,458,910 1,428,926 9,013,020 591,451 425,455 58 3,768,633 3,768,069 564 2003 21,984,415 11,630,008 1,419,131 9,126,776 653,875 430,130 96 3,711,081 3,710,624 457 2004 22,134,270 11,780,375 1,393,464 9,312,608 628,849 445,380 74 3,683,993 3,683,635 358 2005 22,314,647 11,798,491 1,356,920 9,366,651 603,585 471,267 68 3,742,726 3,742,359 367 2006 22,484,427 11,919,580 1,338,581 9,475,398 617,029 488,529 43 3,748,498 3,748,050 448 2007 22,803,048 11,993,100 1,325,111 9,558,662 618,082 491,233 12 3,775,260 3,774,828 432 2008 22,918,144 11,929,887 1,317,844 9,465,832 653,973 457,179 35,059 3,875,407 3,874,974 433 2009 23,025,773 11,954,639 1,312,564 9,453,490 698,300 454,119 36,166 3,999,953 3,999,635 318 2010 23,074,487 12,240,752 1,288,599 9,765,947 688,096 460,985 37,125 3,976,004 3,975,664 340 2011 23,198,664 12,470,563 1,261,213 10,005,821 692,999 471,960 38,570 3,962,392 3,962,004 388 2012 23,280,949 12,649,300 1,237,424 10,192,237 697,292 477,714 44,633 3,868,431 3,867,946 485 2013 23,462,863 12,911,504 1,226,872 10,432,857 706,468 492,367 52,940 3,785,722 3,785,193 529 2014 23,621,599 13,178,029 1,219,371 10,676,661 720,749 506,141 55,107 3,772,173 3,771,461 712 2015 23,737,221 13,399,350 1,219,902 10,866,404 737,472 519,397 56,175 3,759,457 3,758,510 947 2016 23,814,584 13,603,148 1,220,151 11,039,871 751,460 534,494 57,172 3,722,199 3,721,300 899 2017 23,880,332 13,830,699 1,220,741 11,228,726 773,735 549,401 58,096 3,668,824 3,668,074 750 2018 23,948,108 14,026,878 1,220,759 11,387,792 795,718 563,480 59,129 3,621,883 3,621,211 672
15-16c. Number of Group Insurance Applicants and Beneficiaries under National Health Insurance (Continued)2. Beneficiaries Unit: Persons
End ofYear Grand Total
Category 1 Category 2
Total Item 1 Item 2 Item 3 Item 4 Item 5 Total Item 1 Item 2
342

1995 2,998,439 2,652,042 346,397 69,059 … … - 111,452 1,477,273 593,614 883,659 1999 3,297,840 2,827,356 470,484 69,259 … … - 129,890 2,557,520 646,145 1,911,375 2000 3,304,109 2,805,501 498,608 68,579 … … - 146,335 2,665,399 645,595 2,019,804 2001 3,327,657 2,797,024 530,633 … … … - 152,882 2,953,796 644,785 2,309,011 2002 3,328,171 2,765,028 563,143 … … … - 167,637 3,146,127 643,902 2,502,225 2003 3,276,065 2,700,854 575,211 … … … - 186,033 3,181,228 638,327 2,542,901 2004 3,209,126 2,629,808 579,318 … … … - 204,218 3,256,558 630,103 2,626,455 2005 3,141,774 2,561,611 580,163 … … … - 211,614 3,420,042 628,487 2,791,555 2006 3,087,747 2,503,637 584,110 … … … - 218,559 3,510,043 616,762 2,893,281 2007 3,036,617 2,450,452 586,165 173,413 155,295 18,118 - 221,916 3,602,742 607,446 2,995,296 2008 2,993,633 2,407,432 586,201 161,766 141,480 20,286 - 225,609 3,731,842 597,133 3,134,709 2009 2,924,081 2,330,033 594,048 160,189 136,970 23,219 - 254,677 3,732,234 585,847 3,146,387 2010 2,828,337 2,247,513 580,824 157,576 136,960 20,616 - 271,211 3,600,607 572,508 3,028,099 2011 2,750,311 2,176,681 573,630 160,591 138,944 21,647 - 310,273 3,544,534 558,935 2,985,599 2012 2,690,876 2,126,520 564,356 151,910 130,931 20,979 - 347,607 3,572,825 552,929 3,019,896 2013 2,631,177 2,069,407 561,770 186,671 91,753 34,043 60,875 352,700 3,595,089 547,814 3,047,275 2014 2,539,882 1,979,066 560,816 185,047 91,292 34,121 59,634 349,088 3,597,380 536,426 3,060,954 2015 2,441,512 1,882,636 558,876 181,914 96,467 26,676 58,771 334,119 3,620,869 526,837 3,094,032 2016 2,367,177 1,812,924 554,253 164,821 74,358 32,697 57,766 322,950 3,634,289 515,571 3,118,718 2017 2,281,407 1,733,185 548,222 142,877 59,796 25,085 57,996 308,207 3,648,318 502,643 3,145,675 2018 2,208,084 1,669,997 538,087 118,431 45,455 13,809 59,167 302,932 3,669,900 487,516 3,182,384
15-16d. Number of Group Insurance Applicants and Beneficiaries under National Health Insurance (Continued)2. Beneficiaries Unit: Persons
End ofYear
Category 3 Category 4 (1)Category 5
Category 6
Total Item 1 Item 1 Item 2
(1) The number of beneficiaries of Category 4 is not listed during 2001~2006.
Item 2 Total Item 1 Item 2 Item 3 Total
343

Unit: NT$
Total Item 1 Item 2 Item 3 Item 4 Item 5 Total Item 1 Item 2
1995 23,351 24,959 21,875 26,861 45,669 - 17,571 17,569 36,893 1999 28,026 28,916 26,732 28,411 44,852 43,231 19,721 19,718 42,669 2000 28,876 29,180 27,885 26,967 44,241 34,950 19,940 19,933 42,612 2001 29,575 29,218 28,691 27,252 44,742 34,393 20,260 20,255 42,795 2002 32,662 46,034 30,317 27,790 44,729 33,950 20,687 20,681 45,568 2003 32,881 46,557 30,646 27,160 45,061 31,100 20,917 20,913 44,954 2004 33,172 46,929 31,031 27,534 44,714 30,550 21,271 21,268 46,466 2005 34,841 51,447 32,515 28,676 44,575 30,939 21,763 21,759 49,940 2006 35,423 51,612 33,210 28,576 45,333 36,000 22,494 22,489 50,841 2007 36,507 53,902 34,113 29,318 47,291 46,525 24,203 24,198 51,037 2008 36,904 53,949 34,581 28,984 46,223 64,658 24,472 24,467 51,127 2009 37,005 55,193 34,470 29,091 47,063 68,359 25,095 25,092 49,835 2010 37,596 55,684 35,211 29,210 47,417 70,404 25,813 25,810 47,826 2011 38,348 57,758 35,907 30,142 47,896 70,709 26,884 26,881 46,675 2012 39,090 58,619 36,715 30,915 48,361 67,376 26,776 26,772 45,420 2013 39,846 62,864 37,186 31,184 48,591 67,556 26,680 26,677 44,954 2014 40,291 63,408 37,736 31,198 48,990 66,902 27,327 27,324 41,529 2015 40,878 63,229 38,470 31,418 49,620 66,210 27,298 27,294 38,602 2016 41,406 63,872 39,032 31,568 50,292 65,638 27,173 27,167 43,759 2017 42,059 64,071 39,800 32,103 50,451 68,014 26,913 26,907 44,726 2018 43,118 66,125 40,820 33,260 50,546 72,008 27,634 27,629 45,674
Source: See Table 15-16a.
20,691
15-17a. Average Amount of Monthly Payroll on which National Health Insurance Premiums Are Assessed
End ofYear
Grand TotalCategory 1 Category 2
31,847
24,61925,24525,69327,67127,97428,32929,49730,06631,42731,672
36,38036,93338,079
32,54433,50534,08734,71535,40235,918
344
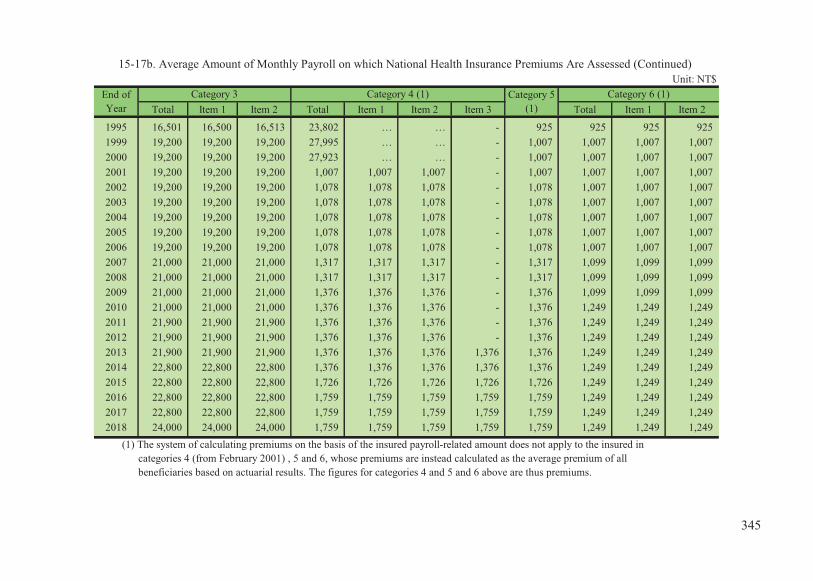
Unit: NT$
Total Item 1 Item 2 Total Item 1 Item 2 Item 3 Total Item 1 Item 2
1995 16,501 16,500 16,513 23,802 … … - 925 925 925 925 1999 19,200 19,200 19,200 27,995 … … - 1,007 1,007 1,007 1,007 2000 19,200 19,200 19,200 27,923 … … - 1,007 1,007 1,007 1,007 2001 19,200 19,200 19,200 1,007 1,007 1,007 - 1,007 1,007 1,007 1,007 2002 19,200 19,200 19,200 1,078 1,078 1,078 - 1,078 1,007 1,007 1,007 2003 19,200 19,200 19,200 1,078 1,078 1,078 - 1,078 1,007 1,007 1,007 2004 19,200 19,200 19,200 1,078 1,078 1,078 - 1,078 1,007 1,007 1,007 2005 19,200 19,200 19,200 1,078 1,078 1,078 - 1,078 1,007 1,007 1,007 2006 19,200 19,200 19,200 1,078 1,078 1,078 - 1,078 1,007 1,007 1,007 2007 21,000 21,000 21,000 1,317 1,317 1,317 - 1,317 1,099 1,099 1,099 2008 21,000 21,000 21,000 1,317 1,317 1,317 - 1,317 1,099 1,099 1,099 2009 21,000 21,000 21,000 1,376 1,376 1,376 - 1,376 1,099 1,099 1,099 2010 21,000 21,000 21,000 1,376 1,376 1,376 - 1,376 1,249 1,249 1,249 2011 21,900 21,900 21,900 1,376 1,376 1,376 - 1,376 1,249 1,249 1,249 2012 21,900 21,900 21,900 1,376 1,376 1,376 - 1,376 1,249 1,249 1,249 2013 21,900 21,900 21,900 1,376 1,376 1,376 1,376 1,376 1,249 1,249 1,249 2014 22,800 22,800 22,800 1,376 1,376 1,376 1,376 1,376 1,249 1,249 1,249 2015 22,800 22,800 22,800 1,726 1,726 1,726 1,726 1,726 1,249 1,249 1,249 2016 22,800 22,800 22,800 1,759 1,759 1,759 1,759 1,759 1,249 1,249 1,249 2017 22,800 22,800 22,800 1,759 1,759 1,759 1,759 1,759 1,249 1,249 1,249 2018 24,000 24,000 24,000 1,759 1,759 1,759 1,759 1,759 1,249 1,249 1,249
(1) The system of calculating premiums on the basis of the insured payroll-related amount does not apply to the insured in categories 4 (from February 2001) , 5 and 6, whose premiums are instead calculated as the average premium of all beneficiaries based on actuarial results. The figures for categories 4 and 5 and 6 above are thus premiums.
15-17b. Average Amount of Monthly Payroll on which National Health Insurance Premiums Are Assessed (Continued)
End ofYear
Category 3 Category 4 (1) Category 5(1)
Category 6 (1)
345

Unit: NT$ million
Total Premiums Other (1) Total MedicalBenefits Other (2)
1995 194,500 194,157 344 157,357 156,847 509 37,1441999 269,127 267,294 1,834 290,130 285,897 4,233 -21,0032000 291,404 290,734 670 290,439 282,105 8,334 9642001 291,510 290,870 640 307,152 301,788 5,364 -15,6422002 311,200 303,417 7,783 326,854 323,255 3,599 -15,6552003 338,778 327,774 11,004 339,160 335,792 3,368 -3832004 353,263 343,966 9,297 353,693 352,617 1,076 -4302005 366,058 356,100 9,958 372,393 367,397 4,996 -6,3352006 386,105 367,990 18,115 386,424 382,209 4,215 -3192007 391,860 370,628 21,231 405,627 401,149 4,478 -13,7672008 406,752 384,884 21,868 420,707 415,928 4,779 -13,9552009 407,468 385,847 21,621 439,166 434,786 4,380 -31,6982010 465,180 438,659 26,520 446,666 442,312 4,354 18,5142011 496,757 469,468 27,289 462,577 458,195 4,382 34,1802012 510,746 482,852 27,895 484,215 480,444 3,771 26,5312013 559,485 530,080 29,405 505,904 502,127 3,777 53,5812014 573,289 545,103 28,186 521,896 518,144 3,752 51,3942015 644,963 569,435 75,528 542,068 538,076 3,992 102,8952016 590,820 556,739 34,081 572,262 568,332 3,930 18,5572017 593,972 572,954 21,017 603,811 599,729 4,082 -9,8402018 611,322 593,194 18,127 636,312 631,635 4,677 -24,991
(1) Other insurance revenues include interest income, investment income and losses, and other extra income. (2) Other insurance costs include bad debt expenses, interest expenses, and other extra costs. Source: See Table 15-16a.
15-18. Revenues and Costs of National Health Insurance
PeriodInsurance Revenues (A) Insurance Costs (B) Net of Reserve
Fund(C=A-B)
346

16. NATIONAL WELL-BEING
INDICATORS


2012 2013 2014 2015 2016 2017 2018
Rooms per person rooms 1.60 1.60 1.70 1.70 - - -
Housing expenditure % 18.00 18.00 17.00 17.00 18.00 17.00 …
Dwelling without basic facilities % 0.00 0.00 0.00 0.00 0.00 0.00 0.00
2012 2013 2014 2015 2016 2017 2018
Average dwelling space per person pin 13.49 13.54 14.01 14.19 14.44 14.67 …
Ratio of house price to income - 7.80 8.40 8.40 8.50 9.30 9.20 …
Ratio of rent to income % 13.80 13.50 13.60 13.50 13.60 13.50 …
Satisfaction with present dwelling % 81.90 84.90 82.90 85.90 84.80 84.30 …
Satisfaction with dwelling surroundingenvironment-quality
% 82.40 81.90 81.80 83.00 82.30 82.50 …
Note: To compare people’s well-being with other countries, the Directorate-General of Budget, Accountant and Statistics (DGBAS) adopted the framework of Your Better Life Index issued by OECD to compile the International Indicators of our National Well-being Indicators, as shown in part A of Table 16-1 to 16-11, including 11 topics and 24 indicators. However, the DGBAS has discontinued the self- ranking since 2017. In addition, to illustrate national feelings, the DGBAS has also compiled the Domestic Indicators, in accordance with the characteristics of life in Taiwan,as in part B of Table 16-1 to 16-11. Meanwhile, please notice that the indicators, either from the OECD or domastic agencies, are subject to change due to the changing of definitions year by year. Source: DGBAS, Executive Yuan, R.O.C. (Taiwan), National Statistics/Socil Indicators/Well-being Iindicators, retrieved Jun 2019
International Indicators Unit
16-1. Housing conditions
Domestic Indicators Year
YearA. International Indicators
B. Domestic Indicators
347

16-2. Income and Wealth
2012 2013 2014 2015 2016 2017 2018
Household disposable income (PPP) US$ 29,475 29,741 31,869 31,740 31,842 33,948 …
Household financial wealth (PPP) US$ - 155,766 167,333 171,829 180,001 202,242 …
2012 2013 2014 2015 2016 2017 2018
Annual change rate of median disposableincome per capita % 4.11 2.95 3.84 2.53 3.94 2.62 …
Consumption expenditure per capita NT$ 225,292 232,998 239,736 245,047 253,033 264,388 …
Ratio of income share of highest 20% tothat of lowest 20% - 6.13 6.08 6.05 6.06 6.08 6.07 …
Subjective evaluation of materialwellbeing % 18.97 18.61 - - - - -
Ratio of relative poverty % 7.72 7.26 7.16 7.12 6.62 7.15 …
Source: See Table 16-1.
B. Domestic Indicators
Domestic Indicators UnitYear
A. International Indicators
UnitInternational Indicators Year
348
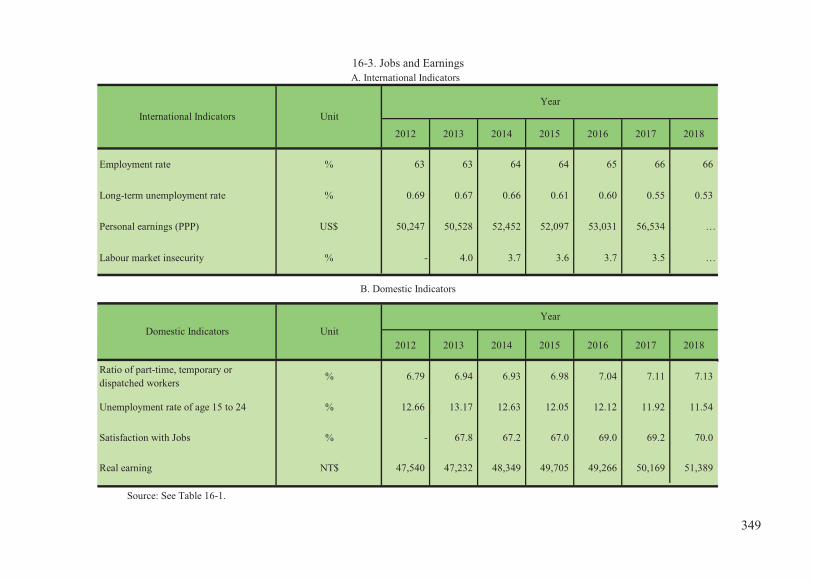
16-3. Jobs and Earnings
2012 2013 2014 2015 2016 2017 2018
Employment rate % 63 63 64 64 65 66 66
Long-term unemployment rate % 0.69 0.67 0.66 0.61 0.60 0.55 0.53
Personal earnings (PPP) US$ 50,247 50,528 52,452 52,097 53,031 56,534 …
Labour market insecurity % - 4.0 3.7 3.6 3.7 3.5 …
2012 2013 2014 2015 2016 2017 2018
Ratio of part-time, temporary ordispatched workers % 6.79 6.94 6.93 6.98 7.04 7.11 7.13
Unemployment rate of age 15 to 24 % 12.66 13.17 12.63 12.05 12.12 11.92 11.54
Satisfaction with Jobs % - 67.8 67.2 67.0 69.0 69.2 70.0
Real earning NT$ 47,540 47,232 48,349 49,705 49,266 50,169 51,389
Source: See Table 16-1.
Year
A. International Indicators
International Indicators Unit
B. Domestic Indicators
Domestic Indicators UnitYear
349

16-4. Social connections
2012 2013 2014 2015 2016 2017 2018
Quality of support network % - 92 91 93 92 - -
2012 2013 2014 2015 2016 2017 2018
Frequency of socializing with friends % 28.5 29.3 27.0 25.9 - - -
Frequency of socializing with relatives % 22.6 23.6 24.0 25.0 - - -
Time spent volunteering minute 5.0 - - - - - -
Trust in others % - 56.7 55.7 57.0 56.1 - -
Satisfaction with family relationship point(from 1 to 5) 4.35 4.36 4.39 4.40 4.38 4.40 4.37
Source: See Table 16-2.
International Indicators UnitYear
A. International Indicators
B. Domestic Indicators
Domestic Indicators UnitYear
350

16-5. Education and skills
2012 2013 2014 2015 2016 2017 2018
Educational attainment % 74 75 77 78 79 80 82
Years in education year 16.7 16.7 16.6 16.6 16.6 16.6 16.5
Students skills in maths, reading and science point 535 - - 524 - - …
2012 2013 2014 2015 2016 2017 2018
Lifelong learning % - - 32.6 - 34.7 36.2 …
Source: See Table 16-1.
A. International Indicators
Internaional Indicators UnitYear
B. Domestic Indicators
Domestic Indicators Unit
Year
351

16-6. Environmental quality
2012 2013 2014 2015 2016 2017 2018
Air pollution ����3 - 20 - - - 18 18
Water quality % 67 66 71 72 - - -
2012 2013 2014 2015 2016 2017 2018
Average green spaces per person in theurban area m2 per person 3.5 3.6 3.6 4.7 4.9 4.9 …
Source: See Table 16-1.
A. International Indicators
Internatioal Indicators UnitYear
B. Domestic Indicators
Domestic Indicators Unit
Year
352
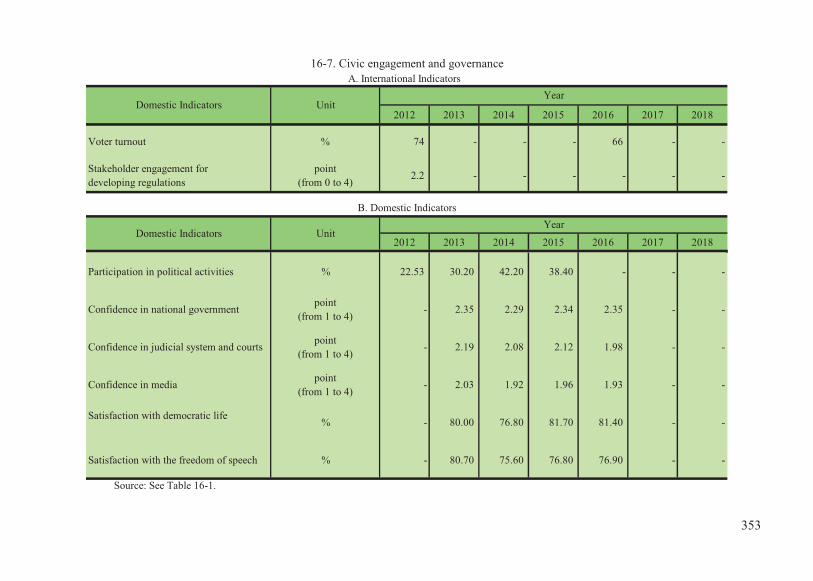
16-7. Civic engagement and governance
2012 2013 2014 2015 2016 2017 2018
Voter turnout % 74 - - - 66 - -
Stakeholder engagement fordeveloping regulations
point(from 0 to 4) 2.2 - - - - - -
2012 2013 2014 2015 2016 2017 2018
Participation in political activities % 22.53 30.20 42.20 38.40 - - -
Confidence in national government point(from 1 to 4) - 2.35 2.29 2.34 2.35 - -
Confidence in judicial system and courts point(from 1 to 4)
- 2.19 2.08 2.12 1.98 - -
Confidence in media point(from 1 to 4)
- 2.03 1.92 1.96 1.93 - -
Satisfaction with democratic life % - 80.00 76.80 81.70 81.40 - -
Satisfaction with the freedom of speech % - 80.70 75.60 76.80 76.90 - -
Source: See Table 16-1.
B. Domestic Indicators
Domestic Indicators UnitYear
A. International Indicators
Domestic Indicators UnitYear
353
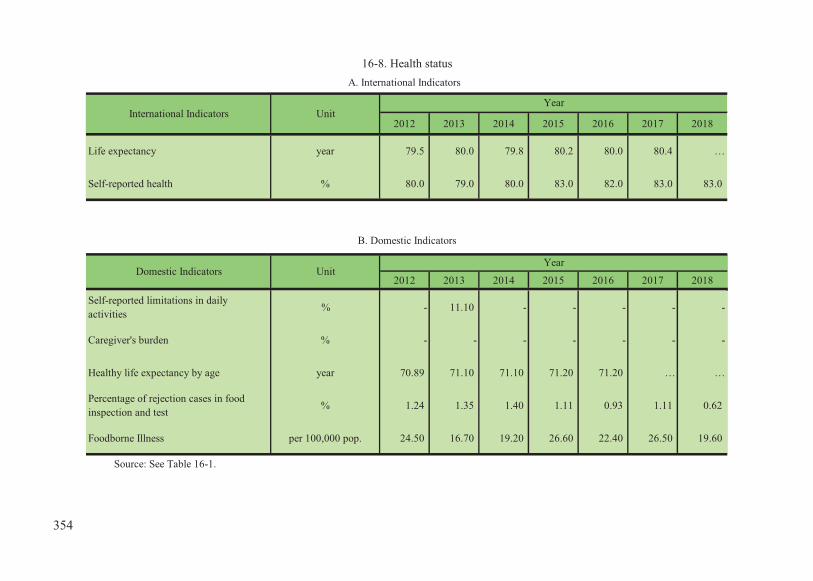
16-8. Health status
2012 2013 2014 2015 2016 2017 2018
Life expectancy year 79.5 80.0 79.8 80.2 80.0 80.4 …
Self-reported health % 80.0 79.0 80.0 83.0 82.0 83.0 83.0
2012 2013 2014 2015 2016 2017 2018
Self-reported limitations in dailyactivities % - 11.10 - - - - -
Caregiver's burden % - - - - - - -
Healthy life expectancy by age year 70.89 71.10 71.10 71.20 71.20 … …
Percentage of rejection cases in foodinspection and test % 1.24 1.35 1.40 1.11 0.93 1.11 0.62
Foodborne Illness per 100,000 pop. 24.50 16.70 19.20 26.60 22.40 26.50 19.60
Source: See Table 16-1.
B. Domestic Indicators
Domestic Indicators UnitYear
A. International Indicators
International Indicators UnitYear
354

16-9. Subjective Well-Being
2012 2013 2014 2015 2016 2017 2018
Life Satisfaction (Cantril Ladder) 6.20 - 6.30 6.40 6.40 6.40 6.40
2012 2013 2014 2015 2016 2017 2018
Life Satisfaction - - 6.32 6.69 6.62 - -
Characteristics contribute to Taiwan'sWell-being -
1.LifeConvenience: 22.72%2.National Health Insurance: 13.90%3.Food: 12.46%
- - - - -
Source: See Table 16-1.
A. International Indicators
International Indicators UnitYear
%
Year
point(from 1 to 10)
B. Domestic Indicators
Domestic Indicators Unit
point(from 1 to 10)
355

16-10. Personal security
2012 2013 2014 2015 2016 2017 2018
Homicide rate murder per 100,000inhabitants
0.8 0.7 0.7 0.8 0.6 0.7 …
Feeling safe walking alone at night % - - - - 78.8 79.1 82.0
2012 2013 2014 2015 2016 2017 2018
Victim of domestic violence per 100,000 pop. 380 403 409 408 405 405 410
Occurrence of residential burglary per 100,000 pop. 36.0 26.9 23.4 21.3 20.4 18.8 15.6
Mortality from accidents per 100,000 pop. 29.5 28.4 30.4 30.0 30.6 29.6 …
Assault rate % 1.9 1.5 1.4 1.4 - - -
Source: See Table 16-1.
B. Domestic Indicators
Domestic Indicators UnitYear
A. International Indicators
International Indicators UnitYear
356

16-11. Work and life balance
2012 2013 2014 2015 2016 2017 2018
Employees working very long hours % 9.08 11.92 11.06 10.19 8.02 5.92 5.88
Time devoted to leisure and personal care hour 14.93 - - - - - -
2012 2013 2014 2015 2016 2017 2018
Commuting time minute 38.00 - - - - - -
Satisfaction with allocation of time % 30.10 - - - - - -
Source: See Table 16-1.
B. Domestic Indicators
Domestic Indicators UnitYear
A. International Indicators
Domestic Indicators UnitYear
357

358

17. INTERNATIONAL STATISTICS

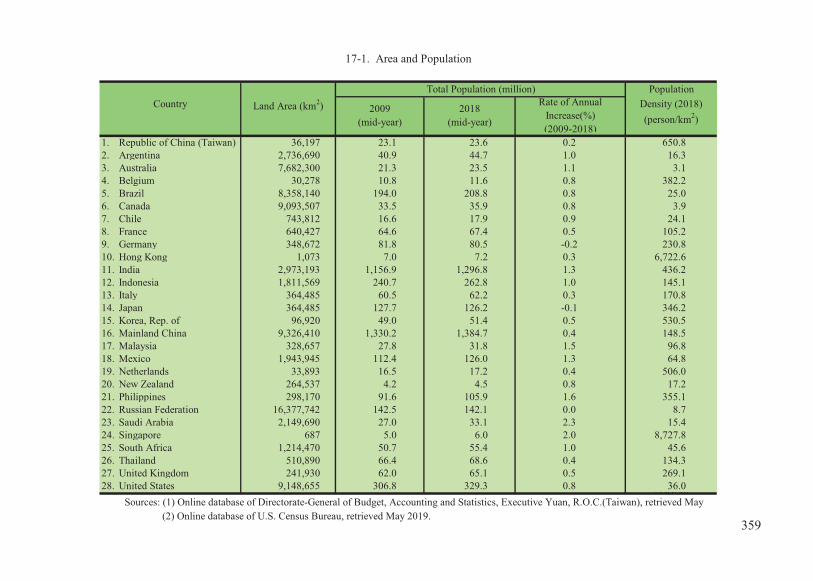
17-1. Area and Population
Total Population (million) PopulationLand Area (km2) 2009
(mid-year)2018
(mid-year)
Rate of AnnualIncrease(%)(2009-2018)
Density (2018)(person/km2)
1. Republic of China (Taiwan) 36,197 23.1 23.6 0.2 650.8 2. Argentina 2,736,690 40.9 44.7 1.0 16.3 3. Australia 7,682,300 21.3 23.5 1.1 3.1 4. Belgium 30,278 10.8 11.6 0.8 382.2 5. Brazil 8,358,140 194.0 208.8 0.8 25.0 6. Canada 9,093,507 33.5 35.9 0.8 3.9 7. Chile 743,812 16.6 17.9 0.9 24.1 8. France 640,427 64.6 67.4 0.5 105.2 9. Germany 348,672 81.8 80.5 -0.2 230.8 10. Hong Kong 1,073 7.0 7.2 0.3 6,722.6 11. India 2,973,193 1,156.9 1,296.8 1.3 436.2 12. Indonesia 1,811,569 240.7 262.8 1.0 145.1 13. Italy 364,485 60.5 62.2 0.3 170.8 14. Japan 364,485 127.7 126.2 -0.1 346.2 15. Korea, Rep. of 96,920 49.0 51.4 0.5 530.5 16. Mainland China 9,326,410 1,330.2 1,384.7 0.4 148.5 17. Malaysia 328,657 27.8 31.8 1.5 96.8 18. Mexico 1,943,945 112.4 126.0 1.3 64.8 19. Netherlands 33,893 16.5 17.2 0.4 506.0 20. New Zealand 264,537 4.2 4.5 0.8 17.2 21. Philippines 298,170 91.6 105.9 1.6 355.1 22. Russian Federation 16,377,742 142.5 142.1 0.0 8.7 23. Saudi Arabia 2,149,690 27.0 33.1 2.3 15.4 24. Singapore 687 5.0 6.0 2.0 8,727.8 25. South Africa 1,214,470 50.7 55.4 1.0 45.6 26. Thailand 510,890 66.4 68.6 0.4 134.3 27. United Kingdom 241,930 62.0 65.1 0.5 269.1 28. United States 9,148,655 306.8 329.3 0.8 36.0
#DIV/0!
(2) Online database of U.S. Census Bureau, retrieved May 2019.
Country
Sources: (1) Online database of Directorate-General of Budget, Accounting and Statistics, Executive Yuan, R.O.C.(Taiwan), retrieved May
359
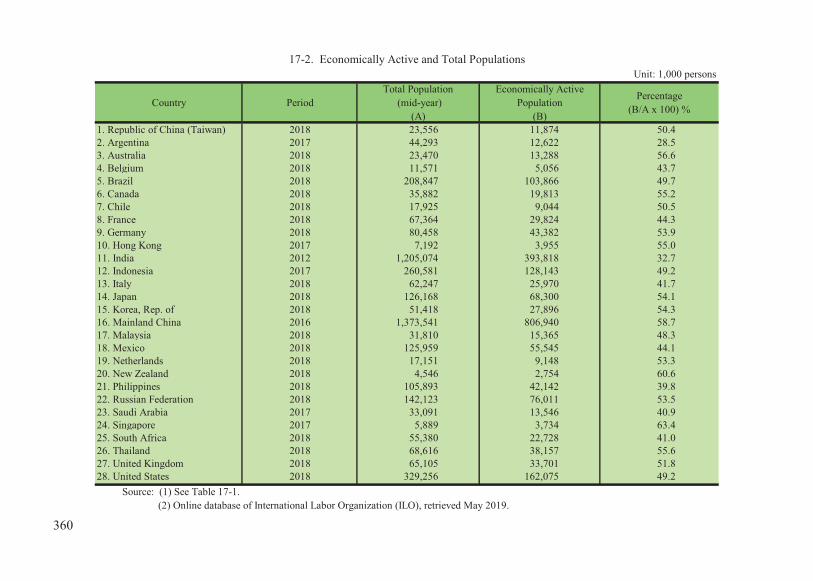
17-2. Economically Active and Total PopulationsUnit: 1,000 persons
Country PeriodTotal Population
(mid-year)(A)
Economically ActivePopulation
(B)
Percentage(B/A x 100) %
1. Republic of China (Taiwan) 2018 23,556 11,874 50.42. Argentina 2017 44,293 12,622 28.53. Australia 2018 23,470 13,288 56.64. Belgium 2018 11,571 5,056 43.75. Brazil 2018 208,847 103,866 49.76. Canada 2018 35,882 19,813 55.27. Chile 2018 17,925 9,044 50.58. France 2018 67,364 29,824 44.39. Germany 2018 80,458 43,382 53.910. Hong Kong 2017 7,192 3,955 55.011. India 2012 1,205,074 393,818 32.712. Indonesia 2017 260,581 128,143 49.213. Italy 2018 62,247 25,970 41.714. Japan 2018 126,168 68,300 54.115. Korea, Rep. of 2018 51,418 27,896 54.316. Mainland China 2016 1,373,541 806,940 58.717. Malaysia 2018 31,810 15,365 48.318. Mexico 2018 125,959 55,545 44.119. Netherlands 2018 17,151 9,148 53.320. New Zealand 2018 4,546 2,754 60.621. Philippines 2018 105,893 42,142 39.822. Russian Federation 2018 142,123 76,011 53.523. Saudi Arabia 2017 33,091 13,546 40.924. Singapore 2017 5,889 3,734 63.425. South Africa 2018 55,380 22,728 41.026. Thailand 2018 68,616 38,157 55.627. United Kingdom 2018 65,105 33,701 51.828. United States 2018 329,256 162,075 49.2
Source: (1) See Table 17-1. (2) Online database of International Labor Organization (ILO), retrieved May 2019.
360

17-3. Distribution of Employment by Industry
Percentage (%)Country Period Total
Total PrimaryIndustry
SecondaryIndustry
TertiaryIndustry Others
1. Republic of China (Taiwan) 2018 11,435 561 4,083 6,790 1 100.0 4.9 35.7 59.4 0.02. Argentina 2018 11,745 11 2,567 9,136 31 100.0 0.1 21.9 77.8 0.33. Australia 2018 12,598 330 2,505 9,763 0 100.0 2.6 19.9 77.5 0.04. Belgium 2018 4,755 47 1,001 3,707 0 100.0 1.0 21.1 78.0 0.05. Brazil 2018 91,051 8,469 18,301 64,227 54 100.0 9.3 20.1 70.5 0.16. Canada 2018 18,658 277 3,652 14,729 0 100.0 1.5 19.6 78.9 0.07. Chile 2018 8,390 773 1,874 5,743 0 100.0 9.2 22.3 68.5 0.08. France 2018 27,122 670 5,424 20,640 388 100.0 2.5 20.0 76.1 1.49. Germany 2018 41,915 524 11,459 29,932 0 100.0 1.3 27.3 71.4 0.010. Hong Kong 2017 3,833 … 458 3,365 10 (1) 100.0 … 11.9 87.8 0.311. India 2012 383,225 180,132 93,335 109,758 0 100.0 47.0 24.4 28.6 0.012. Indonesia 2017 122,781 37,804 27,033 57,943 1 100.0 30.8 22.0 47.2 0.013. Italy 2018 23,215 872 6,060 16,283 0 100.0 3.8 26.1 70.1 0.014. Japan 2018 66,640 2,280 15,940 47,030 1,390 100.0 3.4 23.9 70.6 2.115. Korea, Rep. of 2018 26,822 1,340 6,760 18,722 0 100.0 5.0 25.2 69.8 0.016. Mainland China 2017 776,400 209,440 218,240 348,720 0 100.0 27.0 28.1 44.9 0.017. Malaysia 2016 14,164 1,610 3,893 8,660 1 100.0 11.4 27.5 61.1 0.018. Mexico 2018 53,721 6,826 13,925 32,542 428 100.0 12.7 25.9 60.6 0.819. Netherlands 2018 8,798 167 1,285 6,496 850 100.0 1.9 14.6 73.8 9.720. New Zealand 2018 2,635 153 522 1,962 -2 100.0 5.8 19.8 74.5 -0.121. Philippines 2018 41,157 9,998 7,845 23,312 2 100.0 24.3 19.1 56.6 0.022. Russian Federation 2018 72,532 4,267 19,444 48,821 0 100.0 5.9 26.8 67.3 0.023. Saudi Arabia 2016 11,686 581 2,862 8,243 0 100.0 5.0 24.5 70.5 0.024. Singapore 2017 3,663 … 960 2,696 7 (1) 100.0 … 26.2 73.6 0.225. South Africa 2018 16,610 858 3,843 11,900 9 100.0 5.2 23.1 71.6 0.126. Thailand 2018 37,865 12,168 8,635 17,061 1 100.0 32.1 22.8 45.1 0.027. United Kingdom 2018 32,354 344 5,830 17,116 9,064 100.0 1.1 18.0 52.9 28.028. United States 2018 155,761 2,133 30,953 122,675 0 100.0 1.4 19.9 78.8 0.0
(1) Includes agriculture, fishing, quarrying, utilities and sewage & waste management.Source: See source (2) of Table 17-2.
Unit: 1,000 persons
PrimaryIndustry
SecondaryIndustry
TertiaryIndustry Others
361

Population (million) Percentage (%)All ages Under 15 15-64 Over 65 All ages Under 15 15-64 Over 65
1. Republic of China (Taiwan) 2018 23.6 3.1 17.2 3.4 100 13 73 142. Argentina 2018 44.7 10.9 28.5 5.3 100 24 64 123. Australia 2018 23.5 4.2 15.4 3.9 100 18 66 164. Belgium 2018 11.6 2.0 7.4 2.2 100 17 64 195. Brazil 2018 208.8 45.7 145.1 18.0 100 22 69 96. Canada 2018 35.9 5.5 23.5 6.8 100 15 65 197. Chile 2018 17.9 3.6 12.3 2.0 100 20 69 118. France 2018 67.4 12.4 41.6 13.4 100 18 62 209. Germany 2018 80.5 10.3 52.1 18.0 100 13 65 2210. Hong Kong 2018 7.2 0.9 5.1 1.2 100 12 70 1711. India 2018 1,296.8 349.9 864.1 82.8 100 27 67 612. Indonesia 2018 262.8 64.7 179.0 19.1 100 25 68 713. Italy 2018 62.2 8.5 40.3 13.5 100 14 65 2214. Japan 2018 126.2 16.0 74.3 35.8 100 13 59 2815. Korea, Rep. of 2018 51.4 6.7 37.2 7.5 100 13 72 1516. Mainland China 2018 1,384.7 238.4 990.2 156.1 100 17 72 1117. Malaysia 2018 31.8 8.7 21.0 2.0 100 27 66 618. Mexico 2018 126.0 33.5 83.3 9.1 100 27 66 719. Netherlands 2018 17.2 2.8 11.1 3.3 100 16 65 1920. New Zealand 2018 4.5 0.9 2.9 0.7 100 20 65 1621. Philippines 2018 105.9 35.0 66.0 4.9 100 33 62 522. Russian Federation 2018 142.1 24.5 96.8 20.8 100 17 68 1523. Saudi Arabia 2018 33.1 8.5 23.5 1.1 100 26 71 324. Singapore 2018 6.0 0.8 4.6 0.6 100 13 77 1025. South Africa 2018 55.4 15.6 36.6 3.2 100 28 66 626. Thailand 2018 68.6 11.5 49.6 7.5 100 17 72 1127. United Kingdom 2018 65.1 11.5 41.8 11.8 100 18 64 1828. United States 2018 329.3 61.3 215.2 52.8 100 19 65 16
Source: See source (2) of Table 17-2.
Country Period
17-4. Population by Age Group
362

2015 2016Country GDP
(US$ million)Per Capita GDP
(US$)GDP
(US$ million)Per Capita GDP
(US$)GDP
(US$ million)Per Capita GDP
(US$)
1. Republic of China (Taiwan) 525,562 22,400 531,281 22,592 574,940 24,4082. Argentina 594,749 13,789 557,531 12,790 642,696 14,5923. Australia 1,351,520 56,748 1,210,028 50,020 1,330,803 54,0944. Belgium 455,940 40,441 469,677 41,449 494,902 43,5075. Brazil 1,802,214 8,814 1,796,275 8,713 2,053,595 9,8816. Canada 1,552,900 43,495 1,526,706 42,280 1,646,867 45,0707. Chile 243,919 13,574 250,340 13,748 277,746 15,0378. France 2,438,208 36,613 2,471,286 36,962 2,586,285 38,6799. Germany 3,381,389 41,395 3,495,163 42,443 3,693,204 44,68110. Hong Kong 309,384 42,432 320,861 43,734 341,648 46,22111. India 2,103,588 1,606 2,290,432 1,729 2,652,551 1,98112. Indonesia 860,854 3,332 931,877 3,563 1,015,423 3,83713. Italy 1,832,273 30,171 1,869,202 30,831 1,946,570 32,15514. Japan 4,389,476 34,524 4,926,667 38,794 4,859,951 38,33215. Korea, Rep. of 1,382,764 27,105 1,414,804 27,608 1,530,751 29,74316. Mainland China 11,015,542 8,033 11,137,946 8,079 12,143,491 8,75917. Malaysia 296,636 9,799 296,753 9,671 314,707 10,11818. Mexico 1,170,565 9,606 1,077,828 8,739 1,158,071 9,28119. Netherlands 765,265 45,175 783,528 46,008 830,573 48,48320. New Zealand 177,208 38,560 187,854 40,027 202,591 42,26021. Philippines 292,774 2,867 304,898 2,941 313,620 2,98222. Russian Federation 1,363,594 9,314 1,282,724 8,745 1,578,624 10,75123. Saudi Arabia 654,270 20,628 644,936 19,879 688,586 20,80424. Singapore 308,004 55,647 318,068 56,724 338,406 60,29825. South Africa 317,537 5,733 295,747 5,262 348,872 6,12126. Thailand 401,296 5,840 412,353 5,979 455,276 6,57827. United Kingdom 2,896,421 44,472 2,659,239 40,540 2,637,866 39,93228. United States 18,219,298 56,803 18,707,188 57,904 19,485,394 59,928
Source: (1) See source (1) of Table 17-1. (2) Online database of World Bank(WB), retrieved July 2019.
2017
17-5. Gross Domestic Product and Per Capita GDP
363

2016 2017
Country GrossSavings
GrossInvestment
ExcessSavings
GrossSavings
GrossInvestment
ExcessSavings
amount(US$
million)
as %of GDP
amount(US$
million)
as %of GDP
amount(US$
million)
as %of GDP
amount(US$
million)
as %of GDP
amount(US$
million)
as %of GDP
amount(US$
million)
as %of GDP
1. Republic of China (Taiwan) 187,774 35.3 110,182 20.7 77,591 14.6 202,402 35.2 116,399 20.2 86,003 15.02. Argentina 81,612 14.6 98,478 17.7 -16,867 -3.0 86,965 13.5 120,552 18.8 -33,587 -5.23. Australia 250,186 20.7 307,576 25.4 -57,390 -4.7 290,714 21.8 320,063 24.1 -29,349 -2.24. Belgium 111,442 23.7 113,104 24.1 -1,662 -0.4 126,268 25.5 121,990 24.6 4,278 0.95. Brazil 241,647 13.5 268,985 15.0 -27,338 -1.5 293,922 14.3 308,771 15.0 -14,849 -0.76. Canada 291,511 19.1 350,050 22.9 -58,539 -3.8 330,200 20.1 388,492 23.6 -58,292 -3.57. Chile 51,642 20.6 55,628 22.2 -3,986 -1.6 53,890 19.4 59,970 21.6 -6,081 -2.28. France 538,494 21.8 558,743 22.6 -20,249 -0.8 587,800 22.7 604,304 23.4 -16,504 -0.69. Germany 985,202 28.2 687,162 19.7 298,039 8.5 1,043,165 28.2 742,054 20.1 301,111 8.210. Hong Kong 81,719 25.5 69,008 21.5 12,711 4.0 91,219 26.7 75,320 22.0 15,899 4.711. India 725,795 31.7 691,986 30.2 33,809 1.5 827,210 31.2 820,733 30.9 6,477 0.212. Indonesia 278,844 29.9 315,522 33.9 -36,678 -3.9 312,641 30.8 342,371 33.7 -29,730 -2.913. Italy 374,361 20.0 328,593 17.6 45,768 2.4 390,958 20.1 342,980 17.6 47,978 2.514. Japan 1,347,538 27.4 1,153,205 23.4 194,333 3.9 1,365,923 28.1 1,161,673 23.9 204,250 4.215. Korea, Rep. of 509,828 36.0 413,864 29.3 95,964 6.8 552,895 36.1 475,691 31.1 77,205 5.016. Mainland China 5,064,810 45.5 4,953,534 44.5 111,276 1.0 5,629,811 46.4 5,384,906 44.3 244,905 2.017. Malaysia 83,862 28.3 76,664 25.8 7,198 2.4 89,790 28.5 80,434 25.6 9,356 3.018. Mexico 240,296 22.3 256,182 23.8 -15,886 -1.5 268,714 23.2 265,863 23.0 2,851 0.219. Netherlands 223,634 28.5 160,526 20.5 63,108 8.1 258,757 31.2 171,691 20.7 87,067 10.520. New Zealand 39,270 20.9 44,143 23.5 -4,873 -2.6 41,263 20.4 47,575 23.5 -6,312 -3.121. Philippines 132,920 43.6 74,429 24.4 58,490 19.2 137,560 43.9 78,833 25.1 58,726 18.722. Russian Federation 325,435 25.4 301,879 23.5 23,555 1.8 410,650 26.0 380,325 24.1 30,325 1.923. Saudi Arabia 175,653 27.2 171,591 26.6 4,062 0.6 209,168 30.4 198,739 28.9 10,429 1.524. Singapore 141,094 44.4 85,004 26.7 56,089 17.6 153,490 45.4 95,305 28.2 58,185 17.225. South Africa 48,372 16.4 57,236 19.4 -8,864 -3.0 55,176 15.8 64,897 18.6 -9,721 -2.826. Thailand 124,483 30.2 86,347 20.9 38,136 9.2 146,096 32.1 103,967 22.8 42,129 9.327. United Kingdom 320,021 12.0 458,859 17.3 -138,838 -5.2 345,738 13.1 454,639 17.2 -108,901 -4.128. United States 3,499,159 18.7 3,801,378 20.3 -302,219 -1.6 3,700,975 19.0 4,011,154 20.6 -310,179 -1.6
Source: See Table 17-5.
17-6. Savings and Investment
364

1. Republic of China (Taiwan) 2018 589,997 2.6 1.6 35.2 63.22. Argentina 2017 642,696 2.7 5.5 21.9 72.63. Australia 2017 1,330,803 2.3 2.7 23.5 73.84. Belgium 2017 494,902 1.7 0.7 19.6 79.75. Brazil 2017 2,053,595 1.1 4.6 18.4 77.06. Canada 2015 1,552,900 0.7 1.7 24.8 73.57. Chile 2017 277,746 1.3 3.9 29.6 66.58. France 2017 2,586,285 2.3 1.6 17.2 81.29. Germany 2017 3,693,204 2.2 0.8 28.0 71.210. Hong Kong 2017 341,648 3.8 0.1 7.2 92.711. India 2017 2,652,551 7.2 15.6 26.5 57.912. Indonesia 2017 1,015,423 5.1 13.1 39.4 47.513. Italy 2017 1,946,570 1.7 1.9 21.5 76.614. Japan 2017 4,859,951 1.9 1.2 29.1 69.715. Korea, Rep. of 2017 1,530,751 3.1 2.0 35.9 62.116. Mainland China 2017 12,143,491 6.8 7.6 40.5 51.917. Malaysia 2017 314,707 5.9 8.8 38.8 52.418. Mexico 2017 1,158,071 2.1 3.4 30.7 65.919. Netherlands 2017 830,573 2.9 1.9 17.4 80.720. New Zealand 2016 187,854 3.6 6.6 19.2 74.221. Philippines 2017 313,620 6.7 9.7 30.4 59.922. Russian Federation 2017 1,578,624 1.6 3.5 30.5 66.023. Saudi Arabia 2017 688,586 -0.7 2.5 45.9 51.624. Singapore 2017 338,406 3.7 0.0 23.6 76.425. South Africa 2017 348,872 1.3 2.3 25.9 71.826. Thailand 2017 455,276 4.0 8.3 35.3 56.427. United Kingdom 2017 2,637,866 1.8 0.6 17.9 81.528. United States 2017 19,485,394 2.2 0.9 18.2 80.9
Source: See Table 17-5.
17-7. Structure of Gross Domestic Product by Industry
GDP % of GDP
AgricultureUS$ million Annual Growth Rate (%) ServicesCountry Period
Industry
365
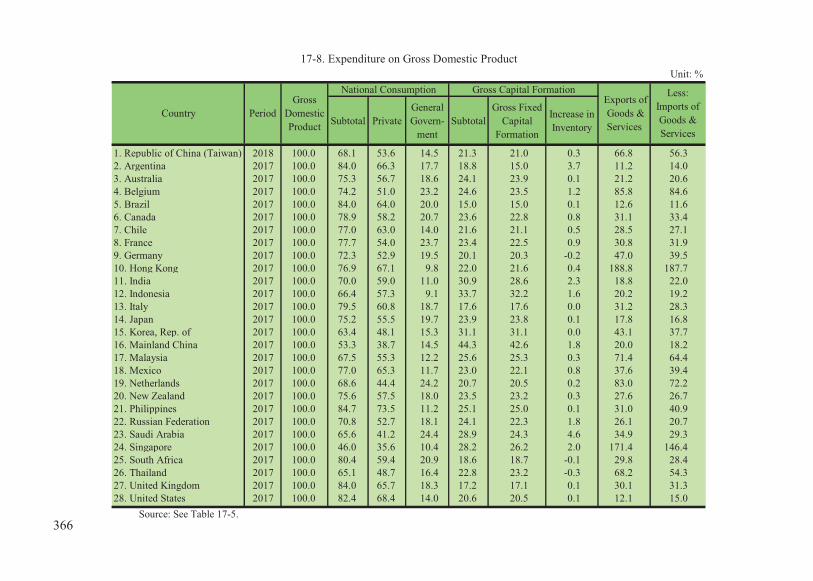
Unit: %National Consumption Gross Capital Formation
Subtotal PrivateGeneralGovern-
mentSubtotal
Gross FixedCapital
Formation
Increase inInventory
1. Republic of China (Taiwan) 2018 100.0 68.1 53.6 14.5 21.3 21.0 0.3 66.8 56.32. Argentina 2017 100.0 84.0 66.3 17.7 18.8 15.0 3.7 11.2 14.03. Australia 2017 100.0 75.3 56.7 18.6 24.1 23.9 0.1 21.2 20.64. Belgium 2017 100.0 74.2 51.0 23.2 24.6 23.5 1.2 85.8 84.65. Brazil 2017 100.0 84.0 64.0 20.0 15.0 15.0 0.1 12.6 11.66. Canada 2017 100.0 78.9 58.2 20.7 23.6 22.8 0.8 31.1 33.47. Chile 2017 100.0 77.0 63.0 14.0 21.6 21.1 0.5 28.5 27.18. France 2017 100.0 77.7 54.0 23.7 23.4 22.5 0.9 30.8 31.99. Germany 2017 100.0 72.3 52.9 19.5 20.1 20.3 -0.2 47.0 39.510. Hong Kong 2017 100.0 76.9 67.1 9.8 22.0 21.6 0.4 188.8 187.711. India 2017 100.0 70.0 59.0 11.0 30.9 28.6 2.3 18.8 22.012. Indonesia 2017 100.0 66.4 57.3 9.1 33.7 32.2 1.6 20.2 19.213. Italy 2017 100.0 79.5 60.8 18.7 17.6 17.6 0.0 31.2 28.314. Japan 2017 100.0 75.2 55.5 19.7 23.9 23.8 0.1 17.8 16.815. Korea, Rep. of 2017 100.0 63.4 48.1 15.3 31.1 31.1 0.0 43.1 37.716. Mainland China 2017 100.0 53.3 38.7 14.5 44.3 42.6 1.8 20.0 18.217. Malaysia 2017 100.0 67.5 55.3 12.2 25.6 25.3 0.3 71.4 64.418. Mexico 2017 100.0 77.0 65.3 11.7 23.0 22.1 0.8 37.6 39.419. Netherlands 2017 100.0 68.6 44.4 24.2 20.7 20.5 0.2 83.0 72.220. New Zealand 2017 100.0 75.6 57.5 18.0 23.5 23.2 0.3 27.6 26.721. Philippines 2017 100.0 84.7 73.5 11.2 25.1 25.0 0.1 31.0 40.922. Russian Federation 2017 100.0 70.8 52.7 18.1 24.1 22.3 1.8 26.1 20.723. Saudi Arabia 2017 100.0 65.6 41.2 24.4 28.9 24.3 4.6 34.9 29.324. Singapore 2017 100.0 46.0 35.6 10.4 28.2 26.2 2.0 171.4 146.425. South Africa 2017 100.0 80.4 59.4 20.9 18.6 18.7 -0.1 29.8 28.426. Thailand 2017 100.0 65.1 48.7 16.4 22.8 23.2 -0.3 68.2 54.327. United Kingdom 2017 100.0 84.0 65.7 18.3 17.2 17.1 0.1 30.1 31.328. United States 2017 100.0 82.4 68.4 14.0 20.6 20.5 0.1 12.1 15.0
Source: See Table 17-5.
17-8. Expenditure on Gross Domestic Product
Country Exports of Goods &Services
Less:Imports ofGoods &Services
GrossDomesticProduct
Period
366

2013(US$ million)
2014(US$ million)
2015(US$ million)
2016(US$ million)
2017(US$ million)
1. Republic of China (Taiwan) 170,134 177,945 158,954 172,238 181,938 30.82. Argentina 146,569 145,472 173,457 190,490 … …3. Brazil 483,765 556,920 543,397 543,257 542,980 27.04. Colombia 7,431 8,130 9,698 11,204 124,364 41.35. Egypt, Arab Rep. 46,503 41,743 48,340 67,641 82,886 35.96. India 427,296 457,553 478,875 455,550 513,209 19.87. Indonesia 265,458 292,984 306,201 320,966 354,352 30.68. Mainland China 1,471,616 1,770,458 1,325,868 1,415,801 1,710,235 14.09. Malaysia 188,795 196,587 190,951 200,364 … …
10. Mexico 406,227 442,414 426,905 422,473 455,058 40.511. Pakistan 58,012 61,549 65,818 72,157 84,523 26.312. Panama 68,391 78,067 88,566 89,492 … …13. Peru 63,546 67,906 67,185 70,636 68,083 33.614. Philippines 66,202 77,434 76,448 73,014 73,080 19.415. South Africa 139,790 141,599 138,078 146,041 176,335 52.016. Thailand 137,353 135,292 129,654 121,497 129,765 31.417. Turkey 390,350 406,081 399,966 409,016 454,725 54.118. Vietnam 65,448 72,423 77,806 85,642 104,079 48.8
Sources: (1) Online database of Central Bank of R.O.C. (Taiwan), retrieved July 2019. (2) See source (2) of Table 17-5.
CountryPresent Value
Percentage of GNI (%)2017
17-9. External Debt
Period
367

17-10. Indices of Industrial ProductionBase: 2010=100
Country 2013 2014 2015 2016 2017 2018
1. Republic of China (Taiwan) (1) 93.4 99.3 98.1 100.0 105.0 108.82. Argentina 98.4 96.6 96.9 92.6 … …3. Australia 104.3 108.5 109.7 109.5 110.3 …4. Belgium 102.9 104.2 103.0 107.5 110.6 111.85. Brazil 100.1 97.1 89.1 83.4 85.4 86.46. Canada 106.4 111.7 111.2 111.1 117.2 121.17. Chile 113.5 112.2 112.4 111.6 110.6 ...8. France 99.0 98.0 99.7 100.1 102.2 102.99. Germany 107.3 109.4 110.6 112.2 115.5 116.910. Hong Kong 100.0 99.6 98.1 97.7 98.1 99.311. India 106.2 111.0 113.8 119.7 124.0 130.412. Indonesia 114.9 120.4 126.1 131.2 137.4 144.913. Italy 97.7 97.7 97.7 97.7 97.7 97.714. Japan 98.1 98.1 98.1 98.1 98.1 98.115. Korea, Rep. of 99.3 99.3 99.3 99.3 99.3 99.316. Mainland China 137.9 149.3 158.4 168.0 179.3 ...17. Malaysia 110.3 116.0 121.5 126.5 132.1 136.118. Mexico 105.5 108.3 109.6 110.0 109.7 109.919. Netherlands 99.5 96.8 93.5 94.8 95.8 97.220. New Zealand 98.8 101.2 102.6 104.6 106.6 ...21. Philippines 124.1 133.1 136.4 152.3 151.9 163.222. Russian Federation 110.5 113.2 112.3 114.8 117.2 120.623. Saudi Arabia 118.2 128.4 136.9 142.0 … …24. Singapore 110.0 112.9 107.1 111.1 122.6 131.325. South Africa 106.9 107.0 106.6 107.3 106.8 …26. Thailand 109.7 105.3 105.4 106.8 108.7 112.727. United Kingdom 96.0 97.4 98.6 98.6 99.7 100.728. United States 108.4 111.7 110.6 108.4 110.2 114.7
(1) Base 2016=100.Sources: (1) Online database of Ministry of Economic Affairs, R.O.C., retrieved May 2019.
(2) Online database of International Monetary Fund (IMF), retrieved August 2019.368
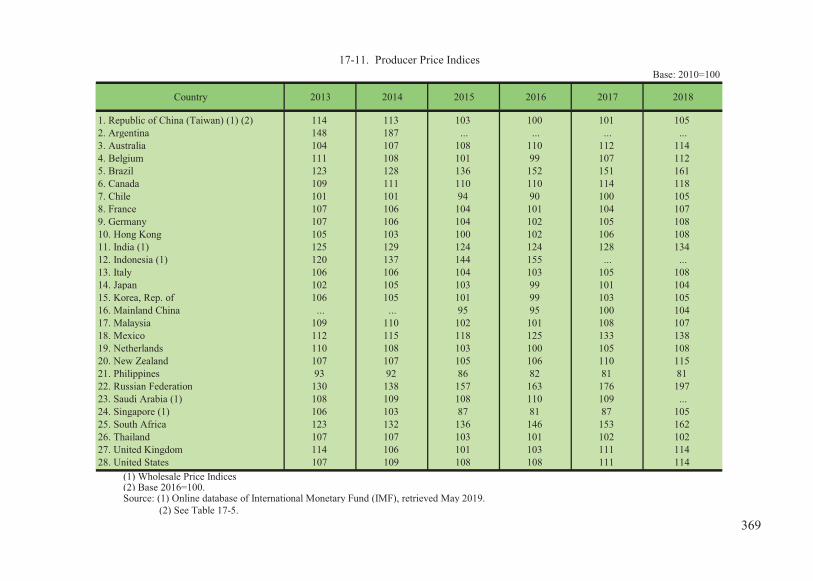
17-11. Producer Price IndicesBase: 2010=100
Country 2013 2014 2015 2016 2017 2018
1. Republic of China (Taiwan) (1) (2) 114 113 103 100 101 1052. Argentina 148 187 ... ... ... ...3. Australia 104 107 108 110 112 1144. Belgium 111 108 101 99 107 1125. Brazil 123 128 136 152 151 1616. Canada 109 111 110 110 114 1187. Chile 101 101 94 90 100 1058. France 107 106 104 101 104 1079. Germany 107 106 104 102 105 10810. Hong Kong 105 103 100 102 106 10811. India (1) 125 129 124 124 128 13412. Indonesia (1) 120 137 144 155 ... ...13. Italy 106 106 104 103 105 10814. Japan 102 105 103 99 101 10415. Korea, Rep. of 106 105 101 99 103 10516. Mainland China ... ... 95 95 100 10417. Malaysia 109 110 102 101 108 10718. Mexico 112 115 118 125 133 13819. Netherlands 110 108 103 100 105 10820. New Zealand 107 107 105 106 110 11521. Philippines 93 92 86 82 81 8122. Russian Federation 130 138 157 163 176 19723. Saudi Arabia (1) 108 109 108 110 109 ...24. Singapore (1) 106 103 87 81 87 10525. South Africa 123 132 136 146 153 16226. Thailand 107 107 103 101 102 10227. United Kingdom 114 106 101 103 111 11428. United States 107 109 108 108 111 114
(1) Wholesale Price Indices(2) Base 2016=100.Source: (1) Online database of International Monetary Fund (IMF), retrieved May 2019.
(2) See Table 17-5. 369
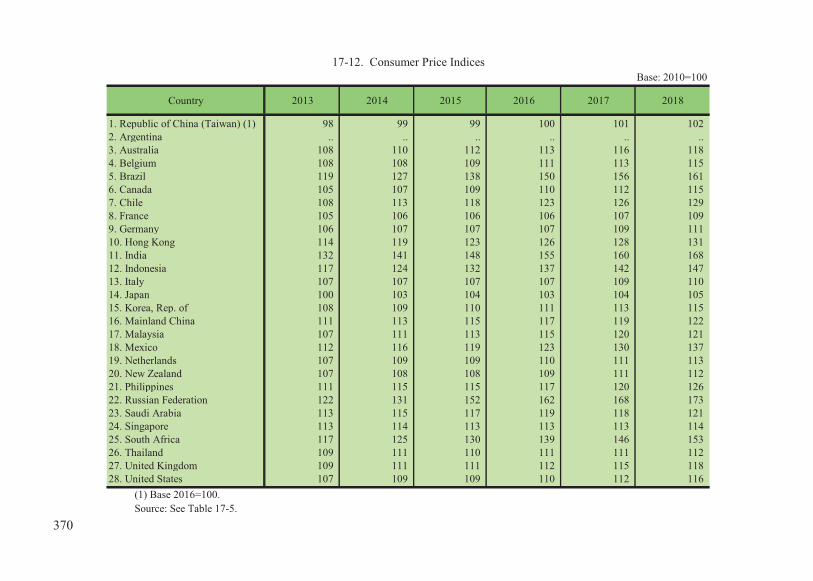
17-12. Consumer Price IndicesBase: 2010=100
Country 2013 2014 2015 2016 2017 2018
1. Republic of China (Taiwan) (1) 98 99 99 100 101 102 2. Argentina .. .. .. .. .. ..3. Australia 108 110 112 113 116 118 4. Belgium 108 108 109 111 113 115 5. Brazil 119 127 138 150 156 161 6. Canada 105 107 109 110 112 115 7. Chile 108 113 118 123 126 129 8. France 105 106 106 106 107 109 9. Germany 106 107 107 107 109 111 10. Hong Kong 114 119 123 126 128 131 11. India 132 141 148 155 160 168 12. Indonesia 117 124 132 137 142 147 13. Italy 107 107 107 107 109 110 14. Japan 100 103 104 103 104 105 15. Korea, Rep. of 108 109 110 111 113 115 16. Mainland China 111 113 115 117 119 122 17. Malaysia 107 111 113 115 120 121 18. Mexico 112 116 119 123 130 137 19. Netherlands 107 109 109 110 111 113 20. New Zealand 107 108 108 109 111 112 21. Philippines 111 115 115 117 120 126 22. Russian Federation 122 131 152 162 168 173 23. Saudi Arabia 113 115 117 119 118 121 24. Singapore 113 114 113 113 113 114 25. South Africa 117 125 130 139 146 153 26. Thailand 109 111 110 111 111 112 27. United Kingdom 109 111 111 112 115 118 28. United States 107 109 109 110 112 116
(1) Base 2016=100.Source: See Table 17-5.
370

17-13. International Rankings
2015 2016 2017 2018 2016 2017 2018 20191. Republic of China (Taiwan) 15 14 15 13 14 14 17 16 11 11 15 132. Argentina 106 104 92 81 55 58 56 61 121 116 117 1193. Australia 21 22 21 22 17 21 19 18 13 15 14 184. Belgium 19 17 20 21 22 23 26 27 43 42 52 455. Brazil 75 81 80 72 57 61 60 59 116 123 125 1096. Canada 13 15 14 12 10 12 10 10 14 22 18 227. Chile 35 33 33 33 36 35 35 42 48 57 55 568. France 22 21 22 17 32 31 28 31 27 29 31 329. Germany 4 5 5 3 12 13 15 17 15 17 20 2410. Hong Kong 7 9 6 7 1 1 2 2 5 4 5 411. India 55 39 40 58 41 45 44 43 130 130 100 7712. Indonesia 37 41 36 45 48 42 43 32 109 91 72 7313. Italy 43 44 43 31 35 44 42 44 45 50 46 5114. Japan 6 8 9 5 26 26 25 30 34 34 34 3915. Korea, Rep. of 26 26 26 15 29 29 27 28 4 5 4 516. Mainland China 28 28 27 28 25 18 13 14 84 78 78 4617. Malaysia 18 25 23 25 19 24 22 22 18 23 24 1518. Mexico 57 51 51 46 45 48 51 50 38 47 49 5419. Netherlands 5 4 4 6 8 5 4 6 28 28 32 3620. New Zealand 16 13 13 18 16 16 23 21 2 1 1 121. Philippines 47 57 56 56 42 41 50 46 103 99 113 12422. Russian Federation 45 43 38 43 44 46 45 45 51 40 35 3123. Saudi Arabia 25 29 30 39 - 36 39 26 82 94 92 9224. Singapore 2 2 3 2 4 3 3 1 1 2 2 225. South Africa 49 47 61 67 52 53 53 56 73 74 82 8226. Thailand 32 34 32 38 28 27 30 25 49 46 26 2727. United Kingdom 10 7 8 8 18 19 20 23 6 7 7 928. United States 3 3 2 1 3 4 1 3 7 8 6 8
(1) WEF is abbreviated from World Economic Forum, an independent international organization committed to improving the state of the world by engaging business, political, academic and other leaders of society to shape global, regional and industry agendas.
(2) IMD is abbreviated from International Institute for Management Development.Sources: (1) World Economic Forum (WEF), The Global Competitiveness Report 2016-2019.
(2) International Institute for Management Development (IMD), IMD World Competitiveness Yearbook 2016-2019 . (3) World Bank (WB), Doing Business 2016-2019.
2018
Rankings for the Ease of Doing Business
2017Country
2016Issued by WEF (1)World Competitiveness Rankings
Issued by IMD (2) 2019
371

372

Taiwan Statistical Data Book, 2019 Author: National Development Council Publisher: National Development Council, R.O.C. (Taiwan) Edition: First edition Sales: 1. Sanmin Book Co., Ltd. ( http://www.sanmin.com.tw/) No.61, Sec. 1, Chongcing S. Rd., Jhongjheng District, Taipei City 100, R.O.C. (Taiwan) TEL: 886-2-2361-7511 FAX: 886-2-2361-3355 2. Wunanbooks Store (http://www.wunan.com.tw) No.600, Junfu 7th Rd., Beitun Dist., Taichung City 406, R.O.C. (Taiwan) TEL: 886-4-2221-0237 FAX: 886-4-2221-0238 3. Government Publication Bookstore (http://www.govbooks.com.tw) No. 209, Songjiang Rd., Zhongshan District, Taipei City 104, R.O.C. (Taiwan) TEL: 886-2-2518-0207 Fax: 886-2-2518-0778 Price: NT$300.00 (Taiwan) Airmail postage: US$23.00 (Europe, America, Africa) Airmail postage: US$20.00 (Asia, Oceania Area); US$18.00 (Hong Kong) Surface mail postage: US$15.00 (Europe, America, Africa, Asia, Oceania) US$13.00 (Hong Kong) ISSN: 1016-2224 August 2019
373


