tata steel (tisco) - icici directcontent.icicidirect.com/mailimages/idirect_tatasteel_q2fy17.pdf ·...
TRANSCRIPT

November 15, 2016
ICICI Securities Ltd | Retail Equity Research
Result Update
Indian operations disappoint… • Tata Steel reported a subdued set of Q2FY17 numbers. The Indian
operations reported a muted performance wherein the EBITDA/tonne was lower than our estimate while the EBITDA/tonne from European operations came in higher than our estimates. The topline, PAT and EBITDA were below our estimates
• Tata Steel’s sales volume from the Indian operations came in at 2.6 million tonne (MT) higher than our estimate of 2.4 MT while the sales volume from European operations were at 2.3 MT below our estimate of 2.5 MT. The gross consolidated topline was at | 27471.2 crore. After adjusting for excise duty net operating income (consolidated) was at | 26371.0 crore up 4.5% QoQ, and lower than our estimate of | 27214.5 crore
• The consolidated reported EBITDA came in at | 2970.0 crore and EBITDA margin of 11.3% (our estimate of | 3216.6 crore and EBITDA margin of 11.8%). EBITDA/tonne of domestic operations came in at | 7297/tonne, significantly lower than our estimate of | 9500/tonne while Tata Steel Europe reported an EBITDA/tonne of US$ 67.2/tonne higher than our estimate of US$40/tonne
• On account of lower-than-expected EBITDA and higher tax outgo the company reported a net loss from continuing operations amounting to | 172.0 crore against our estimate of a net profit of | 989.0 crore. The net loss for the period after accounting for the discontinued operations stood at | 49.4 crore.
Volumes from Indian operations increase, higher CoP weighs on EBITDA Tata Steel’s Indian operations registered a healthy growth in volumes, wherein sales volumes were at 2.6 MT up 14.1% YoY and 25.0% QoQ. However, on the EBITDA front, benefits from a sizable increase in volumes were largely offset by a decline in realisation, which was down ~| 2700/tonne. Going forward, we expect the raw material cost to firm up on account of higher coking coal prices. Hence, despite an increase in volume we expect EBIDTA margins to remain under pressure. Going forward, we downward revised our EBITDA/tonne from Indian operations for FY17E to | 8000/tonne (from | 10000/tonne earlier) and FY18E to | 9500/tonne (from | 11000/tonne earlier). Integrated domestic operations bode well in long run… The company has access to captive raw materials (100% integration for iron ore and ~35% integration for coking coal). This enables TSL to realise superior EBITDA margins compared to its domestic peers. Going forward, over the next couple of years, we expect Indian operations to clock an EBITDA/tonne of ~| 8000-10000/tonne, higher than its peers. Performance of Indian operations disappoints; maintain HOLD… Tata Steel reported a subdued set of Q2FY17 numbers, Going forward, we expect EBITDA margins to take a hit on account of sharp increase in the coking coal prices (~65% of the coking coal requirement is met by imports). The cost dynamics are also likely to move in tandem with the growth in the volumes. Going forward, we have downward revised our EBITDA/tonne estimates for the Indian operations to | 8000/tonne for FY17E (| 10000/tonne earlier) and | 9500/tonne for FY18E (| 11000/tonne earlier). On account of the healthy performance of European operations, we have upward revised the EBITDA/tonne to $60/tonne for FY17E ($40/tonne earlier) and $80/tonne for FY18E ($60/tonne earlier). We value the domestic operations at 6.5x FY18E EV/EBITDA and overseas operations at 5x FY18E EV/EBITDA. We have arrived at a target price of | 375 and have a HOLD recommendation on the stock.
Rating matrix Rating : HoldTarget : | 375 Target Period : 12 monthsPotential Upside : -5%
What’s Changed?
Target Changed from | 350 to | 375 EPS FY17E Changed from | 16.2 to | 8.3 EPS FY18E Changed from | 38.8 to | 37.5 Rating Unchanged
Quarterly Performance
Q2FY17 Q2FY16 YoY (%) Q1FY17 QoQ (%)Revenue 26371.0 26385.3 -0.1 25229.8 4.5EBITDA 2970.0 1784.1 66.5 3242.0 -8.4EBITDA (%) 11.3 6.8 450 bps 12.8 -159 bpsRep. PAT -49.4 5609.4 PL -3197.3 -98.5Adj. PAT -103.7 -338.3 NA 325.8 -131.8
Key Financials (| Crore) FY15 FY16 FY17E FY18ENet Sales 138318.9 117151.6 124862.8 129648.2EBITDA 12535.8 7585.6 13390.3 17952.8Adj Net Profit 3.1 -2243.2 802.7 3637.9EPS (|) NM -23.1 8.3 37.5
Valuation summary
FY15 FY16 FY17E FY18EPE (x) NM NA 47.6 10.5Target PE (x) NM NA 45.4 10.0EV/EBITDA(x) 8.8 15.7 9.0 6.4P/BV (x) 1.1 1.2 1.2 1.1Adj RoNW (%) 0.0 -7.3 2.6 10.9Adj RoCE (%) 5.8 2.1 5.9 9.0
Stock data Particular AmountMarket Capitalization (| Crore) 36,190 Total Debt (FY16) (| Crore) 86,204 Cash & Cash Eq. (FY16) (| Crore) 13,516 EV (| Crore) 111,982 52 week H/L (|) 439/211Equity capital | 970.2 CroreFace value | 10
Price performance (%) Return % 1M 3M 6M 12MJSW Steel -5.2 0.6 33.3 95.8SAIL 1.9 12.8 23.0 12.5Tata Steel 1.9 15.8 29.3 93.5
Research Analyst
Dewang Sanghavi [email protected]
Akshay Kadam [email protected]
Tata Steel (TISCO) | 394

ICICI Securities Ltd | Retail Equity Research Page 2
Variance analysis Q2FY17 Q2FY17E Q2FY16 YoY (%) Q1FY17 QoQ (%)
Revenue 26,371.0 27,214.5 26,385.3 -0.1 25,229.8 4.5 The topline came in lower than our estimateOther Income 108.4 209.3 126.3 -14.2 136.7 -20.7Employee Expense 4,518.3 4,540.9 4,735.6 -4.6 4,679.6 -3.4Raw Material Expense 9,406.8 9,842.4 10,671.3 -11.8 8,183.9 14.9Power & Fuel Expense 1,208.3 1,359.7 1,188.2 1.7 1,220.3 -1.0Other operating Expenses 8,267.6 8,254.9 8,006.2 3.3 7,903.9 4.6
EBITDA 2,970.0 3,216.6 1,784.1 66.5 3,242.0 -8.4 The EBITDA came in lower than our estimatesEBITDA Margin (%) 11.3 11.8 6.8 450 bps 12.8 -159 bps The EBITDA margin came in line with our estimatesDepreciation 1,467.7 873.1 1,316.4 11.5 1,241.7 18.2 Depreciation came in higher than our estimatesInterest 1,351.1 982.6 1,100.1 22.8 1,070.7 26.2 Interest cost came in higher than our estimatesExceptional Item 68.4 (6,452.5) NM 3,508.9 -98.1PBT 191.3 1,570.2 5,946.4 -96.8 (2,442.6) -98.5Tax Outgo 363.4 581.2 (168.2) -316.1 740.5 -50.9PAT (172.0) 989.0 6,114.5 PL (3,183.1) -94.6 Company reported net loss as against our estimate of a profitProfit from discontinued operations
122.7 5.3 (505.1) NA (14.2) NA
Reported PAT for the Group (49.4) 994.3 5,609.4 PL (3,197.3) -98.5Adjusted PAT for the Group (103.7) 994.3 (338.3) NA 325.8 PLKey MetricsTSI Steel Sales (MT) 2.6 2.4 2.3 14.1 2.1 25.0 The TSI sales volume came in above our estimateTSE Steel Sales (MT) 2.3 2.5 3.3 -30.3 2.5 -8.0 The TSE sales volume came in below our estimateGroup Steel Sales (MT) 5.7 5.9 6.3 -10.3 5.4 4.6TSI EBITDA/tonne (|/tonne) 7,297.1 9,500.0 7,979.0 -8.5 10,351.0 -29.5 The TSI EBITDA/tonne came in significantly lower than our estimateTSE EBITDA/tonne (US$/tonne) 67.2 40.0 (11.0) -710.9 50.6 32.8 The TSI EBITDA/tonne came in higher than our estimateTSI: Tata Steel India; TSE: Tata Steel Europe
Source: Company, ICICIdirect.com Research Change in estimates
(| Crore) Old New % Change Old New % Change Comments
Total Operating Income (| crore) 126919 124863 -1.6 127999 129648 1.3Topline estimate marginally revised downwards for FY17E, and marginally upwards for FY18E
EBITDA (| crore) 13896 13390 -3.6 17964 17953 -0.1 EBITDA estimate for FY17E revised downwards
EBITDA Margin (%) 10.9 10.7 -2.1 14.0 13.8 -1.3 EBITDA margin estimates revised downwards for both yearsAdj PAT (| crore) 1573 803 -49.0 3767 3638 -3.4 PAT for both years revised downwardsAdj EPS (|) 16.2 8.3 -49.0 38.8 37.5 -3.4
FY17E FY18E
Source: Company, ICICIdirect.com Research Assumptions
CommentsFY17E FY18E FY17E FY18E
TSI Steel Sales (MT) 10.8 12.5 10.5 12.0 Volume estimates from the Indian operations revised upwards for both years
TSE Steel Sales (MT) 10.0 10.0 10.0 10.0 Maintained sales volumes estimates from European operationsGroup Steel Sales (MT) 24.8 27.0 24.5 26.5TSI EBITDA/tonne (|/tonne) 8,000 9,500 10,000 11,000 Indian operations EBITDA/tonne revised downwards for both yearsTSE EBITDA/tonne (US$/tonne) 60.0 80.0 40.0 60.0 European operations EBITDA/tonne revised upwards for both years
Current Earlier
Source: Company, ICICIdirect.com Research

ICICI Securities Ltd | Retail Equity Research Page 3
Company Analysis Volumes from Indian operations increase, higher CoP weighs on EBITDA Tata Steel’s Indian operations registered a healthy growth in volumes, wherein sales volume was at 2.6 MT up 14.1% YoY and 25.0% QoQ. However, on the EBITDA front, the benefits from a sizable increase in volumes was largely offset by decline in the realisation, which were down 6% QoQ and increased operating costs per tonne which were up 2.7% QoQ. Going forward, we expect the raw material cost to firm up on account of higher coking coal prices. Hence, despite increase in volume we expect EBIDTA margins to remain under pressure. Going forward, we have downward revised our EBITDA/tonne from the Indian operations for FY17E to | 8000/tonne (from | 10000/tonne earlier) and FY18E to | 9500/tonne (from | 11000/tonne earlier). Integrated domestic operations bode well in long run… The company has access to captive raw materials (100% integration for iron ore and ~35% integration for coking coal). This enables TSL to realise superior EBITDA margins compared to its domestic peers. Going forward, over the next couple of years, we expect Indian operations to clock an EBITDA/tonne of ~| 8000-10000/tonne, higher than its peers.
Exhibit 1: Domestic volumes to grow at CAGR of 12% in FY16-18E…
7.58.5 8.8
9.510.8
12.5
0
2
4
6
8
10
12
14
FY2013 FY2014 FY2015 FY2016 FY2017E FY2018E
milli
on to
nne
Source: Company, ICICIdirect.com Research
Exhibit 2: ..domestic EBITDA/tonne likely to inch up at ~| 8000-9500 /tonne levels over next couple of years
14855 15043
11433
7388 80009500
02000400060008000
100001200014000160001800020000
FY2013 FY2014 FY2015 FY2016 FY2017E FY2018E
|/to
nne
Source: Company, ICICIdirect.com Research
European operations sustain turnaround... Tata Steel Europe sold the Clydebridge and Dalzell plants in March 2016 to the Liberty Group, further in April 2016 the company sold the long products business to Greybull Capital for a nominal consideration. As a part of restructuring the UK operations the company shut the loss making operations and implemented several other cost saving initiative in order to improve the overall competitiveness. The restructuring initiatives undertaken resulted in a positive EBITDA in the Q1FY17 wherein the EBITDA/tonne turned positive to $50.6/tonne as against a negative EBITDA/tonne of $15, $31 and $11 in the preceding quarters of Q4FY16, Q3FY16 and Q2FY16 respectively. During Q2FY17, the company benefited from favourable market conditions in Europe and depreciation of the Sterling Pound (GBP) against the dollar post Brexit. The EBITDA/tonne for Q2FY17 came in at $67.2/tonne up 32.8% QoQ.
TSL India outshines domestic demand in FY15 & FY16
3.3
12.913.8
2.7
6.7
3.3
0.6
4.3
9.0
3.1
0.0
2.0
4.0
6.0
8.0
10.0
12.0
14.0
16.0
FY2012 FY2013 FY2014 FY2015 FY2016
%
Tata Steel India YoY Domestic Steel Demand YoY
Source: Company, ICICIdirect.com Research Note – For FY11, FY12 & FY15 Tata Steel Indian operations operated at ~89% , ~93% and ~94% capacity utilisation, respectively. Capacity constraints led to underperformance of volume growth of Tata Steel vis-à-vis domestic steel demand growth

ICICI Securities Ltd | Retail Equity Research Page 4
Exhibit 3: Trend in Tata Steel’s Europe’s volume…
13.113.9 13.7
13.0
10.0 10.0
5.0
7.0
9.0
11.0
13.0
15.0
FY2013 FY2014 FY2015 FY2016 FY2017E FY2018E
mill
ion
tonn
e
Source: Company, ICICIdirect.com Research
Exhibit 4: … TSE EBITDA/tonne to improve
11
36
50
60
80
-7-20
-10
0
10
20
30
40
50
60
70
80
90
FY2013 FY2014 FY2015 FY2016 FY2017E FY2018E
US$/
tonn
e
Source: Company, ICICIdirect.com Research
Expanding capacity at higher margin Indian operations augurs well Tata Steel is currently implementing a capacity expansion plan wherein it is augmenting its domestic capacity by 3 MT from 9.7 MT currently to 12.7 MT. Phased commissioning of facilities is ongoing at KPO. The new facility is likely to be fully operational in FY17. The new plant is being set up at Kalinganagar, Odisha and is within close proximity of the rich mineral belt. Expansion in the higher margin domestic business augurs well for the company as sales volumes from Indian operations would steadily increase in the overall volume mix.
Exhibit 5: Share of domestic sales volume in overall group sales
26.6
26.3
26.3
24.8 27.0
7.5 8.5
8.8 9.5
10.8
12.5
24.1
3132 33 36 44
46
0
5
10
15
20
25
30
FY2013 FY2014 FY2015 FY2016 FY2017E FY2018E
mill
ion
tonn
e
05101520253035404550
%
Tata Steel Group Tata Steel India
India's Proportion to Total sales
Source: Company, ICICIdirect.com Research
Exhibit 6: Consolidated EBITDA margin trend
9.2
6.5
10.7
13.811.1
9.0
0
4
8
12
16
FY2013 FY2014 FY2015 FY2016 FY2017E FY2018E
%
Tata Steel Group
Source: Company, ICICIdirect.com Research

ICICI Securities Ltd | Retail Equity Research Page 5
Debt to remain at elevated levels On a normalised basis, due to the ongoing capex, debt levels of consolidated operations are likely to stay at elevated levels in FY17E and FY18E. Exhibit 7: Net debt to stay at elevated levels
6607
4
7869
9
8070
1
8620
4
8860
4
8500
4
5621
5
7009
5
7195
2
7948
8
8102
5
7481
8
0
20000
40000
60000
80000
100000
FY2013 FY2014 FY2015 FY2016 FY2017E FY2018E
| cr
ore
Gross Debt Net Debt
Source: Company, ICICIdirect.com Research, Net debt is Gross Debt minus Cash
ICICI Securities Ltd | Retail Equity Research Page 6
Conference call highlights & other key developments Indian Operations • During the quarter, the finished steel demand in India increased by
7% YoY. The trade measures on Chinese imports have increased the export opportunities for India. The net steel imports steel imports fell by 76% Q-o-Q as India turned a net exporter in August 2016 after almost 36 months
• The company witnessed a seasonally weak quarter as strong monsoon impacted demand and the average realizations. During the quarter the prices of long products remained subdued due to seasonal slow-down and liquidity issues affecting construction players. The net sales realizations (NSR) for hot rolled coils (HRC) were down by ~| 1000-1200/tonne QoQ while the NSR form the long products were down by | 4000/tonne QoQ. During the quarter the overall NSR were down ~| 2700/tonne
• The management indicated that the demand picked up in September on account of seasonal recovery, also the surge in the coking coal prices triggered upward movement in the average realizations.
• During the quarter the domestic sales of the Indian operations grew 13% YoY, the branded sales increased by 9% YoY and 15% QoQ primarily due to higher sales in the top 3 brands - Tiscon, Astrum and Steelium
• The automotive sales were impacted by the hot strip mill and cold rolling mill shutdowns
• During the quarter, the Kalinganagar unit produced 1 MT of hot metal, the sales volume from the unit stood at 0.4 MT
• The Kalinganagar plant to be ramped up to its rated capacity in the time frame of 18 months. For FY17, the management guided volumes of 1.3 MT up from 1.0 MT previously
• The interest and depreciation cost from the Kalinganagar plant together would be around ~|200 crore each for the quarter going forward
European Operations • Growth of European steel-using sectors remained mixed. The
construction and machinery sectors continued to drag while the automotive sector fared better due to increased consumer spending. European steel demand grew by 2.6% in H1; however most of the additional demand has been taken up by imports
• The management indicated that the European strategy continues to be focused on developing differentiated products and services, Sales of differentiated products was 14% higher YoY
• The EBITDA was higher by £26 million QoQ, on account of favourable market conditions and depreciation of GBP against the dollar. The European operations also benefited from the operating efficiencies post restructuring
• European steel prices witnessed a double digit increase during the quarter, which resulted into improved spreads for the company
• The speciality steel business continues to be a drag on the profitability of the European operations
• Tata Steel continues to invest in upstream and downstream facilities to improve IJmuiden’s competitive capability while at Strip Products UK a new supply chain transformation programme to improve customer service was on stream during the quarter

ICICI Securities Ltd | Retail Equity Research Page 7
• Q3FY17 is production volumes are expected to be lower on account of summer maintenance stops, the management indicated Jan-June period to be stronger in terms of performance
• Tata Steel continues to explore the European consolidation strategy including a potential joint venture with ThyssenKrupp AG. The company indicated a separate process for potential sale of Speciality Steels business and two pipe mills was also ongoing
• The management indicated that the company continues to deeply engage with all relevant stakeholders to find a structural way forward for the pension scheme in UK
South East Asia • The business continues to be impacted by influx of low priced
Chinese imports and volatile spreads • Thailand witnessed relatively stable domestic demand for steel on
back drop of increased spending by Government on infrastructure projects
• At Nat Steel Holding the company continues to focus on the downstream products and export driven strategy.
• Malaysia imposed a safeguard duty of 13.9% on Wire Rods from Singapore; the potential loss is expected to be compensated through increase in Rebar export volume.
• The turnover of Tata Steel Thailand increased by 10% YoY on account of 14% increase in deliveries partly offset by drop in realizations. EBITDA increased by ~71% YoY aided by effective management of spreads.
ICICI Securities Ltd | Retail Equity Research Page 8
Other Updates • Tata Steel secured equity and debt investment in the Direct Shipping
Ore (DSO) project amounting to Canadian $175 million from the Government of Quebec, Canada resulting into dilution of shareholding of the company to 77.68% from 94% earlier
• The company incurred capex of | 1767 crore in the Indian operations while | 1430 crore towards improvement programmes in Europe. The management maintained the capex guidance for FY17, while it indicated that the FY18 capex would be lower for both India and other operations
• The management indicated that the decision on the Kalinganagar expansion for phase II will be taken post ramp up of phase-I. The company has capitalised capex amounting of ~| 22000 crore related to the Kalinganagar Phase I
• The company witnessed an increase in export volumes, wherein currently it is shipping ~2000 tonne on QoQ basis.
• The management indicated that the domestic steel prices for Q3FY17 to be higher by | 2000-2200/tonne compared to Q2
• The company is likely to see an impact of the increased coking coal prices in Q4FY17 and Q1FY18. The company has a captive source for coking coal of around 35%, while it imports the rest 65% of its requirement. The company procures coking coal based on index pricing, during the quarter the cost of the same stood at around $130-140 per tonne
• The management indicated that the company has no material repayments in FY17 as well as FY18
• The company raised | 10000 crore through a 10 year non convertible debentures in India
• The gross debt during the quarter decreased by | 1159 crore on the back of foreign currency fluctuations, however the net debt during the quarter increased by | 306 crore. The company’s liquidity stood strong at around | 17650 crore including cash & cash equivalent, current investments and un-drawn credit lines

ICICI Securities Ltd | Retail Equity Research Page 9
Key takeaways from annual report
• Chairman’s message clearly emphasise on supply side restructuring given the world is readjusting to lower commodity prices and slow growth, the supply side discipline remains crucial for future sustenance and viability of the industry as a whole. The consolidation of the industry is likely to be the key theme in geographies where the demand is likely to remain subdued in the near future
• The Indian operations continue to be the foundation of the group. The Jamshedpur facility achieved highest performance in terms of production and sales as well. The company received environmental clearance for the plant expansion to 11.0 MT crude steel
• Tata Steel successfully completed the first phase of 3 million tonne greenfield project at Kalinganagar; the board approved the commencement of commercial production, the facility is likely to achieve full capacity over next 18 months
• During the year, the European business faced significant challenges in form of cheap imports especially in the UK, a sharp drop in the market spread between steel prices and raw material prices and volatile currency markets. Several structural decisions were taken to turnaround the operations at UK business including disinvestment of the Long products business and restructuring the operations of the bar business and downstream operations. The company continues to explore all options including potential disinvestment to that of strategic partnership for whole or part of the business
• Tata Steel continues to intensely engage with all the stakeholders including the pension trustees, the unions and the relevant bodies in the government of UK and Welsh government to find a sustainable solution to the pension liabilities
• During the year the company incurred a capex of |11486 crore largely towards first phase of 3 million tonnes Greenfield Kalinganagar Project in Odisha
• In India the company plans to maintain its leadership position by means of cost competitiveness and operational excellence, having devised accelerated improvement programme –Shikhar-25. The programme is focused on achieving 25% EBITDA compared at market priced raw material in two or three years. On the other hand, TSE is undertaking a number of initiatives, including cost reduction measures, business specific improvement plans and securing access to cost effective raw materials, in order to maintain its ability to successfully compete in the long-term
• The Indian operations while maintaining the leadership position in the automotive and construction segments aims to explore new segments develop new products, scale up services and ramp up its revenue from B2C business. The European business consequently is pursuing its strategy of becoming a customer focused company with strong portfolio of differentiated products serving the European, US strip market further TSE aims to shift its product mix into higher value markets, particularly automotive

ICICI Securities Ltd | Retail Equity Research Page 10
Outlook and valuation Tata Steel reported a subdued set of Q2FY17 numbers, Going forward, we expect the EBITDA margins to take a hit on account of sharp increase in the coking coal prices (~65% of the coking coal requirement is met by imports). The cost dynamics are also likely to move in tandem with the growth in the volumes. Going forward, we have downward revised our EBITDA/tonne estimates for the Indian operations to | 8000/tonne for FY17E (| 10000/tonne earlier) and | 9500/tonne for FY18E (|11000/tonne earlier) while upward revised the same for the European operations to $60/tonne for FY17E ($40/tonne earlier) and $80/tonne for FY18E ($60/tonne earlier). We value the domestic operations at 6.5x FY18E EV/EBITDA and overseas operations at 5x FY18E EV/EBITDA. We have arrived at a target price of |375 and have a HOLD recommendation on the stock.
Exhibit 8: Target price calculation ( | Crore ) FY18E
Tata Steel India EBITDA FY18E (A) 11876
EV/EBITDA Multiple Assigned (B) 6.5
Tata Steel Europe & Other Subs EBITDA FY18E (C) 6078
EV/EBITDA Multiple Assigned (D) 5
Tata Steel Total EV (E = A*B + C*D) 107579
Tata Steel Gross Debt (F) 85004
Cash & Cash Eq (G) 10186
Minority Interest (H) 1861
Net Debt (I = F-G+H) 76678
Value of Invt (20% discount) (Tata Motors Shares+ Others, J) 5508
Implied Market Cap (K = E-I+J) 36408
No of Shares (L) 97.02
Target Price (K/L) 375
Source: Company, ICICIdirect.com Research
Exhibit 9: Valuation matrix Total Op. Income Growth EPS Growth PE EV/EBIDTA P/ BV RoNW RoCE
(| Crore) % YoY (|) % YoY (x) (x) (x) (%) (%)FY15 138318.9 -6.1 NM NM NM 8.6 1.1 0.0 5.8FY16 115951.7 -16.2 -23.1 NM NA 15.5 1.2 -7.3 2.1FY17E 126018.4 8.7 16.2 LP 23.0 8.7 1.2 5.0 7.0FY18E 127046.2 0.8 38.8 139.5 9.6 6.5 1.1 11.0 10.2
Source: Company, ICICIdirect.com Research
ICICI Securities Ltd | Retail Equity Research Page 11
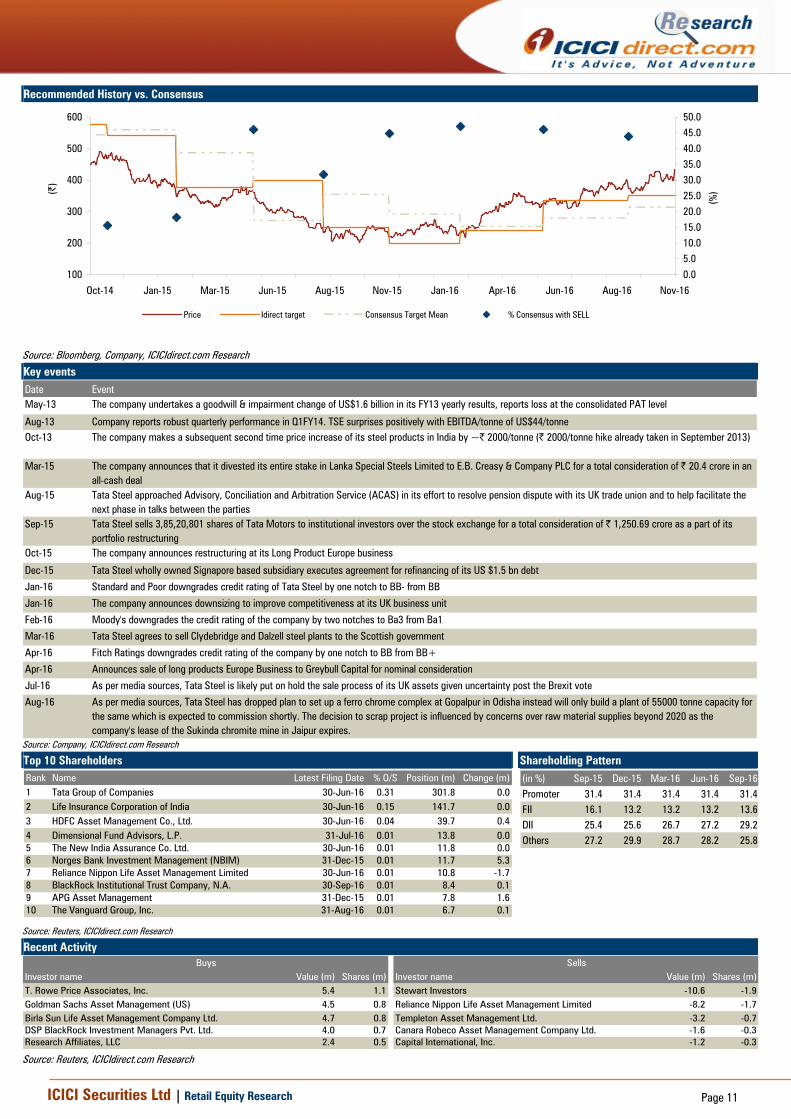
Recommended History vs. Consensus
100
200
300
400
500
600
Nov-16Aug-16Jun-16Apr-16Jan-16Nov-15Aug-15Jun-15Mar-15Jan-15Oct-14
(|)
0.05.010.015.020.025.030.035.040.045.050.0
(%)
Price Idirect target Consensus Target Mean % Consensus with SELL
Source: Bloomberg, Company, ICICIdirect.com Research
Key events Date EventMay-13 The company undertakes a goodwill & impairment change of US$1.6 billion in its FY13 yearly results, reports loss at the consolidated PAT level
Aug-13 Company reports robust quarterly performance in Q1FY14. TSE surprises positively with EBITDA/tonne of US$44/tonne Oct-13 The company makes a subsequent second time price increase of its steel products in India by ~| 2000/tonne (| 2000/tonne hike already taken in September 2013)
Mar-15 The company announces that it divested its entire stake in Lanka Special Steels Limited to E.B. Creasy & Company PLC for a total consideration of | 20.4 crore in an all-cash deal
Aug-15 Tata Steel approached Advisory, Conciliation and Arbitration Service (ACAS) in its effort to resolve pension dispute with its UK trade union and to help facilitate the next phase in talks between the parties
Sep-15 Tata Steel sells 3,85,20,801 shares of Tata Motors to institutional investors over the stock exchange for a total consideration of | 1,250.69 crore as a part of its portfolio restructuring
Oct-15 The company announces restructuring at its Long Product Europe business
Dec-15 Tata Steel wholly owned Signapore based subsidiary executes agreement for refinancing of its US $1.5 bn debt
Jan-16 Standard and Poor downgrades credit rating of Tata Steel by one notch to BB- from BB
Jan-16 The company announces downsizing to improve competitiveness at its UK business unit
Feb-16 Moody's downgrades the credit rating of the company by two notches to Ba3 from Ba1
Mar-16 Tata Steel agrees to sell Clydebridge and Dalzell steel plants to the Scottish government
Apr-16 Fitch Ratings downgrades credit rating of the company by one notch to BB from BB+
Apr-16 Announces sale of long products Europe Business to Greybull Capital for nominal consideration
Jul-16 As per media sources, Tata Steel is likely put on hold the sale process of its UK assets given uncertainty post the Brexit vote
Aug-16 As per media sources, Tata Steel has dropped plan to set up a ferro chrome complex at Gopalpur in Odisha instead will only build a plant of 55000 tonne capacity for the same which is expected to commission shortly. The decision to scrap project is influenced by concerns over raw material supplies beyond 2020 as the company's lease of the Sukinda chromite mine in Jaipur expires.
Source: Company, ICICIdirect.com Research
Top 10 Shareholders Shareholding Pattern Rank Name Latest Filing Date % O/S Position (m) Change (m)1 Tata Group of Companies 30-Jun-16 0.31 301.8 0.02 Life Insurance Corporation of India 30-Jun-16 0.15 141.7 0.03 HDFC Asset Management Co., Ltd. 30-Jun-16 0.04 39.7 0.44 Dimensional Fund Advisors, L.P. 31-Jul-16 0.01 13.8 0.05 The New India Assurance Co. Ltd. 30-Jun-16 0.01 11.8 0.06 Norges Bank Investment Management (NBIM) 31-Dec-15 0.01 11.7 5.37 Reliance Nippon Life Asset Management Limited 30-Jun-16 0.01 10.8 -1.78 BlackRock Institutional Trust Company, N.A. 30-Sep-16 0.01 8.4 0.19 APG Asset Management 31-Dec-15 0.01 7.8 1.610 The Vanguard Group, Inc. 31-Aug-16 0.01 6.7 0.1
(in %) Sep-15 Dec-15 Mar-16 Jun-16 Sep-16Promoter 31.4 31.4 31.4 31.4 31.4FII 16.1 13.2 13.2 13.2 13.6DII 25.4 25.6 26.7 27.2 29.2Others 27.2 29.9 28.7 28.2 25.8
Source: Reuters, ICICIdirect.com Research
Recent Activity
Investor name Value (m) Shares (m) Investor name Value (m) Shares (m)T. Rowe Price Associates, Inc. 5.4 1.1 Stewart Investors -10.6 -1.9Goldman Sachs Asset Management (US) 4.5 0.8 Reliance Nippon Life Asset Management Limited -8.2 -1.7Birla Sun Life Asset Management Company Ltd. 4.7 0.8 Templeton Asset Management Ltd. -3.2 -0.7DSP BlackRock Investment Managers Pvt. Ltd. 4.0 0.7 Canara Robeco Asset Management Company Ltd. -1.6 -0.3Research Affiliates, LLC 2.4 0.5 Capital International, Inc. -1.2 -0.3
Buys Sells
Source: Reuters, ICICIdirect.com Research

ICICI Securities Ltd | Retail Equity Research Page 12
Financial summary (Cons) Profit and loss statement (| crore) (Year-end March) FY15 FY16 FY17E FY18ENet Sales 138318.9 115951.7 123969.6 128673.9Other Operating Income 1184.8 1199.9 893.2 974.2Total Operating Income 139503.7 117151.6 124862.8 129648.2Growth (%) -6.1 -16.2 6.9 3.8Raw Material Expenses 55667.4 44816.1 52217.6 52096.3Employee Expenses 21414.8 19966.8 15403.9 14972.1Purchase of Power 5913.3 5433.6 6375.5 7082.5Other expenses 43972.5 39349.4 37475.6 37544.5Total Operating Expenditure 126968.0 109565.9 111472.5 111695.4EBITDA 12535.8 7585.6 13390.3 17952.8Growth (%) -23.6 -39.5 76.5 34.1Depreciation 5943.6 5081.8 6403.7 7254.9Interest 4847.8 4128.6 5507.5 5471.5Other Income 796.2 3925.7 837.1 1281.9PBT 2540.6 2300.8 2316.2 6508.3Exceptional Item -3928.7 -3974.9 0.0 0.0Total Tax 2567.4 1505.0 1630.3 2975.4PAT -3955.5 -3179.0 685.9 3532.9Growth (%) PL LP -121.6 415.0Minorities, Associates etc 30.0 129.7 116.7 105.0Rep PAT after Assoc., MI -3925.5 -3049.3 802.7 3637.9Adj PAT after Assoc., MI 3.1 -2243.2 802.7 3637.9Growth (%) NM NM -135.8 353.2Adj EPS (|) NM -23.1 8.3 37.5
Source: Company, ICICIdirect.com Research
Cash flow statement (| crore) (Year-end March) FY15 FY16 FY17E FY18EProfit after Tax -3925.5 -3049.3 802.7 3637.9Add: Depreciation 5943.6 5081.8 6403.7 7254.9(Inc)/dec in Current Assets 6237.0 -3635.8 -4691.4 4427.3Inc/(dec) in CL and Prov. -3935.3 1701.3 5758.4 -2292.9Others -1549.2 20.4 0.0 0.0CF from operating activities 2770.6 118.4 8273.3 13027.2(Inc)/dec in Investments 1638.4 -3345.6 0.0 0.0(Inc)/dec in Fixed Assets -3333.9 -4128.3 -9000.0 -6000.0Others -33.9 -49.6 98.0 88.2CF from investing activities -1729.3 -7523.5 -8902.0 -5911.8Issue/(Buy back) of Equity -1.2 0.0 0.0 0.0Inc/(dec) in loan funds 2002.0 5503.0 2400.0 -3600.0Dividend paid & dividend tax -909.2 179.9 -908.1 -908.1Inc/(dec) in Share Cap -4347.8 0.0 0.0 0.0Others 2359.3 -311.0 0.0 0.0CF from financing activities -896.9 5371.9 1491.9 -4508.1Net Cash flow 144.3 -2033.1 863.2 2607.3Opening Cash 8604.5 8748.8 6715.6 7578.9Closing Cash 8748.8 6715.6 7578.9 10186.1
Source: Company, ICICIdirect.com Research
Balance sheet (| crore) (Year-end March) FY15 FY16 FY17E FY18ELiabilitiesEquity Share Capital 970.2 970.2 970.2 970.2 Hybrid Perpetual securities 2,275.0 2,275.0 2,275.0 2,275.0 Reserve and Surplus 30378.0 27508.6 27403.1 30132.9Total Shareholders funds 33623.3 30753.9 30648.4 33378.2Total Debt 80701.0 86204.0 88604.0 85004.0Deferred Tax Liability 2884.5 2904.9 2904.9 2904.9Minority Interest & Others 1723.9 1674.2 1772.3 1860.5Total Liabilities 118932.6 121537.0 123929.5 123147.6AssetsGross Block 143717.0 177463.1 188463.1 198463.1Less: Impairment 7122.0 15692.0 15692.0 15692.0Less: Acc Depreciation 84500.7 89582.5 95986.2 103241.1Net Block 52094.3 72188.6 76784.9 79530.0CWIP 31276.6 10228.8 8228.8 4228.8Investments 3455.1 6800.6 6800.6 6800.6Goodwill on Consolidation 13407.5 13719.4 13719.4 13719.4Inventory 25149.9 20356.0 26466.4 24977.7Debtors 13309.9 11701.2 12227.1 12338.6Loans and Advances 9668.4 19688.7 17493.7 14343.7Other Current Assets 1811.2 1829.3 2079.3 2179.3Cash 8748.8 6715.6 7578.9 10186.1Total Current Assets 58688.1 60290.8 65845.4 64025.4Current Liabilities 28096.8 29197.3 35955.6 34662.7Provisions 11915.0 12515.8 11515.8 10515.8Current Liabilities & Prov 40011.8 41713.1 47471.4 45178.5Net Current Assets 18676.4 18577.7 18374.0 18846.9others 22.8 21.9 21.9 21.9Application of Funds 118932.6 121537.0 123929.5 123147.6
Source: Company, ICICIdirect.com Research
Key ratios (Year-end March) FY15 FY16 FY17E FY18E
Per share data (|)Adj EPS NM -23.1 8.3 37.5Cash EPS 61.3 29.3 74.3 112.3BV 346.5 317.0 315.9 344.0Adj BV (adj for Goodwill) 208.5 175.6 174.5 202.6DPS 8.0 8.0 8.0 8.0Cash Per Share 90.2 69.2 78.1 105.0Operating Ratios (%)EBITDA Margin 9.0 6.5 10.7 13.8PBT / Total Operating income 1.8 2.0 1.9 5.0Adj PAT Margin 0.0 -1.9 0.6 2.8Inventory days 171 185 185 175Debtor days 39 39 36 35Creditor days 212 261 225 250Return Ratios (%)Adj RoE 0.0 -7.3 2.6 10.9Adj RoCE 5.8 2.1 5.9 9.0RoIC 6.2 2.3 6.3 9.9Valuation Ratios (x)P/E NM NA 47.6 10.5EV / EBITDA 8.8 15.7 9.0 6.4EV / Net Sales 0.8 1.0 1.0 0.9Market Cap / Sales 0.3 0.3 0.3 0.3Price to Book Value 1.1 1.2 1.2 1.1Price to Adj Book Value 1.9 2.2 2.3 1.9Solvency RatiosDebt/EBITDA 6.4 11.4 6.6 4.7Debt / Equity 2.4 2.8 2.9 2.5Current Ratio 1.5 1.4 1.4 1.4Quick Ratio 0.8 1.0 0.8 0.9
Source: Company, ICICIdirect.com Research

ICICI Securities Ltd | Retail Equity Research Page 9
ICICIdirect.com coverage universe (Metals & Mining) CMP M Cap
(|) TP (|) Rating (| Cr) FY16 FY17E FY18E FY16 FY17E FY18E FY16 FY17E FY18E FY16 FY17E FY18E FY16 FY17E FY18E
Coal India 305 340 Hold 192838 22.6 21.2 24.3 14.6 15.6 13.6 7.8 8.2 7.1 45.0 45.9 55.0 42.1 41.7 49.9
Hindalco Industries 175 165 Hold 36138 1.3 12.3 16.0 137.2 14.2 11.0 9.8 7.3 6.4 4.3 6.6 7.5 0.7 6.2 7.5
Hindustan Zinc 278 250 Hold 117645 19.3 20.2 22.7 14.2 13.6 12.1 12.2 9.7 8.0 21.6 23.3 23.9 21.8 20.3 20.5
JSW Steel 1646 1750 Hold 39796 57.2 145.8 160.2 NM 11.3 10.3 12.9 6.6 6.3 4.8 13.2 13.5 6.4 15.3 14.6
SAIL 54 56 Hold 22304 -10.0 -1.3 5.4 NA NA 9.9 NA 15.5 6.4 -7.9 1.5 6.7 -10.0 -1.4 5.9
Vedanta 220 205 Hold 65230 7.3 12.4 16.1 30.3 17.8 13.7 8.6 7.0 5.9 6.5 9.2 11.0 4.8 7.9 9.6
Tata Steel 412 425 Hold 40012 -23.1 16.2 38.8 NA 23.0 9.6 15.5 8.7 6.5 2.1 7.0 10.2 -7.3 5.0 11.0
ROCE(%)Company
EV/EBITDA (x)EPS (|) P/E (x) ROE(%)
Source: Company, ICICIdirect.com Research
ICICI Securities Ltd | Retail Equity Research Page 14
RATING RATIONALE ICICIdirect.com endeavours to provide objective opinions and recommendations. ICICIdirect.com assigns ratings to its stocks according to their notional target price vs. current market price and then categorises them as Strong Buy, Buy, Hold and Sell. The performance horizon is two years unless specified and the notional target price is defined as the analysts' valuation for a stock. Strong Buy: >15%/20% for large caps/midcaps, respectively, with high conviction; Buy: >10%/15% for large caps/midcaps, respectively; Hold: Up to +/-10%; Sell: -10% or more;
Pankaj Pandey Head – Research [email protected]
ICICIdirect.com Research Desk, ICICI Securities Limited, 1st Floor, Akruti Trade Centre, Road No 7, MIDC, Andheri (East) Mumbai – 400 093
ICICI Securities Ltd | Retail Equity Research Page 15
ANALYST CERTIFICATION We /I, Dewang Sanghavi, MBA (FIN) research analysts, authors and the names subscribed to this report, hereby certify that all of the views expressed in this research report accurately reflect our views about the subject issuer(s) or securities. We also certify that no part of our compensation was, is, or will be directly or indirectly related to the specific recommendation(s) or view(s) in this report.
Terms & conditions and other disclosures: ICICI Securities Limited (ICICI Securities) is a Sebi registered Research Analyst having registration no. INH000000990. ICICI Securities Limited (ICICI Securities) is a full-service, integrated investment banking and is, inter alia, engaged in the business of stock brokering and distribution of financial products. ICICI Securities is a wholly-owned subsidiary of ICICI Bank which is India’s largest private sector bank and has its various subsidiaries engaged in businesses of housing finance, asset management, life insurance, general insurance, venture capital fund management, etc. (“associates”), the details in respect of which are available on www.icicibank.com. ICICI Securities is one of the leading merchant bankers/ underwriters of securities and participate in virtually all securities trading markets in India. We and our associates might have investment banking and other business relationship with a significant percentage of companies covered by our Investment Research Department. ICICI Securities generally prohibits its analysts, persons reporting to analysts and their relatives from maintaining a financial interest in the securities or derivatives of any companies that the analysts cover. The information and opinions in this report have been prepared by ICICI Securities and are subject to change without any notice. The report and information contained herein is strictly confidential and meant solely for the selected recipient and may not be altered in any way, transmitted to, copied or distributed, in part or in whole, to any other person or to the media or reproduced in any form, without prior written consent of ICICI Securities. While we would endeavour to update the information herein on a reasonable basis, ICICI Securities is under no obligation to update or keep the information current. Also, there may be regulatory, compliance or other reasons that may prevent ICICI Securities from doing so. Non-rated securities indicate that rating on a particular security has been suspended temporarily and such suspension is in compliance with applicable regulations and/or ICICI Securities policies, in circumstances where ICICI Securities might be acting in an advisory capacity to this company, or in certain other circumstances. This report is based on information obtained from public sources and sources believed to be reliable, but no independent verification has been made nor is its accuracy or completeness guaranteed. This report and information herein is solely for informational purpose and shall not be used or considered as an offer document or solicitation of offer to buy or sell or subscribe for securities or other financial instruments. Though disseminated to all the customers simultaneously, not all customers may receive this report at the same time. ICICI Securities will not treat recipients as customers by virtue of their receiving this report. Nothing in this report constitutes investment, legal, accounting and tax advice or a representation that any investment or strategy is suitable or appropriate to your specific circumstances. The securities discussed and opinions expressed in this report may not be suitable for all investors, who must make their own investment decisions, based on their own investment objectives, financial positions and needs of specific recipient. This may not be taken in substitution for the exercise of independent judgment by any recipient. The recipient should independently evaluate the investment risks. The value and return on investment may vary because of changes in interest rates, foreign exchange rates or any other reason. ICICI Securities accepts no liabilities whatsoever for any loss or damage of any kind arising out of the use of this report. Past performance is not necessarily a guide to future performance. Investors are advised to see Risk Disclosure Document to understand the risks associated before investing in the securities markets. Actual results may differ materially from those set forth in projections. Forward-looking statements are not predictions and may be subject to change without notice. ICICI Securities or its associates might have managed or co-managed public offering of securities for the subject company or might have been mandated by the subject company for any other assignment in the past twelve months. ICICI Securities or its associates might have received any compensation from the companies mentioned in the report during the period preceding twelve months from the date of this report for services in respect of managing or co-managing public offerings, corporate finance, investment banking or merchant banking, brokerage services or other advisory service in a merger or specific transaction. ICICI Securities or its associates might have received any compensation for products or services other than investment banking or merchant banking or brokerage services from the companies mentioned in the report in the past twelve months. ICICI Securities encourages independence in research report preparation and strives to minimize conflict in preparation of research report. ICICI Securities or its analysts did not receive any compensation or other benefits from the companies mentioned in the report or third party in connection with preparation of the research report. Accordingly, neither ICICI Securities nor Research Analysts have any material conflict of interest at the time of publication of this report. It is confirmed that Dewang Sanghavi, MBA (FIN) research analysts of this report have not received any compensation from the companies mentioned in the report in the preceding twelve months. Compensation of our Research Analysts is not based on any specific merchant banking, investment banking or brokerage service transactions. ICICI Securities or its subsidiaries collectively or Research Analysts do not own 1% or more of the equity securities of the Company mentioned in the report as of the last day of the month preceding the publication of the research report. Since associates of ICICI Securities are engaged in various financial service businesses, they might have financial interests or beneficial ownership in various companies including the subject company/companies mentioned in this report. It is confirmed that Dewang Sanghavi, MBA (FIN) research analysts do not serve as an officer, director or employee of the companies mentioned in the report. ICICI Securities may have issued other reports that are inconsistent with and reach different conclusion from the information presented in this report. Neither the Research Analysts nor ICICI Securities have been engaged in market making activity for the companies mentioned in the report. We submit that no material disciplinary action has been taken on ICICI Securities by any Regulatory Authority impacting Equity Research Analysis activities. This report is not directed or intended for distribution to, or use by, any person or entity who is a citizen or resident of or located in any locality, state, country or other jurisdiction, where such distribution, publication, availability or use would be contrary to law, regulation or which would subject ICICI Securities and affiliates to any registration or licensing requirement within such jurisdiction. The securities described herein may or may not be eligible for sale in all jurisdictions or to certain category of investors. Persons in whose possession this document may come are required to inform themselves of and to observe such restriction.