teacher characteristics on student achievement
TRANSCRIPT

MARTIN SCHOOL OF PUBLIC POLICY AND ADMINISTRATION
Teacher Characteristics on Student Achievement
An Examination of High Schools in Ohio
Rockstroh, Angela H Capstone Project
Spring 2013

1
Table of Contents
Executive Summary 2
Introduction 3
Literature Review 5
Data Description 11
Model 14
Analysis and Results 15
Discussion 20
Limitations
Recommendations
Conclusion 23
References 25
2
Executive Summary
Teachers are the most important school-based factor in affecting student achievement
levels. Knowing what teacher characteristics influence student achievement and whether or not
schools in different locations have dissimilar student achievement levels will help administrators
prioritize who to hire, retain, and assign to classes. The purpose of this paper is to answer two
questions. The first question is whether teacher characteristics are related to student
achievement; the second is whether there are differences in student achievement based on school
location. A review of teacher quality, teacher incentives, teacher background, the ability of a
school to attract teachers, and differences in school location provides some background of the
relationship between teacher characteristics and student achievement.
I use data from the Ohio Department of Education (ODE) and the Census Bureau. All
data is collected at the school level. From this I develop two models. The first is a fixed effects
model that allows me to examine the relationship between teacher characteristics and student
achievement with a county fixed effect. The second model is similar to the first except I
substitute the country fixed effect variable for school location as an explanatory variable. The
location variable is sorted into three categories by county population, and defined as large,
medium and small. In both models the dependent variable is student achievement, which is
measured by the high school’s percentage-passing rate on the Ohio Graduation Test (OGT), a
standardized test administered to all potential graduates. I estimate each model five times, once
for each section of the OGT.
Based the on results of this analysis it appears that schools’ average levels of teacher
education, student-to-teacher ratio, and enrollment are related to student achievement. The
extent to which these variables affect student achievement is open to interpretation. Since the
study is conducted at the school level the evidence is only suggestive of individual student-to-
teacher relationships.
3
Introduction
Many variables affect student achievement. They include family life, community, diet,
involvement in extracurricular activities, and the school environment. Teachers, however, have a
direct responsibility to shape a student’s academic achievement, and are the most important
school-based factor in their education (e.g. Rockoff 2004; Rivkin, Hanushek and Kain 2005;
Aaronson, Barrow and Sander 2007). This is why it is important to examine which teacher
characteristics may be related to student achievement. Every school has a different mix of
teacher experience, education, teacher attendance, and student-teacher ratio, among other readily
available measures. Considering which teacher characteristics produce the best student
achievement at the school level can help the school in identifying unique ways to increase
student achievement with the teacher resources available to them.
Examining the relationship between teacher characteristics and student achievement at
the school-level allows me to look at the school and examine if there are certain teacher qualities
that increase the school’s overall student achievement. This is important for education
administrators because knowing what teacher characteristics influence student achievement will
help the school’s administration make adjustments in order to increase student achievement.
This does not necessarily mean that all students will benefit, but it will help identify teacher
characteristics that are correlated with increasing the school’s overall student achievement.
The location of a school is another factor that not only may help determine student
achievement, but the school’s access to teachers. Looking at the breakdown of schools by
location is beneficial because different areas have different community demographics, and are
attractive to different types of teachers. The case study “Defining Equity: Implementing the
Weighted Student Formulation in Chicago Public Schools,” (2006) discusses a budget overhaul
4
to the Chicago Public School System. The budget director of the Chicago Public School system
wanted to create an innovative budget scheme to balance out the funding inadequacies across
Chicago Public Schools. One reason for making this change was that teacher experience allowed
experienced teachers to select out of schools in underprivileged areas with less money, in favor
of teaching in a better-off school district with more money to pay. Knowing what teacher
characteristics influence student achievement is valuable to education policy makers in finding
unique ways to attract teachers with certain characteristics in order to increase student
achievement.
In this study I examine high schools in Ohio. I specifically look at a high school’s
average years of teaching experience, percentage of teachers with a master’s degree, average
teacher attendance, student to teacher ratio, and enrollment’s effects on a school’s percentage of
students passing the Ohio Graduation Test (OGT). All high schools in Ohio require each student
to pass all five sections of the OGT (reading, math, writing, social studies, science) before
graduation. In order to receive a passing, grade a student must answer at least 40% of the
questions correct in each section. A student can retake sections of the OGT multiple times as
long as they pass each section before graduation. I then examine if there are any differences in a
school’s OGT percentage-passing rates based on a high school’s location. I determine the
school’s location by large, medium, and small based on county population data.
I am interested both in the relationship between teacher characteristics and student
achievement and between school location and student achievement. Specifically, I ask:
Research Question One: Are the characteristics of schools’ teachers related to its passing
rates on the OGT?

5
Research Question Two: Is there a difference in student achievement based on a high
school’s location?
Literature Review
A substantial amount of research has been conducted on the relationship between
teachers and student achievement. The literature has identified several aspects that affect student
achievement: teacher quality, teacher incentives, background, the ability of a school to attract
teachers, and differences in school location.
The importance of teacher quality:
The article “Teacher Quality and Student Achievement: A Review of State Policy
Evidence” by Linda Darling-Hammond (1999), examined a fifty state survey on teacher policies,
case analyses, and the National Assessment of Educational Progress. It specifically looked at
teacher qualifications and how other school inputs are related to student achievement across all
fifty states. Darling-Hammond found that teacher quality relates to increased student
achievement, and that at the state level, teacher quality is more important than other factors such
as class size and overall school spending. Similar to my study, this article is conducted at a
higher level than the individual student teacher relationship. With these results researchers may
be able to make inferences about the individual student teacher relationship, but it is a much
weaker argument than if conducted on the individual level.
“How and Why Do Teacher Credentials Matter for Student Achievement” by Charles
Clotfelter, Ellen F. Ladd, and Jacob L. Vigor (2007a) collected administrative data from North
Carolina over a ten year period to explore questions involving the relationship between teacher
characteristics and student achievement. Clotfelter, et al. explain that the question is not
6
necessarily new, but since the focus is on one state they hope to find a stronger relationship.
Focusing solely on North Carolina the authors are able to examine the variables more closely and
control for more in the environment. They show that teacher characteristics and regular
licensure have positive effects on student achievement even more so in math scores in
comparison to reading. Again, teacher effects were more influential to student achievement than
class size or parent education.
“Teacher Credentials and Student Achievement in High School: A Cross-subject
Analysis with Student Fixed Effects” by Charles Clotfelter, Ellen F. Ladd, and Jacob L.
Vigor(2007b) uses data again from North Carolina but specifically looks at the effect of teacher
credentials on individual student achievement of high school students. This study found that
students with teachers who have a low licensure score, or no experience see 0.3 standard
deviations less in student achievement than those students with teachers who have more
experience and better licensure scores. As found in the previous two studies, having a strong
teacher is relatively better for a student than being in a classroom with five fewer students than
the average classroom.
These three studies show the effects of teacher characteristics on student outcomes. Not
that the other factors do not matter, but the degree to which teachers influence student
achievement, according to these three studies, appears to be greater than most other factors. All
three studies even at different examination levels show that teacher characteristics influence
student achievement whether it is at the individual level or higher.
Teacher incentives:
“The Impact of Individual Teachers on Student Achievement: Evidence from Panel Data”
by Jonah E. Rockoff (2004) used panel data to estimate the effects of teachers while controlling

7
for student and classroom variables. One of Rockoff’s findings was that teacher incentives (pay-
for-performance, individual based) have positive effects on student test scores. Rockoff suggests
raising teacher quality and incentives linked to student achievement would be beneficial to
increasing student achievement.
Dan Goldhaber’s article “The Mystery of Good Teaching” (2002) examines teacher
quality. He too finds, based on other scholarly articles, that teacher incentives and pay structure
need to be reevaluated so that there is more room for performance-based incentives. Harvard
University professor Richard Murnane and his colleagues (1991) write, “College graduates with
high test scores are less likely to take teaching jobs, employed teachers with high test score are
less likely to stay, and former teachers with high test scores are less likely to return.” Currently
teachers are paid according to their experience, which leaves no room for rewards for increased
student achievement. Based on his findings, Goldhaber believes performance-based incentives
will not only increase student achievement but attract more motivated and intelligent teacher
candidates.
Both articles are important when analyzing the effects of teacher experience on student
achievement. If experienced teachers were more successful in influencing student achievement
then increasing their pay based on experience would correlate to their performance.
Teacher educational background:
“Teacher Training, Teacher Quality and Student Achievement” by Douglas N. Harris and
Tim R. Sass (2007) conducted a pre test-post test analysis of the effects of teacher training on the
effects of student achievement based on standardized tests. They found no evidence that
scholastic or undergraduate aptitude affects a teacher’s ability to increase student achievement.
Teacher experience on the other hand had some effect on student achievement. They suggest

8
that there should be more research conducted on certification programs because there is no
difference in student achievement outcome between education majors and non-education majors.
The article “How Teacher Education Matters” (2000) looks at teacher preparation and
training. It found that greater skills in actual teaching, not just subject matter, and greater
exposure to on the job teacher training creates more confident and successful teachers.
Therefore teachers who participate in more course work on teaching and learning are more likely
to stay in the field of teaching.
Teacher retention and school attraction:
“Effective Schools: Teacher Hiring, Assignment, Development, and Retention” by
Susanna Loeb, Demetra Kalogrides, and Tara Beteille (2012) examines school effectiveness in
relation to the school’s hiring process, how a school assigns new teachers to students, and how a
school retains teachers. The authors found more effective schools are better at attracting more
effective teachers. Teachers who work in schools that recently raised student achievement are
more likely to raise student achievement scores again, the following school year, than teachers in
less effective schools. They also found that effective schools are better at attracting effective
teachers from other schools.
This study influenced the second part of my research question, is there a difference in
teacher characteristics and school effectiveness based on a school’s location? If more
experienced teachers have a positive effect on student achievement, and not all schools have the
same ability to attract effective teachers, then some students would be disadvantaged from the
start based on the area they attend school.

9
Differences School Location:
“Self-Efficacy as a Determinant of Career Maturity in Urban and Rural High School
Seniors” by Shawn Anderson and Chris Brown (1997) examined self-efficacy and career
maturity in 94 high school seniors (51urban and 43 rural). Although the sample size is small it
allows for a closer examination of the individual students, a greater sample size would make the
results more valid and generalizable to other students. They measured career maturity by the
Career Development Inventory School Form, and measured career decision-making self-efficacy
using the Career Decision-Making Self-Efficacy Scale. They found that having a career
development attitude was significant in predicting self-efficacy in both urban and rural students,
but career development was significantly higher in rural students in comparison to urban
students. This study shows a difference in attitudes between urban and rural students.
“Academic Achievement of Rural School Students: A multi-Year Comparison with Their
Peers in Suburban and Urban Schools” by Xitao Fan and Michael J. Chen (1998) examines
school achievement differences based on the schools’ urban, suburban, or rural location. They
examine data from the National Educational Longitudinal Study of 1998, specifically looking at
math, reading, science and social studies test scores of students between 8th and 12th grade.
They use Census data to determine whether or not a school is urban, suburban, or rural. They
found that rural students perform at the same level if not better than students in metropolitan
areas.
“Teacher Sorting and the Plight of Urban Schools: A Descriptive Analysis” by Hamilton
Lankford, Susanna Loeb, and James Wyckoff (2002) examines teacher and school qualities
across the state of New York. They specifically look at the movement of teachers across
schools, detect schools with the least-skilled teachers, and examine job matches between teachers

10
and schools at the beginning of a teacher’s career. They found that urban schools have lesser
qualified teachers, which correlates with low-income, low-achieving, non-white students. They
also found that salary difference hardly compensates for the difficulties of teaching in an urban
setting.
“Stress and Burnout in Rural and Urban Secondary School Teachers” by Millicent H.
Abel, and Joanne Sewell (1999) examined 51 urban and 46 rural secondary school teachers in
Georgia and North Carolina. They found that urban teachers had significantly more stress due to
poor working and staff conditions. Burnout in rural school teachers was predicted by poor
working conditions and time pressures. Burnout in urban school teachers was predicted by poor
working conditions and student misbehavior. The authors suggest designing separate stress
management programs for teachers based on school location, because in order to meet
educational goals the teachers must first be in a good state of mind.
This set of studies examines the many differences in teacher and student characteristics
based on a school’s location. The first study examines a difference in student attitude, and the
second study shows a difference in student achievement. The third and fourth studies examine
differences in teacher attitudes and selection based on a school’s location. This will be helpful in
my research when examining differences among schools’ location.
Drawing on the insights gained from my review of this literature, I investigate the
relationship between average teacher characteristics in a school and student achievement. I
consider the following measureable teacher characteristics: average years taught (experience),
average teacher attendance, proportion of teachers with a master’s degree, student to teacher
ratio, and enrollment on the high school’s percentage-passing rate for each portion of the OGT. I
study these relationships controlling for community variables such as the percent/proportion of
11
the population white, proportion below poverty, proportion college educated and median
household income. In order to examine if there is a difference in student achievement or teacher
characteristics based on a school’s location I sort the schools by overall county population into
three categories, large, medium, and small.
Data Description
I used three sets of data in my analysis. The first two data sets contain teacher and
student testing data from the Ohio Department of Education (ODE) both aggregated up to
school-level averages. The third data set contains demographic and population data from the
Census Bureau.
I first obtained the two sets of school-level data from the ODE website. I gathered data
for the five newest years available (2007-2011). The first school-level data I collected is the
School Rating Data. This data includes school location, enrollment, and percentage proficient in
math, reading, science, writing and social studies on the OGT. The second school-level data set I
collected from the ODE website is Teacher Information. This data set includes average teacher
attendance, average years of teacher experience, percent of teachers who have at least a master’s
degree, number of teachers and average teacher salary. Both sets of data are aggregated at the
school level. I only have access to the average years taught per high school, and the percentage-
passing rate of each section of the OGT of each high school.
For approximately 50 schools there were nonsensical values for attendance, salary, and or
experience. For example, some schools had experience indicators of an average 200 years of
experience. In these cases, I coded the values as missing data in the absence of any obvious
explanation. I then collapse the five years of data by high school to adjust for multiple school
12
years. By collapsing the data I take the average of each variable from each high school from
2007-2011. This allows me to ask the question do schools with average levels of certain teacher
characteristics have different OGT percentage-passing rates. Although it is possible given the
data to study the relationship between changes in teacher characteristic and changes in OGT
scores over the same period there are not that many high schools that change significantly during
these five years. Therefore functionally I do not discard much information by collapsing the data
and examining it at one point in time in a cross section analysis.
Next, I obtain demographic and population data from the Census Bureau website. The
data is organized at the county level and contains proportion white, proportion black, proportion
hispanic, proportion female, proportion college graduates, proportion under 18 years old,
proportion foreign born, proportion below poverty, median income, median cost of house, and
proportion college educated. I use this data as fixed county level distinctions in order to cluster
high schools together that share the same county level data.
Last, using data from the Census Bureau that contains Ohio population by county, I sort
the counties into three categories based on population. If a county has a population of 300,000
or greater I consider it large. If a county has a population between 50,000 and 299,999 I
consider it medium and if a county has a population below 49,999 than I consider it small.

13
Table 1 below shows a description of the data used in my analysis assessed over the
estimation sample. Sample size is based on 823 observations with non-missing data on all
variables. There are slight changes in different observations of the individual models.
Table 1 Data Description:
Variables Observations Mean Standard Deviation
Variable Type
OGT Reading 823 84.56 12.47 Dependent
OGT Math 823 79.85 16.09 Dependent
OGT Writing 823 86.59 11.96 Dependent
OGT Social Studies 823 77.50 16.78 Dependent
OGT Science 823 72.27 19.04 Dependent Average years of teacher experience 823 13.52 4.27 Explanatory
Average teacher attendance 823 95.68 1.59 Explanatory
Percentage of teachers with a master's degree 823 55.90 16.30 Explanatory
Student teacher ratio 823 18.12 7.92 Explanatory
Large county 823 0.41 0.49 Explanatory
Small county 823 0.21 0.41 Explanatory
Enrollment 823 707.01 609.51 Control
Proportion White 823 0.83 0.12 Control Proportion of the population with a college degree
823 0.22 0.08 Control
Median house income 823 47522.02 7442.61 Control
Proportion below poverty 823 0.15 0.04 Control
14
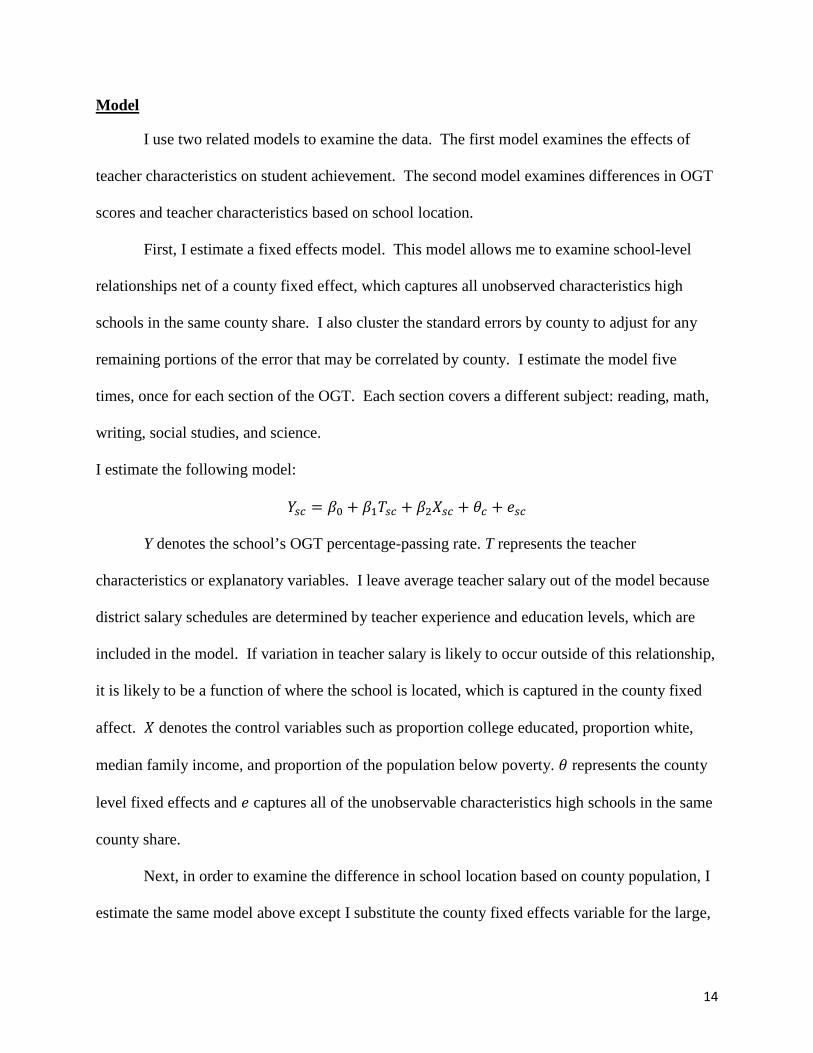
Model
I use two related models to examine the data. The first model examines the effects of
teacher characteristics on student achievement. The second model examines differences in OGT
scores and teacher characteristics based on school location.
First, I estimate a fixed effects model. This model allows me to examine school-level
relationships net of a county fixed effect, which captures all unobserved characteristics high
schools in the same county share. I also cluster the standard errors by county to adjust for any
remaining portions of the error that may be correlated by county. I estimate the model five
times, once for each section of the OGT. Each section covers a different subject: reading, math,
writing, social studies, and science.
I estimate the following model:
𝑌𝑠𝑐 = 𝛽0 + 𝛽1𝑇𝑠𝑐 + 𝛽2𝑋𝑠𝑐 + 𝜃𝑐 + 𝑒𝑠𝑐
Y denotes the school’s OGT percentage-passing rate. T represents the teacher
characteristics or explanatory variables. I leave average teacher salary out of the model because
district salary schedules are determined by teacher experience and education levels, which are
included in the model. If variation in teacher salary is likely to occur outside of this relationship,
it is likely to be a function of where the school is located, which is captured in the county fixed
affect. 𝑋 denotes the control variables such as proportion college educated, proportion white,
median family income, and proportion of the population below poverty. 𝜃 represents the county
level fixed effects and 𝑒 captures all of the unobservable characteristics high schools in the same
county share.
Next, in order to examine the difference in school location based on county population, I
estimate the same model above except I substitute the county fixed effects variable for the large,
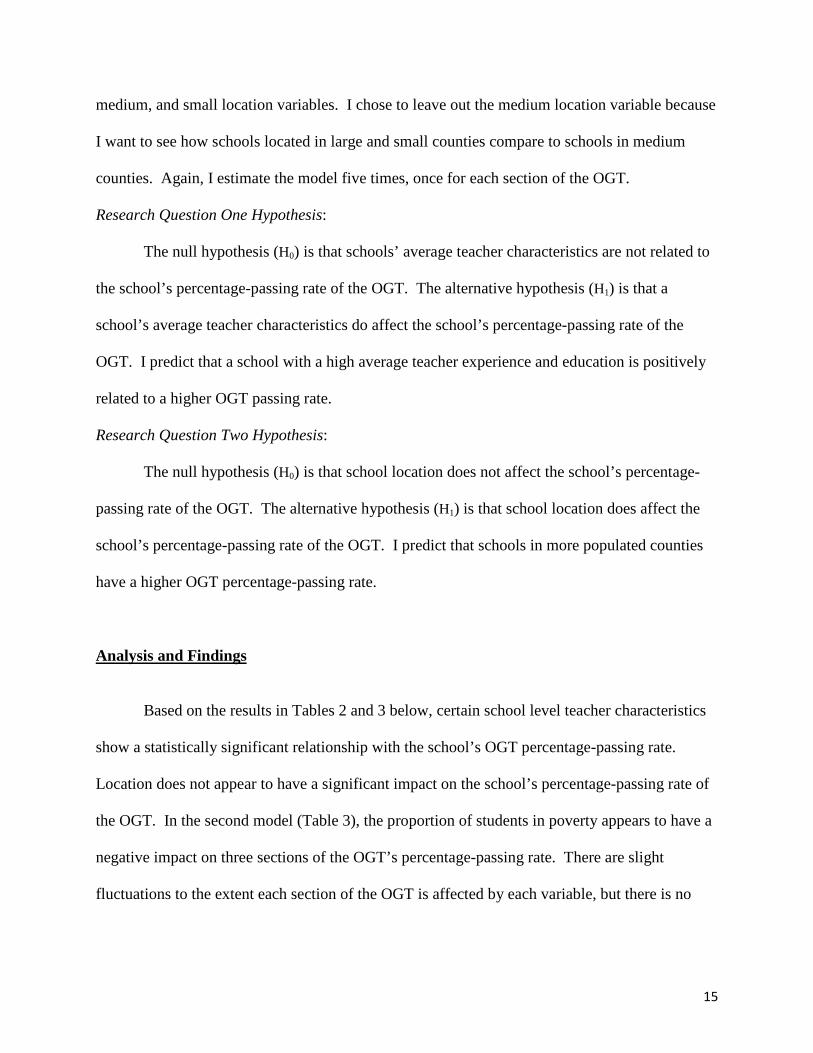
15
medium, and small location variables. I chose to leave out the medium location variable because
I want to see how schools located in large and small counties compare to schools in medium
counties. Again, I estimate the model five times, once for each section of the OGT.
Research Question One Hypothesis:
The null hypothesis (H0) is that schools’ average teacher characteristics are not related to
the school’s percentage-passing rate of the OGT. The alternative hypothesis (H1) is that a
school’s average teacher characteristics do affect the school’s percentage-passing rate of the
OGT. I predict that a school with a high average teacher experience and education is positively
related to a higher OGT passing rate.
Research Question Two Hypothesis:
The null hypothesis (H0) is that school location does not affect the school’s percentage-
passing rate of the OGT. The alternative hypothesis (H1) is that school location does affect the
school’s percentage-passing rate of the OGT. I predict that schools in more populated counties
have a higher OGT percentage-passing rate.
Analysis and Findings
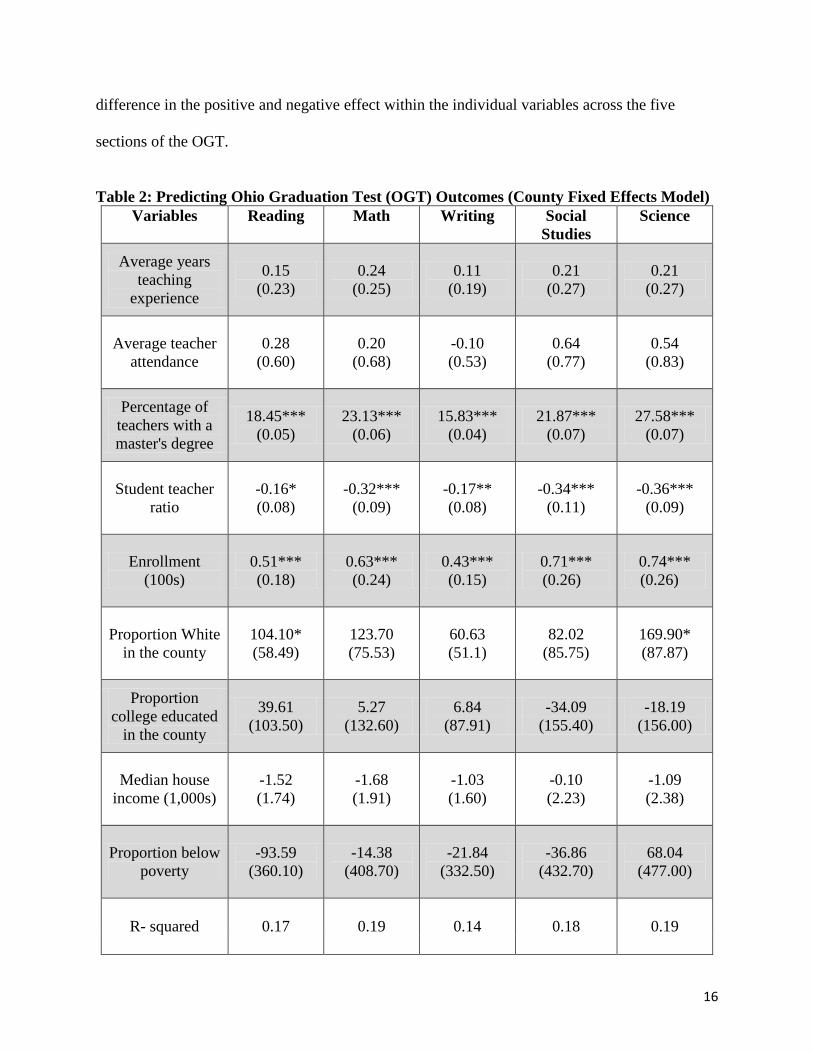
Based on the results in Tables 2 and 3 below, certain school level teacher characteristics
show a statistically significant relationship with the school’s OGT percentage-passing rate.
Location does not appear to have a significant impact on the school’s percentage-passing rate of
the OGT. In the second model (Table 3), the proportion of students in poverty appears to have a
negative impact on three sections of the OGT’s percentage-passing rate. There are slight
fluctuations to the extent each section of the OGT is affected by each variable, but there is no
16
difference in the positive and negative effect within the individual variables across the five
sections of the OGT.
Table 2: Predicting Ohio Graduation Test (OGT) Outcomes (County Fixed Effects Model)
Variables Reading Math Writing Social Studies
Science
Average years teaching
experience
0.15 (0.23)
0.24 (0.25)
0.11 (0.19)
0.21 (0.27)
0.21 (0.27)
Average teacher attendance
0.28 (0.60)
0.20 (0.68)
-0.10 (0.53)
0.64 (0.77)
0.54 (0.83)
Percentage of teachers with a master's degree
18.45*** (0.05)
23.13*** (0.06)
15.83*** (0.04)
21.87*** (0.07)
27.58*** (0.07)
Student teacher ratio
-0.16* (0.08)
-0.32*** (0.09)
-0.17** (0.08)
-0.34*** (0.11)
-0.36*** (0.09)
Enrollment (100s)
0.51*** (0.18)
0.63*** (0.24)
0.43*** (0.15)
0.71*** (0.26)
0.74*** (0.26)
Proportion White in the county
104.10* (58.49)
123.70 (75.53)
60.63 (51.1)
82.02 (85.75)
169.90* (87.87)
Proportion college educated
in the county
39.61 (103.50)
5.27 (132.60)
6.84 (87.91)
-34.09 (155.40)
-18.19 (156.00)
Median house income (1,000s)
-1.52 (1.74)
-1.68 (1.91)
-1.03 (1.60)
-0.10 (2.23)
-1.09 (2.38)
Proportion below poverty
-93.59 (360.10)
-14.38 (408.70)
-21.84 (332.50)
-36.86 (432.70)
68.04 (477.00)
R- squared 0.17 0.19 0.14 0.18 0.19
17
Variables Reading Math Writing Social Studies
Science
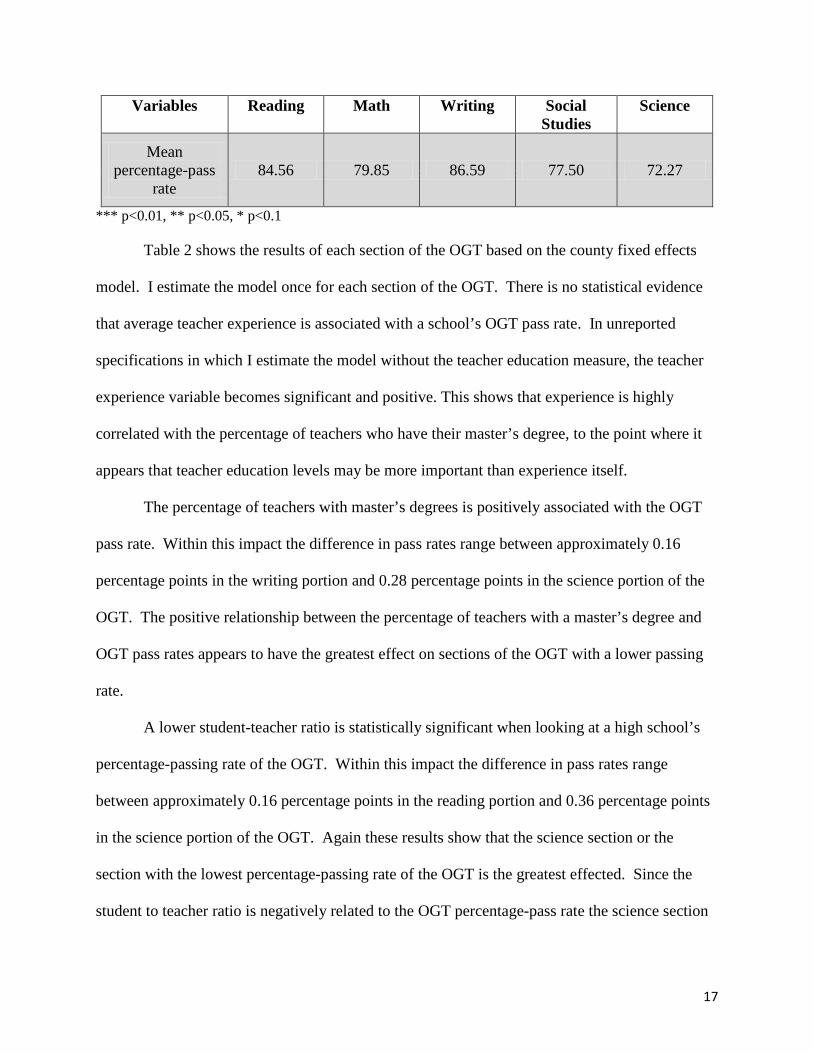
Mean percentage-pass
rate 84.56 79.85 86.59 77.50 72.27
*** p<0.01, ** p<0.05, * p<0.1
Table 2 shows the results of each section of the OGT based on the county fixed effects
model. I estimate the model once for each section of the OGT. There is no statistical evidence
that average teacher experience is associated with a school’s OGT pass rate. In unreported
specifications in which I estimate the model without the teacher education measure, the teacher
experience variable becomes significant and positive. This shows that experience is highly
correlated with the percentage of teachers who have their master’s degree, to the point where it
appears that teacher education levels may be more important than experience itself.
The percentage of teachers with master’s degrees is positively associated with the OGT
pass rate. Within this impact the difference in pass rates range between approximately 0.16
percentage points in the writing portion and 0.28 percentage points in the science portion of the
OGT. The positive relationship between the percentage of teachers with a master’s degree and
OGT pass rates appears to have the greatest effect on sections of the OGT with a lower passing
rate.
A lower student-teacher ratio is statistically significant when looking at a high school’s
percentage-passing rate of the OGT. Within this impact the difference in pass rates range
between approximately 0.16 percentage points in the reading portion and 0.36 percentage points
in the science portion of the OGT. Again these results show that the science section or the
section with the lowest percentage-passing rate of the OGT is the greatest effected. Since the
student to teacher ratio is negatively related to the OGT percentage-pass rate the science section
18
of the OGT is the most harmed by its increase, whereas when examining the effects of the
percentage of teachers with a master’s degree it was the most improved.
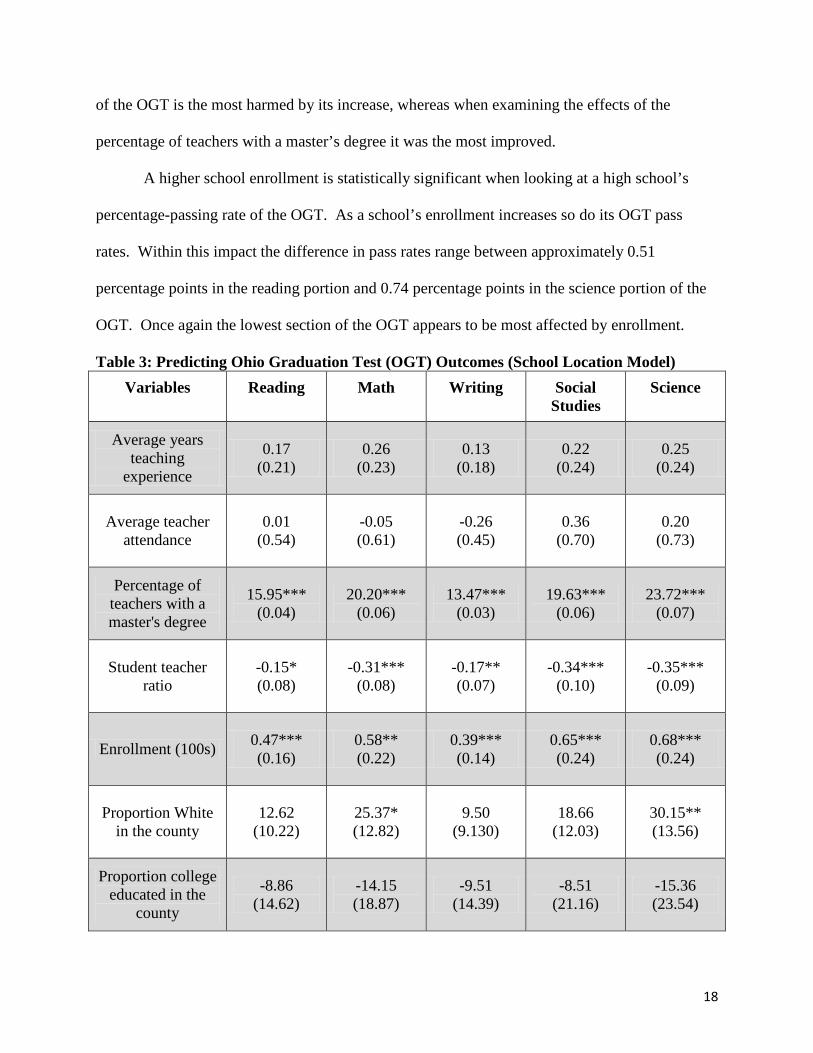
A higher school enrollment is statistically significant when looking at a high school’s
percentage-passing rate of the OGT. As a school’s enrollment increases so do its OGT pass
rates. Within this impact the difference in pass rates range between approximately 0.51
percentage points in the reading portion and 0.74 percentage points in the science portion of the
OGT. Once again the lowest section of the OGT appears to be most affected by enrollment.
Table 3: Predicting Ohio Graduation Test (OGT) Outcomes (School Location Model) Variables Reading Math Writing Social
Studies Science
Average years teaching
experience
0.17 (0.21)
0.26 (0.23)
0.13 (0.18)
0.22 (0.24)
0.25 (0.24)
Average teacher attendance
0.01 (0.54)
-0.05 (0.61)
-0.26 (0.45)
0.36 (0.70)
0.20 (0.73)
Percentage of teachers with a master's degree
15.95*** (0.04)
20.20*** (0.06)
13.47*** (0.03)
19.63*** (0.06)
23.72*** (0.07)
Student teacher ratio
-0.15* (0.08)
-0.31*** (0.08)
-0.17** (0.07)
-0.34*** (0.10)
-0.35*** (0.09)
Enrollment (100s) 0.47*** (0.16)
0.58** (0.22)
0.39*** (0.14)
0.65*** (0.24)
0.68*** (0.24)
Proportion White in the county
12.62 (10.22)
25.37* (12.82)
9.50 (9.130)
18.66 (12.03)
30.15** (13.56)
Proportion college educated in the
county
-8.86 (14.62)
-14.15 (18.87)
-9.51 (14.39)
-8.51 (21.16)
-15.36 (23.54)
19
Variables Reading Math Writing Social Studies
Science
Median house income (1,000s)
0.010
(0.16) 0.06
(0.21) 0.003
(0.15)
0.11 (0.23)
0.12 (0.25)
Proportion below poverty
-51.06** (24.38)
-63.27* (32.88)
-55.45** (24.68)
-48.30 (33.41)
-60.57 (39.08)
Large county -2.68 (1.96)
-2.68 (2.44)
-1.88 (1.03)
-3.42 (2.35)
-4.58* (2.39)
Small county -0.17 (1.14)
0.32 (1.55)
-0.24 (1.03)
1.09 (1.62)
21.50 (66.29)
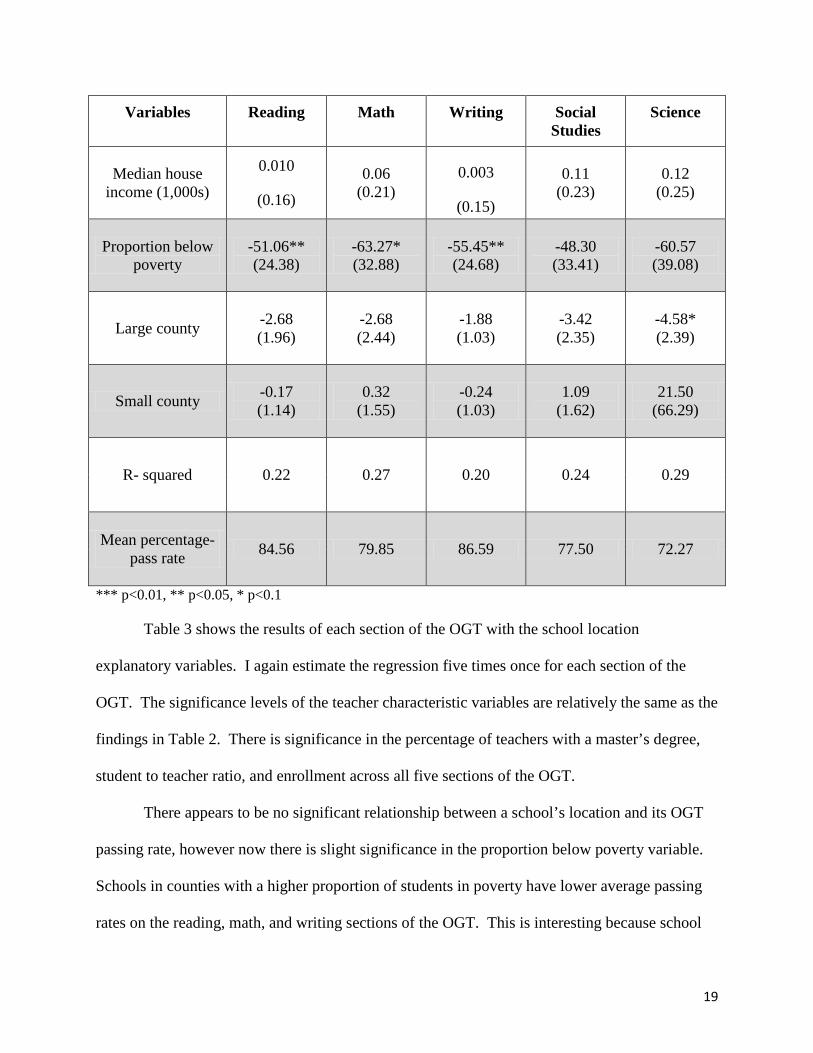
R- squared 0.22 0.27 0.20 0.24 0.29
Mean percentage-pass rate 84.56 79.85 86.59 77.50 72.27
*** p<0.01, ** p<0.05, * p<0.1
Table 3 shows the results of each section of the OGT with the school location
explanatory variables. I again estimate the regression five times once for each section of the
OGT. The significance levels of the teacher characteristic variables are relatively the same as the
findings in Table 2. There is significance in the percentage of teachers with a master’s degree,
student to teacher ratio, and enrollment across all five sections of the OGT.
There appears to be no significant relationship between a school’s location and its OGT
passing rate, however now there is slight significance in the proportion below poverty variable.
Schools in counties with a higher proportion of students in poverty have lower average passing
rates on the reading, math, and writing sections of the OGT. This is interesting because school
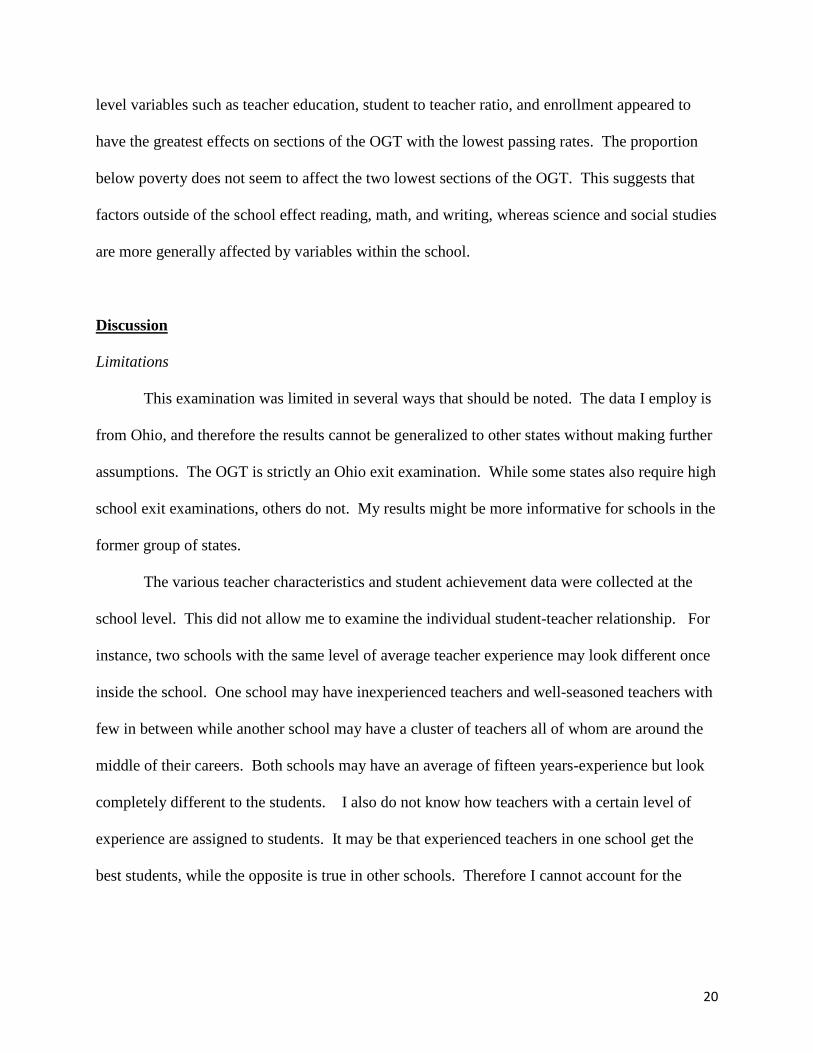
20
level variables such as teacher education, student to teacher ratio, and enrollment appeared to
have the greatest effects on sections of the OGT with the lowest passing rates. The proportion
below poverty does not seem to affect the two lowest sections of the OGT. This suggests that
factors outside of the school effect reading, math, and writing, whereas science and social studies
are more generally affected by variables within the school.
Discussion
Limitations
This examination was limited in several ways that should be noted. The data I employ is
from Ohio, and therefore the results cannot be generalized to other states without making further
assumptions. The OGT is strictly an Ohio exit examination. While some states also require high
school exit examinations, others do not. My results might be more informative for schools in the
former group of states.
The various teacher characteristics and student achievement data were collected at the
school level. This did not allow me to examine the individual student-teacher relationship. For
instance, two schools with the same level of average teacher experience may look different once
inside the school. One school may have inexperienced teachers and well-seasoned teachers with
few in between while another school may have a cluster of teachers all of whom are around the
middle of their careers. Both schools may have an average of fifteen years-experience but look
completely different to the students. I also do not know how teachers with a certain level of
experience are assigned to students. It may be that experienced teachers in one school get the
best students, while the opposite is true in other schools. Therefore I cannot account for the
21
direct relationship among teacher characteristics and student achievement because my data was
collected at the school level.
The way I sorted high schools into large, medium, and small location was based on
population at the county level and does not take into account demographic differences within the
county. While the first county fixed-effects model takes into account enrollment, which would
be highly correlated to the locale area surrounding the school within the county, the second
model does not. The second school location model assumes all highly populated counties are the
same. For instance Hamilton County is different from Warren County, but since they both have
populations over 300,000 they are treated the same.
Recommendations
My results only provide suggestive evidence that teacher characteristics of the school
matter to OGT passing rates. It appears that teacher education, and school characteristics like
student to teacher ratio and enrollment are predictive of OGT passing rates. Perhaps
administrators should prioritize a teacher’s education over experience, and examine school
composition such as student to teacher ratio and enrollment when they hire, retain, or assign
classes. For instance, a school’s student-teacher ratio is negatively related and enrollment is
positively related to the OGT percentage-passing rate. If a school’s enrollment increases without
an increase in teachers than enrollment would switch from positively affecting to negatively
affecting the OGT percentage-passing rate. This is something administrators should keep in
mind when school composition changes.
In the future it could be enlightening to expand this examination to other states that also
require high school exit examinations. The validity of this study would be greatly improved if
individual student and teacher data were collected. Knowing more about student achievement
22
and teachers at the individual level could help to better separate out different school level
average effects of teacher characteristics such as experience and attendance. There was no real
significance in a school’s percentage passing rate of the OGT based on whether or not a school
was located in a large, medium, or small county. As stated above in the limitations this may
have something to do with how I categorized the three location variables at the county level. It
may also be beneficial to narrow the definition of these three areas to better assess the potential
effect of location. If the examination is expanded, includes individual student and teacher level
data, and sorted into more narrowed categories of large, medium and small areas than the effects
of teacher characteristics on student achievement could be better evaluated.
As the student-teacher ratio increased, OGT percentage passing rates decreased. This
could provide evidence in favor of smaller class sizes to produce better student achievement
outcomes, but once again this examination is conducted at the school level, therefore a more
detailed look at class size would be beneficial to increase the validity this study.
Another factor in increasing the OGT percentage-passing rate is enrollment. As the
schools enrollment increases so does the OGT passing rate. The likely explanation is that the
percentage value of one student in a small school is much greater than the percentage value of a
student in a large school. For example in a school of a hundred students each student determines
1 percent of the school’s OGT percentage pass rate, while in larger school with five hundred
students, each student only accounts for 0.2 percent of the school’s OGT percentage pass rate.
The percentage of teachers with master’s degrees is positively associated with the OGT
pass rate. This could be used in support of the idea that the more formalized educational training
a teacher achieves the more successful student he or she produces. Once again I cannot say for
sure if this is the case, only that schools with a greater percentage of teachers with a master’s

23
degree produce a greater percentage of students who pass the OGT. Examining differences
between teachers with a master’s degree and those without would be beneficial in determining a
more specific effect on student achievement.
Conclusion
Based the on results of this examination it appears a school’s teacher education, student
to teacher ratio, and enrollment are related to student achievement. The extent to which these
variables affect student achievement is open to interpretation. Given that this study was
conducted at the school level I cannot make assumptions about the direct student teacher
relationship. Looking back at my research questions, some average teacher characteristics
appear to matter, but school location does not appear to be directly related to the OGT
percentage-passing rate.
Research Question One: Are the characteristics of schools’ teachers related to its passing
rates on the OGT?
The answer to my first research question is, yes. The fixed effects model rejected the null
hypothesis that a school’s average teacher characteristics do not affect the school’s percentage-
passing rate of the OGT. The results showed that there was no significance in teacher experience
or teacher attendance, but did prove to be significant in teacher education. I predicted that a
school with high average teacher experience and education would be positively related to a
higher OGT passing rate, but only teacher education appears to be significant. There was also
significance in the student teacher ratio, and enrollment variables.
24
Research Question Two: Is there a difference in student achievement based on a high
school’s location?
The answer to my second research question is, no. The second model failed to reject the
null hypothesis that school location does not affect the school’s percentage-passing rate of the
OGT. I predicted that schools in more populated counties would have a higher OGT percentage-
passing rate, but the results of my model did not show any significance based on the school’s
location.
25
Reference Page
Aaronson, D., Barrow, L., & Sander, W. (n.d.). Teachers and student achievement in the chicago public high schools. (2007). Journal of Labor Economics, 25(1), 95-135. Abel, M. H., & Sewell, J. (1999). Burnout in rural and urban secondary school teachers. Journal of Educational Research, 92(5), 287-293. Anderson, S., & Brown, C. (1997). Self-efficacy as a determinant of career maturity in urban and
rural high school seniors. Journal of Career Assessment, 5(3), 305-315. Boyd, D. J., Grossman, P. L., Lankford, H., Loeb, S., & Wycoff, J. (2009). Teacher
preparation and student achievement. Educational Evaluation and Policy Analysis.
Chen, M.J., Fan, X. (1998). Academic Achievement of Rural School Students: A Multi-Year
Comparison with Their Peers in Suburban and Urban Schools. Clotfelter, C. L., Ladd, H. F., & Vigdor, J. L. (2007). How and why do teachers
credentials matter for student achievement. Clotfelter, C. T., Ladd, H. F., & Vigdor, J. L. (2007). Teacher credentials and student
achievement in high school: A cross-subject analysis with student fixed effects. Darling-Hammond, L. (2000). How teacher education matters. Journal of Teacher
Education, 51(3), 166-173. Darling-Hammond, L. (1999). Teacher quality and student achievement: A review of
state policy evidence. Center for the Study of Teaching and Policy. Defining equity: Implementing the weighted student formula in Chicago public schools [case
study]. Seattle: The Electronic Hallway. Case teaching resources from the Evans school of public affairs. 2006.
Goldhaber, D. (2002). The mystery of good teaching. Education Next. Harris, D. N., & Sass, T. R. (2008). Teacher training, teacher quality, and student achievement. Lankford, H., Loeb, S., & Wyckoff, J. (2002). Teacher sorting and the plight of urban schools: A descriptive analysis. Educational Evaluation and Policy Analysis, 24(1), 37-62. Loeb, S., Kalogrides, D., & Béteille, T. (2012). Effective schools: Teacher hiring,
assignment, development, and retention. Staiger, D. O., & Rockoff, J. E. (2010). Searching for effective teachers with imperfect
information. Journal of Economic Perspectives, 24(3), 97-118.

26
Rivkin, S. G., Hanushek, E. A., & Kain, J. F. (n.d.). Teachers, schools, and academic achievement. (2005). Econometrica, 73(2), 417-458. Rockoff, J. E. (2004). The impact of individual teachers on student achievement: Evidence from panel data. The American Jouranl of Economic Review, 94(02), 247-252.

27