teacher effectiveness, student achievement, & national board
TRANSCRIPT

Teacher Effectiveness, Student Achievement,
& National Board Certified Teachers
A Comparison of National Board Certified Teachers and non-National Board Certified Teachers:
Is there a difference in teacher effectiveness and student achievement?
Prepared for the National Board for Professional Teaching Standards
Wendy McColskey, Ph.D. and James H. Stronge, Ph.D., Co- PIs Thomas J. Ward, Ph.D.
Pamela D. Tucker, Ed.D. Barbara Howard, Ed.D.
Karla Lewis, Ph.D. Jennifer L. Hindman, Ph.D.
June 2006

ii
TABLE OF CONTENTS LIST OF TABLES AND FIGURES vi EXECUTIVE SUMMARY viii ABOUT THE RESEARCH TEAM xi SECTION 1: CONTEXT OF THE PROJECT 1 Introduction 2 Background on National Board Certification 4 Growing Numbers of NBPTS Certified 6
Teachers What Has Been Learned about Board 7
Certified Teachers?
Project Overview 10 Phase I Overview 10 Phase II Overview 11 Planning and Assessment Practices 12
Quality of Typical Assignments 12 Teacher Sense of Efficacy 13 Classroom Observation Measures 13
and Ratings of Effectiveness Section 1 Endnotes 14 SECTION 2: METHODOLOGY 17
Districts 18 Sample Phase I: Sample Selection 19 Phase II: Sample Selection: Recruitment of 19 Classroom Teachers NBPTS Teacher Identification 20
and Invitation Process Identifying and Inviting Highly 21
Effective and Least Effective Teachers Based on Student
Achievement Results in Phase I
iii
Instrumentation 21
Phase I: Instrumentation: The Relationship 21 between National Board Certification and Student Achievement
Phase II: Instrumentation: Comparison of 22 Teaching Practices Between Three Groups of Teachers
Pre-instructional and Dispositional 23 Instruments
In-classroom Observations 25 Instruments
Teacher Effectiveness Instruments 28 Data Collection Procedures 28
Phase I: Method for Analyzing the Relationship 28 between National Board Certification and Student Achievement
Phase II: Comparison of Teaching Practices 30 Between Three Groups of Teachers
Observers 30 Selection and Training of 31
Interviewers Observation Procedure 31 Data Analysis 33
Phase I: Method for Analyzing the Relationship 33 Between National Board Certification and Student Achievement Phase II: Comparison of Teaching Practices 34
Between Three Groups of Teachers
Section 2 Endnotes 36 SECTION 3: RESULTS 38
Phase I: Methodology for Studying the Relationship 39 Between National Board Certification and Student Achievement
Establishment of the Initial Teacher Effectiveness 40 Prediction Models
Phase I Analysis:Teacher Effectiveness Indices 41

iv
Phase II: Comparison of Teaching Practices Between 49 Three Groups of Teachers
Demographics 49 Pre-instructional and Dispositional Variables 50 Analysis of In-classroom Variables 52 Teacher Effectiveness Based on Classroom Observations 55
Summary of Findings: Phase I 58 Summary of Findings: Phase II 58
Pre-instructional and Dispositional Variables 58 In-classroom Variables 59 Teacher Effectiveness Variables 59
SECTION 4: DISCUSSION OF FINDINGS 60 AND RECOMMENDATIONS Summary 61
Phase I: The Relationship between National Board 63 Certification and Academic Growth of Students
Summary of Findings 63 Discussion of Phase I Findings 64 Phase II: Comparison of Teaching Practices Between
Three Groups of Teachers 65 Summary of Findings 66
Pre-instructional and Dispositional 66 Variables In-classroom Variables 67 Teacher Effectiveness Variables 67 Discussion of Phase II Findings 67 Pre-instructional and Dispositional 68 Variables In-classroom Variables 70 Teacher Effectiveness Variables 71
Conclusions 73 Recommendations 75 Section 4 Endnotes 77

v
Appendix A: Instruments 78 Appendix B: Recruiting Letter to Participants 105 Appendix C: Training Guidelines for Observers 107 Appendix D: Written Instructions to Teachers for 115 Reading Comprehension Assignment Appendix E: Rubrics for Scoring Assignment Samples 118
vi
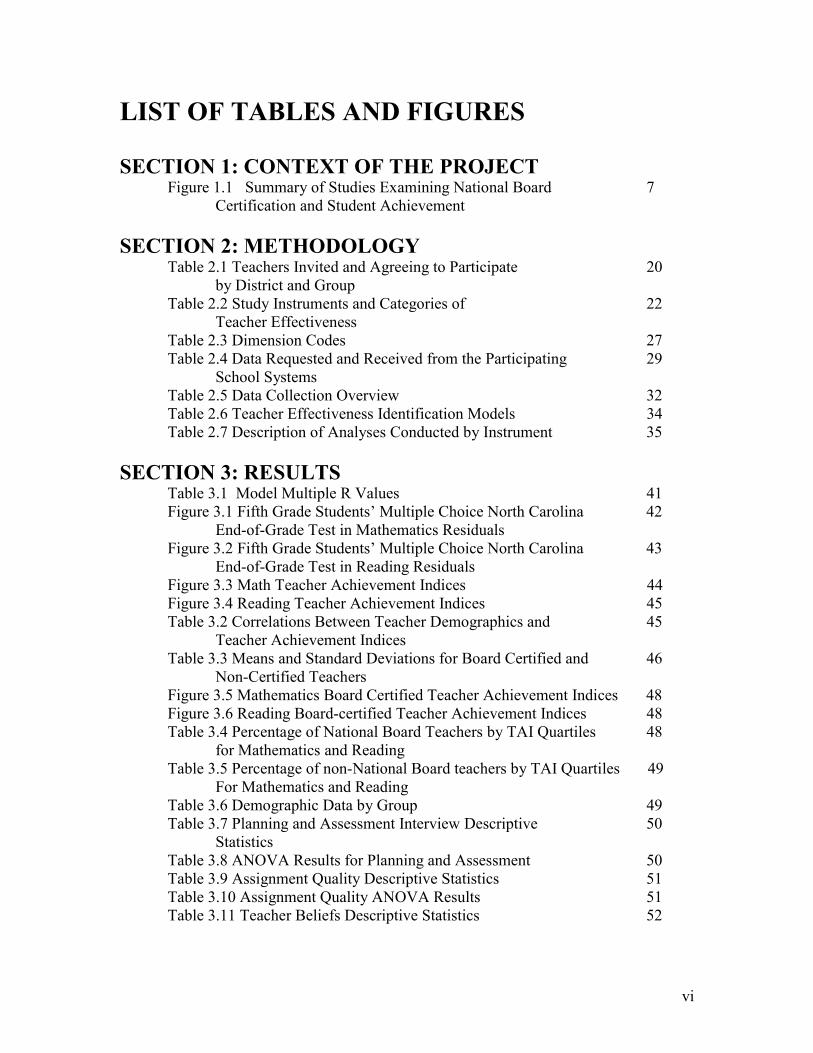
LIST OF TABLES AND FIGURES SECTION 1: CONTEXT OF THE PROJECT
Figure 1.1 Summary of Studies Examining National Board 7 Certification and Student Achievement
SECTION 2: METHODOLOGY Table 2.1 Teachers Invited and Agreeing to Participate 20
by District and Group Table 2.2 Study Instruments and Categories of 22
Teacher Effectiveness Table 2.3 Dimension Codes 27 Table 2.4 Data Requested and Received from the Participating 29
School Systems Table 2.5 Data Collection Overview 32 Table 2.6 Teacher Effectiveness Identification Models 34
Table 2.7 Description of Analyses Conducted by Instrument 35 SECTION 3: RESULTS
Table 3.1 Model Multiple R Values 41 Figure 3.1 Fifth Grade Students’ Multiple Choice North Carolina 42
End-of-Grade Test in Mathematics Residuals Figure 3.2 Fifth Grade Students’ Multiple Choice North Carolina 43
End-of-Grade Test in Reading Residuals Figure 3.3 Math Teacher Achievement Indices 44 Figure 3.4 Reading Teacher Achievement Indices 45 Table 3.2 Correlations Between Teacher Demographics and 45 Teacher Achievement Indices Table 3.3 Means and Standard Deviations for Board Certified and 46
Non-Certified Teachers Figure 3.5 Mathematics Board Certified Teacher Achievement Indices 48 Figure 3.6 Reading Board-certified Teacher Achievement Indices 48 Table 3.4 Percentage of National Board Teachers by TAI Quartiles 48
for Mathematics and Reading Table 3.5 Percentage of non-National Board teachers by TAI Quartiles 49 For Mathematics and Reading
Table 3.6 Demographic Data by Group 49 Table 3.7 Planning and Assessment Interview Descriptive 50
Statistics Table 3.8 ANOVA Results for Planning and Assessment 50 Table 3.9 Assignment Quality Descriptive Statistics 51 Table 3.10 Assignment Quality ANOVA Results 51 Table 3.11 Teacher Beliefs Descriptive Statistics 52

vii
Table 3.12 Mean Number of Questions Asked by Group 53 and Complexity
Table 3.13 Questioning Activity ANOVA Results 53 Table 3.14 Time on Task Observation Descriptive Statistics 54 Table 3.15 Time on Task ANOVA Results 54 Table 3.16 Management Strategy and Nature of Intervention 54
Descriptive Statistics Table 3.17 Management Strategy and Nature of Intervention 55
ANOVA Results Table 3.18 Teacher Effectiveness Observation Rating Descriptive 56
Statistics Table 3.19 Teacher Effectiveness Observation Rating 57
ANOVA Results SECTION 4: DISCUSSION OF FINDINGS AND RECOMMENDATIONS
Figure 4.1 Pre-instructional and Dispositional Variables from Interviews And Sample Assignments 70 Figure 4.2 In-Classroom Variables 71 Figure 4.3 Teacher Effectiveness Variables 73

viii
EXECUTIVE SUMMARY
The National Board for Professional Teaching Standards issued a request for research proposals in January 2002 to explore the usefulness and validity of its process of certifying teachers as highly accomplished. As a result of the request for proposals (RFP) process in 2002, the National Board funded 21 studies proposed by independent researchers to investigate various aspects of the certification process related specifically to student achievement. A team of researchers from SERVE at the University of North Carolina at Greensboro, the College of William and Mary, and the University of Virginia conducted the study described here. The researchers on this team had prior experience in developing and implementing teacher evaluation systems in various states, which is important as a context for thinking about different views of what constitutes teacher quality.
The first goal of this study was to explore the student achievement results of National Board certified 5th grade teachers in three North Carolina districts (for which we had access to longitudinal student achievement data tied directly to teachers responsible for teaching the students) as compared to other teachers in the districts (Phase I). The second goal was to compare National Board certified teachers’ actual teaching practices using observations, surveys, instructional artifacts, and interviews to that of two other groups of teachers who were identified based on an analysis of student achievement data (Phase II).
This report represents the product of this research endeavor. The report is organized into four major sections:
• Section 1 provides the context for the study, including background on National Board for Professional Teaching Standards certification and an overview of the two phases of the study.
• Section 2 describes the methods used for sample selection, instruments used in the study, data collection techniques and data analysis techniques including the approach to modeling student achievement data.
• Section 3 details the results of the research project including modeling student achievement data as an indicator for teacher effectiveness and results from comparisons among National Board certified teachers, teachers identified as highly effective, and teachers identified as least effective in terms of student achievement gains.
• Section 4 focuses on a summary and discussion of the findings from both phases. Recommendations are made based on the findings.

ix
In Phase I, statistical modeling was used to establish the achievement expectations for each student. Recognizing that a variety of factors influence student achievement, the statistical model controlled for some of the student and class inputs such as gender, ethnicity, free and reduced lunch status, attendance, school size, and percentage receiving English as a second language services. Using the outputs of the North Carolina End-of-Grade (EOG) tests in reading and mathematics for fourth and fifth grade, the model allowed researchers to make predictions of student performance, compare the predictions to actual student performance, standardize across the measures, and aggregate the findings at the teacher level. A central focus for the study was the comparison of NBCTs to non-Board certified teachers. Phase I findings showed no clear pattern of effects on student achievement based on whether the teacher was Board certified. The results at the teacher level using a Teacher Achievement Indice (TAI) showed no significant mean differences between fifth grade Board certified and non-Board certified teachers on the mathematics or reading TAIs. The Board certified teachers’ TAIs, however, fell in a narrower range than found in the distribution of all fifth grade teachers in the sample. Phase II, the second focus of the study, involved comparing NBCTs to highly effective and least effective teachers (as identified by their student achievement results operationalized in the Teacher Achievement Indice). It was difficult to get teachers to agree to participate in this aspect of the study and the sample sizes for the three groups of teachers were small, limiting the statistical power to detect differences between the three groups. In order to ensure a sufficient sample size for the National Board certified teacher group, both fourth and fifth grade Board certified teachers from four districts were invited to participate. Data on 51 teachers were collected through interviews, artifacts, surveys, and classroom observations.
• The variables assessed through teacher interviews, artifacts, and surveys were categorized as pre-instructional and dispositional variables.
• The low inference behavioral data collected in classroom
observations were categorized as in-class variables.
• The high inference observer ratings of teacher effectiveness on fifteen dimensions were called teacher effectiveness variables.
On analyses of pre-instructional and dispositional variables, findings were that a higher percentage of NBCTs reported taking Post-Masters

x
coursework. In addition, NBCTs when compared to the other two groups of teachers had a higher mean rating on their planning practices based on an interview, and a significantly higher mean rating of the cognitive challenge of a typical reading comprehension assignment used with their students. In terms of in-class variables, no differences were found among the three groups in terms of the cognitive demand of questioning or the management strategies teachers used or the numbers of disruptions or disengaged students. A higher mean number of visibly disengaged students was observed in the least effective teacher (low student achievement gain) group. In terms of the teacher effectiveness variables, statistically significant differences were found between the three groups on four of the fifteen rated dimensions: classroom management, classroom organization, positive relationships, and encouragement of responsibility. In all four cases, the non-Board certified upper gain score group of teachers scored highest on the dimension. NBCTs scored somewhere among the upper and lower gain score groups of teachers.
The report concludes with recommendations for further study to include: additional research into the relationship between National Board certification and student achievement, using value-added methodology to examine teacher effectiveness, and possibilities for infusing student outcome measures into the National Board for Professional Teaching certification process.

xi
ABOUT THE RESEARCH TEAM
This research project was managed by Co-Principal Investigators, Dr. Wendy McColskey and Dr. James H. Stronge. The research team included members from a regional educational lab and two institutions of higher education.
Jennifer L. Hindman, Ph.D. Dr. Hindman is a managing partner in Teacher Quality Resources, LLC in Williamsburg, Virginia. She recently co-authored Handbook for Qualities of Effective Teachers (Association for Supervision and Curriculum Development). Among her research interests are teacher effectiveness and teacher hiring and selection protocols. Her doctorate is from The College of William and Mary in Educational Policy, Planning, and Leadership.
Barbara Howard, Ed.D.
Dr. Howard is Project Director for Educator Assessment in the Educational Leadership Program at the SERVE Center for Continuous Improvement of the University of North Carolina at Greensboro. She chairs the Task Force for the revisions of the Personnel Evaluation Standards issued by the Joint Committee on Standards for Educational Evaluation. She serves on the Board of Directors of the Consortium for Research on Educational Accountability and Teacher Evaluation. As lead developer and project director of the SERVE model of teacher evaluation, Teacher Growth and Assessment, she has worked with numerous districts across several states in the implementation of formative and summative evaluation processes to improve teacher practices. The four districts in this study all implement the SERVE model of teacher evaluation. Dr. Howard received her doctorate in Educational Leadership from Appalachian State University in Boone, North Carolina.

xii
Karla C. Lewis, Ph.D. Dr. Lewis is a Research Specialist in the Assessment, Accountability, and Standards Program at the SERVE Center for Continuous Improvement at the University of North Carolina at Greensboro. She is the 2005 Program Co-Chair of the PreK-12 Educational Evaluation Topical Interest Group (TIG) of the American Evaluation Association. Her current work centers on high quality professional development in the southeast. Dr. Lewis received her doctorate in Educational Policy Studies from the University of Illinois at Urbana-Champaign followed by a two-year post-doctoral fellowship at Johns Hopkins University.
Wendy McColskey, Ph.D.
Dr. McColskey is the Director of the Assessment, Accountability, and Standards Program at the SERVE Center for Continuous Improvement at UNCG in Greensboro, North Carolina. The SERVE Center houses the Regional Educational Lab (REL) for the southeast funded by the U.S. Department of Education. Dr. McColskey has been leading research and development projects for the last 14 years at SERVE and has developed numerous SERVE publications dealing with teacher evaluation and student assessment. She has also published on these topics in external venues. She was instrumental in the development of a SERVE model of teacher evaluation originally constructed under a contract with the North Carolina Department of Public Instruction. Her doctorate is from The Ohio State University in Educational Evaluation and Assessment.
James H. Stronge, Ph.D.
Dr. James Stronge is Heritage Professor in the Educational Policy, Planning, and Leadership Area at the College of William and Mary in Williamsburg, Virginia. Among his primary research interests are: • Teacher effectiveness and student success and • Teacher and administrator performance evaluation. Relevant publications include books, Handbook on Teacher Evaluation: Assessing and Improving Performance (Eye on Education), Evaluating Professional Support Personnel in Education (Sage Publications), and Evaluating Teaching: A Guide to Current Thinking and Best Practice (Corwin Press). Most recently he has co-authored the book, Handbook for Qualities of Effective Teachers for the Association for Supervision and Curriculum Development. He also authored Qualities of Effective Teachers (ASCD). His doctorate is from the University of Alabama in Educational Administration and Planning.

xiii
Pamela Tucker, Ed.D. Dr. Tucker’s expertise is in the areas of teacher observation and instrument development. She is an associate professor of education in the Curry School of Education at the University of Virginia in Charlottesville, Virginia. She has worked with numerous school systems in the development of teacher evaluation systems. She is the co-author of Handbook on Teacher Evaluation: Assessing and Improving Performance (Eye on Education), Handbook for Qualities of Effective Teachers (Association for Supervision and Curriculum Development), Handbook on Teacher Portfolios for Evaluation and Professional Development (Eye on Education) and most recently, Linking Teacher Evaluation and Student Achievement (Association for Supervision and Curriculum Development) She served as a facilitator for the development of Virginia’s Guidelines for Uniform Performance Standards and Evaluation Criteria for Teachers, Administrators, and Superintendents. Dr. Tucker received her doctorate in Educational Policy, Planning, and Leadership from The College of William and Mary.
Thomas Ward, Ph.D.
Dr. Ward brought expertise in constructing teacher effectiveness indices through student achievement analyses. He led the application of the methodology to construct the effectiveness indices. He is Professor and Associate Dean in the School of Education at the College of William and Mary in Williamsburg, Virginia. Among his primary research interests are the use of data modeling for teaching and school improvement, the use of test data in decision-making, and at-risk program evaluation. His doctorate is from Pennsylvania State University in Educational Psychology.
We also wish to acknowledge the contributions of three reviewers: Dr. Rick Morgan from the Educational Research Methodology Program at the University of North Carolina at Greensboro, Dr. Lindsay Clare Matsumura of the Learning Research and Development Center at the University of Pittsburgh, and Dr. Linda Cavalluzzo of The CNA Corporation in Alexandria, VA.

1
SECTION 1
CONTEXT OF THE PROJECT

2
INTRODUCTION
The National Board for Professional Teaching Standards issued a request for research proposals in January 2002 to explore the usefulness and validity of its process of certifying teachers as highly accomplished. In a 2002 article in Education Week announcing the intent of the National Board to “put its process under the microscope,” it was clear that the degree to which National Board teachers are better than other teachers at raising student achievement was a central question for potential research studies.
Candidates for certification complete portfolios of their work over the course of the school year, submit videotapes of their instruction, and take a one-day exam covering subject-matter knowledge and teaching methods. What isn’t well-known, though, is whether teachers who go through that process are any better than other teachers at raising student achievement—a weak link that’s often noted by the board’s critics.1
As a result of the request for proposals (RFP) process in 2002, the National Board funded 21 studies proposed by independent researchers to investigate various aspects of the certification process related specifically to student achievement. A team of researchers from the SERVE Center at the University of North Carolina at Greensboro, the College of William and Mary, and the University of Virginia conducted the study described here. The researchers on this team had prior experience in developing and implementing teacher evaluation systems in various states, which is important as a context for thinking about different views of what constitutes teacher quality. There are various dimensions of teacher quality. Some might argue the primary aspect of teacher quality is content knowledge. Some might argue it is effective use of pedagogy. Others might argue teacher quality should be assessed only by student outcomes, regardless of pedagogy. Even within the “student outcomes as primary indicator” camp, however, arguments could be made for an emphasis on different types of student outcomes. Teacher quality can be gauged by short-term outcomes such as students’ performance on state tests at the end of the year.2 Long-term outcomes may be much more difficult to measure, but some might argue the best teachers are those who somehow improve students’ educational trajectories in some important ways. In other words, teacher quality is multi-dimensional and complex in nature, and can be measured in multiple ways.

3
The National Board for Professional Teaching Standards defines highly accomplished teaching in a particular way. Teachers who achieve National Board certification have been assessed in terms of their knowledge of content and pedagogy, use of high-quality instructional practices, assessment skills, reflection on their practice, and involvement in professional activities. The certification process, however, does not assess teachers in terms of their students’ achievement on state tests or other measures. At the time of National Board development in the late 1980’s, accountability systems were in their infancy in most states and certainly not on the national scene as they are today. The National Board certification process is demanding and rigorous for participants, requiring many hours beyond teaching to complete extensive reflection papers, document accomplishments, etc., and, as such, is often perceived as a positive professional development experience for teachers. Since the Board conducts the assessment process independently from states, schools, and districts, it has been valued as a strategy for externally defining and improving the quality of teaching. Financial incentives offered by states and districts to teachers who wish to pursue certification are a testament to its perceived value. School districts often look to the National Board certification process as a leading methodology for recognizing accomplished teaching practice in their organizations. Ongoing research on what National Board certified teachers look like in actual practice will continue to inform the debate about how to interpret the meaning of the certification designation, and the debate, more generally, about what constitutes quality teaching. The first goal of this study was to explore the student achievement results of National Board certified fifth-grade teachers in three North Carolina districts (for which we had access to longitudinal student achievement tied directly to teachers using district-level data) as compared to other teachers in the districts. The second goal was to compare National Board certified teachers’ actual teaching practices using observations, surveys, instructional artifacts, and interviews to that of two other groups of teachers who were identified based on an analysis of student achievement data. We expected to find differences in observed practice between the group of National Board certified teachers and a second group of teachers who had been identified as being in the bottom quartile of teachers in terms of their student achievement results. Furthermore, we expected to find similarities in observed practice between the National Board certified teachers and a third group of teachers who had been identified as being in the top quartile of teachers in terms of student achievement results. In this study, we specifically examined the following:

4
• Phase I: the relationship between National Board certification as a measure of teacher quality and the student achievement results of students, and
• Phase II: comparison of teaching practices between National Board certified teachers, teachers who produced high levels of student achievement, and teachers who produced low levels of student achievement.
Background on National Board Certification
In 1987, the National Board for Professional Teaching Standards (NBPTS) was founded with a three-fold mission:
• Advancing the quality of teaching and learning by maintaining high and rigorous standards for what accomplished teachers should know and be able to do,
• Providing a national voluntary system certifying teachers who meet these standards, and
• Advocating related education reforms to integrate National Board Certification in American education and to capitalize on the expertise of National Board Certified Teachers.3
The National Board focused its educational reform efforts on the teacher, believing that strengthening teaching was the most effective action the nation could take as it worked to improve student learning. In the early years of the NBPTS, a commonly held and expressed hope was that National Board certification would help create a nationwide group of teachers who could re-energize, motivate, and invigorate the teaching profession as a whole by setting a standard of excellence. It was expected that these teachers would be working across the country giving back to the profession as leaders and mentors in their schools.4 Two key components of this vision were as follows: (a) adoption of standards that represented accomplished teaching and (b) creation of a reliable and valid system of assessment. Between 1987 and 1992, the National Board focused on policy, research, and development, thus laying the foundation for National Board certification. The process of establishing standards and developing assessments took time and included prolonged debate and discussion about the best methods for accurately measuring authentic teaching and classroom performance and practices.5 The National Board relied on teacher leaders guided by national experts in education to define accomplished teaching, develop core propositions, and devise standards. Once standards were drafted and accepted by the Board, the development

5
of performance assessments followed. NBPTS has been committed to performance-based assessments, relying on teacher portfolios that include student work samples and reflective writing; classroom observations through videotapes submitted by the candidate; and writing tasks completed at an assessment center. During the period 1991–1996, the National Board worked with Assessment Development Laboratories (ADLs) who designed assessment cycles and Technical Analysis Groups (TAGs) who served as advisory groups of measurement specialists.6 Beginning in the 1996–1997 school year, the National Board centralized its assessment activities to one contractor, Educational Testing Service (ETS), standardizing the assessment process. At the same time, a uniform assessment structure was implemented across all certificate areas. In 1996, NBPTS established the assessment centers at Sylvan Learning Centers allowing teachers to submit four written responses to prompts electronically rather than handwriting up to six assessments and engaging in interviews at a central location at a standardized time and date. The assessment process also expanded to include subject matter specific prompts designed to determine the teacher’s level of content knowledge as well as his or her knowledge of pedagogy appropriate for students of specified developmental levels. The teacher portfolio continues to include work inside and outside the classroom, as well as written commentary by the teacher reflecting on practice, describing process, and analyzing progress. The National Board issued its initial policy statement in 1991. That statement, Toward High and Rigorous Standards for the Teaching Profession: Initial Policies and Perspectives of the National Board for Professional Teaching Standards, identified the following five core propositions:
• Teachers are committed to students and their learning. • Teachers know the subjects they teach and how to teach those
subjects to students. • Teachers are responsible for managing and monitoring student
learning. • Teachers think systematically about their practice and learn from
experience. • Teachers are members of learning communities.7
These five core propositions serve as a base upon which the National Board focused on designing content standards specific to each field of certification. The National Board established a framework of certification that included numerous fields, identified by the developmental age of the children and the subject matter taught.8

6
As of March 2005, The National Board had standards available for 24 certificate fields, including the following:
1. Early Childhood (ages 3–8)—Generalist 2. Early and Middle Childhood (ages 3–12)—Art, English as a
New Language, Literacy: Reading-Language Arts, Music, and Physical Education
3. Middle Childhood (ages 7–12) —Generalist 4. Early Adolescence (ages 11–15)—Generalist, English
Language Arts, Mathematics, Science, and Social Studies/ History
5. Early Childhood through Young Adulthood—Exceptional Needs Specialist (birth to 21+), School Counseling, and Library/ Media (ages 3–18+)
6. Early Adolescence through Young Adulthood (ages 11–18+)—Art, World Languages Other than English, Music, Physical Education, English as a New Language, and Career and Technical Education.
7. Adolescence and Young Adulthood Certificate (ages 14–18+)—English Language Arts, Mathematics, Science, and Social Studies/History.9
The National Board perceives its standards as evolving documents that change along with the teaching fields they address. The standards established by the National Board, therefore, are regularly reviewed and revised to ensure that they stay current.
Growing Numbers of NBPTS Certified Teachers
The NBPTS set a goal of 100,000 National Board certified teachers by 2006,10 with the idea that a critical mass of recognized accomplished teachers would improve national teacher performance and turn the occupation into a nationally recognized profession. Early on, the number of teachers applying for National Board certification was relatively small. In order to encourage more teachers to participate in the certification process, the National Board worked with school districts and states to create incentive programs to offset the $2,300 certification process fee11 and to supplement the salaries of successful teachers. The incentive programs have increased in popularity over the past decade. In 1994, only eight states had instituted incentive programs, but by 2002, 48 states offered fee reimbursements, salary bonuses, or other incentives.12 The incentive programs and the increasing publicity for National Board certification encouraged a growing number of candidates to apply for consideration and go through the process. By March 2005, the number of National Board certified teachers reached 40,205,13 and the numbers are

7
likely to continue to increase. Since 1995, when the first teachers were certified, over $300 million nationally has been spent to certify National Board certified teachers (NBCTs) and provide them with additional compensation.14 Strong state support for National Board certification exists in North Carolina (the setting for this study) where the state pays the $2,300 application fee and provides Board certified teachers with a 12% salary increase. Additionally, some school systems offer their own incentives to teachers.
What Has Been Learned About Board Certified Teachers?
School districts and states are relying increasingly on the National Board certification process as a primary means for recognizing accomplished practice, which has led to increasing scrutiny about the validity of the designation. Several studies have explored the student outcomes question. That is, what is the relationship between Board certification and student achievement, particularly as measured by state tests? The first four rows of Figure 1.1 below summarize the studies as described by Vandevoort, Amrein-Beardsley, and Berliner.15
Figure 1.1 Summary of Studies Examining National Board Certification and Student Achievement
STUDY SETTING/SAMPLE DESIGN FINDINGS Stone (2002)
Tennessee: 3rd – 8th grades in three subject areas
Examined teacher effect scores for 16 NBCTs in four subjects
“Of the 123 teacher by subject by year teacher effect scores he calculated, only 15% fit the criteria of exemplary” 16
Stephens (2003) South Carolina: 4th and 5th grade math
Matched NBCT’s to non-NBCT’s in two districts
“The scores of 154 students of NCBT’s were compared to scores of 669 students of non-NCBT’s and in 87% of the matched teacher comparisons, there was no significant difference between the achievement of the two groups of students.” 17
Goldhaber and Anthony (2004)
North Carolina: 3rd–5th grades in reading and math
Examined relationship between Board
“For the three years in which data were examined, the authors found that students of

8
certification status and pre and post student achievement
NCBTs significantly outperformed those of their non-NBCT counterparts. Advantages accruing to the students of NBCTs on the state test, compared to other teachers in the state, were modest, but consistent.”18
Vandervoort, Amrein-Beardsley, & Berliner (2004)
Arizona: 3rd– 6th grades in reading, math, and language
Compared student achievement in classrooms of 35 NBCTs with students from classrooms of non-certified peers in 14 districts
“In the 48 comparisons (four grades, four years of data, three measures of academic performance), using gain scores adjusted by students’ entering ability, the students in the classes of NBCTs surpassed students in the classrooms of non-Board certified teachers in almost three-quarters of the comparisons. Almost one-third of these differences were statistically significant.”19
Cavalluzzo (2004) Miami-Dade Public Schools: 9th and 10th grades in math
Compared student achievement of NBCTs with that of non-Board certified teachers
“The present study uses data from a large urban district to examine the association between student gains in mathematics in ninth and tenth grades, NBC, and other indicators of teacher quality. Based on a variety of different specifications and student subsamples, we find robust evidence that NBC is an effective indicator of teacher quality” (Abstract).

9
Cavalluzzo20 examined the achievement of 108,000 ninth- and tenth-graders in Miami-Dade Public Schools in Florida and found that students of teachers who successfully completed the National Board certification process made larger achievement gains on the Florida state test (FCAT) for mathematics than students of teachers who did not complete or were unsuccessful in the application process.21 The effect size was .12 (a fairly small effect) based on the end of course mathematics test student scores. This effect was reduced to .07-.08 if school factors were entered into the prediction model.22 The authors of the three large sample studies described above, specifically Goldhaber and Anthony, Vandervoort et al., and Cavalluzzo, each concluded that there is evidence from their studies that National Board certification is related to student achievement. For example, Cavalluzzo23 concluded: “The present study uses data from a large urban school district to examine the association between student gains in mathematics in the ninth and tenth grades, NBC, and other indicators of teacher quality. Based on a variety of different specifications and student subsamples, we find robust evidence that NBC is an effective indicator of teacher quality” (Abstract). Other studies, specifically those conducted by Stone (2002) and Stephens (2003) as described above, have not found as conclusive a relationship between certification and achievement. A review of the Stone study can be found at http://www.ecs.org/html/special/nbpts/PanelReport.htm. Results of the various studies of the relationship between National Board certification and student achievement on state tests have been criticized on methodological and statistical issues such as: small samples that lack statistical power; large samples that result in statistical significance but less convincing in terms of meaningful differences; not taking into consideration differences in student attributes that may correlate with assignment to NBCTs classrooms; and inaccurate links between student data and teacher assignment. Thus, ongoing research will continue to add to our understanding of this relationship between National Board certification and student achievement. This issue relates to the study reported here which examined the link between student achievement and National Board certification in three North Carolina districts at one grade level (fifth grade). Other researchers have examined the meaning of National Board certification by looking at teachers’ practice. For example, through a process using classroom observations, teacher interviews, and focused interviews with administrators and teaching colleagues, a case study of six NBCTs found variation in the quality of the NBCT with two each being deemed exemplary, average, and ineffective.24 Pool, Ellet, Schiavone, and Carey-Lewis25 found that the six NBCTs seemed to range from novice to

10
expert in terms of observed practices. Vandervoort et al.26 suggested that the Pool et al. study raises the issue of “false positives.” That is, there are likely to be some teachers who because they are highly articulate can engage easily in written discourse about their practice even if their teaching practice is not particularly effective and others who may be very effective teachers but have difficulty articulating what they do (i.e., false negatives). A study led by Bond et al.27 examined NBCTs using scales measuring 13 dimensions of attributes of excellent teachers. The dimensions reflected findings from an extensive review of relevant research and scholarly literature. This study compared a small group of certified teachers (n = 31) with those who attempted but did not achieve certification (n =34). Data on the 13 dimensions were collected through observations of teaching, questionnaires, artifacts, and interviews. The study concluded that NBCTs outperformed their non-certified peers on every one of the 13 measures with significant differences on 11 of them. Thus, NBCTs compared favorably, on average, to a group of non-successful applicants. In a similar vein, Phase II of this study compared a group of NBCTs to two other reference groups of teachers identified on the basis of high and low student achievement results.
Project Overview
Phase I Overview
Phase I of the study integrated a wide range of background variables to develop a statistical equation and indices to address the question below.
• What is the relationship between National Board certification as a measure of teacher quality and the achievement results of students?
The methodology for studying the relationship between National Board certification and student achievement began with modeling student achievement to obtain best fit estimates of teacher effectiveness. Regression models including two-level hierarchical linear modeling (HLM) and ordinary least squares (OLS) were tested as possible models. HLM has been proven to be an appropriate method to establish the achievement expectations for each student in the selected achievement areas and grades, and to develop teacher effectiveness indices that account for selected student demographic characteristics, class-level characteristics, and prior student achievement.28 With regression modeling, actual student achievement was compared to expected achievement estimates using the selected prediction model. Positive differences indicated achievement beyond expectation, zero differences indicated achievement commensurate with expectation, and negative

11
differences indicated achievement below expectation. The difference scores of students were then aggregated and averaged to develop a composite for each teacher. This composite served as the effectiveness indicator for the teacher within the achievement area. Analysis of the distribution of teacher composites (effectiveness indicators) allowed for the identification of the most effective and least effective teachers for Phase II of the study. A critical element in the application of this methodology was the availability of data to predict and condition achievement. Common data sets were available in North Carolina districts. The control variables were used at the individual, classroom, and school levels as previous research has shown that effectiveness estimates can be biased if individual and classroom level background influences are not eliminated. Research also has shown that multiple models of the data need to be estimated and examined for fit.29
Phase II Overview
Three groups of teachers were invited to participate in this part of the study to answer the question below.
• On what dimensions and in what ways do National Board certified teachers differ from the following groups of teachers: non-Board certified teachers identified as producing high student gain scores (highly effective/upper gain score group) and non-Board certified teachers identified as producing low student gain scores (least effective/lower gain score group)?
More specifically, differences between the three groups of teachers were examined on the following:
a. Planning and assessment practices as rated through interviews; b. Ratings of the quality of typical reading comprehension
assignments given to students using the CRESST Classroom Indicator methodology;
c. Self-reported measure of teacher’s sense of efficacy; d. Observational measures including:
• Level of questioning by both teachers and students (low, intermediate, and high cognitive demand questions) in the classrooms;
• Classroom management and intervention strategies used; • Measures of student behavior (e.g., student engagement and
disruptive behavior) observed in the classrooms; and e. Ratings on 15 dimensions of teacher effectiveness by trained
classroom observers.

12
a. Planning and Assessment Practices Planning practices are often overlooked as a substantive part of a teacher’s practice. Other than routine checks of written lesson plans by principals, it is often not as fully addressed as are other aspects of instructional practice. Yet it represents a cognizant effort on the part of the teacher to develop a coherent set of activities and assessments geared to best facilitate learning of curricular objectives.30 There is some evidence that the average teacher, perhaps because of the lack of extended time periods for significant planning, thinks of a unit of study as a loose collection of topics, interesting activities, or sections in the textbook rather than as carefully sequenced instructional plans geared toward ensuring student mastery of predetermined, essential outcomes.31 In contrast, exemplary teachers may plan in ways that produce more purposeful and coherently organized units than typical teachers. With the emphasis on reflection woven throughout the National Board standards, we were interested in exploring the differences in reported planning practices between the NBPTS certified teachers and the other two groups of teachers. Appropriate classroom assessment techniques and tools can help teachers plan or modify instruction, communicate important learning goals to students, and result in corrective feedback about how to improve. High-quality classroom assessment techniques have also been linked to higher student achievement. For example, Black and Wiliam32 concluded from their review of research studies on this topic that the introduction of formative assessment techniques helps low achievers more than other students and thus, can raise achievement overall by reducing the gap in performance between the high and low achievers. One aspect of formative assessment is the extent to which teachers use student assessment data to modify instruction to meet students’ needs. Because of the emerging importance of this aspect of a teacher’s practice for reducing the achievement gap in their classrooms, this study examined differences in teachers’ reported use of assessment data.
b. Quality of Typical Assignments The quality of assignments that teachers give students to do is one indication of the overall quality of learning opportunities they provide. Thus, collecting and scoring sample assignments from teachers was another way of looking at the teaching quality of National Board teachers. The National Center for Research in Evaluation, Standards and Student Testing (CRESST) has conducted research aimed at developing a method for investigating the quality of students’ learning environments based on

13
teachers’ assignments and student work.33 This research involved the collection of a number of different language arts assignments from teachers over the past four years, including “typical” writing and reading comprehension assignments, as well as “challenging” assignments. For each assignment submitted, teachers completed a one-page cover sheet describing their learning goals and assessment criteria. Teachers also submitted four samples of student work for each assignment—two of which they considered to be of high quality, and two of which they considered to be of medium quality. The CRESST research involved rating the assignments submitted on a 4-point scale (1 = poor to 4 = excellent) using the six dimensions of quality shown. For this study’s purposes, a typical assignment submitted by a teacher represented a window onto the quality of the opportunities to learn afforded students, and thus, a measure of teacher quality that could differentiate NBPTS teachers from the other groups of teachers. That is, “typical” reading comprehension assignments and cover sheets explaining the assignments were collected from the teachers in the study, and then rated using the CRESST scoring rubric.
c. Teacher Sense of Efficacy Teachers’ develop beliefs about their capability to make a difference in student learning and to teach all kinds of students. Teachers who are more successful with students should have stronger beliefs in their capabilities. Thus, differences between the three groups of teachers were explored using a Teacher Sense of Efficacy Scale developed by Tschannen-Moran & Hoy (2001). The scale has items that tap beliefs about instructional strategies, student engagement, and classroom management. d. Classroom Observational Measures and Ratings of Effectiveness National Board teachers have been certified as highly accomplished through a rigorous external assessment process. But, is this accomplished teaching observable to others? That is, are there some aspects of their teaching practice that distinguish them from others if observed? Classroom observations were central to exploring the differences between the three groups of teachers. Both high and low inference measures were used in a three-hour classroom observation of each teacher by two trained
CCRREESSSSTT DDIIMMEENNSSIIOONNSS OOFF QQUUAALLIITTYY CCOOGGNNIITTIIVVEE CCHHAALLLLEENNGGEE OOFF TTHHEE
TTAASSKK CCLLAARRIITTYY OOFF LLEEAARRNNIINNGG GGOOAALLSS CCLLAARRIITTYY OOFF GGRRAADDIINNGG CCRRIITTEERRIIAA AALLIIGGNNMMEENNTT OOFF GGOOAALLSS AANNDD
TTAASSKK AALLIIGGNNMMEENNTT OOFF GGOOAALLSS AANNDD
GGRRAADDIINNGG CCRRIITTEERRIIAA OOVVEERRAALLLL QQUUAALLIITTYY

14
observers. The low inference measures included counts of questions categorized as low, medium, and high cognitive demand; counts of students exhibiting disruptive behavior; and counts of teachers’ management strategies. The high inference measure was a Teacher Effectiveness rubric containing 15 dimensions with four descriptors for each dimension. The rubric was adapted from prior rubrics developed by SERVE in their Teacher Growth and Assessment system (teacher evaluation model currently used by 22 districts) and by Stronge, Tucker, and Ward for a prior study.34 The 15 dimensions represented four categories: Instructional Quality, Assessment Quality, Classroom Management, and Personal Qualities. Instructional quality was rated using six dimensions (Instructional Differentiation, Instructional Focus on Learning, Instructional Clarity, Instructional Complexity, Expectations for Student Learning, and Use of Technology). Assessment quality was rated using two dimensions (Assessment for Understanding and Quality of Verbal Feedback to Students). Classroom Management included two dimensions (Classroom Management and Classroom Organization). Personal Qualities included five dimensions (Caring, Fairness and Respect, Positive Relationships, Encouragement of Responsibility, and Enthusiasm). The study was conducted using North Carolina school districts. In Phase I, descriptive results from the development of Teacher Achievement Indices based on student achievement results are reported for 307 fifth-grade teachers in three districts (25 of whom were National Board certified). In Phase II, 51 fourth and fifth grade teachers from four districts, representing the three teacher groups of interest, participated in the interviews, survey, artifact collection, and classroom observations.
1 Archer, J. (2002, January 30). National Board is pressed to prove certified teachers make a difference. Education Week. Retrieved May 26, 2005, from http://www.edweek.org 2 Mendro, R. L. (1998). Student achievement and school and teacher accountability. Journal of Personnel Evaluation in Education, 12, 257–267.; Wright, S. P., Horn, S. P., & Sanders, W. L. (1997). Teacher and classroom context effects on student achievement: Implications for teacher evaluation. Journal of Personnel Evaluation in Education, 11, 57–67. 3 National Board for Professional Teaching Standards (NBPTS). (n.d.a). History and facts. Arlington, VA: Author. Retrieved March 5, 2004, from www.nbpts.org/about/hist.cfm 4 NBPTS n.d.a 5 Ibid. 6 Harman, A. E. (2001). National board for professional teaching standards’ national teacher certification.
Retrieved March 5, 2004, from www.ericfacility.net/extra/ericdigests/ ed460126.html (ERIC Document Reproduction Service No. ED460126)
15
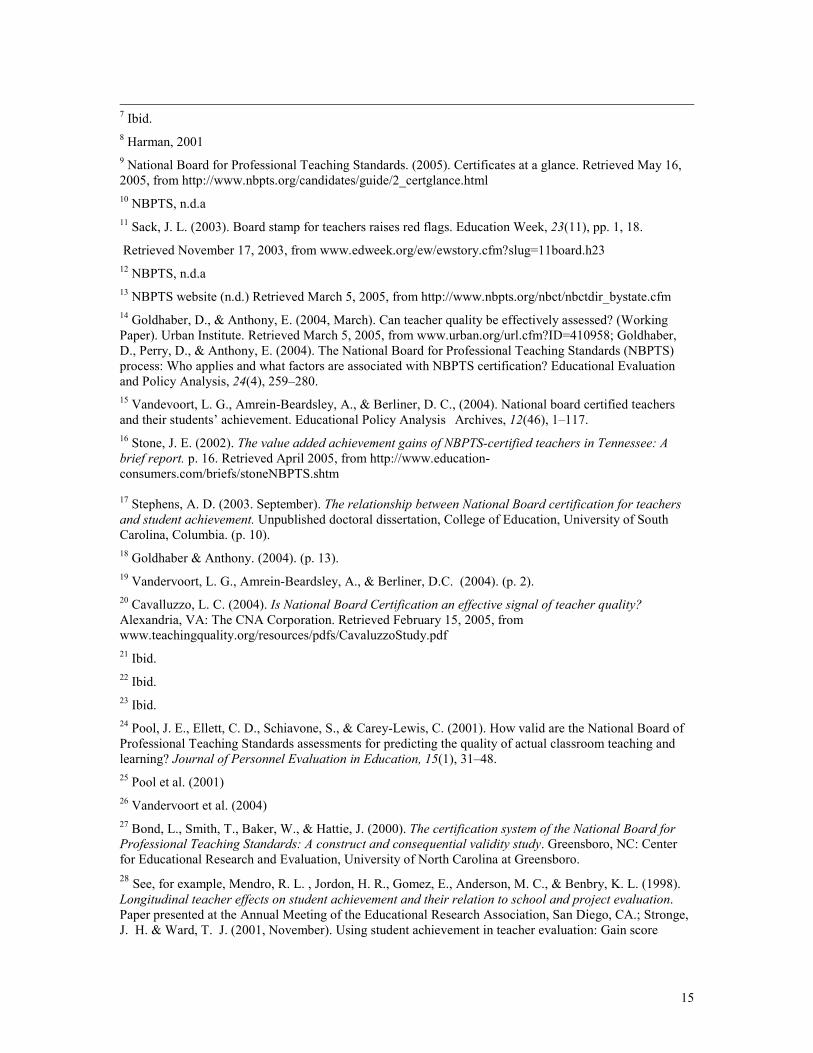
7 Ibid. 8 Harman, 2001 9 National Board for Professional Teaching Standards. (2005). Certificates at a glance. Retrieved May 16, 2005, from http://www.nbpts.org/candidates/guide/2_certglance.html 10 NBPTS, n.d.a 11 Sack, J. L. (2003). Board stamp for teachers raises red flags. Education Week, 23(11), pp. 1, 18.
Retrieved November 17, 2003, from www.edweek.org/ew/ewstory.cfm?slug=11board.h23 12 NBPTS, n.d.a 13 NBPTS website (n.d.) Retrieved March 5, 2005, from http://www.nbpts.org/nbct/nbctdir_bystate.cfm 14 Goldhaber, D., & Anthony, E. (2004, March). Can teacher quality be effectively assessed? (Working Paper). Urban Institute. Retrieved March 5, 2005, from www.urban.org/url.cfm?ID=410958; Goldhaber, D., Perry, D., & Anthony, E. (2004). The National Board for Professional Teaching Standards (NBPTS) process: Who applies and what factors are associated with NBPTS certification? Educational Evaluation and Policy Analysis, 24(4), 259–280. 15 Vandevoort, L. G., Amrein-Beardsley, A., & Berliner, D. C., (2004). National board certified teachers and their students’ achievement. Educational Policy Analysis Archives, 12(46), 1–117. 16 Stone, J. E. (2002). The value added achievement gains of NBPTS-certified teachers in Tennessee: A brief report. p. 16. Retrieved April 2005, from http://www.education-consumers.com/briefs/stoneNBPTS.shtm 17 Stephens, A. D. (2003. September). The relationship between National Board certification for teachers and student achievement. Unpublished doctoral dissertation, College of Education, University of South Carolina, Columbia. (p. 10). 18 Goldhaber & Anthony. (2004). (p. 13). 19 Vandervoort, L. G., Amrein-Beardsley, A., & Berliner, D.C. (2004). (p. 2). 20 Cavalluzzo, L. C. (2004). Is National Board Certification an effective signal of teacher quality? Alexandria, VA: The CNA Corporation. Retrieved February 15, 2005, from www.teachingquality.org/resources/pdfs/CavaluzzoStudy.pdf 21 Ibid. 22 Ibid. 23 Ibid. 24 Pool, J. E., Ellett, C. D., Schiavone, S., & Carey-Lewis, C. (2001). How valid are the National Board of Professional Teaching Standards assessments for predicting the quality of actual classroom teaching and learning? Journal of Personnel Evaluation in Education, 15(1), 31–48. 25 Pool et al. (2001) 26 Vandervoort et al. (2004) 27 Bond, L., Smith, T., Baker, W., & Hattie, J. (2000). The certification system of the National Board for Professional Teaching Standards: A construct and consequential validity study. Greensboro, NC: Center for Educational Research and Evaluation, University of North Carolina at Greensboro. 28 See, for example, Mendro, R. L. , Jordon, H. R., Gomez, E., Anderson, M. C., & Benbry, K. L. (1998). Longitudinal teacher effects on student achievement and their relation to school and project evaluation. Paper presented at the Annual Meeting of the Educational Research Association, San Diego, CA.; Stronge, J. H. & Ward, T. J. (2001, November). Using student achievement in teacher evaluation: Gain score

16
methodology applied. Presentation for the College of William and Mary National Evaluation Institute, Williamsburg, VA. 29 Klem, L. (1997). Path analysis. In L. G. Grimm & P. R. Yarnold (Eds.), Reading and understanding multivariate statistics. Washington, DC: American Psychological Association; Licht, M. H. (1997). Multiple regression and correlation. In L. G. Grimm, & P. R. Yarnold (Eds.), Reading and understanding multivariate statistics. Washington, DC: American Psychological Association. 30 Panasuk, R., Stone, W., & Todd, J. (2002). Lesson planning strategy for effective mathematics teaching. Education, 22(2), 714, 808–827. 31 Solomon, P. G. (2000). The assessment bridge. Thousand Oaks, CA: Corwin Press; McColskey, W., Parke, H., Furtek, E., & Butler, S. (2003). A structured professional development approach to unit study: The experience of 2000 teachers in the National Computational Science Leadership Program. Paper presented at the Annual Meeting of the American Educational Research Association, Chicago, IL. 32 Black, P., & Wiliam, D. (1998). Inside the black box. Phi Delta Kappan, 80(2), 139–148. 33 Aschbacher, 1999; Clare, 2000; Clare, L., & Aschbacher, P.R. (2001). Exploring the technical quality of
using assignments and student work as indicators of classroom practice. Educational Assessment, 7(1), 39–59; Clare, L., Valdés, R., Pascal, J., & Steinberg, J. R. (2001). Teachers’ assignments as indicators of instructional quality in elementary schools. (Center for the Study of Evaluation Technical Report #545). Los Angeles: University of California, National Center for Research on Evaluation, Standards, and Student Testing (CRESST).
34 Stronge, J. H., Tucker, P. D., & Ward, T. J. (2003, April). Teacher effectiveness and student learning: What do good teachers do? American Educational Research Association Annual Meeting, Chicago, IL.

17
SECTION 2
METHODOLOGY

18
METHODOLOGY
This study was conducted in four North Carolina school districts. In Phase I, descriptive results from the development of teacher effectiveness indices based on student achievement results were reported for 307 teachers. In Phase II, 51 teachers representing membership in the three groups of teachers to be studied participated in classroom observations, surveys, artifact collection, and follow-up interviews. The following section describes sample selection, data collection methods, and data analyses.
Districts
North Carolina school districts were selected for this study due to the large numbers of National Board certified teachers in the state. The districts were selected based on the availability of National Board certified teachers in the district, their proximity to the researchers (since observations were involved), and their willingness to participate in the study. The school districts were: RS1, a rural school district in the mountains with 15 schools. Approximately 6% of the population is minority (94% White, 2% Hispanic, 2% Black, 1% Native American, and less than 1% Asian).1 RS2, a rural school system in the southern part of the state with 28 schools. Approximately 15% of the population is minority (85% White, 7% Hispanic, 6% Black, and less than 2% Asian and Native American).2 UR1, an urban school district in the Piedmont region with 67 schools. Approximately 49% of the student population is minority (51% White, 10% Hispanic, 35% Black, 1% Asian, 3% multi-racial or other).3 UR2, an urban school district in the Piedmont region with 108 schools. Approximately 54% of the population is minority (46% White, 5% Hispanic, 40% Black, 4% Asian, 5% multi-racial or other).4 Note: UR2 participated only in Phase II by providing lists of National Board certified teachers and agreeing to let the researchers invite these teachers to participate. The district was not able to provide the database of student achievement linked to teacher assignment that was needed to identify teachers with high and low student achievement results. Thus, when the report refers to three school districts, UR2 is not included.

19
Sample
Phase I Sample Selection
Two years of student test scores in reading and math from approximately 307 fifth-grade teachers from three North Carolina public school districts were included in Phase I of the study. In Phase I, all fifth-grade teachers from each of the three districts constituted the population studied as teacher effectiveness indices (based on student achievement results) were calculated based on their results relative to other fifth-grade teachers in that district. Teachers included in the sample were those who had taught in the district the previous school year (and thus, had student achievement results). Districts were asked to provide two years of student achievement data on the students who were in the fifth-grade teachers’ classrooms the year prior to the study. For each of the three districts, all of the fifth-grade teachers who had National Board certification by the time of the Phase I analysis were coded as such to examine how they compared to the other fifth-grade teachers. School districts provided the data on whether a teacher was Board certified or not. Because this was a secondary data analysis, the teachers did not need to consent to this aspect of the study. Thus, the fifth-grade NBPTS teachers studied in Phase I were not an identical match to the NBPTS teachers who volunteered to participate in Phase II.
Phase II Sample Selection: Recruitment of Classroom Teachers
The Phase II invited population of teachers was identified from three separate lists of teachers, representing the three groups of interest:
1. National Board certified teachers teaching in fourth and fifth grade general education classrooms,
2. Highly effective teachers (as measured by the student test
score results from the Phase I analysis) teaching fourth or fifth grade general education classrooms during the year of observations, and
3. Least effective teachers (as measured by the student test score
results from the Phase I analysis) teaching fourth or fifth grade general education classrooms during the year of observations.
Table 2.1 shows the number of teachers invited to participate by group and district along with the number of those invited that agreed to participate.

20
Table 2.1 Teachers Invited and Agreeing to Participate by District and Group District Number of
NBCTs invited
Number of NBCTs who agreed to participate
Number of Upper Quartile (upper gain score) teachers invited
Number of Upper Quartile (upper gain score) teachers who agreed to participate
Number of Lower Quartile (lower gain score) teachers invited
Number of Lower Quartile (lower gain score) teachers who agreed to participate
UR1
8
3
29
9
34
7
UR2
23
11
0
0
0
0
RS1
5
3
13
2
12
0
RS2
6
4
12
5
14
7
Total
42
21 (50%)
54
16 (30%)
60
14 (23%)
Note: Of the 21 NBCTs who participated, 11 were fourth grade and 10 were fifth grade teachers. Of the 16 upper quartile teachers, 5 were fourth grade and 11 were fifth grade teachers. Of the 14 lower quartile teachers, 8 were fourth grade and 6 were fifth grade teachers.
All Board certified teachers teaching in fourth and fifth grade regular classrooms were sent letters of invitation. Both Board certified fourth and fifth grade teachers were included because the pool of invitees would not have been large enough with just one grade level represented. The non-Board certified teachers also had to meet the same criteria as the Board certified in that they had to have a clear state license, a minimum of three years experience in the classroom, and a Bachelor’s degree. Thus, not every teacher identified as in the top or bottom quartiles from Phase I was included on the invitation list. The numbers of teachers invited to participate was less than the total number of teachers identified in Phase I due to movement of teachers and the other factors just described.
NBPTS Teacher Identification and Invitation Process During the spring of 2003, the districts provided lists of fourth- and fifth-grade National Board certified teachers. Next, the research team reviewed these lists trying to identify any teachers who taught non-regular classes (Academically Gifted, etc.), those who had transferred, and those who had retired, so they could be excluded. In November 2003, the first round of letters inviting participation was sent to teachers (see Appendix B). Enclosed was a card they could return if they were interested in participating. If no response was received, a follow-up phone call was made. Initially, an incentive of $75 was offered, but due to the lack of adequate response, an incentive of $200 was offered to encourage participation. Subsequent rounds of letters of invitation were sent out in January, February, October, and November 2004. Approximately 50% of

21
the National Board certified fourth- and fifth-grade teachers invited from the four school districts participated.
Identifying and Inviting Highly Effective and Least Effective Teachers Based on Student Achievement Results in Phase I The identification of the two comparison groups of teachers: (a) one highly effective in terms of their students’ achievement test score gains and (b) the other least effective in terms of their students’ achievement test score gains began with the analysis described in Phase I. Only three of the four districts supplied longitudinal and demographic data on each student in the fifth grade for the 2001–2002 and 2002–2003 school years with the teacher assignments included. Analyses were run to develop “teacher effectiveness” measures based on their students’ test scores. The analyses resulted in a list of teachers in each district who were in the top and bottom quartiles in terms of their student achievement gain scores for their district. These lists of teachers were reviewed for any obvious exclusion (Academically Gifted teacher, transfer, retirement, etc.) based on district lists of current teachers. In addition, to ensure a match in terms of level of experience with the NBPTS group, any teacher who was not eligible for National Board candidacy at the time of the study (i.e., less than three years of experience in the classroom and/or did not have a clear teaching license from the state) was deleted from the list of those to be invited to participate. Letters of invitation were sent out in January, February, October, and November 2004. As with the NBCT group, an incentive of $200 was offered for participation. The letter did not indicate the reason (high or low group represented) for their invitation but did mention the funding source for the project. As with the letters of invitation to the National Board teachers, this round of letters was accompanied by phone calls as a follow up to the mailings.
Instrumentation
Phase I Instrumentation: The Relationship Between National Board Certification and Student Achievement
There was no instrumentation required for the analyses regarding the relationship between National Board certification and student achievement. Rather, extant data in the form of student and teacher records were collected and analyzed as is described in Section 3 of this report.

22
Phase II Instrumentation: Comparison of Teaching Practices Between Three Groups of Teachers
Work on instrumentation began with a review of prior work by the researchers, including an earlier exploratory study by Stronge, Tucker, and Ward,5 and work by SERVE in developing performance dimensions for a teacher evaluation system. In addition, we reviewed other comparable research efforts and available observational instruments. The research team met to develop the classroom observational instrumentation based on these reviews. A strength of this study was the range of instruments used in examining differences between the three groups of teachers. Not only was instrumentation developed for classroom observations of key dimensions of classroom practice, but data from teacher self-report surveys (Teacher Sense of Efficacy Scale), teacher artifacts (ratings of the quality of typical reading comprehension assignments), and teacher interviews (quality of reported planning and assessment practices) were also collected. There were three categories of instruments used in the study: (a) Pre-instructional and dispositional, (b) In-classroom, and (c) Teacher Effectiveness. All the instruments are located in Appendix A in the order in which they are introduced in this section.
Table 2.2 Study Instruments and Categories of Teacher Effectiveness
Instrumentation
Pre-Instructional Dimensions
In-classroom Dimensions
Teacher Effectiveness Dimensions
Classroom events record
X
Questioning technique analysis chart
X
Student time-on-task chart
X
Teacher effectiveness summary rating form
X
Teacher effectiveness summary rating form – combined
X
Teacher Beliefs Form-TSES
X
Teacher interview (planning and assessment practices)
X
Typical assignments (ratings of quality)
X

23
Pre-Instructional and Dispositional Instruments The following instruments and strategies were used to collect data on teacher beliefs, planning and assessment practices, and quality of a “typical” reading comprehension assignment given to students. Teacher Beliefs Form A teacher’s sense of efficacy is based on a set of beliefs in his or her ability to make a difference in student learning, to be able to reach difficult or unmotivated students. The Teacher Beliefs Form was mailed to teachers upon their agreement to participate in the SERVE study. It provided a measure of teacher self-efficacy and demographic information on the participants. Observers collected the form at the time of the observation. The Teacher Sense of Efficacy Scale (TSES)6 was developed to capture the model of teachers’ sense of efficacy presented in work by Tschannen-Moran, Woolfolk Hoy & Hoy.7 The TSES moves beyond previous measures to assess a wider range of teaching tasks. There are two versions: a long version with 24 items and a short version with 12 items that yield comparable results. The short form was used in this study. In a prior study of survey items, principal-axis factoring with varimax rotation yielded three factors with loadings ranging from .50 to .78. An efficacy subscale score was computed for each factor by calculating the mean of the eight responses to the items loading highest on that factor. Reliabilities for the teacher efficacy subscales were .91 for Instructional Strategies, .90 for Classroom Management, and .87 for Student Engagement. Intercorrelations between the subscales of Instruction, Management, and Engagement were .60, .70, and .58, respectively (p < .001). Means for the three subscales ranged from 6.71 to 7.27. In a validation study by Tschannen-Moran and Woolfolk-Hoy (2001) for the short form, the strongest correlations between the TSES and other measures are with scales that assess personal teaching efficacy. The construct validity of both the short and long forms of the Teacher Sense of Efficacy Scale was assessed through correlations of this new measure with other existing measures of teacher efficacy.8 Teacher Interviews The processes and thinking involved in planning and assessment practices are difficult to observe in a classroom. Follow-up interviews were the primary instrumentation for assessing these two dimensions. For this study, the researchers developed a two-dimension rubric that built on SERVE’s prior experience in teacher evaluation in over twenty districts

24
over the past six years. Part of the SERVE model of teacher evaluation requires an interview by an administrator to delve deeply enough into the teacher’s planning and assessment practices to rate these dimensions. From this model of teacher evaluation, two specific performance dimensions (long-range planning and analysis of assessment results) were used in this study as the rating instrument. Interview questions provided the interviewer with the “data” to score the teacher from 1 to 4 (as the exemplary level) on these two areas. The research team selected a total of 11 interviewers from the pool of trained observers to conduct individual interviews with the teachers. Each interviewer received additional training in both the protocol and the scoring rubric involving direct instruction and interactive practice in interview skills. Establishing a common understanding of the scoring rubric was a major part of the interviewer training. The interviews were scheduled on different days from the three-hour teacher observation (reported on in other sections of this report) to accommodate school and teacher schedules. It was not feasible for the interviewers to interview only the teachers they observed as there were more observers than interviewers. All interviews were audio taped with transcriptions allowing for additional analysis. The interviewer scored the two performance dimensions without the transcript immediately following the interview. The interviewers had no knowledge of the group membership of the teachers they interviewed. “Typical” Reading Comprehension Assignment The National Center for Research in Evaluation, Standards, and Student Testing (CRESST) has developed a method for investigating the quality of teachers’ assignments as an indicator of instructional quality. Their research involved a process for collecting “typical” reading comprehension assignments from teachers. For each assignment, teachers complete a one-page cover sheet describing their learning goals and assessment criteria. Teachers also submit samples of student work for the assignment (two high-quality samples and two medium-quality samples). The whole package is then scored by trained raters using a rubric that outlines six dimensions of quality. The CRESST process was used in this study with some minor changes. In this study, one additional scoring dimension was added to the CRESST rubric (quality of teacher feedback to student) based on the work of Black and Wiliam.9 Although the CRESST process recommended obtaining multiple assignment samples to achieve stable ratings, our process only involved one assignment sample from each teacher. Practically, teachers who had already agreed to observations, a survey, and interview were unlikely to spend additional hours in organizing artifacts for us. In addition, typically

25
in CRESST work, the assignments are the sole method being used to assess classroom quality so a stable rating of a teacher is critical. In this study, a large number of measures assessing different dimensions of instructional quality were collected in order to look at patterns of between group differences. Rather than conceptualizing this assignment quality variable set as stable ratings of a teacher's likelihood of having quality assignments across a variety of assignment types, it is better understood as assignment quality related to a specific sample of a "typical" reading comprehension assignment.
In this study, teachers were given written directions by the classroom observational team about how to collect and organize the information outlined above (a “typical” reading comprehension assignment they had used with students, a completed cover sheet explaining their purposes, goals, assessment criteria, etc. in using the assignment, and finally, student samples from the assignment). They then either mailed the assignment samples to SERVE or had them available when the interviewer returned several weeks after the observation. (The written directions and cover sheet are shown in Appendix D.) The cover sheet responses were used in scoring the assignment quality. Past research by CRESST indicated an acceptable level of agreement between raters, and good internal consistency for the classroom assignment rating scales.10 Results also indicated that three to four teacher assignments rated by at least three raters appeared to yield a stable estimate of quality. In other words, the estimated variance components based on the teacher assignment ratings showed that most of the variation in ratings was accounted for by differences across teachers, and not by differences across raters or assignment type. Due to other demands on teachers in this study as explained above, only one “typical assignment” was requested, which was scored by two raters. The two independent raters’ scores from the application of the scoring rubric to each teacher’s assignment were averaged to result in one set of assignment quality scores per teacher. The Kappa interrater agreement for the CRESST rubric scores was .86. In-Classroom Observation Instruments In May 2003, the research team piloted the preliminary In-Classroom Observation instruments by observing a fifth-grade classroom for two hours. Each of the proposed instruments was completed by two of the team members. After the observation, the research team analyzed each instrument in terms of its contribution to the understanding of teacher practices and ease of use during an observation. In addition, the researchers compared scores on the ratings given to the teacher using the

26
Teacher Effectiveness Rating Form. Based on these discussions, the instruments were modified and the rubric for the Teacher Effectiveness Rating Form was refined for greater clarity and specificity. The following instruments were used by two trained classroom observers who observed each classroom for three hours. The observers were blind to group membership of the teacher. Questioning Techniques Analysis Chart This instrument was intended for use in categorizing the types of questions asked by the teacher and by the students. One of the two observers was asked to record all instructional questions asked by the teacher, orally and in writing, for one hour during the language arts lesson using regular notebook paper. They were also asked to record student-generated questions that were not procedural in nature but related to the instructional content. Questions were categorized based on low, intermediate, and high cognitive demand.11 Later the observer wrote in three examples of each question type on the Questioning Techniques Analysis Chart and tallied the number of questions asked by teachers and students at each level. Percentages were calculated for total questions asked at each level. A Guide for Categorizing Questions based on Bloom’s taxonomy12 was provided as a reference for observers to ensure consistency in coding. Student Time-on-task Chart This instrument was designed to record student engagement in the teaching-learning process at regular five-minute intervals. Additionally, comments regarding off-task behavior and teacher response were to be recorded. The purpose of this instrument was to capture the key events that occurred during that segment related to student off-task behaviors and teacher management of the behavior. This was a modified version of an instrument from an earlier NBPTS validity study.13 During each five-minute cycle, one of the two observers was asked to watch and listen carefully for one full minute to get a clear sense of what was happening in the classroom, and then record their notes during the four minutes before the next sampling of information. If the teacher was uninvolved with students (such as reading papers), this was recorded under the “Task” column. If the teacher took no action, the box for “None” was checked. Classroom Events Record The purpose of this instrument was to create a record of how the teacher structured activities during two hours of the day and how efficiently time was used. One of the two observers recorded and coded the type of classroom activities and interactions during the first two hours of the three-hour observation. They described the length of time and nature of every classroom activity. The classroom was scanned on a regular basis

27
and the activity taking place was described making notations on the subject being covered, the type of activity, and the approach being used. A line was drawn across the form to demarcate each change in activity. The primary focus of the observation was the teacher—what he or she said and did as well as the classroom activities. The classroom events were coded according to Subject, Activity, and Approach (see Table 2.3).
Table 2.3 Dimension Codes Subject Activity Approach
LA – Language Arts M – Math Sc – Science SS – Social Studies O – Other
T – Transition TI – Teacher-center Instruction SA – Student centered instruction O – Other (please
specify)
W – Whole group instruction S – Small group
instruction I – Individualized instruction

28
Teacher Effectiveness Instruments Teacher Effectiveness Summary Rating Form This is a behaviorally-anchored rating scale of dimensions of effective teaching as identified through prior studies used by the observer at the completion of the observation. The scale is based on research of effective teaching and is designed to capture both the types of behaviors and the degree to which the participating classroom teachers exhibit those behaviors.14 This was the primary instrument used for rating teacher effectiveness. During the third hour of the observation, both observers began completing the Teacher Effectiveness Summary Rating Form using the scoring rubric (Teacher Effectiveness Behavior Scale) to guide their judgments about teacher effectiveness on each dimension. After the observation was completed, their individual ratings for each dimension were recorded along with their rationale for each. Teacher Effectiveness Summary Rating Form—Combined Once the two individual observers completed all of the instruments, the observers compared and discussed their respective ratings on the Teacher Effectiveness Summary Rating Form and reached consensus on the most accurate rating for each dimension in those instances in which their initial ratings differed. Observer #2 was responsible for completing the Teacher Effectiveness Summary Rating Form—Combined which reflected the agreed upon score by the two observers. This combined score was used for the analyses.
Data Collection Procedures
Phase I: Method for Analyzing the Relationship Between National Board Certification and Student Achievement
Each of the school systems involved in the study was asked to provide student, teacher, classroom, and school data as indicated in Table 2.4. None of the requested variables relating to classroom or school characteristics was supplied by the school systems. Nonetheless, these variables were calculated based on the student data provided. Other variables, as indicated in the far right column in Table 2.3, were not supplied for various reasons and could not be created from other supplied data.1 Therefore, these variables were not included in the overall analyses (as presented in Section 3 of this report).
1 An indicator of English as a Second Language services was provided in the student level data. This indicator was used to denote English proficiency status.

29
Table 2.4 Data Requested and Received from the Participating School Systems Status Level of Data
Variable Received From All
Not Received
From All
Student Gender Free/reduced lunch status Ethnicity English proficiency status (receiving ESL services) Special Education status Current (5th grade) achievement results:
NC Writing Assessment NC End-of-Grade Tests—Reading Comprehension NC End-of-Grade Tests—Mathematics Iowa Tests of Basic Skill, Form K Survey Battery (Grade 5)
Previous achievement results:
NC Pretest—Grade 3 NC End-of-Grade Tests—Reading Comprehension (4th grade) NC End-of-Grade Tests—Mathematics (4th grade)
School mobility (# schools attended) Average family income Average family education level Attendance Discipline Current teacher (as code)
Teacher Gender
Ethnicity Years teaching Years in district Years in current School Education level (Highest degree earned) Previous evaluation results Certifications held (other than NBPTS) Attendance
Classroom Class size Percent female Percent free and reduced lunch Percent ESL Percent minority
School School size Percent female Percent free and reduced lunch Percent ESL Percent minority

30
Phase II: Comparison of Teaching Practices Between Three Groups of Teachers
This section focuses on the recruitment of observers and the subsequent observation of the classroom teachers for Phase II of the study.
Observers University students and former teachers and administrators were recruited, trained, and selected to serve as observers in the study. The process is described below. Recruitment of Observers During August and September 2003, SERVE staff recruited graduate students from the College of Education and Department of Sociology at the University of North Carolina at Greensboro (UNCG) to serve as observers for this study. SERVE also contacted retired educators in the area. All eligible candidates submitted an application and interviewed with two SERVE staff members prior to being invited to attend a one-day training session on the campus of UNCG. The training session was advertised as being part of the selection process. Training of Observers The eight-hour training session was developed to include training in the skills of conducting classroom observations using the specific instruments developed for this study (see Appendix C). The session included an overview of the study, specific training on the use of each form, and instruction on synthesizing the data for the overall rating of the observation. Each participant was given three opportunities to practice using the various observation instruments while viewing practice videotapes of a National Board certified teacher and a non-Board certified teacher. Since the observers would be using the instruments to observe only language arts and math lessons, the videotapes selected for training depicted one teacher conducting a language arts lesson with the other teacher conducting a lesson in math. As the final part of the training, participants scored the videos using the Teacher Effectiveness Summary Rating Form. Scoring was done individually followed by a large group discussion to establish a common understanding of the rubric. Subsequently, participants were given three separate practice sessions to score a videotape of a teacher’s classroom using the rubric. Selection Process The training session culminated with a performance assessment that simulated the actual data collection process. Potential observers were
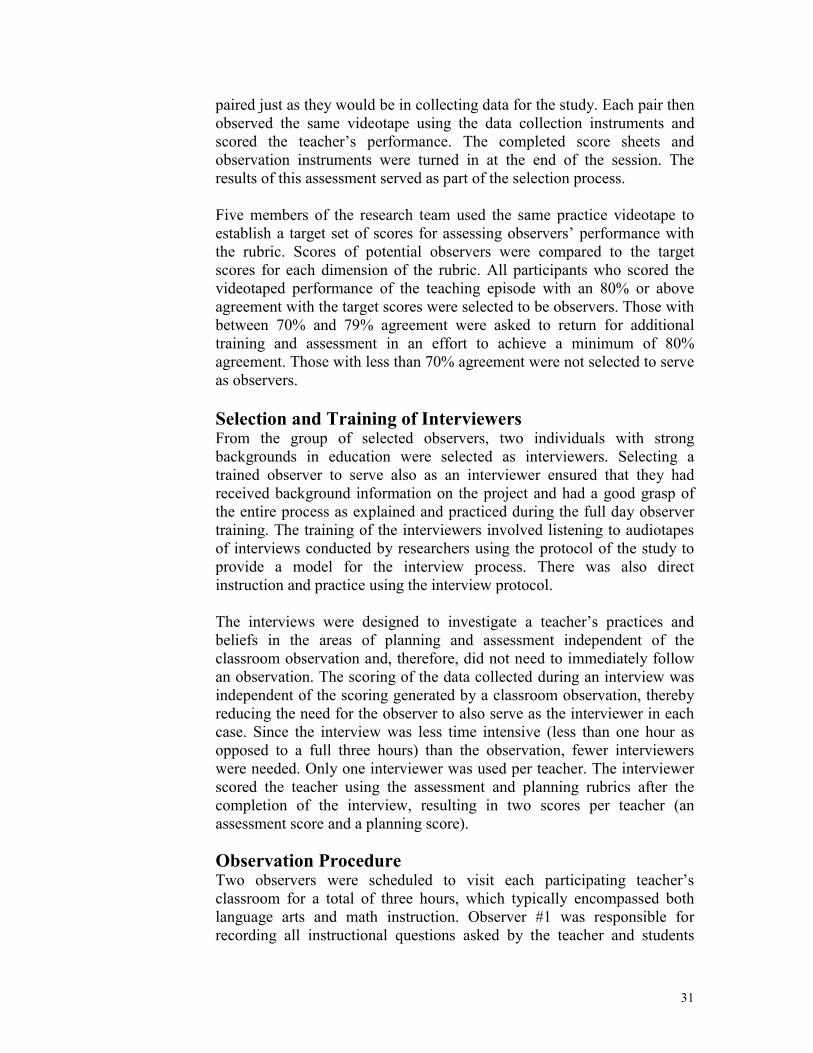
31
paired just as they would be in collecting data for the study. Each pair then observed the same videotape using the data collection instruments and scored the teacher’s performance. The completed score sheets and observation instruments were turned in at the end of the session. The results of this assessment served as part of the selection process. Five members of the research team used the same practice videotape to establish a target set of scores for assessing observers’ performance with the rubric. Scores of potential observers were compared to the target scores for each dimension of the rubric. All participants who scored the videotaped performance of the teaching episode with an 80% or above agreement with the target scores were selected to be observers. Those with between 70% and 79% agreement were asked to return for additional training and assessment in an effort to achieve a minimum of 80% agreement. Those with less than 70% agreement were not selected to serve as observers.
Selection and Training of Interviewers From the group of selected observers, two individuals with strong backgrounds in education were selected as interviewers. Selecting a trained observer to serve also as an interviewer ensured that they had received background information on the project and had a good grasp of the entire process as explained and practiced during the full day observer training. The training of the interviewers involved listening to audiotapes of interviews conducted by researchers using the protocol of the study to provide a model for the interview process. There was also direct instruction and practice using the interview protocol. The interviews were designed to investigate a teacher’s practices and beliefs in the areas of planning and assessment independent of the classroom observation and, therefore, did not need to immediately follow an observation. The scoring of the data collected during an interview was independent of the scoring generated by a classroom observation, thereby reducing the need for the observer to also serve as the interviewer in each case. Since the interview was less time intensive (less than one hour as opposed to a full three hours) than the observation, fewer interviewers were needed. Only one interviewer was used per teacher. The interviewer scored the teacher using the assessment and planning rubrics after the completion of the interview, resulting in two scores per teacher (an assessment score and a planning score).
Observation Procedure Two observers were scheduled to visit each participating teacher’s classroom for a total of three hours, which typically encompassed both language arts and math instruction. Observer #1 was responsible for recording all instructional questions asked by the teacher and students

32
during the first hour using the Questioning Techniques Analysis Chart and recording time on task by students during the second hour using the Student Time-on-task Chart. Observer #2 was responsible for coding classroom activities and interactions during the first two hours of the observation using the Classroom Events Record. Table 2.5 provides an overview of the data collection process. After the visit, they completed a Teacher Effectiveness Summary Rating individually and then completed a second rating as a team, coming to consensus on ratings when initially different.
Table 2.5 Data Collection Overview
Instrument When
Completed Time
Duration Observer
#1 Observer
#2 Classroom Events Record
During
Observation
2 hour
minimum
X
Questioning Techniques Analysis Chart
During
Observation
1 hour
minimum
X
Time-on-task Chart
During
Observation
1 hour
minimum
X
Teacher Effectiveness Summary Rating Form
During/ After
Observation
Full
Observation
X
X
Teacher Effectiveness Summary Rating Form—Combined
After
Observation
Full
Observation
X
X*
Teacher Beliefs Form—TSES
Collected
After Observation
-
X
Typical Reading Comprehension Assignment
Collected
After Observation
-
X
Teacher Interview (Planning and Assessment Practices)
Conducted
After Observation
1 hour
maximum
**
**
* Responsible for reporting consensus ratings ** Only one interviewer was used for each teacher

33
Data Analysis
Phase I: Method for Analyzing the Relationship Between National Board Certification and Student Achievement
The methodology for studying the relationship between National Board certification and student achievement began with modeling student achievement to obtain estimates of teacher effectiveness. Regression models including two-level hierarchical linear modeling (HLM) and ordinary least squares (OLS) were tested as possible models. HLM has been proven to be an appropriate method to establish the achievement expectations for each student in the selected achievement areas and grades, and to develop teacher effectiveness indices that account for selected student demographic characteristics, class-level characteristics, and prior student achievement.15 With regression modeling, actual student achievement was compared to expected achievement estimates using the selected prediction model. Positive differences indicated achievement beyond expectation, zero differences indicated achievement commensurate with expectation, and negative differences indicated achievement below expectation. The difference scores of students were then aggregated and averaged to develop a classroom composite for each teacher (based on the students they had taught). This composite served as the effectiveness indicator for the teacher within the achievement area. Analysis of the distribution of teacher composites (effectiveness indicators) allowed for the identification of the most effective and least effective teachers for Phase II of the study. A critical element in the application of this methodology was the availability of data to predict and condition achievement. Common data sets were available in the North Carolina districts.
Application of the Classroom Effectiveness Indices Model The control variables were used at both the individual and classroom levels as previous research has shown that effectiveness estimates can be biased if individual and classroom level background influences are not eliminated.16 Research also has shown that multiple models of the data need to be estimated and examined for fit.17 The suggested models and predictors for statistically fitting student achievement are described in Table 2.6.

34
Table 2.6 Teacher Effectiveness Identification Models
Model 1st Stage Predictors
(Fairness Stage)
2nd Stage Predictors
Basic OLS Regression
Gender, free/reduced lunch status, race, English proficiency status, days absent, days of discipline, previous standardized achievement test results, previous state standards-based assessment results
None
Two-stage OLS Regression
Gender, free/reduced lunch status, race, English proficiency status, days absent, days of discipline, previous standardized achievement test results, previous state standards-based assessment results
Classroom: Percent Male, Percent f/r Lunch, Percent Minority, Percent ESL, Class Size
Two-stage, Two-level HLM School as second level
Gender, free/reduced lunch status, race, English proficiency status, days absent, days of discipline, previous standardized achievement test results, previous state standards-based assessment results
School: Percent Male, Percent f/r Lunch, Percent Minority, Percent ESL, School Size
Two-stage, Two-level HLM
Gender, free/reduced lunch status, race, English proficiency status, days absent, days of discipline, previous standardized achievement test results, previous state standards-based assessment results
Classroom: Percent Male, Percent f/r Lunch, Percent Minority, Percent ESL, Class Size
Phase II: Comparison of Teaching Practices Between Three Groups of Teachers
In Phase II of the study, differences between the following three groups of teachers were studied:
• National Board certified teachers (fourth and fifth grade), • Teachers in the lowest quartile in terms of student achievement
indices (low gain score group), and

35
• Teachers in the highest quartile in terms of student achievement indices (upper gain score group).
Analyses were run on the data collected through the instruments described previously. Table 2.7 is organized by instrument to describe the analyses run.
Table 2.7 Description of Analyses Conducted by Instrument Instrument Purpose Analyses Classroom Events Record
Classroom Management and Intervention Strategies
Descriptive Statistics, ANOVA
Questioning Techniques Analysis Chart
Level of Questions Asked Teacher vs. Student Initiated Questions Number of Questions Asked
Descriptive Statistics, ANOVA
Time on Task Chart Student Engagement Behaviors
Descriptive Statistics, ANOVA
Teacher Effectiveness Rating Form (Individual and Combined)
Effectiveness Ratings in four areas: Instructional Skills, Assessment Skills, Classroom Management, and Personal Qualities
Descriptive Statistics, ANOVA
Teacher Beliefs Form (TSES)
Demographic Information Teacher Efficacy
Descriptive Statistics, ANOVA
Typical Reading Comprehension Assignment Ratings
Cognitive Challenge and Other Dimensions of a Quality Assignment
Descriptive Statistics, ANOVA
Interview (Ratings) Planning and Assessment Practices
Descriptive Statistics, ANOVA
Because our intent was in finding group differences where they might exist within the context of a small sample of teachers, the decision was

36
made to analyze the data in a manner that maximized statistical power. We elected to control the per-comparison rather than experimentwise error rate in order to optimize the chance of finding certification effects. Therefore, the risk of Type I errors are higher than had more conservative tests been used.
1 Rural School System 1 Website. (2005). 2 Rural School System 2 Website. (2005). 3 Urban School System 1 Website. (2005). 4 Urban School System 2 Website. (2005). 5 Tucker, P. D., Stronge, J. H., & Ward, T. J. (2003, April). Teacher effectiveness and student learning: What do good teachers do? Paper presented at the annual conference of the American Educational Research Association, Chicago, IL. 6 Tschannen-Moran, M., & Woolfolk Hoy, A. (2001). Teacher efficacy: Capturing an elusive construct. Teaching and Teacher Education, 17, 783–805. 7 Tschannen-Moran, M., Woolfolk Hoy, A., & Hoy, W. K. (1998). Teacher efficacy: Its meaning and measure. Review of Educational Research, 68, 202–248. 8 Tschannen-Moran, M., & Woolfolk Hoy, A. (2001). Teacher efficacy: Capturing an elusive construct. Teaching and Teacher Education, 17, 783–805. 9 Black, P., & Wiliam, D. (1998). Inside the black box. Phi Delta Kappan, 80(2), 139–148. 10 Clare, L. (2000). Using teachers’ assignments as an indicator of classroom practice. (Center for the Study of Evaluation Technical Report #532). Los Angeles: University of California, National Center for Research on Evaluation, Standards, and Student Testing (CRESST). 11 Good, T. L., & Brophy, J. E. (1997). Looking in classrooms (7th ed.). New York: Longman. 12 Bloom, B., Englehart, M., Furst, E., Hill, W., & Karthwohl, D. (1956). Taxonomy of educational objectives: The classification of educational goals. Handbook I, Cognitive domain. New York: Longmans Green. 13 Bond, L., Smith, T., Baker, W. K., & Hattie, J. A. (2000). The certification system of the National Board for Professional Teaching Standards: A construct and consequential validity study. Greensboro, NC: The University of North Carolina at Greensboro: Center for Educational Research and Evaluation. 14 Stronge, J. H. (2002). Qualities of effective teachers. Alexandria, VA: Association for Supervision and Curriculum Development. 15 See, for example, Mendro, R. L., Jordon, H. R., Gomez, E., Anderson, M. C., & Bembry, K. L. (1998, April). Longitudinal teacher effects on student achievement and their relation to school and project evaluation. Paper presented at the annual meeting of the Educational Research Association, San Diego, CA.; Stronge, J. H., & Ward, T. J. (2001, November). Using student achievement in teacher evaluation: Gain score methodology applied. Presentation for the College of William and Mary National Evaluation Institute, Williamsburg, VA. 16 Webster, W. J., Mendro, R. L., Orsak, T. H., & Weerasinghe, D. (1997). The applicability of selected regression and hierarchical linear models to the estimation of school and teacher effects. The Dallas Value-Added Accountability System. Dallas, TX: Dallas Public Schools. 17 Klem, L. (1997). Path analysis. In L. G. Grimm & P. R. Yarnold (Eds.), Reading and understanding multivariate statistics. Washington, DC: American Psychological Association; Licht, M. H. (1997).

37
Multiple regression and correlation. In L. G. Grimm & P. R. Yarnold (Eds.), Reading and understanding multivariate statistics. Washington, DC: American Psychological Association.

SECTION 3
RESULTS

39
RESULTS Phase I: Methodology for Studying the Relationship Between National Board Certification and Student Achievement
The purpose of the current study was twofold: (1) Phase I was designed to determine the relationship between Board certification and student achievement using a gain score methodology, and (2) Phase II was designed to examine the instructional practices of Board certified teachers in comparison to teachers with low student achievement gains and those with high student achievement gains. In the following sections, the results of Phases I and II will be presented with further discussion of the results in Section 4 of the report. In the Phase I portion of the study, the data provided by the separate school districts were merged into a common data set after each data set was cleaned up and the common set of variables was determined. The initial database contained the records of over 4,700 students and 379 teachers. The data for all students were used in the student level analyses, but achievement indices were calculated only for those teachers for whom there were data on 10 or more of their students. Thus, the final number of teachers was reduced to 307. The final number of students was 4,632 with 4,215 being taught by non-NB teachers and 417 being taught by NB teachers. The first step in the analysis was to apply a set of statistical methodologies, which controlled for student-level, class-level, or school-level concomitant variables, in order to predict fifth-grade achievement. The methodology employed was regression analysis, both ordinary least squares (OLS) and hierarchical linear models (HLM), to establish the achievement expectations for each student. Target variables were the fifth-grade multiple-choice North Carolina End-of-Grade Tests in Reading and Mathematics. Predictor variables included student-level descriptive variables, prior achievement variables, classroom-level variables, and school-level variables. As noted in Table 2.4 in the previous section of the report, none of the requested variables relating to classroom or school characteristics were supplied by the school systems. Nonetheless, we were able to calculate these variables based on the student data provided. Other variables were not supplied for various reasons and could not be created from other

40
supplied data.1 Therefore, these variables were not included in the overall analyses.
Student variables including gender, ethnicity, free or reduced lunch status, ESL programming, and special education status were provided by all three school systems. Ethnicity was constructed as an indicator variable indicating whether or not the individual was Caucasian. Free or reduced lunch status was coded as three levels: free, reduced, and none. Prior academic achievement measures included the fourth-grade multiple- choice North Carolina End-of-Grade Tests in Reading and Mathematics. In order to minimize collinearity, the student level demographic variables of gender, ethnicity, free or reduced lunch status, and ESL programming were regressed on the prior achievement variables and the residuals were used in the analyses. Class-level variables included class size, percent of students receiving ESL services, percent receiving free or reduced lunch, and percent Caucasian. School-level variables included school size, percent receiving ESL services, percent receiving free or reduced lunch, percent Caucasian, percent Black, and percent Hispanic. The two-way interactions of the student level demographics were also included in the analyses.
Establishment of the Initial Teacher Effectiveness Prediction Models
Four models for the data were tested to determine which model best fit the data and provided outcomes uncorrelated with the predictor variables.
o Model 1 was a basic OLS regression model using the student-level variables as the predictors.
o Model 2 was a two-stage OLS regression model using the student-level variables as predictors at stage one and the class-level variables as predictors at stage two.
o Model 3 was a two-stage, two-level HLM model using student-level predictors at stage one and school-level variables at stage two.
o Model 4 was a two-stage, two-level HLM model using student-level variables at stage one and classroom-level variables at stage two.
A summary of the multiple Rs for each of the target variables is presented in Table 3.1. Model testing indicated that Model 3 was slightly better at predicting the target variables than the other three models. Model 4 was eliminated as a possible model since the matrix operations necessary to
1 An indicator of English as a Second Language services was provided in the student level data. This indicator was used to denote English proficiency status.

41
calculate the model could not be carried out. This is likely the result of small sample sizes at the classroom level. The other three models produced residuals that were not significantly correlated with the predictor variables. Because Model 3 produced the largest multiple R, it was selected as the most appropriate model. Thus, Model 3 results were used in subsequent steps to create the teacher achievement indices (TAI) – the statistic used to represent teacher effectiveness relative to other teachers in the study. Table 3.1 Model Multiple R Values Target Variable
Model 1 R
Model 2 R
Model 3 R
Model 4 R
5th-grade Reading
.837 .844 .854 na
5th-grade Math
.867 .874 .882 na
Phase I Analysis: Teacher Effectiveness Indices Estimation of Teacher Achievement Indices (TAI) The estimate of teacher impact on achievement was calculated by averaging all student residuals for a teacher. The average number of students per classroom was 20.3 for non-Board certified teachers and 19.8 for Board certified teachers. Model 3 was used to create an estimate of student performance. The estimated performance from Model 3 was compared to the student’s actual fifth-grade performance to create the student residuals. Because Model 3 used school-level indicators that would place the teacher within the school rather than the system, it was necessary to correct the residuals by adding the school effect back to the residuals before aggregation. A shrinkage adjustment estimated on the variance of teacher residuals was applied to the calculation of the TAI. Finally, the TAI values were standardized on a T-scale for ease of interpretation. The individual teachers were ranked on the TAI measures and the listing was divided into quartiles to identify the teachers for observation in the next phase of the study. Student Residuals and Teacher Achievement Indices Figures 3.1 and 3.2 show the student residuals for the fifth-grade multiple-choice North Carolina End-of-Grade Tests in Reading and Mathematics. The residuals have been standardized on a z-score scale. The student math residuals ranged from -4.33 to 3.32. The math residuals evidenced a slight negative skew and moderate positive kurtosis. A test of normality indicated the math residuals departed significantly from normality. The reading residuals ranged from -4.15 to 3.57. This distribution was also

42
slightly negatively skewed but had only slight positive kurtosis. The significance test indicated that the reading residuals did not depart significantly from a normal distribution.
Figure 3.1 Fifth-Grade Students’ Multiple Choice North Carolina End-of-Grade Test in Mathematics Residuals
6.004.002.000.00-2.00-4.00-6.00Fifth Grade Math Residuals
400
300
200
100
0
Freq
uenc
y

43
Figure 3.2 Fifth-Grade Students’ Multiple Choice North Carolina End-of-Grade Test in Reading Residuals
4.002.000.00-2.00-4.00Fifth Grade Reading Residuals
250
200
150
100
50
0
Freq
uenc
y
Figures 3.3 and 3.4 show the Teacher Achievement Indices distributions for reading and math, which are based on the mean residual student gain scores. The math TAIs ranged from 22 to 77. The distribution had almost no skew and only slight negative kurtosis. A test of normality indicated that math TAIs did not depart significantly from a normal distribution. The reading TAIs ranged from 13 to 78. The distribution showed slight negative skew and some positive kurtosis. A test of normality indicated that the reading TAIs did not depart significantly from a normal distribution.

44
Figure 3.3 Math Teacher Achievement Indices
20.00 30.00 40.00 50.00 60.00 70.00 80.00
Math TAI
0
10
20
30
40
Freq
uenc
y

45
Figure 3.4 Reading Teacher Achievement Indices
10.00 20.00 30.00 40.00 50.00 60.00 70.00 80.00
Reading TAI
0
5
10
15
20
25
30
Freq
uenc
y
Teacher Achievement Indices and Teacher Characteristics Correlations were calculated between the reading and math TAIs and the teacher demographic variables that were provided by the school district. Years of service, ethnicity (coded as white or non white), and pay grade were the variables available for this analysis. The correlations, reported in Table 3.2, indicate that there were no significant relationships between the teacher demographics and the TAIs. Table 3.2 Correlations Between Teacher Demographics and Teacher Achievement Indices Years of
Service Ethnicity Pay Grade
TAI Math .014 .003 .048 TAI Reading .126 -.017 .045
p>.05 for all correlations

46
Student Residuals, Teacher Achievement Indices, and National Board Certification To examine whether the outcomes for National Board certified teachers were different from non-Board certified teachers, comparisons were made of the student residuals and TAIs of the two groups of teachers. Table 3.3 presents the means and standard deviations for the two groups. Comparisons of the means indicated that there were no significant differences between the National Board certified teachers and the non-Board certified teacher groups on any of the variables. A caution that is necessary with these comparisons is the relatively small number of Board certified teachers included in the analyses (Board certified = 25; non-Board certified = 282). Table 3.3 Means and Standard Deviations for Board Certified and Non-Certified Teachers Non-Board
Certified
(n=282)
Board Certified
(n=25)
Variable Mean SD Mean SD
Student Reading Residuals
(Z Scores)
-.01 .99 .03 1.05
Student Math Residuals
(Z Scores)
.01 1.01 .08 .97
Reading TAI
(T Scores)
49.9 10.23 50.8 7.48
Math TAI
(T Scores)
49.8 10.08 51.5 7.76
p>.05 for all comparisons Analyses for reading and math show a similar dispersion of residuals above and below the line for both groups of teachers. A Levene’s Test for Equality of Variances indicated the variances of the groups were statistically different (Levene’s = 3.64 and 3.18 respectively). Although the means for the residual student gain scores for Board certified and non-Board certified teachers did not differ significantly, their distributions did. Since the TAIs are T-scores, it would be expected that both subgroups, if equivalent, would display means near 50 and standard deviations near 10. This was the case for the non-Board certified teachers as indicated in the first two columns in Table 3.3. However, for Board

47
certified teachers, the reading mean and standard deviation were 50.8 and 7.48, respectively; the math mean and standard deviation were 51.5 and 7.76. These descriptive statistics suggest that the distributions for the non-Board certified teachers are very close to what would be expected but that the distributions for the Board certified teachers are less variable than expected. While the Board-certified group in Table 3.3 had slightly higher mean residual student gain scores in reading (50.8 versus 49.9) and math (51.5 versus 49.8) than their non-Board certified counterparts, the differences were not statistically significant (p < .05). However, the Board-certified teachers’ TAI scores (based on the mean residual student gain scores) are considerably more homogeneous that the non-Board teachers. For reading, the standard deviation was 7.48 (compared to 10.23 for non-Board certified teachers); for math, the standard deviation was 7.76 compared to 10.08. This finding is depicted in the location of Board certified teachers within the overall distribution of fifth-grade teachers in Figures 3.5 and 3.6. In addition to the distributions presented in Figures 3.5 and 3.6, the TAI distributions for the sample were divided into quartiles. Table 3.4 presents the percentages of Board certified teachers who fell into each quartile for the math and reading TAIs. Table 3.5 shows a similar breakdown for non- Board certified teachers. In Table 3.4, the quartile distribution for math shows the largest concentration of Board certified teachers in the middle quartiles with less than 15 percent in the top quartile and less than 20 percent in the lowest quartile. The distribution for reading is more concentrated in the upper quartiles with 61 percent of the NBCTs falling in the top two quartiles. Even so, there are still 22% of the NBCTs in the lowest quartile. At least at this grade level in these three districts, there are some NBCTs who are not as successful at student achievement gains as would be expected given their status as Board certified.

48
Figure 3.5 Mathematics Board Certified Teacher Achievement Indices
-2.00 -1.00 0.00 1.00 2.00
Math TAI
5
10
15
20
25
Cou
ntNot Certified Board Certified
-2.00 -1.00 0.00 1.00 2.00
Math TAI
Figure 3.6 Reading Board Certified Teacher Achievement Indices
-3.00 -2.00 -1.00 0.00 1.00 2.00
Reading TAI
0
10
20
30
Cou
nt
Not Certified Board Certified
-3.00 -2.00 -1.00 0.00 1.00 2.00
Reading TAI
Table 3.4 Percentage of National Board Teachers by TAI Quartiles for Mathematics and Reading
Teacher Achievement Indice Quartile Quartile 1 Quartile 2 Quartile 3 Quartile 4
Mathematics 19% 33% 33% 14% Reading 22% 17% 33% 28%

49
Table 3.5 Percentage o f non-National Board Teachers by TAI Quartiles for Mathematics and Reading
Teacher Achievement Indice Quartile Quartile 1 Quartile 2 Quartile 3 Quartile 4
Mathematics 26% 24% 24% 26%
Reading 25% 25% 25% 25%
Phase II: Comparison of Teaching Practices Between Three Groups of Teachers
The analyses reported in this section are based on the responses and observations of 51 teachers. The 51 teachers were from three identified groups: National Board certified teachers (N=21) (NBCTs), upper quartile in student achievement gain teachers (N=16) (Upper/Highly Effective), and lower quartile teachers (N=14) (Lower/Least Effective). The Upper and Lower teachers were identified in Phase I of this study.
Demographics
The teacher groups were compared on several demographic variables. Table 3.6 provides a summary of the demographics for each group. The demographics on the teacher groups are very similar. The primary noticeable difference is that 31% of the NBCT group reported having Post-Masters coursework compared to no teachers reporting this in the other two groups. Table 3.6 Demographic Data by Group Group Variable NBCT Upper Lower Mean Years Teaching 15.6 12.6 12.8 Percent Female 89% 87% 100% Percent White 96% 87% 100% Percent with Bachelor’s Degree Only
35% 44% 70%
Percent with Masters Degree 31% 53% 30% Percent with Masters Degree plus Post-Masters coursework
31% 0% 0%

50
Pre-Instructional and Dispositional Variables
Phase II of the study examined National Board certified teachers as compared to their non-Board certified counterparts in the top and bottom quartiles based on student achievement gains on a variety of measures of teaching practice described earlier. This section reports the findings from comparisons of the three groups of teachers on the various measures collected. While we present ANOVA results here, because of the small sample sizes and limited scale for some of the ratings, we ran comparable non-parametric comparisons for all of our analyses. Those analyses found exactly the same outcomes as those presented here.
Planning and Assessment The teachers were interviewed and asked about their planning and assessment practices. The interviewers rated the planning and assessment practices of the teachers using an analytic rubric with a scale of 1 to 4, with 4 being the most accomplished descriptor. Table 3.7 presents the descriptive data for the teacher groups on the planning and assessment ratings. Table 3.8 shows the ANOVA results comparing the teacher groups. Table 3.7 Planning and Assessment Interview Descriptive Statistics Group Statistic Planning AssessmentBoard certified Mean 3.67 3.19 SD .452 .653Upper Mean 3.33 3.21 SD .724 .426Lower Mean 3.17 3.00 SD .770 .829
Table 3.8 ANOVA Results for Planning and Assessment
Variable F Sig. Planning 2.46 .09Assessment .41 .668
The comparisons indicated that there were no significant differences between the groups on the mean Assessment or Planning rubric ratings. However, on the planning rubric rating, the NBCTs had the highest mean score, approaching 4 on a 4-point scale. Typical Assignment Quality The teachers from each of the groups submitted typical reading comprehension assignment materials for review. Each assignment was rated on Cognitive Challenge, Clarity of Grading Criteria, Clarity of

51
Learning Goals, Alignment of Goals and Tasks, Alignment of Goals and Grading Criteria, and Meaningful Feedback. Each of these dimensions was rated on a four-point scale using an analytic rubric with four indicating the highest level. Table 3.9 presents the means and standard deviations of the three groups on the Quality of Assignment measures. Comparisons of the groups over the six measures indicated differences between the groups only on Cognitive Challenge. The follow-up analyses (Table 3.10) indicated that the NBCTs had significantly higher Cognitive Challenge ratings than the Upper group who had higher Cognitive Challenge ratings than the Lower group. A “2” on the 4-point scale means that the reading comprehension assignment submitted as “typical” for their class demanded lower-level thinking of students (e.g., straightforward comprehension questions are posed about a passage read). A “3” on cognitive challenge indicates that the assignment requires construction of knowledge from the student that goes beyond just basic comprehension of a text and a “4” indicates that the student is required to do some deep thinking or analysis or extended response relative to a text. On all dimensions rated, the Lower (low gain score) teacher group had the lowest mean ratings as shown in Table 3.8. Their ratings ranged from a 1.97 on Cognitive Challenge to a 2.78 on the Clarity of Learning Goals for the assignment.
Table 3.9 Assignment Quality Descriptive Statistics
Group Statistic
Cognitive Challenge
Clarity GC
Clarity G
Alignment G&T
Alignment G&G Feedback
Board certified Mean 2.83 2.56 2.83 3.06 2.44 2.44
SD .707 .705 .514 .725 .705 .984 Upper Mean 2.36 2.27 2.82 3.09 2.55 2.27 SD .674 .905 .405 .701 .934 .786 Lower Mean 1.97 2.14 2.78 2.73 2.07 2.13 SD .632 .831 .667 .976 .595 .731
Ratings Range = 1 to 4 with 4 representing highest score Table 3.10 Assignment Quality ANOVA Results
Variable F Sig. Cognitive Challenge 5.28 .010
Clarity GC 1.12 .339Clarity G .034 .967Alignment G&T .304 .739Alignment G&G .515 .602Feedback .364 .698
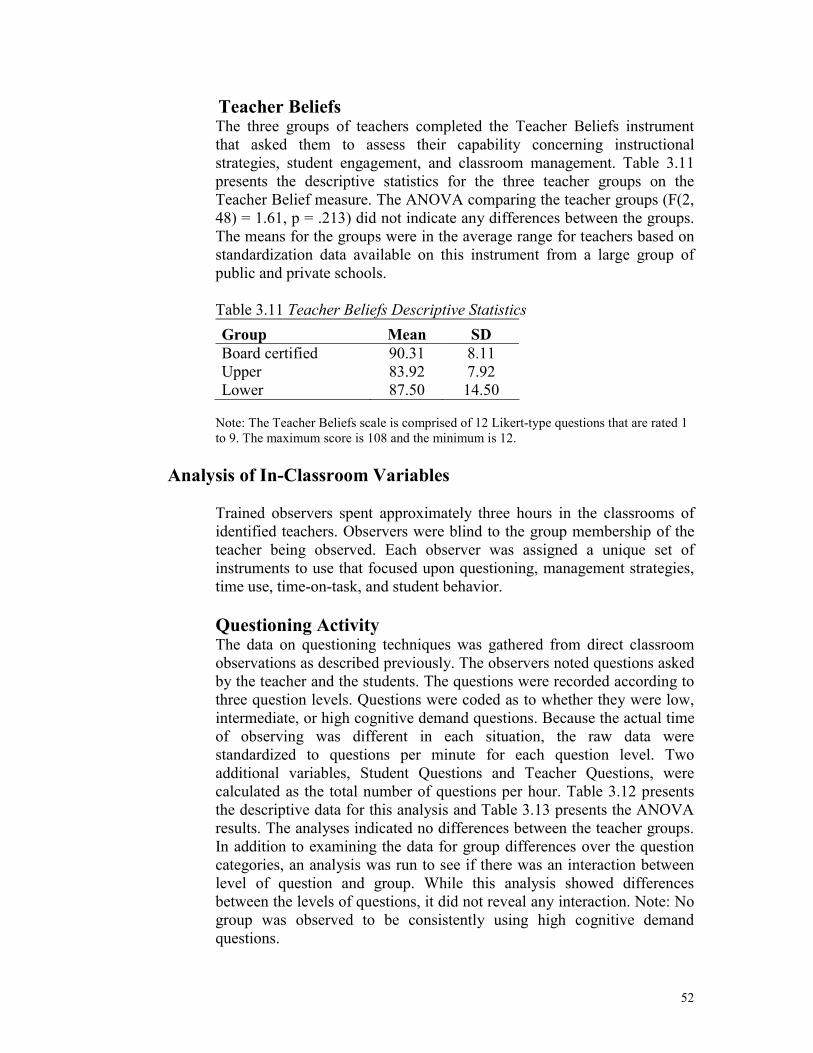
52
Teacher Beliefs The three groups of teachers completed the Teacher Beliefs instrument that asked them to assess their capability concerning instructional strategies, student engagement, and classroom management. Table 3.11 presents the descriptive statistics for the three teacher groups on the Teacher Belief measure. The ANOVA comparing the teacher groups (F(2, 48) = 1.61, p = .213) did not indicate any differences between the groups. The means for the groups were in the average range for teachers based on standardization data available on this instrument from a large group of public and private schools.
Table 3.11 Teacher Beliefs Descriptive Statistics Group Mean SD Board certified 90.31 8.11 Upper 83.92 7.92 Lower 87.50 14.50
Note: The Teacher Beliefs scale is comprised of 12 Likert-type questions that are rated 1 to 9. The maximum score is 108 and the minimum is 12.
Analysis of In-Classroom Variables
Trained observers spent approximately three hours in the classrooms of identified teachers. Observers were blind to the group membership of the teacher being observed. Each observer was assigned a unique set of instruments to use that focused upon questioning, management strategies, time use, time-on-task, and student behavior. Questioning Activity The data on questioning techniques was gathered from direct classroom observations as described previously. The observers noted questions asked by the teacher and the students. The questions were recorded according to three question levels. Questions were coded as to whether they were low, intermediate, or high cognitive demand questions. Because the actual time of observing was different in each situation, the raw data were standardized to questions per minute for each question level. Two additional variables, Student Questions and Teacher Questions, were calculated as the total number of questions per hour. Table 3.12 presents the descriptive data for this analysis and Table 3.13 presents the ANOVA results. The analyses indicated no differences between the teacher groups. In addition to examining the data for group differences over the question categories, an analysis was run to see if there was an interaction between level of question and group. While this analysis showed differences between the levels of questions, it did not reveal any interaction. Note: No group was observed to be consistently using high cognitive demand questions.

53
Table 3.12 Mean Number of Questions Asked by Group and Complexity
Group Statistic
LCD Teacher
LCD Student
ICD Teacher
ICD Student
HCD Teacher
HCD Student
Student Questions
Teacher Questions
Board certified
Mean .39 .04 .18 .01 .06 .01 2.95 39.14
SD .36 .06 .19 .01 .09 .01 3.59 30.82 Upper Mean .39 .03 .19 .01 .05 .00 2.62 38.06 SD .24 .03 .11 .01 .06 .00 2.36 18.55 Lower Mean .41 .02 .19 .01 .10 .01 1.76 43.08 SD .22 .04 .18 .02 .03 .02 1.48 22.55
Note: Data represent questions per minute for all categories except Student Questions and Teacher Questions. The data for the last two categories represent questions per hour. Note: LCDT = low cognitive demand teacher generated, ICDT = intermediate cognitive demand teacher generated, HCDT = high cognitive demand teacher generated, LCDS = low cognitive demand student generated, ICDS = intermediate cognitive demand student generated, HCDS = high cognitive demand student generated.
Table 3.13 Questioning Activity ANOVA Results
Variable F Sig.LCDT .017 .984LCDS 1.102 .341ICDT .032 .969ICDS .276 .760HCDT .694 .504HCDS 1.252 .295Student Questions .727 .489
Teacher Questions .153 .859
Note: LCDT = low cognitive demand teacher generated, ICDT = intermediate cognitive demand teacher generated, HCDT = high cognitive demand teacher generated, LCDS = low cognitive demand student generated, ICDS = intermediate cognitive demand student generated, HCDS = high cognitive demand student generated. Time-on-Task The classroom observers gathered data on the engagement of students in the classroom. During a one-hour period, the observers gathered five- minute samplings of the number of students visibly disengaged in the lesson and the number of students who initiated disruptive activities. Additionally, comments regarding off-task behaviors and teacher responses were recorded. Student off-task behaviors and teacher management of the behavior, both preventive and reactive, were noted. Table 3.14 presents the descriptive data for the analysis of disruptive and disengaged behavior, and Table 3.15 presents the ANOVA results.
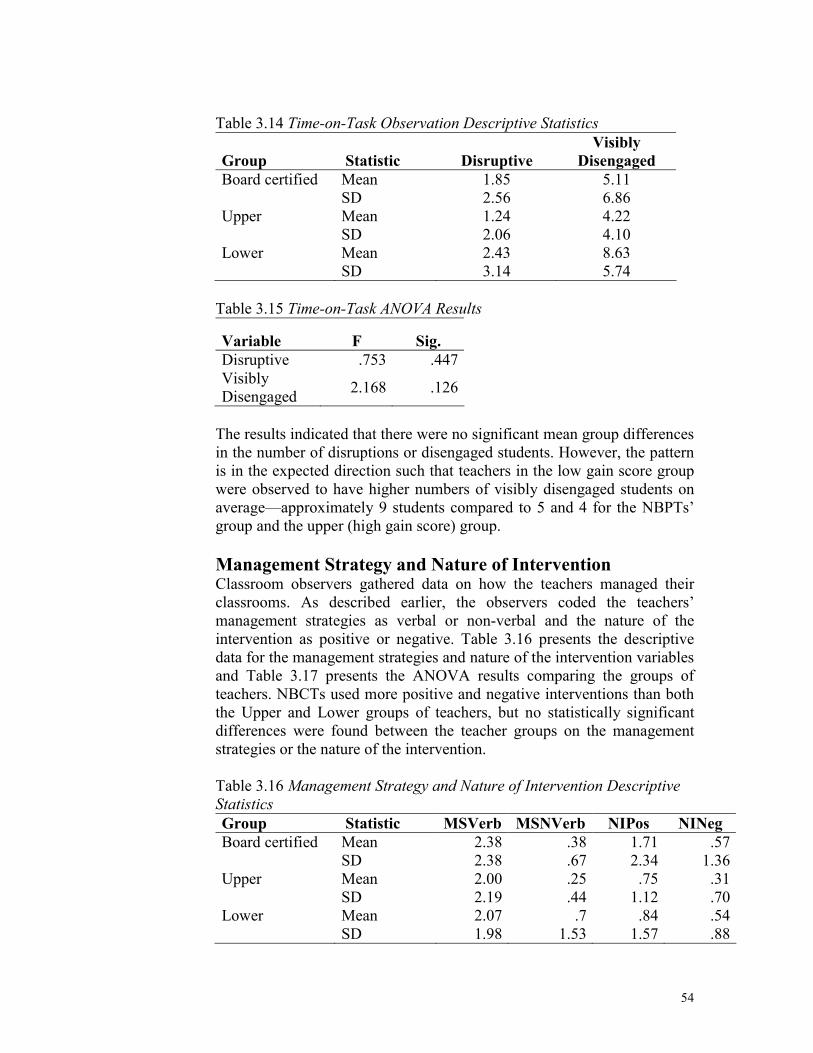
54
Table 3.14 Time-on-Task Observation Descriptive Statistics
Group Statistic Disruptive Visibly
Disengaged Board certified Mean 1.85 5.11 SD 2.56 6.86 Upper Mean 1.24 4.22 SD 2.06 4.10 Lower Mean 2.43 8.63 SD 3.14 5.74
Table 3.15 Time-on-Task ANOVA Results
Variable F Sig. Disruptive .753 .447Visibly Disengaged 2.168 .126
The results indicated that there were no significant mean group differences in the number of disruptions or disengaged students. However, the pattern is in the expected direction such that teachers in the low gain score group were observed to have higher numbers of visibly disengaged students on average—approximately 9 students compared to 5 and 4 for the NBPTs’ group and the upper (high gain score) group. Management Strategy and Nature of Intervention Classroom observers gathered data on how the teachers managed their classrooms. As described earlier, the observers coded the teachers’ management strategies as verbal or non-verbal and the nature of the intervention as positive or negative. Table 3.16 presents the descriptive data for the management strategies and nature of the intervention variables and Table 3.17 presents the ANOVA results comparing the groups of teachers. NBCTs used more positive and negative interventions than both the Upper and Lower groups of teachers, but no statistically significant differences were found between the teacher groups on the management strategies or the nature of the intervention. Table 3.16 Management Strategy and Nature of Intervention Descriptive Statistics Group Statistic MSVerb MSNVerb NIPos NINeg Board certified Mean 2.38 .38 1.71 .57 SD 2.38 .67 2.34 1.36Upper Mean 2.00 .25 .75 .31 SD 2.19 .44 1.12 .70Lower Mean 2.07 .7 .84 .54 SD 1.98 1.53 1.57 .88

55
Note: MSVerb = Management Strategy Verbal, MSNVerb = Management Strategy Non-verbal, NIPOS = Nature of Intervention Positive, NINeg = Nature of Intervention Negative. Data represent the number of responses per 5-minute period.
Table 3.17 Management Strategy and Nature of Intervention ANOVA Results
Variable F Sig. MSVerb .152 .859MSNVer 1.202 .310NIPos 1.538 .226NINeg .282 .756
Note: MSVerb = Management Strategy Verbal, MSNVerb = Management Strategy Non-verbal, NIPOS = Nature of Intervention Positive, NINeg = Nature of Intervention Negative
Teacher Effectiveness Based on Classroom Observations Data on the effectiveness of the teachers in their classrooms included ratings by the observers using the Teacher Effectiveness Rating Form. The observers individually rated the effectiveness of the teachers in the four broad areas of Instructional Skills, Assessment Skills, Classroom Management, and Personal Qualities. Within each broad area, the observers rated the teachers on a one (least effective) to four (most effective) scale using a rubric. Then the observers compared and discussed their respective ratings and if they initially differed in their rating, they reached a consensus on the most accurate rating for each item. Table 3.18 presents the descriptive data for the 15 dimensions using the consensus ratings and Table 3.19 presents the results of the ANOVAs.

56
Table 3.18 Teacher Effectiveness Observation Rating Descriptive Statistics
Measure Group Mean SD I1 Instructional Differentiation Board certified 2.70 .801 Upper 2.81 1.047 Lower 2.62 .870 I2 Instructional Focus on Learning Board certified 3.00 .973 Upper 3.31 .704 Lower 2.85 .689 I3 Instructional Clarity Board certified 3.00 .649 Upper 3.19 .655 Lower 2.85 .689 I4 Instructional Complexity Board certified 2.75 .851 Upper 3.00 .816 Lower 2.69 .751 I5 Expectations for Student Learning Board certified 2.70 .571 Upper 3.06 .772 Lower 2.7 .599 I6 Use of Technology Board certified 2.3 .686 Upper 2.57 .938 Lower 2.54 .877 A1 Assessment for Understanding Board certified 2.80 .894 Upper 3.13 .619 Lower 2.85 .689 A2 Quality of Verbal Feedback Board certified 2.5 .826 Upper 2.94 .772 Lower 2.46 .776 M1 Classroom Management Board certified 2.80 .894 Upper 3.50 .730 Lower 2.69 .855 M2 Classroom Organization Board certified 3.0 .725 Upper 3.50 .516 Lower 2.92 .277 P1 Caring Board certified 2.85 .933 Upper 3.44 .629 Lower 3.15 .899 P2 Fairness and Respect Board certified 2.95 .759 Upper 3.31 .793 Lower 2.92 .494 P3 Positive Relationships Board certified 2.95 .887 Upper 3.56 .512 Lower 2.92 .862 P4 Encouragement of Responsibility Board certified 2.95 .621 Upper 3.38 .719 Lower 2.69 .630 P5 Enthusiasm Board certified 3.05 .887 Upper 3.44 .512 Lower 3.08 .760

57
Table 3.19 Teacher Effectiveness Observation Rating ANOVA Results
Variable F Sig. I1 Instructional Differentiation .174 .841I2 Instructional Focus on Learning 1.246 .297I3 Instructional Clarity .971 .386I4 Instructional Complexity .624 .540I5 Expectations for Student Learning 1.477 .239I6 Use of Technology .396 .675A1 Assessment for Understanding .890 .418A2 Quality of Verbal Feedback to Students 1.567 .20M1 Classroom Management 4.339 .019M2 Classroom Organization 4.742 .013P1 Caring 2.205 .122P2 Fairness and Respect 1.486 .237P3 Positive Relationships 3.465 .040P4 Encouragement of Responsibility 4.060 .024P5 Enthusiasm 1.369 .265
The ANOVA results indicated that the teacher groups differed on Classroom Management, Classroom Organization, Positive Relationships, and Encouragement of Responsibility. Follow-up tests were conducted. A summary of key findings from the comparative analysis of teacher classroom behaviors found the following:
Classroom Management: 1. Classroom Management (M1): The behavioral expectations for students of the
non-Board certified highly effective teachers (Upper) were rated by observers as higher than the expectations of the least effective teachers (Lower) or National Board certified teachers studied.
2. Classroom Organization (M2): The non-Board certified highly effective teachers
(Upper) were rated by observers as more organized than least effective teachers or National Board certified teachers.
Personal Qualities: 1. Positive Relationships (P3): The non-Board certified highly effective teachers
(Upper) were rated by observers as establishing more positive relationships with their students than the least effective teachers (Lower) or National Board certified teachers studied.
2. Encouragement of Responsibility (P4): National Board certified teachers
statistically could not be differentiated from non-Board certified highly effective (Upper) and least effective (Lower) teachers in the area of encouragement of responsibility; however, non-Board certified highly effective (Upper gain
score) teachers were rated higher than least effective (Low gain score) teachers and National Board certified teachers.

58
Summary of Findings: Phase I Statistical modeling was used to establish the achievement expectations for each student taught by a teacher included in the study. Using the outputs of the North Carolina End-of-Grade tests in Reading and Mathematics for fourth and fifth grade, the model allowed researchers to make predictions of student performance, compare the predictions to actual student performance, standardize across the measures, and aggregate the findings at the teacher level. One key finding was that the Teacher Achievement Indices found for Board certified teachers did not consistently put them in the top quartiles of all the teachers.
Summary of Findings: Phase II
In Phase II, three groups of teachers were compared to build an understanding of how National Board teachers might differ from other highly effective teachers and from least effective teachers (as identified from student achievement results). The three groups were: National Board teachers, highly effective non-Board certified teachers (upper gain score group), and least effective non-Board certified teachers (lower gain score group). The variables on which the three groups of teachers were compared in Phase II were organized into three categories for ease of presentation: (a) pre-instructional and dispositional, (b) in-classroom, and (c) overall teacher effectiveness. Pre-Instructional and Dispositional Variables The following differences between the three groups of teachers were found: • 31% of NBCTs had completed post-Master’s coursework while
none of the non-Board certified teachers in either group had done so. • NBCTs had significantly higher ratings in the cognitive challenge
of typical reading comprehension assignments given to students than non-Board certified teachers in both the upper and lower groups.
• Ratings of the teachers’ planning practices showed that the NBCT group had the highest mean ratings.
In-Classroom Variables Using the observational data collected by two trained classroom observers over a three-hour time period in the classroom, the following findings summarize the data: • No differences were found in the cognitive demand of the
questions asked by NBCTs and non-Board certified teachers or by their respective students.

59
• No significant group differences were found in terms of number of disruptions or number of students visibly disengaged, although the lower gain score group of teachers had higher numbers of students disengaged on average (9 compared to 5 and 4 for the NBCTs and the upper gain score group respectively).
• No differences were found between the three groups in terms of teacher interventions used to address disruptions or disengagement. Both verbal and nonverbal, and positive and negative interventions were noted.
Teacher Effectiveness Variables Based on three-hour observations of the classrooms in this study, the observers rated each teacher on 15 dimensions of teacher effectiveness. The following findings were noted: • Statistically significant differences were found between the three
groups of teachers on four dimensions: classroom management, classroom organization, positive relationships, and encouragement of responsibility.
• In all four cases, the non-Board certified upper gain score group of teachers scored higher on the dimension. The NBCT group scored somewhere between the upper and lower gain score groups.
In Section 4, the findings will be discussed in greater detail and conclusions and recommendations will be offered to summarize what can be learned from the study.

60
SECTION 4
DISCUSSION OF FINDINGS AND RECOMMENDATIONS

61
SUMMARY AND DISCUSSION OF THE FINDINGS This study examined the validity of Board certification at two levels. In Phase I, the study looked at how National Board certified teachers compared to other fifth-grade teachers in three districts in terms of their students’ achievement results on the state End-of-Grade Reading and Math tests. In Phase II, the study examined differences between a group of National Board certified teachers and two other groups of teachers identified only by their student achievement results (in the top 25% of teachers in terms of results or in the bottom 25% in terms of results). If National Board certification is a valid designation of effectiveness, then we would hope to find a pattern of differences between the three groups such that National Board teachers demonstrate significantly better teaching practices than the “least effective” group. Because of the advent of “value-added” approaches to evaluating school and teacher effectiveness (effectiveness based solely on student test scores), the study included a “highly effective” teacher group to discover the extent to which National Board certified teachers were similar in practices to this group of teachers. Central to the discussion of both phases of the study is the availability and nature of the data used in the study. Difficulties were encountered on multiple levels in obtaining the necessary data. In Phase I, the data requests made to the three districts were fairly extensive as noted in Table 2.4 in Section 2. Researchers identified a set of variables as being important to the construction of robust and viable prediction equations for student achievement gains. Participating school systems were willing to provide some of the information but were unable to fully meet our requests. One common problem that affected data availability was the lack of links between student achievement and teacher records. In some cases, this was by design, and in others, it was a byproduct of a larger problem for school systems around database interactivity.1 Currently databases for student services, transportation, human resources, and food services do not interact and thus it is difficult to match Student A and their background variables (e.g., gender) with Teacher 1 and their background variables (e.g., National Board certification). The result of this database weakness was that student records had to be searched for student background variables, and the human resources files had to be searched for National Board certification and other background teacher variables. Then each student had to be painstakingly hand matched with the fifth-grade teacher who taught them reading and math. One additional challenge was that the teacher listed on the student’s state testing information did not always match the teacher of record for reading and math. In North Carolina, the teacher listed on the header sheets for the tests was the teacher who administered the tests—not necessarily the ones
62
who taught the subject. In the case of fifth grade, the homeroom teacher frequently administers the test, but students sometimes change classes for math and reading instruction. Since the actual teacher sometimes differs from the one on the header sheet, this required additional filtering of the data. This process should have taken only a few months but in reality it took much longer to gather the disparate pieces of data and meticulously match them for accuracy. In Phase II, the data requirements involved gaining access to teachers’ classrooms for observations, artifact collection, and a subsequent interview. Many teachers contacted were reluctant to volunteer to participate in the study despite the typical assurances of confidentiality and a stipend. There was a mid-course increase in the stipend to increase participation and yet multiple phone calls and post cards were necessary to recruit the teachers who did ultimately participate. It should be noted that 50% of the eligible National Board certified teachers (NBCTs) invited to participate did participate in the study, a higher rate of participation than the other two groups (30% for the Upper group and 23% for the Lower group). However, it could have been the cover letter’s mention of the National Board for Professional Teaching Standards as the funding agency for this study that helped us gain greater consideration from this group. Gaining access to teachers’ classrooms for in-depth collection of data was a challenging process and is reflected in the fact that, even with multiple contacts and requests, only 51 teachers participated. In addition to the small sample sizes, which limited our ability to find differences between the three groups that may exist in a larger sample, it is also quite difficult to measure teaching practices in a fine-grained enough manner to detect significant differences between teachers. Most of our ratings of teachers’ classroom practices and artifacts were on a 4-point scale which, although most efficient for observers, also limited the degree to which teachers’ spread out on the dimensions rated. Consequently, to some degree, measurement restrictions may have affected the results in portions of the study. Our results provide some interesting findings about National Board teachers’ achievement results and teaching practices but definitive conclusions about the validity of the National Board designation should not be drawn from a single study such as this due to sample and measurement issues. Rather, we hope that this report has generated research questions and methods that can be replicated with larger samples and more grade levels to determine if the results are robust.

63
Phase I: The Relationship Between National Board Certification and Academic Growth of Students
Participating school districts provided several data sets to address the question of: 1.1 How do National Board certified teachers compare to all non-Board
certified teachers in a selected grade level(s) in terms of student achievement [controlling for prior student achievement, student demographic characteristics (e.g., SES, ESL, attendance), and classroom characteristics (e.g., class size)]?
Fourth- and fifth-grade students’ standardized testing and demographic data were used in the regression analysis, which included two-level hierarchical linear modeling. Student-level predictors were used in stage one and school-level variables were used at stage two.
Summary of Findings
Statistical modeling was used to establish the achievement expectations for each student. Recognizing that a variety of factors influence student achievement (e.g., family support and student motivation), the statistical model controlled for some of the student and class inputs such as gender, ethnicity, free and reduced lunch status, attendance, school size, and percentage receiving English as a second language services. Using the outputs of the North Carolina End-of-Grade tests in Reading and Mathematics for fourth and fifth grade, the model allowed researchers to make predictions of student performance, compare the predictions to actual student performance, standardize across the measures, and aggregate the findings at the teacher level. It should be noted that there were only 25 NBCTs in the sample versus 282 non-Board certified teachers. It would have been beneficial to have had a larger sample of NBCTs to increase the statistical power of the analyses and to provide a broader representation of NBCTs. Four different models were tested and Model 3, a hierarchical linear model including student-level and school-level variables, was used to create the teacher achievement indices. On the fifth-grade End-of-Grade tests, the student reading residuals fit a normal distribution, while the mathematics residuals significantly differed from a normal distribution as evidenced by moderate leptokurtosis. The student residuals were combined to form indices of teacher effectiveness that were named Teacher Achievement Indices (TAI). In examining the TAI distributions, it was found that the mathematics and reading TAIs did not differ from a normal distribution. The relationship between TAIs and demographic characteristics were
64
calculated. No significant correlation was found between the TAIs and teacher characteristics of years of service, ethnicity, and pay grade. A central issue of the study was the comparison of NBCTs to other teachers. There was no clear pattern of student achievement residuals based on whether their teacher was Board certified or not. The results at the teacher level using the TAI measures showed a similar result. There were no significant differences between the two groups (Board certified and non-Board certified) on the mathematics or reading Teacher Achievement Indices (TAIs). The NBCTs’ TAIs, however, were more tightly grouped than those of non-Board certified teachers suggesting that Board certified teachers’ achievement results may fall in a narrower range than found in the distribution of all teachers. Overall, a district’s expectation might be that Board certified teachers demonstrate achievement results that put them in the upper quartiles of all the teachers at that grade level. That is not what we found. The math achievement analyses showed that 47% of the Board certified teachers fell in quartiles 3 and 4. In reading, 61% of the Board certified teachers fell in quartiles 3 and 4. The reading and math results showed that around 20% of the 25 Board certified fifth-grade teachers fell in the lowest quartile of fifth-grade teachers (quartile 1 in Table 3.4) in terms of their TAIs.
Discussion of Phase I Findings Value-added modeling is a relatively new methodology that holds the promise of capturing student achievement effects by teacher in a quantitative manner, but it has been suggested that more research is needed to address value-added application issues, including construct validity.2 As a result of these factors, relatively few studies have used value-added methodology to examine teacher effects on student achievement, especially with National Board certified teachers. In this case, four teacher effectiveness prediction models were tested for best fit with the data to isolate outcomes that were uncorrelated with the control variables. Three models were found to be highly predictive of outcomes with Model 3, the HLM model with student-level predictors at stage one and school-level variables at stage two, explaining the greatest amount of variance. This model predicted 73% of the variance in fifth-grade reading and 78% of the variance in fifth-grade mathematics, suggesting that a considerable portion of student achievement variance was predictable from prior student achievement, student characteristics, and school characteristics. This model was better than other models that considered only student-level data. An additional challenge in comparing the findings of this study with the work of other researchers is the relative novelty of studying NBCTs as a

65
distinct group of educators. Only a handful of studies have been published in the last few years, and there does not seem to be a clear pattern in the findings. The findings from Phase I of the study were somewhat different from previous studies. One prior study found effect sizes of .07 to .08 in mathematics achievement gains3 and another documented an average effect size of .12 in reading and math over a four-year period.4 In our study, while NBCTs had slightly higher mean TAIs in reading and math, the mean TAIs were not statistically significant when compared to non-Board certified teachers. The National Board certified teachers in the sample did have TAIs falling in a narrower range, but the implications of this finding are unclear given the small sample of NBCTs under study. The studies to-date examining the relationship between National Board certification and student achievement have used different measures of student achievement (different state or district tests), focused on different teacher populations, and used different methodologies which contributes to the difficulty in establishing a clear pattern of results. It must be noted that student achievement is just one educational outcome measure. It does not address the extent to which NBCTs might promote more learner engagement, motivation for lifelong learning, or students who enjoy their educational experience. An earlier study by Bond and associates5 did find that NBCTs (compared to a group of teachers who were assessed but did not receive certification) were “demonstrably more proficient at fostering in their students a level of understanding that is richer, more elaborated, and more meaningfully interconnected with related concepts.”6 While there has been the expectation that the deep content and pedagogical emphasis of National Board certification would enhance student achievement, perhaps the current end-of-grade state tests do not capture the more intangible aspects of expert instruction as defined by National Board certification. The National Board certification process is a standards-based assessment with a focus on core instructional practices. While districts and others may have assumed that skills assessed by National Board certification should result in higher levels of student achievement, student achievement has not been one of the specific goals of the National Board for Professional Standards.
Phase II: Comparison of Teaching Practices Between Three Groups of Teachers A total of 51 teachers agreed to participate in an interview that focused on planning and assessment practices, submission of a typical assignment,

66
completion of a teacher beliefs survey, and a three-hour classroom observation. The data were collected to address the question of: 1.2 On what dimensions and in what ways do National Board certified
teachers differ from the following groups of teachers: non-Board certified teachers identified as producing high student gain scores (highly effective/upper gain score group) and non-Board certified teachers identified as producing low student gain scores (least effective/lower gain score group)?
More specifically, differences between the three groups of teachers were examined on the following: a. Planning and assessment practices; b. Ratings of the quality of typical reading comprehension assignments
given to students using the CRESST Classroom Indicator methodology;
c. Self-reported measure of teacher’s sense of efficacy; d. Level of questioning by both teachers and students (low, intermediate,
and high cognitive demand questions) in the classrooms; e. Classroom management and intervention strategies used; f. Measures of student behavior (e.g., number of disruptions and students
disengaged) observed in the classrooms; and g. Ratings on 15 dimensions of teacher effectiveness by trained
classroom observers. Summary of Findings
The three groups of teachers examined were: NBCTs, highly effective non-Board certified teachers (upper gain score), and least effective non-Board certified teachers (lower gain score). The variables in Phase II were organized into three categories for ease of presentation: (a) pre-instructional and dispositional, (b) in-classroom, and (c) teacher effectiveness. Pre-Instructional and Dispositional Variables The following differences between the three groups were found: • 31% of NBCTs reported completing post-Master’s coursework
while none of the non-Board certified teachers in the upper or lower groups reported doing so.
• Although not significant at the .05 level, NBCTs were rated the highest of the three groups on their planning practices. There were no significant differences in the ratings of assessment practices between the three groups.
• NBCTs had significantly higher ratings in the cognitive challenge of their typical assignments than non-Board certified teachers in both the upper and lower gain score groups. No other significant differences

67
between the groups on other ratings of the quality of the typical assignment were found. However, it is interesting to note that the lower gain score group of teachers had the lowest mean ratings of the three groups across all six quality assignment dimensions rated.
In-Classroom Variables Using the low inference, observational data collected by two trained observers over a three-hour time period in the classroom, the following findings summarize the data: • No differences were found in the cognitive demand of the
questions asked by NBCTs and non-Board certified teachers or by their respective students. All three groups of teachers generated around 40 questions per hour observed compared to roughly 2–3 student-generated questions per hour.
• No significant differences were found in the counts of disruptive behavior or visibly disengaged students between the three groups. However, the National Board group and Upper gain score group were observed to have 4–5 visibly disengaged students on the average compared to 9 for the Lower gain score group of teachers.
• No differences were found between the three groups in terms of the interventions teachers used to address disruptions or disengagement. Both verbal and nonverbal, and positive and negative interventions were noted.
Teacher Effectiveness Variables Based on three-hour visits to the classrooms in this study, two observers rated each teacher on 15 dimensions of teacher effectiveness. The following findings were noted when the ratings were compared across the three groups of teachers: • Statistically significant differences were found between the groups
on four dimensions: classroom management, classroom organization, positive relationships, and encouragement of responsibility.
• In all four cases, the non-Board certified Upper gain score group of teachers scored highest on the dimension. NBCTs scored somewhere between the upper and lower gain score groups.
• On most other dimensions, NBCTs had mean ratings that fell in between the upper and lower gain score groups.
Discussion of Phase II Findings
Often an assumption is made that National Board certification is synonymous with highly effective teaching. After all, teachers who pursue National Board certification are experienced, motivated, and willing to submit their work for scrutiny and evaluation. Teacher quality research

68
has found that teaching experience, to some degree, is positively related to student achievement.7 While previous studies have explored a variety of background characteristics of NBCTs, the purpose of Phase II was to determine if NBCTs were measurably different from non-Board certified teachers with high and low student achievement based on selected measures of classroom practices. Because of the small sample sizes in the three groups, the statistical power of many of the comparisons was weakened. Additionally, having to depend on volunteers in Phase II may have introduced an equalizing force across the three groups in that only the more confident and articulate teachers may have agreed to participate. To further describe the differences found between the three groups of teachers, graphical representations of the measures were constructed. These graphical representations are organized by the three categories of variables assessed: 1) Pre-instructional and Dispositional, 2) In-classroom, and 3) Classroom Teacher Effectiveness. All of the variables in the charts were standardized so that all variables could be observed along a common metric. The graphs are presented in the context of the more general discussion of each cluster of variables. Pre-Instructional and Dispositional Variables Educational attainment. In examining the participant demographics related to educational attainment, only the NBCT group reported completing post-master’s course work (31% reported taking such coursework). Similarly, 62% of NBCTs had more than a Bachelor’s degree compared with 30% of the Lower gain score group of teachers and 53% of the Upper gain score group of teachers. NCBTs appear to be teachers who take the initiative to seek external opportunities to validate and expand their professional knowledge and competencies, both through graduate education and challenges such as National Board certification. Teacher reported efficacy. No statistical differences were found in the area of teachers’ efficacy as reported on the survey of Teacher Beliefs. Surprisingly, the three teacher groups viewed their effectiveness and ability in the classroom in a similar manner. While we did not expect to see gross differences between the NBCTs and the Upper gain score teacher group, it was expected that the Lower gain score group of teachers would view themselves as less capable of effecting change and control in the classroom. This hypothesis was incongruent with the findings. However, it is possible that teachers in the Lower gain score group who might have been less confident may not have agreed to participate in the study, thus, narrowing the range of responses from those who agreed to participate. Planning and assessment practices. Based on interviews, NBCTs received the highest average rating on their planning practices. In informal reviews
69
of the transcripts, it appeared that the National Board certified teachers talked more about the “big” picture of planning and seemed more able to articulate modifications that had been made to their teaching in response to student needs. In terms of ratings of assessment practices (expressed use of data to improve instruction), there were no discernible thematic differences in the interview data between the three teacher groups. Teachers in all three groups were aware of various assessment methods, but they also reported inconsistent use of them. A number of teachers expressed a lack of confidence in using assessment results. Thus, this may be an area in which some teachers in all groups lacked knowledge and skills. Typical Assignments. Statistically significant differences were found between the groups on one quality indicator from the typical reading comprehension assignments submitted by teachers for ratings. NBCTs had higher ratings of cognitive challenge of the assignment than the Upper and Lower gain score groups. The average rating for cognitive challenge of assignments submitted by NBCTs was 2.83 on a 4-point scale, with a score of “3” indicating that the assignment required construction of knowledge from the student that exceeds basic comprehension of a text. Significant differences between teacher groups were not found on the other quality of assignment ratings. Relatively low average ratings of teachers’ typical assignments are consistent with prior research by CRESST. Teachers, in general, do not typically assign students highly cognitively challenging (higher-order thinking) tasks. CRESST found that the majority of assignments collected from teachers in economically disadvantaged schools were considered to be of “basic” quality (i.e., average score of 1.64 on a 4-point scale) in terms of cognitive challenge.8 Data collected from elementary schools that served more economically advantaged students who were relatively higher achieving indicated that students from the higher achieving schools received slightly higher-rated assignments overall (average of 2.23), though there were certainly exceptions to this pattern.9 Overall, NBCTs appear stronger on several of the pre-instructional and dispositional variables than either group of non-Board certified teachers, especially in the areas of graduate course-taking, cognitively challenging assignments, and quality of planning practices (see Figure 4.1). These are some of the skill areas stressed by the National Board certification process, and it is logical that NBCTs would excel in those areas that closely match the demands of the National Board for Professional Teaching Standards assessment process.

70
Figure 4.1 Pre-Instructional and Dispositional Variables from Interviews and Typical Assignments
-0.80000
-0.60000
-0.40000
-0.20000
0.00000
0.20000
0.40000
0.60000National Board Upper Lower
Group
Mea
n
CogChalClarityGCClarityGAlignmentGTAlignmentGGFeedbackPlanningAssessment
In-Classroom Variables The findings from the classroom observations revealed that the three teacher groups were more similar than different on the observed behaviors (see Figure 4.2). Questioning. In an earlier exploratory study of highly effective and ineffective teachers based on student achievement gains,10 a statistically significant difference had been found in the number of higher-order questions asked by effective teachers as compared to ineffective teachers. Similar results were expected in this study but were not found. While the data suggested a trend favoring the NBCTs, the differences between groups were insignificant, in part, due to large standard deviations in each of the three teacher groups. Disruptions and disengagement. Given the emphasis on rich and varied teaching strategies in the National Board certification process, it would seem logical that NBCTs have fewer disruptions and disengaged students. We found no statistical significance in the group differences for number of disengaged students. However, the Lower gain score group of teachers did have a higher average number of visibly disengaged students than the NBCT group or the Upper gain score group (an average of 9 students visibly disengaged compared to 4–5 for the other two groups). This

71
finding must be viewed with some skepticism because we cannot assume a random distribution of NBCTs in schools or a random distribution of students in the classes of these three groups of teachers. Prior research has indicated that NBCTs tend to be found in higher SES schools and therefore, the students with whom they work may be more easily engaged.11 Management strategies. There were no discernible patterns or statistically significant findings relative to the management strategies used by teachers in the three groups. The lack of significance in the findings is due somewhat to the large variations in the practices of teachers. The standard deviations were larger than the means in some case, suggesting that the observations and recording of these behaviors were quite variable given the limited time teachers were observed. Figure 4.2 In-Classroom Variables
-0.60000
-0.50000
-0.40000
-0.30000
-0.20000
-0.10000
0.00000
0.10000
0.20000
0.30000
0.40000National Board Upper Lower
Group
Mea
n
LCDTLCDSICDTICDSHCDTHCDSDisruptingDisengagedMSVerbMSNVerbNIPosNINeg
Note: All variables have been standardized using the same rubric for comparative purposes. Scores for negatively stated variables (disengaged behavior and disruptive behavior) were inverted such that lower values indicate less satisfactory outcomes.
Teacher Effectiveness Variables The 15 teacher effectiveness dimensions rated by the observers were categorized into four categories of practice. Differences were found between groups of teachers in the areas of classroom management and

72
personal qualities, but not in the areas of instruction or assessment. Specifically, out of the 15 dimensions rated, significant differences were found on the dimensions of classroom management, classroom organization, positive relationships, and encouragement of responsibility. These distinctions favored the non-Board certified teachers with higher student achievement gains (Upper gain score group).
As depicted in Figure 4.3, the Upper gain score group of teachers had higher mean ratings than the NBCT group on all dimensions. Based on these results, one hypothesis is that teachers who are “effective” in terms of their student achievement results have some particular set of attitudes, approaches, strategies, or connections with students that manifest themselves in non-academic ways (positive relationships, encouragement of responsibility, classroom management and organization). For instance, this ability to produce unusually high student achievement gains may have more to do with a “motivational set” the teachers are able to engender in students rather than particular instructional strategies or teaching skills per se. Moreover, this motivational set may either not be assessed in the National Board certification process or be very difficult to assess through an external certification process.

73
Figure 4.3 Teacher Effectiveness Variables
-0.60000
-0.40000
-0.20000
0.00000
0.20000
0.40000
0.60000
0.80000National Board Upper Lower
Group
Stan
dard
Sco
re
DifferentitationFocusClarityComplexityExpectationsTechnologyAssessmentVerbal FeedbackManagementOrganizationCaringFairnessRelationshipsResponsibilityEnthusiasm
Conclusions There are a number of methodological limitations to this study that should be acknowledged prior to the assertion of conclusions. They include:
1. Phase I was conducted at one grade level (fifth grade) and, thus, may have findings that are unique to teachers at this grade level.
2. In Phase I, the availability of data from districts on both background variables and classroom variables was limited.
3. The sample size in Phase II (n=51) was small, making it more difficult to detect real differences between the groups. Replication with larger sample sizes is suggested.
4. High standard deviations were found on multiple variables in Phase II of the study, which could indicate problems with the reliability of the instrumentation, the consistency of the observers, and/or naturally occurring variations in the practices of classroom teachers.
5. Student achievement in reading and math was operationalized by performance on multiple-choice state tests. Different Phase I and Phase II results might have been found if other (e.g., performance-based) achievement measures were used in exploring the relationship between National Board certification and student

74
achievement and in exploring differences between National Board teachers and other groups of teachers identified as high and low on these other measures of student learning.
The following conclusions were drawn from Phase I of the study: When sorted into National Board certified versus non-certified groups, for our population of 307 fifth-grade teachers from three districts for whom we had longitudinal student data (at least ten students), we found that
• The Board certified group (n=25) had slightly higher Teacher Achievement Indices in reading and math than the non-Board certified group (n=282) but the group differences were not statistically significant.
• The Board certified group had smaller standard deviations for their TAIs than the non-Board certified teacher group suggesting less variability in the group than in the larger group of non-certified teachers.
• There were “false positives” in the National Board certified group in that approximately 20% of the NBCTs fell in the bottom quartile of all the fifth-grade teachers on the Teacher Achievement Indices (see Table 3.4). That is, any expectation that all National Board certified teachers would be exemplary in their student achievement results on state tests was not borne out.
The following conclusions were based on findings from Phase II of the study:
• NBCTs reported pursuing post-Masters coursework at higher rates than non-Board certified teachers.
• Typical reading comprehension assignments submitted by NBCTs were rated significantly (p<.05) higher on cognitive challenge than those of non-Board certified teachers in both the upper and lower gain score groups.
• NBCTs appeared to have some distinguishing characteristics that reflect cognitive or expressive abilities (pursuit of graduate coursework, more cognitively challenging assignments, and higher ratings on planning practices). However, as a group, they were indistinguishable from the other two groups of teachers on a variety of in-classroom variables (e.g., cognitive demand of questioning, management techniques, disengaged students).
• NBCTs received significantly (p<.05) lower ratings from observers, when compared to the Upper gain score group of teachers, on selected teacher effectiveness dimensions: classroom management, classroom organization, positive

75
relationships with students, and student encouragement of responsibility.
Recommendations
First and foremost, the conclusions from this study must be viewed as resulting from a particular set of research conditions in one study. As with most research studies, it is important to look at single studies within the body of research on the topic rather than the study in isolation. The following recommendations pertain to the larger body of research on the National Board process. 1. More research needs to be conducted to determine the relationship
between National Board certification and student achievement, observed classroom practices, and global ratings of dimensions of teacher effectiveness. The areas of planning for instruction, cognitive challenge or overall quality of instructional materials and assignments used with students, and overall ability to reflect on practices are particularly promising in terms of distinguishing teachers with National Board certification. Somewhat unexpectedly, observer ratings of the teachers’ classroom management, classroom organization, positive relationships with students, and student encouragement of responsibility were higher for the highly effective, upper gain score group of non-Board certified teachers than for the NBCTs as a group. Comparisons between NBCTs and teachers highly effective in terms of their students’ achievement results are important to explore further to determine if there are some additional assessment criteria that could be used in the National Board certification process.
2. Researchers using extant longitudinal student achievement databases from states and districts should take extreme care in making assumptions about the teacher who might have taught a student in a given subject area when district or state databases are used. In a substantial number of cases, we found that the teacher who administered a given test did not teach the student and yet this is often presumed to be the case, even by personnel in the school district.
3. This study has demonstrated the potential of crafting HLM models that account for a large percentage of the variance in student achievement residuals in reading and math for exploring teacher effectiveness.
4. To the extent that findings in support of value-added effects on student achievement of National Board certification are mixed within and across studies, then we must examine implications for the use of the certification results. If there are “false positives” (teachers who receive certification but who are in the bottom quartile of teachers in terms of their student achievement results), what does this mean for states’ and districts’ reliance on National Board certification as an indicator of teacher excellence? Should districts use multiple measures of teacher

76
effectiveness in determining which teachers have the potential to be effective in working with at-risk populations or in providing mentoring and support to other teachers?
5. Many states and school systems across the country have begun to recognize NBCTs in a variety of ways, including the award of salary supplements. NBCTs deserve to be recognized for their superior skills in a variety of areas, but National Board certification should not be used as a proxy for increased student achievement. If school systems want to reward teachers for student achievement gains, then a methodology similar to the one proposed here with controls for prior achievement and a host of contextual issues that influence student achievement, needs to be used.
6. The current National Board certification process is heavily based on instructional practices. We recommend infusing more emphasis on student outcomes in the certification to balance the process and product aspects of the assessment. This study examined student achievement in reading and math as the learning outcome measures, but other outcomes (e.g., quality of writing, student attitude toward learning, student creativity, and goal-oriented student behavior) also could be explored.

77
1 See discussion of this problem in: Trotter, A. (2005, February 2). Software framework opens up data-
sharing. Education Week, p. 12. 2 McCaffrey, D. F., Lockwood, J. R., Koretz, D. M., & Hamilton, L. S. (2003). Evaluating value-added
models for teacher accountability. Santa Monica, CA: Rand Corporation. 3 Cavalluzzo, L. C. (2004). Is National Board Certification an effective signal of teacher quality?
Alexandria, VA: The CAN Corporation. Retrieved February 15, 2005, from www.teachingquality.org/resources/pdfs/CavaluzzoStudy.pdf
4 Vandevoort, L. G., Amrein-Beardsley, A., & Berliner, D. C., (2004). National board certified teachers and their students’ achievement. Educational Policy Analysis Archives, 12(46), 1–117.
5 Bond, L., Smith, T., Baker, W. K., & Hattie, J. A. (2000). The certification system of the National Board
for Professional Teacher Standards: A construct and consequential validity study. Greensboro, NC: Center for Educational Research and Evaluation, The University of North Carolina at Greensboro.
6 Ibid, p. 140 7 Covino, E. A., & Iwanicki, E. (1996). Experienced teachers: Their constructs on effective teaching.
Journal of Personnel Evaluation in Education, 11, 325–363; Fetler, M. (1999). High school staff characteristics and mathematics test results. Educational Policy Analysis Archives, 7(9). Retrieved from http://olam.ed.asu.edu/v7n9; Reynolds, A. (1992). What is competent beginning teaching? A review of the literature. Review of Educational Research, 62(1), 1–35.
8 Clare, L. (2000). Using teachers’ assignments as an indicator of classroom practice. (Center for the
Study of Evaluation Technical Report #532). Los Angeles: University of California, National Center for Research on Evaluation, Standards, and Student Testing (CRESST).
9 Clare, L., Valdés, R., Pascal, J., & Steinberg, J. R. (2001). Teachers’ assignments as indicators of
instructional quality in elementary schools. (Center for the Study of Evaluation Technical Report #545). Los Angeles: University of California, National Center for Research on Evaluation, Standards, and Student Testing (CRESST).
10 Tucker, P. D., Stronge, J. H., & Ward, T. J. (2003, April). Teacher effectiveness and student learning: What do good teachers do? Paper presented at the annual conference of the American Educational Research Association, Chicago, IL. 11 Goldhaber et al., 2004

78
Appendix A
Instruments

79
Teacher Beliefs-TSES
This questionnaire is being used by SERVE as part of a study on qualities of effective teachers. It is necessary for you to indicate your voluntary participation below. Your name will be removed prior to the data entry of your responses. Please sign the statement below: I understand that my participation is voluntary, that I will not be identified in any written report, and the results of this questionnaire will not impact my teacher evaluation. Print Name ______________________________________ Signature__________________________________ Date_________
This questionnaire is designed to help us gain a better understanding of the kinds of things that create challenges for teachers.
Directions: Please indicate your opinion about each of the questions below by marking one of the nine responses in the columns on the right side. The response scale ranges from “None at all” (1) to “A Great Deal” (9), with “Some Degree” (5) representing the mid-point between these low and high extremes. You may choose any of the nine possible responses, as each represents a degree on the continuum. Please respond to each of the questions by considering the combination of your current ability, resources, and opportunity to do each of the following in your present position. Your answers are confidential. N
one
at a
ll
Ver
y Li
ttle
Som
e D
egre
e
Qui
te A
Bit
A G
reat
Dea
l
1. How much can you do to control disruptive behavior in the classroom? (1) (2) (3) (4) (5) (6) (7) (8) (9)
2. How much can you do to motivate students who show low interest in school work?
(1) (2) (3) (4) (5) (6) (7) (8) (9)
3. How much can you do to get students to believe they can do well in school work?
(1) (2) (3) (4) (5) (6) (7) (8) (9)
4. How much can you do to help your student’s value learning? (1) (2) (3) (4) (5) (6) (7) (8) (9)
5. To what extent can you craft good questions for your students? (1) (2) (3) (4) (5) (6) (7) (8) (9)
6. How much can you do to get children to follow classroom rules? (1) (2) (3) (4) (5) (6) (7) (8) (9)
7. How much can you do to calm a student who is disruptive or noisy? (1) (2) (3) (4) (5) (6) (7) (8) (9)
8. How well can you establish a classroom management system with each group of students?
(1) (2) (3) (4) (5) (6) (7) (8) (9)
9. How much can you use a variety of assessment strategies? (1) (2) (3) (4) (5) (6) (7) (8) (9)
10. To what extent can you provide an alternative explanation or example when students are confused?
(1) (2) (3) (4) (5) (6) (7) (8) (9)
11. How much can you assist families in helping their children do well in school? (1) (2) (3) (4) (5) (6) (7) (8) (9)
12. How well can you implement alternative strategies in your classroom? (1) (2) (3) (4) (5) (6) (7) (8) (9)
Please complete the information of the back of this form
For Study Use Only (0) (0) (0) (0) (0) (0) (1) (1) (1) (1) (1) (1) (2) (2) (2) (2) (2) (2) (3) (3) (3) (3) (3) (3) (4) (4) (4) (4) (4) (4) (5) (5) (5) (5) (5) (5) (6) (6) (6) (6) (6) (6) (7) (7) (7) (7) (7) (7) (8) (8) (8) (8) (8) (8) (9) (9) (9) (9) (9) (9)

80
Thank you for your participation!
8. How would you rate the level of resource support for purchasing materials to use in your classroom?
Excellent Good Adequate Poor
9. How would you rate the quality of your professional development experiences?
Excellent Good Adequate Poor
Have you had professional development regarding… 10. Working with special populations? Yes No 11. Higher order thinking skills? Yes No 12. Science laboratory skills? Yes No
13. What type of professional development have you had since 2001 and what was its subject? Coursework _____________________________________ Conference _____________________________________ Workshop ______________________________________ Other training program ____________________________
1. What is the context of your school? Rural Suburban Urban
2. How many years have you taught? 1 2 3 4 5 6 7 8 9 10 11 12 13 14 15 16 17 18 19 20 22 23 24 25 26+ Please state ________
3. How many years have you taught the grade level you are teaching during the 2003-2004 school year?
1 2 3 4 5 6 7 8 9 10 11 12 13 14 15 16 17 18 19 20 22 23 24 25 26+ Please state ________
4. Do you hold state certification in the grade level in which you teach?
Yes No
5. What is/are your area(s) of licensure? Academically gifted Birth through kindergarten Elementary education (K-6) Middle grades Elementary second language endorsement Language arts Mathematics Preschool/elementary Science Social studies Special education Please state __________________ Alternative certification Other Please state ____________________________
6. What subjects do you teach? Language Arts Mathematics Science Social Studies Other Please state _____________________________
7. Are you a nationally board certified (NBPTS) teacher? Yes No
A) Are you currently a candidate for NBPTS? Yes No
B) Do you plan to apply for NBPTS certification? Yes No
14. How would you rate the quality of your college preparation program?
Excellent Good Adequate Poor
15. What is your highest level of education? Bachelor’s degree (B.A./B.S.) Master’s degree Master’s degree plus 15 additional course hours Education Specialist Doctoral degree (Ed.D./Ph.D.)
16. Where did you earn your degrees and what was your major? College/University Major/Area BA/BS ____________________, in __________________ MA ______________________, in __________________ Ed.S._____________________, in ___________________ Ed.D./Ph.D. _______________, in ___________________
17. What is your gender? Female Male
18. What is your racial identity? African American Asian Hispanic White, non Hispanic Other
19. What type of students do you serve in your classroom? Regular education Gifted Special Education Heterogeneous Remedial (not special education)
20. What percentage of your students receives a free/ reduced lunch?
0-25% 26-50% 51-75% 76-100%
Directions: Please respond to each of the questions below either by checking the applicable response or writing in the requested information.

81
Questioning Techniques Analysis Chart
Observer:________________________ Date: Teacher:___________________________ Start & End Times: Grade/Subjects:_____________________ School: On a separate piece of paper, record all instructional questions asked by the teacher, orally and in writing, for one hour during the language arts lesson. In addition, also include student generated questions and designate with an “S.” Omit procedural questions, such as “Would you read the directions?” Note any question that the teacher answers by circling it in your notes. After the observation, write in 3 examples of each question type in the grid below. Next, tally the number of questions at each level by teachers and students (separate count for each) and calculate a percentage at each level. Attach the entire script of questions asked. Type of Question Total # Percent Low Cognitive Demand (Knowledge) Teacher generated- Student generated-
Intermediate Cognitive Demand (Comprehension & Application) Teacher generated- Student generated-

82
Questioning Techniques Analysis Chart Type of Question Total # Percent High Cognitive Demand (Analysis, Synthesis & Evaluation) Teacher generated- Student generated-
Total # of Teacher Generated Questions:_____________ Total # of Student Generated Questions:______________

83
Guide for Categorizing Questions for Questioning Techniques Analysis Chart
Type of Question Teacher Generated
(What does T ask S to do) Student Generated
Low Cognitive (Knowledge or Recall of information)
Outline Recognize Recite from memory Identify Name Order Recall List Define
Procedural Questions (ie. Can I do… What goes here… How do I…
Intermediate Cognitive Demand (Comprehension and Application)
Discuss Classify Interpret Explain Create own meaning Predict Problem-solving Demonstrate
Curiosity Questions: Relating to another topic Asking for more information Using information in another context Adding to teacher explanation with own
High Cognitive Demand (Analysis, Synthesis & Evaluation)
Compare/Contrast Ask for cause/effect Ask about relationships between ideas/things Ask to differentiate Design or create (not copy) Plan Perform Predict outcome Evaluate/judge
Evaluation Questions: What do you think happens… Why …. What happens if…

84
Tim
e on
Tas
k C
hart
Obs
erve
r
Dat
e
Tea
cher
S
ubje
ct
Num
ber o
f Stu
dent
s
Sta
rt ti
me
Inte
rval
T
ask,
act
ivity
, eve
nt, q
uest
ion
Off
-Tas
k B
ehav
iors
(N
ote
# of
stud
ents
and
des
crib
e be
havi
or.)
Man
agem
ent S
trat
egy
Nat
ure
of In
terv
entio
n
5 m
in
Dis
rupt
ing
Oth
ers
_
____
_ #
Vis
ibly
Dis
enga
ged
___
___
#
Ver
bal
ο
C
omm
ents
N
onve
rbal
ο
Non
e ο
Posi
tive
ο
C
omm
ents
N
egat
ive
ο
Neu
tral
ο
10 m
in
Dis
rupt
ing
Oth
ers
_
____
_ #
Vis
ibly
Dis
enga
ged
___
___
#
Ver
bal
ο
C
omm
ents
N
onve
rbal
ο
Non
e ο
Posi
tive
ο
C
omm
ents
N
egat
ive
ο
Neu
tral
ο
15 m
in
Dis
rupt
ing
Oth
ers
_
____
_ #
Vis
ibly
Dis
enga
ged
___
___
#
Ver
bal
ο
C
omm
ents
N
onve
rbal
ο
Non
e ο
Posi
tive
ο
C
omm
ents
N
egat
ive
ο
Neu
tral
ο
20 m
in
Dis
rupt
ing
Oth
ers
_
____
_ #
Vis
ibly
Dis
enga
ged
___
___
#
Ver
bal
ο
C
omm
ents
N
onve
rbal
ο
Non
e ο
Posi
tive
ο
C
omm
ents
N
egat
ive
ο
Neu
tral
ο
25 m
in
Dis
rupt
ing
Oth
ers
_
____
_ #
Vis
ibly
Dis
enga
ged
___
___
#
Ver
bal
ο
C
omm
ents
N
onve
rbal
ο
Non
e ο
Posi
tive
ο
C
omm
ents
N
egat
ive
ο
Neu
tral
ο

85
Tim
e on
Tas
k C
hart
Inte
rval
T
ask,
act
ivity
, eve
nt, q
uest
ion
Off
-Tas
k B
ehav
iors
(N
ote
# of
stud
ents
and
des
crib
e be
havi
or.)
Man
agem
ent S
trat
egy
Nat
ure
of In
terv
entio
n
30 m
in
Dis
rupt
ing
Oth
ers
_
____
_ #
Vis
ibly
Dis
enga
ged
___
___
#
Ver
bal
ο
C
omm
ents
N
onve
rbal
ο
Non
e ο
Posi
tive
ο
C
omm
ents
N
egat
ive
ο
Neu
tral
ο
35 m
in
Dis
rupt
ing
Oth
ers
_
____
_ #
Vis
ibly
Dis
enga
ged
___
___
#
Ver
bal
ο
C
omm
ents
N
onve
rbal
ο
Non
e ο
Posi
tive
ο
C
omm
ents
N
egat
ive
ο
Neu
tral
ο
40 m
in
Dis
rupt
ing
Oth
ers
_
____
_ #
Vis
ibly
Dis
enga
ged
___
___
#
Ver
bal
ο
C
omm
ents
N
onve
rbal
ο
Non
e ο
Posi
tive
ο
C
omm
ents
N
egat
ive
ο
Neu
tral
ο
45 m
in
Dis
rupt
ing
Oth
ers
_
____
_ #
Vis
ibly
Dis
enga
ged
___
___
#
Ver
bal
ο
C
omm
ents
N
onve
rbal
ο
Non
e ο
Posi
tive
ο
C
omm
ents
N
egat
ive
ο
Neu
tral
ο
50 m
in
Dis
rupt
ing
Oth
ers
_
____
_ #
Vis
ibly
Dis
enga
ged
___
___
#
Ver
bal
ο
C
omm
ents
N
onve
rbal
ο
Non
e ο
Posi
tive
ο
C
omm
ents
N
egat
ive
ο
Neu
tral
ο
55 m
in
Dis
rupt
ing
Oth
ers
_
____
_ #
Vis
ibly
Dis
enga
ged
___
___
#
Ver
bal
ο
C
omm
ents
N
onve
rbal
ο
Non
e ο
Posi
tive
ο
C
omm
ents
N
egat
ive
ο
Neu
tral
ο

86
Tim
e on
Tas
k C
hart
Inte
rval
T
ask,
act
ivity
, eve
nt, q
uest
ion
Off
-Tas
k B
ehav
iors
(N
ote
# of
stud
ents
and
des
crib
e be
havi
or.)
Man
agem
ent S
trat
egy
Nat
ure
of In
terv
entio
n
60 m
in
Dis
rupt
ing
Oth
ers
_
____
_ #
Vis
ibly
Dis
enga
ged
___
___
#
Ver
bal
ο
C
omm
ents
N
onve
rbal
ο
Non
e ο
Posi
tive
ο
C
omm
ents
N
egat
ive
ο
Neu
tral
ο
N
otes
: “D
isru
ptin
g ot
hers
” w
ould
incl
ude
stud
ents
who
are
not
onl
y of
f tas
k bu
t atte
mpt
ing
to d
istra
ct o
ther
s fro
m th
e te
ache
r ass
igne
d ta
sks.
“Vis
ibly
dis
enga
ged”
wou
ld in
clud
e st
uden
ts w
ho a
re d
aydr
eam
ing,
doo
dlin
g, st
arin
g ou
t the
win
dow
or o
ther
wis
e no
t foc
usin
g on
the
teac
her’
s ass
igne
d ta
sks
but w
ho a
re n
ot d
istra
ctin
g ot
her s
tude
nts.
“Man
agem
ent s
trate
gy”
wou
ld b
e an
y ac
tion
take
n by
the
teac
her e
ither
in re
spon
se to
a la
ck o
f atte
ntio
n by
stud
ents
or i
n an
ticip
atio
n of
pos
sibl
e di
srup
tions
. “N
atur
e of
inte
rven
tion”
wou
ld in
clud
e po
sitiv
e re
spon
ses s
uch
as p
rais
ing
stud
ents
who
are
atte
ndin
g or
par
ticip
atin
g, n
egat
ive
resp
onse
s suc
h as
yel
ling
at
stud
ents
, or n
eutra
l suc
h as
cha
ngin
g th
e ac
tivity
or m
ovin
g ne
ar th
e st
uden
t or s
tude
nts.
Und
er “
Com
men
ts,”
not
e th
e ty
pe o
f act
ion
take
n or
wha
t was
said
.

87
Cla
ssro
om E
vent
s Rec
ord
Obs
erve
r
Teac
her
D
ate
Num
ber o
f Stu
dent
s
Star
t tim
e
Dir
ectio
ns:
Des
crib
e th
e le
ngth
of t
ime
and
natu
re o
f eve
ry c
lass
room
act
ivity
. Sca
n th
e cl
assr
oom
on
a re
gula
r bas
is a
nd d
escr
ibe
the
activ
ity ta
king
pla
ce m
akin
g no
tatio
ns o
n th
e su
bjec
t bei
ng c
over
ed, t
he ty
pe o
f act
ivity
, and
the
appr
oach
bei
ng u
sed.
Dra
w a
line
ac
ross
the
form
to d
emar
cate
eac
h ch
ange
in a
ctiv
ity.
Tim
e D
escr
iptio
ns o
f cla
ssro
om a
ctiv
ity a
nd in
tera
ctio
n Su
bjec
t (L
A,
M, S
c, S
S, O
) A
ctiv
ity
(T, T
I, SA
, O)
App
roac
h (W
, S, I
)
Cod
es fo
r ea
ch c
ateg
ory:
Su
bjec
t LA
= L
angu
age
Arts
M
= M
ath
Sc =
Sci
ence
SS
= S
ocia
l Stu
dies
O
= O
ther
(ple
ase
spec
ify)
Act
ivity
T
= Tr
ansi
tion
TI =
Tea
cher
-cen
tere
d in
stru
ctio
n SA
= S
tude
nt-c
ente
red
activ
ity
O =
Oth
er (p
leas
e sp
ecify
)
App
roac
h
W =
Who
le g
roup
inst
ruct
ion
S
= Sm
all g
roup
inst
ruct
ion
I =
Indi
vidu
aliz
ed in
stru
ctio
n

88
Tim
e D
escr
iptio
ns o
f cla
ssro
om a
ctiv
ity a
nd in
tera
ctio
n Su
bjec
t (L
A,
M, S
c, S
S, O
) A
ctiv
ity
(T, T
I, SA
, O)
App
roac
h (W
, S, I
)
Cod
es fo
r ea
ch c
ateg
ory:
Su
bjec
t LA
= L
angu
age
Arts
M
= M
ath
Sc =
Sci
ence
SS
= S
ocia
l Stu
dies
O
= O
ther
(ple
ase
spec
ify)
Act
ivity
T
= Tr
ansi
tion
TI =
Tea
cher
-cen
tere
d in
stru
ctio
n SA
= S
tude
nt-c
ente
red
activ
ity
O =
Oth
er (p
leas
e sp
ecify
)
App
roac
h
W =
Who
le g
roup
inst
ruct
ion
S
= Sm
all g
roup
inst
ruct
ion
I =
Indi
vidu
aliz
ed in
stru
ctio
n

89
Tea
cher
Inte
rvie
w
PL
AN
NIN
G
L
ong-
rang
e pl
anni
ng w
ith se
quen
cing
T
here
is e
vide
nce
of st
rong
da
ily, w
eekl
y an
d un
it pl
anni
ng
with
con
tinui
ty a
cros
s uni
ts
focu
sing
on
key
topi
cs. T
he
teac
her
prov
ides
a w
ell-
artic
ulat
ed r
atio
nale
for
sequ
enci
ng w
ith e
vide
nce
of
refle
ctio
n on
pas
t pla
ns a
nd
stud
ent p
erfo
rman
ce in
de
velo
ping
and
mod
ifyin
g su
bseq
uent
pla
ns.
The
re is
evi
denc
e of
con
siste
nt
plan
ning
of d
aily
inst
ruct
iona
l go
als,
stra
tegi
es a
nd m
etho
ds o
f as
sess
men
t. T
he te
ache
r ca
n pr
ovid
e a
clea
r ra
tiona
le fo
r th
e de
sign
and
sequ
ence
of u
nits
.
The
re is
evi
denc
e of
inco
nsis
tent
or
spor
adic
pla
nnin
g of
dai
ly
goal
s. T
here
are
no
clea
r in
stru
ctio
nal a
nd/o
r as
sess
men
t go
als o
r st
rate
gies
. Pl
ans c
onsi
st
of li
ttle
mor
e th
an p
ages
of t
exts
or
topi
cs to
be
addr
esse
d. U
nit
plan
ning
is in
adeq
uate
or
wea
k.
The
re is
no
evid
ence
of d
aily
, w
eekl
y or
uni
t pla
nnin
g. T
here
is
no
evid
ence
of c
ontin
uity
ac
ross
pla
ns o
r lo
ng-t
erm
pl
anni
ng.
Inte
rvie
w Q
uest
ions
for
Plan
ning
:
1.1)
M
ay I
see
a se
lect
ion
of y
our l
esso
n pl
ans?
[ L
ook
for g
oals
, ins
truct
iona
l stra
tegi
es a
nd a
sses
smen
t on
a da
ily b
asis
.) 1.
2)
How
do
you
dete
rmin
e th
e de
sign
and
sequ
enci
ng o
f you
r uni
ts?
1.
3)
Wha
t sor
t of t
hing
s do
you
cons
ider
whe
n de
cidi
ng w
hen
to te
ach
a ce
rtain
uni
t?
1.4)
W
hat p
art d
oes s
tude
nt p
erfo
rman
ce p
lay
in sh
apin
g yo
ur p
lans
? O
n a
daily
bas
is?
Lon
g-te
rm?
1.5)
W
hat s
ort o
f thi
ngs u
sual
ly c
ause
s yo
u to
cha
nge
your
pla
ns w
ithin
a d
ay o
r wee
k?

90
ASS
ESS
ME
NT
Ana
lysi
s of s
tude
nt a
sses
smen
t res
ults
The
teac
her d
emon
stra
tes
exce
ptio
nal s
kill
in a
naly
zing
st
uden
t ass
essm
ent r
esul
ts o
n a
regu
lar b
asis
. Th
e te
ache
r de
mon
stra
tes s
kill
in d
esig
ning
as
sess
men
t stra
tegi
es fo
r di
agno
stic
and
form
ativ
e pu
rpos
es.
The
teac
her d
emon
stra
tes
prof
icie
ncy
in a
naly
zing
stud
ent
asse
ssm
ent r
esul
ts in
ord
er to
ad
just
inst
ruct
ion
or p
lan
inte
rven
tion
stra
tegi
es.
Th
e te
ache
r has
diff
icul
ty
anal
yzin
g st
uden
t ass
essm
ent
resu
lts to
gui
de in
stru
ctio
nal
plan
ning
and
inte
rven
tion
stra
tegi
es.
The
evid
ence
indi
cate
s tha
t as
sess
men
t res
ults
are
not
use
d to
af
fect
inst
ruct
iona
l pla
nnin
g.
The
teac
her d
oes n
ot a
djus
t in
stru
ctio
n or
pla
n in
terv
entio
n ba
sed
on a
naly
ses o
f stu
dent
as
sess
men
t.
Inte
rvie
w Q
uest
ions
: 2.
1)
How
do
you
dete
rmin
e if
an in
divi
dual
stud
ent n
eeds
add
ition
al in
stru
ctio
n or
inte
rven
tion
stra
tegi
es?
2.2)
A
ppro
xim
atel
y ho
w o
ften
do y
ou u
se fo
rmat
ive
asse
ssm
ent s
trate
gies
in y
our t
each
ing?
2.
3)
Wha
t do
thes
e fo
rmat
ive
asse
ssm
ents
look
like
? 2.
4)
How
do
you
use
thes
e fo
rmat
ive
asse
ssm
ents
?

91
Teacher Effectiveness Summary Rating Form
Observer: Date:
Teacher:
Rate each category with 1, least effective, to 4, most effective, based on the Teacher Effectiveness Behavior Scale. INSTRUCTIONAL SKILLS I-1 Instructional Differentiation I-2 Instructional Focus on Learning
I-3 Instructional Clarity I-4 Instructional Complexity I-5 Expectations for Student Learning I-6 Use of Technology

92
ASSESSMENT SKILLS A-1 Assessment for Understanding A-2 Quality of Verbal Feedback to Students CLASSROOM MANAGEMENT M-1 Classroom Management M-2 Classroom Organization PERSONAL QUALITIES P-1 Caring P-2 Fairness & Respect

93
P-3 Positive Relationships P-4 Encouragement of Responsibility P-5 Enthusiasm
10/13/03 version

94
Teacher Effectiveness Summary Rating Form-Combined
Observers: Date:
Teacher:
Transcribe the ratings for each item by the two observers to this sheet and reach consensus on the “Agreed upon” score with 1, least effective, to 4, most effective, based on the Teacher Effectiveness Behavior Scale. INSTRUCTIONAL SKILLS
Item Observer #1 Observer #2 Agreed Upon Score
I-1 Instructional Differentiation I-2 Instructional Focus on Learning I-3 Instructional Clarity I-4 Instructional Complexity I-5 Expectations for Student Learning I-6 Use of Technology ASSESSMENT SKILLS
Item Observer #1 Observer #2 Agreed Upon Score
A-1 Assessment for Understanding A-2 Quality of Verbal Feedback to
Students
CLASSROOM MANAGEMENT
Item Observer #1 Observer #2 Agreed Upon Score
M-1 Classroom Management M-2 Classroom Organization PERSONAL QUALITIES
Item Observer #1 Observer #2 Agreed Upon Score
P-1 Caring P-2 Fairness & Respect P-3 Positive Relationships P-4 Encouragement of Responsibility P-5 Enthusiasm

95
Are
a I:
In
stru
ctio
nal S
kills
Ef
fect
ive
teac
hers
org
aniz
e fo
r ins
truct
ion
by m
aint
aini
ng a
nd c
omm
unic
atin
g a
focu
s on
inst
ruct
ion,
dem
onst
ratin
g hi
gh e
xpec
tatio
ns fo
r stu
dent
s, al
loca
ting
time,
and
eng
agin
g in
eff
ectiv
e pl
anni
ng. R
espo
nsiv
e in
stru
ctio
n hi
nges
on
a fle
xibi
lity
and
faci
lity
with
a v
arie
ty o
f tea
chin
g st
rate
gies
. Te
ache
rs w
ho su
cces
sful
ly e
mpl
oy a
rang
e of
stra
tegi
es re
ach
mor
e st
uden
ts b
ecau
se th
ey ta
p in
to m
ore
lear
ning
styl
es a
nd st
uden
t int
eres
ts.
Titl
e an
d #
Lev
el 4
L
evel
3
Lev
el 2
L
evel
1
Inst
ruct
iona
l D
iffer
entia
tion
I-1
The
teac
her u
ses a
bro
ad
repe
rtoire
of i
nstru
ctio
nal
stra
tegi
es w
ith fl
uenc
y an
d fle
xibi
lity
to d
iffer
entia
te
inst
ruct
ion
for i
ndiv
idua
l or
grou
ps o
f stu
dent
s con
stan
tly.
The
teac
her u
ses a
n ad
equa
te
varie
ty o
f ins
truct
iona
l st
rate
gies
that
app
eal t
o th
e in
tere
sts/
need
s of i
ndiv
idua
l st
uden
ts w
ith m
ultip
le
appr
oach
es to
teac
hing
.
The
teac
her u
ses a
lim
ited
num
ber o
f ins
truct
iona
l st
rate
gies
to m
eet t
he
indi
vidu
al n
eeds
of s
ome
stud
ents
, but
the
maj
ority
ta
rget
the
who
le c
lass
.
The
teac
her r
elie
s hea
vily
on
inst
ruct
iona
l stra
tegi
es
prim
arily
for t
he w
hole
cla
ss
(i.e.
, lec
ture
, wor
kshe
ets,
ques
tioni
ng, e
tc.)
with
littl
e, if
an
y, in
divi
dual
izat
ion.
I-1
SCO
RE
: ___
__
NO
TE
S/R
AT
ION
AL
E:
Inst
ruct
iona
l Fo
cus o
n L
earn
ing
I-2
The
teac
her a
lloca
tes
max
imum
tim
e to
war
ds
inst
ruct
iona
l act
iviti
es
resu
lting
in m
inim
al
inte
rrup
tions
; aca
dem
ic
lear
ning
tim
e is
cle
arly
the
focu
s of i
nstru
ctio
n
The
teac
her r
einf
orce
s his
/her
fo
cus o
n in
stru
ctio
n th
roug
h ap
prop
riate
allo
catio
n of
tim
e to
the
teac
hing
and
lear
ning
pr
oces
s.
The
teac
her a
llow
s non
-in
stru
ctio
nal a
ctiv
ities
to
redu
ce in
stru
ctio
nal t
ime
and
curta
il te
achi
ng o
bjec
tives
.
The
teac
her d
emon
stra
tes
little
urg
ency
in m
akin
g us
e of
inst
ruct
iona
l tim
e an
d pr
olon
gs in
terr
uptio
ns.
I-2
SCO
RE
: ___
__
NO
TE
S/R
AT
ION
AL
E:

96
Are
a I:
In
stru
ctio
nal S
kills
T
itle
and
# L
evel
4
Lev
el 3
L
evel
2
Lev
el 1
In
stru
ctio
nal
Cla
rity
I-3
The
teac
her c
omm
unic
ates
ef
fect
ivel
y w
ith in
divi
dual
st
uden
ts a
nd c
lass
room
gr
oups
. Pro
vide
s ple
ntifu
l in
stru
ctio
nal e
xam
ples
and
gu
ided
pra
ctic
e.
The
teac
her c
omm
unic
ates
w
ith c
larit
y an
d gi
ves s
tep-
by-
step
dire
ctio
ns. P
rovi
des s
ome
exam
ples
and
pra
ctic
e.
The
teac
her d
oes n
ot
cons
iste
ntly
com
mun
icat
e w
ith c
larit
y or
ofte
n do
es n
ot
prov
ide
adeq
uate
dire
ctio
ns,
exam
ples
, or p
ract
ice.
The
teac
her p
rovi
des
conf
usin
g di
rect
ions
, ex
ampl
es, o
r pra
ctic
e.
The
teac
her d
oes n
ot
fully
or c
lear
ly e
xpla
in
conc
epts
.
I-
3 SC
OR
E: _
____
N
OT
ES/
RA
TIO
NA
LE
:
Inst
ruct
iona
l C
ompl
exity
I-4
Lear
ning
act
iviti
es re
quire
co
mpl
ex th
inki
ng a
s a m
ajor
fo
cus o
r ext
ensi
on o
f the
le
sson
(e.g
., st
uden
ts m
ay b
e as
ked
to a
naly
ze c
ause
and
ef
fect
, ide
ntify
a p
robl
em a
nd
pose
reas
onab
le so
lutio
ns,
spec
ulat
e gi
ving
det
ails
or
just
ifica
tion,
def
end
optio
ns
or a
rgue
a p
ositi
on w
ith
evid
ence
to a
gre
at e
xten
t).
Som
e ac
tiviti
es re
quire
co
mpl
ex th
inki
ng a
s a
seco
ndar
y fo
cus o
f the
less
on.
Lear
ning
act
iviti
es p
rimar
ily
invo
lve
stud
ents
in ta
sks t
hat
requ
ire ro
te m
emor
y or
onl
y lim
ited
amou
nts o
f com
plex
th
inki
ng. (
e.g.
, stu
dent
s may
be
ask
ed to
sum
mar
ize
stra
ight
forw
ard
info
rmat
ion,
in
fer s
impl
e m
ain
idea
s).
Lear
ning
act
iviti
es in
volv
e st
uden
ts in
task
s tha
t do
not
requ
ire a
ny si
gnifi
cant
deg
ree
of c
ompl
ex th
inki
ng. S
tude
nts
may
be
aske
d to
reca
ll ba
sic
info
rmat
ion.
I-4
SCO
RE
: ___
__
NO
TE
S/R
AT
ION
AL
E:
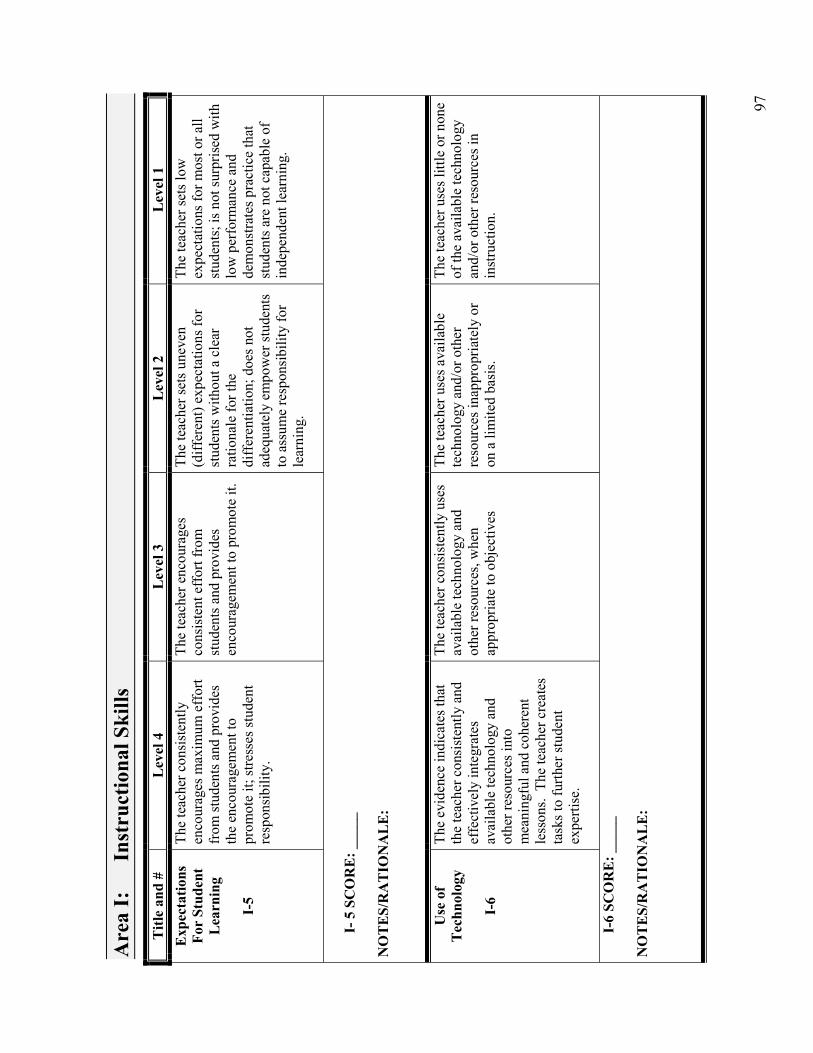
97
Are
a I:
In
stru
ctio
nal S
kills
Titl
e an
d #
Lev
el 4
L
evel
3
Lev
el 2
L
evel
1
Exp
ecta
tions
Fo
r St
uden
t L
earn
ing
I-5
The
teac
her c
onsi
sten
tly
enco
urag
es m
axim
um e
ffor
t fr
om st
uden
ts a
nd p
rovi
des
the
enco
urag
emen
t to
prom
ote
it; st
ress
es st
uden
t re
spon
sibi
lity.
The
teac
her e
ncou
rage
s co
nsis
tent
eff
ort f
rom
st
uden
ts a
nd p
rovi
des
enco
urag
emen
t to
prom
ote
it.
The
teac
her s
ets u
neve
n (d
iffer
ent)
expe
ctat
ions
for
stud
ents
with
out a
cle
ar
ratio
nale
for t
he
diff
eren
tiatio
n; d
oes n
ot
adeq
uate
ly e
mpo
wer
stud
ents
to
ass
ume
resp
onsi
bilit
y fo
r le
arni
ng.
The
teac
her s
ets l
ow
expe
ctat
ions
for m
ost o
r all
stud
ents
; is n
ot su
rpris
ed w
ith
low
per
form
ance
and
de
mon
stra
tes p
ract
ice
that
st
uden
ts a
re n
ot c
apab
le o
f in
depe
nden
t lea
rnin
g.
I- 5
SC
OR
E: _
____
N
OT
ES/
RA
TIO
NA
LE
:
Use
of
Tec
hnol
ogy
I-6
The
evid
ence
indi
cate
s tha
t th
e te
ache
r con
sist
ently
and
ef
fect
ivel
y in
tegr
ates
av
aila
ble
tech
nolo
gy a
nd
othe
r res
ourc
es in
to
mea
ning
ful a
nd c
oher
ent
less
ons.
The
teac
her c
reat
es
task
s to
furth
er st
uden
t ex
perti
se.
The
teac
her c
onsi
sten
tly u
ses
avai
labl
e te
chno
logy
and
ot
her r
esou
rces
, whe
n ap
prop
riate
to o
bjec
tives
The
teac
her u
ses a
vaila
ble
tech
nolo
gy a
nd/o
r oth
er
reso
urce
s ina
ppro
pria
tely
or
on a
lim
ited
basi
s.
The
teac
her u
ses l
ittle
or n
one
of th
e av
aila
ble
tech
nolo
gy
and/
or o
ther
reso
urce
s in
inst
ruct
ion.
I-6
SCO
RE
: ___
__
NO
TE
S/R
AT
ION
AL
E:

98
Are
a A
:
Ass
essm
ent S
kills
Effe
ctiv
e te
ache
rs u
se a
var
iety
of a
sses
smen
t pra
ctic
es to
mon
itor s
tude
nt le
arni
ng, i
nclu
ding
form
al a
nd in
form
al a
sses
smen
ts a
nd fo
rmat
ive
and
sum
mat
ive
asse
ssm
ents
. Ass
essm
ents
are
use
d to
mon
itor p
rogr
ess,
prov
ide
feed
back
to st
uden
ts a
nd p
aren
ts, a
nd to
adj
ust i
nstru
ctio
n. W
hen
nece
ssar
y, e
ffec
tive
teac
hers
re-te
ach
mat
eria
l tha
t has
not
bee
n le
arne
d th
orou
ghly
.
Titl
e an
d #
Lev
el 4
L
evel
3
Lev
el 2
L
evel
1
Ass
essm
ent f
or
Und
erst
andi
ng
A-1
The
teac
her r
egul
arly
che
cks
in w
ith st
uden
ts to
mon
itor
thei
r lev
el o
f und
erst
andi
ng,
inte
rest
, fru
stra
tion,
etc
. St
uden
t und
erst
andi
ng is
as
sess
ed th
roug
h a
varie
ty o
f m
etho
ds (o
bser
vatio
n, g
roup
qu
estio
ning
, ind
ivid
ual
conv
ersa
tions
, loo
king
at
stud
ent w
ork,
etc
.). T
he
teac
her r
emai
ns fl
exib
le in
in
stru
ctio
nal d
ecis
ion-
mak
ing
and
seem
s to
cont
inuo
usly
use
“d
ata”
to a
djus
t ins
truct
ion.
The
teac
her c
heck
s in
with
st
uden
ts p
erio
dica
lly,
parti
cula
rly a
t the
end
of t
he
less
on to
gau
ge th
eir
unde
rsta
ndin
g of
con
tent
. The
m
etho
ds a
nd e
xten
t of c
heck
s fo
r und
erst
andi
ng a
re
suff
icie
nt to
iden
tify
and
addr
ess s
erio
us
mis
unde
rsta
ndin
gs b
ut th
e pr
obin
g is
not
det
aile
d an
d ex
tens
ive.
The
teac
her m
ay
spen
d ad
ditio
nal t
ime
ques
tioni
ng in
divi
dual
s.
The
teac
her m
ay c
heck
for
unde
rsta
ndin
g on
ce o
r tw
ice
durin
g a
less
on b
y as
king
for
any
ques
tions
but
doe
s ver
y lit
tle p
robi
ng o
r act
ing
on th
e in
form
atio
n an
d m
akes
few
ad
just
men
ts to
resp
ond
to
any
conf
usio
n st
uden
ts
expr
ess.
The
teac
her s
eem
s to
eith
er m
iss s
tude
nt c
ues
that
indi
cate
lack
of
unde
rsta
ndin
g or
reco
gniz
e th
em b
ut n
ot a
ct o
n th
em.
Que
stio
ns a
re a
sked
to
who
le c
lass
, not
indi
vidu
als.
The
teac
her s
eldo
m o
r nev
er
chec
ks fo
r und
erst
andi
ng a
nd
seem
s to
teac
h th
e le
sson
as
plan
ned
with
littl
e fle
xibi
lity
for r
espo
ndin
g to
m
isun
ders
tand
ings
. The
te
ache
r doe
s not
use
ob
serv
atio
n or
que
stio
ning
or
othe
r ass
essm
ent m
etho
ds to
m
onito
r stu
dent
un
ders
tand
ing.
A-1
SC
OR
E: _
____
N
OT
ES/
RA
TIO
NA
LE
:

99
Are
a A
:
Ass
essm
ent S
kills
Titl
e an
d #
Lev
el 4
L
evel
3
Lev
el 2
L
evel
1
Qua
lity
of
Ver
bal
Feed
back
to
Stud
ents
A
-2
The
teac
her p
rovi
des v
erba
l fe
edba
ck c
onsi
sten
tly,
addr
esse
s ind
ivid
ual s
tude
nt
stre
ngth
and
wea
knes
ses,
and
enco
urag
es st
uden
t sel
f-re
flect
ion.
Fee
dbac
k is
fair
and
dem
onst
rate
s hig
h ex
pect
atio
ns fo
r all
stud
ents
by
enc
oura
ging
all
stud
ents
to
ask
ques
tions
or c
ontri
bute
to
the
disc
ussi
on.
The
teac
her p
rovi
des v
erba
l fe
edba
ck th
at is
app
ropr
iate
an
d co
nsis
tent
ly a
ddre
sses
in
divi
dual
stud
ent s
treng
ths
and
wea
knes
ses.
Fee
dbac
k pr
ovid
es g
ood
idea
of h
ow
stud
ents
can
impr
ove.
The
te
ache
r spe
nds a
dditi
onal
tim
e in
exp
lana
tion
or p
robi
ng
ques
tions
bef
ore
mov
ing
on if
th
ere
is c
onfu
sion
.
The
teac
her p
rovi
des
min
imal
ver
bal f
eedb
ack
on
stud
ent p
erfo
rman
ce.
Feed
back
doe
s not
ad
equa
tely
add
ress
in
divi
dual
stud
ent s
treng
ths
or w
eakn
esse
s. R
e-di
rect
ion
is in
cons
iste
nt o
r lim
ited
to
only
a sm
all n
umbe
r of
stud
ents
.
The
teac
her p
rovi
des
verb
al fe
edba
ck th
at is
lim
ited
to c
orre
ctne
ss o
f re
spon
se (“
Goo
d an
swer
.”)
Ther
e is
littl
e or
no
dire
ctio
n pr
ovid
ed fo
r im
prov
emen
t in
perf
orm
ance
. If
a st
uden
t an
swer
s inc
orre
ctly
, the
te
ache
r mov
es o
n to
an
othe
r stu
dent
with
out
disc
ussi
on.
A-2
SC
OR
E: _
____
N
OT
ES/
RA
TIO
NA
LE
:
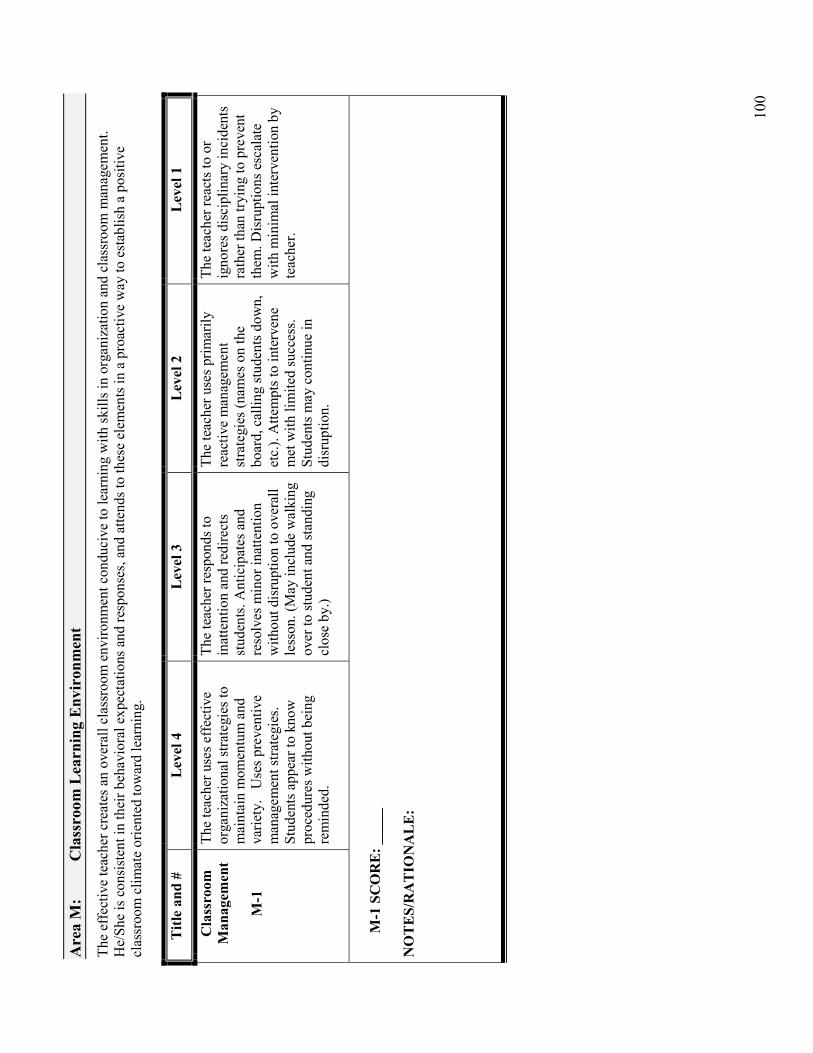
100
Are
a M
: C
lass
room
Lea
rnin
g E
nvir
onm
ent
The
effe
ctiv
e te
ache
r cre
ates
an
over
all c
lass
room
env
ironm
ent c
ondu
cive
to le
arni
ng w
ith sk
ills i
n or
gani
zatio
n an
d cl
assr
oom
man
agem
ent.
He/
She
is c
onsi
sten
t in
thei
r beh
avio
ral e
xpec
tatio
ns a
nd re
spon
ses,
and
atte
nds t
o th
ese
elem
ents
in a
pro
activ
e w
ay to
est
ablis
h a
posi
tive
clas
sroo
m c
limat
e or
ient
ed to
war
d le
arni
ng.
T
itle
and
# L
evel
4
Lev
el 3
L
evel
2
Lev
el 1
Cla
ssro
om
Man
agem
ent
M
-1
The
teac
her u
ses e
ffec
tive
orga
niza
tiona
l stra
tegi
es to
m
aint
ain
mom
entu
m a
nd
varie
ty.
Use
s pre
vent
ive
man
agem
ent s
trate
gies
. St
uden
ts a
ppea
r to
know
pr
oced
ures
with
out b
eing
re
min
ded.
The
teac
her r
espo
nds t
o in
atte
ntio
n an
d re
dire
cts
stud
ents
. Ant
icip
ates
and
re
solv
es m
inor
inat
tent
ion
with
out d
isru
ptio
n to
ove
rall
less
on. (
May
incl
ude
wal
king
ov
er to
stud
ent a
nd st
andi
ng
clos
e by
.)
The
teac
her u
ses p
rimar
ily
reac
tive
man
agem
ent
stra
tegi
es (n
ames
on
the
boar
d, c
allin
g st
uden
ts d
own,
et
c.).
Atte
mpt
s to
inte
rven
e m
et w
ith li
mite
d su
cces
s.
Stud
ents
may
con
tinue
in
disr
uptio
n.
The
teac
her r
eact
s to
or
igno
res d
isci
plin
ary
inci
dent
s ra
ther
than
tryi
ng to
pre
vent
th
em. D
isru
ptio
ns e
scal
ate
with
min
imal
inte
rven
tion
by
teac
her.
M-1
SC
OR
E: _
____
N
OT
ES/
RA
TIO
NA
LE
:

101
Are
a M
: C
lass
room
Lea
rnin
g E
nvir
onm
ent
C
lass
room
O
rgan
izat
ion
M
-2
The
teac
her i
ncor
pora
tes
task
s, m
ater
ials
, and
spac
e so
ef
fect
ivel
y in
to o
ngoi
ng
clas
sroo
m p
roce
dure
s and
ex
pect
atio
ns fo
r stu
dent
s tha
t th
ey se
em to
kno
w
auto
mat
ical
ly w
hat t
o do
at
certa
in ti
mes
dur
ing
the
less
ons w
ithou
t bei
ng to
ld.
The
arra
ngem
ent o
f the
room
an
d m
ater
ials
may
cha
nge
from
less
on to
less
on to
su
ppor
t on-
goin
g in
stru
ctio
n.
Tran
sitio
ns, i
f any
, are
sm
ooth
.
The
teac
her o
rgan
izes
task
s, m
ater
ials
, and
spac
e to
fa
cilit
ate
lear
ning
by
stud
ents
by
arr
angi
ng th
e ro
om a
nd
mat
eria
ls to
supp
ort t
he
less
on. A
ny m
ovem
ent o
f st
uden
ts, m
ater
ials
, eq
uipm
ent,
etc.
, occ
urs w
ith a
pu
rpos
e an
d su
ppor
ts th
e le
sson
.
The
teac
her i
s inc
onsi
sten
t in
his/
her o
rgan
izat
ion
of ta
sks,
mat
eria
ls, a
nd sp
ace
such
that
on
ce o
r tw
ice
the
less
on w
as
inte
rrup
ted
by u
nnec
essa
ry
mov
emen
t or s
earc
hing
for
mat
eria
ls.
The
teac
her d
emon
stra
tes
little
org
aniz
atio
n of
task
s, m
ater
ials
, and
spac
e su
ch th
at
inst
ruct
iona
l tim
e is
was
ted.
Th
e ro
om/m
ater
ials
are
not
se
t up
to a
ccom
mod
ate
stud
ents
and
the
less
on.
M-2
SC
OR
E: _
____
N
OT
ES/
RA
TIO
NA
LE
(des
crib
e th
e ro
om se
tup)

102
Are
a P:
Pe
rson
al Q
ualit
ies
A te
ache
r’s a
bilit
y to
rela
te w
ith st
uden
ts a
nd to
mak
e po
sitiv
e, c
arin
g co
nnec
tions
with
them
pla
ys a
sign
ifica
nt p
art i
n su
ppor
ting
the
lear
ning
en
viro
nmen
t and
stud
ent a
chie
vem
ent.
Effe
ctiv
e te
ache
rs c
are
abou
t the
ir st
uden
ts a
nd d
emon
stra
te th
at c
arin
g so
that
stud
ents
are
con
scio
us o
f it.
T
itle
and
# L
evel
4
Lev
el 3
L
evel
2
Lev
el 1
Car
ing
P-
1
The
teac
her d
emon
stra
tes
sust
aine
d ca
ring
and
com
mitm
ent t
owar
d ea
ch
indi
vidu
al st
uden
t.
The
teac
her g
ener
ally
de
mon
stra
tes a
car
ing
man
ner.
The
teac
her i
ncon
sist
ently
de
mon
stra
tes a
car
ing
man
ner
with
stud
ents
. Tre
ats s
ome
stud
ents
with
less
con
cern
th
an o
ther
s.
The
teac
her i
s unc
arin
g an
d di
stan
t with
stud
ents
. D
emon
stra
tes l
ittle
con
cern
fo
r som
e st
uden
ts.
P-1
SCO
RE
: ___
__
NO
TE
S/R
AT
ION
AL
E:
Fa
irne
ss a
nd
Resp
ect
P-
2
The
teac
her c
onsi
sten
tly
dem
onst
rate
s fai
rnes
s and
re
spec
t tow
ard
stud
ents
and
ac
tivel
y pr
omot
es th
ese
qual
ities
in st
uden
ts.
The
teac
her t
reat
s all
stud
ents
w
ith fa
irnes
s and
resp
ect b
y pr
ovid
ing
oppo
rtuni
ties t
o pa
rtici
pate
and
succ
eed.
The
teac
her t
reat
s som
e st
uden
ts w
ith le
ss re
spec
t tha
n ot
hers
. Lim
its so
me
stud
ents
’ op
portu
nitie
s for
invo
lvem
ent
and
succ
ess.
The
teac
her s
how
s a la
ck o
f re
spec
t for
stud
ents
and
trea
ts
stud
ents
in a
n un
fair
man
ner.
P-2
SCO
RE
: ___
__
NO
TE
S/R
AT
ION
AL
E:

103
Are
a P:
Pe
rson
al Q
ualit
ies
Posi
tive
Rel
atio
nshi
ps
P-
3
The
teac
her c
onsi
sten
tly
mod
els a
nd n
urtu
res
supp
ortiv
e re
latio
nshi
ps
amon
g st
uden
ts. I
nitia
tes
activ
ities
to m
ake
scho
ol a
n en
joya
ble
expe
rienc
e.
The
teac
her i
nter
acts
with
st
uden
ts in
a fr
iend
ly a
nd
pers
onab
le m
anne
r. Pa
rtici
pate
s in
activ
ities
to
mak
e sc
hool
an
enjo
yabl
e ex
perie
nce.
The
teac
her i
ncon
sist
ently
re
spon
ds to
stud
ents
, not
al
way
s sho
win
g in
tere
st in
st
uden
ts a
s ind
ivid
uals
.
The
teac
her d
oes n
ot
dem
onst
rate
a fr
iend
ly a
nd
pers
onab
le m
anne
r tow
ard
stud
ents
eith
er a
s a g
roup
or
indi
vidu
als.
P-3
SCO
RE
: ___
__
NO
TE
S/R
AT
ION
AL
E:
Enc
oura
gem
ent
of R
espo
nsib
ility
P-4
The
teac
her a
ctiv
ely
enco
urag
es st
uden
ts to
take
re
spon
sibi
lity
for t
heir
own
lear
ning
in w
ays t
hat
com
mun
icat
e hi
gh re
gard
and
hi
gh e
xpec
tatio
ns.
The
teac
her p
rom
otes
en
thus
iasm
for l
earn
ing
and
enco
urag
es st
uden
ts to
be
activ
e pa
rtici
pant
s in
thei
r le
arni
ng.
The
teac
her a
ssum
es p
rimar
y re
spon
sibi
lity
for s
tude
nts’
le
arni
ng a
nd sh
ows l
imite
d ev
iden
ce o
f tru
stin
g st
uden
ts
with
thei
r lea
rnin
g.
The
teac
her m
aint
ains
sole
re
spon
sibi
lity
for s
tude
nt
lear
ning
and
dis
cour
ages
in
depe
nden
t thi
nkin
g by
st
uden
ts.
P-4
SCO
RE
: ___
__
NO
TE
S/R
AT
ION
AL
E:

104
E
nthu
sias
m
P-
5
The
teac
her i
s ent
husi
astic
an
d de
mon
stra
tes a
pas
sion
fo
r tea
chin
g th
at is
evi
dent
in
the
care
with
whi
ch
inst
ruct
ion
is p
repa
red
and
pres
ente
d; p
rom
otes
stud
ents
’ en
joym
ent o
f lea
rnin
g
The
teac
her d
emon
stra
tes a
po
sitiv
e at
titud
e ab
out l
ife a
nd
teac
hing
; dem
onst
rate
s car
e ab
out s
tude
nt o
utco
mes
The
teac
her s
how
s pos
itive
fe
elin
gs to
war
d st
uden
t le
arni
ng in
inco
nsis
tent
way
s;
seld
om e
ncou
rage
s stu
dent
s’
enjo
ymen
t of l
earn
ing
The
teac
her r
arel
y, if
eve
r, sh
ows p
ositi
ve fe
elin
gs
tow
ard
inst
ruct
ion
or st
uden
t le
arni
ng; o
vertl
y di
scou
rage
s st
uden
t enj
oym
ent o
f lea
rnin
g
P-5
SCO
RE
: ___
__
NO
TE
S/R
AT
ION
AL
E:
NB
PTS
Stud
y Te
ache
r Effe
ctiv
enes
s Beh
avio
r Sca
le a
dapt
ed fr
om S
trong
e &
Tuc
ker,
2001
and
the
SER
VE
Teac
her G
row
th a
nd A
sses
smen
t
Rev
11/
21/2
005
105
Appendix B
Recruiting Letter to Participants

106
October 10, 2003 Dear We would like to invite you to participate in a study regarding variations in teaching practice related to perceptions and measures of effectiveness being conducted by SERVE, the regional educational laboratory based at The University of North Carolina at Greensboro. This study is being funded by the National Board for Professional Teaching Standards (NBPTS) and has the support of your district. You are one of approximately 120 fourth and fifth grade classroom teachers from three North Carolina districts selected to participate in this study. Participation in the study is completely voluntary; however, we very much hope that you will consent to participate. The results will be used to benefit all teachers in better understanding what the NBPTS and other entities define as effective teachers. What does participation entail? Involvement in the study will consist of allowing two trained observers from SERVE to observe in your classroom for approximately three hours of typical instruction during one morning. They would also need to conduct an interview of no more than 20 minutes (when the students are not present) about your classroom context. Also, we are asking you for samples of the kinds of work students do. Please be assured that all information gained from the study will be held in the strictest confidence. Results will be discussed in terms of research questions, with no individual names recorded Please return the enclosed form to SERVE in the envelope provided, as soon as possible, indicating your willingness to participate in the study. If you choose to participate, Amber Cratty, the SERVE study facilitator, will contact you to arrange a convenient date for the observers to visit your class. It is our hope to schedule this observation and interview at a time convenient for you during the period of November – December 2003. We realize that participating in a study of this nature does add to your already busy day. As a small token of appreciation, each participating teacher will receive $100.00 at the completion of data collection. Should you have any questions, please contact Dr. Barbara Howard (1-800-755-3277 or [email protected]). Thank you for considering participating in this very important study. Sincerely, Barbara Howard Cc: Principal

107
Appendix C
Training Guidelines for Observers

108
Teacher Effectiveness & Student Learning Study
Training Manual For Data Collection
October 2003
(SERVE Logo here)

109
Overview of Data Collection Instruments
Background Material Teacher Beliefs Form - TSES The Teacher Beliefs Form will be mailed to teachers upon their agreement to participate in the SERVE study. It will provide a measure of teacher self-efficacy and demographic information on the participants. Collect the form from the teacher after the observation and put it in the teacher packet. Work Samples In addition to the Teacher Beliefs Form, teachers who volunteer to participate in the study will be asked to furnish a sample lesson plan and student work. Collect the sample lesson and student work from the teacher after the observation and place it in the packet.
Observer #1 Instruments Questioning Techniques Analysis Chart The observer records all instructional questions asked by the teacher, orally and in writing, for one hour during the language arts lesson on regular notebook paper. In addition, include student generated questions and designate each with an “S” for student. Omit any procedural questions, such as “Would you read the directions?” Note all questions that the teacher answers by circling them in your notes. After the observation, write in 3 examples of each question type on the Questioning Techniques Analysis Chart. Next, tally the number of questions at each level by teachers and students (separate count for each) and calculate a percentage of total questions asked at each level. Attach the entire script of questions asked. Refer to the Guide for Categorizing Questions if you are unsure of the question type or confer with the second observer. Student Time-on-task Chart During a second hour of the observation, the observer records student engagement in the teaching-learning process at five-minute intervals. Additionally, comments regarding off-task behavior and teacher response are to be recorded. During each five-minute cycle, watch and listen carefully for one full minute to get a clear sense of what is happening in the classroom, and record your notes during the four minutes before the next sampling of information. If the teacher is uninvolved with students, record this activity (possibly reading papers for example) too under the “Task” column. If the teacher takes no action, check the box for “None.” It is important to capture the key events that occur during that minute related to student off-task behaviors and teacher management of the behavior.

110
Observer #2 Instruments
Classroom Events Record The observer records and codes the type of classroom activities and interactions during the first two hours of the three-hour observation. Describe the length of time and nature of every classroom activity. Scan the classroom on a regular basis and describe the activity taking place making notations on the subject being covered, the type of activity, and the approach being used. Draw a line across the form to demarcate each change in activity. The primary focus of your observation is the teacher, what he or she says and does and classroom activities. The dimensions to be coded from your observations are subject (LA, M, Sc, SS, O), Activity (T, TI, SA, O), and Approach (W, S, I).
Subject LA = Language Arts M = Math Sc = Science SS = Social Studies O = Other (please
specify)
Activity T = Transition TI = Teacher-centered
instruction SA = Student-centered
activity O = Other (please
specify)
Approach W = Whole group
instruction S = Small group
instruction I = Individualized
instruction
Observers #1 and #2 Instruments
Teacher Effectiveness Summary Rating Form This is a behaviorally-anchored rating scale of effective teacher behaviors. The scale is based on research of effective teaching behaviors and is designed to capture both the types of behaviors and the degree to which the participating classroom teachers exhibit those behaviors. This is the primary instrument for recording teacher behavior throughout the classroom observation. During the third hour of the observation, both observers begin completing the Teacher Effectiveness Rating Form using the scoring rubric (Teacher Effectiveness Behavior Scale) to guide their judgments about teacher effectiveness on each item. After the observation is completed, record your individual ratings for each item along with your rationale for each based on the entire observation.
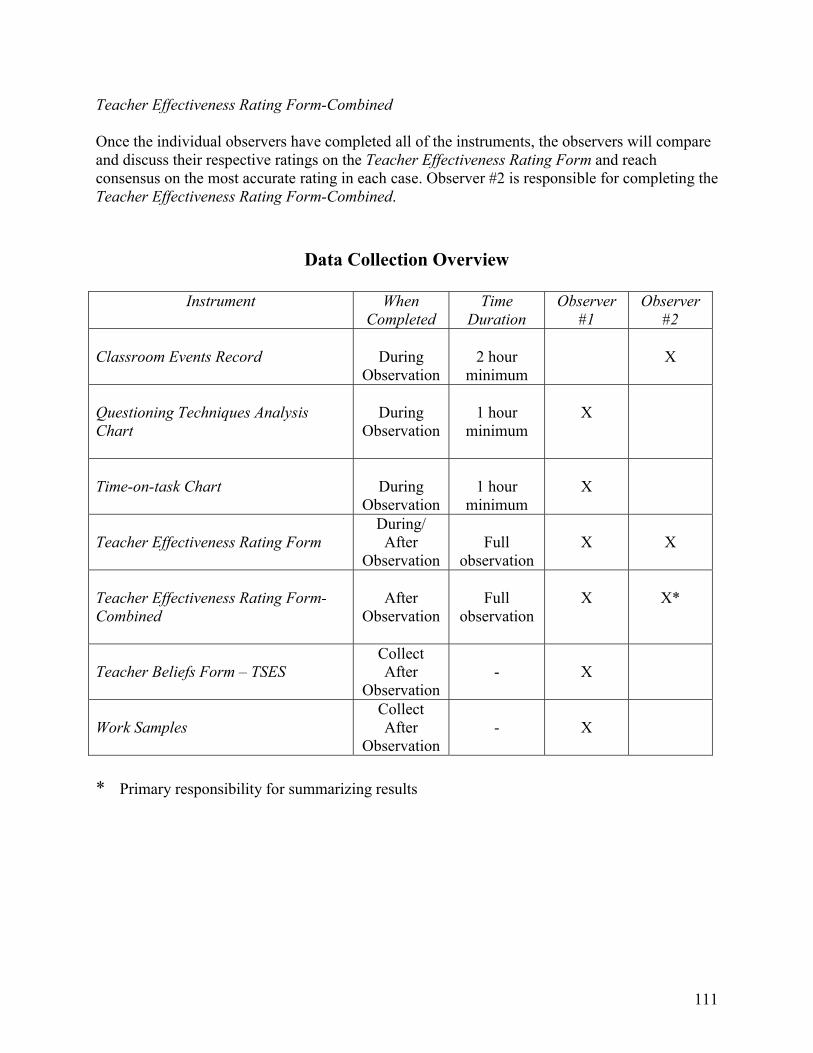
111
Teacher Effectiveness Rating Form-Combined Once the individual observers have completed all of the instruments, the observers will compare and discuss their respective ratings on the Teacher Effectiveness Rating Form and reach consensus on the most accurate rating in each case. Observer #2 is responsible for completing the Teacher Effectiveness Rating Form-Combined.
Data Collection Overview
Instrument When
Completed Time
Duration Observer
#1 Observer
#2 Classroom Events Record
During
Observation
2 hour
minimum
X
Questioning Techniques Analysis Chart
During
Observation
1 hour
minimum
X
Time-on-task Chart
During
Observation
1 hour
minimum
X
Teacher Effectiveness Rating Form
During/ After
Observation
Full
observation
X
X
Teacher Effectiveness Rating Form-Combined
After
Observation
Full
observation
X
X*
Teacher Beliefs Form – TSES
Collect After
Observation
-
X
Work Samples
Collect After
Observation
-
X
* Primary responsibility for summarizing results

112
Specific Directions for Observers
I. Logistics A. Confirm observation: time & date (observe classroom instruction during a morning
time period of at least 3 hours) B. Get directions C. Check in at the office D. Introduce yourself to teacher and thank him/her for letting you visit their classroom
II. During Classroom Observation (morning time period of at least 3 hours)
A. Observer #1: Focus on one instrument at a time. The sequence of tasks will be set by the instructional schedule for the morning. 1) Complete Teacher Questioning Techniques Analysis Chart during the
Language Arts lesson for a period of not less than one hour. 2) Complete Student Time on Task Chart (number of students on task recorded
every five minute interval with comments on off task behavior and teacher response for one hour minimum) during another hour of the observation.
3) Begin completing the Teacher Effectiveness Summary Rating Form during the final hour noting the rationale for each rating. Use the full range of ratings with Level 3 for an average teacher and Level 4 for a teacher who goes above and beyond.
B. Observer #2: Focus on classroom events during the three hour span of time.
1) Complete Classroom Events Record (time use and classroom activities) during the first 2 hours of the observation.
2) Begin completing the Teacher Effectiveness Summary Rating Form during the final hour noting the rationale for each rating. Use the full range of ratings with Level 3 for an average teacher and Level 4 for a teacher who goes above and beyond.
III. After the Classroom Observation
A. Ask the teacher: What this a typical morning? Why or Why not? B. Collect the 1) Teacher Beliefs Form and 2) Work Samples (sample lesson plan and
student work). C. Convey appreciation for the teacher’s time and participation.
IV. Post-observation activities (See Data Collection Protocol chart.)
A. Observer #1: Focused on teacher questioning and student time on task 1. Review the Teacher Questioning Techniques Analysis Chart and tally results. 2. Review Student Time on Task Chart and tally results. 3. Rate the entire observation using the Teacher Effectiveness Behavior Scale and
Teacher Effectiveness Rating Form. Note the rationale for rating each item on the individual Teacher Effectiveness Rating Form. Be sure to use the full range of ratings with Level 3 for an average teacher and Level 4 for a teacher who goes above and beyond.
113
4. Discuss any differences in the ratings of the two observers and complete one rating form, the Teacher Effectiveness Rating Form-Combined to reflect the agreed upon ratings.
B. Observer #2: Focused on classroom events during two hour span of time
1. Review the Classroom Events Record and fill in any missing details such as times and/or activities by reviewing the tape recording.
2. Rate the entire observation using the Teacher Effectiveness Behavior Scale and Teacher Effectiveness Rating Form. Note the rationale for rating each item on the individual Teacher Effectiveness Rating Form. Be sure to use the full range of ratings with Level 3 for an average teacher and Level 4 for a teacher who goes above and beyond.
3. Discuss any differences in the ratings of the two observers and complete one rating form, the Teacher Effectiveness Rating Form-Combined to reflect the agreed upon ratings.

114
Guidelines for Observers
1. Follow school protocols. - report to the office, introduce yourselves, sign in, and get a badge - return to the office and sign out 2. Dress professionally. It is important that you are as unobtrusive as possible so dress in a
manner consistent with elementary schools. 3. Be objective. Use your judgment in recording and scoring, but base your decisions on data. 4. Be consistent. Adhere to the recording and scoring rubrics as closely as possible. 5. Be accurate. Position yourself in the classroom so that you can best observe the interactions
among the teacher and students. If you feel that you missed something important, put a question mark in your notes and continue. If you observe instances when the teacher’s verbal language, tone or actions does not reflect their visible, nonverbal affective nature, draw a “smiley face” (☺) or “sad face” ( ) beside the action or phrase to indicate the intent.
6. Be unbiased. Your primary job is to record what you see and learn in the observations and
interviews. Don’t be concerned about the ratings appearing to be positive, neutral, or negative. We want objective assessments using the full range of possible ratings. Rate each item on the scale independently based only on what you see.
7. Be clear. Use “T” to indicate teacher actions and “S” to indicate student actions. Be as
descriptive as possible in your notations: T nods head, T shakes head, T says “good job,” S glowers at T, S smiles, etc. Try to capture the essential qualities of the interactions.
8. Be positive. A smile goes a long way. As you leave, place a thank you card with a gift
certificate enclosed on the teacher’s desk.

115
Appendix D
Written Instructions to Teachers on the Reading Comprehension Assignment
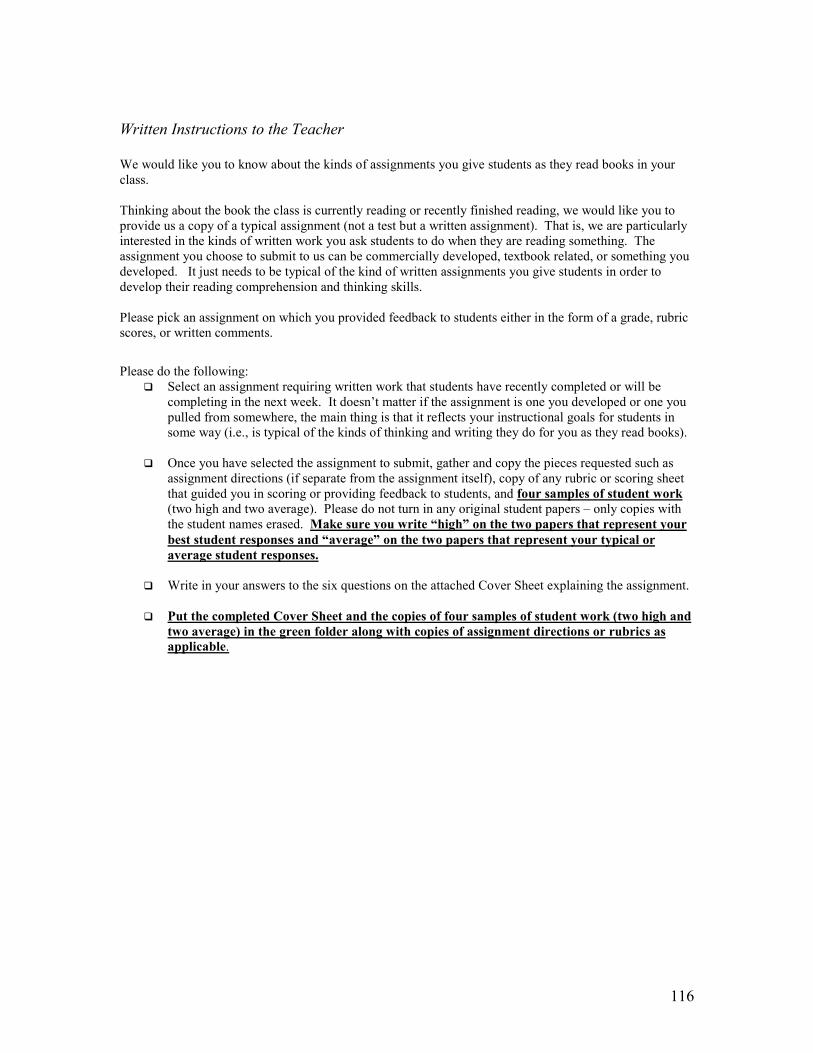
116
Written Instructions to the Teacher We would like you to know about the kinds of assignments you give students as they read books in your class. Thinking about the book the class is currently reading or recently finished reading, we would like you to provide us a copy of a typical assignment (not a test but a written assignment). That is, we are particularly interested in the kinds of written work you ask students to do when they are reading something. The assignment you choose to submit to us can be commercially developed, textbook related, or something you developed. It just needs to be typical of the kind of written assignments you give students in order to develop their reading comprehension and thinking skills. Please pick an assignment on which you provided feedback to students either in the form of a grade, rubric scores, or written comments.
Please do the following:
Select an assignment requiring written work that students have recently completed or will be completing in the next week. It doesn’t matter if the assignment is one you developed or one you pulled from somewhere, the main thing is that it reflects your instructional goals for students in some way (i.e., is typical of the kinds of thinking and writing they do for you as they read books).
Once you have selected the assignment to submit, gather and copy the pieces requested such as
assignment directions (if separate from the assignment itself), copy of any rubric or scoring sheet that guided you in scoring or providing feedback to students, and four samples of student work (two high and two average). Please do not turn in any original student papers – only copies with the student names erased. Make sure you write “high” on the two papers that represent your best student responses and “average” on the two papers that represent your typical or average student responses.
Write in your answers to the six questions on the attached Cover Sheet explaining the assignment.
Put the completed Cover Sheet and the copies of four samples of student work (two high and
two average) in the green folder along with copies of assignment directions or rubrics as applicable.

117
COVER SHEET EXPLAINING THE ATTACHED “TYPICAL” READING COMPREHENSION ASSIGNMENT
1. Assignment Description: Describe the assignment below including the context for the assignment (homework or in-class, major or minor grade, middle or end of unit, etc.). If applicable, attach a copy of the assignment directions you distributed to students.
____________________________________________________________________________________________________________________________________________________________________________________________________________________________________________________________________________________________________________________
2. Learning Goals for Students: What were your learning goals for this assignment?
Please describe the concepts, facts, thinking skills and/or processes you wanted students to learn as a result of completing this assignment.
________________________________________________________________________________________________________________________________________________________________________________________________________________________________________________________________________________________
3. Context: How did the assignment fit into a larger unit of study or with what you are
teaching or working on in language arts this year? ________________________________________________________________________________________________________________________________________________________________________________________________________________________________________________________________________________________
a. Approximately how many assignments like this did you give in the fall semester?_______
4. Feedback to Students: Please describe the criteria you used in giving the students
grades or feedback on the work they turned in. If you used a rubric, please attach a copy of the rubric you used to score the work. If you didn’t use a rubric, just describe how you graded or provided feedback on the assignment.
__________________________________________________________________________________________________________________________________________________________________________________________________________________
5. Please describe the criteria you used to decide which papers were High samples and
which were Average samples on this assignment. That is, what are the key factors that distinguished the high samples from the average samples?
_________________________________________________________________________________________________________________________________________________________________________________________________________________________________
6. Approximately what percent of the students in your class performed at the following
levels on this assignment? ____% = good to excellent ____%= adequate ____%= not yet adequate

118
Appendix E
Rubrics for Scoring Assignment Samples

119
Cognitive Challenge 4 – Assignment task requires students to construct and transform knowledge and engage with less obvious meanings or nuances of a text, and this is evident in the students’ work. Students also may be required to marshal well-supported and elaborated evidence to support a position. Assignment task also requires students to engage with grade-appropriate, academic content material and to write extensively on a topic (i.e., compose a multi-paragraph composition for students at grades 4 and above). 3 – Assignment task requires students to construct and transform knowledge, and this is evident in students’ work. However, students may engage with surface-level details more than less obvious meanings of nuances of a text. Students also may be required to use evidence to support a position, but that evidence may not be well-supported or elaborated. Assignment task also requires students to engage with grade-appropriate academic content material and write extended responses on a topic. 2 – Assignment task requires students to summarize straightforward information, infer simple main idea, or apply the appropriate format for a given genre, and this is evident in students’ work. Students may be required to provide reasons for their positions with evidence. This is evident as well in students’ work. Assignment task may not require students to engage with grade-appropriate academic content material, or write extended responses. 1 – Assignment task requires students to recall very basic information or definitions (e.g., What color was the character’s car? Where did the character go after he left the store? Etc); or to write on a topic with no structure or focus. This is evident in students’ work. Assignment task may not require students to engage with grade-appropriate content material, or write extended responses.
Clarity of the Grading Criteria 4 – The teacher’s grading criteria are very clear, explicit and elaborated. The teacher uses a rubric that is very detailed and provides explicit and elaborated. The teacher uses a rubric that is very detailed and provides specific information to help students improve their performance. 3 – the teacher’s grading criteria mostly are clear and explicit. The teacher may use a rubric or an elaborate scoring guide (i.e., a detailed list of the dimensions upon which student work will be scored). The rubric or dimensions are fairly helpful for students’ use in improving their performance. 2 – The teacher’s grading criteria are in the form of a scoring guide (i.e. a list of criteria), or an extremely rudimentary rubric. The list of criteria is not elaborated or detailed and provides little help to students to improve their performance.

120
1 – The teacher’s grading criteria are unclear and unspecified. The grading criteria do not help students in improving their performance.
Clarity of the Goals for Student Learning 4 – The teacher’s goals are very focused on student learning. Goals are very clear and explicit in terms of what students are to learn as a result of completing the assignment. Additionally, all of the goals are elaborated. 3 – The teacher’s goals mostly are focused on student learning. Goals are mostly clear and explicit in terms of what students are to learn as a result of completing the assignment. 2 – The teacher’s goals are somewhat focused on student learning. Goals are somewhat clear and explicit in terms of what students are to learn as a result of completing the assignment. 1 – The teacher’s goals are not focused on student learning an dare not clear and explicit in terms of what students are to learn as a result of comopoleting the assignment.
Alignment of Learning Goals and Task 4 – There is exact alignment between the teacher’s stated learning goals for students and what the task requires students to do. The task fully supports the instructional goals. The tasks and goals overlap completely – neither one calls for something not included in the other. 3 – The teacher’s stated learning goals and what the task requires students to do are mostly aligned. The task supports the instructional goals. 2 – There is only some alignment between the teacher’s stated goals and what the task requires students to do. The task only somewhat supports the instructional goals. Or the goals may be so broadly stated that the task and goals are aligned only at a very general level. 1 – There is very little or no alignment between the teacher’s stated goals and what the task requires students to do. The task does not support the instructional goals.
Alignment of Learning Goals and Grading Criteria 4 – There is exact alignment between the teacher’s stated learning goals for students and the stated grading criteria.
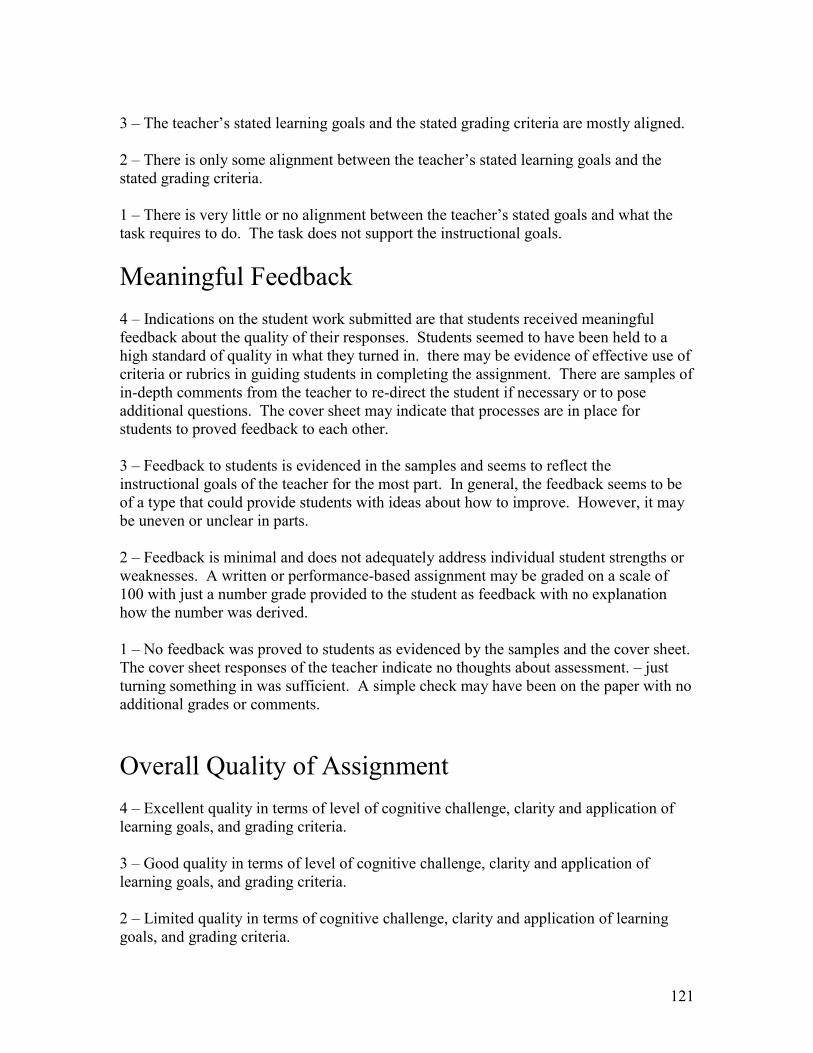
121
3 – The teacher’s stated learning goals and the stated grading criteria are mostly aligned. 2 – There is only some alignment between the teacher’s stated learning goals and the stated grading criteria. 1 – There is very little or no alignment between the teacher’s stated goals and what the task requires to do. The task does not support the instructional goals.
Meaningful Feedback 4 – Indications on the student work submitted are that students received meaningful feedback about the quality of their responses. Students seemed to have been held to a high standard of quality in what they turned in. there may be evidence of effective use of criteria or rubrics in guiding students in completing the assignment. There are samples of in-depth comments from the teacher to re-direct the student if necessary or to pose additional questions. The cover sheet may indicate that processes are in place for students to proved feedback to each other. 3 – Feedback to students is evidenced in the samples and seems to reflect the instructional goals of the teacher for the most part. In general, the feedback seems to be of a type that could provide students with ideas about how to improve. However, it may be uneven or unclear in parts. 2 – Feedback is minimal and does not adequately address individual student strengths or weaknesses. A written or performance-based assignment may be graded on a scale of 100 with just a number grade provided to the student as feedback with no explanation how the number was derived. 1 – No feedback was proved to students as evidenced by the samples and the cover sheet. The cover sheet responses of the teacher indicate no thoughts about assessment. – just turning something in was sufficient. A simple check may have been on the paper with no additional grades or comments.
Overall Quality of Assignment 4 – Excellent quality in terms of level of cognitive challenge, clarity and application of learning goals, and grading criteria. 3 – Good quality in terms of level of cognitive challenge, clarity and application of learning goals, and grading criteria. 2 – Limited quality in terms of cognitive challenge, clarity and application of learning goals, and grading criteria.

122
1 – Poor quality in terms of level of cognitive challenge, clarity and application of learning goals, and grading criteria.