technical report 2 - penn state engineering · this report will analyze the energy consumption emoc...
TRANSCRIPT

Montgomery County Equipment Maintenance and Operations Center
Technical Report 2 Building and Plant Energy Analysis
Michael Tellep
Mechanical Option
Advisor: Moses Ling

Montgomery County Equipment Maintenance and Operations Center-Building 1
Technical Report 2 - Building and Plant Energy Analysis
Michael Tellep
Advisor: Moses Ling | AE 481W - Senior Thesis
1
Table of Contents:
Executive Summary 2
Mechanical Overview 2
Design Load Estimation 4
Modeling Overview
Weather Data
Load Sources
Occupancy and Ventilation
Schedules
Summary of Results 7
Energy Analysis 9
Cost Analysis 10
Appendix A - Weather Data for Washington, DC 11
Appendix B - Trane Trace Results Pages 12
Appendix C - Power and Gas Rates for Rockville, MD 15
Tables and Figures:
Figure 1 - Bypass VAV with Reheat 2
Figure 2 - Heating and Ventilating Unit 3
Table 1 - Load Sources 5
Table 2 - Weekday Cooling 6
Table 3 - Weekend Cooling 6
Table 4 - Heating Schedule 6
Table 5 - TRACE 700 Results by System 7
Table 6 - Plant Size 8
Table 7 - Energy Distribution 9
Figure 3 - Energy Distribution 9
Table 8 - Annual Costs 10

Montgomery County Equipment Maintenance and Operations Center-Building 1
Technical Report 2 - Building and Plant Energy Analysis
Michael Tellep
Advisor: Moses Ling | AE 481W - Senior Thesis
2
Executive Summary:
The Montgomery County Equipment Maintenance and Operations Center, Building 1 (EMOC 1) is a
75,000 square foot building in Rockville, Maryland designed to be the new hub for Montgomery
County's ground transportation services. EMOC 1 is a multi-purpose building consisting of both garage
space for maintenance and office space for operations. The building is still under construction and is
scheduled to be finished in February of 2013. The design strives for LEED silver or better.
This report will analyze the energy consumption EMOC 1 based on a model created in Trane TRACE 700.
The scope of the report will include an overview of the mechanical system, a description of the modeling
process and data used, a summary of the calculation results, and an energy consumption analysis based
on the calculations from TRACE 700. Actual energy use data is not available for the building since the
building is not yet completed, therefore a comparison of my results to the actual data will not be in the
scope of this report.
Mechanical Overview:
EMOC 1 is serviced by 3 rooftop air handling units, 2 energy recovery units, 1 heating and ventilating
system, and numerous exhaust fans. The overall layout of the building allows for the different
occupancies of garage space and office/storage space to be clearly defined and considered separately in
a mechanical sense. The rooftop units (RTU-1, RTU-2, RTU-3) mainly service the office spaces and
storage spaces. The schematic of the RTUs is shown below. They are bypass VAV systems with reheat.
Figure 1 - Bypass VAVV with Reheat

Montgomery County Equipment Maintenance and Operations Center-Building 1
Technical Report 2 - Building and Plant Energy Analysis
Michael Tellep
Advisor: Moses Ling | AE 481W - Senior Thesis
3
While these units provide both heating and cooling, the energy recovery units (ERU-1, ERU-2), which
service the garage spaces, are for heating and ventilating only. The garage bay doors are open to the
outside quite often, so cooling the spaces would not be practical. Heating, however, is required during
the winter months. This type of system, however, created a problem in the energy modeling. Trane
TRACE 700 does not have a system schematic that is comparable to the ERUs. In order to get a relatively
close estimate for this energy analysis, the ERUs were treated as simple heating and ventilating units
shown below.
Figure 2 - Heating and Ventilating Unit
This is also the schematic for the heating and ventilating system (HV-1) that services the shipping and
receiving areas as well as the machine shop.
Exhaust fans are used throughout the building to service any areas where excess heat or fumes are
created. Some rooms, especially in the garage areas, are not serviced by either the RTUs or the ERUs,
but only with an exhaust fan therefore drawing the "supply air" for the space from the surrounding
rooms.

Montgomery County Equipment Maintenance and Operations Center-Building 1
Technical Report 2 - Building and Plant Energy Analysis
Michael Tellep
Advisor: Moses Ling | AE 481W - Senior Thesis
4
Design Load Estimation:
The academic version of Trane TRACE 700 was used to for the analysis of the mechanical system. The
analysis was based on square footage of each room, room height, and the existence of exterior walls in
each room. Other specific factors for input as shown below. Most information was available in the
design documents, however, where information was not available, research was done to find an
applicable example for the sake of accuracy.
Modeling Overview:
The model of the building was done in a standardized manner due to the similarity between spaces
within each occupancy and the definite boundaries where the occupancy changes from office to garage.
First, weather data was selected for Washington, D.C. The building is in Rockville, MD but the weather
data for Washington is still applicable due to proximity. Next Templates were created to define
mechanical parameters for each type of space. The following templates exist in the model:
Office Space
Garage Space
Storage Space
Kitchen Space
Locker Space
These templates were then assigned to each room in the building depending on its occupancy. The use
of templates allowed rooms to be created with the Single Sheet entry only. There were some specifics
defined for certain spaces that override the template, but this was not needed often.
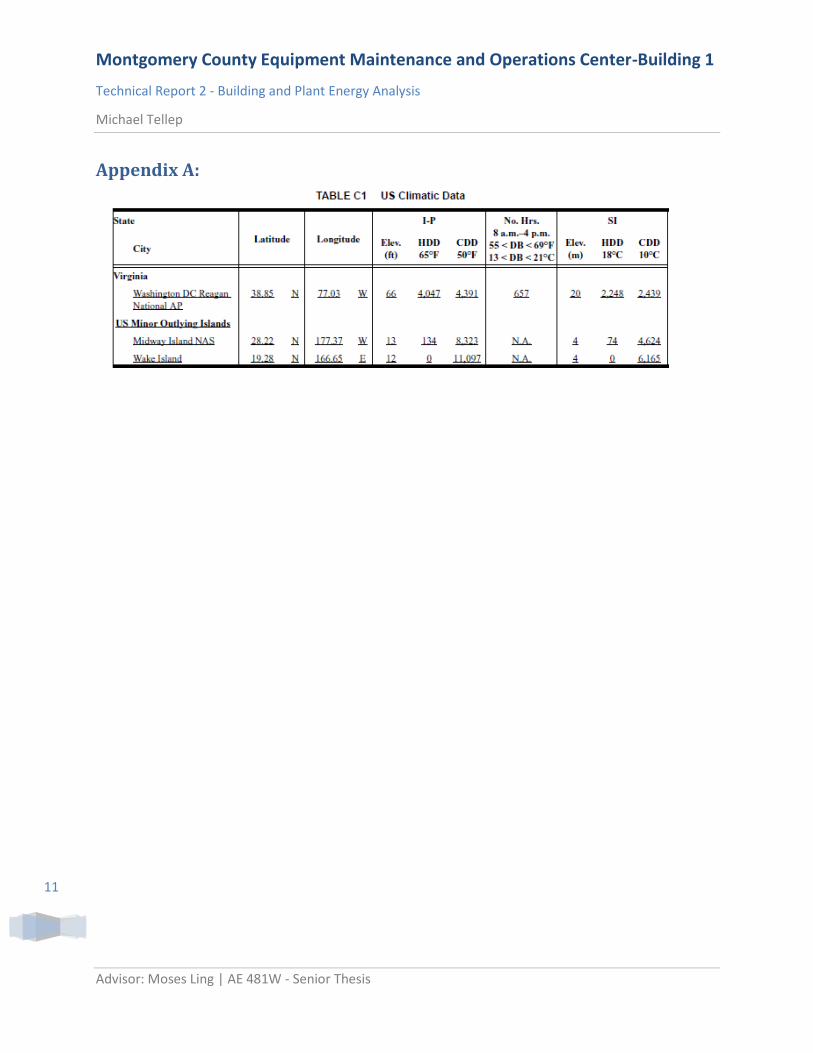
Weather Data:
The weather data selected for the analysis was from Washington D.C. Even though EMOC 1 is located in
Rockville, MD, the data for Washington is consistent with the data for Rockville and is already available
in TRACE 700. The specific data used can be found in Appendix A.
Montgomery County Equipment Maintenance and Operations Center-Building 1
Technical Report 2 - Building and Plant Energy Analysis
Michael Tellep
Advisor: Moses Ling | AE 481W - Senior Thesis
5
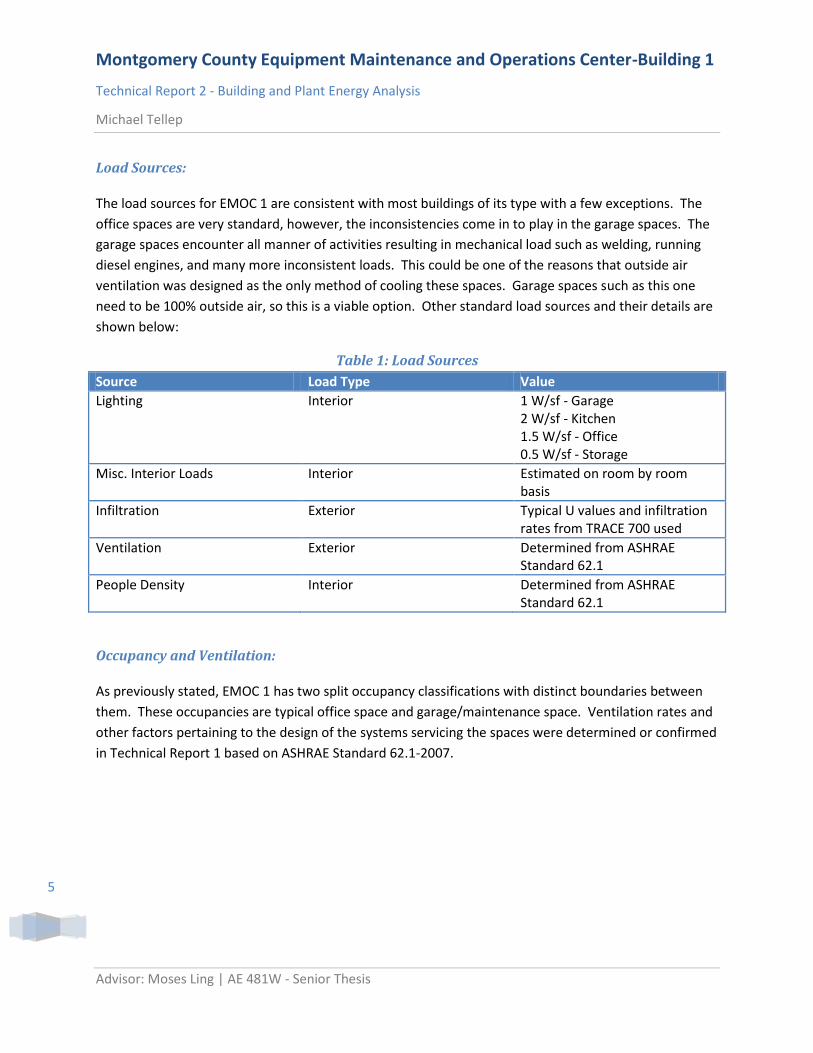
Load Sources:
The load sources for EMOC 1 are consistent with most buildings of its type with a few exceptions. The
office spaces are very standard, however, the inconsistencies come in to play in the garage spaces. The
garage spaces encounter all manner of activities resulting in mechanical load such as welding, running
diesel engines, and many more inconsistent loads. This could be one of the reasons that outside air
ventilation was designed as the only method of cooling these spaces. Garage spaces such as this one
need to be 100% outside air, so this is a viable option. Other standard load sources and their details are
shown below:
Table 1: Load Sources
Source Load Type Value
Lighting Interior 1 W/sf - Garage 2 W/sf - Kitchen 1.5 W/sf - Office 0.5 W/sf - Storage
Misc. Interior Loads Interior Estimated on room by room basis
Infiltration Exterior Typical U values and infiltration rates from TRACE 700 used
Ventilation Exterior Determined from ASHRAE Standard 62.1
People Density Interior Determined from ASHRAE Standard 62.1
Occupancy and Ventilation:
As previously stated, EMOC 1 has two split occupancy classifications with distinct boundaries between
them. These occupancies are typical office space and garage/maintenance space. Ventilation rates and
other factors pertaining to the design of the systems servicing the spaces were determined or confirmed
in Technical Report 1 based on ASHRAE Standard 62.1-2007.

Montgomery County Equipment Maintenance and Operations Center-Building 1
Technical Report 2 - Building and Plant Energy Analysis
Michael Tellep
Advisor: Moses Ling | AE 481W - Senior Thesis
6
Schedules:
The following schedules were used for the energy analysis:
Table 2 - Weekday Cooling
Time Period Percentage Available
0000 - 0500 30
0500 - 0600 60
0600 - 0700 90
0700 - 2000 100
2000 - 2100 90
2100 - 2200 60
2200 - 0000 30
Table 3 - Weekend Cooling
Time Period Percentage Available
0000 - 0500 30
0500 - 0700 60
0700 - 0900 90
0900 - 1800 100
1800 - 2000 90
2000 - 2100 60
2100 - 0000 30
Table 4 - Heating Schedule
Time Period Percent Available
0000 - 0000 100

Montgomery County Equipment Maintenance and Operations Center-Building 1
Technical Report 2 - Building and Plant Energy Analysis
Michael Tellep
Advisor: Moses Ling | AE 481W - Senior Thesis
7
Summary of Results:
5 systems were considered for this energy analysis. These systems are RTU-1 through RTU-3, ERU-1&2,
and HV-1. The table below shows the results of the calculations from TRACE 700:
Table 5 - TRACE 700 Results by System
System Parameter Cooling Heating
RTU-1 %OA 7.7 7.8
cfm/sf 1.78 1.75
cfm/ton 459.45 -
sf/ton 257.49 -
RTU-2 %OA 18.4 15.3
cfm/sf 0.97 0.97
cfm/ton 292.68 -
sf/ton 301.90 -
RTU-3 %OA 6.0 6.6
cfm/sf 2.07 2.07
cfm/ton 463.68 -
sf/ton 224.35 -
ERU-1 %OA - 100
cfm/sf - 0.25
cfm/ton - -
sf/ton - -
ERU-2 %OA - 100
cfm/sf - 0.25
cfm/ton - -
sf/ton - -
HV-1 %OA - 100
cfm/sf - 0.18
cfm/ton - -
sf/ton - -
One can clearly see how the systems are split to service each specific occupancy in the building by
simply looking at the outside air percentages. The RTUs have a relatively normal outside air intake due
to the fact that they only service the office spaces. The ERUs and HV unit are 100 percent outside air
because of their exclusive service to the garage and maintenance spaces. The project mechanical
engineer did not provide data from an energy analysis, however, when compared to other buildings of
its type, this analysis shows EMOC 1 to be at the lower end of its type in terms of energy use. This is
consistent with the efforts to classify EMOC 1 as LEED silver. These results are similar, but not perfectly
consistent with the design documents. The design document values could be including some
assumptions made by the engineer that I did not make here.

Montgomery County Equipment Maintenance and Operations Center-Building 1
Technical Report 2 - Building and Plant Energy Analysis
Michael Tellep
Advisor: Moses Ling | AE 481W - Senior Thesis
8
Another result of the TRACE 700 analysis is the design heating and cooling capacity of the building. The
full report can be seen in Appendix C, but a summary of these capacities is shown below:
Table 6 - Plant Size
Plant System Main Coil (tons or MBh)
Heating RTU-1 79
RTU-2 158
RTU-3 77
ERU-1 611
ERU-2 714
HV-1 75
Heating Total: 1,714 MBh
Cooling RTU-1 28.6
RTU-2 55.0
RTU-3 22.0
Cooling Total: 105.6 tons
It can be seen here that the heating total is slightly higher than a typical building of this size. This is due
to the considerations taken for the garage bay doors being opened and the extreme infiltration
associated with that. The ERUs are clearly sized much larger for this purpose. However, looking just at
the RTUs that service the office spaces, the efforts towards a LEED certified building are displayed.

Montgomery County Equipment Maintenance and Operations Center-Building 1
Technical Report 2 - Building and Plant Energy Analysis
Michael Tellep
Advisor: Moses Ling | AE 481W - Senior Thesis
9
Energy Analysis: This section will analyze the overall energy distribution in the building and how it relates to an average
building energy distribution figure. The full energy distribution can be found in Appendix C, however, a
summary is given below for comparison.
Table 7 - Energy Distribution
System % Total
Primary Heating 4.7
Primary Cooling 6.9
Lighting 67.9
Receptacle 20.6
For this analysis, the lighting system came out to be quite high. This could be due to a modeling error or
due to assumptions made during modeling. For comparison, the US Department of Energy chart for
building energy distribution is shown below.
Figure 3 - Energy Distribution

Montgomery County Equipment Maintenance and Operations Center-Building 1
Technical Report 2 - Building and Plant Energy Analysis
Michael Tellep
Advisor: Moses Ling | AE 481W - Senior Thesis
10
Cost Analysis:
The cost data produced for EMOC 1 appears to be quite accurate. This is based on typical buildings of its
type since no actual data is available for EMOC 1 as of yet. Actual utility cost can vary greatly depending
on the accuracy of the design, maintenance of components, use of systems by occupants, and quality of
construction. The estimated cost data from TRACE 700 is summarized below. The full reports can be
found in Appendix C.
Table 8 - Annual Costs
Utility Cost ($/Yr)
Electric 26,061
Gas 363
Total 26,464
The monthly utility costs can also be found in Appendix C. The rates for the utilities service come from
information provided by the city of Rockville. The rates are posted in Appendix B.
Montgomery County Equipment Maintenance and Operations Center-Building 1
Technical Report 2 - Building and Plant Energy Analysis
Michael Tellep
Advisor: Moses Ling | AE 481W - Senior Thesis
11
Appendix A:

Montgomery County Equipment Maintenance and Operations Center-Building 1
Technical Report 2 - Building and Plant Energy Analysis
Michael Tellep
Appendix B: See following pages

ACADEMIC
USE ONLY
Michael Tellep
Rockville, MD
Montgomery County
Penn State AE
Comments
Company
Program user
Building owner
Location
EMOC
Washington, D.C.Location
Latitude
Longitude
38.0 deg
77.0
5
deg
14
29.9
ft
in. Hg
Time Zone
Elevation
Barometric pressure
Air density
Air specific heat
Density-specific heat product
Latent heat factor
Enthalpy factor
lb/cu ft 0.0760
0.2444
1.1147
4,906.9
4.5604
Btu/lb·°F
Btu/h·cfm·°F
Btu·min/h·cu ft
lb·min/hr·cu ft
Summer design dry bulb
Summer design wet bulb
Winter design dry bulb
Summer clearness number
Winter clearness number
Summer ground reflectance
Winter ground reflectance
91
77
17
°F
°F
°F
0.85
0.85
0.20
0.20
TETD-TA1
UATD
Design simulation period
Cooling load methodology
Heating load methodology
January - December
By ACADEMIC
C:\Users\Michael Tellep\Desktop\Trace files\Thesis.trcDataset name
02:42 PM on 12/06/2011Calculation time
TRACE® 700 version
400Carbon Dioxide Level ppm
6.2.6.5

MONTHLY UTILITY COSTS
By ACADEMIC
ACADEMIC
USE
ONLY
Jan Feb Mar Apr May June July Aug Sept Oct Nov Dec TotalUtility
------- Monthly Utility Costs -------
Alternative 1
Electric
26,043 0 0 3,230 3,372 3,673 3,804 3,575 1,852 1,667 1,688 1,510 1,671On-Pk Cons. ($)
19 9 9 0 0 0 0 0 0 0 0 0 0On-Pk Demand ($)
1,671 1,510 1,688 1,667 1,852 3,575 3,804 3,673 3,372 3,230 9 9 26,061Total ($):
Gas
363 49 18 18 18 18 18 18 18 18 19 64 86On-Pk Cons. ($)
1,757 1,574 1,707 1,685 1,870 3,593 3,822 3,691 3,390 3,249 27 59 26,424Monthly Total ($):
Building Area = 74,991 ft²
Utility Cost Per Area = 0.35 $/ft²
Project Name: TRACE® 700 v6.2.6.5 calculated at 02:42 PM on 12/06/2011EMOC
Dataset Name: Thesis.trc Monthly Utility Costs report Page 1 of 1

SYSTEM SUMMARY
DESIGN COOLING CAPACITIES
By ACADEMIC
Alternative 1
Building Airside Systems and Plant Capacities
tontontontontontontontontontontontontontonPlant ton tonSystem mo/hr
Peak TotalTotalCoil Coil Load Cond Cond Utility Coil Coil Coil Load Cond Cond UtilityCoil
Of BlockPeakMain Desic Desic Main Desic DesicAux Opt Vent Misc Base Aux Opt Vent Misc Base
TimeStg 1 Stg 2 Stg 1 Stg 2
Peak Plant Loads Block Plant Loads
Cooling plant - 001 105.6 0.0 0.0 0.0 0.0 0.0 0.0 105.6 85.4 0.0 0.0 0.0 0.0 0.0 0.0 85.47/16
28.6 0.0 0.0 0.0 0.0 0.0 0.0 28.6 20.9 0.0 0.0 0.0 0.0 0.0 0.0 20.9RTU - 1 7/16
55.0 0.0 0.0 0.0 0.0 0.0 0.0 55.0 48.3 0.0 0.0 0.0 0.0 0.0 0.0 48.3RTU - 2 7/16
22.0 0.0 0.0 0.0 0.0 0.0 0.0 22.0 16.3 0.0 0.0 0.0 0.0 0.0 0.0 16.3RTU - 3 7/16
Building totals 105.6 0.0 0.0 0.0 0.0 0.0 0.0 105.6 85.4 0.0 0.0 0.0 0.0 0.0 0.0 85.4
Building maximum block load of 85.4 tons occurs in July at hour 16
based on system simulation.
Building peak load is 105.6 tons.
Project Name: TRACE® 700 v6.2.6.5 calculated at 02:42 PM on 12/06/2011EMOCDataset Name: Thesis.trc Design Capacity Quantities report Page 1 of 1

SYSTEM SUMMARY
DESIGN HEATING CAPACITIES
By ACADEMIC
ACADEMIC
USE
ONLY
Alternative 1
System Coil Capacities
System Description System Type Btu/h Btu/h Btu/h Btu/h Btu/h Btu/h Btu/h Btu/h Btu/h Btu/h Btu/h
System System Vent TotalsPreheat Reheat Humid. Prevention PreventionRegen Regen
Main Aux HeatingDesic DesicOptional Frost Frost
Stg 1 Stg 2 Stg 1 Stg 2
RTU - 1 Bypass VAV with Reheat (30% Min Flow Default) -79,374 0 -75,166 -163 0 0 0 0 0 0 -154,540
RTU - 2 Bypass VAV with Reheat (30% Min Flow Default) -158,047 0 -155,506 -6,025 0 0 0 0 0 0 -313,553
RTU - 3 Bypass VAV with Reheat (30% Min Flow Default) -76,788 0 -51,974 -3,280 0 0 0 0 0 0 -128,761
ERU - 1 Ventilation and Heating -610,995 0 0 0 0 0 0 0 0 0 -610,995
ERU - 2 Ventilation and Heating -713,787 0 0 0 0 0 0 0 0 0 -713,787
HV - 1 Ventilation and Heating -74,674 0 0 0 0 0 0 0 0 0 -74,674
-1,713,665 0 -282,645 -9,469 0 0 0 0 0 0 -1,996,311Totals
Building Plant Capacities
Plant MBhMBhMBhMBhMBhMBh MBh MBh MBh MBhMBh MBhMBhSystem
Regen. LoadPrev. Prev.CoilCoilCoil Coil Coil Load Regen. UtilityCoil
Desic. AbsorptionFrost FrostHumid.ReheatPreheatMain Aux Opt Vent Misc Desic. Base
Stg 1 Stg 1 Stg 2Stg 2
Peak Loads
Heating plant - 002 1,714 283 0 0 0 0 0 0 0 0 0 0 0
79 75 0 0 0 0 0 0 0 0 0 0 0RTU - 1
158 156 0 0 0 0 0 0 0 0 0 0 0RTU - 2
77 52 0 0 0 0 0 0 0 0 0 0 0RTU - 3
611 0 0 0 0 0 0 0 0 0 0 0 0ERU - 1
714 0 0 0 0 0 0 0 0 0 0 0 0ERU - 2
75 0 0 0 0 0 0 0 0 0 0 0 0HV - 1
Building peak load is 1,996.3 MBh.
Project Name: EMOC TRACE® 700 v6.2.6.5 calculated at 02:42 PM on 12/06/2011
Dataset Name: Thesis.trc Design Capacity Quantities report Page 1 of 1

Rockville, MDEMOCMichael TellepPenn State AE
20 yearsStudy Life:
CommentsCompanyUserProject NameLocation
Project Information
Economic Summary
ThesisAlternative 1:10 %Cost of Capital:
Economic Comparison of Alternatives
First Cost
Difference
($)
Yearly Savings
($)
Cumulative Cash
Flow Difference ($)
Simple
Payback (yrs.)
Net Present
Value
($)
Internal Rate of
Return (%)
Life Cycle
Payback (yrs.)
Life Cycle
Cost
$0
$4,000
$8,000
$12,000
$16,000
$20,000
$24,000
$28,000
Yearly Total Operating Cost Yearly Utility Cost Yearly Maintenance Cost Others
Alt 1
Annual Operating Costs
Yearly Maintenance Cost ($)Yearly Utility Cost ($)Yearly Total Operating Cost ($)
$0
$500
$1,000
$1,500
$2,000
$2,500
$3,000
$3,500
$4,000
January February March April May June July August September October November December
Alt 1
Monthly Utility Costs
TRACE 700 6.2.6.5
Dataset Name: Thesis.trc calculated at 02:42 PM on 12/06/2011
Project Name: EMOC

By ACADEMIC
ENERGY CONSUMPTION SUMMARY
Total Building
(kBtu/yr)
Energy
(kBtu/yr)
Total Source% of Total
Building Energy*
Energy
Gas
Cons.
(kBtu)
Elect
Cons.
(kWh)
Alternative 1
Primary heating
Primary heating 120,862 3.1 127,223% 120,862
Other Htg Accessories 18,046 1.6 184,790% 61,590
Heating Subtotal 18,046 120,862 4.7 312,013% 182,452
Primary cooling
Cooling Compressor 67,284 5.9 688,985% 229,639
Tower/Cond Fans 9,661 0.9 98,928% 32,973
Condenser Pump 0.0 0% 0
Other Clg Accessories 847 0.1 8,677% 2,892
Cooling Subtotal.... 77,792 6.9 796,591% 265,504
Auxiliary
Supply Fans 0.0 0% 0
Pumps 0.0 0% 0
Stand-alone Base Utilities 0.0 0% 0
Aux Subtotal.... 0.0 0% 0
Lighting
Lighting 770,727 67.9 7,892,260% 2,630,490
Receptacle
Receptacles 233,892 20.6 2,395,060% 798,274
Cogeneration
Cogeneration 0.0 0% 0
Totals
Totals** 1,100,457 120,862 100.0 11,395,924% 3,876,720
** Note: This report can display a maximum of 7 utilities. If additional utilities are used, they will be included in the total.
* Note: Resource Utilization factors are included in the Total Source Energy value .
EMOC TRACE® 700 v6.2.6.5 calculated at 02:42 PM on 12/06/2011Project Name:
Alternative - 1 Energy Consumption Summary report page 1Thesis.trcDataset Name:

* Alt-1 Thesis
Energy
10^6 Btu/yr
Proposed
/ Base
%
Peak
kBtuh
Lighting - Conditioned Electricity 2,630.5 68 300
Space Heating Electricity 61.6 2 9
Gas 120.9 3 332
Space Cooling Electricity 232.5 6 302
Heat Rejection Electricity 33.0 1 32
Receptacles - Conditioned Electricity 798.3 21 91
Total Building Consumption 3,876.7
Energy Cost Budget / PRM Summary
By ACADEMIC
Project Name: EMOC
Weather Data: Washington, D.C.City: Rockville, MD
December 06, 2011Date:
Note: The percentage displayed for the "Proposed/ Base %"
column of the base case is actually the percentage of the
total energy consumption.
* Denotes the base alternative for the ECB study.ACADEMIC USE ONLY
ACADEMIC USE Only * Alt-1 Thesis
Energy
10^6 Btu/yr
Cost/yr
$/yr
Electricity 3,755.9 26,061
Gas 120.9 363
Total 3,877 26,424
* Alt-1 Thesis
Total Number of hours heating load not met
Number of hours cooling load not met
188
0
EMOC
Dataset Name:
Project Name:
Energy Cost Budget Report Page 1 of 1
TRACE® 700 v6.2.6.5 calculated at 02:42 PM on 12/06/2011
Thesis.trc

ENGINEERING CHECKS
By ACADEMIC
ACADEMIC
USE
ONLY
COOLING HEATINGFloor Area
Type % OASystem cfm/ft² cfm/ton ft²/ton Btu/hr·ft² % OA cfm/ft²ft² Btu/hr·ft²Zone Room
Alternative 1 0.00 0.00 0.0 0.0 0.00 100.00 1,519 0.14 -15.17Zone1101 - Corridor
0.00 0.00 0.0 0.0 0.00 100.00 479 0.18 -21.31Zone1117 - Tool Storage
0.00 0.00 0.0 0.0 0.00 100.00 1,000 0.22 -26.65Zone1133 - Tire Shops
0.00 0.00 0.0 0.0 0.00 100.00 2,569 0.18 -21.31Zone1134 - Corridor
0.00 0.00 0.0 0.0 0.00 100.00 5,935 0.29 -34.59Zone1168-1173 - Maintenance Bays
0.00 0.00 0.0 0.0 0.00 100.00 5,962 0.29 -34.53Zone1174-1179 - Maintenance Bays
0.00 0.00 0.0 0.0 0.00 100.00 1,761 0.31 -37.21Zone1184 - Welding Bay
0.00 0.00 0.0 0.0 0.00 100.00 771 0.21 -25.48Zone1185 - Welding Shop
0.00 0.00 0.0 0.0 0.00 100.00 19,996 0.25 -30.56System - Ventilation and HeatingERU - 1
0.00 0.00 0.0 0.0 0.00 100.00 1,119 0.29 -34.88Zone1139 - Tire Shop/Storage - Bus Tires
0.00 0.00 0.0 0.0 0.00 100.00 1,536 0.23 -27.86Zone1149 - Body/Welding Bay
0.00 0.00 0.0 0.0 0.00 100.00 1,475 0.24 -29.31Zone1150 - Chassis Wash
0.00 0.00 0.0 0.0 0.00 100.00 9,869 0.26 -31.88Zone1151-1159 - Maintenance Bays
0.00 0.00 0.0 0.0 0.00 100.00 8,483 0.27 -32.31Zone1160-1167 - Maintenance Bays
0.00 0.00 0.0 0.0 0.00 100.00 22,481 0.26 -31.75System - Ventilation and HeatingERU - 2
0.00 0.00 0.0 0.0 0.00 100.00 1,244 0.27 -32.14Zone1122 - Shipping & Receiving
0.00 0.00 0.0 0.0 0.00 100.00 1,842 0.12 -13.19Zone1123 - Parts Room
0.00 0.00 0.0 0.0 0.00 100.00 527 0.16 -19.72Zone1182 - Machine Shop
0.00 0.00 0.0 0.0 0.00 100.00 3,613 0.18 -20.67System - Ventilation and HeatingHV - 1
15.92 0.88 295.2 336.1 35.71 15.92 3,414 0.88 -14.86Zone1204 - Misc
4.19 3.34 556.0 166.7 71.99 4.19 202 3.34 -33.55Zone1205 - Bunks/Bulk Storage
17.69 0.79 265.4 335.7 35.75 17.69 273 0.79 -12.02Zone1206 - Conference
18.33 0.76 259.6 340.2 35.27 18.33 304 0.76 -11.96Zone1207 - Break Room
3.88 3.60 563.6 156.5 76.67 3.88 165 3.60 -35.27Zone1209 - Fleet Serv Manager
11.22 1.25 342.7 274.9 43.65 11.22 102 1.25 -13.03Zone1210 - Visiting Staff
3.33 4.20 577.3 137.4 87.35 3.33 156 4.20 -40.15Zone1211 - Coord Manager
7.67 0.33 187.4 574.8 20.88 36.80 68 0.33 -11.25Zone1212 - Supply STG
7.67 0.33 187.4 574.8 20.88 36.80 74 0.33 -11.25Zone1213 - File Room
3.44 4.06 574.3 141.4 84.85 3.44 162 4.06 -39.08Zone1214 - Coord Manager
13.66 1.02 308.7 301.6 39.79 13.66 147 1.02 -12.53Zone1215 - Electrical
3.20 4.38 580.8 132.7 90.44 3.20 141 4.38 -41.30Zone1216 - Admin Spec
3.70 3.78 573.5 151.6 79.17 3.70 230 3.78 -36.97Zone1217 - Division Chief
3.03 4.62 592.0 128.1 93.64 3.03 113 4.62 -41.80Zone1218 - Prog Mngr
2.64 5.30 603.5 113.8 105.46 2.64 111 5.30 -47.31Zone1220 - Senior Spec
2.58 5.43 581.1 107.1 112.04 2.58 160 5.43 -57.40Zone1221 - Admin Serv Coord Mngr
4.16 3.36 491.7 146.2 82.09 4.16 137 3.36 -30.89Zone1222 - Prog Mngr
4.08 3.43 494.2 144.2 83.20 4.08 128 3.43 -31.17Zone1223 - Prog Mngr
4.05 3.45 495.0 143.5 83.63 4.05 133 3.45 -31.48Zone1224 - Prog Mngr
3.97 3.52 498.0 141.3 84.94 3.97 118 3.52 -31.67Zone1225 - IT Spec III
TRACE® 700 v6.2.6.5 calculated at 02:42 PM on 12/06/2011EMOCProject Name:
Dataset Name: Thesis.trc Engineering Checks Report Page 1 of 3

ACADEMIC
USE
ONLY
COOLING HEATINGFloor Area
Type % OASystem cfm/ft² cfm/ton ft²/ton Btu/hr·ft² % OA cfm/ft²ft² Btu/hr·ft²Zone Room
4.05 3.45 495.0 143.5 83.63 4.05 133 3.45 -31.48Zone1226 - IT Spec II
3.95 3.54 498.3 140.7 85.26 3.95 129 3.54 -32.10Zone1227 - IT Spec II
20.41 0.69 242.4 353.8 33.92 20.41 446 0.69 -11.79Zone1228 - Conference
13.38 1.05 312.3 298.8 40.16 13.38 141 1.05 -12.58Zone1231 - Men
14.52 0.96 298.4 309.7 38.74 14.52 167 0.96 -12.40Zone1232 - Women
7.71 1.78 459.4 257.5 46.60 7.82 7,354 1.78 -21.01System - Bypass VAV with Reheat
(30% Min Flow Default)
RTU - 1
21.90 0.64 235.0 367.9 32.61 21.90 539 0.64 -11.89Zone1105 - Crew Chief
22.64 0.62 230.3 372.8 32.19 22.64 656 0.62 -11.85Zone1106 - QA Tech
19.94 0.70 248.3 354.0 33.90 19.94 351 0.70 -12.01Zone1107 - Conferance
12.19 1.15 320.0 279.0 43.01 12.19 101 1.15 -12.85Zone1108 - Equipment Service Coordinator
9.45 1.48 349.1 235.7 50.90 9.45 122 1.48 -27.45Zone1110 - Break Room
17.57 0.80 266.6 334.9 35.83 17.57 230 0.80 -12.19Zone1111 - Men
8.78 1.59 366.6 230.3 52.11 8.78 59 1.59 -13.69Zone1112 - Women
100.00 1.39 157.9 113.6 105.66 30.00 66 1.39 -76.36Zone1113 - Tech Library
100.00 1.39 157.9 113.6 105.66 30.00 64 1.39 -76.36Zone1114 - Depot Crew Chief
100.00 1.39 158.5 114.0 105.24 30.00 431 1.39 -76.36Zone1115 - Crew Chief - Heavy Equipment
15.14 0.92 288.3 312.1 38.45 15.14 157 0.92 -12.43Zone1116 - Equipment Service Coordinator
23.08 0.61 227.6 375.6 31.95 23.08 748 0.61 -11.83Zone1126 - Supply Clerk II & III
12.39 1.13 317.7 281.4 42.64 12.39 104 1.13 -12.82Zone1127 - Shipping & Receiving Office
13.73 1.02 302.7 297.1 40.39 13.73 127 1.02 -12.61Zone1128 - Senior Supply Clerk
7.00 0.36 215.9 604.1 19.86 33.58 120 0.36 -12.11Zone1130 - Bolts Bins Storage
22.78 0.61 229.4 373.7 32.11 22.78 683 0.61 -11.84Zone1200 - Lobby
11.54 1.21 362.8 299.5 40.07 11.54 1,984 1.21 -22.60Zone1203 - Training Room
22.85 0.61 229.0 374.2 32.07 22.85 698 0.61 -11.84Zone1234 - Men Locker
20.69 0.68 243.0 359.5 33.38 20.69 409 0.68 -11.96Zone1235 - Men
13.57 1.03 304.4 295.3 40.64 13.57 124 1.03 -12.63Zone1237 - Women Locker
18.60 0.75 256.1 340.5 35.24 18.60 1,342 0.75 -15.99Zone1239 - Break Room
4.62 1.14 354.2 312.1 38.45 10.57 207 1.14 -17.05Zone1240 - Kitchen
7.00 0.36 215.9 604.1 19.86 33.58 92 0.36 -12.11Zone1241 - STG
13.00 1.08 310.6 288.8 41.55 13.00 114 1.08 -12.71Zone1242 - Vending
23.14 0.60 227.3 376.0 31.91 23.14 762 0.60 -11.82Zone1245 - Corridor
19.19 0.73 253.8 348.2 34.46 19.19 348 0.73 -12.06Zone1247 - Women
20.29 0.69 245.8 356.6 33.65 20.29 430 0.69 -11.99Zone1248 - Men
13.71 1.02 300.4 294.6 40.74 13.71 621 1.02 -20.08Zone1249 - Lockers
13.12 1.07 453.5 425.4 28.21 13.12 116 1.07 -12.70Zone1251 - Driver Mail
17.04 0.82 271.1 330.2 36.34 17.04 211 0.82 -12.23Zone1252 - Dispatch Window
11.29 1.24 325.2 262.6 45.70 11.29 305 1.24 -24.44Zone1254 - Lobby
9.80 1.43 392.4 274.9 43.65 9.80 1,945 1.43 -20.82Zone1255 - Dirvers Room
4.62 1.14 354.2 312.1 38.45 10.57 144 1.14 -17.05Zone1256 - Kitchenette
3.67 3.81 543.0 142.6 84.16 3.67 142 3.81 -39.11Zone1257 - Vending
18.00 0.78 263.1 338.5 35.45 18.00 247 0.78 -12.15Zone1258 - Quiet Room
11.74 1.19 318.0 266.9 44.96 11.74 906 1.19 -27.35Zone1260 - Dispatch Coordinator
21.40 0.65 238.3 364.5 32.92 21.40 478 0.65 -11.92Zone1284 - Corridor
3.21 0.78 317.2 406.9 29.49 15.39 123 0.78 -29.88Zone1293 - Recycling
12.81 1.09 305.4 279.7 42.90 12.81 311 1.09 -25.87Zone1295 - Lockers
TRACE® 700 v6.2.6.5 calculated at 02:42 PM on 12/06/2011EMOCProject Name:
Dataset Name: Thesis.trc Engineering Checks Report Page 2 of 3

ACADEMIC
USE
ONLY
COOLING HEATINGFloor Area
Type % OASystem cfm/ft² cfm/ton ft²/ton Btu/hr·ft² % OA cfm/ft²ft² Btu/hr·ft²Zone Room
18.35 0.97 292.7 301.9 39.75 15.31 16,617 0.97 -18.87System - Bypass VAV with Reheat
(30% Min Flow Default)
RTU - 2
6.46 2.17 417.0 192.5 62.33 6.46 242 2.17 -23.31Zone1245 - Misc Rooms
11.38 1.23 323.6 263.4 45.55 11.38 186 1.23 -23.17Zone1250 - Dispatch Coord Locker
9.56 1.46 407.0 278.1 43.15 9.56 859 1.46 -19.81Zone1261 - Training Room
16.80 0.83 267.6 321.4 37.34 16.80 204 0.83 -12.14Zone1262 - Men
16.80 0.83 267.6 321.4 37.34 16.80 204 0.83 -12.14Zone1263 - Women
8.37 0.30 170.9 571.8 20.99 40.16 114 0.30 -11.21Zone1264 - Training Storage
10.23 1.37 340.2 248.7 48.24 10.23 262 1.37 -26.33Zone1265 - Uniform Storage
0.51 4.90 561.0 114.4 104.90 2.45 146 4.90 -65.07Zone1266 - Personnel Records Storage
3.77 3.71 491.5 132.4 90.64 3.77 314 3.71 -32.94Zone1267 - Conference Room
3.53 3.96 496.3 125.4 95.73 3.53 195 3.96 -37.40Zone1268 - Break Room
1.49 4.71 493.0 104.8 114.55 2.97 69 4.71 -60.78Zone1269 - Lost and Found
8.37 0.30 170.9 571.8 20.99 40.16 160 0.30 -11.21Zone1271 - Chair/Table Storage
4.16 3.36 541.8 161.2 74.42 4.16 122 3.36 -33.05Zone1272 - Transit Operations Supervisor
4.11 3.40 543.2 159.6 75.18 4.11 111 3.40 -33.05Zone1273 - Transit Operations Supervisor
4.08 3.43 543.9 158.7 75.62 4.08 105 3.43 -33.02Zone1274 - Transit Operations Supervisor
4.19 3.34 541.1 162.2 73.98 4.19 123 3.34 -32.87Zone1275 - Transit Operations Supervisor
4.19 3.33 541.1 162.3 73.95 4.19 122 3.33 -32.83Zone1276 - Transit Operations Supervisor
4.11 3.41 543.2 159.4 75.27 4.11 116 3.41 -33.26Zone1277 - Transit Operations Supervisor
3.11 4.49 546.0 121.6 98.68 3.11 112 4.49 -58.57Zone1278 - Transit Operations Supervisor
5.58 2.51 452.5 180.4 66.51 5.58 110 2.51 -35.97Zone1279 - Transit Operations Supervisor
5.37 2.61 457.5 175.5 68.36 5.37 105 2.61 -37.15Zone1280 - Transit Operation Supervisor
4.28 3.27 455.3 139.4 86.09 4.28 166 3.27 -53.50Zone1281 - Seciton Chief
8.37 0.30 170.9 571.8 20.99 40.16 296 0.30 -11.21Zone1296 - Vehicle Condition Report Storage
17.81 0.79 258.2 328.8 36.49 17.81 236 0.79 -12.04Zone1297 - Copy/Work Room
18.23 0.77 254.6 331.8 36.17 18.23 251 0.77 -12.00Zone1298 - Schedule/Transfer Storage
5.96 2.07 463.7 224.3 53.49 6.63 4,930 2.07 -26.12System - Bypass VAV with Reheat
(30% Min Flow Default)
RTU - 3
TRACE® 700 v6.2.6.5 calculated at 02:42 PM on 12/06/2011EMOCProject Name:
Dataset Name: Thesis.trc Engineering Checks Report Page 3 of 3
MONTHLY ENERGY CONSUMPTION
By ACADEMIC
ACADEMIC
USE
ONLY
Jan Feb Mar Apr May June July Aug Sept Oct Nov Dec TotalUtility
------- Monthly Energy Consumption -------
Alternative: 1 Thesis
Electric
1,100,456 87,572 85,575 89,361 93,268 101,604 105,236 98,903 96,915 87,224 88,353 79,010 87,437On-Pk Cons. (kWh)
212 129 142 149 186 203 212 204 180 151 144 132 127On-Pk Demand (kW)
Gas
1,209 230 72 39 14 10 8 8 14 31 87 297 398On-Pk Cons. (therms)
3 2 0 0 0 0 0 0 0 0 1 3 3On-Pk Demand (therms/hr)
BuildingSource
Floor Area
51,695
151,963
ft2
Btu/(ft2-year)
74,991
CO2SO2NOX
Energy Consumption Environmental Impact Analysis
4,105,348 lbm/year
10,791 gm/year
5,732 gm/year
Btu/(ft2-year)
Project Name: TRACE® 700 v6.2.6.5 calculated at 02:42 PM on 12/06/2011EMOC
Dataset Name: Thesis.trc Alternative - 1 Monthly Energy Consumption report Page 1 of 1

System ChecksumsBy ACADEMIC
Ventilation and HeatingERU - 1
ACADEMIC
USE ONLY
HEATING COIL PEAKCLG SPACE PEAKCOOLING COIL PEAK TEMPERATURES
Heating DesignMo/Hr:0 / 0Mo/Hr:0 / 0Mo/Hr:Peaked at Time: Cooling Heating
SADBOADB: 17OADB:0 / 0 / 0OADB/WB/HR:Outside Air: 0.0 124.6
Ra Plenum 0.0 48.2
ReturnPercentCoil PeakSpace PeakSpace PercentPercentNetPlenumSpace 0.0 48.2Ret/OASens. + Lat. Of TotalTot SensSpace SensOf TotalSensibleOf TotalTotalSens. + Lat 17.0 0.0
0.1 0.0Fn MtrTDBtu/h (%)Btu/hBtu/h(%)Btu/h(%)Btu/hBtu/h 0.1 0.0Fn BldTDEnvelope Loads 0.3 0.0Fn Frict 0Skylite Solar 0.00 0 0 0 0 0 0 0
0Skylite Cond 0.00 0 0 0 0 0 0 0 0Roof Cond 21.80-133,169 0 0 0 0 0 0
0.00 0Glass Solar 0 0 0 0 0 0 0 0Glass/Door Cond -77,059 12.61-77,059 0 0 0 0 0
AIRFLOWS
HeatingCooling 0Wall Cond 4.40-26,910-21,884 0 0 0 0 0 0Partition/Door 0.00 0 0 0 0 0 0 0Floor 0.00 0 0 0 0 0
Sec Fan 11.91 0Infiltration -72,776-72,776 0 0 0 0
0 0MinStop/Rh
50.72 0Sub Total ==> -309,915-171,718 0 0 0 0 0
0Return 0
Internal Loads
0 0Exhaust
0Lights 0.00 0 0 0 0 0 0 0
0 6,328Rm Exh
0People 0.00 0 0 0 0
0 0Auxiliary
0Misc 0.00 0 0 0 0 0 0 0
0Sub Total ==> 0.00 0 0 0 0 0 0 0
0Ceiling Load 0.000-138,196 0 0 0 0 0 0Ventilation Load 49.28-301,080 0 0 0 0 0 0
Sup. Fan Heat 0 0
ENGINEERING CKS
HeatingCooling
Ret. Fan Heat 0 0 0 % OA 100.0 0.0
Duct Heat Pkup 0 0 0 0.25 0.00cfm/ft²
0Ov/Undr Sizing
0.00 0 0
0 0 0 0
0.00cfm/ton
Exhaust Heat
0.00 0 0 0
0.00ft²/ton
-30.56 0.00Btu/hr·ft²
103No. People 0Grand Total ==> 100.00-610,995-309,915100.00 0100.00 0 0
AREAS HEATING COIL SELECTIONCOOLING COIL SELECTIONTotal Capacity Sens Cap. Coil Airflow Enter DB/WB/HR Leave DB/WB/HR Gross Total Glass Coil Airflow Ent LvgCapacityton MBh MBh cfm °F °F gr/lb °F °F gr/lb ft² (%) °F°FcfmMBh
Floor 19,996 Main Htg -611.0 5,096 17.0 124.6 0.0 0.0 0.0 0 0.0 0.0 0.0 0.0 0.0 0.0Main ClgPart 0 Aux Htg 0.0 0.0 0.0 0 0.0 0.0 0.0 0 0.0 0.0 0.0 0.0 0.0 0.0Aux Clg
ExFlr 0 0.0Preheat 0.0 0.0 0 0.0 0.0 0.0 0 0.0 0.0 0.0 0.0 0.0 0.0Opt Vent
Roof 19,996 0 0Wall 9,900 2,848 29
Humidif 0.0 0 0.0 0.0 0.0 0.0TotalOpt Vent 0.0 0.0 0.0 0
-611.0Total
Envelope LoadsSkylite SolarSkylite CondRoof CondGlass SolarGlass/Door CondWall CondPartition/DoorFloor
InfiltrationSub Total ==>
LightsPeopleMisc
Sub Total ==>
Ceiling LoadVentilation Load
Additional Reheat
OA Preheat Diff.
Ov/Undr SizingExhaust Heat
RA Preheat Diff.
Grand Total ==>
Internal Loads
0
0 0
0.00 0.00 0.00
0
Supply Air Leakage
0
Dehumid. Ov Sizing 0 0
Adj Air Trans Heat 0 0 0 0 0 Adj Air Trans Heat 0 0 0Leakage Ups
Leakage Dwn
1,232 0Infil
AHU Vent
Nom Vent
Main FanTerminal
Adjacent Floor
Diffuser
Supply Air Leakage
Underflr Sup Ht Pkup Underflr Sup Ht Pkup
Adjacent Floor 0 0 0 0
0 0
0 0 0
0 0
0 0 0 0
0 0.00
0 0.00
0
0 0
0
0
0
0
0
5,096
5,096 5,096
0
5,096
5,096
0
0
0 0 0
Int Door 0
Ext Door 0 0 0
TRACE® 700 v6.2.6.5 calculated at 02:42 PM on 12/06/2011Project Name: EMOC
Dataset Name: Alternative - 1 System Checksums Report Page 1 of 6Thesis.trc

System ChecksumsBy ACADEMIC
Ventilation and HeatingERU - 2
ACADEMIC
USE ONLY
HEATING COIL PEAKCLG SPACE PEAKCOOLING COIL PEAK TEMPERATURES
Heating DesignMo/Hr:0 / 0Mo/Hr:0 / 0Mo/Hr:Peaked at Time: Cooling Heating
SADBOADB: 17OADB:0 / 0 / 0OADB/WB/HR:Outside Air: 0.0 125.0
Ra Plenum 0.0 48.2
ReturnPercentCoil PeakSpace PeakSpace PercentPercentNetPlenumSpace 0.0 48.2Ret/OASens. + Lat. Of TotalTot SensSpace SensOf TotalSensibleOf TotalTotalSens. + Lat 17.0 0.0
0.1 0.0Fn MtrTDBtu/h (%)Btu/hBtu/h(%)Btu/h(%)Btu/hBtu/h 0.1 0.0Fn BldTDEnvelope Loads 0.4 0.0Fn Frict 0Skylite Solar 0.00 0 0 0 0 0 0 0
0Skylite Cond 0.00 0 0 0 0 0 0 0 0Roof Cond 20.99-149,840 0 0 0 0 0 0
0.00 0Glass Solar 0 0 0 0 0 0 0 0Glass/Door Cond -99,164 13.89-99,164 0 0 0 0 0
AIRFLOWS
HeatingCooling 0Wall Cond 3.64-25,951-20,592 0 0 0 0 0 0Partition/Door 0.00 0 0 0 0 0 0 0Floor 0.00 0 0 0 0 0
Sec Fan 12.41 0Infiltration -88,548-88,548 0 0 0 0
0 0MinStop/Rh
50.93 0Sub Total ==> -363,503-208,304 0 0 0 0 0
0Return 0
Internal Loads
0 0Exhaust
0Lights 0.00 0 0 0 0 0 0 0
0 7,428Rm Exh
0People 0.00 0 0 0 0
0 0Auxiliary
0Misc 0.00 0 0 0 0 0 0 0
0Sub Total ==> 0.00 0 0 0 0 0 0 0
0Ceiling Load 0.000-155,199 0 0 0 0 0 0Ventilation Load 49.07-350,285 0 0 0 0 0 0
Sup. Fan Heat 0 0
ENGINEERING CKS
HeatingCooling
Ret. Fan Heat 0 0 0 % OA 100.0 0.0
Duct Heat Pkup 0 0 0 0.26 0.00cfm/ft²
0Ov/Undr Sizing
0.00 0 0
0 0 0 0
0.00cfm/ton
Exhaust Heat
0.00 0 0 0
0.00ft²/ton
-31.75 0.00Btu/hr·ft²
112No. People 0Grand Total ==> 100.00-713,787-363,503100.00 0100.00 0 0
AREAS HEATING COIL SELECTIONCOOLING COIL SELECTIONTotal Capacity Sens Cap. Coil Airflow Enter DB/WB/HR Leave DB/WB/HR Gross Total Glass Coil Airflow Ent LvgCapacityton MBh MBh cfm °F °F gr/lb °F °F gr/lb ft² (%) °F°FcfmMBh
Floor 22,481 Main Htg -713.8 5,929 17.0 125.0 0.0 0.0 0.0 0 0.0 0.0 0.0 0.0 0.0 0.0Main ClgPart 0 Aux Htg 0.0 0.0 0.0 0 0.0 0.0 0.0 0 0.0 0.0 0.0 0.0 0.0 0.0Aux Clg
ExFlr 0 0.0Preheat 0.0 0.0 0 0.0 0.0 0.0 0 0.0 0.0 0.0 0.0 0.0 0.0Opt Vent
Roof 22,481 0 0Wall 10,547 3,664 35
Humidif 0.0 0 0.0 0.0 0.0 0.0TotalOpt Vent 0.0 0.0 0.0 0
-713.8Total
Envelope LoadsSkylite SolarSkylite CondRoof CondGlass SolarGlass/Door CondWall CondPartition/DoorFloor
InfiltrationSub Total ==>
LightsPeopleMisc
Sub Total ==>
Ceiling LoadVentilation Load
Additional Reheat
OA Preheat Diff.
Ov/Undr SizingExhaust Heat
RA Preheat Diff.
Grand Total ==>
Internal Loads
0
0 0
0.00 0.00 0.00
0
Supply Air Leakage
0
Dehumid. Ov Sizing 0 0
Adj Air Trans Heat 0 0 0 0 0 Adj Air Trans Heat 0 0 0Leakage Ups
Leakage Dwn
1,499 0Infil
AHU Vent
Nom Vent
Main FanTerminal
Adjacent Floor
Diffuser
Supply Air Leakage
Underflr Sup Ht Pkup Underflr Sup Ht Pkup
Adjacent Floor 0 0 0 0
0 0
0 0 0
0 0
0 0 0 0
0 0.00
0 0.00
0
0 0
0
0
0
0
0
5,929
5,929 5,929
0
5,929
5,929
0
0
0 0 0
Int Door 0
Ext Door 0 0 0
TRACE® 700 v6.2.6.5 calculated at 02:42 PM on 12/06/2011Project Name: EMOC
Dataset Name: Alternative - 1 System Checksums Report Page 2 of 6Thesis.trc
System ChecksumsBy ACADEMIC
Ventilation and HeatingHV - 1
ACADEMIC
USE ONLY
HEATING COIL PEAKCLG SPACE PEAKCOOLING COIL PEAK TEMPERATURES
Heating DesignMo/Hr:0 / 0Mo/Hr:0 / 0Mo/Hr:Peaked at Time: Cooling Heating
SADBOADB: 17OADB:0 / 0 / 0OADB/WB/HR:Outside Air: 0.0 121.8
Ra Plenum 0.0 50.7
ReturnPercentCoil PeakSpace PeakSpace PercentPercentNetPlenumSpace 0.0 50.7Ret/OASens. + Lat. Of TotalTot SensSpace SensOf TotalSensibleOf TotalTotalSens. + Lat 17.0 0.0
0.0 0.0Fn MtrTDBtu/h (%)Btu/hBtu/h(%)Btu/h(%)Btu/hBtu/h 0.0 0.0Fn BldTDEnvelope Loads 0.0 0.0Fn Frict 0Skylite Solar 0.00 0 0 0 0 0 0 0
0Skylite Cond 0.00 0 0 0 0 0 0 0 0Roof Cond 34.86-26,034 0 0 0 0 0 0
0.00 0Glass Solar 0 0 0 0 0 0 0 0Glass/Door Cond -3,721 4.98-3,721 0 0 0 0 0
AIRFLOWS
HeatingCooling 0Wall Cond 6.57-4,908-4,152 0 0 0 0 0 0Partition/Door 0.00 0 0 0 0 0 0 0Floor 0.00 0 0 0 0 0
Sec Fan 9.34 0Infiltration -6,975-6,975 0 0 0 0
0 0MinStop/Rh
55.76 0Sub Total ==> -41,638-14,849 0 0 0 0 0
0Return 221
Internal Loads
221 0Exhaust
0Lights 0.00 0 0 0 0 0 0 0
0 537Rm Exh
0People 0.00 0 0 0 0
0 0Auxiliary
0Misc 0.00 0 0 0 0 0 0 0
0Sub Total ==> 0.00 0 0 0 0 0 0 0
0Ceiling Load 0.000-22,044 0 0 0 0 0 0Ventilation Load 50.59-37,781 0 0 0 0 0 0
Sup. Fan Heat 0 0
ENGINEERING CKS
HeatingCooling
Ret. Fan Heat 0 0 0 % OA 100.0 0.0
Duct Heat Pkup 0 0 0 0.18 0.00cfm/ft²
0Ov/Undr Sizing
0.00 0 0
0 0 0 0
0.00cfm/ton
Exhaust Heat
-6.35 4,745 0 0
0.00ft²/ton
-20.67 0.00Btu/hr·ft²
18No. People 0Grand Total ==> 100.00-74,674-36,893100.00 0100.00 0 0
AREAS HEATING COIL SELECTIONCOOLING COIL SELECTIONTotal Capacity Sens Cap. Coil Airflow Enter DB/WB/HR Leave DB/WB/HR Gross Total Glass Coil Airflow Ent LvgCapacityton MBh MBh cfm °F °F gr/lb °F °F gr/lb ft² (%) °F°FcfmMBh
Floor 3,613 Main Htg -74.7 639 17.0 121.8 0.0 0.0 0.0 0 0.0 0.0 0.0 0.0 0.0 0.0Main ClgPart 0 Aux Htg 0.0 0.0 0.0 0 0.0 0.0 0.0 0 0.0 0.0 0.0 0.0 0.0 0.0Aux Clg
ExFlr 0 0.0Preheat 0.0 0.0 0 0.0 0.0 0.0 0 0.0 0.0 0.0 0.0 0.0 0.0Opt Vent
Roof 3,613 0 0Wall 1,375 138 10
Humidif 0.0 0 0.0 0.0 0.0 0.0TotalOpt Vent 0.0 0.0 0.0 0
-74.7Total
Envelope LoadsSkylite SolarSkylite CondRoof CondGlass SolarGlass/Door CondWall CondPartition/DoorFloor
InfiltrationSub Total ==>
LightsPeopleMisc
Sub Total ==>
Ceiling LoadVentilation Load
Additional Reheat
OA Preheat Diff.
Ov/Undr SizingExhaust Heat
RA Preheat Diff.
Grand Total ==>
Internal Loads
0
0 0
0.00 0.00 0.00
0
Supply Air Leakage
0
Dehumid. Ov Sizing 0 0
Adj Air Trans Heat 0 0 0 0 0 Adj Air Trans Heat 0 0 0Leakage Ups
Leakage Dwn
118 0Infil
AHU Vent
Nom Vent
Main FanTerminal
Adjacent Floor
Diffuser
Supply Air Leakage
Underflr Sup Ht Pkup Underflr Sup Ht Pkup
Adjacent Floor 0 0 0 0
0 0
0 0 0
0 0
0 0 0 0
0 0.00
0 0.00
0
0 0
0
0
0
0
0
639
639 639
0
639
639
0
0
0 0 0
Int Door 0
Ext Door 0 0 0
TRACE® 700 v6.2.6.5 calculated at 02:42 PM on 12/06/2011Project Name: EMOC
Dataset Name: Alternative - 1 System Checksums Report Page 3 of 6Thesis.trc

System ChecksumsBy ACADEMIC
Bypass VAV with Reheat (30% Min Flow Default)RTU - 1
ACADEMIC
USE ONLY
HEATING COIL PEAKCLG SPACE PEAKCOOLING COIL PEAK TEMPERATURES
Heating DesignMo/Hr:9 / 16Mo/Hr:7 / 16Mo/Hr:Peaked at Time: Cooling Heating
SADBOADB: 17OADB:91 / 76 / 115OADB/WB/HR:Outside Air: 60.6 5,185.9
Ra Plenum 82.8 57.5
ReturnPercentCoil PeakSpace PeakSpace PercentPercentNetPlenumSpace 82.8 57.5Ret/OASens. + Lat. Of TotalTot SensSpace SensOf TotalSensibleOf TotalTotalSens. + Lat 54.3 83.4
0.0 0.1Fn MtrTDBtu/h (%)Btu/hBtu/h(%)Btu/h(%)Btu/hBtu/h 0.0 0.3Fn BldTDEnvelope Loads 0.0 0.8Fn Frict 0Skylite Solar 0.00 0 0 0 0 0 0 0
0Skylite Cond 0.00 0 0 0 0 0 0 0 0Roof Cond 41.08-63,551 0 0 0 32 108,135 108,135
0.00 41,607Glass Solar 0 0 48 100,503 12 41,607 0 7,626Glass/Door Cond -27,008 17.46-27,008 1 2,089 2 7,626 0
AIRFLOWS
HeatingCooling 19,207Wall Cond 20.68-31,984-23,147 13 26,567 8 27,141 7,933
0Partition/Door 0.00 0 0 0 0 0 0 0Floor 0.00 0 0 0 0 0
Sec Fan 0.00 0Infiltration 0 0 0 0 0 0
3,937 14MinStop/Rh
79.22 68,440Sub Total ==> -122,543-50,155 61 129,159 54 184,508 116,068
12,168Return 14,134
Internal Loads
2,038 4Exhaust
29,731Lights 0.00 0 0 14 29,731 11 37,164 7,433
954 0Rm Exh
23,086People 0.00 0 6 12,804 7
0 0Auxiliary
27,475Misc 0.00 0 0 13 27,475 8 27,475 0
80,292Sub Total ==> 0.00 0 0 33 70,010 26 87,724 7,433
18,175Ceiling Load 0.000-29,198 6 12,036 0 0-18,175 0Ventilation Load 39.18-60,600 0 0 0 16 54,238 0
Sup. Fan Heat 5 16,330
ENGINEERING CKS
HeatingCooling
Ret. Fan Heat 0 0 0 % OA 7.8 7.7
Duct Heat Pkup 0 0 0 1.78 1.78cfm/ft²
0Ov/Undr Sizing
0.00 0 0
0 0 0 0
459.45cfm/ton
Exhaust Heat
-18.40 28,461 0-75
257.49ft²/ton
-21.01 46.60Btu/hr·ft²
51No. People 166,906Grand Total ==> 100.00-154,682-79,353100.00 211,204100.00 342,725 105,251
AREAS HEATING COIL SELECTIONCOOLING COIL SELECTIONTotal Capacity Sens Cap. Coil Airflow Enter DB/WB/HR Leave DB/WB/HR Gross Total Glass Coil Airflow Ent LvgCapacityton MBh MBh cfm °F °F gr/lb °F °F gr/lb ft² (%) °F°FcfmMBh
Floor 7,354 Main Htg -79.4 14 59.4 5,185.9 28.6 342.7 295.7 13,122 83.4 65.9 67.7 59.4 57.5 67.7Main ClgPart 0 Aux Htg 0.0 0.0 0.0 0 0.0 0.0 0.0 0 0.0 0.0 0.0 0.0 0.0 0.0Aux Clg
ExFlr 0-75.2Preheat 54.3 59.4 13,122 0.0 0.0 0.0 0 0.0 0.0 0.0 0.0 0.0 0.0Opt Vent
Roof 7,354 0 0Wall 2,495 998 40
Humidif 0.0 0 0.0 0.0 28.6 342.7TotalOpt Vent 0.0 0.0 0.0 0
-154.5Total
Envelope LoadsSkylite SolarSkylite CondRoof CondGlass SolarGlass/Door CondWall CondPartition/DoorFloor
InfiltrationSub Total ==>
LightsPeopleMisc
Sub Total ==>
Ceiling LoadVentilation Load
Additional Reheat
OA Preheat Diff.
Ov/Undr SizingExhaust Heat
RA Preheat Diff.
Grand Total ==>
Internal Loads
0
0 0
0.00 0.00 0.00
-75
Supply Air Leakage
83
Dehumid. Ov Sizing 0 0
Adj Air Trans Heat 0 0 0 0 0 Adj Air Trans Heat 0 0 0Leakage Ups
Leakage Dwn
0 0Infil
AHU Vent
Nom Vent
Main FanTerminal
Adjacent Floor
Diffuser
Supply Air Leakage
Underflr Sup Ht Pkup Underflr Sup Ht Pkup
Adjacent Floor 0 0 0 0
0 0
0 0 0
0 0
0 0 0 0
0 0.00
0 0.00
13,122
13,122 13,122
0
958
958
0
0
14
14 14
0
1,026
1,026
0
0
0 23,086 0
Int Door 0
Ext Door 0 0 0
TRACE® 700 v6.2.6.5 calculated at 02:42 PM on 12/06/2011Project Name: EMOC
Dataset Name: Alternative - 1 System Checksums Report Page 4 of 6Thesis.trc

System ChecksumsBy ACADEMIC
Bypass VAV with Reheat (30% Min Flow Default)RTU - 2
ACADEMIC
USE ONLY
HEATING COIL PEAKCLG SPACE PEAKCOOLING COIL PEAK TEMPERATURES
Heating DesignMo/Hr:7 / 15Mo/Hr:7 / 16Mo/Hr:Peaked at Time: Cooling Heating
SADBOADB: 17OADB:91 / 76 / 115OADB/WB/HR:Outside Air: 58.0 406.7
Ra Plenum 87.5 55.0
ReturnPercentCoil PeakSpace PeakSpace PercentPercentNetPlenumSpace 87.5 55.0Ret/OASens. + Lat. Of TotalTot SensSpace SensOf TotalSensibleOf TotalTotalSens. + Lat 49.2 88.1
0.0 0.1Fn MtrTDBtu/h (%)Btu/hBtu/h(%)Btu/h(%)Btu/hBtu/h 0.0 0.3Fn BldTDEnvelope Loads 0.0 0.9Fn Frict 0Skylite Solar 0.00 0 0 0 0 0 0 0
0Skylite Cond 0.00 0 0 0 0 0 0 0 0Roof Cond 42.66-133,753 0 0 0 34 226,005 226,005
0.00 29,632Glass Solar 0 0 25 74,680 4 29,632 0 9,414Glass/Door Cond -33,340 10.63-33,340 1 2,761 1 9,414 0
AIRFLOWS
HeatingCooling 24,563Wall Cond 15.66-49,089-37,295 9 28,439 5 31,561 6,998
0Partition/Door 0.00 0 0 0 0 0 0 0Floor 0.00 0 0 0 0 0
Sec Fan 0.70 1,984Infiltration -2,210-2,210 0 646 0 1,984
4,833 405MinStop/Rh
69.65 65,593Sub Total ==> -218,392-72,845 35 106,527 45 298,595 233,002
13,605Return 17,986
Internal Loads
4,342 452Exhaust
66,855Lights 0.00 0 0 22 66,855 13 83,569 16,714
2,542 313Rm Exh
51,936People 0.00 0 9 28,716 8
0 0Auxiliary
50,540Misc 0.00 0 0 17 50,540 8 50,540 0
169,331Sub Total ==> 0.00 0 0 48 146,111 28 186,044 16,714
65,918Ceiling Load 0.000-79,189 17 52,005 0 0-65,918 0Ventilation Load 46.46-145,690 0 0 0 24 157,342 0
Sup. Fan Heat 4 24,820
ENGINEERING CKS
HeatingCooling
Ret. Fan Heat 0 0 0 % OA 15.3 18.4
Duct Heat Pkup 0 0 0 0.97 0.97cfm/ft²
0Ov/Undr Sizing
0.00 0 0
0 0 0 0
292.68cfm/ton
Exhaust Heat
-22.73 71,268-1-6,303
301.90ft²/ton
-18.87 39.75Btu/hr·ft²
114No. People 300,842Grand Total ==> 100.00-313,565-152,034100.00 304,644100.00 660,499 177,495
AREAS HEATING COIL SELECTIONCOOLING COIL SELECTIONTotal Capacity Sens Cap. Coil Airflow Enter DB/WB/HR Leave DB/WB/HR Gross Total Glass Coil Airflow Ent LvgCapacityton MBh MBh cfm °F °F gr/lb °F °F gr/lb ft² (%) °F°FcfmMBh
Floor 16,617 Main Htg -158.1 405 56.7 406.7 55.0 660.5 529.7 16,109 88.1 68.6 73.6 56.7 55.8 65.2Main ClgPart 0 Aux Htg 0.0 0.0 0.0 0 0.0 0.0 0.0 0 0.0 0.0 0.0 0.0 0.0 0.0Aux Clg
ExFlr 0-155.5Preheat 48.0 56.7 16,109 0.0 0.0 0.0 0 0.0 0.0 0.0 0.0 0.0 0.0Opt Vent
Roof 16,501 0 0Wall 3,550 1,232 35
Humidif 0.0 0 0.0 0.0 55.0 660.5TotalOpt Vent 0.0 0.0 0.0 0
-313.6Total
Envelope LoadsSkylite SolarSkylite CondRoof CondGlass SolarGlass/Door CondWall CondPartition/DoorFloor
InfiltrationSub Total ==>
LightsPeopleMisc
Sub Total ==>
Ceiling LoadVentilation Load
Additional Reheat
OA Preheat Diff.
Ov/Undr SizingExhaust Heat
RA Preheat Diff.
Grand Total ==>
Internal Loads
0
-21,676 926
6.91-0.30 0.00
-6,303
Supply Air Leakage
91
Dehumid. Ov Sizing 0 0
Adj Air Trans Heat 0 0 0 0 0 Adj Air Trans Heat 0 0 0Leakage Ups
Leakage Dwn
37 37Infil
AHU Vent
Nom Vent
Main FanTerminal
Adjacent Floor
Diffuser
Supply Air Leakage
Underflr Sup Ht Pkup Underflr Sup Ht Pkup
Adjacent Floor 0 0 0 0
0 0
0 0 0
0 0
0 0 0 0
0 0.00
0 0.00
16,109
16,109 16,109
0
2,956
2,956
0
0
405
405 405
0
2,466
2,466
0
0
0 51,936 0
Int Door 0
Ext Door 0 0 0
TRACE® 700 v6.2.6.5 calculated at 02:42 PM on 12/06/2011Project Name: EMOC
Dataset Name: Alternative - 1 System Checksums Report Page 5 of 6Thesis.trc
System ChecksumsBy ACADEMIC
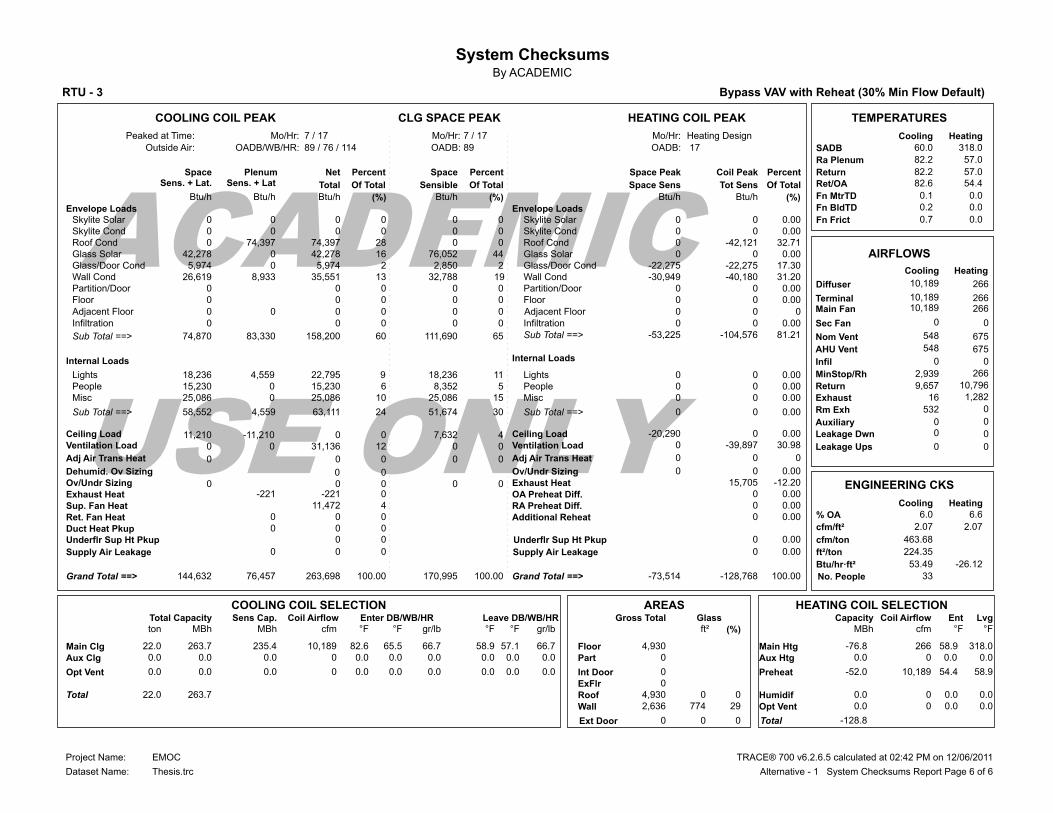
Bypass VAV with Reheat (30% Min Flow Default)RTU - 3
ACADEMIC
USE ONLY
HEATING COIL PEAKCLG SPACE PEAKCOOLING COIL PEAK TEMPERATURES
Heating DesignMo/Hr:7 / 17Mo/Hr:7 / 17Mo/Hr:Peaked at Time: Cooling Heating
SADBOADB: 17OADB:89 / 76 / 114OADB/WB/HR:Outside Air: 60.0 318.0
Ra Plenum 82.2 57.0
ReturnPercentCoil PeakSpace PeakSpace PercentPercentNetPlenumSpace 82.2 57.0Ret/OASens. + Lat. Of TotalTot SensSpace SensOf TotalSensibleOf TotalTotalSens. + Lat 54.4 82.6
0.0 0.1Fn MtrTDBtu/h (%)Btu/hBtu/h(%)Btu/h(%)Btu/hBtu/h 0.0 0.2Fn BldTDEnvelope Loads 0.0 0.7Fn Frict 0Skylite Solar 0.00 0 0 0 0 0 0 0
0Skylite Cond 0.00 0 0 0 0 0 0 0 0Roof Cond 32.71-42,121 0 0 0 28 74,397 74,397
0.00 42,278Glass Solar 0 0 44 76,052 16 42,278 0 5,974Glass/Door Cond -22,275 17.30-22,275 2 2,850 2 5,974 0
AIRFLOWS
HeatingCooling 26,619Wall Cond 31.20-40,180-30,949 19 32,788 13 35,551 8,933
0Partition/Door 0.00 0 0 0 0 0 0 0Floor 0.00 0 0 0 0 0
Sec Fan 0.00 0Infiltration 0 0 0 0 0 0
2,939 266MinStop/Rh
81.21 74,870Sub Total ==> -104,576-53,225 65 111,690 60 158,200 83,330
9,657Return 10,796
Internal Loads
1,282 16Exhaust
18,236Lights 0.00 0 0 11 18,236 9 22,795 4,559
532 0Rm Exh
15,230People 0.00 0 5 8,352 6
0 0Auxiliary
25,086Misc 0.00 0 0 15 25,086 10 25,086 0
58,552Sub Total ==> 0.00 0 0 30 51,674 24 63,111 4,559
11,210Ceiling Load 0.000-20,290 4 7,632 0 0-11,210 0Ventilation Load 30.98-39,897 0 0 0 12 31,136 0
Sup. Fan Heat 4 11,472
ENGINEERING CKS
HeatingCooling
Ret. Fan Heat 0 0 0 % OA 6.6 6.0
Duct Heat Pkup 0 0 0 2.07 2.07cfm/ft²
0Ov/Undr Sizing
0.00 0 0
0 0 0 0
463.68cfm/ton
Exhaust Heat
-12.20 15,705 0-221
224.35ft²/ton
-26.12 53.49Btu/hr·ft²
33No. People 144,632Grand Total ==> 100.00-128,768-73,514100.00 170,995100.00 263,698 76,457
AREAS HEATING COIL SELECTIONCOOLING COIL SELECTIONTotal Capacity Sens Cap. Coil Airflow Enter DB/WB/HR Leave DB/WB/HR Gross Total Glass Coil Airflow Ent LvgCapacityton MBh MBh cfm °F °F gr/lb °F °F gr/lb ft² (%) °F°FcfmMBh
Floor 4,930 Main Htg -76.8 266 58.9 318.0 22.0 263.7 235.4 10,189 82.6 65.5 66.7 58.9 57.1 66.7Main ClgPart 0 Aux Htg 0.0 0.0 0.0 0 0.0 0.0 0.0 0 0.0 0.0 0.0 0.0 0.0 0.0Aux Clg
ExFlr 0-52.0Preheat 54.4 58.9 10,189 0.0 0.0 0.0 0 0.0 0.0 0.0 0.0 0.0 0.0Opt Vent
Roof 4,930 0 0Wall 2,636 774 29
Humidif 0.0 0 0.0 0.0 22.0 263.7TotalOpt Vent 0.0 0.0 0.0 0
-128.8Total
Envelope LoadsSkylite SolarSkylite CondRoof CondGlass SolarGlass/Door CondWall CondPartition/DoorFloor
InfiltrationSub Total ==>
LightsPeopleMisc
Sub Total ==>
Ceiling LoadVentilation Load
Additional Reheat
OA Preheat Diff.
Ov/Undr SizingExhaust Heat
RA Preheat Diff.
Grand Total ==>
Internal Loads
0
0 0
0.00 0.00 0.00
-221
Supply Air Leakage
89
Dehumid. Ov Sizing 0 0
Adj Air Trans Heat 0 0 0 0 0 Adj Air Trans Heat 0 0 0Leakage Ups
Leakage Dwn
0 0Infil
AHU Vent
Nom Vent
Main FanTerminal
Adjacent Floor
Diffuser
Supply Air Leakage
Underflr Sup Ht Pkup Underflr Sup Ht Pkup
Adjacent Floor 0 0 0 0
0 0
0 0 0
0 0
0 0 0 0
0 0.00
0 0.00
10,189
10,189 10,189
0
548
548
0
0
266
266 266
0
675
675
0
0
0 15,230 0
Int Door 0
Ext Door 0 0 0
TRACE® 700 v6.2.6.5 calculated at 02:42 PM on 12/06/2011Project Name: EMOC
Dataset Name: Alternative - 1 System Checksums Report Page 6 of 6Thesis.trc

Montgomery County Equipment Maintenance and Operations Center-Building 1
Technical Report 2 - Building and Plant Energy Analysis
Michael Tellep
Appendix C: See following pages.

MARYLAND GENERAL SERVICE SCHEDULE GS UPDATED DECEMBER 1, 2011 Standard Offer Service (Generation, Transmission including GRT, and PCA) 06/01/11 - 09/30/11 10/01/11 – 05/31/12 06/01/12 – 09/30/12 Generation1 All kwh $ 0.09195 per kwh $ 0.08138 per kwh $ 0.08571 per kwh Procurement Cost Adj. www.pepco.com/md-rates for monthly rate Billing Billing Months of Months of
June – October November – May (Summer) (Winter) Transmission2 All kwh $ 0.00408 per kwh $ 0.00408 per kwh Gross Receipts Tax 2.0408% applied to transmission bill Distribution Service3 Customer Charge $ 9.31 per month $ 9.31 per month All kwh $ 0.03615 per kwh $ 0.01911 per kwh Delivery Tax www.pepco.com/md-rates for monthly rate MD Environmental Surcharge www.pepco.com/md-rates for monthly rate Montgomery County Surc. www.pepco.com/md-rates for monthly rate or Prince Georges County Surc. www.pepco.com/md-rates for monthly rate Universal Service Charge4 See page 28 of Pepco’s MD Electric Rate Schedules Gross Receipts Tax 2.0408% applied to distribution bill excluding the GPC, and the
Montgomery or Prince Georges County Surcharge Administrative Credit www.pepco.com/md-rates for monthly rate Bill Stabilization Credit (BSA)5 www.pepco.com/md-rates for monthly rate EmPower MD Charge6 $ 0.000167 per kwh $ 0.000167 per kwh
1 Effective Usage on and after June 1, 2012 2 Effective Usage on and after August 10, 2011 3 Effective Usage on and after August 19, 2010 4 Effective March 1, 2005 5 Effective Billing Month of November, 2007 6 Effective Billing Month of March 2010
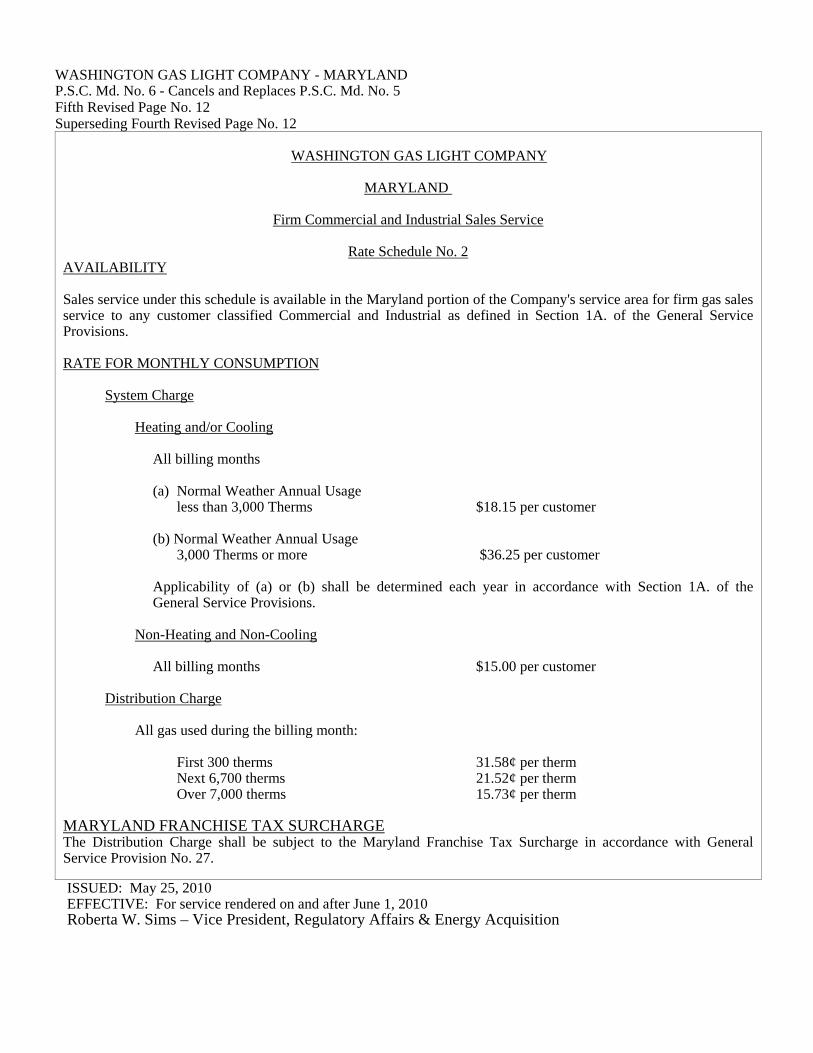
WASHINGTON GAS LIGHT COMPANY - MARYLAND P.S.C. Md. No. 6 - Cancels and Replaces P.S.C. Md. No. 5 Fifth Revised Page No. 12 Superseding Fourth Revised Page No. 12
WASHINGTON GAS LIGHT COMPANY
MARYLAND
Firm Commercial and Industrial Sales Service
Rate Schedule No. 2
AVAILABILITY Sales service under this schedule is available in the Maryland portion of the Company's service area for firm gas sales service to any customer classified Commercial and Industrial as defined in Section 1A. of the General Service Provisions. RATE FOR MONTHLY CONSUMPTION
System Charge
Heating and/or Cooling
All billing months
(a) Normal Weather Annual Usage less than 3,000 Therms $18.15 per customer
(b) Normal Weather Annual Usage
3,000 Therms or more $36.25 per customer
Applicability of (a) or (b) shall be determined each year in accordance with Section 1A. of the General Service Provisions.
Non-Heating and Non-Cooling
All billing months $15.00 per customer
Distribution Charge
All gas used during the billing month:
First 300 therms 31.58¢ per therm Next 6,700 therms 21.52¢ per therm Over 7,000 therms 15.73¢ per therm
MARYLAND FRANCHISE TAX SURCHARGE The Distribution Charge shall be subject to the Maryland Franchise Tax Surcharge in accordance with General Service Provision No. 27.
ISSUED: May 25, 2010 EFFECTIVE: For service rendered on and after June 1, 2010 Roberta W. Sims – Vice President, Regulatory Affairs & Energy Acquisition

WASHINGTON GAS LIGHT COMPANY - MARYLAND P.S.C. Md. No. 6 - Cancels and Replaces P.S.C. Md. No. 5 First Revised Page No. 13 Superseding Original Page No. 13
Firm Commercial and Industrial Sales Service - Rate Schedule No. 2 (Continued)
Purchased Gas Charge The Purchased Gas Charge per therm shall be computed in accordance with Section 16 of the General ServiceProvisions and applies to all gas used during the billing month. REVENUE NORMALIZATION ADJUSTMENT The Distribution Charge shall be subject to the Revenue Normalization Adjustment (RNA) in accordance with General Service Provision No. 30. MINIMUM MONTHLY BILL The minimum monthly bill for sales service shall be the System Charge. LATE PAYMENT CHARGE All bills are due and payable when rendered and the charges stated apply when the bills are paid within twenty days after date of rendition. If bills are not paid within twenty days after rendition, a late payment charge will be added equal to one and one-half percent of the unpaid bill and at the end of the first nominal thirty-day billing interval after that, an additional charge of one and one-half percent of any portion of the original amount which remains unpaid, and at the end of the second thirty-day nominal billing interval, an additional charge will be made equal to 2 percent of any portion of the original amount which remains unpaid at that time; however, the total of such charges shall not exceed 5%. FIRM CREDIT ADJUSTMENT The charges for sales service specified in this schedule shall be subject to the Firm Credit Adjustment (FCA) in accordance with General Service Provision No. 20. GAS SUPPLY REALIGNMENT ADJUSTMENT The distribution charge shall be subject to the Gas Supply Realignment Adjustment (GSRA) in accordance with General Service Provision No. 26. SPECIAL PROVISION – UNMETERED GAS FOR LIGHTING A. Unmetered gas sales service is available under this schedule for outdoor gas lights installed on the
Company's side (upstream) of the meter on or before September 29, 1999, provided:
1. The lights conform with the Company's General Service Provisions; and,
2. The posts and lamps are owned by and installed and maintained at the expense of the customer or property owner.
ISSUED: September 1, 2005 EFFECTIVE: For meter readings on and after October 1, 2005 Adrian P. Chapman - Vice President, Regulatory Affairs & Energy Acquisition

WASHINGTON GAS LIGHT COMPANY - MARYLAND P.S.C. Md. No. 6 - Cancels and Replaces P.S.C. Md. No. 5 Original Page No. 14
Firm Commercial and Industrial Sales Service - Rate Schedule No. 2 (Continued) SPECIAL PROVISION – UNMETERED FOR GAS LIGHTING (Continued) B. The monthly gas consumption of the light or lights used in each installation shall be determined by
multiplying the aggregate rated hourly input capacity of the light(s) by 730 hours, adjusted to reflect hours of use if applicable, and converting the product (rounded to the nearest 100 cubic feet) to therms.
C. Where the customer does not use metered gas for other purposes under this schedule, unmetered gas used
for lighting shall be billed at the rates contained herein. But where the customer also uses metered gas under this schedule, the unmetered gas used for lighting shall be added to the metered usage and the total usage billed at the rates contained herein.
CHARGE FOR TEMPORARY DISCONTINUANCE OF SERVICE Whenever sales service under this rate schedule has been temporarily discontinued at the request of the customer, a charge equal to the System Charge times the number of months of discontinued service will be made for reestablishing such service. GROSS RECEIPTS TAX SURCHARGE Amounts billed to customers shall include a surcharge to reflect any increase or decrease in the effective gross receipts tax rate from the effective gross receipts tax rate in effect at the time the sales agreement became effective for service. The surcharge factor shall be computed as follows where R represents the decimal equivalent of the changed rate and E represents the existing gross receipts tax rate.
Surcharge Factor = (R – E) / (1 – R)
Such surcharge factor or any subsequently revised factor shall become effective along with the billing of revenues to which the changed gross receipts tax rate first applies. The amount of such charge shall be shown separately on bills rendered to customers. GENERAL SERVICE PROVISIONS Except as otherwise specifically provided herein, the application of this schedule is subject to the General Service Provisions of the Company as they may be in effect from time to time, and as filed with the Public Service Commission.
ISSUED: September 27, 2002 EFFECTIVE: For meter readings on and after September 30, 2002 Adrian P. Chapman - Vice President, Regulatory Affairs & Energy Acquisition