techno-economic optimal design of solid oxide fuel cell...
TRANSCRIPT

1
tacatidepctbimfieb
btpcocefl
psf
J
Downlo
Robert J. BraunDivision of Engineering,
Colorado School of Mines,Golden, CO 80401
Techno-Economic Optimal Designof Solid Oxide Fuel Cell Systemsfor Micro-Combined Heat andPower Applications in the U.S.A techno-economic optimization study investigating optimal design and operating strat-egies of solid oxide fuel cell (SOFC) micro-combined heat and power (CHP) systems forapplication in U.S. residential dwellings is carried out through modeling and simulationof various anode-supported planar SOFC-based system configurations. Five differentSOFC system designs operating from either methane or hydrogen fuels are evaluated interms of their energetic and economic performances and their overall suitability formeeting residential thermal-to-electric ratios. Life-cycle cost models are developed andemployed to generate optimization objective functions, which are utilized to explore thesensitivity of the life-cycle costs to various system designs and economic parameters andto select optimal system configurations and operating parameters for eventual applica-tion in single-family, detached residential homes in the U.S. The study compares theresults against a baseline SOFC-CHP system that employs primarily external steamreforming of methane. The results of the study indicate that system configurations andoperating parameter selections that enable minimum life-cycle cost while achievingmaximum CHP-system efficiency are possible. Life-cycle cost reductions of over 30% andCHP efficiency improvements of nearly 20% from the baseline system are detailed.�DOI: 10.1115/1.3211099�
Keywords: techno-economic, optimization, SOFC, micro-CHP, residential, energy sys-tems design, combined heat and power, distributed generation, systems’ analysis
IntroductionThe accelerating development activity of solid oxide fuel cell
echnology has sparked interest in numerous power generationpplications. The residential energy sector is one potential appli-ation for SOFCs and is responsible for nearly 22% of the totalnnual energy consumption in the U.S. �1� with over two-thirds ofhat energy consumption being used for low-efficiency space heat-ng, domestic hot water, and air-conditioning �2�. While the resi-ential sector has substantial room for improvements in energyfficiency, it is also one of the most challenging markets to com-ete in. Despite the efficiency advantages of high temperature fuelell systems for onsite combined heat and power �CHP� genera-ion, the application requirements of low maintenance, high dura-ility �or lifetime�, low cost, and high efficiency are severe. Thencreasing understanding of SOFC technology cost and perfor-
ance enables a timely study of assessing optimal system con-gurations, parameter selection, and identification of key techno-conomic parameters that will influence the success of SOFC-ased micro-CHP systems in residential applications.
Fuel cell system performance characteristics are largely driveny cell-stack design parameters such as cell voltage, fuel utiliza-ion, operating temperature, and cathode gas temperature rise. De-ending on where the fuel cell-stack is operated on its voltage-urrent characteristic, different proportions of electric and thermalutputs will be derived from the fuel cell system. Selection of fuelell design parameters may either maximize power density orlectric efficiency. The system design operating point strongly in-uences the capital costs of the major system hardware compo-
Manuscript received February 15, 2009; final manuscript received June 1, 2009;ublished online March 16, 2010. Review conducted by Ken Reifsnider. Paper pre-ented at the 6th International Fuel Cell Science Engineering and Technology Con-
erence �FUELCELL2008�, Denver, CO, June 16–18, 2008.ournal of Fuel Cell Science and TechnologyCopyright © 20
aded 16 May 2010 to 138.67.129.2. Redistribution subject to ASME
nents, such as the SOFC stack, air blower, air preheater, and heatrecovery equipment, and the operating costs, which are primarilyassociated with fuel consumption �or efficiency�. The importanceof techno-economic analyses, which utilize life-cycle costing, isthe ability to quantify benefits of CHP operation and optimize asystem design by judiciously taking into account the competingobjectives of capital and operating cost minimization subject tothe application constraints.
The objectives of the present work are to �1� quantitativelyidentify optimal SOFC system configurations for residential appli-cations; �2� given an optimal configuration, select preferred oper-ating parameters for the SOFC that minimize the life-cycle cost ofthe system; �3� quantify the importance of on-site cogeneration;and �4� establish the sensitivity of SOFC system cost-effectiveness to various economic parameters toward developingan understanding of the economic viability of SOFCs in the U.S.residential energy sector. Given the cost and complexity of stand-alone power systems, this analysis focuses on fuel cell systems forgrid-connected, medium-sized ��200 m2� single-family detacheddwellings with access to pipeline natural gas. The analysis doesnot include potential environmental or economic benefits associ-ated with emission reductions below that of conventional utility-supplied power and heat technologies. The study also employsU.S. national average utility energy pricing rather than focusingon a single geographic region or utility provider.
The body of work on residential-scale fuel cell-based micro-CHP systems is increasing, and much effort to date has proceededassuming a single fuel cell system configuration. Previous workon techno-economic modeling and analysis of residential-scalefuel cell systems has focused largely on PEM-based systems�3–5�. Gunes and Ellis �4� presented an evaluation of a 4 kilowattproton exchange membrane �PEM� fuel cell system with com-
bined heat and power serving a residence. Their analysis focusedJUNE 2010, Vol. 7 / 031018-110 by ASME
license or copyright; see http://www.asme.org/terms/Terms_Use.cfm
oewcmTeatsapSdmescKaspgtataos
2
cTdSfatips
awtsrape
ehclaArsswcompte1
0
Downlo
n an evaluation of grid-independent, fuel cell systems in terms ofnergetic, economic, and environmental variables. The studyorked from a specific design and performance of the PEM fuel
ell system. Khandkar et al. �6� developed a techno-economicodel for a simple SOFC electric-only system at the 25 kW scale.his work generated design performance maps that measured theffect of capital cost and cost-of-electricity for variations in oper-ting cell voltage and fuel utilization. Baratto et al. �7,8� examinedhe potential benefits of SOFC systems at the residential powercale but aimed toward truck auxiliary power unit applicationsnd evaluated primarily in terms of a life-cycle assessment view-oint. Hawkes and co-workers �9,10� performed studies on micro-OFC-CHP systems for residential dwellings in the United King-om. In Ref. �9�, their work focused on techno-economicodeling of a SOFC stack and power conditioning system for
nergy cost minimization. The model accounted for the SOFCtack, power conditioning, and supplemental boiler and was exer-ised to optimize operating and application strategies for Unitedingdom residential loads, not system design. In Ref. �10�, the
uthors explored the optimal size of a SOFC system and its sen-itivity to changes in economic parameters such as net meteringlans, fuel price, and component lifetimes. This study assumed aiven simple SOFC-CHP system configuration and parameter set-ings. In an analogous manner, Alanne et al. �11� performed anssessment of micro-CHP residential systems using SOFCs forwo different Canadian cities. Given a SOFC system configurationnd operating characteristic, estimations regarding the sensitivityf SOFC economic sizing and competitiveness via payback analy-es were made.
Methodology and ApproachComponent and system models were developed that incorporate
ost functions, which scale with both size and production volume.he detailed SOFC and balance-of-plant �BOP� models have beeniscussed elsewhere �12,13� and will only be briefly highlighted inec. 2.1. The basic approach is the integration of component costunctions with system models that predict SOFC-CHP energeticnd economic performances. Of particular interest is the estima-ion of life-cycle costs that are influenced by first costs �capital,nstallation, etc.�, operation and maintenance, fuel consumption,roduction volumes, system power rating, and by the choices ofystem configuration and SOFC operating parameters.
A comprehensive parametric optimization is carried out throughvariation of system configurations and operating parameters,hereby optima are identified by the minimization or maximiza-
ion of different life-cycle cost metrics. The optima are con-trained by variable boundaries established from knowledge ofesidential application thermal and electrical energy requirementsnd practical SOFC operating parameters, such as operating tem-erature, voltage, fuel utilization, and fuel cell durability consid-rations.
A significant issue surrounding the use of fuel cells �and theirfficiency� in residential applications is their ability to meet theighly noncoincident electric and thermal loads in either grid-onnected or stand-alone configurations. That is, in either baseoad operation or electric load-following conditions, electricitynd/or heat may be available when it is not needed or vice-versa.
key application parameter is the residential thermal-to-electricatio �TER�. The TER is the ratio of the thermal energy load orystem output to the electrical demand. A TER may be based onpace heating, space cooling, or domestic hot water demandsithin a residence, and its magnitude is highly dependent on lo-
ation, building type, design, usage patterns, time of day, and timef year. The following design studies consider SOFC-basedicro-CHP systems that produce TERs in the range 0.7–1.0 to be
referred for integration with residential domestic hot water sys-ems �14�. The annual hourly averaged residential electric load isstimated at 1.0 kW, and the average domestic hot water load at
.1 kW. Actual residential electricity demand can reach peak val-31018-2 / Vol. 7, JUNE 2010
aded 16 May 2010 to 138.67.129.2. Redistribution subject to ASME
ues of 9 kW or more over shorter time intervals �e.g., 15 minperiods�. The grid-connected system approach in this study as-sumes that dynamic loads are handled by the utility thereby en-abling a focus on steady-state design and analysis of the fuel cellsystem. The fuel cell operating mode is considered to be base-loaded at a nominal power level near the annual hourly average of1.0 kW. Given the hourly average electrical load, the prototypicalresidence used herein consumes 8760 kWh of electrical energyper year. The techno-economic model only employs averagehourly loads and assumes an electric capacity factor of 90% forthe fuel cell to account for both maintenance downtime and theinability of the SOFC to serve a large fraction of the dynamicloads. Details on techno-economic modeling are provided in Sec.2.2.
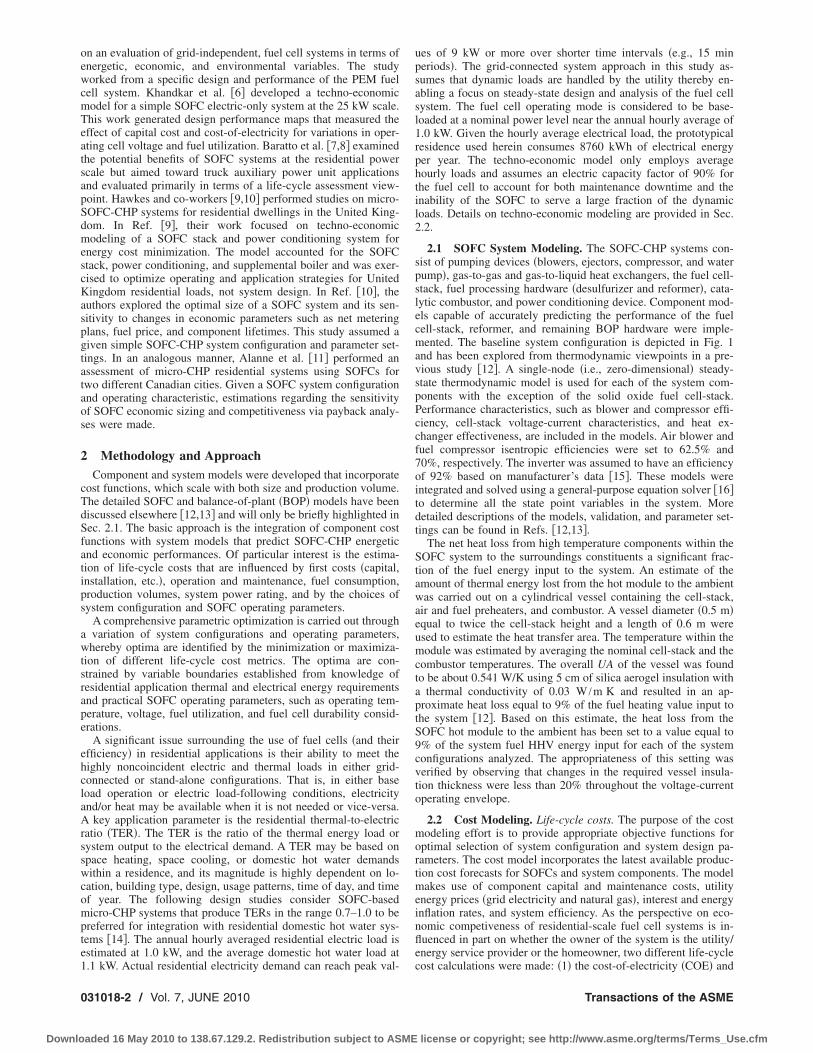
2.1 SOFC System Modeling. The SOFC-CHP systems con-sist of pumping devices �blowers, ejectors, compressor, and waterpump�, gas-to-gas and gas-to-liquid heat exchangers, the fuel cell-stack, fuel processing hardware �desulfurizer and reformer�, cata-lytic combustor, and power conditioning device. Component mod-els capable of accurately predicting the performance of the fuelcell-stack, reformer, and remaining BOP hardware were imple-mented. The baseline system configuration is depicted in Fig. 1and has been explored from thermodynamic viewpoints in a pre-vious study �12�. A single-node �i.e., zero-dimensional� steady-state thermodynamic model is used for each of the system com-ponents with the exception of the solid oxide fuel cell-stack.Performance characteristics, such as blower and compressor effi-ciency, cell-stack voltage-current characteristics, and heat ex-changer effectiveness, are included in the models. Air blower andfuel compressor isentropic efficiencies were set to 62.5% and70%, respectively. The inverter was assumed to have an efficiencyof 92% based on manufacturer’s data �15�. These models wereintegrated and solved using a general-purpose equation solver �16�to determine all the state point variables in the system. Moredetailed descriptions of the models, validation, and parameter set-tings can be found in Refs. �12,13�.
The net heat loss from high temperature components within theSOFC system to the surroundings constituents a significant frac-tion of the fuel energy input to the system. An estimate of theamount of thermal energy lost from the hot module to the ambientwas carried out on a cylindrical vessel containing the cell-stack,air and fuel preheaters, and combustor. A vessel diameter �0.5 m�equal to twice the cell-stack height and a length of 0.6 m wereused to estimate the heat transfer area. The temperature within themodule was estimated by averaging the nominal cell-stack and thecombustor temperatures. The overall UA of the vessel was foundto be about 0.541 W/K using 5 cm of silica aerogel insulation witha thermal conductivity of 0.03 W /m K and resulted in an ap-proximate heat loss equal to 9% of the fuel heating value input tothe system �12�. Based on this estimate, the heat loss from theSOFC hot module to the ambient has been set to a value equal to9% of the system fuel HHV energy input for each of the systemconfigurations analyzed. The appropriateness of this setting wasverified by observing that changes in the required vessel insula-tion thickness were less than 20% throughout the voltage-currentoperating envelope.
2.2 Cost Modeling. Life-cycle costs. The purpose of the costmodeling effort is to provide appropriate objective functions foroptimal selection of system configuration and system design pa-rameters. The cost model incorporates the latest available produc-tion cost forecasts for SOFCs and system components. The modelmakes use of component capital and maintenance costs, utilityenergy prices �grid electricity and natural gas�, interest and energyinflation rates, and system efficiency. As the perspective on eco-nomic competiveness of residential-scale fuel cell systems is in-fluenced in part on whether the owner of the system is the utility/energy service provider or the homeowner, two different life-cycle
cost calculations were made: �1� the cost-of-electricity �COE� andTransactions of the ASME
license or copyright; see http://www.asme.org/terms/Terms_Use.cfm

�mv
U
wtftsinfcsca
waiabletp
J
Downlo
2� the life-cycle savings �LCS�. Both COE and LCS functionsay be based on either electric-only or CHP-systems where the
alue of the waste heat is accounted for.In an electric-only application, the COE �expressed in
S $/kWh� is written as
�1�
here the first term in Eq. �1� is associated with the capital costs,he second term with maintenance costs, and the final term withuel costs. In Eq. �1�, RF is the capital recovery factor, Csys,eo ishe unit fuel cell system installed capital cost for electric-onlyystems in $/kW, CFe is the system electric capacity factor, Aplants the expected annual plant availability, MCj is the levelized an-ual maintenance cost of component j in $/kWh, Fc is the unituel cost in $/therm, �sys,e is the fuel cell system electric effi-iency �higher heating value basis�, and k1 and k2 are unit conver-ion constants. The levelized annual maintenance cost for eachomponent j was estimated by determining the present worth ofll replacement costs over the life of the power plant as follows:
MCj =
RFCj� �1 + iinfl�n1
�1 + i�n1+
�1 + iinfl�n2
�1 + i�n2+ ¯�
CFe · Aplant · 8760�2�
here the numerator in Eq. �2� represents the present worth ofnnual payments for the replacement cost of component j replacedn years n1 ,n2 , . . . utilizing an equipment cost inflation rate iinflnd an interest rate i. Levelized maintenance costs were estimatedy amortizing each of the expected service requirements over theife of the system. The SOFC stacks are assumed to have an op-rational life of 5 years �40,000 h� with a salvage value of 10% ofhe original investment. These considerations translate into a re-
Fig. 1 Process flowsheet of methane-fueled SO
lacement of the entire fuel cell-stack two times during the 15
ournal of Fuel Cell Science and Technology
aded 16 May 2010 to 138.67.129.2. Redistribution subject to ASME
year plant life. The catalysts in the steam reformer and combustorare assumed to be replaced every 5 years �40,000 h� and thedesulfurizer sorbent bed is replaced annually.
In a CHP-system, the net cost-of-electricity must be offset bythe amount of thermal energy recovered and utilized for eitherspace or hot water heating. Ellis and Gunes �17� showed the COEfor the CHP case to be determined by
�3�
where Csys,CHP is the unit fuel cell system installed cost for co-generation systems in $/kW, Cmaint,CHP is the maintenance cost, �H
is the heating or thermal energy recovery efficiency, Fth is thefraction of thermal energy from the fuel cell system that can beused, �htg is the efficiency of the heating system that is displacedby the exported thermal energy from the fuel cell system, and k1
and k2 are unit conversion constants. CFe is defined as the kWh ofelectricity produced divided by the product of the rated capacityof the system and 8760 h/year. The product of Fth and �H is thenet thermal energy conversion efficiency and is equivalent to��CHP−�sys,e�, where �CHP is the system cogeneration efficiency.Transmission and distribution costs do not factor into the cost-of-electricity for on-site power generation. Employing a levelizedmaintenance cost and a heating capacity factor that accounts forsituations where the heat that is available from the fuel cell system
-CHP system with external reforming „Case 2a…
FCis not utilized, Eq. �3� is rewritten as
JUNE 2010, Vol. 7 / 031018-3
license or copyright; see http://www.asme.org/terms/Terms_Use.cfm

wf
I
shi1
tvT
lBtel=�c
wts
ciFpcrocadmianctipbsstc
wad
0
Downlo
�4�
here CFh is the annual average CHP-system heating capacityactor defined here as
CFh =QHR
Qload,avg· CFe · Aplant �5�
n Eq. �5�, QHR is the amount of heat recovered from the fuel cell
ystem at design conditions in kilowatt and Qload,avg is the averageourly residential thermal load �in this case, domestic hot water�n kilowatt. On an annual basis, the value of CFh must be less than.
The life-cycle savings are computed from the difference be-ween life-cycle cost estimates of the utility/energy provider ser-ices and the life-cycle costs of a solid oxide fuel cell system.hat is,
LCSSOFC = LCCutility − LCCSOFC �6�
The individual life-cycle cost terms �e.g., LCCSOFC� are calcu-ated by adapting the P1− P2 method presented by Duffie andeckman �18� for the case of grid-connected fuel cell power sys-
ems that may not supply 100% of the electricity and/or thermalnergy requirements of a residence. In the P1− P2 method, theife-cycle cost is considered to be the sum of two terms �LCCP1F+ P2C� that are proportional to the first year operating cost
F� and to the installed capital costs �C� of the system. The life-ycle cost of a SOFC power system is determined from
LCCSOFC,j = P1�FSOFC,j + Futility,ngas� + P2Csys,jWsys,net
+ P3Futility,elec�1 − CFeAplant� �7�
here the subscript j refers to either an electric-only or a CHPype system, FSOFC is the annual fuel cost to operate the SOFCystem, Futility,ngas is the annual natural gas fuel cost the utility
harges to serve the thermal energy demand in the home, Wsys,nets the rated power capacity of the SOFC system, andutility,elec�1−CFeAplant� is the net grid electricity cost to deliverower to the home that is not met by the fuel cell system. Theonstants P1 and P3 are present worth factors that depend prima-ily on the number of years that the equipment is expected toperate, the inflation rate for expenses related to operation �typi-ally the rate at which the cost of the fuel or electricity inflates�,nd the market discount rate. The constant of proportionality P2epends on many economic parameters, including the down pay-ent on the first costs �capital and installation�, the mortgage
nterest rate, the market discount rate, the term of the economicnalysis, the salvage value of the equipment at the end of eco-omic analysis period, and other economic factors related to firstosts such as tax credits, property tax, maintenance, and deprecia-ion. It is also important to note that the life-cycle cost employedn this analysis does not include any benefit of selling fuel cell-roduced electricity back to the grid via a net metering plan. Suchenefits are not cost-effective for the combined heat and powerystem owner when the total electricity produced exceeds the con-umption over a billing cycle due to utility buyback rates that areypically lower than the cost of the natural gas supplied to the fuelell system �19,20�.
In a conventional system, residential electrical energy and hotater demands are typically served with a gas-fired water heater
nd grid-supplied electricity. The life-cycle costs of the utility are
etermined from the relation31018-4 / Vol. 7, JUNE 2010
aded 16 May 2010 to 138.67.129.2. Redistribution subject to ASME
LCCutility = P1Futility,ngas + P3Futility,elec �8�
The annual energy costs �F� in Eqs. �7� and �8� are calculatedfrom
FSOFC,j =8760k2FCWsys,netCFeAplant
�sys,e�9�
Futility,ngas =8760k2FC�Qload,avg − QHRCFeAplant�
�htg�10�
Futility,elec = 8760Eelec,avgPelec �11�
where in Eq. �10� the product term QHRCFeAplant is zero for the
LCCutility calculation, and Eelec,avg in Eq. �11� is the annual hourlyaverage electric load in kW and Pelec is the annual average elec-tricity price in $/kWh.
Hydrogen fuel cost is estimated at $3.30 /kg H2 per a U.S. De-partment of Energy study �21�. The cost of hydrogen was basedon steam methane reforming of natural gas with pressure swingadsorption and a national average industrial natural gas price of$0.0113/kWh. Residential natural gas prices for powering themicro-CHP SOFC system vary significantly with geographic lo-cation, and the base case is established at $1.00/therm or$0.03412/kWh. The utility price for electricity also varies signifi-cantly across the U.S. and the national average of $0.104/kWh in2006 �22� was employed for the base case. The sensitivity of theresults to variations in utility pricing is explored in this study.
Capital equipment costing. Component capital costs are depen-dent on both the production volume and capacity �or size� of thehardware. In order to test the sensitivity of the life-cycle costs tothese variables, the cost model equations were formulated to beinclusive of both the economy of production and economy ofscale. The basic formulation for estimating the cost of componenti at production volume V is given as
Ci,V = Ci,Vref
ref · � V
Vprodref k
· � S
Sirefy
�12�
where Ci,Vref
ref is the reference cost for component i at some refer-
ence production volume Vprodref and known equipment size Si
ref, andk and y are volume production and equipment size scaling param-eters, respectively. The value of k has been assumed to be thesame for all components in the system and was estimated at�0.1365 using data regression of system cost estimates byMugerwa and Blomen �23� for different manufacturing volumesof molten carbonate and phosphoric acid fuel cell systems.
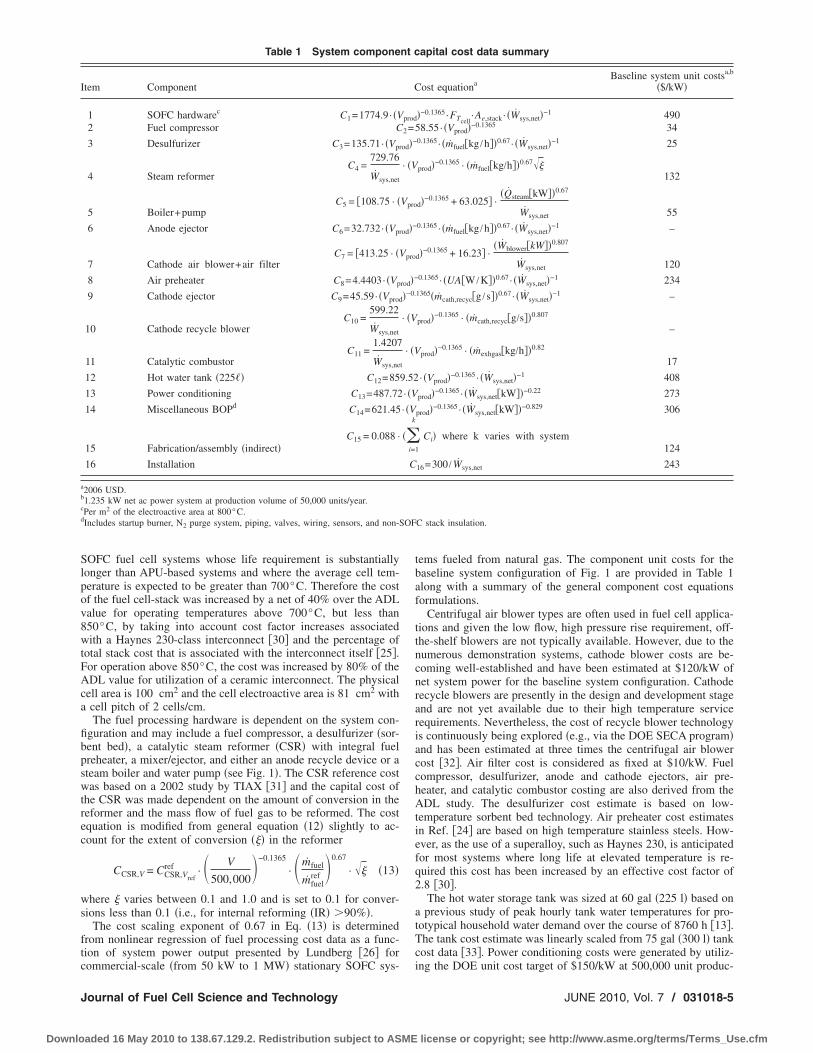
The bulk of the component costing is derived from studies byArthur D. Little �ADL� �24� and Thijssen �25� on 5 kW SOFC-based auxiliary power units �APUs�. Others have also presentedcost studies �26–29� for fuel cell systems; however, the 2001 ADLand 2007 Thijssen studies remain as the most comprehensive forplanar SOFC power systems at this scale. The SOFC stack manu-facturing costs utilized herein are based on anode-supported pla-nar cells with metallic interconnects. The reference unit cell de-sign is comprised of a Ni/Zr cermet anode �700 �m thick�, anyttria-stabilized zirconia �YSZ� electrolyte �10 �m�, a strontium-doped lanthanum manganite �LSM� cathode �50 �m�, and a me-tallic interconnect. The interconnect material is dependent on thecell operating temperature and is either a high temperature stain-less steel ��700°C�, a superalloy metal �700–900°C�, or a LaChromite ceramic ��900°C�. The area specific cost of the com-plete cell-stack module consisting of repeat unit cells �electrode-electrolyte-interconnect assembly� and balance of stack compo-nents �compression, seals, manifolds, etc.� was estimated at about$472 /m2 for production volumes of 500,000 stacks/year �24�.However, this cost is based on stainless steel interconnect materi-
als, which is not considered sufficiently robust for stationaryTransactions of the ASME
license or copyright; see http://www.asme.org/terms/Terms_Use.cfm
Slpov8wtFAca
fibpswtrec
ws
ftc
I
a
b
c
d
J
Downlo
OFC fuel cell systems whose life requirement is substantiallyonger than APU-based systems and where the average cell tem-erature is expected to be greater than 700°C. Therefore the costf the fuel cell-stack was increased by a net of 40% over the ADLalue for operating temperatures above 700°C, but less than50°C, by taking into account cost factor increases associatedith a Haynes 230-class interconnect �30� and the percentage of
otal stack cost that is associated with the interconnect itself �25�.or operation above 850°C, the cost was increased by 80% of theDL value for utilization of a ceramic interconnect. The physical
ell area is 100 cm2 and the cell electroactive area is 81 cm2 withcell pitch of 2 cells/cm.The fuel processing hardware is dependent on the system con-
guration and may include a fuel compressor, a desulfurizer �sor-ent bed�, a catalytic steam reformer �CSR� with integral fuelreheater, a mixer/ejector, and either an anode recycle device or ateam boiler and water pump �see Fig. 1�. The CSR reference costas based on a 2002 study by TIAX �31� and the capital cost of
he CSR was made dependent on the amount of conversion in theeformer and the mass flow of fuel gas to be reformed. The costquation is modified from general equation �12� slightly to ac-ount for the extent of conversion ��� in the reformer
CCSR,V = CCSR,Vref
ref · � V
500,000−0.1365
· � mfuel
mfuelref 0.67
· � �13�
here � varies between 0.1 and 1.0 and is set to 0.1 for conver-ions less than 0.1 �i.e., for internal reforming �IR� �90%�.
The cost scaling exponent of 0.67 in Eq. �13� is determinedrom nonlinear regression of fuel processing cost data as a func-ion of system power output presented by Lundberg �26� for
Table 1 System compone
tem Component
1 SOFC hardwarec C1=1774.9· �V2 Fuel compressor C
3 Desulfurizer C3=135.71· �Vp
4 Steam reformerC4 =
729.76
Wsys,net
5 Boiler+pumpC5 = �108.75 · �
6 Anode ejector C6=32.732· �Vp
7 Cathode air blower+air filterC7 = �413.25 · �
8 Air preheater C8=4.4403· �Vp
9 Cathode ejector C9=45.59· �Vprod
10 Cathode recycle blowerC10 =
599.22
Wsys,net
11 Catalytic combustorC11 =
1.4207
Wsys,ne
12 Hot water tank �225�� C12=85
13 Power conditioning C13=487.72
14 Miscellaneous BOPd C14=621.45
15 Fabrication/assembly �indirect�C15 = 0.088 ·
16 Installation
2006 USD.1.235 kW net ac power system at production volume of 50,000 units/year.Per m2 of the electroactive area at 800°C.Includes startup burner, N2 purge system, piping, valves, wiring, sensors, and non-
ommercial-scale �from 50 kW to 1 MW� stationary SOFC sys-
ournal of Fuel Cell Science and Technology
aded 16 May 2010 to 138.67.129.2. Redistribution subject to ASME
tems fueled from natural gas. The component unit costs for thebaseline system configuration of Fig. 1 are provided in Table 1along with a summary of the general component cost equationsformulations.
Centrifugal air blower types are often used in fuel cell applica-tions and given the low flow, high pressure rise requirement, off-the-shelf blowers are not typically available. However, due to thenumerous demonstration systems, cathode blower costs are be-coming well-established and have been estimated at $120/kW ofnet system power for the baseline system configuration. Cathoderecycle blowers are presently in the design and development stageand are not yet available due to their high temperature servicerequirements. Nevertheless, the cost of recycle blower technologyis continuously being explored �e.g., via the DOE SECA program�and has been estimated at three times the centrifugal air blowercost �32�. Air filter cost is considered as fixed at $10/kW. Fuelcompressor, desulfurizer, anode and cathode ejectors, air pre-heater, and catalytic combustor costing are also derived from theADL study. The desulfurizer cost estimate is based on low-temperature sorbent bed technology. Air preheater cost estimatesin Ref. �24� are based on high temperature stainless steels. How-ever, as the use of a superalloy, such as Haynes 230, is anticipatedfor most systems where long life at elevated temperature is re-quired this cost has been increased by an effective cost factor of2.8 �30�.
The hot water storage tank was sized at 60 gal �225 l� based ona previous study of peak hourly tank water temperatures for pro-totypical household water demand over the course of 8760 h �13�.The tank cost estimate was linearly scaled from 75 gal �300 l� tankcost data �33�. Power conditioning costs were generated by utiliz-
apital cost data summary
ost equationaBaseline system unit costsa,b
�$/kW�
�−0.1365 ·FTcell·Ae,stack · �Wsys,net�−1 490
58.55· �Vprod�−0.1365 340.1365 · �mfuel�kg /h��0.67 · �Wsys,net�−1 25
prod�−0.1365 · �mfuel�kg/h��0.67�132
d�−0.1365 + 63.025� ·�Qsteam�kW��0.67
Wsys,net 550.1365 · �mfuel�kg /h��0.67 · �Wsys,net�−1 –
d�−0.1365 + 16.23� ·�Wblower�kW��0.807
Wsys,net 1200.1365 · �UA�W /K��0.67 · �Wsys,net�−1 234
1365�mcath,recyc�g /s��0.67 · �Wsys,net�−1 –
prod�−0.1365 · �mcath,recyc�g/s��0.807
–
prod�−0.1365 · �mexhgas�kg/h��0.82
17
· �Vprod�−0.1365 · �Wsys,net�−1 408
prod�−0.1365 · �Wsys,net�kW��−0.22 273
prod�−0.1365 · �Wsys,net�kW��−0.829 306
1
Ci� where k varies with system124
16=300 /Wsys,net 243
C stack insulation.
nt c
C
prod
2=
rod�−
· �V
Vpro
rod�−
Vpro
rod�−
�−0.
· �V
t
· �V
9.52
· �V· �V
��i=
k
C
SOF
ing the DOE unit cost target of $150/kW at 500,000 unit produc-
JUNE 2010, Vol. 7 / 031018-5
license or copyright; see http://www.asme.org/terms/Terms_Use.cfm
tlblc
e
Tfac
ttchaNmoccdat
liutiua0
su
w
sSwf
cWimai
0
Downlo
ion volumes and scaling down to 50,000 units/year productionevels. Miscellaneous balance-of-plant and fabrication and assem-ly cost estimates were taken from the ADL study �24� and instal-ation costs were assumed fixed at $300 ��25% of system capitalost� and do not include grid-connection fees.
The total capital cost of the system is determined by summingach of the component contributions
Csys,total = �1
N
Cj �14�
he capital cost model estimates a system unit cost of $2268/kWor the CHP-system with hot water production shown in Fig. 1,nd a cost of $1860/kW for an electric-only version �no heat re-overy hardware� of the baseline system configuration.
Cost model benchmarking. Significant uncertainty exists in es-imating equipment and system costs, especially for small capaci-ies as required for residential-scale systems. Factors, such asomponent size and availability, raw material price volatility,ardware technology status, purchase volumes, and service lifend temperature requirements will affect hardware cost estimates.evertheless, system cost estimates that take into account econo-ies of scale and production can be made to within about �30%
f the actual system cost. Despite the large uncertainties in systemost estimates, the utility of this type of analysis lies in the relativehanges in capital and operating costs due to changes in systemesign configurations, operating parameters, and application oper-ting strategies. Uncertainty in the relative economic change be-ween system configurations is estimated at 5–10%.
Cost predictions for the SOFC system were compared againstiterature data and found to be within 5–10%. For SOFC systemsn the 3–10 kW-class, DOE SECA teams have reported systemnit capital costs ranging from $741/kW to $774/kW for produc-ion volumes of 50,000 units/year �34,35�. These units do notnclude ac inverters and heat recovery hardware. The cost modeltilized in this study predicts a system capital cost of $815/kW forcomparable 5 kW SOFC system operating at a power density of.4 W /cm2.
2.3 Performance Definitions. SOFC cell-stack efficiency, netystem electric efficiency, and system cogeneration efficiencysed throughout the present work are defined as
�SOFC =Wdc
�nfuel,in · HHVfuel�anode
inlet
�15�
�sys,e =Wac,net
�nfuel,in · HHVfuel�system
inlet
�16�
�CHP =Wac,net + QHR
�nfuel,in · HHVfuel�system
inlet
�17�
here Wdc is the stack dc power developed, Wac,net is the net
ystem ac power, QHR is the amount of thermal energy from theOFC system exhaust gas converted to low-grade �60°C� hotater, nfuel,in is the molar system fuel flow rate, and HHVfuel is the
uel higher heating value.The in-cell fuel utilization refers to the amount of fuel electro-
hemically oxidized in the anode compartment of the cell-stack.hen anode gas recycle �AGR� is used, the system fuel utilization
s evaluated at the system fuel input boundary and is different inagnitude than the in-cell utilization. Both utilizations are defined
s follows where nj refers to the molar flow rate of the species of
nterest:31018-6 / Vol. 7, JUNE 2010
aded 16 May 2010 to 138.67.129.2. Redistribution subject to ASME
Uf ,cell =�nH2,consumed�
�4nCH4+ nH2
+ nCO�anode
inlet
, Uf ,sys =�nH2,consumed�
�4nCH4�system
feed
�18�The amount of stoichiometric air for hydrogen- and methane-
fueled systems is calculated using the following respective rela-tions:
air�CH4=
nO2,sys
2nCH4,sys
, air�H2=
2nO2,sys
nH2,sys
�19�
where the molar flow rates in Eq. �19� are taken at the system feedto the plant. The total airflow to the system is significantly greaterthan the stoichiometric requirements and is determined via energybalances that include the magnitude of the cell polarizations, theamount of internal reforming, and the allowable air temperaturerise in the cathode.
3 Optimization Study of SOFC-CHP SystemConfigurations
The integrated thermo-economic system models are used in aparametric optimization study to �1� identify a residential-scaleSOFC-CHP system concept that offers the lowest life-cycle costs,�2� select optimal SOFC operating parameters for the identifiedsystem configuration, and �3� evaluate life-cycle cost sensitivitiesto a variation in economic parameters. The system configurationsinvestigated focus on concepts related to reactant gas processingvia external and internal reformings of methane �natural gas�, aswell as anode and cathode gas recirculations. The impact of fueltype �hydrogen versus natural gas� on system life-cycle cost isalso examined.
Five different system configurations are explored and are de-noted as follows: Case �1� hydrogen-fueled, Case �2� methane-fueled with waste heat boiler, Case �3� methane-fueled with cath-ode gas recycle �CGR� and waste heat boiler, Case �4� methane-fueled with AGR, and Case �5� integration of CGR, AGR, and IRconcepts. The analyses are carried out for a system that producesa fixed net ac power output of 1.235 kW when operating a SOFCstack at a nominal temperature of 800°C, an average cell voltageof 0.7 V/cell, a design cathode air temperature rise, Tair, of100°C, and a system fuel utilization of 85%. The SOFC poweroutput was selected so that a system annual average electric ca-pacity factor of 90% could be obtained over the 5 year life of theSOFC stack.
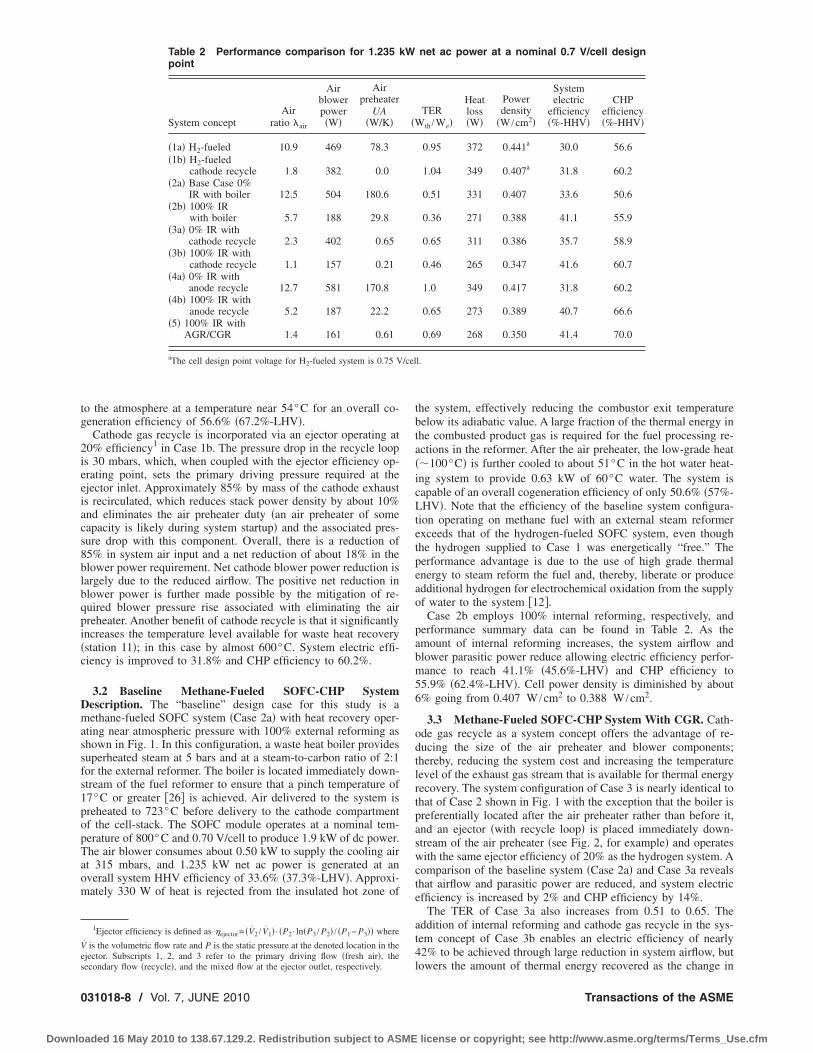
Detailed energetic and technical performance evaluations of thesystem configurations in Cases 1–5 have been reported previously�12�. They are briefly reviewed here for the case of a specified netpower of 1.235 kW to complement the subsequent life-cycle costdiscussion. A process and performance description for hydrogen-fueled systems �Case 1� is first presented followed by themethane-fueled system configurations beginning with the baselinesystem �Case 2a�. Process flowsheets are provided in Figs. 1–3,and a summary of key performance parameters is given in Table2.
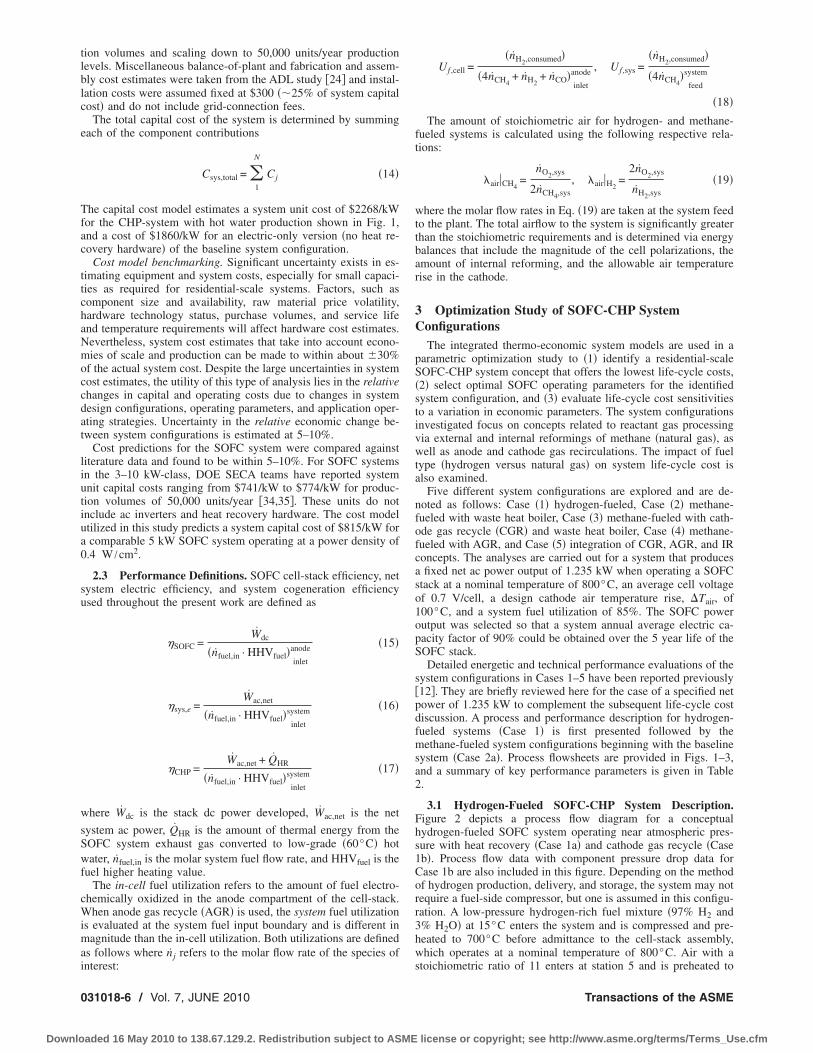
3.1 Hydrogen-Fueled SOFC-CHP System Description.Figure 2 depicts a process flow diagram for a conceptualhydrogen-fueled SOFC system operating near atmospheric pres-sure with heat recovery �Case 1a� and cathode gas recycle �Case1b�. Process flow data with component pressure drop data forCase 1b are also included in this figure. Depending on the methodof hydrogen production, delivery, and storage, the system may notrequire a fuel-side compressor, but one is assumed in this configu-ration. A low-pressure hydrogen-rich fuel mixture �97% H2 and3% H2O� at 15°C enters the system and is compressed and pre-heated to 700°C before admittance to the cell-stack assembly,which operates at a nominal temperature of 800°C. Air with a
stoichiometric ratio of 11 enters at station 5 and is preheated toTransactions of the ASME
license or copyright; see http://www.asme.org/terms/Terms_Use.cfm

7s0tfaoc
J
Downlo
31°C before delivery to the cathode compartment of the cell-tack. The SOFC module contains a 41-cell stack operating at.75 V/cell that produces 1.78 kW of dc power, which is invertedo ac. After parasitic power consumption by the air blower anduel compressor, 1.235 kW net ac is generated by the system forn overall HHV efficiency of 30.0% �35.5%-LHV�. Depleted an-de gas products exit the stack and catalytically combust usingathode exhaust to obtain a temperature of 841°C. The product
Fig. 2 Process flowsheet of hydrogen-fueled SO
Fig. 3 Process flowsheet of CH4-fueled SOFC-CHP sy
ournal of Fuel Cell Science and Technology
aded 16 May 2010 to 138.67.129.2. Redistribution subject to ASME
gas stream is cooled to just above 169°C by reactant preheatduties. The remaining thermal energy content of the product gas isused to heat water from a temperature of 15°C to less than 60°Cin a heat recovery heat exchanger that functionally serves as awater preheat tank. Approximately 1.2 kW of low-grade heat inthe form of domestic hot water could be recovered from the prod-uct gas. However, given that the average domestic hot water loadis 1.1 kW, only this amount can be utilized. The system exhausts
-CHP system „Case 1a… and with CGR „Case 1b…
FCstem with IR and tail gas recycle „Cases 4b and 5…
JUNE 2010, Vol. 7 / 031018-7
license or copyright; see http://www.asme.org/terms/Terms_Use.cfm
tg
2ieeiacs8blbqpi�c
Dmassfs1popTaom
Ves
0
Downlo
o the atmosphere at a temperature near 54°C for an overall co-eneration efficiency of 56.6% �67.2%-LHV�.
Cathode gas recycle is incorporated via an ejector operating at0% efficiency1 in Case 1b. The pressure drop in the recycle loops 30 mbars, which, when coupled with the ejector efficiency op-rating point, sets the primary driving pressure required at thejector inlet. Approximately 85% by mass of the cathode exhausts recirculated, which reduces stack power density by about 10%nd eliminates the air preheater duty �an air preheater of someapacity is likely during system startup� and the associated pres-ure drop with this component. Overall, there is a reduction of5% in system air input and a net reduction of about 18% in thelower power requirement. Net cathode blower power reduction isargely due to the reduced airflow. The positive net reduction inlower power is further made possible by the mitigation of re-uired blower pressure rise associated with eliminating the airreheater. Another benefit of cathode recycle is that it significantlyncreases the temperature level available for waste heat recoverystation 11�; in this case by almost 600°C. System electric effi-iency is improved to 31.8% and CHP efficiency to 60.2%.
3.2 Baseline Methane-Fueled SOFC-CHP Systemescription. The “baseline” design case for this study is aethane-fueled SOFC system �Case 2a� with heat recovery oper-
ting near atmospheric pressure with 100% external reforming ashown in Fig. 1. In this configuration, a waste heat boiler providesuperheated steam at 5 bars and at a steam-to-carbon ratio of 2:1or the external reformer. The boiler is located immediately down-tream of the fuel reformer to ensure that a pinch temperature of7°C or greater �26� is achieved. Air delivered to the system isreheated to 723°C before delivery to the cathode compartmentf the cell-stack. The SOFC module operates at a nominal tem-erature of 800°C and 0.70 V/cell to produce 1.9 kW of dc power.he air blower consumes about 0.50 kW to supply the cooling airt 315 mbars, and 1.235 kW net ac power is generated at anverall system HHV efficiency of 33.6% �37.3%-LHV�. Approxi-ately 330 W of heat is rejected from the insulated hot zone of
1Ejector efficiency is defined as �ejector= �V2 / V1� · �P2 · ln�P3 / P2� / �P1− P3�� where˙ is the volumetric flow rate and P is the static pressure at the denoted location in thejector. Subscripts 1, 2, and 3 refer to the primary driving flow �fresh air�, the
Table 2 Performance comparison for 1.235point
System conceptAir
ratio air
Airblowerpower�W�
Airpreheater
UA�W/K�
�1a� H2-fueled 10.9 469 78.3�1b� H2-fueled
cathode recycle 1.8 382 0.0�2a� Base Case 0%
IR with boiler 12.5 504 180.6�2b� 100% IR
with boiler 5.7 188 29.8�3a� 0% IR with
cathode recycle 2.3 402 0.65�3b� 100% IR with
cathode recycle 1.1 157 0.21�4a� 0% IR with
anode recycle 12.7 581 170.8�4b� 100% IR with
anode recycle 5.2 187 22.2�5� 100% IR with
AGR/CGR 1.4 161 0.61
aThe cell design point voltage for H2-fueled system is 0.75 V
econdary flow �recycle�, and the mixed flow at the ejector outlet, respectively.
31018-8 / Vol. 7, JUNE 2010
aded 16 May 2010 to 138.67.129.2. Redistribution subject to ASME
the system, effectively reducing the combustor exit temperaturebelow its adiabatic value. A large fraction of the thermal energy inthe combusted product gas is required for the fuel processing re-actions in the reformer. After the air preheater, the low-grade heat��100°C� is further cooled to about 51°C in the hot water heat-ing system to provide 0.63 kW of 60°C water. The system iscapable of an overall cogeneration efficiency of only 50.6% �57%-LHV�. Note that the efficiency of the baseline system configura-tion operating on methane fuel with an external steam reformerexceeds that of the hydrogen-fueled SOFC system, even thoughthe hydrogen supplied to Case 1 was energetically “free.” Theperformance advantage is due to the use of high grade thermalenergy to steam reform the fuel and, thereby, liberate or produceadditional hydrogen for electrochemical oxidation from the supplyof water to the system �12�.
Case 2b employs 100% internal reforming, respectively, andperformance summary data can be found in Table 2. As theamount of internal reforming increases, the system airflow andblower parasitic power reduce allowing electric efficiency perfor-mance to reach 41.1% �45.6%-LHV� and CHP efficiency to55.9% �62.4%-LHV�. Cell power density is diminished by about6% going from 0.407 W /cm2 to 0.388 W /cm2.
3.3 Methane-Fueled SOFC-CHP System With CGR. Cath-ode gas recycle as a system concept offers the advantage of re-ducing the size of the air preheater and blower components;thereby, reducing the system cost and increasing the temperaturelevel of the exhaust gas stream that is available for thermal energyrecovery. The system configuration of Case 3 is nearly identical tothat of Case 2 shown in Fig. 1 with the exception that the boiler ispreferentially located after the air preheater rather than before it,and an ejector �with recycle loop� is placed immediately down-stream of the air preheater �see Fig. 2, for example� and operateswith the same ejector efficiency of 20% as the hydrogen system. Acomparison of the baseline system �Case 2a� and Case 3a revealsthat airflow and parasitic power are reduced, and system electricefficiency is increased by 2% and CHP efficiency by 14%.
The TER of Case 3a also increases from 0.51 to 0.65. Theaddition of internal reforming and cathode gas recycle in the sys-tem concept of Case 3b enables an electric efficiency of nearly42% to be achieved through large reduction in system airflow, but
net ac power at a nominal 0.7 V/cell design
TERth /We�
Heatloss�W�
Powerdensity
�W /cm2�
Systemelectric
efficiency�%-HHV�
CHPefficiency�%-HHV�
0.95 372 0.441a 30.0 56.6
1.04 349 0.407a 31.8 60.2
0.51 331 0.407 33.6 50.6
0.36 271 0.388 41.1 55.9
0.65 311 0.386 35.7 58.9
0.46 265 0.347 41.6 60.7
1.0 349 0.417 31.8 60.2
0.65 273 0.389 40.7 66.6
0.69 268 0.350 41.4 70.0
l.
kW
�W
/cel
lowers the amount of thermal energy recovered as the change in
Transactions of the ASME
license or copyright; see http://www.asme.org/terms/Terms_Use.cfm

Taaood
coo6tapp
RpcciTeawegtgwC
CitemhciLls
ateagop3cFtrcmccdh
frco
J
Downlo
ER from 0.65 to 0.21 shows. The increase in electric efficiencylso results in a system heat loss of only 265 W—a reduction ofbout 20% from the baseline system. The combined effects ofxygen dilution on the cathode side and 100% internal reformingn the anode side of the SOFC serve to reduce cell-stack powerensity by almost 20% from the baseline system configuration.
Case 4b combines 100% internal reforming with anode gas re-ycle and improves the system electric efficiency by nearly 9%ver Case 4a and the CHP efficiency is raised to 66.6% as a resultf the reduced cooling airflow and associated parasitic power. A8% reduction in the required cooling airflow is obtained by vir-ue of adding internal reforming into the system operation; theirflow reduction also reduces the system TER by 35%. Detailedrocess flowsheet parameters for Case 4b system configuration arerovided in Fig. 3.
3.4 Methane-Fueled SOFC-CHP System With Internaleforming and Cathode and Anode Gas Recycles. Case 5 de-icted in Fig. 3 was the final system configuration studied andombines internal reforming, anode recycle �62% by mass�, andathode recycle �77% by mass�. Significant system simplifications achieved with the incorporation of these system concepts, andable 2 shows that at 1.235 kW net power output, an electricfficiency of 41.4% �45.9%-LHV�, a CHP efficiency of 70.0%,nd a TER of 0.69 are achieved. System heat loss from the hard-are hot zone is minimized to less than 270 W. The combined
ffects of internal reforming and recycle of depleted electrodeases result in a lower SOFC stack power density �0.35 W /cm2�han Cases 2 and 4. However, the use of anode gas recycle miti-ates the reduction in stack power density normally associatedith internal reforming operation as evidenced in a comparison ofases 2a and 2b.
3.5 Establishing an Optimal SOFC-CHP Systemonfiguration. The analysis of the various system configurations
ndicates that systems incorporating internal reforming providehe highest electric efficiency, while those also utilizing SOFCxhaust gas recycle increase the system TER to improve theatch with residential domestic hot water requirements in U.S.
ouseholds. While energetic performance analysis of the systemonfigurations given in Cases 1–5 is insightful, by itself, it isnsufficient in distinguishing between preferred system designs.ife-cycle cost estimation is far more revealing in terms of estab-
ishing optimal configurations and identifying key parameterensitivities.
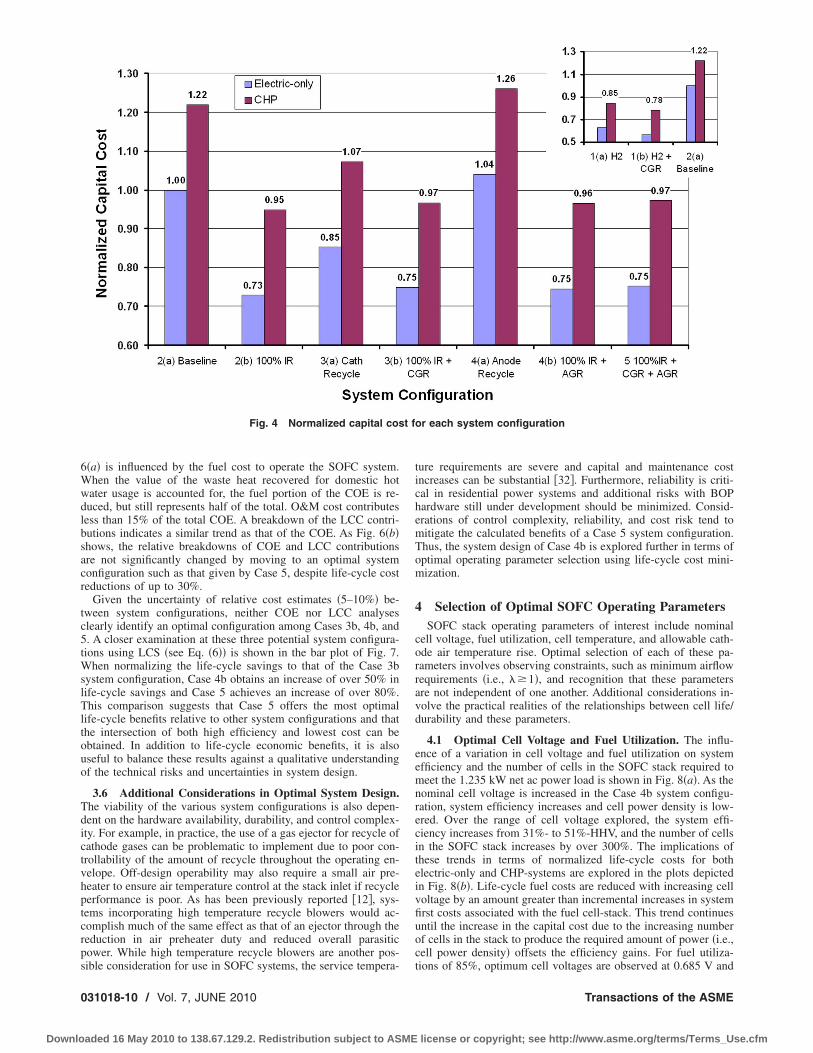
Although the cost-of-electricity as given in Eqs. �1� and �4�mortizes the capital and maintenance costs of the power genera-or over its life, the metric is more representative of the equivalentlectricity price to be charged over a specified period of time, suchs winter or summer season. In contrast, the life-cycle costs asiven by Eqs. �6�–�8� estimate the net present worth of capital andperating costs over the life of the system. Reference economicarameters utilized in the cost estimation are summarized in Table, and the normalized capital cost, cost-of-electricity, and life-ycle costs for each of the system configurations are plotted inigs. 4 and 5. Figure 4 shows that internal reforming-based sys-
ems offer the lowest capital cost, and the addition of waste heatecovery hardware and control can add over 20% to the capitalost. Hydrogen-fueled systems are lower in capital cost �by asuch as 45%� as expected given the reduced number of system
omponents �see inset of Fig. 4�. This plot also shows that capitalost comparisons are not particularly revealing in terms of systemifferentiation as the internal reforming Cases 2b, 3b, 4b, and 5ave similar expected costs.
The normalized cost-of-electricity plot of Fig. 5�a� reveals thatrom a third party owner perspective, systems with anode gasecycle and internal reforming offer the lowest CHP-based COEompared with the baseline configuration. Interestingly, the value
f the recovered heat varies for each system and is found to beournal of Fuel Cell Science and Technology
aded 16 May 2010 to 138.67.129.2. Redistribution subject to ASME
negative2 in cases involving internal reforming without anode gasrecycle �Cases 2b and 3b�. In these cases, the increase in systemcapital and maintenance cost cannot be successfully overcome bythe gain in CHP efficiency. The value of the waste heat rangesfrom –$0.005/kWh to $0.035/kWh. In contrast, due to the highfuel cost of hydrogen, systems utilizing hydrogen as a fuel �Case1� experience COEs that are up to 80% higher than the baselineelectric-only system. The COE penalty for hydrogen-fueledSOFC-CHP systems is only 10–20% above the baseline CHP caseconfiguration. However, it should be noted that this result is due inpart to the fact that the CHP-based COE estimate assumes thathydrogen also fuels the domestic hot water heater. Clearly conclu-sions drawn from cost comparisons between hydrogen-fueled andmethane-fueled systems are suspect as the relative fuel costs foreither system are highly uncertain and depend on projections thatmay be decades in the future. Nevertheless, were hydrogen-basedsystems to be installed in the near future with access to fuel de-livery at prices targeted by DOE ��$3.30 /kgH2
�, sizable energycost increases over natural gas would be expected withoutincentives.
The plots of normalized life-cycle costs of the various systemconfigurations in Fig. 5�b� demonstrate a very similar trend as theplot for COE. One prime difference between these two metrics isthat LCC analysis shows that CHP-systems offer reduced costsfrom electric-only systems in all cases. This advantage arises fromthe offset fuel costs that are realized as a result of on-site cogen-eration. As with COE-based analysis, systems incorporating bothanode recycle and internal reforming offer the lowest life-cyclecost due to efficiency improvements and first cost reductions. Ingeneral, life-cycle costs are up to 30% lower for CHP-systemsthan electric-only based configurations due to the value of thewaste heat recovery that offsets utility gas consumption.
Breakdowns of the contributions of fuel, operation and mainte-nance �O&M�, and capital to the total COE and LCC objectivefunctions are shown in Fig. 6. For life-cycle costs, the O&M costsare estimated as a function of the first costs of the system and areincluded in the capital cost segment of the bar plot. Additionally,since these cost analyses are for grid-connected systems, someamount of electricity and fuel is purchased from the utility to meetthe total energy demand of the residence. These contributions areonly relevant for the LCC function and are denoted by “U. Elec-tric” and “U.Fuel.” The portion of the life-cycle cost used to sup-ply fuel to the fuel cell system is denoted as “FC Fuel.” Over halfof the cost-of-electricity for the baseline case as shown in Fig.
2
Table 3 Summary of technical and economic parameters em-ployed in analysis
Parameter Value
Production volume �units/year� 50,000Natural gas price �$/therm� 1.0Electricity price �$/kWh� 0.104Electric capacity factor �%� 90Plant availability �%� 99.5Electric price inflation rate, iinfl �%� 2.2Natural gas price inflation rate, iinfl �%� 5.0Equipment price inflation rate, ig,infl �%� 2.59SOFC stack life �year� 5SOFC salvage value at the end-of-life �%� 10Average hourly domestic hot water load �kWth� 1.1Average hourly electric load �kW� 1.0Conventional hot water heater efficiency �%-HHV� 60Fuel cell design power �kW� 1.235SOFC nominal voltage �V/cell� 0.70SOFC fuel utilization �%� 85SOFC nominal cell temperature �°C� 800
The value of heat is estimated as the difference between COEeo−COECHP.
JUNE 2010, Vol. 7 / 031018-9
license or copyright; see http://www.asme.org/terms/Terms_Use.cfm
6Wwdlbsacr
tc5tWslTltouo
Tdictvhptcrps
t f
0
Downlo
�a� is influenced by the fuel cost to operate the SOFC system.hen the value of the waste heat recovered for domestic hotater usage is accounted for, the fuel portion of the COE is re-uced, but still represents half of the total. O&M cost contributesess than 15% of the total COE. A breakdown of the LCC contri-utions indicates a similar trend as that of the COE. As Fig. 6�b�hows, the relative breakdowns of COE and LCC contributionsre not significantly changed by moving to an optimal systemonfiguration such as that given by Case 5, despite life-cycle costeductions of up to 30%.
Given the uncertainty of relative cost estimates �5–10%� be-ween system configurations, neither COE nor LCC analyseslearly identify an optimal configuration among Cases 3b, 4b, and. A closer examination at these three potential system configura-ions using LCS �see Eq. �6�� is shown in the bar plot of Fig. 7.
hen normalizing the life-cycle savings to that of the Case 3bystem configuration, Case 4b obtains an increase of over 50% inife-cycle savings and Case 5 achieves an increase of over 80%.his comparison suggests that Case 5 offers the most optimal
ife-cycle benefits relative to other system configurations and thathe intersection of both high efficiency and lowest cost can bebtained. In addition to life-cycle economic benefits, it is alsoseful to balance these results against a qualitative understandingf the technical risks and uncertainties in system design.
3.6 Additional Considerations in Optimal System Design.he viability of the various system configurations is also depen-ent on the hardware availability, durability, and control complex-ty. For example, in practice, the use of a gas ejector for recycle ofathode gases can be problematic to implement due to poor con-rollability of the amount of recycle throughout the operating en-elope. Off-design operability may also require a small air pre-eater to ensure air temperature control at the stack inlet if recycleerformance is poor. As has been previously reported �12�, sys-ems incorporating high temperature recycle blowers would ac-omplish much of the same effect as that of an ejector through theeduction in air preheater duty and reduced overall parasiticower. While high temperature recycle blowers are another pos-
Fig. 4 Normalized capital cos
ible consideration for use in SOFC systems, the service tempera-
31018-10 / Vol. 7, JUNE 2010
aded 16 May 2010 to 138.67.129.2. Redistribution subject to ASME
ture requirements are severe and capital and maintenance costincreases can be substantial �32�. Furthermore, reliability is criti-cal in residential power systems and additional risks with BOPhardware still under development should be minimized. Consid-erations of control complexity, reliability, and cost risk tend tomitigate the calculated benefits of a Case 5 system configuration.Thus, the system design of Case 4b is explored further in terms ofoptimal operating parameter selection using life-cycle cost mini-mization.
4 Selection of Optimal SOFC Operating ParametersSOFC stack operating parameters of interest include nominal
cell voltage, fuel utilization, cell temperature, and allowable cath-ode air temperature rise. Optimal selection of each of these pa-rameters involves observing constraints, such as minimum airflowrequirements �i.e., �1�, and recognition that these parametersare not independent of one another. Additional considerations in-volve the practical realities of the relationships between cell life/durability and these parameters.
4.1 Optimal Cell Voltage and Fuel Utilization. The influ-ence of a variation in cell voltage and fuel utilization on systemefficiency and the number of cells in the SOFC stack required tomeet the 1.235 kW net ac power load is shown in Fig. 8�a�. As thenominal cell voltage is increased in the Case 4b system configu-ration, system efficiency increases and cell power density is low-ered. Over the range of cell voltage explored, the system effi-ciency increases from 31%- to 51%-HHV, and the number of cellsin the SOFC stack increases by over 300%. The implications ofthese trends in terms of normalized life-cycle costs for bothelectric-only and CHP-systems are explored in the plots depictedin Fig. 8�b�. Life-cycle fuel costs are reduced with increasing cellvoltage by an amount greater than incremental increases in systemfirst costs associated with the fuel cell-stack. This trend continuesuntil the increase in the capital cost due to the increasing numberof cells in the stack to produce the required amount of power �i.e.,cell power density� offsets the efficiency gains. For fuel utiliza-
or each system configuration
tions of 85%, optimum cell voltages are observed at 0.685 V and
Transactions of the ASME
license or copyright; see http://www.asme.org/terms/Terms_Use.cfm

08ltia�cdhtrdugtav
J
Downlo
.76 V for CHP and electric-only systems, respectively. As Fig.�b� shows, The CHP-configuration demonstrates a 1–12% lowerife-cycle cost depending on selection of cell voltage. When sys-em fuel utilization is decreased from 85% to 75%, life-cycle costsncrease throughout the voltage range for the electric-only system,s lowering fuel utilization not only increases cell power densityreduces capital cost� but also reduces system efficiency. In thease of CHP-configurations, the reduction in electric efficiencyue to lower fuel utilization can be offset by the increase in wasteeat recovery so that a fuel utilization of 75% ultimately yieldshe lowest LCC at a cell voltage of 0.75 V. Simultaneous explo-ation of the cell voltage and fuel utilization parameter space in-icates that a global optimum is likely at 0.75 V and 75% fueltilization for the Case 4b system operating with the settingsiven in Table 3. For systems intended for electric-only applica-ions, the minimum LCC favors higher design point cell voltagend higher fuel utilizations, while a balance is struck between
Fig. 5 Normalized cost-of-electricity and life-cycle cost formalized LCC
oltage and fuel utilization for CHP-systems.
ournal of Fuel Cell Science and Technology
aded 16 May 2010 to 138.67.129.2. Redistribution subject to ASME
4.2 Optimal Cell Temperature and Air Temperature Rise.Increasing cell operating temperature reduces the cell polariza-tions and results in improved efficiency performance as Fig. 9�a�shows. The cost model incorporates the change in SOFC stack andair recuperator material requirements as operating temperature isaltered up or down from its nominal value of 800°C and the cellmodel responds to changes in cell resistance due to changes inoperating temperature. Figure 9�a� illustrates that as the nominalcell operating temperature is increased from 700°C to 850°C, thenormalized LCC is decreased by as much as 10%. This figure alsoshows the sensitivity of LCC to changes in cell voltage and tem-perature. When the operating voltage is increased from its base-line value of 0.7 V/cell to 0.75 V/cell at a given temperature, theLCC is reduced. This characteristic is largely due to the benefitsof reduced fuel costs from increased operating efficiency. Further-more, capital cost increases with higher operating temperature can
ch system configuration: „a… normalized COE and „b… nor-
eabe mitigated or even reduced as second order effects such as re-
JUNE 2010, Vol. 7 / 031018-11
license or copyright; see http://www.asme.org/terms/Terms_Use.cfm

dcrde
Fc
Fc
0
Downlo
uced airflow, and, therefore, reduced air preheater duty and costompensate for higher SOFC capital costs. However, Fig. 9�a�eveals that the benefits of selecting a higher design cell voltageiminish with increasing operating temperature as gains in cellfficiency and airflow reduction are nonlinear and are ultimately
ig. 6 Breakdown of life-cycle cost contributions: „a… Case 2aost breakdown and „b… Case 5 cost breakdown
ig. 7 Normalized life-cycle savings versus systemonfiguration
Fig. 8 The effect of cell voltage on normalized
efficiency and number of cells in SOFC stack, and „b…31018-12 / Vol. 7, JUNE 2010
aded 16 May 2010 to 138.67.129.2. Redistribution subject to ASME
bounded by the minimum system airflow requirements.The variation of life-cycle costs is also analyzed for changes in
design air temperature rise across the cathode. This analysis as-sumes that it is possible to achieve acceptable levels of thermallyinduced internal cell stresses due to the increased cell temperaturegradient via stack and/or cell design strategy. The plots in Fig.9�b� are generated by maintaining the nominal cell operating tem-perature at 800°C, but altering the allowable cathode air tempera-ture rise across the cell. An increase in cell temperature rise from75°C to 200°C reduces the LCC metric by 4% for a nominal 0.7V/cell condition and by less than 2% for a 0.75 V/cell operatingpoint. It is further observed that the use of 100% internal reform-ing and operation at higher cell voltages leads to LCC optimaconstrained by minimum airflow requirements. Figure 9 showsthat, in general, the opportunity to reduce LCC of the systemdesign is greater for increases in cell operating temperature thanfor increasing the allowable air temperature rise.
4.3 Global Optima. Locating the minimum CHP LCC forCase 4b system configuration involved a comprehensive paramet-ric analysis that constrained optima to system airflows with stoi-chiometric ratios of at least 1.4 �i.e., �1.4�. This value of excessair is somewhat arbitrary but is intended to provide design margin,allowing for changes in airflow requirements as the cell-stackvoltage decays over its life. Parametric optimization over the pa-rameter space of 0.6 V/cell to 0.8 V/cell, 69% to 92% fuel utili-zation, 700°C to 850°C cell temperature, and 75°C to 200°C airtemperature rise reveals several LCC optima within less than 2%of each other. The global minimum was found at 0.7 V/cell,0.75Uf, 850°C cell temperature, and 175°C cathode air tempera-ture rise. At these operating conditions, the system LCC �=0.673� is reduced by about 33% below the baseline system con-figuration value. System electric efficiency performance is about40% and CHP efficiency is 69% at these SOFC parameter set-tings, and the required cell power density is 0.42 W /cm2 with aminimized stoichiometric airflow of =1.4. The analysis resultssuggest that the optima are driven toward solutions that maximizecell temperature and air temperature rise, minimize cell voltageand fuel utilization, and approach or reside at the constraint ofminimum airflow. Within a given material temperature range,maximizing cell temperature achieves increases in system effi-ciency, cell power density, and a decrease in SOFC capital cost.Increasing the cathode air temperature rise lowers BOP capitalcost and increases system efficiency through reductions in airblower parasitic power, but in increments that are smaller thanthose gained by elevation of cell temperature. Reduction in cellvoltage and, hence, system efficiency �see Fig. 8�b�� can be over-come by increases in cell temperature and allowable air tempera-ture rise. These observations indicate that the optimal values ofLCC are achieved by maximizing system efficiency and minimiz-
C, system efficiency, and stack size: „a… system
LC normalized LCCTransactions of the ASME
license or copyright; see http://www.asme.org/terms/Terms_Use.cfm

ipo
etdS1ohTaltrem
5S
sd
de
J
Downlo
ng the number of cells in the stack �the highest capital cost com-onent� until parameter constraints in cell temperature, Tcathode,r air are reached.
Practical considerations in selection of SOFC design param-ters are heavily influenced by cell life and durability. Raising cellemperatures and lowering design voltages �increasing currentensity� generally reduce cell life �36�. Furthermore, a 40,000 hOFC stack with an average voltage degradation rate of 0.5%/000 h will decay on the order of 160 mV/cell from beginning-f-life to end-of-life. Thus, end-of-life current densities must beigher to satisfy the same power demand at the beginning-of-life.he systems-level perspective must account for the increased re-ctant flows at the end-of-life and this may ultimately provideittle leeway in the selection of cell voltage. For the purposes ofhis analysis, it is insightful to quantify the benefits without suchestrictions by assuming that cell voltage parameter exploration isssentially one of the median cell voltage design conditions �i.e.,iddle-of-life performance�.
Additional Considerations for Optimal Design ofOFCs in Residential ApplicationsA comparison of the normalized life-cycle costs for all of the
ystem configurations given in Table 2 with a conventional resi-ential energy system that supplies heat and power by a natural
Fig. 9 The effect of cell temperature and air tempversus cell temperature and „b… LCC versus catho
Fig. 10 Comparison of SOFC-CHP and
ournal of Fuel Cell Science and Technology
aded 16 May 2010 to 138.67.129.2. Redistribution subject to ASME
gas-fired water heater and utility grid power, respectively, is pre-sented in Fig. 10. The LCCs are normalized to the conventionalsystem for production volumes of 50,000 units/year, and the re-sults show that only the optimized SOFC-CHP system achieveslife-cycle costs lower than the conventional system at the�1.2 kW scale. As the figure illustrates, residential SOFC sys-tems can be cost competitive in a business-as-usual economic en-vironment only when the system design is properly optimized. Itis also important to recognize that these results employ nationalaverage utility pricing, and, therefore, the economic viability ofSOFC-CHP systems at this scale has a geographic dependence.The techno-economic optimal system design is influenced by theeconomies of production and scale. The sensitivity of the systemLCC and LCS to these variables is explored next.
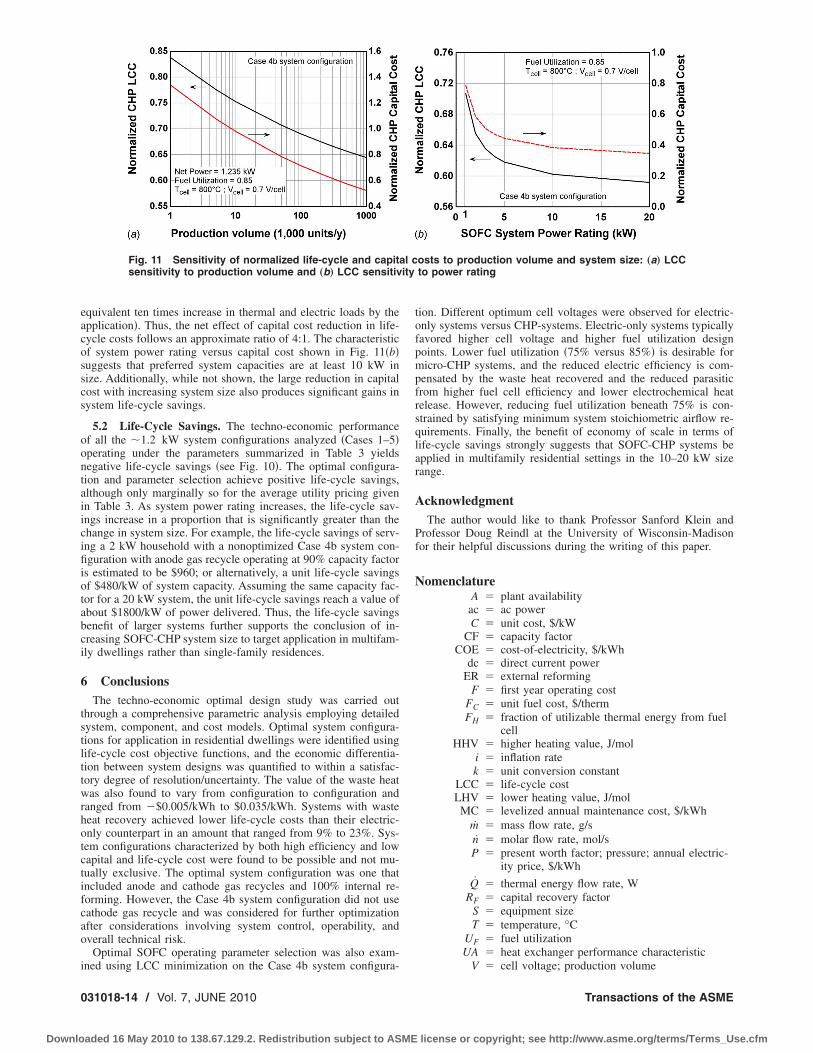
5.1 Sensitivity of LCC to Economy of Production andScale. The variation of life-cycle cost with changes in productionvolume is depicted in Fig. 11�a�. It is interesting to note that byincreasing the production rate from the base case of 50,000 units/year to 1�106 units /year, the 25% reduction in capital cost thatis achieved translates into a life-cycle cost reduction of only 6%.In a similar fashion, Fig. 11�b� illustrates that the economy ofscale in moving from a 1 kW SOFC-CHP system to a 10 kWsystem produces a decrease in system capital cost of 40%, butyields only a 10% decrease in life-cycle costs �assuming an
ture rise on normalized SOFC-CHP LCC: „a… LCCair temperature rise
era
conventional system life-cycle costs
JUNE 2010, Vol. 7 / 031018-13
license or copyright; see http://www.asme.org/terms/Terms_Use.cfm
eacosscs
oontaiicifiiotabci
6
tstlttwrhotctifcao
i
ity
0
Downlo
quivalent ten times increase in thermal and electric loads by thepplication�. Thus, the net effect of capital cost reduction in life-ycle costs follows an approximate ratio of 4:1. The characteristicf system power rating versus capital cost shown in Fig. 11�b�uggests that preferred system capacities are at least 10 kW inize. Additionally, while not shown, the large reduction in capitalost with increasing system size also produces significant gains inystem life-cycle savings.
5.2 Life-Cycle Savings. The techno-economic performancef all the �1.2 kW system configurations analyzed �Cases 1–5�perating under the parameters summarized in Table 3 yieldsegative life-cycle savings �see Fig. 10�. The optimal configura-ion and parameter selection achieve positive life-cycle savings,lthough only marginally so for the average utility pricing givenn Table 3. As system power rating increases, the life-cycle sav-ngs increase in a proportion that is significantly greater than thehange in system size. For example, the life-cycle savings of serv-ng a 2 kW household with a nonoptimized Case 4b system con-guration with anode gas recycle operating at 90% capacity factor
s estimated to be $960; or alternatively, a unit life-cycle savingsf $480/kW of system capacity. Assuming the same capacity fac-or for a 20 kW system, the unit life-cycle savings reach a value ofbout $1800/kW of power delivered. Thus, the life-cycle savingsenefit of larger systems further supports the conclusion of in-reasing SOFC-CHP system size to target application in multifam-ly dwellings rather than single-family residences.
ConclusionsThe techno-economic optimal design study was carried out
hrough a comprehensive parametric analysis employing detailedystem, component, and cost models. Optimal system configura-ions for application in residential dwellings were identified usingife-cycle cost objective functions, and the economic differentia-ion between system designs was quantified to within a satisfac-ory degree of resolution/uncertainty. The value of the waste heatas also found to vary from configuration to configuration and
anged from �$0.005/kWh to $0.035/kWh. Systems with wasteeat recovery achieved lower life-cycle costs than their electric-nly counterpart in an amount that ranged from 9% to 23%. Sys-em configurations characterized by both high efficiency and lowapital and life-cycle cost were found to be possible and not mu-ually exclusive. The optimal system configuration was one thatncluded anode and cathode gas recycles and 100% internal re-orming. However, the Case 4b system configuration did not useathode gas recycle and was considered for further optimizationfter considerations involving system control, operability, andverall technical risk.
Optimal SOFC operating parameter selection was also exam-
Fig. 11 Sensitivity of normalized life-cycle and capitsensitivity to production volume and „b… LCC sensitiv
ned using LCC minimization on the Case 4b system configura-
31018-14 / Vol. 7, JUNE 2010
aded 16 May 2010 to 138.67.129.2. Redistribution subject to ASME
tion. Different optimum cell voltages were observed for electric-only systems versus CHP-systems. Electric-only systems typicallyfavored higher cell voltage and higher fuel utilization designpoints. Lower fuel utilization �75% versus 85%� is desirable formicro-CHP systems, and the reduced electric efficiency is com-pensated by the waste heat recovered and the reduced parasiticfrom higher fuel cell efficiency and lower electrochemical heatrelease. However, reducing fuel utilization beneath 75% is con-strained by satisfying minimum system stoichiometric airflow re-quirements. Finally, the benefit of economy of scale in terms oflife-cycle savings strongly suggests that SOFC-CHP systems beapplied in multifamily residential settings in the 10–20 kW sizerange.
AcknowledgmentThe author would like to thank Professor Sanford Klein and
Professor Doug Reindl at the University of Wisconsin-Madisonfor their helpful discussions during the writing of this paper.
NomenclatureA plant availability
ac ac powerC unit cost, $/kW
CF capacity factorCOE cost-of-electricity, $/kWh
dc direct current powerER external reforming
F first year operating costFC unit fuel cost, $/thermFH fraction of utilizable thermal energy from fuel
cellHHV higher heating value, J/mol
i inflation ratek unit conversion constant
LCC life-cycle costLHV lower heating value, J/molMC levelized annual maintenance cost, $/kWh
m mass flow rate, g/sn molar flow rate, mol/sP present worth factor; pressure; annual electric-
ity price, $/kWh
Q thermal energy flow rate, WRF capital recovery factor
S equipment sizeT temperature, °C
UF fuel utilizationUA heat exchanger performance characteristic
osts to production volume and system size: „a… LCCto power rating
al c
V cell voltage; production volume
Transactions of the ASME
license or copyright; see http://www.asme.org/terms/Terms_Use.cfm
G
S
R
J
Downlo
V volumetric flow rate
W rate of work production or electric power
reek Letters change in
�H heating or thermal energy recovery efficiency� efficiency amount of excess air� extent of reaction conversion
ubscripts/Superscriptse, elec electric
eo electric-onlyf fuel
h, htg heatinginfl inflation
j component indexprod production
rec recoveredref referencesys system
th thermal
eferences�1� Energy Information Administration, 2002, “Table 2.1a Energy Consumption
by Sector, 1949–2002,” Annual Energy Review.�2� Energy Information Administration, 2002, “Table 2.6 Household Energy Con-
sumption and Expenditures by End Use and Energy Source, Selected Years,1978–1997,” Annual Energy Review.
�3� Kreutz, T. G., and Ogden, J. M., 2000, “Assessment of Hydrogen-Fueled PEMFuel Cells for Distributed Generation and Cogeneration,” Proceedings of the2000 U.S. DOE Hydrogen Program Review, Report No. NREL/CP-570-28890.
�4� Gunes, M. B., and Ellis, M. W., 2003, “Evaluation of Energy, Environmental,and Economic Characteristics of Fuel Cell Combined Heat and Power Systemsfor Residential Applications,” ASME J. Energy Resour. Technol., 125, pp.208–220.
�5� Marechal, F., Palazzi, F., Godat, J., and Favrat, D., 2005, “Thermo-EconomicModelling and Optimisation of Fuel Cell Systems,” Fuel Cells, 5�1�, pp. 5–24.
�6� Khandkar, A., Hartvigsen, J., and Elangovan, S., 2000, “A Techno-EconomicModel for SOFC Power Systems,” Solid State Ionics, 135, pp. 325–330.
�7� Baratto, F., Diwekar, U. M., and Manca, D., 2005, “Impacts Assessment andTrade-Offs of Fuel Cell-Based Auxiliary Power Units: Part I. System Perfor-mance and Cost Modeling,” J. Power Sources, 139, pp. 205–213.
�8� Baratto, F., Diwekar, U. M., and Manca, D., 2005, “Impacts Assessment andTrade-Offs of Fuel Cell Based Auxiliary Power Units: Part II. Environmentaland Health Impacts, LCA, and Multi-Objective Optimization,” J. PowerSources, 139, pp. 214–222.
�9� Hawkes, A., Aguiar, P., Hernandez-Aramburo, C., Leach, M., Brandon, N.,Green, T., and Adjiman, C., 2006, “Techno-Economic Modelling of a SolidOxide Fuel Cell Stack for Micro Combined Heat and Power,” J. PowerSources, 156, pp. 321–333.
�10� Hawkes, A., and Leach, M., 2005, “Solid Oxide Fuel Cell Systems for Resi-dential Micro-Combined Heat and Power in the UK: Key Economic Drives,”J. Power Sources, 149, pp. 72–83.
�11� Alanne, K., Saari, A., Ugursal, V., and Good, J., 2006, “The Financial Viabilityof an SOFC Cogeneration System in Single-Family Dwellings,” J. PowerSources, 158, pp. 403–416.
�12� Braun, R. J., Klein, S. A., and Reindl, D. T., 2006, “Evaluation of SystemConfigurations for Solid Oxide Fuel Cell-Based Micro-Combined Heat andPower Generators in Residential Applications,” J. Power Sources, 158, pp.
1290–1305.ournal of Fuel Cell Science and Technology
aded 16 May 2010 to 138.67.129.2. Redistribution subject to ASME
�13� Braun, R. J., 2002, “Optimal Design and Operation of Solid Oxide Fuel CellSystems for Small-Scale Stationary Applications,” Ph.D. thesis, University ofWisconsin-Madison, Madison, WI.
�14� Braun, R. J., Klein, S. A., and Reindl, D. T., 2004, “Considerations in theDesign and Application of Solid Oxide Fuel Cell Energy Systems in Residen-tial Markets,” ASHRAE Trans., 110.
�15� Exeltech, 2000, MX Series product brochure, Fort Worth, TX, www.exeltech-.com.
�16� Engineering Equation Software �EES�, 2005, F-Chart Software, Middleton,WI, www.fchart.com.
�17� Ellis, M. W., and Gunes, M. B., 2002, “Status of Fuel Cell Systems for Com-bined Heat and Power Applications in Buildings,” ASHRAE Trans., 108.
�18� Duffie, J. A., and Beckman, W. A., 1991, Solar Engineering of Thermal Pro-cesses, 2nd ed., Wiley Interscience, New York.
�19� Starrs, T. J., 2000, “Summary of State Net Metering Programs,” Kelso Starrs& Associates, LLC, Feb.
�20� Alderfer, R. B., Eldridge, M. M., and Starrs, T. J., 2000, “Making Connec-tions: Case Studies of Interconnections and Their Impact on Distributed PowerProjects,” National Renewable Energy Laboratory, Report No. NREL/SR-200-28053.
�21� Myers, D. B., Ariff, G. D., James, B. D., Lettow, J. S., Thomas, C. E., Kuhn,R. C., 2002, “Cost and Performance Comparison of Stationary Hydrogen Fu-eling Appliances,” Task 2 report prepared for the U.S. DOE under Grant No.DE-FG01-99EE35099.
�22� Energy Information Administration, 2008, “Average Retail Price of Electricityto Ultimate Customers by End-Use Sector, 1995 Through 2006,” Table 7.4,Electric Power Annual Data.
�23� Mugerwa, M. N., and Blomen, L. J., 1993, “Fuel Cell System Economics”Fuel Cell Systems, L. J. L. Blomen and M. N. Mugerwa, eds., Plenum, NewYork.
�24� Arthur D. Little, llc, 2001, “Conceptual Design of POX/SOFC 5 kW NetSystem,” final report, prepared for the U.S. Department of Energy, NationalEnergy Technology Laboratory.
�25� Thijssen, J. H., 2007, “The Impact of Scale-Up and Production Volume onSOFC Manufacturing Cost,” final report, prepared for the U.S. Department ofEnergy, National Energy Technology Laboratory.
�26� Lundburg, W. L., 1989, “Solid Oxide Fuel Cell Cogeneration System Concep-tual Design,” final report, prepared for the Gas Research Institute �GRI�, Re-port No. GRI-89/0162.
�27� Itoh, H., Mori, M., Mori, N., and Abe, T., 1994, “Production Cost Estimationof Solid Oxide Fuel Cells,” J. Power Sources, 49, pp. 315–332.
�28� Krist, K., Wright, J. D., and Romero, C., 1995, “Manufacturing Costs forPlanar Solid Oxide Fuel Cells,” Proceedings of the Fourth International Sym-posium on Solid Oxide Fuel Cells, The Electrochemical Society, Osaka, Japan,pp. 24–32.
�29� James, B. D., Lomax, F. D., and Thomas, C. E., 1999, “Manufacturing Cost ofStationary Polymer Electrolyte Membrane �PEM� Fuel Cell Systems,” finalreport, prepared for the U.S. Department of Energy, National Renewable En-ergy Laboratory.
�30� Adame, B., 2008, Haynes International Inc., private communication.�31� TIAX, llc., 2002, “Scale-Up Study of 5-kW SECA Modules to a 250 kW
System,” final report, prepared for the U.S. Department of Energy, NationalEnergy Technology Laboratory.
�32� Johnson, M., 2006, Phoenix Analysis and Design Technologies, Inc., privatecommunication.
�33� Polak, D. R., 2001, “A Thermoeconomic Model for Residential Fuel CellSystems Studies,” final report, United Technologies Research Center.
�34� Surdoval, W., 2006, “U.S. DOE Fossil Energy Fuel Cell Program Review,”Proceedings of the Seventh SECA Public Workshop and Peer Review, Phila-delphia, PA, Sept. 14–16.
�35� Doyon, J., 2006, “SECA SOFC Programs at Fuel Cell Energy, Inc.,” Proceed-ings of the Seventh SECA Public Workshop and Peer Review, Philadelphia, PA,Sept. 14–16.
�36� Linderoth, S., and Mogensen, M., 2000, “Improving Durability of SOFCStacks,” Proceedings of the Fourth European SOFC Forum, Lucerne, Swit-
zerland, Jul.JUNE 2010, Vol. 7 / 031018-15
license or copyright; see http://www.asme.org/terms/Terms_Use.cfm