technological change and productivity growth...
TRANSCRIPT
Région et Développement n° 24-2006
TECHNOLOGICAL CHANGE AND PRODUCTIVITY GROWTH IN ITALIAN REGIONS, 1982-2001
Francesco QUATRARO*
Abstract – This paper first brings together aggregate data from the 20 Italian regions, concerning the dynamics of Total Factor Productivity (TFP) over twenty years, and then investigates the relationship between the observed variance in TFP evolution and the level of knowledge capital, both private and public, human capital and patent applications. Over the last decade a growing debate emerged in Italy concerning the transition of the national economy toward specialization in service sectors, despite the continuing relevance of manufacturing activities. The transition is supposed to be managed in different ways, according to the different governance mechanisms at work in different contexts. The opposition between a "first capitalistic organization" and a "second" one provides a useful framework to the interpretation of the dynamics in progress. The results stemming from econometric tests confirm the existence of different patterns of evolution, driven by different sets of factors, according to the specific way the economic activities are organized in each of the twenty Italian regions. Key-words – ECONOMIC GROWTH, LOCALIZED TECHNOLOGICAL CHANGE, TOTAL FACTOR PRODUCTIVITY, ITALIAN MODELS OF CAPITALISM. JEL Classification: O11, O14, O47. I acknowledge the comments of Cristiano Antonelli, Frank Lichtenberg, Francesco Rullani and of one anonymous referee, as well as the funding of the CSI -Piemonte project "L'economia dell'innovazione nei servizi di rete: il caso piemontese" and of the European Union Directorate for Research within the context of the Integrated Project EURODITE, contract n. 006187 in progress at the Fondazione Rosselli.
* Columbia University and Laboratorio di Economia dell'Innovazione "F. Momigliano", Dipartimento di Economia, Università degli Studi di Torino; [email protected].
136 Francesco Quatraro
INTRODUCTION
The evolution of the Italian industrial system in the post war period, has been represented by different authors as characterized by two distinct forms of capitalism, which are supposedly complementary. By "first capitalism" they mean the core of large firms, both private and public ly owned, which mainly emerged in north-western Italy. These firms usually operated in highly capital-intensive sectors, like chemicals, steel and car production. Their growth was enabled by also relying on government support, sometimes even in direct monetary terms. Some authors have argued that the Italian government in this period played the role of an entrepreneur (Amatori and Colli, 2000).
The "second capitalism" is the outcome of a dynamic and dispersed entrepreneurial spirit, which has venerable origins. It mainly consists of small and medium sized firms, which are settled in areas traditionally based on the work of artisans and croppers. It is the outcome of the evolution of proto-industrial systems, helped by the changes in the production technology and the conditions of the 1970s. Firms are usually linked by systemic ties, giving rise to the well known industrial districts, which are specialized in the production of consumer goods in the sectors of the so called Made in Italy (Antonelli and Militello, 2000).
Thus the second capitalism has emerged in a system already dominated by large corporations specialized in capital-intensive production. In a recent work by Traù (2005) the sequential character of this process is shown very clearly. Drawing on long run time series on employment, he shows how the emergence of the Made in Italy sectors during the 1970s may be viewed as a creative destruction process, as they slowly replaced the declining sectors of that period.
In the late 1990s Italy started experiencing the same process of structural change which affected the United States in the 1980s and the United Kingdom in the early 1990s. Such a process consists of a slow fall in the economic performances of manufacturing sectors and the parallel rise of service sectors. In this process, the mismatch between firms' plans and actual conditions is likely to induce the introduction of technological innovations localized in the idiosyncratic conditions of factor markets and institutions. Just as occurred in its predecessors, the transition towards a service economy in Italy is supposed to take the form of a transition to the digital economy (Antonelli, 2003; Antonelli and Militello, 2000).
While the growth of the Italian economy in the second half of the 20PthP century has mainly relied upon the virtues of the second capitalism, the ongoing process of structural change poses serious difficulties. In particular the specialization in traditional sectors and the small sizes that mostly characterizes firms within this environment, are likely to represent crucial weaknesses. There are other elements that are likely to jeopardize the
Région et Développement 137
effectiveness of the creative reaction processes, such as the lack of appropriate scientific and technological infrastructures and of linkages between firms and universities, and the prevalence of tacit knowledge and the low levels of codified human capital. Thus, at the end of the 1990s it is hard to determine which sectors will be able to replace the decline of manufacturing. Some policy measures are needed to foster the adoption of digital technologies within the production system.
This paper first investigates the dynamics of total factor productivity (TFP) in each of twenty Italian regions from 1982 to 2001, and then tests the strength of several inducement mechanisms. The paper is organized as follows. In Section 2 the empirical context characterizing the analysis is introduced. In Section 3 we describe the main features of the model and report the results of some econometric tests. Section 4 presents OLS estimations of the contribution of R&D, patenting and human capital to TFP, for each of the 20 Italia n regions. Finally, in section 5, we provide conclusions and some policy implications.
1. THE EMPIRICAL CONTEXT
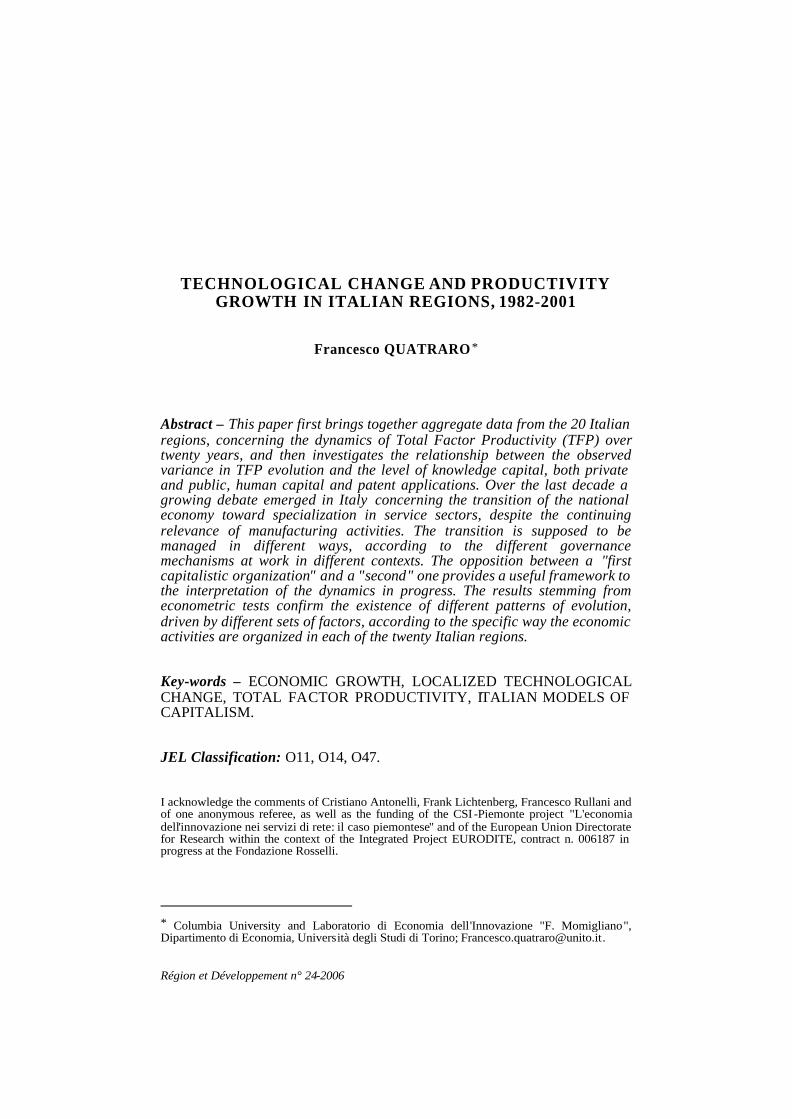
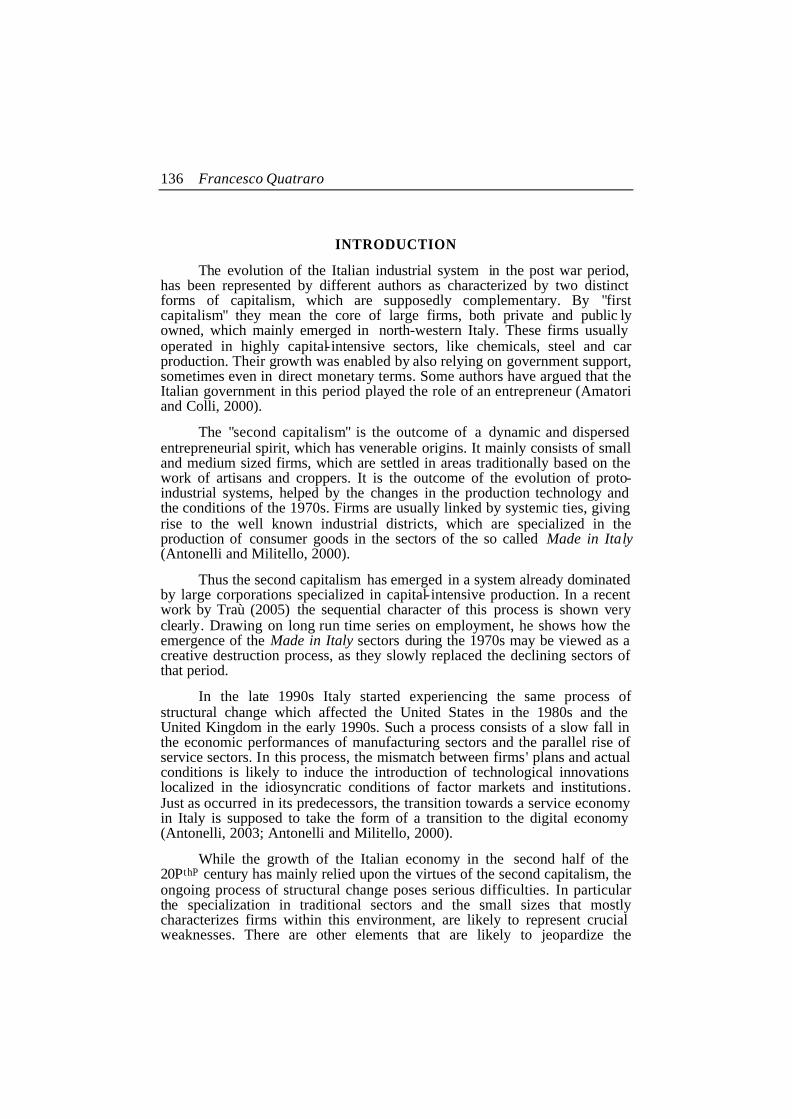
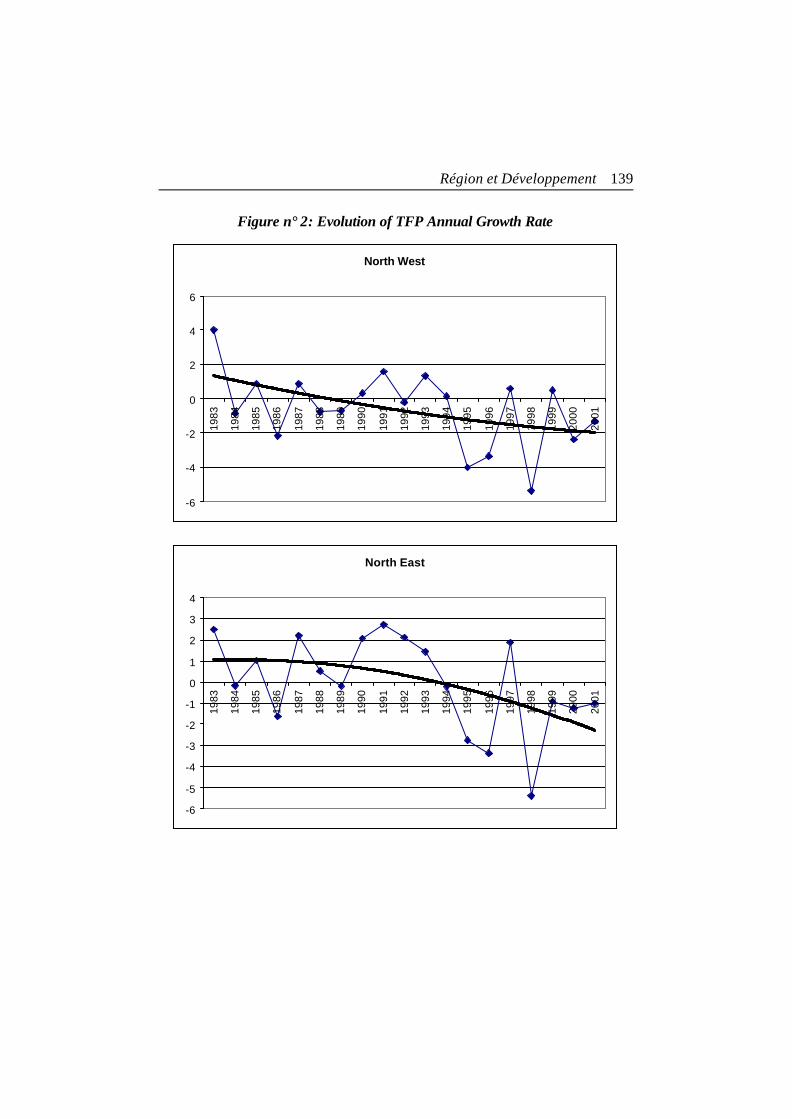
In Table 1 we provide average annual growth rates of TFP. TFP in Italy grew during the 1980s, and then started decreasing in the 1990s as a result of the crisis in the manufacturing sectors. 1 This clearly appears in Figure 1, where the trend line shows that growth rates first increased but at a decreasing rate, and then experienced a fall. At the regional level the dynamics are significantly different. In Piedmont, for example, one can see that in the period 1986-1991 the average annual growth rate was negative, then became positive in the first half of the 1990s and finally negative in the late 1990s. Lombardy, Tuscany and Emilia Romagna, display instead the same evolution as that at the national level, i.e. continuously decreasing along the three considered periods. Hence, with a few exceptions Italian regions follow the national trend, as in the late 1990s the TFP proved to fall, both in absolute and in relative terms. A comparison of the four basic Italian macro-regions in Figure 2 helps the understanding of such dynamics.
This evidence makes the Italian case a very particular one. In the United States and the United Kingdom the transition towards the digital economy and the specialization in service sectors has been successfully managed through creative reactions which allowed the system to adapt as the changes occurred. The evolution of TFP in Italy suggests that perhaps the decline in the performances of manufacturing sectors has not been paralleled by a more-than-proportionate rise of services activities.
To gain some understanding of this phenomenon we investigate the
evolution of the variables related to the innovative activity, both in terms of inputs and outputs. For inputs to innovation in Figure 3 we provide data about
1 See the Appendix for data sources and the methodology we used to get the variables introduced in this section.
138 Francesco Quatraro
Table n° 1: Average Annual Growth Rates of TFP
1986-1991 1991-1996 1996-2001 Piemonte -0,133 0,151 -1,320 Valle d'Aosta 3,609 -1,860 0,307 Lombardia 0,219 -1,056 -2,105 Liguria -2,228 -1,420 -2,233 North West -0,148 -0,750 -1,890 Trentino-Alto Adige 1,570 -0,428 -2,072 Veneto 0,661 -0,111 -1,497 Friuli-Venezia Giulia 0,038 0,421 -2,258 Emilia-Romagna 1,250 0,168 -1,584 North East 0,961 -0,008 -1,659 Toscana 1,644 -1,947 -2,026 Umbria 0,737 -0,999 -1,057 Marche 1,118 0,398 -2,048 Lazio -0,412 -0,732 -2,193 Abruzzo 0,734 2,410 -0,782 Molise 3,074 1,350 -1,110 Central Italy 0,497 -0,988 -2,050 Campania -0,337 2,924 -0,050 Puglia -1,103 1,525 -1,969 Basilicata 1,544 0,751 0,959 Calabria -0,672 0,063 -1,253 Sicilia 0,784 2,821 -0,788 Sardegna 2,431 -0,486 -0,230 Southern Italy 0,173 1,952 -0,717 Italy 0,387 0,109 -1,569
Source: Elaborations on National Bureau of Census (ISTAT) data.
Figure n° 1: Evolution of TFP Annual Growth Rate
Italy
-7
-6
-5
-4
-3
-2
-1
0
1
2
3
Région et Développement 139
Figure n° 2: Evolution of TFP Annual Growth Rate
North West
-6
-4
-2
0
2
4
6
1983
1984
1985
1986
1987
1988
1989
1990
1991
1992
1993
1994
1995
1996
1997
1998
1999
2000
2001
North East
-6
-5
-4
-3
-2
-1
0
1
2
3
4
1983
1984
1985
1986
1987
1988
1989
1990
1991
1992
1993
1994
1995
1996
1997
1998
1999
2000
2001

140 Francesco Quatraro
Central Italy
-8
-6
-4
-2
0
2
4
6
1983
1985
1987
1989
1991
1993
1995
1997
1999
2001
Southern Italy
-8
-6
-4
-2
0
2
4
6
1983
1985
1987
1989
1991
1993
1995
1997
1999
2001
the evolution of the percentage of GDP that is expended in R&D, and the evolution of the shares of total R&D coming from public and private sources. At the national level, the share of GDP devoted to R&D in the 1990s remains around 1%, far below the levels observed in other developed countries. The situation is more controversial, if one goes into further detail. In the North West, for example, the same indicator was far above 1% and increasing in the 1980s, while in the last decade the difference from the national level started shrinking (in the late 1990s the value was around 1,2%). As far as the compo-sition of R&D expenditure is concerned, the general trend is towards a rise in
Région et Développement 141
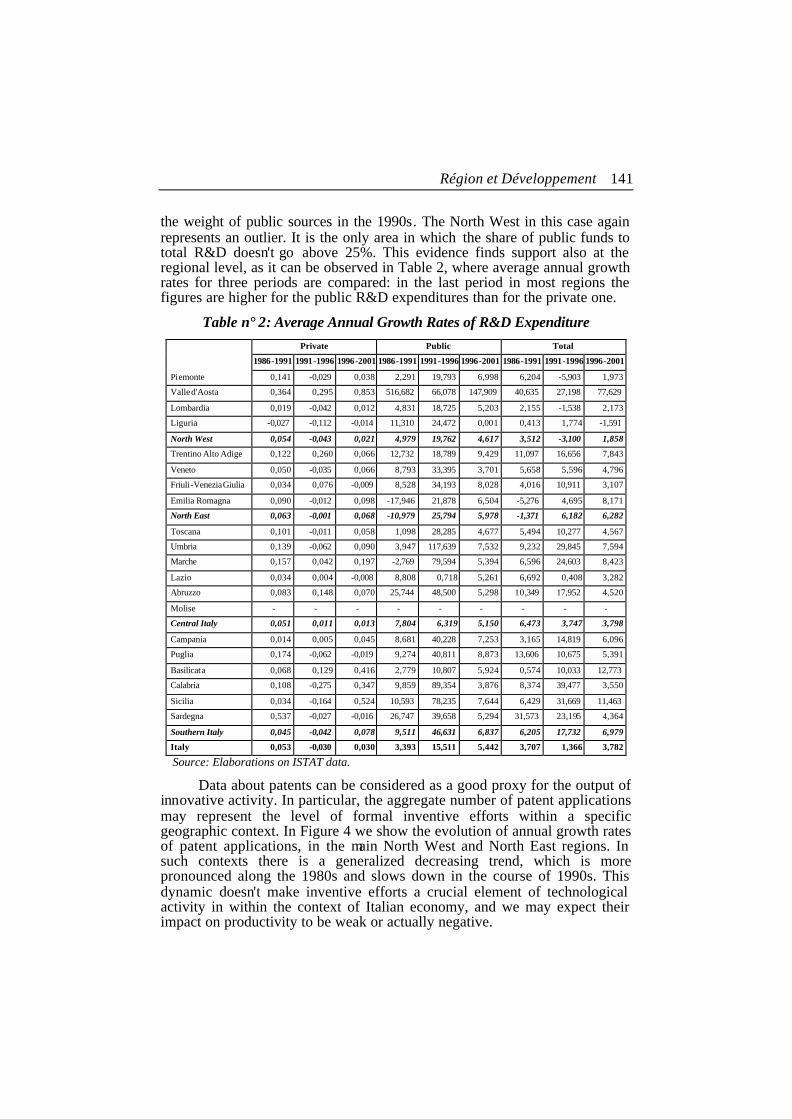
the weight of public sources in the 1990s. The North West in this case again represents an outlier. It is the only area in which the share of public funds to total R&D doesn't go above 25%. This evidence finds support also at the regional level, as it can be observed in Table 2, where average annual growth rates for three periods are compared: in the last period in most regions the figures are higher for the public R&D expenditures than for the private one.
Table n° 2: Average Annual Growth Rates of R&D Expenditure
Private Public Total
1986-1991 1991-1996 1996-2001 1986-1991 1991-1996 1996-2001 1986-1991 1991-1996 1996-2001
Piemonte 0,141 -0,029 0,038 2,291 19,793 6,998 6,204 -5,903 1,973
Valle d'Aosta 0,364 0,295 0,853 516,682 66,078 147,909 40,635 27,198 77,629
Lombardia 0,019 -0,042 0,012 4,831 18,725 5,203 2,155 -1,538 2,173
Liguria -0,027 -0,112 -0,014 11,310 24,472 0,001 0,413 1,774 -1,591
North West 0,054 -0,043 0,021 4,979 19,762 4,617 3,512 -3,100 1,858
Trentino Alto Adige 0,122 0,260 0,066 12,732 18,789 9,429 11,097 16,656 7,843
Veneto 0,050 -0,035 0,066 8,793 33,395 3,701 5,658 5,596 4,796
Friuli-Venezia Giulia 0,034 0,076 -0,009 8,528 34,193 8,028 4,016 10,911 3,107
Emilia Romagna 0,090 -0,012 0,098 -17,946 21,878 6,504 -5,276 4,695 8,171
North East 0,063 -0,001 0,068 -10,979 25,794 5,978 -1,371 6,182 6,282
Toscana 0,101 -0,011 0,058 1,098 28,285 4,677 5,494 10,277 4,567
Umbria 0,139 -0,062 0,090 3,947 117,639 7,532 9,232 29,845 7,594
Marche 0,157 0,042 0,197 -2,769 79,594 5,394 6,596 24,603 8,423
Lazio 0,034 0,004 -0,008 8,808 0,718 5,261 6,692 0,408 3,282
Abruzzo 0,083 0,148 0,070 25,744 48,500 5,298 10,349 17,952 4,520
Molise - - - - - - - - -
Central Italy 0,051 0,011 0,013 7,804 6,319 5,150 6,473 3,747 3,798
Campania 0,014 0,005 0,045 8,681 40,228 7,253 3,165 14,819 6,096
Puglia 0,174 -0,062 -0,019 9,274 40,811 8,873 13,606 10,675 5,391
Basilicata 0,068 0,129 0,416 2,779 10,807 5,924 0,574 10,033 12,773
Calabria 0,108 -0,275 0,347 9,859 89,354 3,876 8,374 39,477 3,550
Sicilia 0,034 -0,164 0,524 10,593 78,235 7,644 6,429 31,669 11,463
Sardegna 0,537 -0,027 -0,016 26,747 39,658 5,294 31,573 23,195 4,364
Southern Italy 0,045 -0,042 0,078 9,511 46,631 6,837 6,205 17,732 6,979
Italy 0,053 -0,030 0,030 3,393 15,511 5,442 3,707 1,366 3,782
Source: Elaborations on ISTAT data.
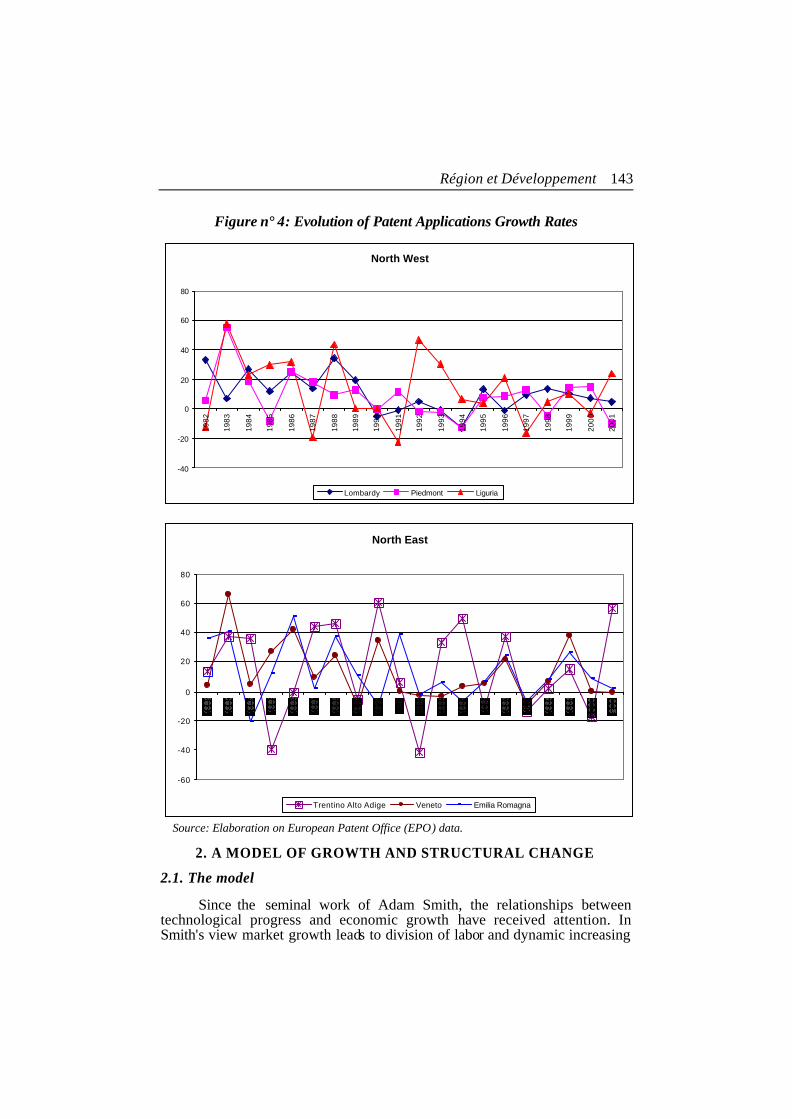
Data about patents can be considered as a good proxy for the output of innovative activity. In particular, the aggregate number of patent applications may represent the level of formal inventive efforts within a specific geographic context. In Figure 4 we show the evolution of annual growth rates of patent applications, in the main North West and North East regions. In such contexts there is a generalized decreasing trend, which is more pronounced along the 1980s and slows down in the course of 1990s. This dynamic doesn't make inventive efforts a crucial element of technological activity in within the context of Italian economy, and we may expect their impact on productivity to be weak or actually negative.

142 Francesco Quatraro
Figure n° 3: Input Indicators for Innovative Activity
Ratio between R&D expenditure and GDP
0
0,2
0,4
0,6
0,8
1
1,2
1,4
1,6
1,8
1982
1983
1984
1985
1986
1987
1988
1989
1990
1991
1992
1993
1994
1995
1996
1997
1998
1999
2000
2001
Italia Nord Ovest Nord Est Italia Centrale Mezzogiorno
Private R&D as a percentage of Total R&D
0
20
40
60
80
100
1982
1983
1984
1985
1986
1987
1988
1989
1990
1991
1992
1993
1994
1995
1996
1997
1998
1999
2000
2001
Italia Nord Ovest Nord Est Italia Centrale Mezzogiorno
Source: Elaborations on ISTAT data.
Région et Développement 143
Figure n° 4: Evolution of Patent Applications Growth Rates
North West
-40
-20
0
20
40
60
80
1982
1983
1984
1985
1986
1987
1988
1989
1990
1991
1992
1993
1994
1995
1996
1997
1998
1999
2000
2001
Lombardy Piedmont Liguria
North East
-60
-40
-20
0
20
40
60
80
Trentino Alto Adige Veneto Emilia Romagna
Source: Elaboration on European Patent Office (EPO) data.
2. A MODEL OF GROWTH AND STRUCTURAL CHANGE 2.1. The model
Since the seminal work of Adam Smith, the relationships between technological progress and economic growth have received attention. In Smith's view market growth leads to division of labor and dynamic increasing
144 Francesco Quatraro
returns. Eventually technological innovations are introduced in the system, and productivity is increased. This allows for an increase in output and entry in other markets. Technological progress and economic growth hence feed each other (Smith, 1776).
In the 1930s the need to give a quantitative account of the contribution of technological progress to economic growth emerged. At the very beginning two approaches could be distinguished: on the one hand there was the tradition of national income measurement, and on the other hand, the production function approach related to the contributions of Cobb and Douglas (Griliches, 1996).
An important step in this process was marked by the models proposed by Abramovitz (1956) and Solow (1957). In these models technological progress is the only element allowing for a continuous growth process. The concept of Total Factor Productivity (TFP) gains momentum, conceived as the ratio between a measure of the output and the index of factors utilization. The growth of TFP is then calculated as the difference between the growth in output and growth in input utilization.
In such a quantitative framework technological progress explains growth, but in turn it is not explained. It is exogenous to the economic system, like manna from the sky. By contrast, in the literature mainly based on historical accounts, the close relationship between the emergence of innovations and economic dynamics clearly emerged. In Smith, market dynamics are the basic engine, while in Schumpeter, oligopolistic rivalry induces firms to innovate (Schumpeter, 1942).
As far as the inducement mechanisms are concerned, different views of the endogeneity of technological progress (and hence of TFP) have been proposed in the economic literature, concerned both with the rate and the direction of technological change. Some works stressed the relevance of supply-side factors in fostering the introduction of innovations, as the accumulation of knowledge capital stock and high levels of codifie d human capital provide the system with new technological opportunities (Nelson, 1959; Rosenberg, 1974). Conversely, other authors emphasized the role of the demand-side factors, i.e. the growth in output, both enhancing the innovative effort (Kaldor, 1957; Young, 1928) and shaping its direction (Schmookler, 1954 and 1962). On a different ground, within another strand of literature, the changes in relative prices of production factors are supposed to force the search for innovations that save the new dearer input (Hicks, 1932; Fellner, 1961; Kennedy, 1964). Lastly it is worth stressing that Kaldor suggested another interesting mechanism by which innovations enter the economic system, i.e. the investments in fixed capital. Actually he stated: "the use of more capital per worker inevitably entails the introduction of new techniques which requires "inventiveness" of some kind […] On the other hand, most, though not all, technical innovations which are capable of raising the productivity of labor require the use of more capital per man" (Kaldor, 1957, 595).
Région et Développement 145
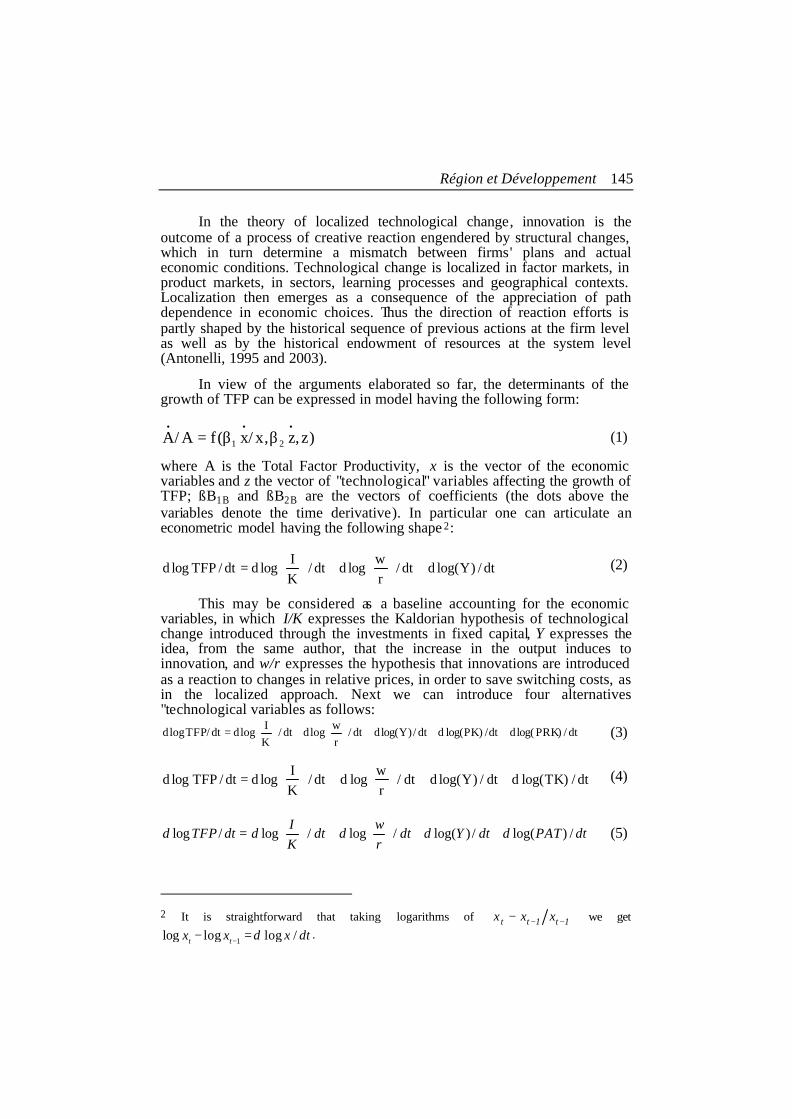
In the theory of localized technological change, innovation is the outcome of a process of creative reaction engendered by structural changes, which in turn determine a mismatch between firms' plans and actual economic conditions. Technological change is localized in factor markets, in product markets, in sectors, learning processes and geographical contexts. Localization then emerges as a consequence of the appreciation of path dependence in economic choices. Thus the direction of reaction efforts is partly shaped by the historical sequence of previous actions at the firm level as well as by the historical endowment of resources at the system level (Antonelli, 1995 and 2003).
In view of the arguments elaborated so far, the determinants of the growth of TFP can be expressed in model having the following form:
)z,z,x/x(fA/A 21
•••ββ= (1)
where A is the Total Factor Productivity, x is the vector of the economic variables and z the vector of "technological" variables affecting the growth of TFP; ßB1B and ßB2B are the vectors of coefficients (the dots above the variables denote the time derivative). In particular one can articulate an econometric model having the following shape 2:
dt/)Ylog(ddt/rw
logddt/KI
logddt/TFPlogd +
+
= (2)
This may be considered as a baseline accounting for the economic
variables, in which I/K expresses the Kaldorian hypothesis of technological change introduced through the investments in fixed capital, Y expresses the idea, from the same author, that the increase in the output induces to innovation, and w/r expresses the hypothesis that innovations are introduced as a reaction to changes in relative prices, in order to save switching costs, as in the localized approach. Next we can introduce four alternatives "technological variables as follows:
dt/)PRKlog(ddt/)PKlog(ddt/)Ylog(ddt/rwlogddt/
KIlogddt/TFPlogd +++
+
= (3)
dt/)TKlog(ddt/)Ylog(ddt/rw
logddt/KI
logddt/TFPlogd ++
+
= (4)
dtPATddtYddtrw
ddtKI
ddtTFPd /)log(/)log(/log/log/log ++
+
= (5)
2 It is straightforward that taking logarithms of 1t1tt xxx −−− we get
1log log log /t tx x d x dt−− = .
146 Francesco Quatraro
)log(/)log(/log/log/log HCPddtYddtrw
ddtKI
ddtTFPd ++
+
= (6)
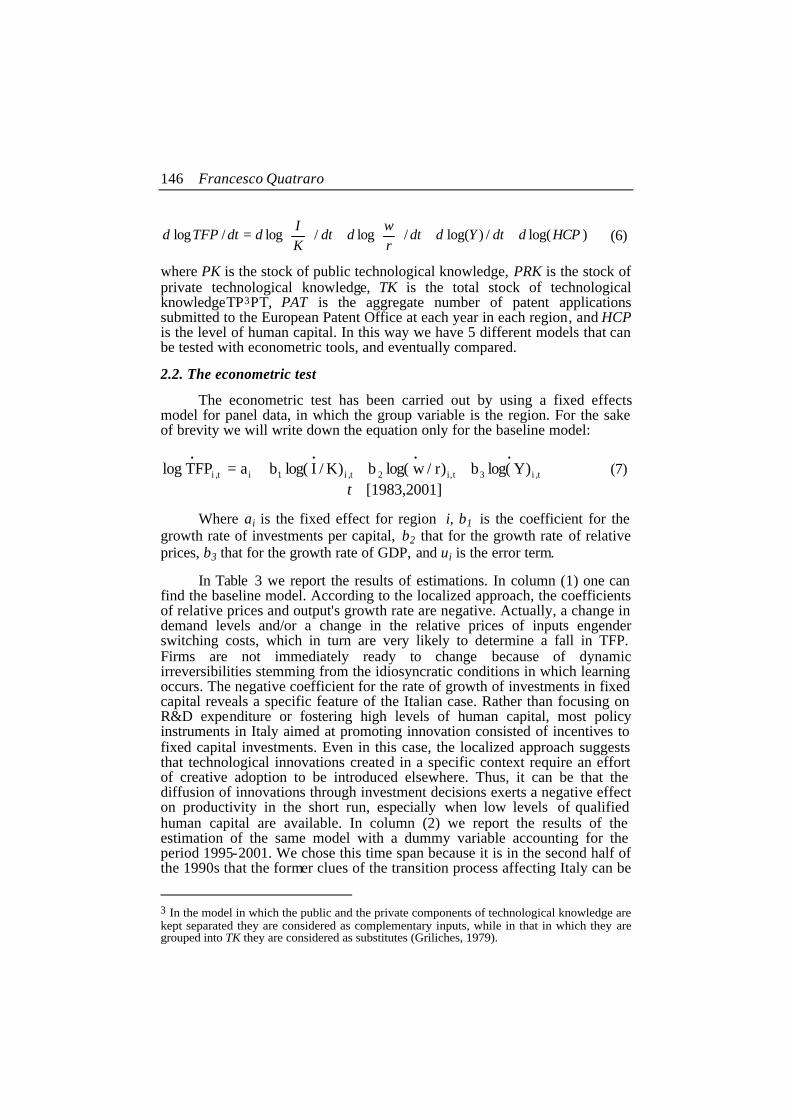
where PK is the stock of public technological knowledge, PRK is the stock of private technological knowledge, TK is the total stock of technological knowledgeTP3PT, PAT is the aggregate number of patent applications submitted to the European Patent Office at each year in each region, and HCP is the level of human capital. In this way we have 5 different models that can be tested with econometric tools, and eventually compared. 2.2. The econometric test
The econometric test has been carried out by using a fixed effects model for panel data, in which the group variable is the region. For the sake of brevity we will write down the equation only for the baseline model:
t,i3t,i2t,i1it,i )Ylog(b)r/wlog(b)K/Ilog(baTFPlog••••
+++= (7) [1983,2001]t ∈
Where ai is the fixed effect for region i, b1 is the coefficient for the growth rate of investments per capital, b2 that for the growth rate of relative prices, b3 that for the growth rate of GDP, and ui is the error term.
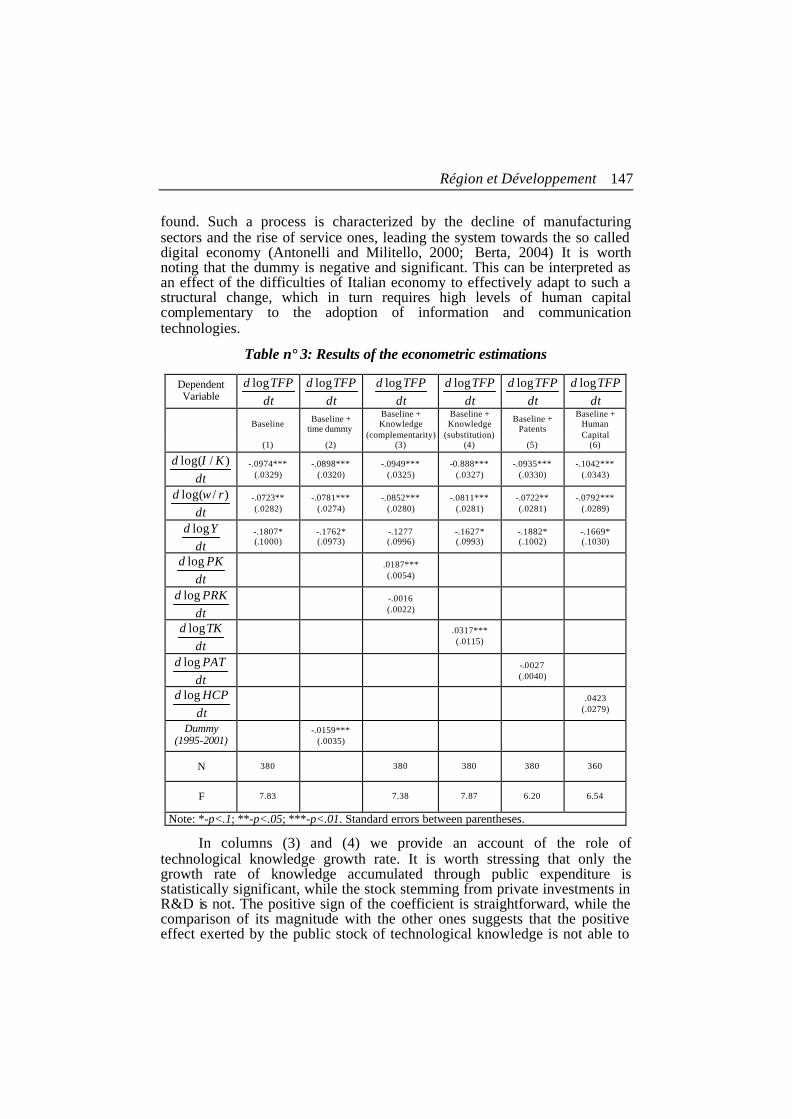
In Table 3 we report the results of estimations. In column (1) one can find the baseline model. According to the localized approach, the coefficients of relative prices and output's growth rate are negative. Actually, a change in demand levels and/or a change in the relative prices of inputs engender switching costs, which in turn are very likely to determine a fall in TFP. Firms are not immediately ready to change because of dynamic irreversibilities stemming from the idiosyncratic conditions in which learning occurs. The negative coefficient for the rate of growth of investments in fixed capital reveals a specific feature of the Italian case. Rather than focusing on R&D expenditure or fostering high levels of human capital, most policy instruments in Italy aimed at promoting innovation consisted of incentives to fixed capital investments. Even in this case, the localized approach suggests that technological innovations created in a specific context require an effort of creative adoption to be introduced elsewhere. Thus, it can be that the diffusion of innovations through investment decisions exerts a negative effect on productivity in the short run, especially when low levels of qualified human capital are available. In column (2) we report the results of the estimation of the same model with a dummy variable accounting for the period 1995-2001. We chose this time span because it is in the second half of the 1990s that the former clues of the transition process affecting Italy can be
3 In the model in which the public and the private components of technological knowledge are kept separated they are considered as complementary inputs, while in that in which they are grouped into TK they are considered as substitutes (Griliches, 1979).
Région et Développement 147
found. Such a process is characterized by the decline of manufacturing sectors and the rise of service ones, leading the system towards the so called digital economy (Antonelli and Militello, 2000; Berta, 2004) It is worth noting that the dummy is negative and significant. This can be interpreted as an effect of the difficulties of Italian economy to effectively adapt to such a structural change, which in turn requires high levels of human capital complementary to the adoption of information and communication technologies.
Table n° 3: Results of the econometric estimations
Dependent Variable dt
TFPd log dt
TFPd log dt
TFPd log dt
TFPd log dt
TFPd log dt
TFPd log
Baseline Baseline + time dummy
Baseline + Knowledge
(complementarity)
Baseline + Knowledge
(substitution)
Baseline + Patents
Baseline + Human Capital
(1) (2) (3) (4) (5) (6)
dtKId )/log( -.0974***
(.0329) -.0898***
(.0320) -.0949***
(.0325) -0.888***
(.0327) -.0935***
(.0330) -.1042***
(.0343)
dtrwd )/log( -.0723**
(.0282) -.0781***
(.0274) -.0852***
(.0280) -.0811***
(.0281) -.0722** (.0281)
-.0792*** (.0289)
dtYd log -.1807*
(.1000) -.1762* (.0973)
-.1277 (.0996)
-.1627* (.0993)
-.1882* (.1002)
-.1669* (.1030)
dtPKd log .0187***
(.0054)
dtPRKd log -.0016
(.0022)
dtTKd log .0317***
(.0115)
dtPATd log -.0027
(.0040)
dtHCPd log .0423
(.0279)
Dummy (1995-2001) -.0159***
(.0035)
N 380 380 380 380 360
F 7.83 7.38 7.87 6.20 6.54
Note: *-p<.1; **-p<.05; ***-p<.01. Standard errors between parentheses.
In columns (3) and (4) we provide an account of the role of technological knowledge growth rate. It is worth stressing that only the growth rate of knowledge accumulated through public expenditure is statistically significant, while the stock stemming from private investments in R&D is not. The positive sign of the coefficient is straightforward, while the comparison of its magnitude with the other ones suggests that the positive effect exerted by the public stock of technological knowledge is not able to

148 Francesco Quatraro
counterbalance the short run negative effects introduced above. Moreover, the positive and significant coefficient of the total stock of knowledge supports the idea that in Italy substitutability rather than complementarity between private and public efforts prevailed. Specifically, with the exception of a few large corporations, the private sector appeared to lean on public procurement.
In columns (5) and (6) we investigate the effects of inventive efforts and of the of qualified human capital levels. In both cases the baseline coefficients do not change significantly, and, in both cases, the added variables are not statistically significant. Note that the positive sign on human capital and the negativeP4PT one on patenting are consistent with what one could have expected. These findings are strikingly complementary with the evidence about the effects of the change in the economic conditions within the system. Both the levels of human capital and of the inventive efforts are not such that agents can react effectively to the mismatches they face between their plans and the actual situation, at least in the short run.
3. A CROSS-REGIONAL OVERVIEW
In view of the analysis carried out so far, it can be of some interest to investigate the determinants of TFP at the regional level, so as to account for the path dependency stemming form the idiosyncratic factors which influenced the evolution of the economic system in Italy. In particular, by disentangling the regional specificities one can appreciate the differences between the "first capitalism" and the "second capitalism" areas.
To do so, it is necessary first to understand the direct relationships between TFP and the knowledge stock, both private and public, and then to observe the impacts of the indexes of inventive effectiveness and human capital levels, for each of the 20 Italian regions. We can write the econometric specifications of the functional relationships to be estimated as follows:
1111 lnlnln εγβα +++= PKPRKTFP (8)
222 lnln εβα ++= TKTFP (9)
333 lnln εβα ++= PATTFP (10)
444 lnln εβα ++= HCPTFP (11)
These equations are then estimated by applying the standard OLS techniques on the 20 available observations for each Italian region. While we are aware this poses serious econometric problems, nonetheless we think we can extract from such an exercise valuable knowledge to better understanding the shape the structural change process is taking in the different areas.
4 As the variable consists of the ratio between application and issued patents, the greater it is the less the effectiveness of inventive effort.
Région et Développement 149
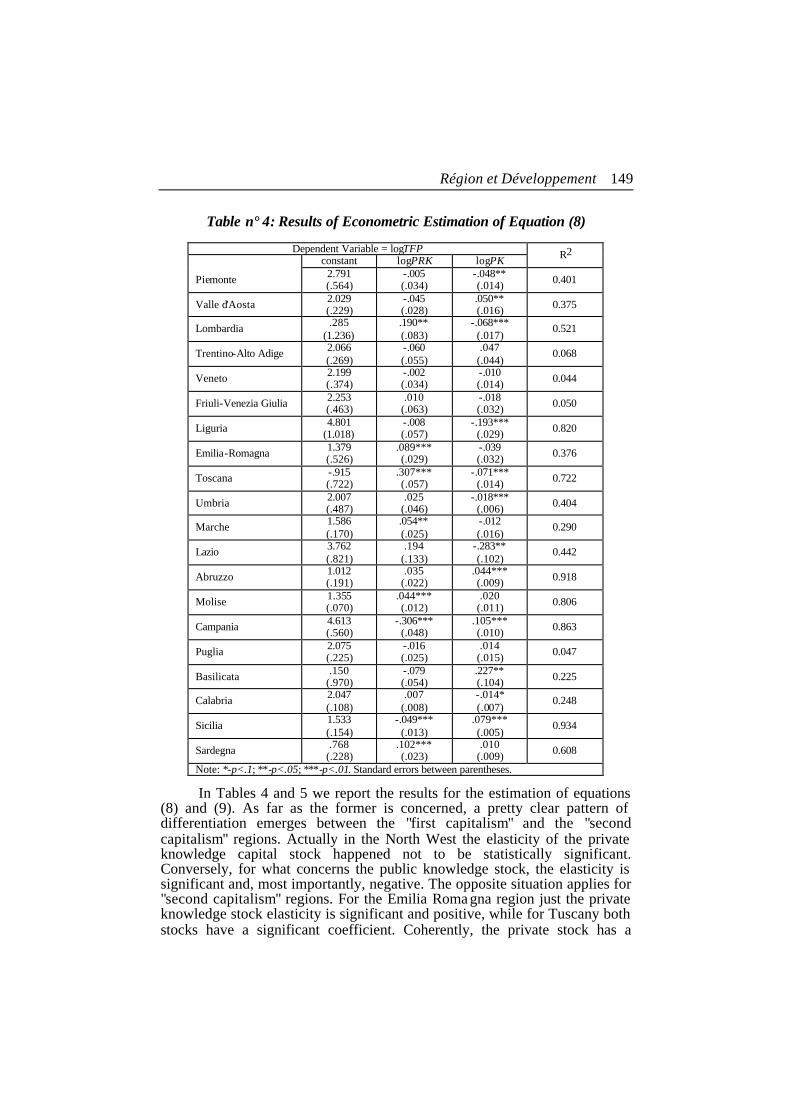
Table n° 4: Results of Econometric Estimation of Equation (8)
Dependent Variable = logTFP constant logPRK logPK R2
Piemonte 2.791 (.564)
-.005 (.034)
-.048** (.014) 0.401
Valle d'Aosta 2.029 (.229)
-.045 (.028)
.050** (.016) 0.375
Lombardia .285 (1.236)
.190** (.083)
-.068*** (.017)
0.521
Trentino-Alto Adige 2.066 (.269)
-.060 (.055)
.047 (.044)
0.068
Veneto 2.199 (.374)
-.002 (.034)
-.010 (.014) 0.044
Friuli-Venezia Giulia 2.253 (.463)
.010 (.063)
-.018 (.032) 0.050
Liguria 4.801 (1.018)
-.008 (.057)
-.193*** (.029) 0.820
Emilia-Romagna 1.379 (.526)
.089*** (.029)
-.039 (.032) 0.376
Toscana -.915 (.722)
.307*** (.057)
-.071*** (.014) 0.722
Umbria 2.007 (.487)
.025 (.046)
-.018*** (.006) 0.404
Marche 1.586 (.170)
.054** (.025)
-.012 (.016)
0.290
Lazio 3.762 (.821)
.194 (.133)
-.283** (.102)
0.442
Abruzzo 1.012 (.191)
.035 (.022)
.044*** (.009) 0.918
Molise 1.355 (.070)
.044*** (.012)
.020 (.011) 0.806
Campania 4.613 (.560)
-.306*** (.048)
.105*** (.010) 0.863
Puglia 2.075 (.225)
-.016 (.025)
.014 (.015) 0.047
Basilicata .150 (.970)
-.079 (.054)
.227** (.104) 0.225
Calabria 2.047 (.108)
.007 (.008)
-.014* (.007)
0.248
Sicilia 1.533 (.154)
-.049*** (.013)
.079*** (.005)
0.934
Sardegna .768 (.228)
.102*** (.023)
.010 (.009) 0.608
Note: *-p<.1; **-p<.05; ***-p<.01. Standard errors between parentheses.
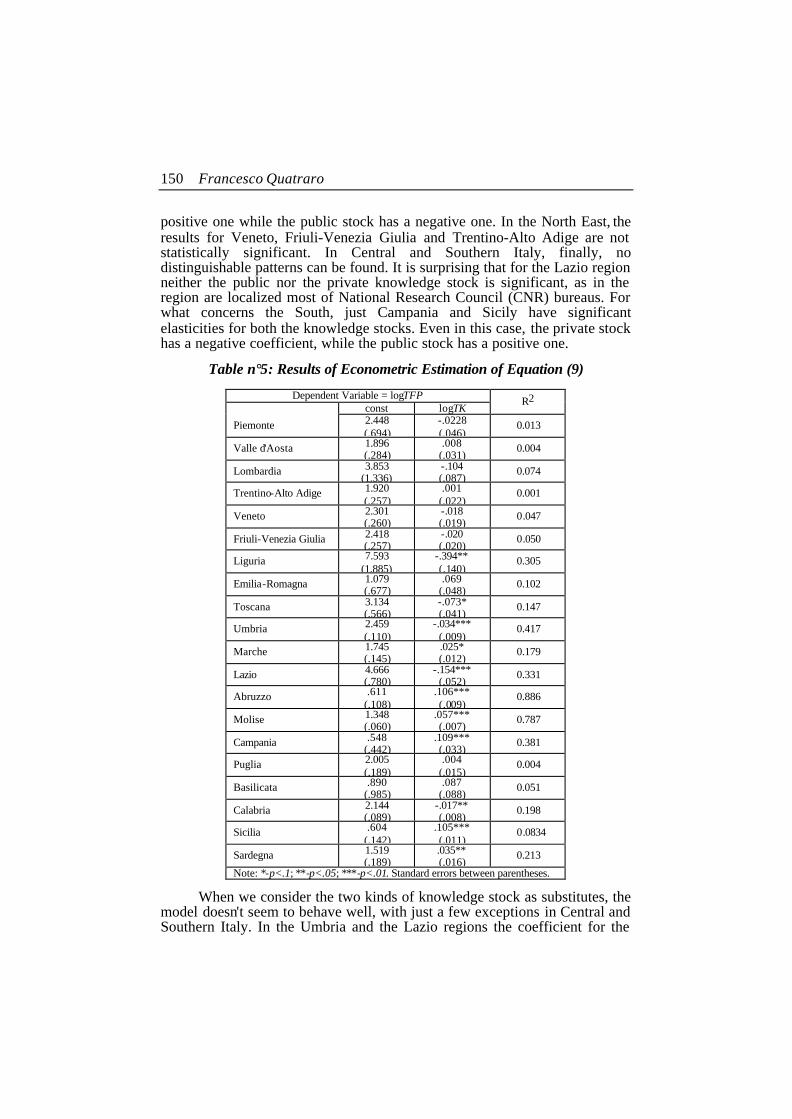
In Tables 4 and 5 we report the results for the estimation of equations (8) and (9). As far as the former is concerned, a pretty clear pattern of differentiation emerges between the "first capitalism" and the "second capitalism" regions. Actually in the North West the elasticity of the private knowledge capital stock happened not to be statistically significant. Conversely, for what concerns the public knowledge stock, the elasticity is significant and, most importantly, negative. The opposite situation applies for "second capitalism" regions. For the Emilia Roma gna region just the private knowledge stock elasticity is significant and positive, while for Tuscany both stocks have a significant coefficient. Coherently, the private stock has a
150 Francesco Quatraro
positive one while the public stock has a negative one. In the North East, the results for Veneto, Friuli-Venezia Giulia and Trentino-Alto Adige are not statistically significant. In Central and Southern Italy, finally, no distinguishable patterns can be found. It is surprising that for the Lazio region neither the public nor the private knowledge stock is significant, as in the region are localized most of National Research Council (CNR) bureaus. For what concerns the South, just Campania and Sicily have significant elasticities for both the knowledge stocks. Even in this case, the private stock has a negative coefficient, while the public stock has a positive one.
Table n°5: Results of Econometric Estimation of Equation (9)
Dependent Variable = logTFP const logTK
R2
Piemonte 2.448 (.694)
-.0228 (.046)
0.013
Valle d'Aosta 1.896 (.284)
.008 (.031)
0.004
Lombardia 3.853 (1.336)
-.104 (.087)
0.074
Trentino-Alto Adige 1.920 (.257)
.001 (.022)
0.001
Veneto 2.301 (.260)
-.018 (.019)
0.047
Friuli-Venezia Giulia 2.418 (.257)
-.020 (.020)
0.050
Liguria 7.593 (1.885)
-.394** (.140)
0.305
Emilia-Romagna 1.079 (.677)
.069 (.048)
0.102
Toscana 3.134 (.566)
-.073* (.041)
0.147
Umbria 2.459 (.110)
-.034*** (.009)
0.417
Marche 1.745 (.145)
.025* (.012)
0.179
Lazio 4.666 (.780)
-.154*** (.052)
0.331
Abruzzo .611 (.108)
.106*** (.009)
0.886
Molise 1.348 (.060)
.057*** (.007)
0.787
Campania .548 (.442)
.109*** (.033)
0.381
Puglia 2.005 (.189)
.004 (.015)
0.004
Basilicata .890 (.985)
.087 (.088)
0.051
Calabria 2.144 (.089)
-.017** (.008)
0.198
Sicilia .604 (.142)
.105*** (.011)
0.0834
Sardegna 1.519 (.189)
.035** (.016)
0.213
Note: *-p<.1; **-p<.05; ***-p<.01. Standard errors between parentheses.
When we consider the two kinds of knowledge stock as substitutes, the model doesn't seem to behave well, with just a few exceptions in Central and Southern Italy. In the Umbria and the Lazio regions the coefficient for the
Région et Développement 151
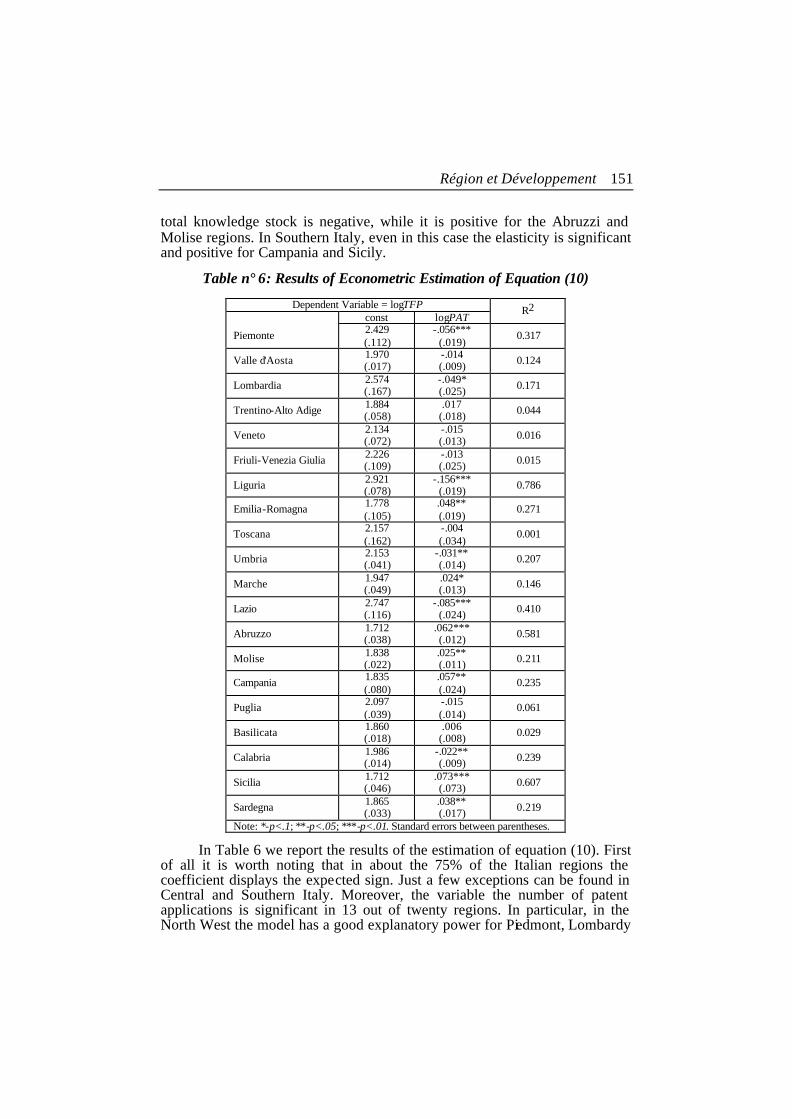
total knowledge stock is negative, while it is positive for the Abruzzi and Molise regions. In Southern Italy, even in this case the elasticity is significant and positive for Campania and Sicily.
Table n° 6: Results of Econometric Estimation of Equation (10)
Dependent Variable = logTFP const logPAT
R2
Piemonte 2.429 (.112)
-.056*** (.019)
0.317
Valle d'Aosta 1.970 (.017)
-.014 (.009) 0.124
Lombardia 2.574 (.167)
-.049* (.025) 0.171
Trentino-Alto Adige 1.884 (.058)
.017 (.018) 0.044
Veneto 2.134 (.072)
-.015 (.013) 0.016
Friuli-Venezia Giulia 2.226 (.109)
-.013 (.025) 0.015
Liguria 2.921 (.078)
-.156*** (.019) 0.786
Emilia-Romagna 1.778 (.105)
.048** (.019)
0.271
Toscana 2.157 (.162)
-.004 (.034)
0.001
Umbria 2.153 (.041)
-.031** (.014) 0.207
Marche 1.947 (.049)
.024* (.013) 0.146
Lazio 2.747 (.116)
-.085*** (.024) 0.410
Abruzzo 1.712 (.038)
.062*** (.012) 0.581
Molise 1.838 (.022)
.025** (.011) 0.211
Campania 1.835 (.080)
.057** (.024)
0.235
Puglia 2.097 (.039)
-.015 (.014)
0.061
Basilicata 1.860 (.018)
.006 (.008) 0.029
Calabria 1.986 (.014)
-.022** (.009) 0.239
Sicilia 1.712 (.046)
.073*** (.073) 0.607
Sardegna 1.865 (.033)
.038** (.017) 0.219
Note: *-p<.1; **-p<.05; ***-p<.01. Standard errors between parentheses.
In Table 6 we report the results of the estimation of equation (10). First of all it is worth noting that in about the 75% of the Italian regions the coefficient displays the expected sign. Just a few exceptions can be found in Central and Southern Italy. Moreover, the variable the number of patent applications is significant in 13 out of twenty regions. In particular, in the North West the model has a good explanatory power for Piedmont, Lombardy
152 Francesco Quatraro
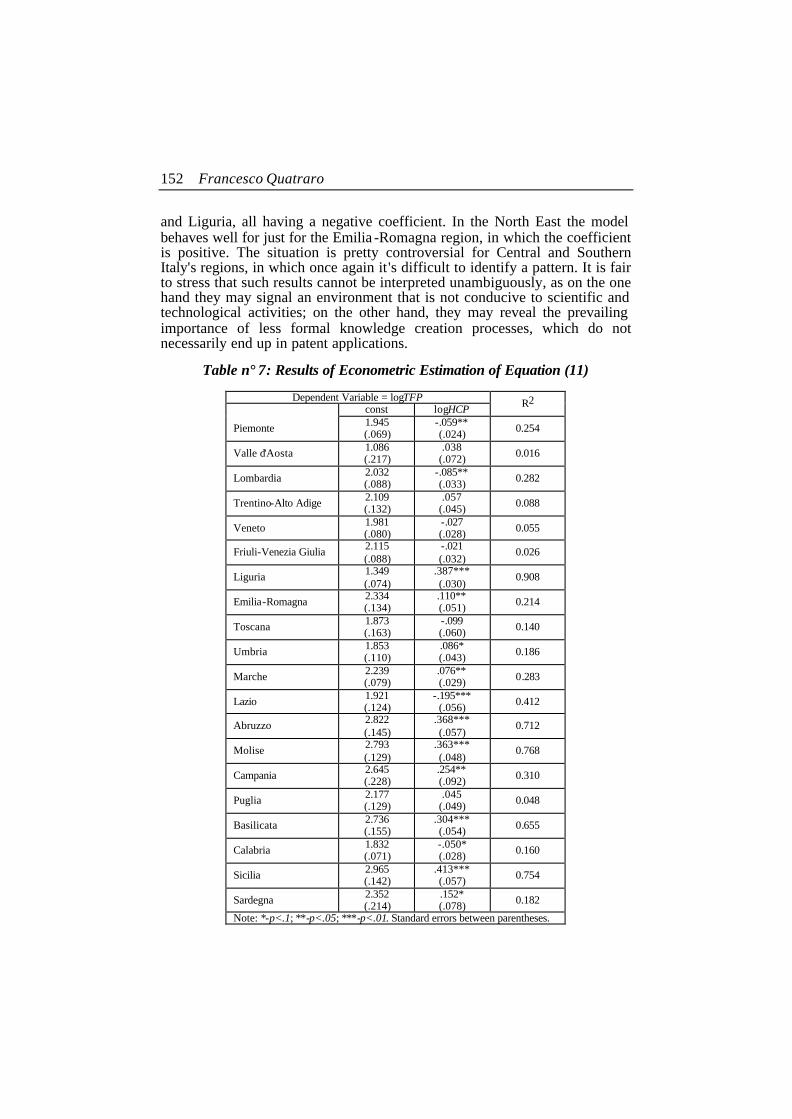
and Liguria, all having a negative coefficient. In the North East the model behaves well for just for the Emilia -Romagna region, in which the coefficient is positive. The situation is pretty controversial for Central and Southern Italy's regions, in which once again it's difficult to identify a pattern. It is fair to stress that such results cannot be interpreted unambiguously, as on the one hand they may signal an environment that is not conducive to scientific and technological activities; on the other hand, they may reveal the prevailing importance of less formal knowledge creation processes, which do not necessarily end up in patent applications.
Table n° 7: Results of Econometric Estimation of Equation (11)
Dependent Variable = logTFP const logHCP R2
Piemonte 1.945 (.069)
-.059** (.024) 0.254
Valle d'Aosta 1.086 (.217)
.038 (.072) 0.016
Lombardia 2.032 (.088)
-.085** (.033) 0.282
Trentino-Alto Adige 2.109 (.132)
.057 (.045) 0.088
Veneto 1.981 (.080)
-.027 (.028) 0.055
Friuli-Venezia Giulia 2.115 (.088)
-.021 (.032)
0.026
Liguria 1.349 (.074)
.387*** (.030)
0.908
Emilia-Romagna 2.334 (.134)
.110** (.051) 0.214
Toscana 1.873 (.163)
-.099 (.060) 0.140
Umbria 1.853 (.110)
.086* (.043) 0.186
Marche 2.239 (.079)
.076** (.029) 0.283
Lazio 1.921 (.124)
-.195*** (.056) 0.412
Abruzzo 2.822 (.145)
.368*** (.057)
0.712
Molise 2.793 (.129)
.363*** (.048)
0.768
Campania 2.645 (.228)
.254** (.092) 0.310
Puglia 2.177 (.129)
.045 (.049) 0.048
Basilicata 2.736 (.155)
.304*** (.054) 0.655
Calabria 1.832 (.071)
-.050* (.028) 0.160
Sicilia 2.965 (.142)
.413*** (.057) 0.754
Sardegna 2.352 (.214)
.152* (.078) 0.182
Note: *-p<.1; **-p<.05; ***-p<.01. Standard errors between parentheses.
Région et Développement 153
In view of this, it seems appropriate to investigate the impact of tacit knowledge on factor productivity. Human capital, conceived as skill levels and competences developed through learning, gains momentum. Table 7 shows the results of the econometric test for equation (11). In this case, too, we can find different patterns characterizing "first capitalism" and "second capitalism" regions. In particular, while the coefficient for Piedmont, Lombardy and Valle d'Aosta is not statistically significant, for Emilia Romagna, Tuscany and Veneto it is. It is worth stressing that in the two latter regions the coefficient is negative, while in Emilia Romagna it is positive. This controversial evidence can be found also looking at Central and Southern regions.
4. CONCLUSIONS
The evolution of the Italian economy after the World War II has been characterized by the presence of two different kinds of capitalisms. On the one hand there was the system based upon large firms, specialized in high capital intensive productions and strongly supported by Government actions. On the other hand in the 1970s a system characterized by a dispersed and fragmented entrepreneurial system emerged as a partial complement to the other. This "second capitalism" is then relatively young, mainly made of small and medium sized firms endowed with a strong propensity to networking.
At the turn of the 21st century the Italian economic system started facing a process of structural change with the same features as the one already faced by first United States and then the United Kingdom. This transition poses serious threats to Italian firms, because of the strong reliance on tacit knowledge and the lack of codified human capital able to cope with the digital technologies characterizing the service sectors.
The analysis carried out in this paper has shown that the situation in Italy was difficult in the late 1990s. TFP was falling and the investments in the factors crucial to a creative reaction, like R&D and qualified human capital, are not at satisfying levels. Changes in demand levels and in relative prices of production factors engender switching costs, which are reflected in the respective negative coefficients in the econometric tests. The period 1995-2001 has proved to be especially crucial in this framework. When the former signals of the transition towards a service economy emerged, in the footsteps of United States and United Kingdom, the national economy started being in deep trouble. The capacity of the system to adapt to this new context has proved to be weak, because of the low quality of human capital, the inadequacy of formal innovative efforts and hence the low rate of penetration of information and communication technologies. It is worth noting that in the same period there were still the effects of some elements pertaining to the previous economic situation5.
5 It seems that the financial effects of the devaluation within the Amato government in 1992 were particularly bad. Foreign investitors switched to other countries, determining the

154 Francesco Quatraro
The distinction between "first" and "second" capitalism proved to be useful to understanding the different patterns of reaction to the structural change, according to the specific areas under scrutiny. In particular, it seems that "first capitalism" regions have too low levels of codified human capital to effectively cope with the transition towards the digital economy. On the other hand "second capitalism" regions have weak scientific and technological infrastructures dedicated to formal R&D activities.
As a consequence, the policymakers should favor the actualization of dynamic coordination procedures, as the markets are not likely to adjust automatically to such sudden changes. The scientific and technological system ought to be the main target of policy measures. First, the rate and the direction of R&D expenditures need to be modified. In Italy the share of GDP devoted to R&D still is far less than in the other developed countries, and not very focused on crucial fields like biotechnology and digital technologies. In addition, the number of undergraduates in disciplines like engineering, chemistry, etc., is very low in comparison with the number of graduates in humanities. Increasing the number of undergraduates in high-tech fields would lower the relative cost of qualified human capital, feeding the virtuous cycle of TFP growth and diffusion of new technologies.
Finally, it is necessary to adapt the new technologies to the idiosyncratic features of the system, with a clear understanding of the path-dependency stemming from the specific way the system evolved in the different areas. The amount of resources dedicated to R&D activities should be increased, and the identification and design of feasible technological platforms ought to be enhanced, favouring the integration between the scientific and the production system.
5. METHODOLOGICAL APPENDIX
In calculating the TFP we follow the seminal contributions by Abramovitz (1956) and Solow (1957), and the following elaborations by Griliches (1979). Consider a standard Cobb-Douglas production function:
Y K Lβ γ= where as usual Y is the level of production, K is the level of capital and L the level of labour. We the define the Total Factor Productivity as:
γβ LKY
TFP =
while the growth rate of TFP is the following:
depreciation of the Italian "lira" with respect to other currencies, above all the Deutsche Mark. Even the situation in the Italian Stock Exchange is pretty bad, engendering an increase of both long and short run interest rates (for a more detailed analysis of this causal chain see Sylos Labini, 1995).

Région et Développement 155
LL
KK
YY
xy&&&
γβτ −−=−=
Of course this indicator has some problems, as it comprehends some elements that cannot be reduced to technological process, and moreover it is exposed to measurement errors. Solow himself argued he called "technical progress" whatever causes a shift in the production function, while Abramovitz used to say that the TFP is a measure of our ignorance. Nonetheless this indicator may be very useful to understanding the evolution of economic performances.
To calculate the TFP drawing upon national accounting data we assumed a constant returns to scale production function, undertaking the following steps:
Y K Lβ γ= 1=γ+β
'LY Y
PL L
γ∂
= =∂
Y wLw
L Yγ γ= ⇒ =
In this way we got the ?s for each region in each year. The output elasticity of capital is then easily calculated as a residual. In such a way we got a TFP for each region every year.
We used the data got from the National Bureau of Census (ISTAT). Specifically we calculated the output elasticities as follows:
AV
Income Total=γ and γ−=β 1
Finally, the capital stock is obtained by applying a lag operator to the
Gross Fixed Investments (I):
2t1ttt 0.4I0.8IIK −− ++= [ ]1980,2001t∈
In the same vein, we can assume a relationship exists between each stock of total knowledge and W(B)R, which is an index of the current and past expenditure in R&D. W(B) a lag polynomial expressing the contribution of the flow of R&D expenditure to the stock of knowledge. In formal terms:
( )[ ]?PRD,BWGPRK =
( )[ ]?GRD,BWHPK =
where ? is the term expressing non measurable influences, PRD the private R&D expenditure and GRD the public one. The lag polynomial takes the following form:

156 Francesco Quatraro
( ) ( ) ...... 221102
210 +++=+++= −− ttttt PRDwPRDwPRDwPRDBwBwwPRDBW
( ) ( ) ...... 221102
210 +++=+++= −− ttttt GRDwGRDwGRDwGRDBwBwwGRDBW
We need now to specify the characteristics of the lag operator. As it
seems it doesn't exist a first best in this cases (Griliches, 1979), we will apply a lag operator similar to that for the fixed capital stock:
1 20.8 0.4t t t tPRK PRD PRD PRD− −= + + [ ]2001,1980∈t
1 20.8 0.4t t t tPK GRD GRD GRD− −= + + [ ]2001,1980∈t
As far as the PAT variable is concerned, we used the data from the European Patent Office, about the number of patent applications in each region each year (classified by the EPO as "A1" stage). Finally the HCP variables is still obtained by using ISTAT data, as a ratio between people in labour force who got a "laurea" degree and the total labour force.
REFERENCES Abramovitz M., 1956, "Resources and Output Trends in the United States
since 1870", American Economic Review, 46, 5-23.
Amatori F. and Colli, A., 1999, Impresa ed Industria in Italia dall'Unità ad Oggi, Venezia, Marsilio.
Antonelli C., 1995, The Economics of Localised Technological Change and Industrial Dynamics, Boston, Kluwer Academic Press.
Antonelli C., 2003, The Economics of Innovation and Structural Change, London, Routledge.
Antonelli C. e Militello, G., 2000, Italia in Transizione: Ruolo dello Stato e dei Mercati, Roma, Ediesse.
Berta G., 2004, Metamorfosi. L'Industria Italiana fra Declino e Trasformazione, Milano, EGEA.
Fellner 1961, "Two Proposition in the Theory of Induced Innovation", Economic Journal, 71, 305-308.
Griliches Z., 1979, "Issues in Assessing the Contribution of Research and Development to Productivity Growth", The Bell Journal of Economics, 10 (1), 92-116.
Griliches Z., 1996, "The Discovery of the Residual: A Historical Note ", Journal of Economic Literature, 34, 1324-1330.
Hicks J.R., 1932, The Theory of Wages, London, Macmillan.
Région et Développement 157
Kennedy C., 1964, "Induced Bias in Innovation and the Theory of Distribution", Economic Journal, 74, 541-47.
Kaldor N., 1957, "A Model of Economic Growth", Economic Journal, 67, 591-624.
Mokyr J., 1990, "Punctuated Equilibria and Technological Progress", American Economic Review, 80, 350-54.
Nelson R.R., 1959, "The Economics of Invention: A Survey of the Literature", The Journal of Business, 32 (2), 101-127.
Rosenberg N., 1974, "Science, Invention and Economic Growth", The Economic Journal, 84, 90-108.
Schmookler J., 1954, "The Level of Inventive Activity", The Review of Economic and Statistics, 36 (2), 183-190.
Schmookler J., 1962, "Economic Sources of Inventive Activity", The Journal of Economic History, 22 (1), 1-20.
Schumpeter J.A., 1942, Capitalism, Socialism and Democracy, London, Unwin.
Solow R.M., 1957, "Technical Change and the Aggregate Production Function", The Review of Economics and Statistics, 39, 312-320.
Sylos Labini P., 1995, La Crisi Italiana, Roma and Bari, Laterza.
Smith A., 1776, 1991, The Wealth of Nations, New York, Prometheus Book.
Young A., 1928, "Increasing Returns and Economic Progress", Economic Journal, 38, 527-542.
CHANGEMENT TECHNOLOGIQUE ET CROISSANCE DE LA PRODUCTIVITÉ DANS LES RÉGIONS ITALIENNES (1982-2001) Résumé – L'article utilise des données agrégées portant sur 20 régions italiennes ayant trait à l'évolution de la productivité totale des facteurs (PTF) entre 1982 et 2001. Il tente d'établir des relations entre l'évolution de la PTF, le capital privé et le capital public de connaissances. Pour cela, des indicateurs concernant le capital humain et l'efficacité des activités d'innovation ont été élaborés. L'impact du progrès technique sur la croissance économique a été beaucoup étudié dans la littérature. En Italie dans la dernière décennie un débat a émergé concernant la transition vers une économie de services en dépit de la prégnance des activités manufacturières. La transition vers une économie de services est "managée" sous des formes différentes selon les modes de gouvernance. Les résultats des estimations économétriques confirment l'existence de différentes tendances d'évolution selon la façon dont les activités économiques sont organisées dans les 20 régions italiennes.
158 Francesco Quatraro
CAMBIO TECNOLÓGICO Y CRECIMIENTO DE LA PRODUCTIVIDAD EN LAS REGIONES
ITALIANAS, 1982 – 2001
Resumen – Este artículo reúne datos de las 20 regiones de Italia, sobre las dinámicas de la Productividad Total de los Factores (PTF) a lo largo de 20 años, luego busca la relación entre la variación de la evolución de la PTF y el nivel del capital intelectual, tanto privado como público, del capital humano y de las aplicaciones patentes. A lo largo de los últimos diez años ha surgido un debate creciente en Italia sobre la transición de la economía nacional hacia una especialización en los sectores del servicio, a pesar del despliegue continuo de las actividades de manufacturas. Se supone que la transición se maneja de distintas maneras, según los mecanismos distintos de gestión del trabajo en contextos distintos. La oposición entre una “primera organización capitalista” y una “segunda” nos da un marco útil para interpretar las dinámicas en marcha. Los resultados surgiendo de las pruebas econométricas confirman la existencia de distintas formas de evolución, llevadas por distintos tipos de factores, según la manera utilizada para organizar las actividades económicas en cada una de las veinte regiones.