technological innovation and productivity in service...
TRANSCRIPT
Technological Innovation and Productivity in Service Delivery:
Evidence from the Adoption of Electronic Medical Records
Rezwan Haque ∗
Harvard [email protected]
November 24, 2014
JOB MARKET PAPER
CLICK HERE FOR THE LATEST VERSION
Abstract
Information technology (IT) can improve productivity by simultaneously affecting op-erational efficiency for a given worker and the coordination of different workers. Iinvestigate IT adoption in a service setting by considering the impact of electronicmedical records (EMRs) on the length of stay and clinical outcomes of patients in UShospitals. To uncover the distinct impacts of EMRs on operational efficiency and carecoordination, I present evidence of heterogeneous effects by patient complexity. I findthat EMRs have the largest impact for relatively less complex patients. Admission toa hospital with an EMR is associated with a 2% reduction in length of stay and a 9%reduction in thirty-day mortality for such patients. In contrast, there is no statisticallysignificant benefit for more complex patients. However, I present three additional re-sults for complex cases. First, patients returning to the same hospital benefit relativeto those who previously went to a different hospital, which could be due to easier accessto past electronic records. Second, computerized order entry is associated with higherbilled charges. Finally, hospitals that have a high share of publicly insured patients,and hence a bigger incentive to curb resource use, achieve a greater reduction in lengthof stay for complex patients after EMR adoption.
∗I am deeply grateful to my advisers David Cutler, Robert Huckman, and Oliver Hart for their invaluableguidance and encouragement. I also benefited from helpful discussions with Leila Agha, David Autor, DavidBlumenthal, Ryan Buell, Dave Chan, Raj Chetty, Seth Freedman, Joel Goh, Shane Greenstein, NathanHendren, Bapu Jena, Larry Katz, Jeff McCullough, Arun Mohan, Frank Schilbach, Benjamin Schoefer, MarkShepard, Ariel Stern, Alexander Turchin, and John Van Reenen as well as participants at the Labor/PFLunch, the Organizational Economics Lunch, the Public Economics Seminar, and the Health Care PolicySeminar at Harvard. I thank Jean Roth at NBER for helping to obtain and manage the data.
1 Introduction
Economists have long been interested in the link between technological innovation and pro-
ductivity growth (Solow, 1957; Griliches, 1979). Recently, many have attributed the pro-
ductivity surge at the end of the 20th century to the widespread adoption of information
technology (IT) and the subsequent reorganization of business practices (Brynjolfsson and
Saunders, 2010).1 When investment in IT accelerated in the 1990s, it transformed many
service industries such as retail, travel and banking, by reducing the costs of processing
information and coordinating production (Brynjolfsson and Hitt, 2003; Stiroh, 2002).
Relative to the rest of the service sector, the health care industry has lagged behind in
IT adoption and productivity growth. But that may be changing. The HITECH Act, which
was passed as part of the stimulus package in 2009, provided up to $30 billion in subsidies
to eligible hospitals and physicians for the meaningful use of certified electronic medical
records (EMRs). Hospital adoption of EMRs has increased more than five-fold since 2008,
and the majority of US hospitals now have EMRs.2 In this paper, I investigate how the
rapid diffusion of IT has affected productivity in the health care sector.
IT can have several distinct effects on productivity. First, it helps to expedite many
tasks, which leads to greater operational efficiency. This channel is especially important for
simple transactions consisting mainly of routine, rules-based tasks that can be easily done
by computers (Autor et al., 2003). Second, IT increases the amount of information that is
available to a worker, which can either help with decision-making or increase the cognitive
burden on the worker.3 This channel is especially important for complex transactions that
involve a large volume of information. Finally, IT helps to coordinate complex transactions
by lowering communication costs (Bloom et al., 2009). There are two aspects to such coordi-
nation: coordination at a point in time between different service providers and coordination
1US labor productivity growth, which averaged just 1.4% per year between 1973 and 1995, increased to2.6% per year in 1996-2000, and rose even further to 3.6% in 2001-2003.
2<http://www.healthit.gov/sites/default/files/oncdatabrief16.pdf >3Kesselheim et al. (2011); Singh et al. (2013); Gino (2013)
1
over time by virtue of storing data from previous encounters.4 These channels suggest that
IT could have different effects on different types of patients in a health care setting.
To understand how IT affects productivity in hospitals empirically, I consider hetero-
geneous impacts by patient complexity. The bulk of this paper is an empirical analysis of
how EMRs have affected patient outcomes in US hospitals. I merge detailed patient-level
data from Medicare beneficiaries with a new dataset on the adoption of EMRs, the Amer-
ican Hospital Association Health IT Supplement, that is closely tied to the meaningful use
criteria proposed in the HITECH Act. Taking advantage of the rapid uptake of EMRs fol-
lowing the HITECH Act, I employ a difference-in-difference research design to explore the
impact of EMRs on patient-level outcomes for four diseases typically studied in the litera-
ture: pneumonia, congestive heart failure (CHF), heart attack, and hip fracture. I measure
complexity in two different ways: whether patients have a high number of secondary diag-
noses, and whether they have been admitted to a hospital in the year preceding their current
admission.
I find that EMRs have the largest impact on less complex patients. For pneumonia or
CHF patients with a low number of secondary diagnoses, going to a hospital with an EMR
is associated with a 2% reduction in length of stay and a 9% reduction in mortality. This
result fits the notion that computers can help with routine tasks. In hospitals, all transactions
involve some routine tasks such as ordering medications or transferring lab results from one
department to another. However, improving the efficiency of these tasks is more likely to
have a marginal impact on productivity for less complex patients. In contrast to my results
for less complex patients, I find that more complex cases do not appear to benefit from
EMR adoption. There are several potential explanations for this result. A purely logistical
barrier, such as delays or errors in ordering medications, is less likely to be the bottleneck in
such cases; there is a greater need for customization and workarounds; and there is a higher
scope for information overload for clinicians. It is possible that as more EMRs become
4In addition to these permanent effects of IT, there might also be a temporary productivity loss fromlearning how to use new IT, which should become smaller over time.
2
interoperable across hospitals and physician practices over the next few years, the benefits
to more complex patients will increase.
Due to the various mechanisms via which EMRs might affect outcomes for more complex
patients, I investigate such cases in more detail through an additional set of empirical tests.
With regard to coordination over time, I find that EMRs are associated with lower lengths of
stay and improved quality outcomes for patients who had been admitted to the same hospital
in the twelve months preceding the current admission. Information about these patients is
likely to be stored in the hospital’s electronic system, which clinicians can access during the
current visit. I also show that EMR systems that include computerized order entry (CPOE)
lead to higher billed charges at the hospital for more complex patients. CPOE reduces the
cost of ordering additional lab and radiology tests, and therefore doctors are more likely
to order such tests. However, this effect is diminished for patients who have been to the
same hospital before, possibly because some important information is already stored in their
EMR. I also find that hospitals that have a high share of publicly insured patients achieve
a greater reduction in length of stay for more complex patients when they have IT systems.
Such hospitals have a bigger incentive to leverage EMRs for curbing resource use because
public insurance programs pay relatively low rates to hospitals. Moreover, the HITECH Act
proposed penalties that are calculated as a percentage of Medicare payments if hospitals do
not demonstrate the meaningful use of EMRs by 2016.
This paper is related to several literatures. Studies of the impact of technology on
productivity have documented that the gains from IT rely on organizational and labor com-
plementarities (Bloom et al., 2012; Bresnahan et al., 2002; Brynjolfsson and Hitt, 2003).
Dranove et al. (2012) show that such complementarities are also important in the specific
case of health IT. Buntin et al. (2011) provide a comprehensive review of many studies in
the health services literature that document evidence of positive impacts of health IT; in
contrast to these studies, many of which are small scale or cross-sectional, some recent papers
find smaller impacts of EMRs at the hospital level. Using longitudinal data, McCullough
3
et al. (2010) and Agha (2014) show that IT has little or no impact on average hospital qual-
ity. Miller and Tucker (2011) find that increased health IT penetration at the county-level
is associated with a small decline in infant mortality rates. I am able to conduct a more
detailed empirical analysis at the patient level to uncover evidence of heterogeneous impacts.
Therefore, this paper builds upon and complements recent studies that have looked at the
effects of EMRs on patient-level outcomes. McCullough et al. (2013) show that health IT
improves quality by facilitating coordination and communication across providers, which
leads to relatively high benefits among high-risk patients. On the other hand, Freedman
et al. (2014) find that EMRs with clinical decision support are effective at reducing certain
adverse events for less complicated cases.
One advantage of this study relative to the literature is that I look at the time period since
2008. Most studies on health IT consider an earlier time period when information systems
were not very advanced and only the most innovative hospitals had fully implemented EMRs.
Furthermore, I propose a conceptual framework for the effects of IT adoption on operational
efficiency and care coordination, which leads to empirical tests to distinguish between the
differing roles of IT in service delivery organizations. I also provide evidence of specific
scenarios in which EMRs can help improve health care outcomes, such as the case of repeat
patients, and scenarios in which EMRs can lead to more resource use, such as the case of
computerized order entry.
The rest of this paper is structured as follows. Section 2 lays out the conceptual frame-
work in more detail and derives a set of testable hypotheses. Section 3 provides background
on EMRs and their adoption in US hospitals. Section 4 presents some case studies demon-
strating the effects of EMR adoption. Section 5 outlines the empirical strategy and describes
the data. Section 6 presents the main results in the paper. Section 7 discusses if EMRs are
worth the cost, both from the perspective of society and of a hospital. Section 8 concludes.
4
2 Conceptual Framework and Hypothesis Development
To direct the empirical analysis, I develop a simple model of how IT might affect service
delivery in a hospital setting. The key feature of the model is the simultaneous consideration
of task execution and information management. This framework yields several hypotheses
about how IT affects productivity based on properties of the interaction such as its complex-
ity and its frequency. In this section, I focus on the intuition of the model and the mapping
from theory to empirical tests.
An example will help to illustrate the key ideas in this framework. Consider a patient
who arrives at the emergency department with chest pain and shortness of breath. He might
be diagnosed with a heart attack, necessitating the immediate initiation of well-established
treatment protocols such as thrombolytic therapy and catheterization.5 His condition could
also turn out to be an exacerbation of congestive heart failure (CHF), necessitating hospital
admission for medical observation and management. In the case of heart attack, which
requires immediate intervention, there may not be much time to interact with the IT system.
In the case of CHF, several steps have to be taken that the EMR could make more efficient.
The EMR can instantaneously transmit the initial history taken by the ED doctor to the
clinical team in the medical ward, who can start preparing without waiting for the paper
folder to arrive. Moreover, the EMR enables parallel processing, allowing any member of
the team to access the patient’s information simultaneously regardless of their location in
the hospital. Nurses who follow through with the doctor’s instructions would not have to
deal with illegible handwriting. These features could speed up the care process and reduce
the probability of adverse events due to medical errors. The EMR might also address the
additional needs of particularly complex patients. If the patient has multiple conditions,
specialists from different medical departments can view each other’s notes on the EMR
before proceeding with treatment. If the patient had been to the same hospital before,
5Thrombolytic therapy involves the injection of clot-busting drugs, whereas catheterization entails insert-ing a catheter with a tiny balloon that blows up to clear the blocked blood vessel.
5
clinicians can look up past notes on the EMR.
In light of this context, I present a more general framework, which could be applicable
in any service setting. In a large firm, it is useful to divide activities between managing and
doing, where managing is figuring out what to do in contrast to doing it (Radner, 1992).
Given the information-intensive nature of health care, clinicians spend a substantial amount
of time on such management. Therefore, I follow Radner (1992) and assume that there are
two broad sets of tasks that health care providers need to be accomplish once a patient
arrives at the hospital. First, there is a pre-established workflow that has to be carried out,
and second, there is a body of information that has to be managed. I call the first set of
activities task execution and the second set of activities information management.
Let the amount of work that has to be done for task execution be L. The time required
for each unit of work is t. Therefore, the total time required for task execution is tL. Such
tasks might include medication administration and the transmission of patient information
such as lab results from one department of the hospital to another.
At the same time, in order to figure out what to do, clinicians need to process a certain
volume of information, V , about the interaction. In addition to managing information,
doctors have to communicate with each other and nurses have to communicate with doctors
to figure out how exactly to take care of the patient. Let C be the cost of coordinating
different employees.6 The time required for information management, M , is a function of
the volume of information and the cost of coordinating different employees and is increasing
in both these variables:
M = f(V,C).
To simplify the analysis, I assume that the two activities, task execution and information
management, take place simultaneously such that whichever activity requires more time acts
as the bottleneck for healthcare production. The total time, T , required for production is
6For the purpose of this analysis, I assume that C is a fixed cost of communication across workers thatis independent of V .
6

then given by:
T = max{tL,M}
Given this set-up, what is the impact of IT in a hospital? First, EMRs have the potential
to improve workflow and reduce the time required to perform each task:
∂t
∂IT< 0
There are many examples of improved operational efficiency. For instance, EMRs enable
the parallel processing of information, allowing all members of the clinical team to simulta-
neously view the patient’s record. Ancillary departments such as pathology and radiology
can instantaneously transfer test results to attending physicians. Clinical decision support
provides timely reminders for tasks such as medication administration and replacement of
intravenous lines.
While features such as clinical decision support could also make management easier by
reminding the physician of established guidelines, the effect on managerial efficiency is am-
biguous since EMRs increase the amount of information about each case.
∂V
∂IT> 0
The EMR might display an excessive amount of information to the clinician, which results
in information overload.7 Part of this disruption is temporary. Over time, we should see im-
provements in poorly designed software that cannot synthesize clinical information smartly.
However, part of this effect is permanent: more information is acquired because the cost of
acquiring information has gone down. Clinicians can ask for more diagnostics at low time
cost and hassle.
I also incorporate the fact that IT lowers communication costs,8 which solves two compo-
7The idea that the limited bandwidth could lead to cognitive overload is well documented in the man-agement and economics literature (Gino, 2013; Mullainathan and Shafir, 2013).
8Communication technologies embedded in IT systems can have large effects on firms (Garicano, 2000;
7
nents of coordination failure. First, IT could lower the coordination cost among workers by
enabling faster communication channels between employees. Specialists who are consulted
can read the patient’s history on the EMR without having to get in touch with the primary
team members who may not be immediately available. Second, IT could lower the coordi-
nation cost over time by facilitating storage and retrieval of information about a patient,
making future encounters easier to manage.
∂C
∂IT< 0
Thus, improvements in IT can simultaneously affect V and C, albeit in different direc-
tions. Whether M increases or decreases as a result of investment in IT depends on which
effect dominates. If the greater information management requirements outweigh the benefits
from easier coordination, we will see an increase in M . On the other hand, if the benefits
from coordination are bigger than the costs of managing more information, we will see a
decrease in M .
The above analysis suggests that IT could have different effects on different types of pa-
tients. Some cases are relatively standard and already have protocols in place that clinicians
are required to follow. A patient coming into the emergency department with a heart attack
is one such example. Clear protocols exist for such cases and they are typically executed
without IT. Even if such protocols are not always followed, IT might not help with manage-
ment because, due to the emergent nature of these events, there is often no time to interact
with the IT systems in place at the hospital. The priority is to stabilize the patient and
efficient production entails bypassing the information systems.
On the other hand, when chronic medical conditions lead to hospitalization, they are
often less standardized and there is scope to interact with IT systems during the course of
treatment. A technology that lowers the time required to execute certain tasks can make
such interactions more efficient. In particular, Autor et al. (2003) find that IT substituted for
Bloom et al., 2009).
8
labor involving rules-based tasks and complemented labor involving complex communications
and decision making. Task execution becomes easier for all types of interactions. However,
less complex interactions that consist mainly of such rules-based tasks will benefit relatively
more. Since such tasks constitute the major component of less complex interactions, delays
in executing them are likely to be the bottleneck.
The benefits of improved operational efficiency might be less relevant for more complex
interactions. Such cases often require input from various service providers. The delay in
executing rules-based tasks, which IT can alleviate, is not the bottleneck. Rather, the
time required for information management is the bottleneck. To the extent that IT makes
information management more difficult, it could even slow down more complex transactions.
Such complex activities might require enough customization to the specific needs of the
patient that a one-size-fits-all technology designed to improve workflow might actually get
in the way.9 Moreover, to the extent that EMRs display an excessive amount of information,
there could also be information overload for physicians.10 On the other hand, since IT helps
to lower coordination costs, it may make complex tasks easier by facilitating communication
across multiple providers.11 Whether IT helps with information management and hence
with complex cases depends on whether the benefit of easier coordination dominates the
disruptiveness of information overload for such interactions. The matrix below and the
accompanying hypothesis summarizes the preceding discussion.
Non-Standard Cases Standard Cases
Less Complex Patients Benefits No Effects
More Complex Patients Ambiguous Effects Ambiguous Effects
9Bartel et al. (2007), using unique data on IT investments in valve-making plants, find that IT leads tolower setup times, which increases the efficiency and lowers the cost of customized production. However,when an IT system is already in place and has to cater to a variety of different activities, it is hard tocustomize and more workarounds are involved.
10The medical literature has warned about too many notifications leading to alert fatigue among clinicians(Kesselheim et al., 2011; Singh et al., 2013).
11McCullough et al. (2013) point out that health IT may be particularly important for care coordinationin complex patients who require consultation from multiple specialists.
9
Hypothesis 1. IT has a larger impact for non-standard cases than for standard conditions
with clear existing protocols. Among such non-standard cases, IT increases productive effi-
ciency for less complex patients but has an ambiguous impact on more complex patients.
There are several different mechanisms operating at the same time for more complex
patients, which makes it unclear what the net effect for these patients should be. I therefore
explore the impact of EMRs on these types of patients in more detail. One situation in
which we would expect IT to help with more complex cases is if there is a substantial history
that is involved in the interaction. Relative to complex transactions for first-time patients,
IT should help with such transactions for repeat patients, because it makes coordination
over time easier. For patients who are repeatedly admitted to the same hospital, EMRs
can help to store data from previous visits in a readily accessible format. For instance, if
the patient has an allergy to the most commonly prescribed medication for his condition,
this information will show up on the EMR, leading the doctor to prescribe an alternative
drug. This feature helps to avoid potential complications from an allergy that could force
the patient to stay longer at the hospital or pose health risks for him. On the other hand, if
the patient had been to a different hospital before, his previous information would need to
be transferred by fax or in some other way.
Hypothesis 2. EMRs have a larger positive impact on clinical outcomes for patients who
have been previously admitted to the same hospital.
In addition to having a potentially lengthy medical history, complex patients might also
be candidates for multiple medical tests for any given episode of care. Certain technologies
embedded in EMRs, such as computerized provider order entry (CPOE), can reduce the
physician’s effort cost of acquiring more information about the patient. Since CPOE makes
it easy for clinicians to ask for more diagnostics to be performed, it could lead to additional
services being ordered at the hospital. Typically, there is greater discretion for doctors to
order more tests for the most complicated cases, and so we would expect to see this phe-
nomenon for relatively complex patients. Such additional testing could lead to information
10
overload, and this effect will not disappear over time, in contrast to information overload
due to technological constraints, such as poorly designed software, that should improve over
time.
Hypothesis 3. Computerized provider order entry can result in more information gathering
activities, leading to higher resource use at the hospital for complex patients.
So far, I have considered heterogeneous impacts of EMRs based on patient complexity,
and discussed the distinct channels for more complex patients. However, EMRs could also
have different impacts based on characteristics of the adopting hospitals. For instance, one
would also expect to see benefits for complex patients if certain organizational features make
it easier to leverage information technology for coordination. There is a large literature
showing that the gains from information technology depend upon both organizational and
labor complementarities (Bresnahan et al., 2002).12 In healthcare, there are several sources
of such complementarity at the organizational level. I specifically explore whether the type of
health insurance carried by the majority of patients modifies the impact of EMRs on complex
cases. Public insurance programs, including Medicare and Medicaid, pay low rates to hos-
pitals relative to private insurers. Hospitals with a large share of publicly insured patients,
therefore, have a greater incentive to leverage EMRs for curbing resource use. Moreover, the
HITECH Act proposed penalties that are calculated as a percentage of Medicare payments,
if hospitals do not demonstrate the meaningful use of electronic health records by 2016.
Hypothesis 4. Hospitals with a high share of publicly insured patients are more likely to
leverage IT to help with coordination.
12For instance, Bloom et al. (2012) find that the US-based firms operating in the UK earned higher returnsfrom IT investments than non-US based firms. These high returns are a consequence of US firms’ internalorganizational structures that complemented IT investments. Dranove et al. (2012) show that even thoughEMR adoption is associated with an initial increase in costs, hospitals in favorable locations with access tocomplementary inputs are able to lower their costs after three years
11
3 Background on the Adoption of EMRs
In order to investigate the impact of IT in the health care sector, I consider the specific
example of the adoption of electronic medical records (EMRs) by hospitals. The transition
to IT has been gradual in health care for several reasons. There have been few incentives,
the reimbursement model does not reward process innovation, and liability is a very big
consideration. However, EMRs have diffused rapidly over the time period in our study. As
Figure 1 shows, less than 10% of U.S. hospitals had a basic EMR in 2008. This number is
close to 60% by 2013. Table 1 defines a basic and comprehensive EMR. An EMR has four
functionalities. The first is storing information about the patient, including patient demo-
graphics, physician notes, problem lists and medication lists. All EMR systems should have
this information. The second functionality is storing results such as lab reports, radiology
reports and diagnostic test results. Advanced EMRs can also store images. The third func-
tionality is computerized provider order entry (CPOE), which allows physicians to order lab
tests, radiology tests, medications and consultations electronically. CPOE prevents the ful-
fillment of prescriptions that do not meet dosage requirements. The last category is clinical
decision support (CDS), which provides clinical guidance, reminders, and various kinds of
interaction alerts such as drug-drug interactions and drug-allergy interactions. For instance,
CDS systems alert nurses when it is time to remove or replace a central line, reducing the
risk of central line-associated bloodstream infections, a common hospital-acquired condition.
If EMRs are so helpful, why has adoption lagged behind? Providers typically cite the
prohibitive cost of health IT as the key barrier to adoption. A complete EMR costs about
$20 million in addition to annual operating costs of about $3 million (Laflamme et al., 2010).
There are several components to adopting a new EMR system: the initial fixed cost of the
hardware, software, and technical assistance necessary to install the system; licensing fees;
the expense of maintaining the system; and the opportunity cost of the time that health care
providers could have spent seeing patients but instead must devote to learning how to use the
new system and how to adjust their work practices accordingly (Orszag, 2008). Moreover, the
12
kind of quality improvement delivered by EMRs does not lead to financial benefits because
payers do not generally reimburse providers more for using EMRs and because patients or
doctors rarely choose hospitals based on their EMR system (Cutler, 2014).
Over the last few years, there have been several policy changes that make this a particu-
larly interesting time to study EMRs. The Health Information Technology for Economic and
Clinical Health (HITECH) Act of 2009 authorized nearly $30 billion to increase the adop-
tion of electronic health record systems, with much of this money in the form of incentive
payments to hospitals and eligible providers for meeting specific meaningful use. Hospitals
have until the end of 2015 to deploy certified electronic health records or face fines starting
at $2,000 a bed in the first year and up to $35,000 a bed by 2019 (Laflamme et al., 2010).
There have been other relevant policy changes. The Affordable Care Act has promoted the
formation of Accountable Care Organizations (ACOs), groups of doctors and hospitals who
coordinate with each to provide care. More integrated providers such as ACOs could increase
the scope for IT use. There has also been a move from volume-based payment to value-based
payment. These complementary changes could also facilitate IT use in organizations that
do adopt EMRs.
13
4 Case Studies of Organizations with EMRs
Many early adopters of EMRs have seen positive results. In 1996, Maimonides Medical Cen-
ter (MMC), a 705-bed tertiary hospital located in Brooklyn, New York, allocated resources
for the adoption of the Maimonides Access Clinical System EHR, which transformed the
delivery of health care at MMC (Daurio et al., 2009). MMC saw a 68% decrease in med-
ication processing time, a 55% decrease in medication discrepancies, and a 58% reduction
in problem medication orders. Duplication of ancillary orders decreased by 20% overall,
including a 48% reduction in duplicate laboratory diagnostic tests. Accessibility of clinical
data improved time of diagnosis and treatment, contributing to a 30.4% reduction in the
average length of a patient’s hospital stay.
Sentara Healthcare, a not-for-profit health care organization serving more than 2 million
people in Virginia and North Carolina, implemented an EHR project over a five-year period
after signing a contract with Epic in 2005. 13 The adoption of the EMR resulted in workflow
improvements at the hospital. For instance, CPOE significantly reduced turn around time
for order processing and patient care delivery. The average time for administration of a
medication dose after order creation decreased from approximately 90 minutes to 30 minutes
or less. Furthermore, the EMR resulted in improved adherence to process-of-care guidelines.
From 2009 to 2010, the percentage of patients with angioplasty within 90 minutes of arrival
increased from 78% to 90% and the percentage of outpatient surgery patients who had
antibiotics started within 60 minutes of incision increased from 84% to 92%.
Patients with specific conditions such as congestive heart failure saw improvements in
many settings after EMR adoption. Elderly patients are often vulnerable to the develop-
ment of deep vein thrombosis (DVT) and pulmonary embolism as a result of hospitalization.14
Despite published guidelines for the prevention of DVT, physicians often underutilize pre-
13Source: Epic Systems Corporation. Appendix D contains further details.14DVT is a blood clot that forms in a vein deep in the body, usually in the lower leg or thigh. This blood
clot can break off and travel through the bloodstream to an artery in the lungs where it blocks blood flow,resulting in a very serious condition called pulmonary embolism, which can damage the lungs and otherorgans and lead to death
14
ventive treatment (prophylaxis). Brigham and Women’s Hospital introduced an alert-based
computerized decision support strategy and evaluated the impact on prophylaxis use and the
subsequent 90-day incidence of symptomatic DVT in high-risk hospitalized patients (Piazza
and Goldhaber, 2009). Electronic alerts more than doubled the rate of DVT prophylaxis
orders from 14.5% to 33.5% compared with the control group and decreased the risk of symp-
tomatic DVT by 41%. When physicians and pharmacists in Kaiser Permanente Colorado
developed an electronic critical drug interaction alert program (CDIX), electronic screen-
ing was coupled with active intervention to prevent dispensing of critically interacting drug
combinations. Following CDIX implementation, the overall rate of co-dispensing dropped
by 31% from 21.3 to 14.7 per 10, 000 prescriptions, based on monthly electronic pharmacy
data (Humphries et al., 2007).
Despite the success stories, the response to EMRs has not been unanimously positive
among early adopters. Many physicians complain that EMRs actually increase the amount
of time they have to spend documenting actions and detract from taking care of patients
(CJ et al., 2014). This problem can be particular severe for more complex cases where there
is a large amount of medical history. For instance, one doctor described trying to look for
information in an electronic record as follows, “...it’s like getting a big box full of packaging
material, and there’s a thumb drive in it.”15 Functionalities such as CPOE have also been
known to facilitate medical errors (Koppel et al., 2005; Han et al., 2005). Some of these
drawbacks are due to poorly designed software and should disappear with time, but some of
the problems could also persist over time. In order to systemically understand when EMRs
are most useful and when they can be potential harmful, I next move to an empirical analysis
of the effects of EMR adoption around the time of the passage of the HITECH Act.
15<http://www.npr.org/blogs/health/2014/11/07/361148976/electronic-medical-records-built-for-efficiency-often-backfire?sc=tw>
15
5 Empirical Strategy
5.1 Data
In order to investigate the effect of EMR adoption on health care outcomes, I combine de-
tailed hospital-level data on the adoption of electronic medical records with detailed hospital
and patient level information from 2008 to 2011. I use data on the adoption of electronic
medical records from the AHA Health IT Supplement. This survey has been conducted as
a supplement to the AHA annual survey since 2008 and asks detailed questions about EMR
adoption so that we know whether a hospital has each of the twenty-four functionalities
listed in Table 1. A major advantage of this dataset is that there is a strong correlation
between the measured EMR functions and the meaningful use criteria outlined in regula-
tions that followed the HITECH Act. From the AHA Annual Survey, I obtain data on
hospital characteristics including number of admissions, number of beds, ownership status,
system membership, trauma center status, residency programs, medical school affiliation,
hospitalist programs, and teaching intensity. I obtain outcome data at the hospital-level
from Medicare’s Hospital Compare website, which includes quality measures that focus on
heart attack, pneumonia, and heart failure for all US acute care hospitals. Table 2 sum-
marizes the characteristics of hospitals by adoption status. Relative to the early adopters,
hospitals which had not yet adopted an EMR by 2011 were smaller, as measured by number
of admissions and number of beds. They were also less likely to be a trauma center, have a
residency program, or have a hospitalist program.
I obtain patient level data from the MEDPAR 100% inpatient Medicare claims data. I
only include Medicare fee-for-service patients aged 65 and older, who have been enrolled
for all twelve months of the year. The MEDPAR data allow me to investigate several di-
mensions of patient heterogeneity. I consider patients suffering from pneumonia, congestive
heart failure (CHF), heart attack or acute myocardial infarction(AMI) and hip fracture.16
16CHF is a condition in which the heart can no longer pump enough blood to the rest of the body. It isthe most common diagnosis for the Medicare population. Pneumonia is a lung infection where treatment
16
Pneumonia, AMI, and CHF are common conditions with substantial mortality and morbid-
ity, and are part of the core measure set currently reported by Medicare. These conditions
impose a substantial burden on patients and the healthcare system, and there is marked
variation in outcomes by institution. I also use hip fracture because it is a common reason
why Medicare patients end up in the hospital.
I consider patients with AMI or hip fracture to fall in the category of diseases with clear
protocols, which limits the scope for EMRs to help. For instance, in the case of AMI, time
is of the essence, and clinicians have to take several steps immediately to confirm an AMI,
to administer medications, and to restore blood flow to the heart. After this initial period of
treatment, the remainder of the hospital stay is primarily rest and recovery. In the case of hip
fracture, early surgery within 48 hours should occur for most patients, followed by rest and
recovery. On the other hand, pneumonia and CHF require continuous monitoring throughout
the hospital stay and there is more potential for EMRs to help. For instance, evidence-
based recommendations from CDS software can help to standardize care by mitigating the
consequences of variation in physician beliefs unsupported by clinical evidence (Cutler et al.,
2013). Appendix C shows clinical pathways for these four conditions.
The primary dependent variable I focus on to measure resource use is the length of stay
for a given admission. To the extent that patients would like to stay at the hospital for
as few days as possible, it can also be interpreted as a measure of quality. Adverse events
and medical errors, for instance, can increase the length of stay. I also consider two explicit
measures of the quality of care, the thirty-day mortality rate and the thirty-day readmission
rate. Patients returning to the hospital shortly after they are discharged impose an enormous
cost on Medicare, which has started to reduce payments for readmissions, exposing hospitals
to considerable financial risks.17 Table 3 summarizes patient-level characteristics by disease.
requires blood culture testing to determine the type of bacteria and the administration of the appropriateantibiotics. AMI results from the interruption of blood flow to a part of the heart, causing heart cells to die.It is the leading cause of death in the US.
17In its patient safety and quality initiative, the Centers for Medicare and Medicaid Services has estimatedthe cost of avoidable readmissions at more than $17 billion a year. In fiscal year 2013, hospitals faced apenalty equal to 1% of their total Medicare billings if an excessive number of patients are readmitted. The
17
5.2 Research Design
To identify the effect of IT on outcomes, I employ a difference-in-difference identification
strategy, relying on variation in the timing of adoption of electronic medical records. For my
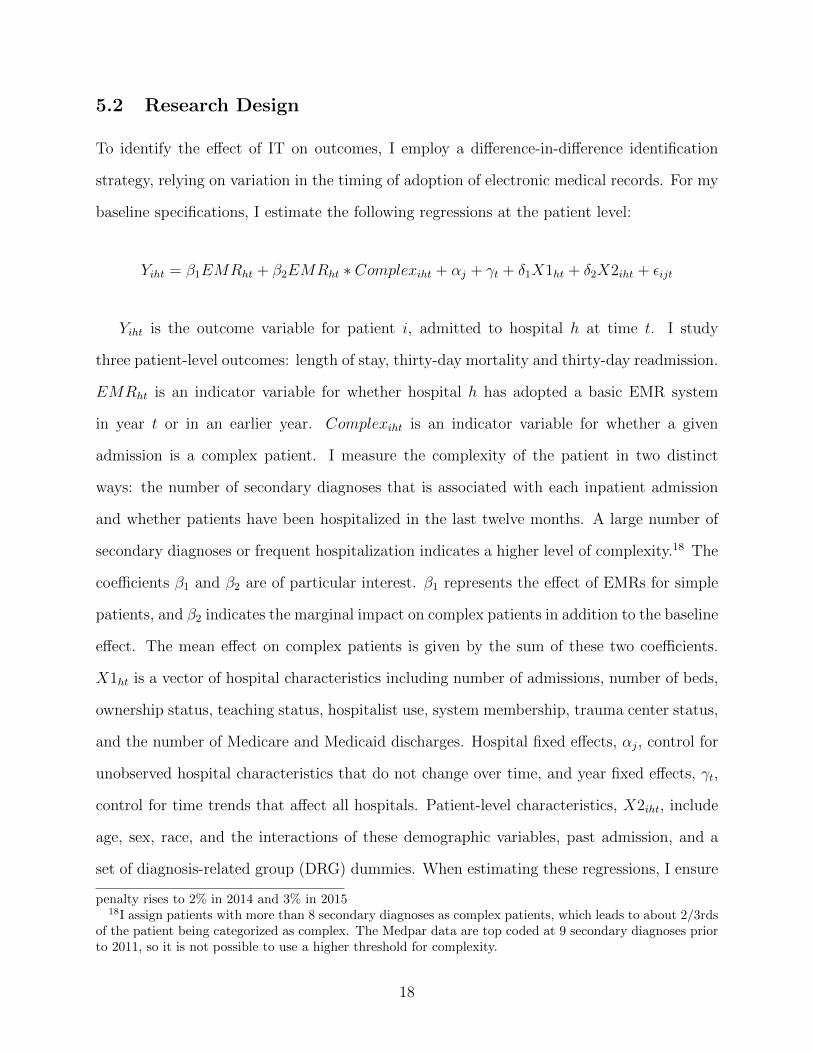
baseline specifications, I estimate the following regressions at the patient level:
Yiht = β1EMRht + β2EMRht ∗ Complexiht + αj + γt + δ1X1ht + δ2X2iht + εijt
Yiht is the outcome variable for patient i, admitted to hospital h at time t. I study
three patient-level outcomes: length of stay, thirty-day mortality and thirty-day readmission.
EMRht is an indicator variable for whether hospital h has adopted a basic EMR system
in year t or in an earlier year. Complexiht is an indicator variable for whether a given
admission is a complex patient. I measure the complexity of the patient in two distinct
ways: the number of secondary diagnoses that is associated with each inpatient admission
and whether patients have been hospitalized in the last twelve months. A large number of
secondary diagnoses or frequent hospitalization indicates a higher level of complexity.18 The
coefficients β1 and β2 are of particular interest. β1 represents the effect of EMRs for simple
patients, and β2 indicates the marginal impact on complex patients in addition to the baseline
effect. The mean effect on complex patients is given by the sum of these two coefficients.
X1ht is a vector of hospital characteristics including number of admissions, number of beds,
ownership status, teaching status, hospitalist use, system membership, trauma center status,
and the number of Medicare and Medicaid discharges. Hospital fixed effects, αj, control for
unobserved hospital characteristics that do not change over time, and year fixed effects, γt,
control for time trends that affect all hospitals. Patient-level characteristics, X2iht, include
age, sex, race, and the interactions of these demographic variables, past admission, and a
set of diagnosis-related group (DRG) dummies. When estimating these regressions, I ensure
penalty rises to 2% in 2014 and 3% in 201518I assign patients with more than 8 secondary diagnoses as complex patients, which leads to about 2/3rds
of the patient being categorized as complex. The Medpar data are top coded at 9 secondary diagnoses priorto 2011, so it is not possible to use a higher threshold for complexity.
18
that the standard errors, εijt, are clustered at the hospital level to account for correlation
across patients within the same hospital and for the same hospital over time.
Under the HITECH Act, different hospitals received different incentive payments based
on the number of admissions as well as the Medicare and Medicaid share of patients. In line
with some recent literature (Dranove et al., 2014), I find empirical evidence that the subsidies
stimulated the adoption of EMRs.19 However, this association is not strong enough to use
the HITECH subsidies as an instrument for EMR adoption as part of a viable instrumental
variable strategy. Therefore, I rely on variation in the timing of adoption to identify the
effect of EMRs on patient-level outcomes.
The variation in EMR use is at the hospital-by-year level, so the key identifying assump-
tion is that the adoption decision is independent of other hospital-by-year shocks. Several
robustness tests validate this assumption. For a given patient, being part of the treatment
group is getting admitted to a hospital which adopted a basic EMR system between 2009 and
2011. I look at the difference between members of this group before and after IT adoption at
the hospital, relative to the trend in the control group, which comprises patients admitted
to hospitals that already had a basic EMR system by 2008 or did not yet adopt EMRs by
2011. The parallel trends assumption is that patients admitted to hospitals which adopted
EMRs during this period experience the same trends in the outcome measures as patients
admitted to other hospitals.
The most plausible threat to identification is the adoption of concurrent hospital-wide
quality improvement initiatives. If hospitals were engaging in other quality improvement
initiatives at the same time as they were adopting electronic medical records, my estimates
would be biased. The crux of my argument relies on the heterogeneous impact of EMRs on
different types of patients. Therefore, such unobserved quality improvements would need to
have a similar differential impact on patients. While it is possible that there were unobserved
hospital-level changes over this time period, it is less likely that were unobserved management
19An additional $1 million of incentive payments is associated with an increase in the probability of EMRadoption of more than 2 percentage points.
19
changes that had the same pattern of effects on different types of patients. Moreover, it is
reasonable to interpret any management initiatives that were rolled out along with IT systems
as part of the treatment effect. Such initiatives are clearly sufficiently complementary with
the digitization of medical records to go hand in hand with EMR adoption.
One potential issue with EMRs is that hospitals may be using them to game the system
by engaging in upcoding behavior such as inflating the number of diagnoses. This issue is of
particular concern in my case since I use the number of diagnoses as one measure of patient
complexity. There have been widespread stories about hospitals strategically using the better
documentation made possible by EMRs to select billing codes that reflect more intensive care
or a sicker patient population, thus leading to higher reimbursement (Abelson et al., 2012).20
I directly test for such gaming behavior in my sample by investigating the effect of EMR
adoption on the reported number of secondary diagnoses. Table A4 in Appendix A shows
the results of this empirical exercise. I find no statistically significant relationship between
EMR adoption and the number of secondary diagnoses reported.
Another concern with this research design is that patients could be selectively sorting
into hospitals with EMRs. If healthier patients are more likely to do this, I would find a
positive impact of EMRs where none exists. But there is some evidence that this scenario
is unlikely. Consumers still have a very limited idea about the quality of their health care
providers. Evidence from the introduction of hospital report cards suggests that patient
preferences are weakly related to measurable quality and therefore IT utilization is unlikely
to affect hospital volumes(Cutler et al., 2004). Thus, it is reasonably unlikely that there
is significant patient sorting due to consumers choosing hospitals on the basis of whether
they have EMRs. In particular, I find that there is no significant change in the number of
admissions to a hospital following EMR adoption as shown in Table A1 in Appendix A.
20EMRs may degrade the quality of documentation by enabling record cloning - copying and pasting thesame examination findings into the records for multiple patients -which could similarly drive up reimburse-ment by documenting and then billing for care that did not occur. Adler-Milstein and Jha (2014) find noevidence of upcoding whereas Li (2013) finds some evidence for upcoding.
20
6 How Do EMRs Affect Patient Outcomes?
In order to provide context for the patient-level analysis, I start by investigating outcomes at
the hospital level to estimate the average effect of EMR adoption on hospital level outcomes.
Using a difference-in-difference framework, I find that there are very small effects on length of
stay and clinical outcomes over the first few years. Table 4 summarizes these findings, which
are robust to the use of different empirical strategies.21 For all four conditions that I study,
EMR adoption has no statistically significant effect on length of stay, thirty-day mortality
or thirty-day readmission. The effect on length of stay is less than 1% in all cases, and the
effect on mortality and readmission is less than half a percentage point. These results are in
line with some recent studies, which also find small impacts of EMRs at the hospital level
(Agha, 2014; McCullough et al., 2010).
However, theory suggests that patient level heterogeneity in outcomes is important.
Therefore, in order to understand how EMRs affect productive efficiency and coordination
at the patient level, I move to patient level data. Hypothesis 1 predicts that EMRs will have
different impacts on different kinds of patients. To test these predictions, I estimate equation
(1) separately for all four conditions that I study. Tables 5 and 6 show the results of these
regressions. In these tables, Complex is a binary variable indicating that the patient has a
high number of secondary diagnoses.
The odd-numbered columns in Table 5 show results from patient level regressions and
indicate that, on average, EMR adoption is not significantly associated with a change in
length of stay for patients with any of the four diseases. I also show results from regressions
in which I interact EMR adoption with an indicator variable for patient complexity. The
first row in the even-numbered columns of Table 5 shows results for less complex patients. I
21I conduct an event study analysis, looking at hospitals which adopted EMR at different times, and checkfor changes in the outcome variables following adoption of EMRs. I also use a propensity score matchingmethod to compare similar hospitals, to check if the the adoption of EMRs is associated with any changein hospital level outcomes. I create three groups of hospitals: those which already had basic EMR by 2008;those which adopted EMR between 2009 and 2011; and those which had not adopted EMR by 2011. I thencompare the change in outcome variables in each group relative to matched controls from each of the othergroups.
21
find that for CHF and pneumonia patients with a low number of secondary diagnoses, EMR
adoption is associated with a decrease of more than 2% in the length of stay. The second row
shows the impact of EMRs on more complex patients relative to less complex patients, and
there is a statistically significant difference between patients in these two categories. To get
the overall effect on more complex patients we sum up the first and second row. It appears
that while EMR adoption is associated with a slight increase in length of stay for more
complex patients, this result is not statistically significant. I contrast my results for CHF
and pneumonia patients with those for patients who suffer from an AMI or a hip fracture.
As indicated by column 6 and column 8, results for patients with AMI and hip fracture are in
the same direction, but they are much smaller in magnitude and not statistically significant.
These findings are robust to dropping outliers with particularly high lengths of stay from the
analysis. I estimate these specifications after dropping patients above the 95th percentile
with lengths of stay greater than 13 days, and find quantitatively similar results.
One concern with using the length of stay as a dependent variable is that it is not an
ideal measure of the quality of care. The quality of care might actually be worse if patients
are being rushed out too quickly. Therefore, I test how the quality of care is affected by
looking at the thirty-day mortality rate and the thirty-day readmission rate for patients
in my sample. Tables 6 and 7 show results with these quality measures as the dependent
variables. I find no evidence that there is lower quality of care associated with shorter lengths
of stay. In fact, the results are in the same direction as the length of stay results. As Table 6
indicates, thirty-day mortality is reduced by roughly 0.8 percentage points for less complex
patients, with no significant impact for more complex patients. According to Table 7, thirty-
day readmission is also reduced by 0.8 percentage points for less complex patients, with no
significant impact for more complex patients. The mortality results hold even for AMI and
hip fracture patients, while the readmission results hold for AMI patients. It appears that
EMR adoption is associated with changes in quality outcomes for less complex patients in
such cases, even though it does not significantly affect the length of stay. Additionally, I
22
use a combined measure and estimate regressions in which the dependent variable is either
mortality or readmission within thirty days of discharge. I find quantitatively similar results.
It is evident there are several simultaneous channels operating for more complex patients.
EMRs might be disruptive for such cases to the extent that they result in information
overload and impose standardization. On the other hand, EMRs may facilitate improved
care coordination. In order to understand the specific circumstances under which EMRs are
most helpful for such cases, I next present results on what factors could modify the effect of
EMRs on the outcomes for more complex patients who repeatedly come back to the hospital.
6.1 Storage of Information over Time
Hypothesis 2 predicts that repeated interaction at the same facility is one situation in which
EMRs help to solve the coordination problem for complex patients. To test this prediction,
I estimate a version equation (1) in which I measure complexity by previous hospitalization.
In particular, I interact the EMR adoption variable with an indicator variable for whether
the patient had been hospitalized in the last 12 months. I also include a triple interaction
term which additionally indicates if the previous admission was at the same hospital.
Tables 8 through 10 show results from this specification. Patients who have been hospi-
talized in the previous twelve months have higher lengths of stay in the presence of EMRs
but this effect disappears for those patients coming back to the same hospital. Column 2 in
Table 8 indicates that for pneumonia patients coming to a hospital with an EMR, being a
repeat admit is associated with a 2.59 percentage point increase in the length of stay relative
to those who had not been admitted to a hospital in the preceding twelve months. However,
if the previous admission was at the same hospital, this effect is reduced by 1.39 percentage
points. Thus, more than half the relative effect of being a complex patient disappears. Col-
umn 4 shows that this phenomenon is even starker for patients with congestive heart failure.
Being a repeat admit is associated with a 2.73 percentage point increase in the length of stay
relative to those who had not been admitted to a hospital in the preceding twelve months.
23
This effect is reduced by 2.37 percentage points if the previous admission was at the same
hospital.
Interestingly, in columns 6 and 8, we see a statistically significant effect even for heart
attack and hip fracture patients who have been to the same hospital before. In the baseline,
going to a hospital with an EMR does not affect the length of stay for these patients, whether
they have been to admitted to a hospital within the last twelve months or not. However,
having been admitted to the same hospital in the last twelve months changes the effect on
length of stay by 2.54 percentage points for AMI patients, and 1.39 percentage points for
hip fracture patients. It is possible that when such patients are registered at the ED, their
patient records provide information, for instance on drug allergies, that enable doctors to
treat them better. There is no time to further interact with the EMR before providing
the most crucial elements of the treatment other than a quick automatic check to see any
relevant information in case of previous admission. I repeat these regressions using thirty-
day mortality and thirty-day readmission as dependent variables but, as shown in Tables 9
and 10, there are no statistically significant results for these outcome measures.
6.2 Effect of CPOE on Hospital Charges
It is possible that doctors spend more resources when certain features of an EMR such as
computerized physician order entry are available. Such features potentially make it easier
for doctors to order tests and get more information.
Table 11 shows that, in the case of pneumonia and heart failure, CPOE increases both
laboratory and radiology charges for more complex patients who repeatedly end up in the
hospital. Note that in these specifications, hospital fixed effects control for different average
prices across hospitals. For complex cases, there is more scope to learn about the patient,
which is why there is an opportunity for physicians to order a large number of tests. For
pneumonia patients, being a frequent patient is associated with a 2.35 percentage point
increase in lab charges and a 2.74 percentage point increase in radiology charges relative to
24

being a patient who has not been admitted to a hospital in the past twelve months. The
effect is greater for heart failure patients for whom the corresponding increases are 4.79 and
4.65 percentage points.
Such additional tests and imaging could be one explanation for the relatively longer
lengths of stay that these patients experience. Not only do the tests take time, but they
could also result in information overload for any other clinician who is subsequently involved
in the patient’s care during the hospital stay. This effect is greatly reduced if patients have
been to the same hospital before, possibly because some necessary information is already
stored in the electronic medical record. For both pneumonia and heart failure patients, the
relative increase in billed charges due to being a repeat admit disappears if the previous
admission was at the same hospital.
Some of the additional services could be beneficial for more complex patients, but the
findings also support the view that computerized order entry could have unintended con-
sequences that act as a countervailing force to the faster ordering and administration of
medications.
6.3 Interaction of Payer Type with EMR Use
The types of insurance plans that a hospital deals with could influence how it uses EMRs.
Hospitals that have a higher share of Medicare and Medicaid patients are under relatively
more financial pressure, because Medicare, and especially Medicaid, reimburses hospitals less
generously relative to private insurers. Such hospitals are more likely to focus on leveraging
EMRs to curb resource use. Therefore, one would hypothesize that the financial benefits
of EMRs would be most obvious in hospitals with a high share of publicly insured patients
since physicians have an incentive to learn how to use them properly. I test this hypothesis
in Table 12 and find that complex CHF and pneumonia patients in such hospitals have
relatively lower lengths of stay.
For pneumonia patients, being a repeat admit is associated with a 2.21 percentage point
25
increase in the length of stay. However, if the hospital has an above median share of publicly
insured patients, this effect is reduced by 1.71 percentage points. There is a similar effect
for CHF patients, where the corresponding numbers are 1.39 percentage points and 1.48
percentage points. I do not observe any statistically significant effect for AMI and hip
fracture patients.
Taken together, the results in this section provide evidence for the heterogeneous impacts
of EMRs for different types of patients. The effects are more prominent for chronic medical
conditions such as heart failure and pneumonia than for protocol-driven conditions such as
hip fracture or heart attack. For the chronic diseases, there is also a larger impact for less
complex patients with a lower number of secondary diagnoses. By improving workflow at
the hospital, EMRs can help to relieve the bottleneck for such cases. Delving deeper into
more complex cases, I find evidence that EMRs help with coordination over time: there is
a more beneficial impact for patients who come back to the same hospital. However, EMRs
could also disrupt care for complex cases by creating information overload for clinicians. One
reason is that the software is still in its infancy and cannot smartly synthesize all the relevant
clinical information. This disruptive effect should disappear over time but there is a more
permanent effect because technologies such as computerized order entry (CPOE) lower the
cost of acquiring information. In line with this theory, I find that CPOE is associated with
additional laboratory and radiology charges. Finally, I find that EMRs are more effective
in hospitals with a higher share of publicly insured patients and a correspondingly greater
incentive to curb resource use.
26
7 Are EMRs Worth It?
Technological innovation, primarily in the form of new products and services, accounts for
a large proportion of the increase in health care costs over the last few decades (Newhouse,
1992). In contrast, process innovations such as EMRs can actually help to reduce costs in
addition to improving the quality of health care. But EMRs require substantial upfront
investment and, like other business process innovations, need complementary organizational
change to be successful. For a 200 bed hospital, the initial cost of an EMR is $20 million
and the annual operating cost is $3 million (Laflamme et al., 2010). Assuming that a system
lasts ten years before it has to be replaced, the fixed cost can be amortized to $2 million per
year. Thus, the total cost per year is $5 million. Is this sum a worthwhile investment? In
light of the results in the previous section, it is possible to formulate a rough answer to this
question.
First, consider the impact of EMRs on length of stay. The marginal cost of an additional
day at the hospital is approximately $600 (Bartel et al., 2014). I find that EMR adoption is
associated with a 2% reduction in length of stay for less complex patients, which is equivalent
to a reduction of 0.1 days given that the average length of stay is roughly 5 days. If hospitals
could achieve this reduction for all patients, the cost per patient would decrease by $60. For
an average hospital that treats 10, 000 patients per year, which is reasonable based on Table
2, this amount translates to annual savings of $0.6 million. Next, consider the impact of
EMRs on mortality. Murphy and Topel (2006) estimate the value of a life-year for an 80-year
old, the approximate mean age of patients in my sample, to be $150, 000, or slightly more
than $200, 000 in 2014 dollars. I find EMR adoption to be associated with a reduction in
mortality of 0.8 percentage points for less complex patients. Suppose that this reduction can
be extrapolated to all patients with one caveat. Since not all hospitalized patients are at a
serious risk of dying, as a rough estimate let me assume that 30-day mortality is a relevant
outcome only for Medicare patients, who make up about 40% of hospital admissions. In
that case, an average hospital that sees 4, 000 Medicare patients per year will save 32 lives
27
or $6.4 million based on the Murphy and Topel (2006) estimate.
While this calculation relies on many assumptions, at first glance, the estimated benefit
exceeds the cost of adopting an EMR system. One important assumption is the extrapolation
of the results I find for less complex patients to all patients. I believe that this paper
underestimates the potential benefits of EMRs for more complex patients because of the
absence of interoperability during the time period of this study. Without interoperable
EMRs, it is hard to retrieve previous information about the patient if they had been to a
different hospital before or to transfer records from physician practices.
In fact, handoffs across care settings are the most critical points at which information
about the patient is likely to get lost (Wachter et al., 1999). The fact that EMRs are not
interoperable across hospitals or between hospitals and outpatient clinics makes such loss of
information more likely. In recent years, it has become more important to prevent such loss
of information because of the emergence of hospitalists who take over the responsibility for
patients who are admitted to hospitals by their PCPs. Unlike PCPs, hospitalists have had
no prior interaction with the patient and therefore would find the patient history contained
in the EMR particularly useful. In some health systems, it is possible for clinicians at the
hospital to access records from affiliated physician practices, but this arrangement is the
exception rather than the rule. The government has required that installed EMRs have the
ability to exchange clinical information, but the first stage meaningful use criteria do not
stipulate that hospitals actually exchange information. As the second stage goes into effect,
we are likely to see greater interoperability of EMRs and potentially larger benefits for more
complex patients who interact with the health care system through multiple organizations.
Even if the social benefits of EMRs exceed the costs, it might not be worth it for hospitals
to invest in EMRs because they cannot fully internalize the benefits. To the extent that
hospitals care about patient health, they internalize some of the benefits. Hospitals also
benefit from efficiency improvements such as reduction in nurses’ unproductive time and
savings in medical records departments. However, insurance companies do not reimburse
28
more for hospitals with an EMR. Moreover, if patients are not aware that hospitals are using
EMRs and that they are achieving better outcomes, it might not be possible for hospitals
to gain market share. Hospitals have traditionally not realized most of the clinical savings
that accrue from greater operational efficiency. This situation is a stark contrast to other
industries and is largely a product of fee-for-service reimbursement models, which reward
providers for performing more services. Indeed, hospitals paid on a fee-for-service basis might
actually lose money if patients stay fewer days but those paid via a prospective payment
system might benefit because they get to keep any cost savings
The recent surge in hospital adoption of EMRs indicates that the HITECH Act and con-
current policy changes have been successful in tilting the balance in favor of EMR adoption.
While the HITECH Act did not provide enough subsidies to fully cover the cost of installing
an EMR system, it did promise a substantial amount. Based on the formulas, a hospital
with 10,000 admissions per year, of which 60% are either Medicare or Medicaid patients,
could receive around $6 million over the course of several years, which is about a third of the
initial cost of an EMR. While this amount does not seem to be a substantial portion of the
cost, it could well push many hospitals over the margin once they account for the benefits
of EMR adoption.
29
8 Conclusion
As the price of computing power has fallen, computers have increasingly displaced workers
in accomplishing explicit, codifiable tasks that follow precise procedures (Autor, 2014). On
the other hand, computers cannot improvise solutions for unexpected cases and automation
is difficult for tasks requiring flexibility and judgment (Levy and Murnane, 2012). It is
possible that IT has a more nuanced impact on healthcare organizations than it did in other
service industries because such complex tasks form a larger proportion of what doctors have
to do. There is more variability and uncertainty at the point of service in health care than in
any other economic activity. In the absence of an inventory of standardized health services,
clinicians must customize their work at the point of care on a “just-in-time” basis (Burns,
2012). Moreover, the consequences of production mistakes can be large in health care, both
in terms of quality and in terms of cost.22 Since two of the biggest culprits behind the high
level of health care spending in the US are operational inefficiency and lack of coordination
(Cutler, 2011), I frame the adoption of health IT in terms of its effects on operational
efficiency and care coordination.
I investigate these mechanisms in a hospital setting by looking at the impact of EMR
adoption on the length of stay and quality of care. I find reductions in length of stay and
improvements in quality outcomes for less complex patients with congestive heart failure
and pneumonia. For such cases, coordination is less likely to be an important part of the
production process, and I attribute the results to an improvement in operational efficiency.
In contrast, I find that there are no improvements on average for more complex patients
for whom coordination is more likely to be important. Thus the beneficial effects of easier
coordination do not appear to outweigh the disruption that EMRs entail for such complex
cases.
The theory highlights several reasons why this technology might make production ineffi-
22According to studies reviewed by the Institute of Medicine, approximately 98,000 people die each year inUS hospitals from medical error (Kohn et al., 2000). Failures in care delivery and care coordination accountfor over $160 billion of excessive Medicare spending (Berwick and Hackbarth, 2012).
30
cient for complex cases, and anecdotal evidence from physicians corroborate this view (Park
et al., 2012). Unlike for simple patients, the fact that some tasks get done faster has less
marginal impact since such tasks are unlikely to be the bottleneck for complex cases. On
the contrary, a large amount of information is presented to clinicians which could lead to
information overload. I only look at a few years of data that cover the initial surge in EMR
adoption at hospitals. In the long run, as IT systems become more sophisticated, they may
improve outcomes for more complex transactions as well. While that outcome is not yet
evident in my setting, I do find specific circumstances in which the disruption is smaller for
more complex cases: when patients have been to the same hospital before and when the
hospital faces financial incentives to lower resource use.
If the digitization of records actually helps with the simplest cases, we should see the
largest effects for certain patients who are not even hospitalized but seen in outpatient
clinics. Since the dataset for this study is limited to the inpatient setting, I cannot form
an estimate of the benefits of EMRs based on their value in physician practices. As EMRs
become more interoperable, it would be particularly interesting to estimate the additional
benefits of sharing information across care settings. The widespread diffusion of EMRs makes
it imperative to understand how they will affect health care delivery organizations. If the
benefits of EMRs that I find in specific cases can be replicated for all patients, the additional
value from this technology will far surpass its costs.
31
References
Abelson, R., J. Creswell, and G. Palmer (2012). Medicare Bills Rise as Records TurnElectronic. New York Times .
Adler-Milstein, J. and A. K. Jha (2014). No evidence found that hospitals are using newelectronic health records to increase medicare reimbursements. Health Affairs 33 (7), 1271–1277.
Agha, L. (2014). The effects of health information technology on the costs and quality ofmedical care. Journal of Health Economics 34, 19–30.
Autor, D. (2014). Polanyi’s paradox and the shape of employment growth. Paper preparedfor Federal Reserve Bank of Kansas City, Jackson Hole Conference, August 22, 2014.
Autor, D. H., F. Levy, and R. J. Murnane (2003). The skill content of recent technologicalchange: An empirical exploration. Quarterly Journal of Economics 118, 4.
Bartel, A., C. Ichniowski, and K. Shaw (2007). How does information technology affectproductivity? plant-level comparisons of product innovation, process improvement, andworker skills. The Quarterly Journal of Economics , 1721–1758.
Bartel, A. P., C. W. Chan, and S.-H. H. Kim (2014). Should hospitals keep their patientslonger? the role of inpatient and outpatient care in reducing readmissions.
Berwick, D. M. and A. D. Hackbarth (2012). Eliminating waste in us health care.JAMA 307 (14), 1513–1516.
Bloom, N., L. Garicano, R. Sadun, and J. Van Reenen (2009). The distinct effects ofinformation technology and communication technology on firm organization. Technicalreport, National Bureau of Economic Research.
Bloom, N., R. Sadun, and J. Van Reenen (2012, 02). Americans do it better: Us multina-tionals and the productivity miracle. American Economic Review 102 (1), 167–201.
Bresnahan, T. F., E. Brynjolfsson, and L. M. Hitt (2002). Information technology, workplaceorganization, and the demand for skilled labor: Firm-level evidence. Quarterly Journal ofEconomics 117 (1).
Brynjolfsson, E. and L. M. Hitt (2003). Computing productivity: Firm-level evidence. Reviewof Economics and Statistics 85 (4), 793–808.
Brynjolfsson, E. and A. Saunders (2010). Wired for Innovation: How Information Technologyis Reshaping Economy,–Cambridge (Massachusetts). MIT Press.
Buntin, M. B., M. F. Burke, M. C. Hoaglin, and D. Blumenthal (2011). The benefits ofhealth information technology: a review of the recent literature shows predominantlypositive results. Health Affairs 30 (3), 464–471.
Burns, L. R. (2012). The business of healthcare innovation. Cambridge University Press.
32
CJ, M., C. FM, W. A, G. RM, M. M, and K. T (2014). Use of internist’s free time byambulatory care electronic medical record systems. JAMA Internal Medicine 174 (11),1860–1863.
Cutler, D. (2014). The Quality Cure: How Focusing on Health Care Quality Can Save YourLife and Lower Spending Too, Volume 9. Univ of California Press.
Cutler, D., J. Skinner, A. D. Stern, and D. Wennberg (2013). Physician beliefs and patientpreferences: a new look at regional variation in health care spending.
Cutler, D. M. (2011). Where are the Health Care Entrepreneurs? the failure of organizationalinnovation in health care. In Innovation Policy and the Economy, Volume 11, pp. 1–28.University of Chicago Press.
Cutler, D. M., R. S. Huckman, and M. B. Landrum (2004). The role of information inmedical markets: An analysis of publicly reported outcomes in cardiac surgery. AmericanEconomic Review , 342–346.
Daurio, N. R., M. Fielding, and P. A. Cholewka (2009). Implementation of an enterprise-wide electronic health record: a nurse-physician partnership. In Nursing Informatics, pp.263–265.
Dranove, D., C. Forman, A. Goldfarb, and S. Greenstein (2012). The trillion dollar conun-drum: complementarities and health information technology. Working Paper, NationalBureau of Economic Research.
Dranove, D., C. Garthwaite, B. Li, and C. Ody (2014). Investment subsidies and the adoptionof electronic medical records in hospitals.
Freedman, S., H. Lin, and J. Prince (2014). Information technology and patient health:An expanded analysis of outcomes, populations, and mechanisms. Indiana University,Bloomington School of Public and Environmental Affairs Research Paper No. 2445431.
Garicano, L. (2000). Hierarchies and the organization of knowledge in production. Journalof Political Economy 108 (5), 874–904.
Gino, F. (2013). Sidetracked: Why our decisions get derailed, and how we can stick to theplan. Harvard Business Review Press.
Griliches, Z. (1979). Issues in assessing the contribution of research and development toproductivity growth. The Bell Journal of Economics , 92–116.
Han, Y. Y., J. A. Carcillo, S. T. Venkataraman, R. S. Clark, R. S. Watson, T. C. Nguyen,H. Bayir, and R. A. Orr (2005). Unexpected increased mortality after implementationof a commercially sold computerized physician order entry system. Pediatrics 116 (6),1506–1512.
Humphries, T. L., N. Carroll, E. A. Chester, D. Magid, and B. Rocho (2007). Evaluation of anelectronic critical drug interaction program coupled with active pharmacist intervention.Annals of Pharmacotherapy 41 (12), 1979–1985.
33
Kesselheim, A. S., K. Cresswell, S. Phansalkar, D. W. Bates, and A. Sheikh (2011). Clinicaldecision support systems could be modified to reduce alert fatiguewhile still minimizingthe risk of litigation. Health Affairs 30 (12), 2310–2317.
Kohn, L. T., J. M. Corrigan, M. S. Donaldson, et al. (2000). To Err Is Human:: Building aSafer Health System, Volume 627. National Academies Press.
Koppel, R., J. P. Metlay, A. Cohen, B. Abaluck, A. R. Localio, S. E. Kimmel, and B. L. Strom(2005). Role of computerized physician order entry systems in facilitating medicationerrors. Jama 293 (10), 1197–1203.
Laflamme, F. M., W. E. Pietraszek, and N. V. Rajadhyax (2010). Reforming hospitals withit investment. McKinsey on Business Technology (20).
Levy, F. and R. J. Murnane (2012). The new division of labor: How computers are creatingthe next job market. Princeton University Press.
McCullough, J. S., M. Casey, I. Moscovice, and S. Prasad (2010). The effect of healthinformation technology on quality in us hospitals. Health Affairs 29 (4), 647–654.
McCullough, J. S., S. Parente, and R. Town (2013). Health information technology and pa-tient outcomes: The role of organizational and informational complementarities. WorkingPaper, National Bureau of Economic Research.
Miller, A. and C. E. Tucker (2011). Can health care information technology save babies?The Journal of Political Economy 119 (2), 289–324.
Mullainathan, S. and E. Shafir (2013). Scarcity: Why having too little means so much.Macmillan.
Murphy, K. M. and R. H. Topel (2006). The value of health and longevity. Journal ofPolitical Economy 114 (5).
Newhouse, J. P. (1992). Medical Care Costs: How Much Welfare Loss? The Journal ofEconomic Perspectives 6 (3), 3–21.
Orszag, P. R. (2008). Evidence on the costs and benefits of health information technology.Testimony before Congress 24.
Park, S. Y., S. Y. Lee, and Y. Chen (2012). The effects of emr deployment on doctorswork practices: A qualitative study in the emergency department of a teaching hospital.International journal of medical informatics 81 (3), 204–217.
Piazza, G. and S. Z. Goldhaber (2009). Computerized decision support for the cardiovascu-lar clinician applications for venous thromboembolism prevention and beyond. Circula-tion 120 (12), 1133–1137.
Radner, R. (1992). Hierarchy: The Economics of Managing. Journal of economic literature,1382–1415.
34
Singh, H., C. Spitzmueller, N. J. Petersen, M. K. Sawhney, and D. F. Sittig (2013). Infor-mation overload and missed test results in electronic health record–based settings. JAMAinternal medicine 173 (8), 702–704.
Solow, R. M. (1957). Technical change and the aggregate production function. The reviewof Economics and Statistics , 312–320.
Stiroh, K. J. (2002). Information technology and the us productivity revival: what do theindustry data say? American Economic Review , 1559–1576.
Wachter, R. et al. (1999). An Introduction to the Hospitalist Model. Annals of InternalMedicine 130 (4 Pt 2), 338.
35
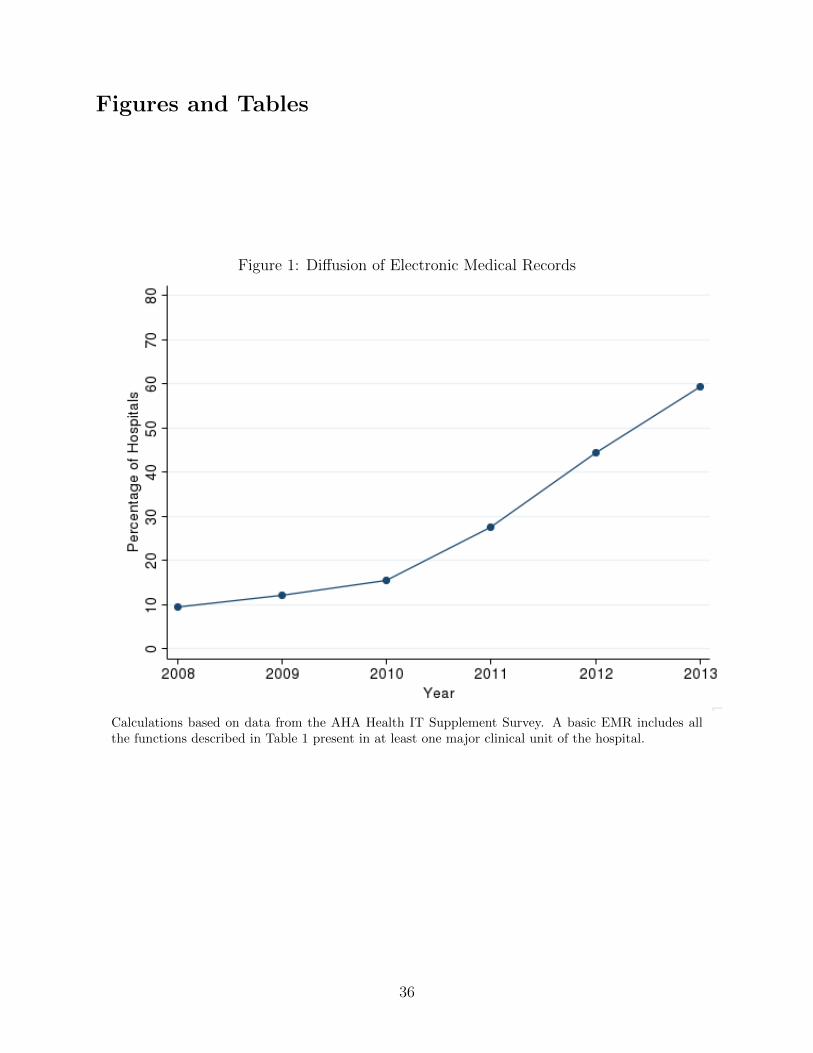
Figures and Tables
Figure 1: Diffusion of Electronic Medical Records
Calculations based on data from the AHA Health IT Supplement Survey. A basic EMR includes allthe functions described in Table 1 present in at least one major clinical unit of the hospital.
36
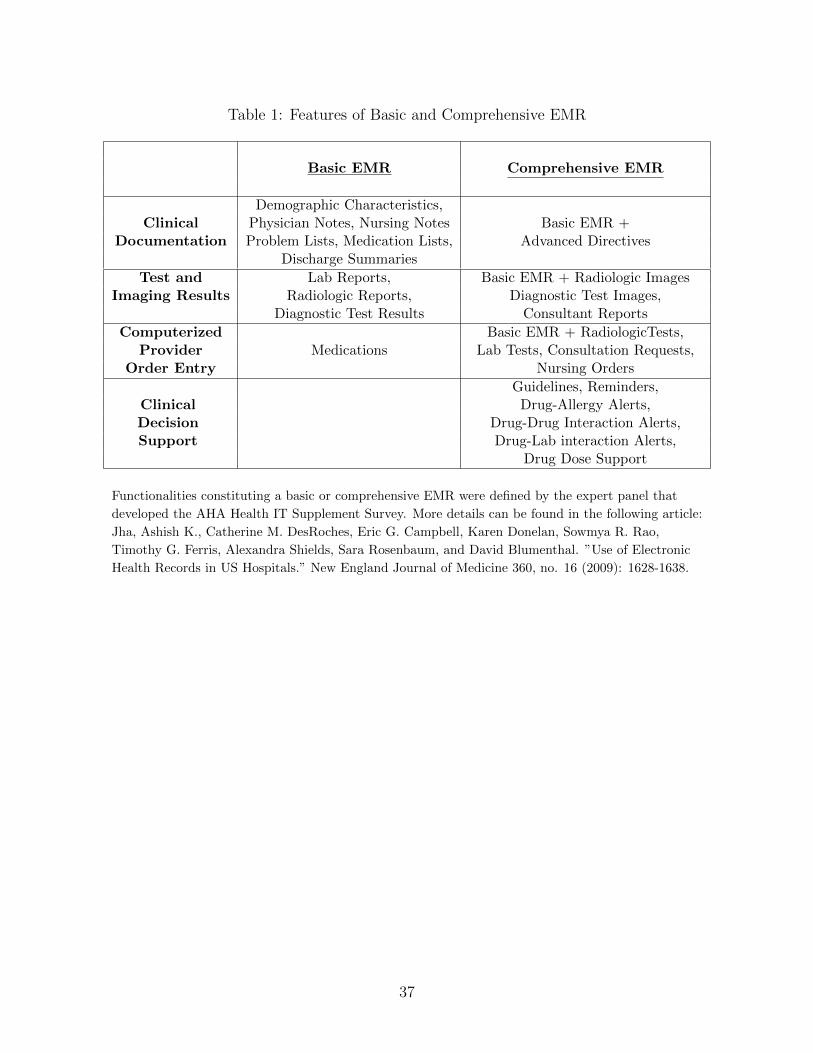
Table 1: Features of Basic and Comprehensive EMR
Basic EMR Comprehensive EMR
Demographic Characteristics,Clinical Physician Notes, Nursing Notes Basic EMR +
Documentation Problem Lists, Medication Lists, Advanced DirectivesDischarge Summaries
Test and Lab Reports, Basic EMR + Radiologic ImagesImaging Results Radiologic Reports, Diagnostic Test Images,
Diagnostic Test Results Consultant Reports
Computerized Basic EMR + RadiologicTests,Provider Medications Lab Tests, Consultation Requests,
Order Entry Nursing Orders
Guidelines, Reminders,Clinical Drug-Allergy Alerts,Decision Drug-Drug Interaction Alerts,Support Drug-Lab interaction Alerts,
Drug Dose Support
Functionalities constituting a basic or comprehensive EMR were defined by the expert panel that
developed the AHA Health IT Supplement Survey. More details can be found in the following article:
Jha, Ashish K., Catherine M. DesRoches, Eric G. Campbell, Karen Donelan, Sowmya R. Rao,
Timothy G. Ferris, Alexandra Shields, Sara Rosenbaum, and David Blumenthal. ”Use of Electronic
Health Records in US Hospitals.” New England Journal of Medicine 360, no. 16 (2009): 1628-1638.
37
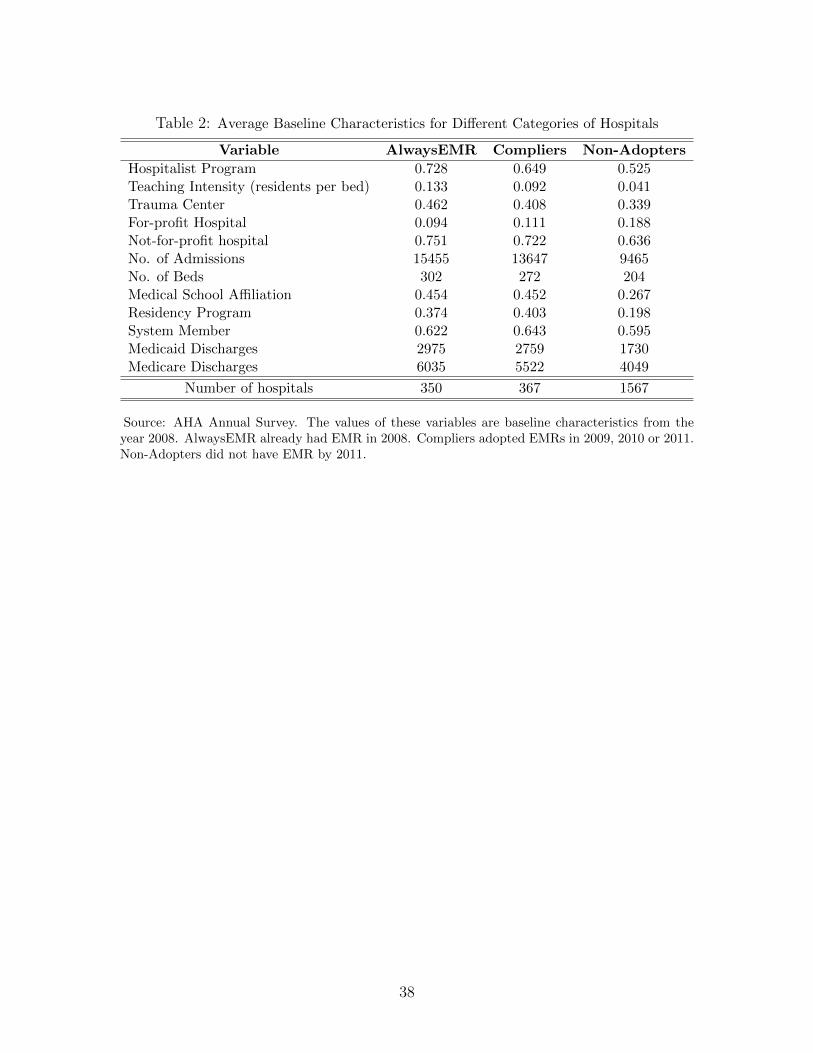
Table 2: Average Baseline Characteristics for Different Categories of Hospitals
Variable AlwaysEMR Compliers Non-Adopters
Hospitalist Program 0.728 0.649 0.525Teaching Intensity (residents per bed) 0.133 0.092 0.041Trauma Center 0.462 0.408 0.339For-profit Hospital 0.094 0.111 0.188Not-for-profit hospital 0.751 0.722 0.636No. of Admissions 15455 13647 9465No. of Beds 302 272 204Medical School Affiliation 0.454 0.452 0.267Residency Program 0.374 0.403 0.198System Member 0.622 0.643 0.595Medicaid Discharges 2975 2759 1730Medicare Discharges 6035 5522 4049
Number of hospitals 350 367 1567
Source: AHA Annual Survey. The values of these variables are baseline characteristics from theyear 2008. AlwaysEMR already had EMR in 2008. Compliers adopted EMRs in 2009, 2010 or 2011.Non-Adopters did not have EMR by 2011.
38
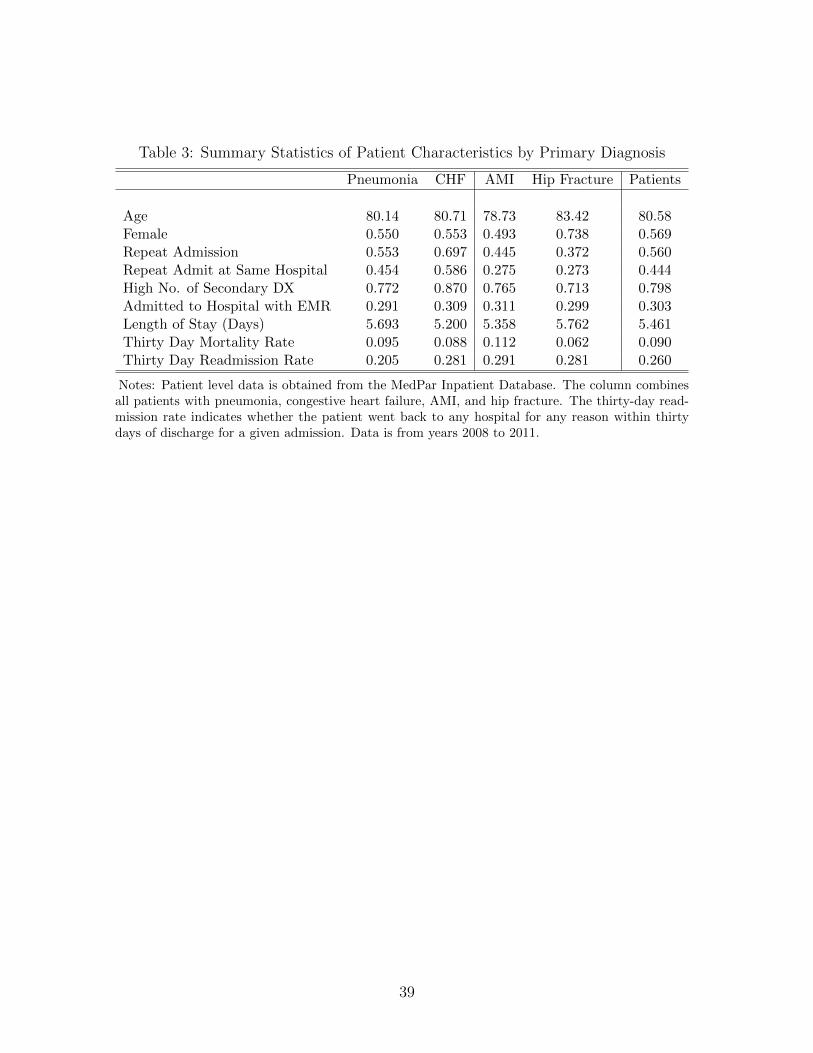
Table 3: Summary Statistics of Patient Characteristics by Primary Diagnosis
Pneumonia CHF AMI Hip Fracture Patients
Age 80.14 80.71 78.73 83.42 80.58Female 0.550 0.553 0.493 0.738 0.569Repeat Admission 0.553 0.697 0.445 0.372 0.560Repeat Admit at Same Hospital 0.454 0.586 0.275 0.273 0.444High No. of Secondary DX 0.772 0.870 0.765 0.713 0.798Admitted to Hospital with EMR 0.291 0.309 0.311 0.299 0.303Length of Stay (Days) 5.693 5.200 5.358 5.762 5.461Thirty Day Mortality Rate 0.095 0.088 0.112 0.062 0.090Thirty Day Readmission Rate 0.205 0.281 0.291 0.281 0.260
Notes: Patient level data is obtained from the MedPar Inpatient Database. The column combinesall patients with pneumonia, congestive heart failure, AMI, and hip fracture. The thirty-day read-mission rate indicates whether the patient went back to any hospital for any reason within thirtydays of discharge for a given admission. Data is from years 2008 to 2011.
39
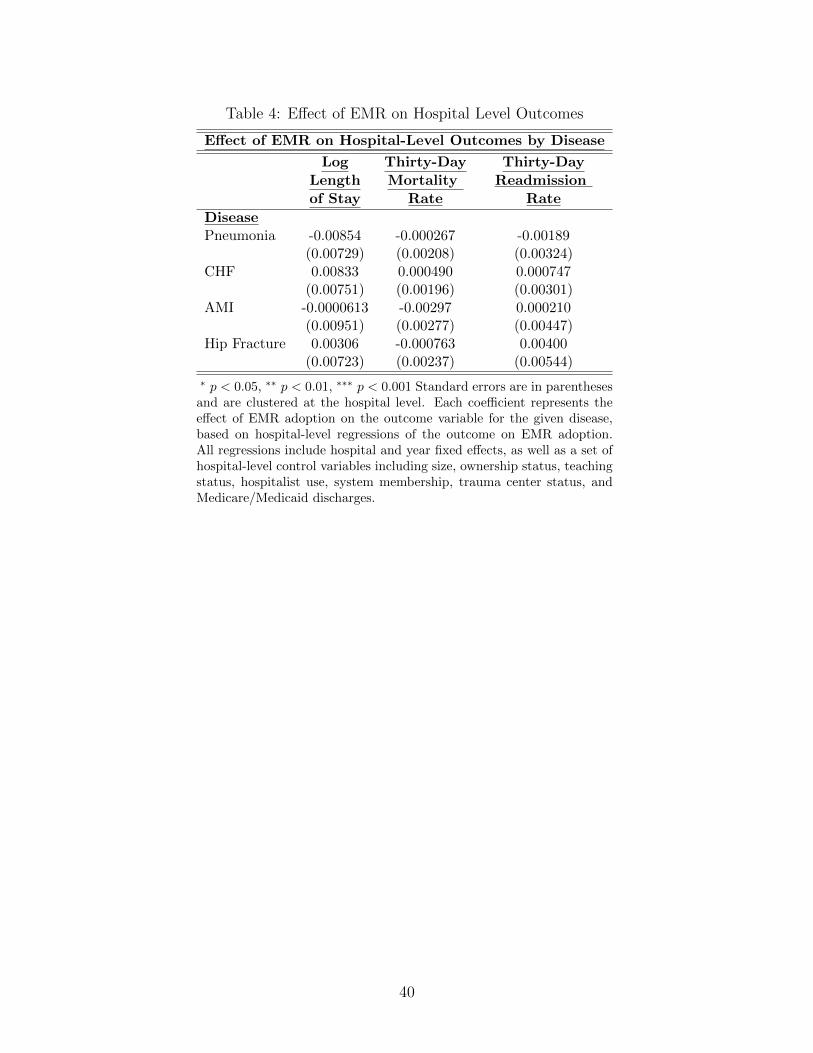
Table 4: Effect of EMR on Hospital Level Outcomes
Effect of EMR on Hospital-Level Outcomes by Disease
Log Thirty-Day Thirty-Day
Length Mortality Readmission
of Stay Rate Rate
DiseasePneumonia -0.00854 -0.000267 -0.00189
(0.00729) (0.00208) (0.00324)CHF 0.00833 0.000490 0.000747
(0.00751) (0.00196) (0.00301)AMI -0.0000613 -0.00297 0.000210
(0.00951) (0.00277) (0.00447)Hip Fracture 0.00306 -0.000763 0.00400
(0.00723) (0.00237) (0.00544)
∗ p < 0.05, ∗∗ p < 0.01, ∗∗∗ p < 0.001 Standard errors are in parenthesesand are clustered at the hospital level. Each coefficient represents theeffect of EMR adoption on the outcome variable for the given disease,based on hospital-level regressions of the outcome on EMR adoption.All regressions include hospital and year fixed effects, as well as a set ofhospital-level control variables including size, ownership status, teachingstatus, hospitalist use, system membership, trauma center status, andMedicare/Medicaid discharges.
40
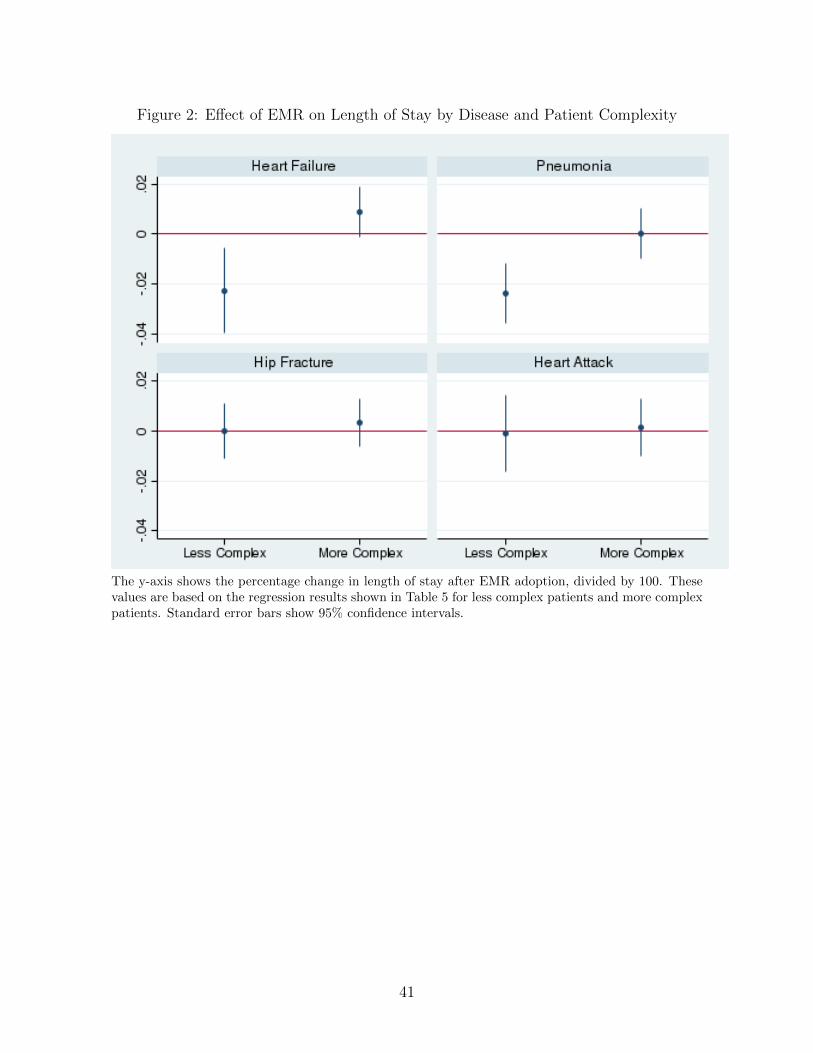
Figure 2: Effect of EMR on Length of Stay by Disease and Patient Complexity
The y-axis shows the percentage change in length of stay after EMR adoption, divided by 100. Thesevalues are based on the regression results shown in Table 5 for less complex patients and more complexpatients. Standard error bars show 95% confidence intervals.
41

Tab
le5:
Eff
ect
ofE
MR
onL
engt
hof
Sta
y
Dep
endent
Vari
able
:L
og
Length
of
Sta
yP
neum
onia
CH
FA
MI
Hip
Fra
ctu
re(1
)(2
)(3
)(4
)(5
)(6
)(7
)(8
)
EM
R-0
.004
60-0
.023
9∗∗∗
0.00
568
-0.0
226∗
∗0.
0008
13-0
.001
050.
0023
0-0
.000
0940
(0.0
0480
)(0
.006
07)
(0.0
0493
)(0
.008
59)
(0.0
0547
)(0
.007
82)
(0.0
0467
)(0
.005
51)
EM
R*C
omple
x0.
0241
∗∗∗
0.03
14∗∗
∗0.
0023
30.
0032
6(0
.005
36)
(0.0
0831
)(0
.007
78)
(0.0
0439
)N
8649
2786
4927
1061
605
1061
605
5129
5851
2958
4271
6042
7160
adj.R
20.
273
0.27
30.
242
0.24
20.
415
0.41
50.
308
0.30
8F
-Tes
t0.
967
0.08
180.
827
0.51
6(E
MR
+E
MR
*Com
ple
x=
0)
∗p<
0.0
5,∗∗
p<
0.0
1,∗∗
∗p<
0.00
1S
tan
dar
der
rors
are
inp
aren
thes
esan
dar
ecl
ust
ered
atth
eh
osp
ital
leve
l.A
llre
gre
ssio
ns
incl
ud
eh
osp
ital
and
year
fixed
effec
ts,
asw
ell
asa
set
ofh
osp
ital
-lev
elco
ntr
olva
riab
les
incl
ud
ing
size
,ow
ner
ship
statu
s,te
ach
ing
statu
s,h
osp
ital
ist
use
,sy
stem
mem
ber
ship
,tr
aum
ace
nte
rst
atu
s,an
dM
edic
are/
Med
icai
dd
isch
arge
s.P
atie
nt-
leve
lch
ara
cter
isti
csin
clu
de
age,
sex,
race
,an
dth
ein
tera
ctio
ns
ofth
ese
dem
ogra
ph
icva
riab
les,
pas
tad
mis
sion
,an
da
set
ofd
iagn
osis
-rel
ate
dgro
up
(DR
G)
du
mm
ies.
42
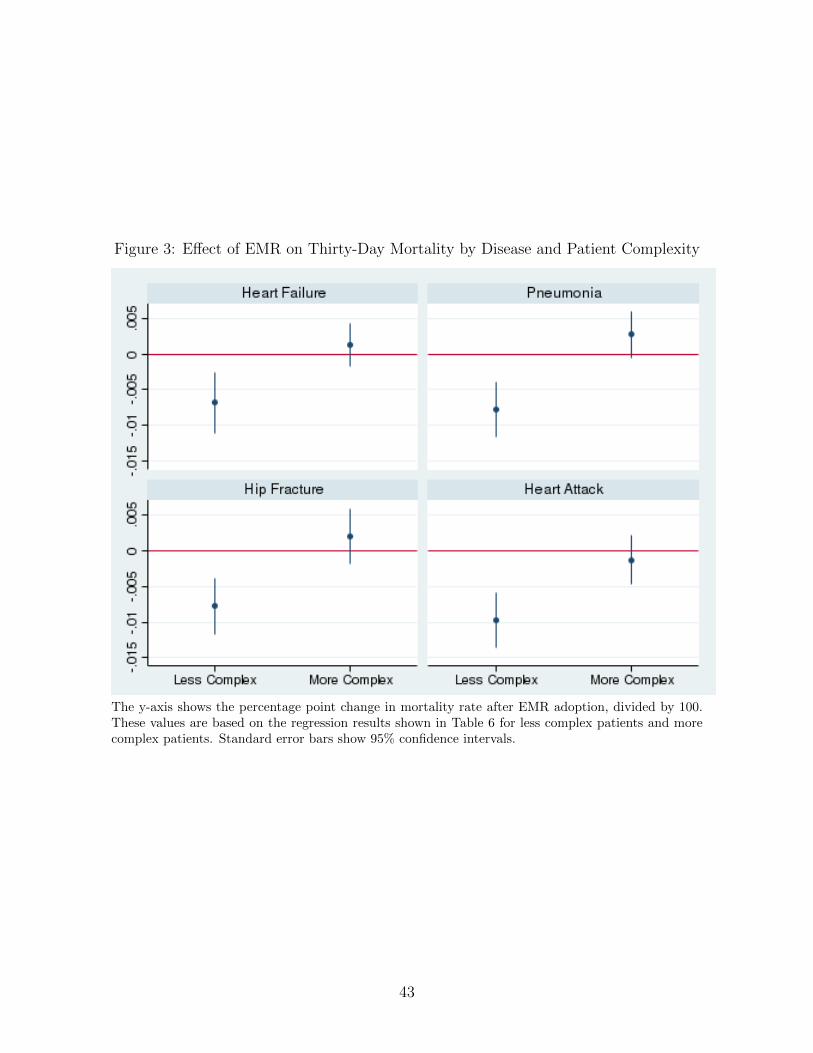
Figure 3: Effect of EMR on Thirty-Day Mortality by Disease and Patient Complexity
The y-axis shows the percentage point change in mortality rate after EMR adoption, divided by 100.These values are based on the regression results shown in Table 6 for less complex patients and morecomplex patients. Standard error bars show 95% confidence intervals.
43

Tab
le6:
Eff
ect
ofE
MR
onT
hir
tyD
ayM
orta
lity
Rat
e
Dep
endent
Vari
able
:Thir
tyD
ay
Mort
ality
Pneum
onia
CH
FA
MI
Hip
Fra
ctu
re(1
)(2
)(3
)(4
)(5
)(6
)(7
)(8
)
EM
R0.
0006
22-0
.007
75∗∗
∗0.
0004
58-0
.006
86∗∗
-0.0
0304
-0.0
0979
∗∗∗
-0.0
0061
1-0
.007
77∗∗
∗
(0.0
0160
)(0
.001
96)
(0.0
0154
)(0
.002
18)
(0.0
0163
)(0
.001
96)
(0.0
0184
)(0
.001
99)
EM
R*C
omple
x0.
0105
∗∗∗
0.00
814∗
∗∗0.
0085
0∗∗∗
0.00
976∗
∗∗
(0.0
0168
)(0
.001
80)
(0.0
0171
)(0
.001
73)
N87
0084
8700
8410
7010
810
7010
852
6359
5263
5942
8546
4285
46ad
j.R
20.
096
0.09
60.
081
0.08
10.
411
0.41
10.
106
0.10
6F
-Tes
t0.
104
0.41
00.
455
0.31
8(E
MR
+E
MR
*Com
ple
x=
0)
∗p<
0.05
,∗∗
p<
0.0
1,∗∗
∗p<
0.0
01S
tan
dar
der
rors
are
inp
aren
thes
esan
dar
ecl
ust
ered
atth
eh
osp
ital
leve
l.A
llre
gre
ssio
ns
incl
ud
eh
osp
ital
and
year
fixed
effec
ts,
asw
ell
asa
set
ofh
osp
ital
-lev
elco
ntr
olva
riab
les
incl
ud
ing
size
,ow
ner
ship
statu
s,te
ach
ing
statu
s,h
osp
itali
stu
se,
syst
emm
emb
ersh
ip,
trau
ma
cente
rst
atu
s,an
dM
edic
are/
Med
icai
dd
isch
arge
s.P
atie
nt-
leve
lch
aract
eris
tics
incl
ude
age,
sex,
race
,an
dth
ein
tera
ctio
ns
ofth
ese
dem
ogra
ph
icva
riab
les,
pas
tad
mis
sion
,an
da
set
ofd
iagn
osis
-rel
ated
grou
p(D
RG
)du
mm
ies.
44

Tab
le7:
Eff
ect
ofE
MR
onT
hir
tyD
ayR
eadm
issi
onR
ate
Dep
endent
Vari
able
:Thir
tyD
ay
Read
mis
sion
Pneum
onia
CH
FA
MI
Hip
Fra
ctu
re(1
)(2
)(3
)(4
)(5
)(6
)(7
)(8
)
EM
R-0
.001
29-0
.008
70∗∗
-0.0
0005
47-0
.008
45∗
-0.0
0052
8-0
.011
7∗0.
0038
0-0
.000
916
(0.0
0255
)(0
.003
13)
(0.0
0235
)(0
.003
77)
(0.0
0342
)(0
.004
98)
(0.0
0426
)(0
.005
14)
EM
R*C
omple
x0.
0094
1∗∗∗
0.00
939∗
∗0.
0144
∗∗0.
0065
4(0
.002
51)
(0.0
0325
)(0
.004
71)
(0.0
0420
)N
7945
5979
4559
9882
4698
8246
4693
3746
9337
4040
9940
4099
adj.R
20.
032
0.03
20.
022
0.02
20.
094
0.09
40.
139
0.13
9F
-Tes
t0.
786
0.69
20.
463
0.20
8(E
MR
+E
MR
*Com
ple
x=
0)
∗p<
0.0
5,∗∗
p<
0.0
1,∗∗
∗p<
0.00
1S
tan
dar
der
rors
are
inp
aren
thes
esan
dar
ecl
ust
ered
atth
eh
osp
ital
leve
l.A
llre
gre
ssio
ns
incl
ud
eh
osp
ital
and
year
fixed
effec
ts,
asw
ell
asa
set
ofh
osp
ital
-lev
elco
ntr
olva
riab
les
incl
ud
ing
size
,ow
ner
ship
statu
s,te
ach
ing
statu
s,h
osp
ital
ist
use
,sy
stem
mem
ber
ship
,tr
aum
ace
nte
rst
atu
s,an
dM
edic
are/
Med
icai
dd
isch
arge
s.P
atie
nt-
leve
lch
ara
cter
isti
csin
clu
de
age,
sex,
race
,an
dth
ein
tera
ctio
ns
ofth
ese
dem
ogra
ph
icva
riab
les,
pas
tad
mis
sion
,an
da
set
ofd
iagn
osis
-rel
ate
dgro
up
(DR
G)
du
mm
ies.
45

Tab
le8:
Eff
ect
ofE
MR
onL
engt
hof
Sta
y
Dep
endent
Vari
able
:L
og
Length
of
Sta
yP
neum
onia
CH
FA
MI
Hip
Fra
ctu
re(1
)(2
)(3
)(4
)(5
)(6
)(7
)(8
)
EM
R-0
.004
60-0
.011
7∗0.
0056
80.
0003
770.
0008
130.
0008
580.
0023
00.
0041
8(0
.004
80)
(0.0
0492
)(0
.004
93)
(0.0
0520
)(0
.005
47)
(0.0
0568
)(0
.004
67)
(0.0
0498
)
EM
R*R
eadm
issi
on0.
0259
∗∗∗
0.02
73∗∗
∗0.
0154
0.00
718
(0.0
0548
)(0
.006
56)
(0.0
109)
(0.0
0592
)
EM
R*R
eadm
issi
on*S
ameH
ospit
al-0
.013
9∗-0
.023
7∗∗∗
-0.0
254∗
-0.0
139∗
(0.0
0548
)(0
.006
53)
(0.0
112)
(0.0
0636
)N
8649
2786
4927
1061
605
1061
605
5129
5851
2958
4271
6042
7160
adj.R
20.
273
0.25
80.
242
0.22
80.
415
0.39
80.
308
0.28
9F
-Tes
t0.
0367
0.00
0353
0.11
70.
0912
(EM
R+
EM
R*R
eadm
issi
on=
0)
F-T
est
0.95
50.
437
0.20
10.
648
(∑ All
3C
oeffi
cien
ts=
0)
∗p<
0.0
5,∗∗
p<
0.0
1,∗∗
∗p<
0.0
01S
tan
dar
der
rors
are
inp
aren
thes
esan
dar
ecl
ust
ered
atth
eh
osp
ital
leve
l.A
llre
gre
ssio
ns
incl
ude
hos
pit
alan
dye
arfi
xed
effec
ts,
asw
ell
asa
set
ofh
osp
ital
-lev
elco
ntr
olva
riab
les
incl
ud
ing
size
,ow
ner
ship
statu
s,te
ach
ing
statu
s,h
osp
itali
stu
se,
syst
emm
emb
ersh
ip,
trau
ma
cente
rst
atu
s,an
dM
edic
are/
Med
icai
dd
isch
arge
s.P
atie
nt-
leve
lch
aract
eris
tics
incl
ud
eage,
sex,
race
,an
dth
ein
tera
ctio
ns
ofth
ese
dem
ogra
phic
vari
able
s,pas
tad
mis
sion
,an
da
set
ofd
iagn
osis
-rel
ated
grou
p(D
RG
)du
mm
ies.
46

Tab
le9:
Eff
ect
ofE
MR
onT
hir
tyD
ayM
orta
lity
Rat
e
Dep
endent
Vari
able
:Thir
tyD
ay
Mort
ality
Pneum
onia
CH
FA
MI
Hip
Fra
ctu
re(1
)(2
)(3
)(4
)(5
)(6
)(7
)(8
)
EM
R0.
0006
22-0
.002
720.
0004
58-0
.004
52∗∗
-0.0
0304
-0.0
0398
∗-0
.000
611
-0.0
0220
(0.0
0160
)(0
.001
71)
(0.0
0154
)(0
.001
65)
(0.0
0163
)(0
.001
67)
(0.0
0184
)(0
.001
91)
EM
R*R
eadm
issi
on0.
0094
5∗∗∗
0.00
628∗
∗-0
.001
150.
0041
4(0
.002
68)
(0.0
0206
)(0
.002
22)
(0.0
0285
)
EM
R*R
eadm
issi
on*S
ameH
ospit
al-0
.004
170.
0009
110.
0058
1∗0.
0005
95(0
.002
70)
(0.0
0211
)(0
.002
74)
(0.0
0320
)N
8700
8487
0084
1070
108
1070
108
5263
5952
6359
4285
4642
8546
adj.R
20.
096
0.09
90.
081
0.08
20.
411
0.41
10.
106
0.10
6F
-Tes
t0.
0166
0.44
40.
0457
0.52
8E
MR
+E
MR
*Rea
dm
issi
on=
0F
-Tes
t0.
172
0.11
80.
765
0.29
5(∑ A
ll3
Coeffi
cien
ts=
0)
∗p<
0.05
,∗∗
p<
0.01
,∗∗
∗p<
0.00
1S
tan
dar
der
rors
are
inp
aren
thes
esan
dar
ecl
ust
ered
atth
eh
osp
ital
leve
l.A
llre
gre
ssio
ns
incl
ud
eh
osp
ital
and
year
fixed
effec
ts,
asw
ell
asa
set
ofh
osp
ital
-lev
elco
ntr
olva
riab
les
incl
ud
ing
size
,ow
ner
ship
statu
s,te
ach
ing
statu
s,h
osp
itali
stu
se,
syst
emm
emb
ersh
ip,
trau
ma
cente
rst
atu
s,an
dM
edic
are/
Med
icai
dd
isch
arge
s.P
atie
nt-
leve
lch
aract
eris
tics
incl
ud
eage,
sex,
race
,an
dth
ein
tera
ctio
ns
ofth
ese
dem
ogra
ph
icva
riab
les,
pas
tad
mis
sion
,an
da
set
ofd
iagn
osis
-rel
ated
grou
p(D
RG
)du
mm
ies.
47

Tab
le10
:E
ffec
tof
EM
Ron
Thir
tyD
ayR
eadm
issi
onR
ate
Dep
endent
Vari
able
:Thir
tyD
ay
Read
mis
sion
Pneum
onia
CH
FA
MI
Hip
Fra
ctu
re(1
)(2
)(3
)(4
)(5
)(6
)(7
)(8
)
EM
R-0
.001
29-0
.006
70∗∗
-0.0
0005
47-0
.006
27∗
-0.0
0052
8-0
.003
010.
0038
0-0
.000
443
(0.0
0255
)(0
.002
59)
(0.0
0235
)(0
.002
71)
(0.0
0342
)(0
.003
70)
(0.0
0426
)(0
.004
45)
EM
R*R
eadm
issi
ont
0.01
25∗∗
∗0.
0072
6∗0.
0022
20.
0158
∗∗
(0.0
0375
)(0
.003
64)
(0.0
0430
)(0
.005
71)
EM
R*R
eadm
issi
on*S
ameH
ospit
al-0
.002
920.
0019
00.
0078
8-0
.005
23(0
.003
88)
(0.0
0350
)(0
.005
01)
(0.0
0596
)N
7945
5979
4559
9882
4698
8246
4693
3746
9337
4040
9940
4099
adj.R
20.
032
0.04
20.
022
0.03
00.
094
0.09
60.
139
0.13
9F
-Tes
t0.
164
0.78
50.
868
0.01
94(E
MR
+E
MR
*Rea
dm
issi
on=
0)
F-T
est
0.31
60.
258
0.12
60.
0565
(∑ All
3C
oeffi
cien
ts=
0)
∗p<
0.05
,∗∗
p<
0.01
,∗∗
∗p<
0.0
01S
tan
dar
der
rors
are
inpar
enth
eses
and
are
clu
ster
edat
the
hos
pit
al
leve
l.A
llre
gre
ssio
ns
incl
ud
eh
osp
ital
and
year
fixed
effec
ts,
asw
ell
asa
set
ofh
osp
ital
-lev
elco
ntr
olva
riab
les
incl
ud
ing
size
,ow
ner
ship
stat
us,
teach
ing
statu
s,h
osp
itali
stu
se,
syst
emm
emb
ersh
ip,
trau
ma
cente
rst
atu
s,an
dM
edic
are/
Med
icai
dd
isch
arge
s.P
atie
nt-
level
char
acte
rist
ics
incl
ud
eage,
sex,
race
,an
dth
ein
tera
ctio
ns
ofth
ese
dem
ogra
ph
icva
riab
les,
pas
tad
mis
sion
,an
da
set
ofd
iagn
osis
-rel
ated
grou
p(D
RG
)d
um
mie
s.
48
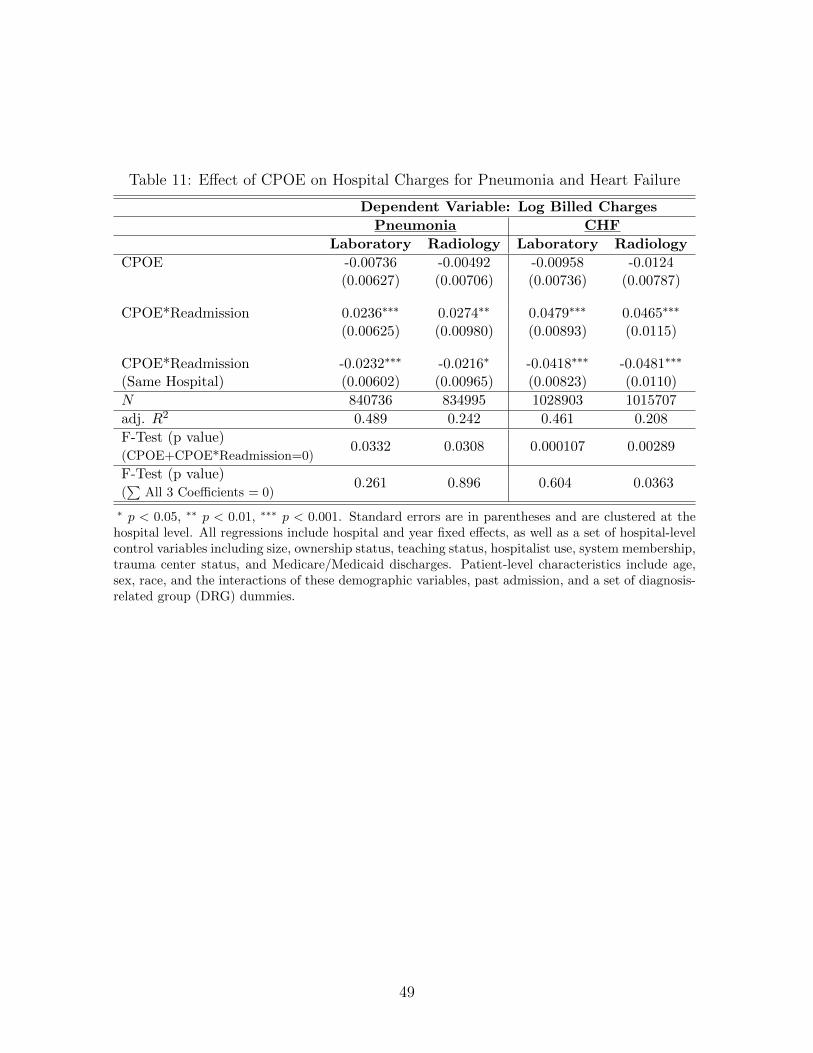
Table 11: Effect of CPOE on Hospital Charges for Pneumonia and Heart Failure
Dependent Variable: Log Billed Charges
Pneumonia CHF
Laboratory Radiology Laboratory Radiology
CPOE -0.00736 -0.00492 -0.00958 -0.0124(0.00627) (0.00706) (0.00736) (0.00787)
CPOE*Readmission 0.0236∗∗∗ 0.0274∗∗ 0.0479∗∗∗ 0.0465∗∗∗
(0.00625) (0.00980) (0.00893) (0.0115)
CPOE*Readmission -0.0232∗∗∗ -0.0216∗ -0.0418∗∗∗ -0.0481∗∗∗
(Same Hospital) (0.00602) (0.00965) (0.00823) (0.0110)
N 840736 834995 1028903 1015707
adj. R2 0.489 0.242 0.461 0.208
F-Test (p value)0.0332 0.0308 0.000107 0.00289
(CPOE+CPOE*Readmission=0)
F-Test (p value)0.261 0.896 0.604 0.0363
(∑
All 3 Coefficients = 0)
∗ p < 0.05, ∗∗ p < 0.01, ∗∗∗ p < 0.001. Standard errors are in parentheses and are clustered at thehospital level. All regressions include hospital and year fixed effects, as well as a set of hospital-levelcontrol variables including size, ownership status, teaching status, hospitalist use, system membership,trauma center status, and Medicare/Medicaid discharges. Patient-level characteristics include age,sex, race, and the interactions of these demographic variables, past admission, and a set of diagnosis-related group (DRG) dummies.
49

Table 12: Effect of EMR on Length of Stay by Publicly Insured Share of Patients
Dependent Variable: Log Length of Stay
Pneumonia CHF AMI Hip Fracture
EMR -0.00685 0.00546 0.00869 0.00751(0.00594) (0.00670) (0.00803) (0.00644)
EMR*HighPublicInsurance -0.00967 -0.00947 -0.0139 -0.00615(0.00912) (0.00956) (0.0111) (0.00919)
EMR*Readmission 0.0221∗∗∗ 0.0139∗∗∗ -0.00860 -0.00273(0.00413) (0.00405) (0.00859) (0.00498)
EMR*HighPublicInsurance*Readmission -0.0171∗∗ -0.0148∗ 0.0145 -0.000478(0.00606) (0.00617) (0.0107) (0.00560)
N 841858 1031316 496472 414890
adj. R2 0.257 0.227 0.397 0.289
∗ p < 0.05, ∗∗ p < 0.01, ∗∗∗ p < 0.001 Standard errors are in parentheses and are clustered at thehospital level. All regressions include hospital and year fixed effects, as well as a set of hospital-levelcontrol variables including size, ownership status, teaching status, hospitalist use, system membership,trauma center status, and Medicare/Medicaid discharges. Patient-level characteristics include age, sex,race, and the interactions of these demographic variables, past admission, and a set of diagnosis-relatedgroup (DRG) dummies.
50
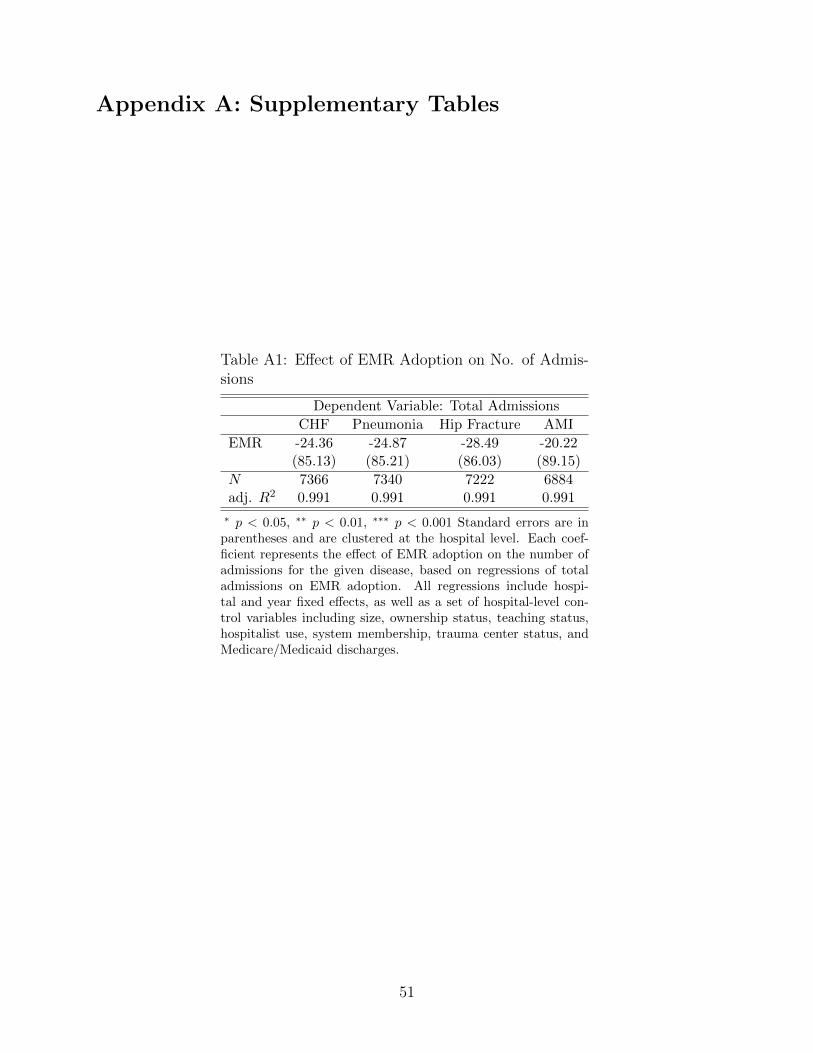
Appendix A: Supplementary Tables
Table A1: Effect of EMR Adoption on No. of Admis-sions
Dependent Variable: Total Admissions
CHF Pneumonia Hip Fracture AMI
EMR -24.36 -24.87 -28.49 -20.22(85.13) (85.21) (86.03) (89.15)
N 7366 7340 7222 6884adj. R2 0.991 0.991 0.991 0.991
∗ p < 0.05, ∗∗ p < 0.01, ∗∗∗ p < 0.001 Standard errors are inparentheses and are clustered at the hospital level. Each coef-ficient represents the effect of EMR adoption on the number ofadmissions for the given disease, based on regressions of totaladmissions on EMR adoption. All regressions include hospi-tal and year fixed effects, as well as a set of hospital-level con-trol variables including size, ownership status, teaching status,hospitalist use, system membership, trauma center status, andMedicare/Medicaid discharges.
51
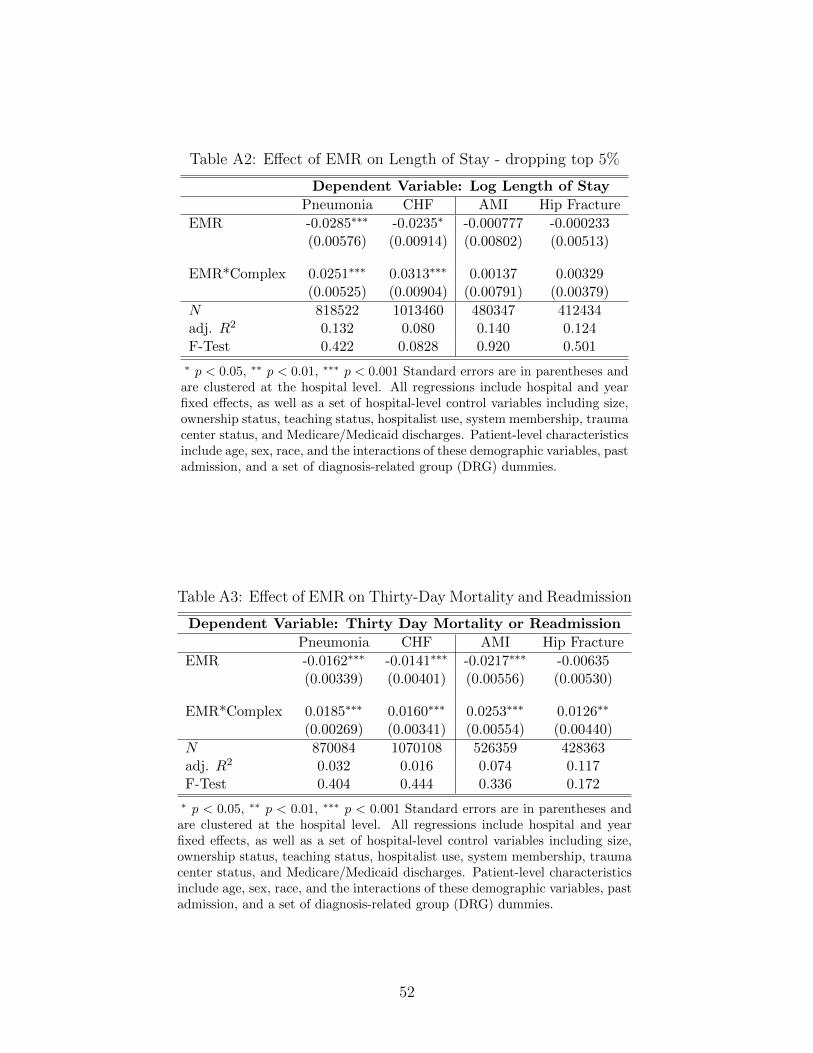
Table A2: Effect of EMR on Length of Stay - dropping top 5%
Dependent Variable: Log Length of Stay
Pneumonia CHF AMI Hip Fracture
EMR -0.0285∗∗∗ -0.0235∗ -0.000777 -0.000233(0.00576) (0.00914) (0.00802) (0.00513)
EMR*Complex 0.0251∗∗∗ 0.0313∗∗∗ 0.00137 0.00329(0.00525) (0.00904) (0.00791) (0.00379)
N 818522 1013460 480347 412434adj. R2 0.132 0.080 0.140 0.124F-Test 0.422 0.0828 0.920 0.501
∗ p < 0.05, ∗∗ p < 0.01, ∗∗∗ p < 0.001 Standard errors are in parentheses andare clustered at the hospital level. All regressions include hospital and yearfixed effects, as well as a set of hospital-level control variables including size,ownership status, teaching status, hospitalist use, system membership, traumacenter status, and Medicare/Medicaid discharges. Patient-level characteristicsinclude age, sex, race, and the interactions of these demographic variables, pastadmission, and a set of diagnosis-related group (DRG) dummies.
Table A3: Effect of EMR on Thirty-Day Mortality and Readmission
Dependent Variable: Thirty Day Mortality or Readmission
Pneumonia CHF AMI Hip Fracture
EMR -0.0162∗∗∗ -0.0141∗∗∗ -0.0217∗∗∗ -0.00635(0.00339) (0.00401) (0.00556) (0.00530)
EMR*Complex 0.0185∗∗∗ 0.0160∗∗∗ 0.0253∗∗∗ 0.0126∗∗
(0.00269) (0.00341) (0.00554) (0.00440)
N 870084 1070108 526359 428363adj. R2 0.032 0.016 0.074 0.117F-Test 0.404 0.444 0.336 0.172
∗ p < 0.05, ∗∗ p < 0.01, ∗∗∗ p < 0.001 Standard errors are in parentheses andare clustered at the hospital level. All regressions include hospital and yearfixed effects, as well as a set of hospital-level control variables including size,ownership status, teaching status, hospitalist use, system membership, traumacenter status, and Medicare/Medicaid discharges. Patient-level characteristicsinclude age, sex, race, and the interactions of these demographic variables, pastadmission, and a set of diagnosis-related group (DRG) dummies.
52

Tab
leA
4:E
ffec
tof
EM
Ron
Up
codin
g
Dep
endent
Vari
able
:H
igh
No.
of
Seco
nd
ary
Dia
gn
ose
sP
neum
onia
CH
FA
MI
Hip
Fra
ctu
re(1
)(2
)(3
)(4
)(5
)(6
)(7
)(8
)
EM
R0.
0040
50.
0050
5-0
.000
315
0.00
230
0.00
198
0.00
387
0.00
386
0.00
625
(0.0
0403
)(0
.004
24)
(0.0
0341
)(0
.003
57)
(0.0
0407
)(0
.004
39)
(0.0
0538
)(0
.005
54)
EM
R*R
eadm
issi
on-0
.003
51-0
.003
01-0
.000
938
-0.0
137∗
∗
(0.0
0342
)(0
.002
47)
(0.0
0427
)(0
.004
77)
EM
R*R
eadm
issi
on*S
ameH
ospit
al0.
0020
2-0
.000
845
-0.0
0620
0.00
984∗
(0.0
0312
)(0
.002
24)
(0.0
0468
)(0
.005
01)
N87
0084
8700
8410
7010
810
7010
852
6359
5263
5942
8546
4285
46ad
j.R
20.
215
0.21
50.
170
0.17
10.
245
0.24
70.
193
0.19
4F
-Tes
t(p
valu
e)0.
750
0.85
80.
573
0.27
9(E
MR
+E
MR
*Rep
eat
=0
)F
-Tes
t(p
valu
e)0.
407
0.65
70.
469
0.67
6(∑ A
ll3
Coeffi
cien
ts=
0)
∗p<
0.0
5,∗∗
p<
0.0
1,∗∗
∗p<
0.00
1S
tan
dar
der
rors
are
inp
aren
thes
esan
dar
ecl
ust
ered
atth
eh
osp
ital
leve
l.A
llre
gre
ssio
ns
incl
ud
eh
osp
ital
and
year
fixed
effec
ts,
asw
ell
asa
set
ofh
osp
ital
-lev
elco
ntr
olva
riab
les
incl
ud
ing
size
,ow
ner
ship
statu
s,te
ach
ing
statu
s,h
osp
itali
stu
se,
syst
emm
emb
ersh
ip,
trau
ma
cente
rst
atu
s,an
dM
edic
are/
Med
icai
dd
isch
arge
s.P
atie
nt-
leve
lch
aract
eris
tics
incl
ud
eage,
sex,
race
,an
dth
ein
tera
ctio
ns
ofth
ese
dem
ogra
ph
icva
riab
les,
pas
tad
mis
sion
,an
da
set
ofd
iagn
osis
-rel
ated
grou
p(D
RG
)du
mm
ies.
53
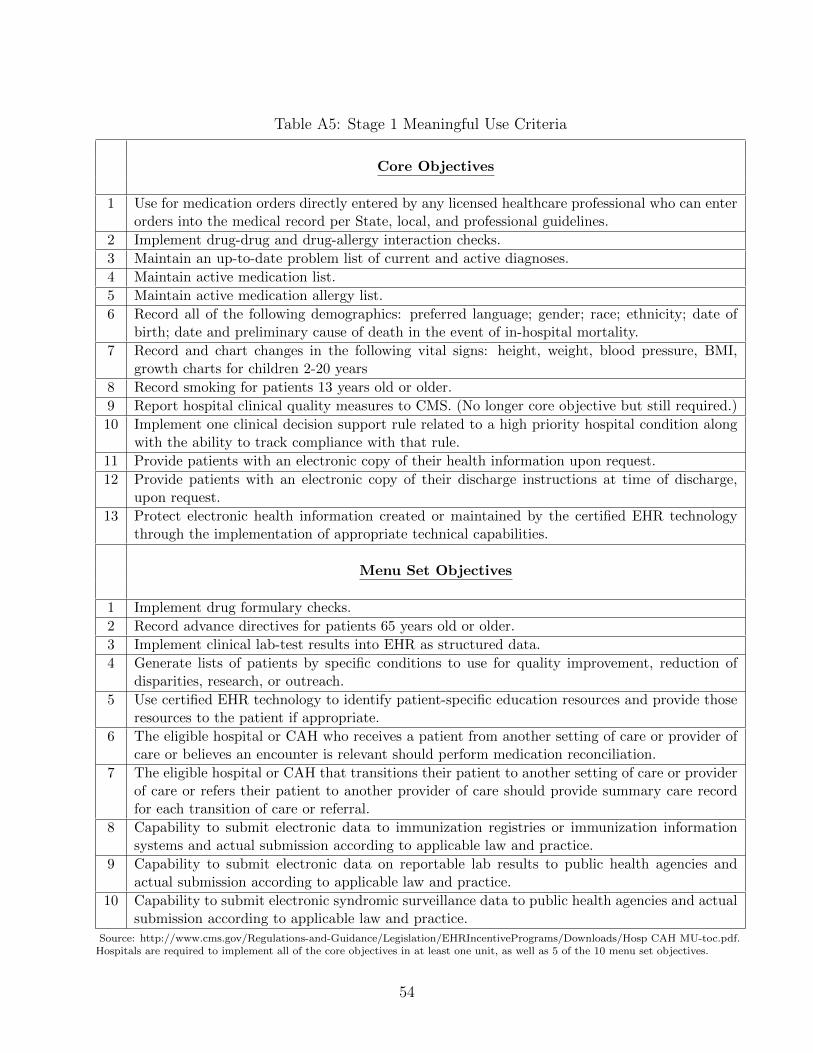
Table A5: Stage 1 Meaningful Use Criteria
Core Objectives
1 Use for medication orders directly entered by any licensed healthcare professional who can enterorders into the medical record per State, local, and professional guidelines.
2 Implement drug-drug and drug-allergy interaction checks.
3 Maintain an up-to-date problem list of current and active diagnoses.
4 Maintain active medication list.
5 Maintain active medication allergy list.
6 Record all of the following demographics: preferred language; gender; race; ethnicity; date ofbirth; date and preliminary cause of death in the event of in-hospital mortality.
7 Record and chart changes in the following vital signs: height, weight, blood pressure, BMI,growth charts for children 2-20 years
8 Record smoking for patients 13 years old or older.
9 Report hospital clinical quality measures to CMS. (No longer core objective but still required.)
10 Implement one clinical decision support rule related to a high priority hospital condition alongwith the ability to track compliance with that rule.
11 Provide patients with an electronic copy of their health information upon request.
12 Provide patients with an electronic copy of their discharge instructions at time of discharge,upon request.
13 Protect electronic health information created or maintained by the certified EHR technologythrough the implementation of appropriate technical capabilities.
Menu Set Objectives
1 Implement drug formulary checks.
2 Record advance directives for patients 65 years old or older.
3 Implement clinical lab-test results into EHR as structured data.
4 Generate lists of patients by specific conditions to use for quality improvement, reduction ofdisparities, research, or outreach.
5 Use certified EHR technology to identify patient-specific education resources and provide thoseresources to the patient if appropriate.
6 The eligible hospital or CAH who receives a patient from another setting of care or provider ofcare or believes an encounter is relevant should perform medication reconciliation.
7 The eligible hospital or CAH that transitions their patient to another setting of care or providerof care or refers their patient to another provider of care should provide summary care recordfor each transition of care or referral.
8 Capability to submit electronic data to immunization registries or immunization informationsystems and actual submission according to applicable law and practice.
9 Capability to submit electronic data on reportable lab results to public health agencies andactual submission according to applicable law and practice.
10 Capability to submit electronic syndromic surveillance data to public health agencies and actualsubmission according to applicable law and practice.
Source: http://www.cms.gov/Regulations-and-Guidance/Legislation/EHRIncentivePrograms/Downloads/Hosp CAH MU-toc.pdf.Hospitals are required to implement all of the core objectives in at least one unit, as well as 5 of the 10 menu set objectives.
54

Appendix B: Legislative Background
This section provides some background information on the HITECH Act 23, which provided incentives for
adoption of certified EMRs via the Medicare and Medicaid programs. Eligible acute care inpatient hospitals
are defined as “subsection (d) hospitals” which are hospitals that are paid under the hospital inpatient
prospective payment system (IPPS) and are located in one of the 50 states or the District of Columbia.
Penalties are supposed to start in 2015. Actual payments in 2011 included $1.38 billion through Medicare
to 604 hospitals and $1.5 billion through Medicaid to 1,043 hospitals. Hospitals are eligible for payments
through both Medicare and Medicaid.
The formula for the Medicare payment in the first year is:
[2,000,000 + Discharge Related Amount] * Medicare Share of Inpatient Days
The formula for the Medicaid payment in the first year is:
[2,000,000 + Discharge Related Amount] * Medicaid Share of Inpatient Days
Only hospitals which have at least 10% of discharges on Medicaid are eligible.
The “Discharge Related Amount” for a 12 month period is:
• 0 for the first 1,149 discharges
• $200 per discharge for discharges between 1,150 and 23,000
• 0 for discharges in excess of 23,000
The formula for calculating the Medicare/Medicaid share includes an adjustment for charity care charges
as a proportion of total charges. This effectively increases the Medicare/Medicaid share resulting in higher
incentive payments for hospitals that provide a greater proportion of charity care.
Hospitals that demonstrate that they are meaningful users of certified EHR technology in FYs 2011,
2012, or 2013 could receive up to four years of financial incentive payments. Hospitals that begin receiving
incentive payments later than FY 2013 will receive no more than three years of incentive payments.
Data on acute care hospital discharges from the hospitals most recently filed 12-month cost report at
the time of the calculation is used as the basis for making preliminary incentive payments. Eligible hospitals
can receive payments for attesting to the meaningful use of certified EHRs by reporting on 13 required core
objectives and 5 of 10 menu set objectives. These objectives are detailed in Table A5.
23Source: Centers for Medicare and Medicaid Services
55
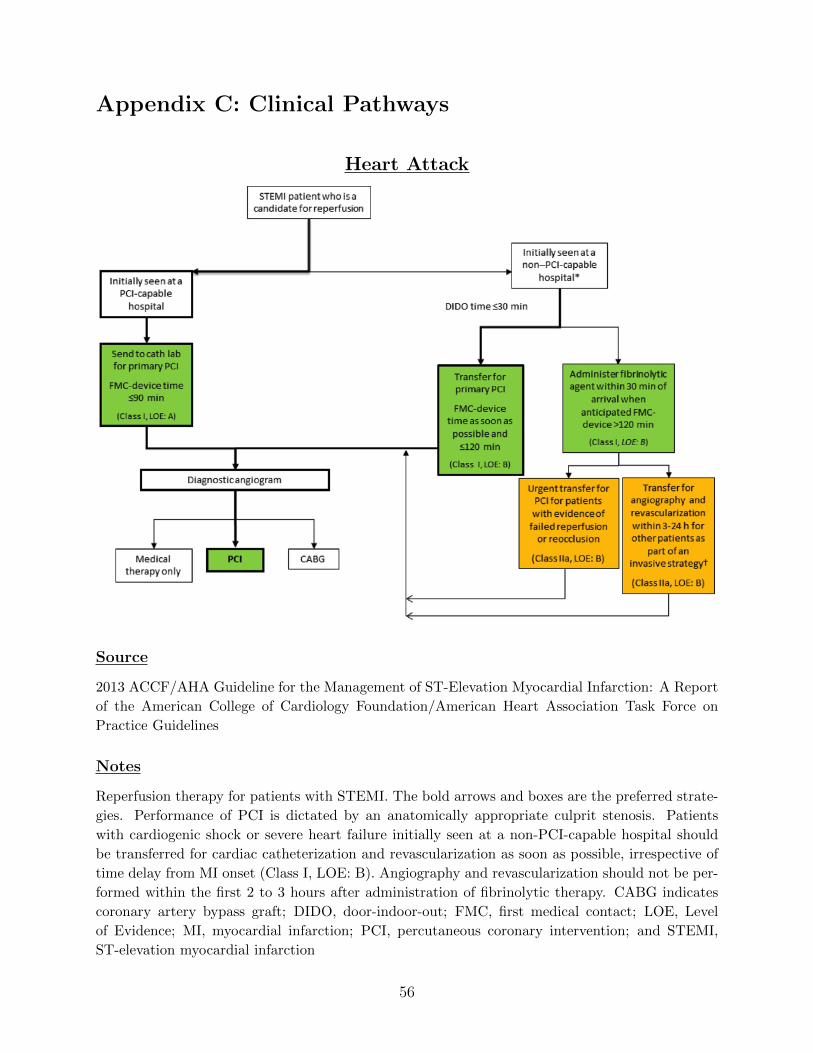
Appendix C: Clinical Pathways
Heart Attack
Source
2013 ACCF/AHA Guideline for the Management of ST-Elevation Myocardial Infarction: A Report
of the American College of Cardiology Foundation/American Heart Association Task Force on
Practice Guidelines
Notes
Reperfusion therapy for patients with STEMI. The bold arrows and boxes are the preferred strate-
gies. Performance of PCI is dictated by an anatomically appropriate culprit stenosis. Patients
with cardiogenic shock or severe heart failure initially seen at a non-PCI-capable hospital should
be transferred for cardiac catheterization and revascularization as soon as possible, irrespective of
time delay from MI onset (Class I, LOE: B). Angiography and revascularization should not be per-
formed within the first 2 to 3 hours after administration of fibrinolytic therapy. CABG indicates
coronary artery bypass graft; DIDO, door-indoor-out; FMC, first medical contact; LOE, Level
of Evidence; MI, myocardial infarction; PCI, percutaneous coronary intervention; and STEMI,
ST-elevation myocardial infarction
56
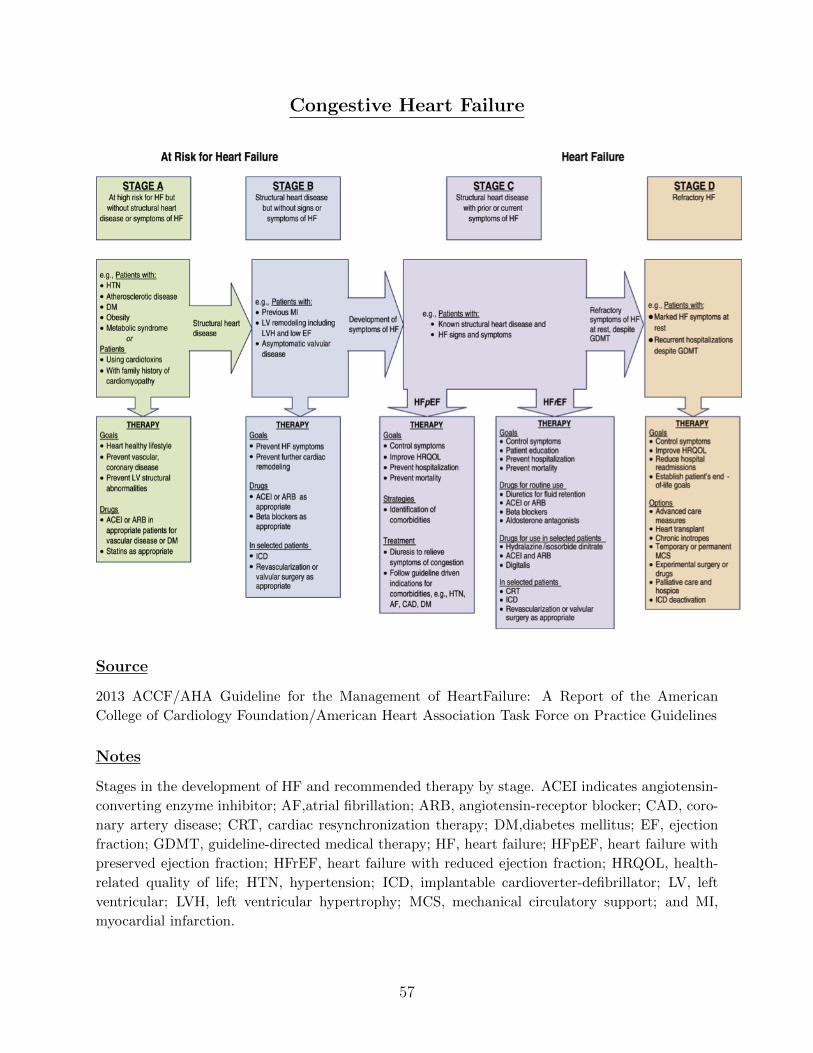
Congestive Heart Failure
Source
2013 ACCF/AHA Guideline for the Management of HeartFailure: A Report of the American
College of Cardiology Foundation/American Heart Association Task Force on Practice Guidelines
Notes
Stages in the development of HF and recommended therapy by stage. ACEI indicates angiotensin-
converting enzyme inhibitor; AF,atrial fibrillation; ARB, angiotensin-receptor blocker; CAD, coro-
nary artery disease; CRT, cardiac resynchronization therapy; DM,diabetes mellitus; EF, ejection
fraction; GDMT, guideline-directed medical therapy; HF, heart failure; HFpEF, heart failure with
preserved ejection fraction; HFrEF, heart failure with reduced ejection fraction; HRQOL, health-
related quality of life; HTN, hypertension; ICD, implantable cardioverter-defibrillator; LV, left
ventricular; LVH, left ventricular hypertrophy; MCS, mechanical circulatory support; and MI,
myocardial infarction.
57
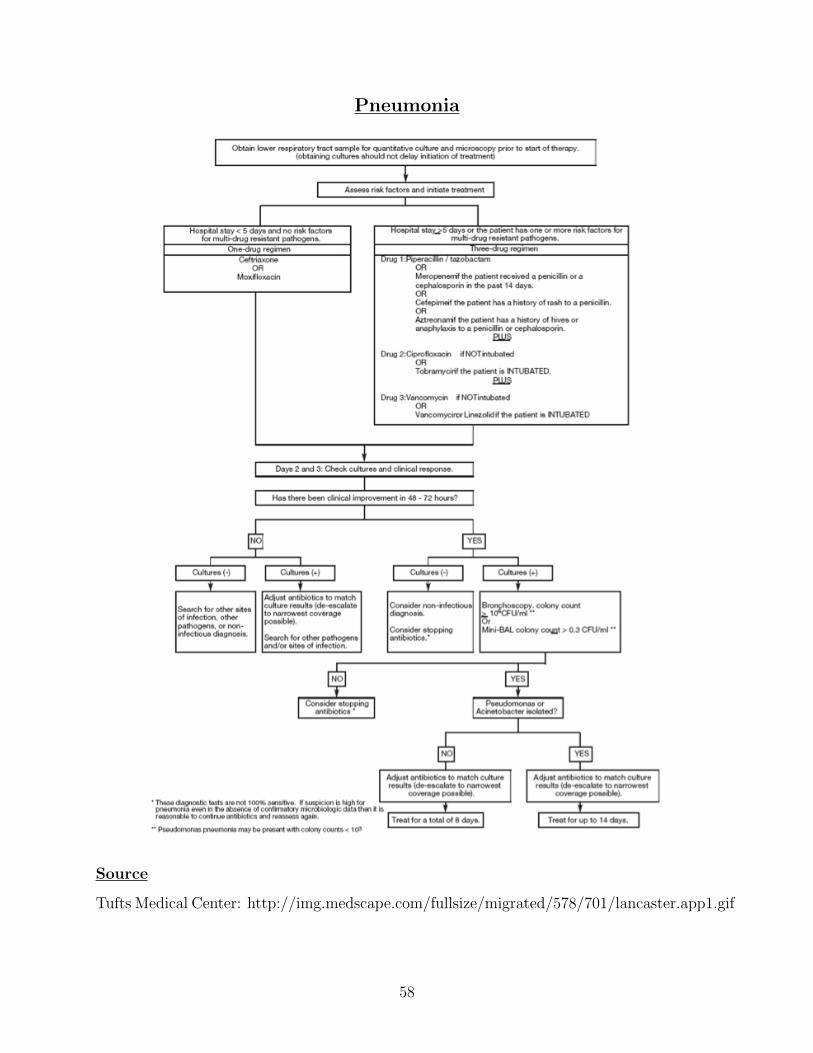
Pneumonia
Source
Tufts Medical Center: http://img.medscape.com/fullsize/migrated/578/701/lancaster.app1.gif
58
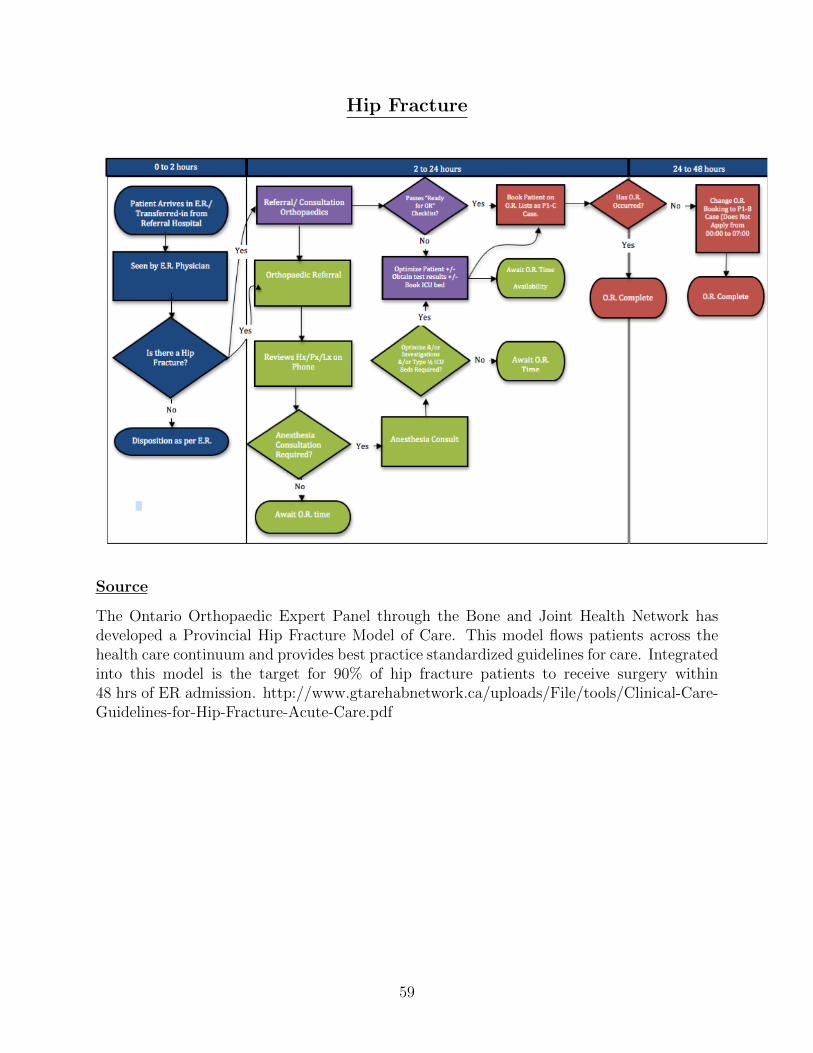
Hip Fracture
Source
The Ontario Orthopaedic Expert Panel through the Bone and Joint Health Network hasdeveloped a Provincial Hip Fracture Model of Care. This model flows patients across thehealth care continuum and provides best practice standardized guidelines for care. Integratedinto this model is the target for 90% of hip fracture patients to receive surgery within48 hrs of ER admission. http://www.gtarehabnetwork.ca/uploads/File/tools/Clinical-Care-Guidelines-for-Hip-Fracture-Acute-Care.pdf
59
Appendix D: Case Studies
Case 1: Adoption of Computed Radiography at Geisinger Health System24
The Geisinger Health System is an integrated health provider serving a base of approximately2.6 million patients throughout Pennsylvania. More than 200,000 imaging studies per year areperformed in the Geisinger Health System. There are 437 beds at Geisinger Medical Center, thelargest facility in the system, and the Geisinger group employs 27 FTE radiologists.
A picture archiving and communication system (PACS) is a medical imaging technology whichprovides economical storage of and convenient access to, images from multiple modalities (sourcemachine types). Electronic images and reports are transmitted digitally via PACS; this eliminatesthe need to manually file, retrieve, or transport film jackets. At Geisinger Health System, PACSpreceded digital X-ray. Patient images acquired through other imaging modalities were quicklyand easily accessible, but caregivers often had to wait overnight for X-ray images to be physicallytransferred from outlying clinics to the medical center in Danville.
The impetus to upgrade came from Geisinger’s transition to an EMR in 2001. With the EMR,physicians very quickly became accustomed to having near-instantaneous access to comprehen-sive patient records, including images stored on a PACS. Notably absent, however, were X-rayexams, which account for more than half of the 200,000 diagnostic studies conducted annuallyin the Geisinger Health System. According to Sally Womer, Geisinger’s coordinator of qualityimprovement:
“All of our clinic physicians use the same medical record. They are used to havinginformation at their fingertips. The EMR was so quick and accessible that it calledattention to how slow and outdated our manual process for handling X-rays really was.”
The radiology group at Geisinger Medical Center, a level 1 trauma center, was the first touse FUJIFILM Computed Radiography (FCR) for trauma care. With SmartCRs installed in boththe pediatric ICU and the adult ICU, the long walks to those departments to read films have beeneliminated. Since the pediatric ICU is a distance equal to two city blocks from the radiology depart-ment, having digital radiographs available on the PACS keeps the radiologists at the workstationin the department - not down the street chasing films - and thus more productive.
Because of the wider dynamic range of FUJIFILM CR, the number of repeat exams and call-backs automatically drops. Geisinger physicians have noticed big improvements in X-ray imagequality. Bone images produced with conventional processing rarely show the trabecular pattern,which is now evident on the FUJIFILM CR images. CR also provides a good skin line, which isimportant to some readers because it represents the image more accurately. A PACS feature oftenused with the CR images is magnification of a region of interest. With the magnification feature,one click provides a close-up view. No detail is lost and no additional time is required. The mostimportant benefits of FCR relate to patient care. Those caregivers who used to wait all day for aradiologic image, now receive it within minutes.
24Source: Fujifilm Corporation
60
Case 2: Adoption of a Comprehensive EMR at Sentara Healthcare25
Sentara Healthcare is a not-for-profit health care organization headquartered in Norfolk, Virginia,and serving more than 2 million residents in Virginia and northeastern North Carolina. Sentaraoperates more than 100 sites, including ten acute care hospitals with a total of 1,911 beds, nine out-patient care campuses, seven nursing centers, three assisted living centers, and about 380 primarycare and multi-specialty physicians
Sentara planned, implemented and proactively managed the EHR project (called Sentara eCareHealth Network) over a five-year period after signing a contract with Epic in 2005. eCare softwareapplications include Epic’s inpatient and physician practice EHR, pharmacy, health informationmanagement, emergency department, oncology, bed flow management, and scheduling. Supple-mental applications include bar-coding, faxing, and patient health record. eCare used Six Sigmamethodology to redesign 18 major workflows.
The order entry process was redesigned and automated via the computerized physician ordermanagement (CPOE) application. CPOE significantly reduced turn around time for order process-ing and patient care delivery. The average time for administration of a NOW medication dose afterorder creation was reduced from approximately 90 minutes to 30 minutes or less. Order sets arestandard across the system and are evidence-based. CPOE eliminated the ambiguity of writtenorders. Clinical decision support tools, such as medication alerts, have reduced the need for nursesand pharmacists to validate orders through callbacks.
Sentara redesigned patient flow and care management processes to enable real-time commu-nications of patient status, bed need and bed availability. A pull process allows staff to directthe patient to the appropriate bed on a given unit without a central staff intervention. Lengthof stay is visible to caregivers on the patient banner, increasing awareness of actual vs. expectedlength-of-stay. Medical Care Management staff pushes data on patients awaiting placement out tolong-term care facilities, which facilitates better handoffs and information transfer. The redesign ofthe workflows resulted in a 16,000 patient day length of stay reduction and a reduced turnaroundtime for bed availability from ED to inpatient of 90 minutes
No paper charts remain in medical records departments. Medical records realized a $3 milliondollar reduction due to the paperless environment. There has been a $1.4 million reduction intranscription costs and malpractice premiums. Claims denials have decreased by $500,000 annually.Medical records departments now require minimal hospital space.
88,500 potential medication errors were avoided due to bar-coding scanning alerts. 7 of 10emergency departments improved their triage performance; 4 of 10 EDs improved their admit timeperformance; and all hospitals improved their patient throughput times. The percentage of patientswith angioplasty within 90 minutes of arrival increased from 78%, ( Q1 2009 to 90%, in first quarterof Q1 2010. The percentage of outpatient surgery patients who had antibiotics started within 60minutes of incision increased from 84% (Q1 2009) to 92% (Q1 2010).
Elimination of duplicate orders reduced inpatient lab tests by 5.5 %. There were $9.4 million insavings due to reduction in nursing overtime and purchased labor. The time from bed assignmentto admit an ED patient has decreased 90 minutes. Central scheduling average speed to answer wasreduced from 71 to 10 seconds.
25Source: Epic Systems Corporation
61