technology and people: the great job-creating machine · pdf filetechnology and people: the...
TRANSCRIPT

Technology and people:The great job-creating machine

1. Technology and people: The great job-creating machine 1
2. Innovation: Frenetic, uncoordinated, pervasive 2
3. The technology debate is skewed towards destruction 3
4. Jobs, technology and the lessons of history 4
5. Conclusions 10
6. Datasets and references 11
Contents

Technology and people:The great job-creating machine
A positive narrative about technology and progress has dominated history. Improvements in living standards, which have been felt by most, from generation to generation, and an accumulation of life-changing innovations, from the steam engine to antibiotics, to mass travel, TV and communication, have made progress tangible.
From time-to-time this narrative has been punctuated by fears about the job-destroying effects of technology. From the Luddites of the eighteenth century through the technological Jeremiahs of today, the theme persists, of machines impoverishing and destroying opportunity for humans.
The mood now is once again of caution. Advances in machine learning and enormous increases in storage, processing and communication capacity are enabling machines to tackle complex tasks involving thought and judgement, which were once the sole preserve of humans. Jobs are being automated more quickly, or made less labour intensive.
A recent PEW Foundation survey summed up the views of US technology experts. Almost half of them, 48%, believe that robots and digital agents will displace significant numbers of both unskilled and skilled workers with many expressing concern that this will lead to mass unemployment. Such worries feed into, and reflect, a wider pessimism about long-term growth prospects for the West.
The debate on technology has many aspects, encompassing everything from education to inequality, productivity to jobs. This paper focuses on employment. We argue that the current discourse is biased towards the job-destroying effects of technological change due to the relative unpredictability of its creative aspects. To make up for this human limitation, we analyse employment data covering one and a half centuries from the England and Wales census and the Labour Force Survey and identify four mechanisms, as shown in Graphic 1, through which technology has led to overall job creation in the past.
Ian Stewart, Debapratim De and Alex Cole, economists at Deloitte LLP, are the authors of this paper. It was shortlisted for the Society of Business Economists’ Rybczynski prize and expresses their
personal views.
Graphic 1. Four mechanisms through which technology affects employment
Ind
irec
t ef
fect
sD
irec
t ef
fect
s 1. Technology substitutes labour, raising productivity and lowering prices
e.g. agriculture and manufacturing
3. Technology complements labour, leading to improved outcomes in sectors which subsequently expand and generate new demand for labour
e.g. medicine, management consulting
2. Sectors which are the source of technological innovation expand rapidly, demanding increased labour
e.g. software engineering, scientific research
4. Lower costs of production and prices enable consumers to shift spending to more discretionary goods and services, generating new demand for labour
e.g. entertainment, gyms
1Technology and People The great job-creating machine

InnovationFrenetic, uncoordinated, pervasive
Technology develops over time in an unpredictable, haphazard fashion. We tend to think of a moment in history when one brilliant invention changes the world. The reality is more prosaic, of a lengthy, chaotic progression in which unrelated forces, over time, add, refine and apply technology.
The steam engine, the machine at the heart of the Industrial Revolution, illustrates this process. It was invented by Thomas Newcomen in 1711 to pump water out of his flooded coal mines. More than fifty years later, while repairing a Newcomen engine, James Watt refined it to produce more power, thereby enabling its wider deployment. Other inventions and refinements followed which made steam into a true general purpose technology, leading to its application across production and in sea and land transport. In all, it took a century and a half to realise the full potential of steam.
The progress of electricity was faster but hardly breakneck. The big impact of electricity on American productivity was in the 1920s, when US factories became organised around electrical power, 40 years after the experiments of Thomas Edison.
The final application of a technology is often distant from what its originator had imagined. Ideas build on themselves, in a chaotic and free-market fashion, with countless failures and dead ends along the way. The writer Matt Ridley memorably described this as “ideas having sex”.
This process means that many of the most profound effects of technology are indirect and unforeseen. Car ownership was the essential pre-condition for the growth of the American suburbs.
The explosion in photography in the last few years has been driven by what might initially have seemed the incongruous pairing of the telephone with the camera. As the Nobel Laureate Herbert Simon noted, before the car, one of the most important skills of a doctor was the ability to ride a horse or drive a trap to reach his patients; now, in the era of the car, doctors sit in their surgeries and their patients come to them.
Ultimately, technology shapes society itself. Rising female workforce participation has been facilitated by inventions such as the contraceptive pill, labour-saving domestic technologies and convenience foods. The ageing of the West’s population reflects the effects of technology in raising incomes, controlling fertility and extending life.
We cannot predict how today’s technology will shape tomorrow’s society, or which goods and services its citizens will demand. Who, for instance, could have predicted 60 years ago the role coffee shops, gyms and mobile telephony would play in our lives in the early twenty-first century?
The final application of a technology is often distant from what its originator had imagined. Ideas build on themselves, in a chaotic and free-market fashion, with countless failures and dead ends along the way.
2

The technology debate is skewed towards destruction
Despite all the benefits technology has brought, the idea of conflict between technology and labour is almost as embedded in the popular imagination as the notion of the conflict between labour and capital in the Marxist world. While change is the driver of prosperity, it is also profoundly unsettling.
The destruction brought about by technology is direct and easily observed. Two small examples involving the rise of self-service make the point. If you are a regular user of a mobile banking app you probably find yourself making less use of the bank’s call centre. And in supermarkets more of us are doing our own scanning and paying at self-service checkouts. This kind of highly visible displacement of labour makes humans see risks in future innovations even as they enjoy the benefits of past ones.
Academics have attempted to quantify the number of jobs that could be destroyed in future by recent technological advances. In a recent report for Deloitte, Michael Osborne and Carl Frey of Oxford University, assessed that 35% of jobs in the UK are at high risk of automation in the next ten to twenty years.*
Osborne and Frey’s analysis sheds light on the destructive effects of technological change on jobs. The creative effects are far more chaotic and unpredictable, depending on the vagaries of developing needs and fashions, and the interaction of employment with technology.
While change is the driver of prosperity, it is also profoundly unsettling.
*Deloitte LLP, Micheal Osborne and Carl B. Frey, Agiletown: the relentless march of technology and London’s reponse, November 2014.
3Technology and People The great job-creating machine

Jobs, technology and the lessons of history
If the effects of technology on employment – especially the job-generating qualities – are so unpredictable, are there any durable lessons that can be gleaned from history? We have examined two major data sources for clues: census records on employment in England and Wales for every decade year since 1871 (the first census for which detailed occupational data were collated, whilst the War caused a break in the series in 1941) and Labour Force Survey (LFS) data, from 1992, arranged by Standard Occupational Classification.
Establishing consistent definitions of occupations over time is a longstanding problem, one the Census of 1871 described as, “the most laborious, the most costly, and…the least satisfactory” part of measuring changes in employment.
Table 1. Fastest growing and fastest shrinking occupations since 1992*
Occupations
Employment in
Change since 1992
1992 2014
Total employment 24,746,881 30,537,415 23%
Nursing auxilliaries and assistants 29,743 300,201 909%
Teaching and educational support assistants 72,320 491,669 580%
Management consultants and business analysts
40,458 188,081 365%
Information technology managers and above 110,946 327,272 195%
Welfare, housing, youth and community workers
82,921 234,462 183%
Care workers and home carers 296,029 792,003 168%
Actors, dancers, entertainment presenters, producers and directors
47,764 122,229 156%
Financial managers and directors 88,877 205,857 132%
Footwear and leather working trades 40,715 7,528 -82%
Weavers and knitters 24,009 4,961 -79%
Metal making and treating process operatives 39,950 12,098 -70%
Typists and related keyboard occupations 123,048 52,580 -57%
Company secretaries 90,476 43,181 -52%
Energy plant operatives 19,823 9,652 -51%
Farm workers 135,817 68,164 -50%
Metal machining setters and setter-operators 89,713 49,861 -44%
To provide consistent data we have adjusted the census and LFS data by, for instance, aggregating changed occupations over time. Definitional issues may contribute to changes in numbers between surveys, and for this reason we tend to focus on underlying trends over time.
Table 1 provides an overview of creative destruction in the UK labour force since 1992. The dominant trend is of contracting employment in agriculture and manufacturing being more than offset by rapid growth in the caring, creative, technology and business services sectors.
Source: Labour Force Survey, authors’ calculations *Does not include occupations for which LFS sample sizes are too low for a reliable employment estimate or those that have been subsumed into significantly larger occupations due to changes in classification.
4
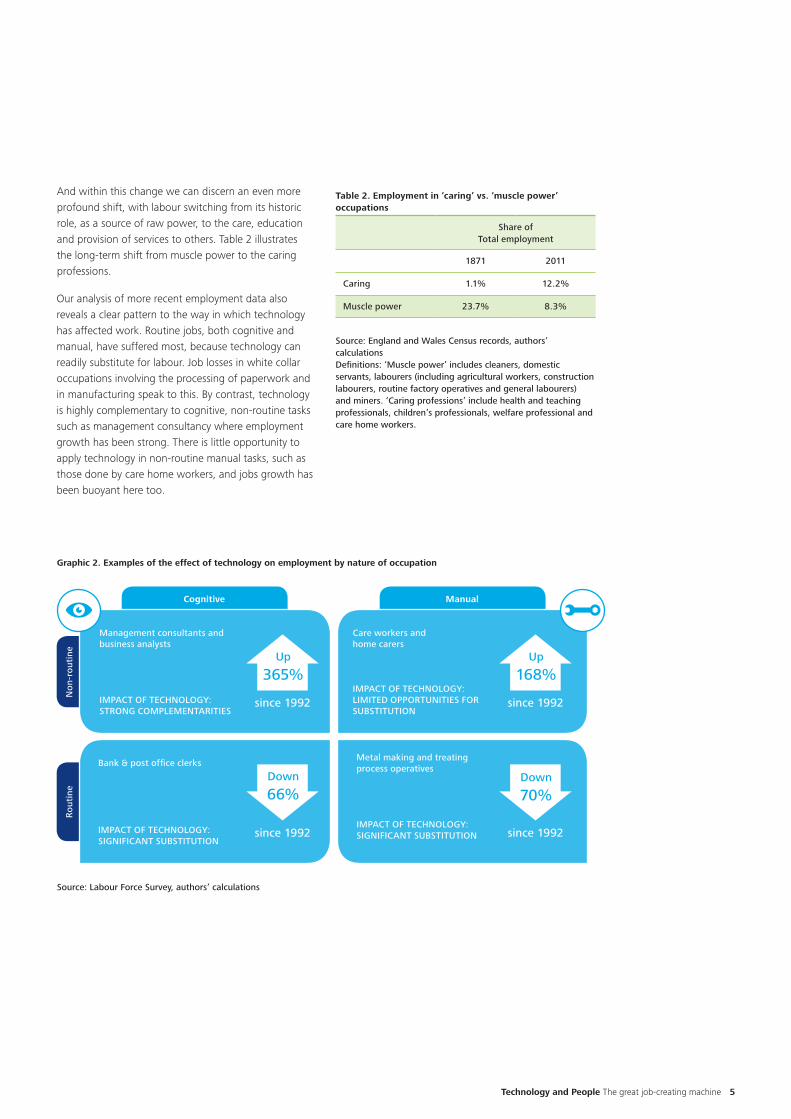
Our analysis of more recent employment data also reveals a clear pattern to the way in which technology has affected work. Routine jobs, both cognitive and manual, have suffered most, because technology can readily substitute for labour. Job losses in white collar occupations involving the processing of paperwork and in manufacturing speak to this. By contrast, technology is highly complementary to cognitive, non-routine tasks such as management consultancy where employment growth has been strong. There is little opportunity to apply technology in non-routine manual tasks, such as those done by care home workers, and jobs growth has been buoyant here too.
Table 2. Employment in ‘caring’ vs. ‘muscle power’ occupations
Share of Total employment
1871 2011
Caring 1.1% 12.2%
Muscle power 23.7% 8.3%
Source: England and Wales Census records, authors’ calculations Definitions: ‘Muscle power’ includes cleaners, domestic servants, labourers (including agricultural workers, construction labourers, routine factory operatives and general labourers) and miners. ‘Caring professions’ include health and teaching professionals, children’s professionals, welfare professional and care home workers.
Graphic 2. Examples of the effect of technology on employment by nature of occupation
And within this change we can discern an even more profound shift, with labour switching from its historic role, as a source of raw power, to the care, education and provision of services to others. Table 2 illustrates the long-term shift from muscle power to the caring professions.
Cognitive Manual
Ro
uti
ne
No
n-r
ou
tin
e
Management consultants and business analysts
IMPACT OF TECHNOLOGY:STRONG COMPLEMENTARITIES
Bank & post office clerks
IMPACT OF TECHNOLOGY:SIGNIFICANT SUBSTITUTION
Metal making and treating process operatives
IMPACT OF TECHNOLOGY:SIGNIFICANT SUBSTITUTION
Care workers and home carers
IMPACT OF TECHNOLOGY:LIMITED OPPORTUNITIES FOR SUBSTITUTION
since 1992
Up
365%
since 1992
Down
66%
since 1992
Up
168%
since 1992
Down
70%
Source: Labour Force Survey, authors’ calculations
5Technology and People The great job-creating machine

0
100
200
300
400
500
600
700
800
900
1,000
20112001199119811971196119511931192119111901189118811871
Source: England and Wales Census records, authors’ calculations
Thousands % of workforce
Chart 1. Agricultural labourers
Number of Agricultural labourers (LHS) % of workforce (RHS)
0.00
1.00
2.00
3.00
4.00
5.00
6.00
7.00
8.00
Using the census and LFS data, we identify the following four mechanisms through which technology and the labour market interact:
1. Technology substitutes labour as a source of energy Perhaps the most obvious area is where technology directly substitutes human muscle power and, in so doing, raises productivity and shrinks employment. In the UK, the first sector to feel this effect on any scale was agriculture. In 1871, 6.6% of the workforce of England and Wales were classified as agricultural labourers. Today that has fallen to 0.2%, a 95% decline in numbers (Chart 1).
The same forces have been at work in manufacturing. A recent paper from the ONS shows that employment in manufacturing has fallen from 38% of the workforce in 1948 to 8% in 2012.
Source: England and Wales Census records, authors’ calculations
Thousands % of workforce
Chart 2. Washers, Launderers
Number of Washers, Launderers (LHS) % of workforce (RHS)
0
50
100
150
200
250
201120011991198119711961195119311921191119011891188118710.00
0.20
0.40
0.60
0.80
1.00
1.20
1.40
1.60
1.80
As in agriculture, falling manufacturing employment reflects the growth of international trade and the effect of shifting production to cheaper countries overseas. But globalisation is, itself, a beneficiary of technological change through advances in communication, transportation and the mobility of capital.
The census data also provide an insight into the interaction of technology and employment in a once-large, but now almost forgotten, sector. In 1901, in a population in England and Wales of 32.5 million, 200,000 people were engaged in washing clothes. By 2011, with a population of 56.1 million just 35,000 people worked in the sector, most in launderettes or commercial laundries. A collision of technologies, indoor plumbing, electricity and the affordable automatic washing machine have all but put paid to large laundries and the drudgery of hand washing. (Chart 2).
6

In real terms, the cost of getting the laundry done, of food and of manufactured products has fallen, in part, because of the application of technology. Much of the benefit of technology flows to labour as consumers. (It is striking how many technologies improve the lot of consumers but fail to do much for their investors.)
The effect of rising productivity in agriculture and manufacturing can be seen in the shrinking share of consumer spending accounted for their output.
Better productivity, and growing international trade, has shrunk the share of food in the retail price index basket from 34.8% in 1950 to 11.4% in 2014. Off-shoring and rapid gains in productivity have also reduced the share of clothing and footwear costs in the RPI basket from 9.7% to 4.5% over the same time. The real price of cars has halved in the UK in the last 25 years, and its share in the RPI basket has almost halved.
Improvements in the quality and pricing of electronic goods have been particularly striking. These gains accelerated with the switch from mechanical components and transistors to digital components in the 1970s. In 1948, a Freed-Eiseman 16-inch TV cost $795 in the US, roughly a quarter of the average annual salary, or roughly $12,000 today.
A top of the range TV can be bought today for less than $1,000. On a quality-adjusted basis, the decline in prices is even more pronounced. US CPI data show that the price of a TV has fallen by 98% since 1950.
2. Jobs are created for the drivers of technological changeWe are also familiar with the way in which technology directly creates employment in new sectors. In the last 35 years, two of the top ten fastest growing occupations in the UK have been in the technology sector. The number of information technology managers has risen by a factor of 6.5, to over 327,000; and the number of programmers and software development professionals has risen by a factor of almost three, to 274,160.
But history shows this is a dynamic process, in which, in time, technologies become obsolete and are supplanted. The number of people employed as telephone and telegraph operators rose by a factor of forty in the 100 years to 1971. Since then employment has shrunk as automated switchboards, the internet and mobile telephony have taken off (Chart 3).
Source: England and Wales Census records, authors’ calculations
Data for 1931 have been interpolated due to discontinuities in definitions and data
Thousands % of workforce
Chart 3. Telephonists, Telegraph Operators
Number of Telephonist, Telegraph Operators (LHS) % of workforce (RHS)
0
20
40
60
80
100
120
140
201120011991198119711961195119311921191119011891188118710.00
0.10
0.20
0.30
0.40
0.50
0.60
7Technology and People The great job-creating machine

Source: England and Wales Census records, authors’ calculations
Data for 1921 and 1931 have been interpolated due to discontinuities in definitions and data
Thousands % of workforce
Chart 4. Accountants
Number of accountants (LHS) % of workforce (RHS)
0
50
100
150
200
250
201120011991198119711961195119311921191119011891188118710.00
0.10
0.20
0.30
0.40
0.50
0.60
0.70
0.80
3. Technology creates jobs in knowledge-intensive sectorsThe direct job-creating and job-destroying properties of technology are relatively clear and well understood. What is less obvious is the way in which some technology and knowledge-using sectors combine rising productivity and higher employment over time.
Demand for specialist services such as medicine, business and professional services, marketing, design and education have increased as incomes have risen. These sectors help customers benefit from improvements in specialist knowledge and assist them in navigating complexity. The application of technology to these sectors has raised productivity and improved outcomes. This can be seen most spectacularly in medicine; but easy access to information and the accelerating pace of communication have revolutionised most knowledge-based industries.
Thus, far from technology and jobs being in opposition, in areas including medicine, education and professional services, employment and technology have marched together. The 1871 census records that there were 9,832 accountants in England and Wales. Their numbers have risen twenty-fold in the last 140 years to 215,678 (Chart 4).
Over the last 150 years, the state has taken a growing role in the provision of health and education – two major knowledge-and-technology-intensive industries. The nineteenth century welfare state was miniscule by today’s standards. Most people met their own needs, relying on family and friends or charities or going without. In 1851, government expenditure accounted for less than 10% of UK GDP and the bulk of this was on the armed forces. Spending on health, education and welfare has been the engine behind the subsequent expansion of the state. Over the last 50 years, public expenditure has accounted for an average of 43% of GDP. Consumers have expressed their preference for state provision through the ballot box, and the state is now the dominant provider of health and education.
Nursing illustrates the growing specialisation, and professionalisation, that has been seen in many other services in the last 150 years. Until the middle of the nineteenth century nursing was generally seen as a low-skilled, low-status role, closer to domestic service than medicine. At the time of the 1871 census most nursing was done by domestic servants, family and nuns. The census of 1871 recorded only 28,000 “sick and invalid” nurses. The reforms of the late nineteenth century, partly a response to the pioneering work of Florence Nightingale, led to an expansion in the number of professional nurses which accelerated rapidly after the creation of the National Health Service in 1948. The 2011 census recorded almost three quarters of a million nurses in England and Wales, 26 times as many as in 1871.
8

4. Technological change lowers expenditure on essentials, creating new demand and jobsTechnology-driven declines in relative prices, often a side-effect of the first mechanism described above, increase consumer spending power which, in turn, creates new demand and new jobs. Technological progress allows consumers to meet existing needs at lower cost, enabling them to spend on more discretionary goods and services. Some of these are burgeoning, technology-driven sectors, such as communications and home entertainment. Rising disposable incomes bring what was once the preserve of the well off to a mass market and enable consumers to increase spending on non-essentials. The census provides two examples of the latter phenomenon –
a) Despite the decline in the traditional pub, census data show that the number of people employed in bars rose four-fold between 1951 and 2011 (Chart 5).
b) Rising incomes have enabled consumers to spend more on personal services, such as grooming, driving employment of hairdressers. In 1871, there was 1 hairdresser/barber for every 1,793 citizens of, England and Wales; today there is one for every 287 (Chart 6).
Source: England and Wales Census records, authors’ calculations
Thousands % of workforce
Chart 5. Barstaff
Number of Barmen/Barstaff (LHS) % of workforce (RHS)
0
20
40
60
80
100
120
140
160
180
200
2011200119911981197119611951193119211911190118911881 0.00
0.10
0.20
0.30
0.40
0.50
0.60
0.70
Source: England and Wales Census records, authors’ calculations
Thousands % of workforce
Chart 6. Hairdressers
Number of Hairdressers (LHS) % of workforce (RHS)
0
50
100
150
200
250
20112001199119811971196119511931192119111901189118811871 0.00
0.10
0.20
0.30
0.40
0.50
0.60
0.70
0.80
9Technology and People The great job-creating machine

Change is the prerequisite for improving welfare. Until the eighteenth century the organisation of work was largely fixed and the material condition of the masses was miserable. It was the wrenching change of the industrial revolution, the application of steam power to production, urbanisation and the rise of manufacturing that brought improvements in material conditions and life expectancy for working people.
Technology has transformed productivity and living standards, and, in the process, created new employment in new sectors. Machines will continue to reduce prices, democratising what was once the preserve of the affluent and furnishing the income for increased spending in new and existing areas. Machines will take on more repetitive and laborious tasks, but seem no closer to eliminating the need for human labour than at any time in the last 150 years. It is not hard to think of pressing, unmet needs even in the rich world: the care of the elderly and the frail, lifetime education and retraining, health care, physical and mental well-being.
Conclusions
The stock of work in the economy is not fixed; the last 200 years demonstrates that when a machine replaces a human, the result, paradoxically, is faster growth and, in time, rising employment. Indeed, in the UK employment has more than doubled in the last one and a half century.
The work of the future is likely to be varied and have a bigger share of social interaction and empathy, thought, creativity and skill. We believe that jobs will continue to be created, enhanced and destroyed much as they have in the last 150 years.
History offers important lessons on how technology interacts with employment. And it also points to two central policy challenges. If the pace of adoption of technology is accelerating, society will need to prepare for higher levels of technological unemployment. And the way in which change increasingly rewards high-level education and skills suggests that income inequality may yet widen. Rapid advances in technology mean that education, training and the distribution of income are likely to be central to the political debate for many years to come.
10

1. England and Wales Census Records, 1871 to 2011, Various Sources.
2. Labour Force Survey, 1992 to 2014, Office for National Statistics.
3. UK Service Industries: Definition, classification and evolution, Office for National Statistics, 23rd August 2013.
4. Robert Gordon, Is U.S. Economic Growth Over? Faltering Innovation Confronts the Six Headwinds, NBER Working Paper No. 18315, August 2012.
5. Maarten Goos and Alan Manning, Lovely and Lousy Jobs: The Rising Polarisation of Work in Britain, Review of Economics and Statistics, MIT Press, February 2007.
6. Lawrence F. Katz and Robert A. Margo, Technical Change and the Relative Demand for Skilled Labor: The United States in Historical Perspective, Human Capital in History, University of Chicago Press and NBER, 2014.
7. Deloitte LLP, Michael Osborne and Carl B. Frey, Agiletown: the relentless march of technology and London’s response, November 2014.
8. John Van Reenen and Stephen Machin, Technology and Changes in Skill Structure: Evidence from Seven OECD Countries, The Quarterly Journal of Economics, November 1998.
9. Herbert A. Simon, The Steam Engine and the Computer: What Makes Technology Revolutionary, Educom Bulletin, Spring 1986.
10. PEW Foundation, Future of the Internet, August 6th 2014.
Datasets and references
11Technology and People The great job-creating machine

NotesNotes
12


Deloitte refers to one or more of Deloitte Touche Tohmatsu Limited (“DTTL”), a UK private company limited by guarantee, and its network of member firms, each of which is a legally separate and independent entity. Please see www.deloitte.co.uk/about for a detailed description of the legal structure of DTTL and its member firms.
Deloitte LLP is the United Kingdom member firm of DTTL.
This document contains general information only and is not intended to be comprehensive or to provide professional or investment advice. It is not a substitute for such professional advice and should not be relied upon or used as a basis for any decision or action that may affect you or your business. This briefing is not directed to, or intended for distribution or use in, any jurisdiction where such distribution or use would be prohibited. To the extent permitted by law, Deloitte LLP accepts no duty of care or liability for any loss occasioned to any person acting or refraining from acting as a result of any material in this publication.
Opinions, conclusions and other information in this document which have not been delivered by way of the business of Deloitte LLP are neither given nor endorsed by it.
© Deloitte LLP 2015. All rights reserved.
Deloitte LLP is a limited liability partnership registered in England and Wales with registered number OC303675 and its registered office at 2, New Street Square, London EC4A 3BZ, United Kingdom. Tel: +44 (0) 20 7936 3000 Fax: +44 (0) 20 7583 1198.
Designed and produced by The Creative Studio at Deloitte, London. J558
Contacts
Related Publication
Ian StewartChief Economist020 7007 [email protected]
Agiletown: the relentless march of technology and London’s response
Debapratim DeSenior Economist020 7303 [email protected]
Alex ColeEconomist020 7007 2947 [email protected]