technology in low socio-economic k-12 schools: examining
TRANSCRIPT

University of South FloridaScholar Commons
Graduate Theses and Dissertations Graduate School
2007
Technology in low socio-economic K-12 schools:Examining student access and implementationKatherine J. KemkerUniversity of South Florida
Follow this and additional works at: http://scholarcommons.usf.edu/etd
Part of the American Studies Commons
This Dissertation is brought to you for free and open access by the Graduate School at Scholar Commons. It has been accepted for inclusion inGraduate Theses and Dissertations by an authorized administrator of Scholar Commons. For more information, please [email protected].
Scholar Commons CitationKemker, Katherine J., "Technology in low socio-economic K-12 schools: Examining student access and implementation" (2007).Graduate Theses and Dissertations.http://scholarcommons.usf.edu/etd/2240
Technology in Low Socio-Economic K-12 Schools:
Examining Student Access and Implementation
by
Katherine J. Kemker
A dissertation submitted in partial fulfillment of the requirements for the degree of
Doctor of Philosophy Department of Secondary Education
College of Education University of South Florida
Major Professor: Ann E. Barron, Ed.D. Frank Breit, Ph.D
Robert Dedrick, Ph.D. Denise Miller, Ph.D.
Date of Approval: August 16, 2007
Keywords: low socioeconomic, technology, computers, software, access
© Copyright 2007, Katherine J. Kemker
ACKNOWLEDGMENTS
I want to thank my family, friends and colleagues for all of their support and
guidance during the many stages of this dissertation. Thank you to my parents who have
stood by me in this process with their unselfish love, support and encouragement. Thank
you to my major professor, Ann Barron, for her ongoing belief that I would complete this
dissertation. In particular, I want to thank my friends, cheerleaders, and taskmasters Roy
Winkelman and Christine Harmes, who truly pushed me all the way to the end. Finally I
want to thank all of my other friends and colleagues that I have made during this long
journey to truly make a difference in the world.

i
TABLE OF CONTENTS
Acknowledgments................................................................................................................ i List of Figures .................................................................................................................... iii List of Tables ..................................................................................................................... iv
Technology in Low Socio-Economic K-12 Schools: Examining Student Access and Implementation .................................................................................................................. vi Chapter One Introduction ................................................................................................... 1
Role of Technology......................................................................................................... 2 Defining Technology Integration.................................................................................... 4 Purpose............................................................................................................................ 6 Research Questions......................................................................................................... 7 Significance of the Study................................................................................................ 7 Limitations ...................................................................................................................... 8 Definitions....................................................................................................................... 8
Chapter Two Literature Review........................................................................................ 11 Defining Effective Technology Integration .................................................................. 11
National Educational Technology Standards........................................................ 12 Authentic Instruction ............................................................................................ 14 Stages of Instructional Evolution.......................................................................... 19 Summary............................................................................................................... 21
Essential Conditions...................................................................................................... 22 Access to Technology........................................................................................... 22 Student-Centered Learning Environment ............................................................. 26 Technology in the Curricular Framework............................................................. 33 Summary............................................................................................................... 36
Technology and Students of Low Socioeconomic Status............................................. 37 Title I Schools ....................................................................................................... 37 Characteristics of Students.................................................................................... 39 Student Achievement ............................................................................................ 40 Technology in Schools with Low SES Student Population.................................. 42 Summary............................................................................................................... 47
Chapter Three Method ...................................................................................................... 49 Research Design............................................................................................................ 49 Population ..................................................................................................................... 50 Instrument ..................................................................................................................... 51

ii
Construct Definition.............................................................................................. 52 Survey Development............................................................................................. 53 Pilot Test Implementation..................................................................................... 54 Current Implementation........................................................................................ 56
Data Source and Analysis ............................................................................................. 57 Chapter Four Results......................................................................................................... 65
Verification of Data ...................................................................................................... 65 Access to Computers..................................................................................................... 69
Total Modern and Non-Modern Computers ......................................................... 70 Location of the Computers.................................................................................... 74 Summary Access to Computers ............................................................................ 78
Software Types on Student Computers......................................................................... 78 Tool-Based Software on Student Computers........................................................ 78 Curriculum-Based Software on Student Computers............................................. 82 Summary of Software Types on Student Computers............................................ 83
Student Use of Software Types..................................................................................... 83 Limited and Regular Use of Software Types........................................................ 83 Frequency of Student Use of Software ................................................................. 86 Summary of Student Use of Software .................................................................. 88
Teacher Use of Technology.......................................................................................... 88 Basic Teacher Use of Technology ........................................................................ 89 Curriculum-Focused Use of Technology.............................................................. 90 Summary of Teacher Use of Technology ............................................................. 91
Chapter Five Discussion and Recommendations.............................................................. 92 Summary of Questions and Results .............................................................................. 92 Discussion..................................................................................................................... 96
Student Access to Technology.............................................................................. 96 Student-Centered Learning Environment ............................................................. 98 Technology in the Curricular Framework............................................................. 99
Recommendations....................................................................................................... 101 Recommendations to Policymakers.................................................................... 101 Recommendations for Modifications to the Survey ........................................... 102 Recommendations for Future Research .............................................................. 103
Summary..................................................................................................................... 104 References....................................................................................................................... 106
About the Author ................................................................................................... End Page
iii
LIST OF FIGURES
Figure 1. Scale levels of authentic instruction .................................................................. 18
Figure 2. Student access to modern computers................................................................. 59
Figure 3. Student access to non-modern computers ......................................................... 59
Figure 4. Tool-based software on computers.................................................................... 61
Figure 5. Curriculum-based software on computers......................................................... 62
Figure 6. Frequency of student use of software................................................................ 63
Figure 7. Level of teacher use of technology.................................................................... 64

iv
LIST OF TABLES
Table 1. Contrasting Views of Instruction and Construction ........................................... 29
Table 2. STaR Strands and Categories within Each Strand............................................. 53
Table 3. Number of Schools and Student by Free and Reduced Lunch Status ................ 67
Table 4. District Size for Sample Size .............................................................................. 68
Table 5. Descriptive Statistics for Total Modern Computers by School SES .................. 71
Table 6. Descriptive Statistics for Total Non-Modern Computers by School SES.......... 72
Table 7. Descriptive Statistics for Total Modern Laptop Computers by School SES...... 72
Table 8. Modern Computers per Classrooms by School SES .......................................... 73
Table 9. Modern Computers per Labs by School SES ..................................................... 74
Table 10. Student Access to Modern Computers.............................................................. 75
Table 11. Students' Access to Non-Modern Computers ................................................... 76
Table 12. Students' Access to Modern Classroom Computers ........................................ 77
Table 13. Students' Access to Modern Lab Computers .................................................... 77
Table 14. Tool-Based Software Availability on Student Computers ............................... 79
Table 15. Factor Analysis for Tool-Based Software ........................................................ 80
Table 16. Basic Tool-Based Software Availability on Student Computers...................... 81
Table 17. Robust Tool-Based Software Availability on Student Computers ................... 81
Table 18. Curriculum-Based Software Availability on Student Computers..................... 82
Table 19. Student Limited and Regular Use of Software ................................................. 85
v
Table 20. Frequency of Student Software Use ................................................................. 86
Table 21. Factor Analysis for Frequency of Student Use................................................. 87
Table 22. Frequency of Student Tool-Based Software..................................................... 88
Table 23. Frequency of Basic Teacher Use of Technology.............................................. 90
Table 24. Factor Analysis for Teacher Use of Technology .............................................. 90
Table 25. Frequency of Teacher Curriculum-Focused Use of Technology as a Tool...... 91

vi
TECHNOLOGY IN LOW SOCIO-ECONOMIC K-12 SCHOOLS: EXAMINING
STUDENT ACCESS AND IMPLEMENTATION
Katherine J. Kemker
ABSTRACT
Over the past twenty years, there has been an enormous financial investment in
technology for K-12 schools to help bridge the digital divide between high and low
socioeconomic (SES) students. These investments have included hardware, software,
professional development, and research studies on the effectiveness of technology in the
classroom.
This dissertation explored the essential conditions for the integration of
technology, access, student-centered learning environment, and teacher use in the
curriculum. Florida's elementary schools were divided into quartiles based on free and
reduced lunch to investigate differences between the top quartile of high SES schools
(n=400) and the lower quartile of low SES (schools n=396). The first research question
investigated students' access to technology by specifically concentrating on their access
to computers in high and low SES schools. A statistically significant difference was
found between students' access to modern computer labs and modern laptop computers.
However, there were no significant differences in access to modern classroom computers.
When looking at software on student computers, a statistically significant difference
between high and low SES schools was found in the availability of both basic tool-based

vii
software and robust tool-based software. These data mirrored the statistically significant
difference for frequency of use for tool-based software at high and low SES schools. Data
on the teacher use of technology in the curricular framework of the classroom showed a
statistically significant difference in the curriculum-focused use of technology, between
high and low SES schools.
This study is a building block for further examination of the digital divide that
exists between high and low SES schools. This divide appears to include low
expectations for students in low SES schools through regular exposure to drill and
practice software, while students in schools with high-SES populations have more
opportunities to utilize tool-based software.
1
CHAPTER ONE
INTRODUCTION
In a speech to the Commonwealth Club of California, former United States
Secretary of Education, Rod Paige, remarked on the “soft bigotry of low expectations”
for low socioeconomic students. He stated that educators must “let go of the myths and
perceptions about who can learn and who can’t” to ensure that all students despite their
level of poverty can reach high academic standards (U.S. Department of Education
[USDOE], March 12, 2003, p. 2). The passage of the federal No Child Left Behind
(NCLB) Act of 2001 legislation reinforced the belief that all children can learn through
the achievement of high academic standards (USDOE, 2002). This movement in the field
of education emphasizes the use of rigorous curriculum for all students with the
expectation of a shift in the type of curriculum being offered to students of poverty in low
socioeconomic schools (Borman, 2003).
Research is revealing a pedagogical gap between schools in low and high
socioeconomic status (SES) neighborhoods. Grading standards have been found to be
lower in low SES schools because less curriculum material has been covered (Biddle &
Berliner, 2002). In low SES schools, curriculum has been implemented that aims at the
“basic” elements of the content to be learned on the assumption that no more can be
managed and that mastery of the basics is the important accomplishment (Knapp, 1995).

2
A “pedagogy of poverty" has emerged in which students are given direct instruction in
order for the teacher to maintain control in the classroom (Haberman, 1991).
An analysis of Title I schools conducted for the U. S. Department of Education
found that students performed better in reading when teachers spent less time on basic
instruction, followed by students filling out worksheets, and more time in exploration
activities, such as problem solving (USDOE, 2001). Educational researchers concur
inequities exist in the curriculum offered to low income students, in that cognitively rich
tasks that require critical thinking are often missing (Darling-Hammond, 1997; Haycock,
2001; Wenglinsky, 2005). A curriculum must be developed for low socioeconomic
schools that helps students to draw upon their strengths, skills, and prior knowledge in the
learning environment (Marlowe & Page, 1999).
Newmann (1996) developed a curriculum called authentic pedagogy that requires
students to construct meaning or knowledge, engage in disciplined inquiry, and work on
products that have value beyond school. Students are given challenging academic lessons
that involve the development of higher-order cognitive skills rather than merely
responding to lower-order skills found in the pedagogy of poverty (Newmann, Wehlage,
& Lamborn, 1992). Research has shown positive outcomes when this curriculum
approach has been implemented in the classroom (Avery, 1999; Newmann, 1996).
Role of Technology
A technology enriched learning environment has the potential to deepen
classroom instruction to make it more meaningful and assist in the development of
higher-order thinking skills (Niemiec & Walberg, 1992). This type of environment entails

3
a teacher and students’ seamless access to technology in the classroom. When technology
is used in this manner, it empowers students to develop thinking skills that allow them to
help themselves (Kelley & Ringstaff, 2002; Mann, 1999). Students in a technology rich
classroom tend to become more engaged and more active learners because of greater
emphasis on inquiry and less on drill and practice (Bozeman & Baumbach, 1995;
Sandholtz & Dwyer, 1997).
Since 1990, the United States has invested over forty billion dollars to provide
technology for the K-12 classrooms. These federal dollars have come in various forms,
such as E-Rate funding, Technology Literacy Challenge Funds (TLCF), and Preparing
Tomorrow’s Teachers to Use Technology (PT3). Each source of funding had a specific
purpose for the use of technology (McMillan-Culp, Honey, & Mandinach, 2003). For
example, E-Rate supplies funding to schools with the expectation that every student will
have access to the Internet. The goal of the TLCF program was to provide computers in
the classroom, and funding has been provided through PT3 to train pre-service teachers
on the use of technology in the classroom (Dickard, 2003).
NCLB mandates the effective integration of technology into the curriculum of
public schools for all students in the United States. This landmark legislation provides
federal dollars through Title II Part D, Enhancing Education Through Technology
(EETT) with the stipulation that both state and local educational agencies develop a
comprehensive plan for the integrated use of educational technology into instruction and
curricula to improve teaching and student achievement. The deadline placed on

4
educators is “that technology will be fully integrated into the curricula and instruction of
the schools by December 31, 2006” (USDOE, 2002, p.1676).
Defining Technology Integration
Unfortunately, a consistent definition for the integration of technology in the
curriculum has never been adopted. Even the term “technology” can have varied
interpretations. For example, administrators, teachers and policymakers often make the
assumption that technology refers simply to a computer. However, Kelley and Ringstaff
(2002) define technology as a variety of digital devices, from computers to digital
cameras to software. For the purpose of this study, the term “technology” will include
computers, application software, and digital devices, such as digital cameras, digital
microscopes, and digital video cameras.
The integration of technology in the classroom is a process that involves change
in an educational system and occurs over a period of time (National Center for Education
Statistics [NCES], 2002). The attainment of this goal entails a reform in the teachers’
method for the delivery of instruction with students. The National School Boards
Association stated that the integration of technology is as much about change as it is
about technology because educators must reform their teaching to integrate technology
(Tiene & Luft, 2002). Researchers have concluded, “The magic lay not exclusively in the
technology, but in the interweaving of a systematic program of education reform with the
judicious use of technology-based resources” (Chang, Henriquez, Honey, Light, Moeller,
& Ross, 1998, p. 43).

5
This process of change takes time, as a culture must be developed in the
classroom that embraces technology as a “natural” part of the everyday work routine
(NCES, 2003). According to Sandholtz, Ringstaff, and Dwyer (1997), there is an
evolution of thought and practice that occurs with teachers during the process of change
that teachers undergo with the integration of technology. At each stage of the process, the
teacher adopts and implements technology in the curriculum (Dooley, 1999; Hall &
Hord, 2001; Painter, 2001; Sandholtz, Ringstaff, & Dwyer, 1997). The integration of
technology in the educational system is a time-consuming process in which teachers must
change their beliefs about teaching and learning.
Regrettably, the pedagogical divide is also reflected in the use of technology. Low
SES schools frequently use technology for drill and practice, while high SES schools use
technology for higher-order thinking skills (Becker & Ravitz, 1998; Becker, Ravitz, &
Wong, 1999; Wenglinsky, 2005). For example, students in low SES schools most
commonly use technology for lower-order tasks, such as drill, practice, and test taking,
whereas students in affluent, high SES schools have more opportunity to create web sites
and multimedia presentations (Reid, 2001). Wenglinsky (1998) found that students of
poverty use computers for “drill-n-skill” purposes. Likewise, when Herbert Kohl
examined the use of computers with inner city students, he found a “covert” racism in the
limits to the types of activities being done with students of poverty (Reid, 2001).
Recent studies suggest that research should move beyond a focus on the
technology to an interest in designing an environment that fosters the disposition for
critical thinking (Kelley & Ringstaff, 2002; Wenglinsky, 2005). The restructuring of the

6
classroom should include the use of technology to provide active learning, authentic
tasks, challenging work, problem solving, and higher-order thinking skills (Dalton &
Goodrum, 1991; David, 1993).
Purpose
In the last four years, the state of Florida has received over $175 million dollars of
federal funds through the EETT program for an average of 2.5 million students per year.
However, research on the use of technology with low socioeconomic students has been
very limited. The legislation of “No Child Left Behind” demands more resources for
students in low socioeconomic classrooms. With more technology funds being provided
to the schools, it is important to recognize and understand how effectively technology is
being integrated that promotes higher-order thinking skills.
The purpose of this study is to examine the use of technology with low and high
socioeconomic students in the state of Florida. In response to the NCLB legislation, the
Florida Department of Education significantly revised its annual technology survey to
provide more meaningful information about technology integration and capacity in
Florida’s schools. The implementation of the survey is an iterative process that entails a
variety of individuals from the district level personnel to the school based technology
specialist. During this process, the district and schools are able to be in constant
communication to verify the accuracy of the data.
In 2002, the technology resource survey was piloted with schools in Florida based
on benchmarks to provide schools with a tool for use in goal setting and technology
planning. Revisions to the survey were based upon these benchmarks and the pilot study.

7
Historical data from the 2005-06 Florida Technology Resource Survey (TRS) were
analyzed to examine the use of technology with low SES students in Florida. The TRS is
divided in five sections, Digital Learning Environment, Instructional Leadership,
Florida's Digital Educators, and Access to Technology with 78 survey items.
Research Questions
This study used data from the last three years of the Technology Resource Survey
to examine the following questions in elementary schools:
1. Is there a significant difference between students’ access to computers in high
and low socioeconomic schools?
a. Is there a significant difference in the total number (desktops and laptops)
of modern and non-modern computers?
b. Is there a significant difference in the locations of the computers for
student use?
2. Is there a significant difference in the types of software available on
computers between high and low SES schools?
3. Is there a relationship between the socioeconomic status of an elementary
school and the frequency of student use by software type?
4. Is there a relationship between socioeconomic status of an elementary school
and the teacher use of technology in the classroom?
Significance of the Study
Findings from this study expand our knowledge about the use of technology in
high and low SES schools. Data from this study informs policy makers and state/district

8
level administrators on how to plan for the high level integration of technology in all
public schools. In addition, the data provide guidance on professional development for
teachers on the use of technology with low SES students.
Limitations
A limitation of this study is the use of survey data in which the purpose is to
provide information on the accessibility, use, and accountability of technology in schools.
These data represent one moment in time from the individual who submits the survey and
do not represent the actual classroom implementation by the teacher. The data collected
reflects the interpretation of an individual who reports the data based on their perception
of the use of the technology in the classroom.
Another limitation is a clear definition for the types of software programs being
reported on the computers and the pedagogical use with students in the classroom. The
data on the software programs is a generic representation for types of software programs
being purchased for the computers. This data does not reflect how the software is actually
being integrated into curriculum by the teachers. In addition, these data are reported by
individuals, such as principals, technology coordinators, and media specialists that are not
in the actual classroom.
Definitions
Authentic instruction. A model for high quality instruction that incorporates five
main components of higher order thinking, depth of knowledge, connectedness to the
world beyond the classroom, substantive conversation, and social support for student
achievement.

9
Authentic standards. The five standards for authentic instruction: higher-order
thinking; 2) depth of knowledge; 3) substantive conversation; 4) connections to the world
beyond the classroom; and 5) social support for student achievement.
Curriculum-based software. Program based software that focuses specifically on
curriculum and content areas.
High socioeconomic status. The top quartile of schools in which less than 40% of
the students qualify for free and reduced lunch.
Low socioeconomic status. The bottom quartile of schools in which more than
75% of the students qualify for free and reduced lunch.
National Educational Technology Standards. The technology standards
established for teachers and students. The six standards are premised on the use of
technology to develop students: basic operations and concepts; social, ethical, and human
issues; productivity tools; communication tools; research tools; and problem-solving and
decision-making tools.
Pedagogy of poverty. A series of basic traditional core functions, such as teachers
giving information, assigning homework, and monitoring seatwork that constitutes an
instructional method.
Project-based learning. An instructional method organized around projects that
allow students to encounter and learn the central concepts of the subject through real-
world projects.
Technology integration. The seamless use of technology as a tool to accomplish a
given task in a disciplined study that promotes higher order thinking skills.

10
Tool-based software. Application based software that provides opportunity for
teachers and students to perform a task.
21st century skills. Those skills that have been identified as information and
communication skills, thinking and problem-solving skills, and interpersonal and self-
directional skills.

11
CHAPTER TWO
LITERATURE REVIEW
The review of the literature is organized into three sections. The first section
provides a theoretical understanding for defining technology integration technology in the
classroom. The second section examines research on the essential conditions for
integrating technology in the classroom. The final section provides an overview of
research related to technology use with students from low socioeconomic status.
Defining Effective Technology Integration
Technology integration entails the students’ seamless use of technology as a
productivity tool to accomplish a given task in a disciplined study that promotes higher-
order thinking skills. Integration is the assimilation of technology resources and
technology enabled practices as a routine and seamless element of the day, so that
students are prepared to use technology for the workforce (NCES, 2002). Technology is a
tool to be employed by students in all curriculum areas to acquire new knowledge and
skills, analyze and synthesize data, then construct a product that demonstrates their
knowledge (NCES, 2003; Partnership for 21st Century Skills, 2002). This definition of
technology integration in the classroom is based on NETS (the National Technology
Standards for Students that were developed by ISTE in 2004), authentic instruction
(Newmann & Wehlage, 1995), and Stages of Instructional Evolution (Sandholtz,
Ringstaff & Dwyer, 1997).
12
National Educational Technology Standards
In the last century, there has been a move toward identifying and implementing
state and national technology standards for students and teachers. In 1998, the
International Society for Technology in Education (ISTE) published their National
Educational Technology Standards (NETS) for Students. Two years later, ISTE published
standards for teachers, which was followed in 2001 by standards for administrators. As of
May 19, 2004, 33 states had adopted, adapted, or aligned with the ISTE standards for
students. In addition, 34 states were using the ISTE standards for teachers and 29 states
were implementing the ISTE standards for administrators (International Society for
Technology in Education [ISTE], 2004).
In addition to basic computer operations and social/ethical issues, the NETS
standards for students focus on using technology as a classroom tool for productivity,
communication, research, and problem-solving/decision-making. Specifically, the NETS
for students categorize technology competencies into six areas:
1. Basic operations and concepts
2. Social, ethical, and human issues
3. Technology productivity tools
4. Technology communication tools
5. Technology research tools
6. Technology problem-solving and decision-making tools
The categories provide a framework for linking performance indicators to the
standards for Grades PreK-2; 3-5; 6-8; and 9-12. It is recommended that the skills be

13
integrated into a student's personal learning and social framework, by being introduced in
the classroom, reinforced, and finally mastered. The intent of the standards is for
technology to be an integral component or tool for learning within the context of
academic subject areas (ISTE, 2000).
In the first category, basic operations and concepts, students should be able to
demonstrate a basic understanding of technology, such as computers, television, digital
cameras and additional peripherals. Performance indicators at various grade levels might
include being proficient in the use of computer terminology, proper care of the monitor,
and selection of a printer (ISTE, 2004).
The second category, social, ethical and human issues, pertains to various issues
involving the use of technology. Students should demonstrate technology literacy (in
areas such as legal and ethical behaviors). A sample performance indicator would include
students being able to evaluate the media images that surround them to make responsible
choices about what they see and hear (ISTE, 2004).
In the third category, technology productivity tools, students use various forms of
technology to create different types of media such as documents, movies, pictures, and
spreadsheets. In addition to using the computer, students demonstrate proper use of an
assortment of hardware such as probes, scanners, and digital cameras to construct their
knowledge (ISTE, 2004).
The fourth category, technology communication tools, focuses on students’ use of
various media to converse and interact with their peers, experts, and other audiences.
Performance indicators include being able to collaborate, communicate, and interact

14
effectively with a range of audiences for both direct and independent learning (ISTE,
2004).
In the fifth category, technology research tools, students use diverse forms of
technology as a tool to locate, evaluate, and collect information from a variety of sources.
Performance indicators include the ability to evaluate the accuracy, relevance,
appropriateness, comprehensiveness, and bias of online information (ISTE, 2004).
In the sixth category, technology problem solving and decision-making, students
use technology to develop strategies for recognizing and solving real world problems.
They should be able to identify a problem, ascertain if technology is useful in solving the
problem, and, if so, select and implement the appropriate tools (ISTE, 2004).
Authentic Instruction
The NETS for students provide a basic framework for the use of technology in the
classroom, while the theory of authentic instruction aims to engage students in authentic
activities (Newmann & Wehlage, 1995). In 1990, the Office of Educational Research and
Improvement of the U.S. Department of Education funded the University of Wisconsin’s
Center on Instructional and Restructuring of Schools to conduct a five-year program of
research on School Restructuring to support authentic learning (Newmann & Wehlage,
1995; Newmann, 1996). Researchers visited over 60 schools across the country that were
involved in restructuring efforts, and observed instructional activities, assessments, and
student work in mathematics and social studies in 24 of those schools (Newmann &
Wehlage, 1993).

15
Because of the dynamic and social nature of the activities, researchers noticed in
the schools a widespread use of instructional techniques that resembled both social and
psychological constructivism. Students were engaged in activities to create projects,
compile portfolios, produce performances, complete experiments, and analyze data from
surveys. The researchers recognized and appreciated the active learning in the classrooms
but were concerned:
Assuming the central purpose of teaching is to help students to use their
minds well, then education reform must involve more than innovation in
teaching technique, method, or procedure. The merit of any technique,
whether conventional or innovative must be judged on its capacity to
improve the intellectual quality of student performance (Newmann,
Secada, & Wehlage, 1995, p.3).
Authentic Pedagogy. The theory of authentic pedagogy is based on the premise
that students’ work in the classroom should prepare them for the intellectual work that
will be demanded of them as adults (Newmann & Wehlage, 1995). Newmann (1996)
states that authentic pedagogy “stands for intellectual accomplishments that are
worthwhile, significant, and meaningful, such as those undertaken by successful adults”
(p. 23). He goes on to elaborate this theory with three criteria for authentic intellectual
work: student construction of knowledge, discipline inquiry, and value beyond the
classroom (Newmann, 1996).
First, students need to be constructors of knowledge, built on what they already
know. The goal of instruction should be deep understanding of concept development

16
through cognitive development or knowledge building rather than the development of
behaviors or skills (Fosnot, 1996). From this perspective, learning is viewed as an active
process and teaching as a means of facilitating active student mental processing (Gagne,
1985). When students construct knowledge it involves “organizing, interpreting,
evaluating, or synthesizing prior knowledge to solve new problems” (Newmann, Bryk, &
Nagaoka, 2001, p. 19).
The second criterion for significant authentic pedagogy requires disciplined
inquiry that involves the use of a prior knowledge base, in-depth understanding, and
elaborated communication. Students must acquire the knowledge base of facts,
vocabularies, concepts and theories necessary for their inquiry. Knowledge becomes most
powerful when students can use information to gain a deeper understanding of specific
problems. Students must rely upon complex forms of communication, both to conduct
their work and to present their ideas (Newmann, Bryk, & Nagaoka, 2001).
The final criterion of authentic pedagogy is for the task to “have meaning or value
apart from documenting the competence of the learner” (Newman, Secada, & Wehlage,
1995, p.11). Instructional activities might include allowing students’ experiences outside
of school to be integrated into those activities in the classroom. The concept of value
beyond school involves the transfer of knowledge to an area that has personal
significance for the students. When students are involved in an activity that has no value
beyond measuring their success in school, “success in these tasks often carries no
adaptive value, because large numbers of students consider school to only be a restricted,

17
even an insignificant, arena of personal experience” (Newmann, Marks, & Gamoran,
1996, p. 286).
Authentic Standards. The standards for authentic instruction describe the
cognitive connections that authentic tasks promote. For example, Wiggins (1998) defines
authentic instruction as “the situational or contextual realism of the proposed tasks” (p.
21). Similarly, Darling-Hammond (1995) contends that authentic tasks should be set in a
“meaningful context that provides connections between real-world experiences and
school-based ideas” (p. 4). Authentic instruction involves tasks that generally engage
students in “ill structured” challenges and roles that guide students for real world
situations (Wiggins, 1989).
Authentic instruction is meaningful instruction. Teachers are able to move
students beyond memorization of facts by creating experiences that demand sustained,
disciplined, and critical thinking on topics that have relevance to life beyond school. The
scale for the five standards of authentic instruction is shown in Figure 1.

18
Higher-order Thinking
Lower-order thinking only …2…………..3……….4…… Higher-order thinking is central
Depth Knowledge
Knowledge is shallow …….2……………3…………….4……………Knowledge is deep
Substantive Conversation
None ………………………2……….……3………..…..4…………………… High level
Connections to the world beyond the classroom
No connection …………….2……………..3…………...4……………………. Connected
Social Support for Student Achievement
Negative social support ……2……………3…………....4…..….. Positive social support
Figure 1. Scale levels of authentic instruction
The standards of authentic instruction are continuous constructs of quality from
“less” to “more” rather than categorical variables (Newmann & Wehlage, 1995). Each of
the constructs uses a five-point scale to measure the extent of authentic instruction in a
particular lesson in the classroom. For example, the first construct measures the degree of
higher-order thinking in a task given to students. In lower-order thinking, students are
recipients of information; in this role, students simply recite information. However, at
higher-order thinking, students are manipulating information and are involved in tasks
that require problem solving and decision-making skills (Newmann, Marks, & Gamoran,
1996).
The framework for the five standards of authentic instruction can be used as a
research tool or a reflective critique of teaching. In the role of research, the framework
has been utilized to estimate the levels of authentic instruction in social studies and

19
mathematics in K – 12 schools. Researchers were able to examine the conditions under
which “restructuring” improves instruction in teachers instructional skills. The
framework also allows teachers, either alone or with peers, to reflect upon their teaching.
The standards provide criteria for examining the extent to which certain lessons and
activities provide for authentic learning (Newmann & Wehlage, 1995).
Stages of Instructional Evolution
Over a decade ago, the Apple Classrooms of Tomorrow (ACOT) project began
with the assumption that computers and technology would impact the classrooms (Office
of Technology Assessment [OTA], 1995). The ACOT project trained teachers on the
integration of computer technology in the classroom. This project was a collaboration
among public schools, universities, research agencies and Apple Computer. Over one
hundred schools around the United States were selected to begin integrating computer
technology in the classroom (Fouts, 2000). The majority of the research was qualitative
in nature.
In the ACOT classrooms, students and teachers had immediate access to a wide
range of technologies including computers, videodisc players, video cameras, scanners,
CD-ROM drives, modems and online communication services. Technology in the ACOT
classroom was viewed as a tool for learning and a medium for thinking, collaborating,
and communicating (Sandholtz, Ringstaff, & Dwyer, 1997). The teachers were trained on
basic troubleshooting and tool-based software such as spreadsheets, databases, and
graphic programs (Kelley & Ringstaff, 2002).
20
Using technology in this context changed the role of the teacher (Ringstaff,
Sandholtz, & Dwyer, 1997). The teachers involved in the study began to reexamine their
instructional strategies, and began to see themselves as facilitators. Teachers began to
take a constructivist approach, realizing that teaching is more than transferring ideas from
one who is knowledgeable to one who is not. Instead, learning was perceived as a
personal, reflective, and transformative process (Sandholtz, Ringstaff, & Dwyer, 1997).
As the role of the teacher changed, the role of the student also changed, moving
from a passive role to an active role in learning. Students were provided with the
opportunity to collaborate with other students on projects and given tasks. Teachers in the
study observed numerous changes in student engagement with the introduction of
technology in the classroom. Students became empowered when they were able to take
responsibility for their learning as they interacted with the computer, designing and using
their own instructional materials (Dixon-Krauss, 1996). Often, students displayed
increased initiative by going beyond the requirements of assignments to independently
explore new applications (Sandholtz, Ringstaff, & Dwyer, 1994).
Research from the ACOT project demonstrated that the introduction of
technology to the classroom could increase the power for learning. (Sandholtz, Ringstaff,
& Dwyer, 1990). However, the mere placement of the computer in the classroom did not
change the learning environment; computer-based activities had to be related closely to
those activities already taking place in the classroom for change to happen (Reilly, 1992).
Even when classrooms were drastically altered and teachers were willingly
immersed in innovation, the change was slow, and often filled with temporary regression.

21
The ACOT study focused on both the process of the integration technology in the
curriculum, as well as the adoption of the innovation, access to computers at the
classroom level (Coley, Cradler, & Engel, 2000). This ten-year study produced an
adoption model for the use of computer technology in the classroom known as the Stages
of Instructional Evolution. This model states that educators go through five stages when
adopting technology in the classroom: (a) entry, (b) adoption, (c) adaptation, (d)
appropriation, and (e) invention (Sandhotz, Ringstaff, & Dwyer, 1997).
Researchers found that at each phase during this model, teachers varied their
utilization of technology both personally and pedagogically. For example, at the entry
stage, teachers were still not comfortable using technology and tended to use direct
instruction and whole class activities. However, at the adaptation stage, teachers began to
make the transition to using technology within the context of the curriculum. Finally, at
the innovation stage, teachers and students were engaged in activities where technology
was used to construct knowledge in a meaningful context (Sandholtz, Ringstaff & Dwyer,
1997).
Summary
The Stages of Instructional Evolution (Sandholtz, Ringstaff, & Dwyer, 1997), the
NETS (ISTE, 2004) and authentic instruction (Newmann & Wehlage, 1995) provide the
framework for defining the levels of technology integration in the classroom. The NETS
for students (ISTE, 2004) establishes the role of technology in the classroom, while the
standards for authentic instruction define the instructional methods for engaging students
in authentic tasks (Newmann & Wehlage, 1995). Finally, the Evolution of Thought and

22
Practice establishes the stages of teachers use of technology in the classroom (Sandholtz,
Ringstaff, & Dwyer, 1997). Hence, the optimal integration of technology in the
classroom entails students’ seamless use of technology as a productivity tool to
accomplish a given task in a disciplined study that promotes higher-order thinking skills.
Essential Conditions
The integration of technology in the classroom requires a reformation of
instructional practice by all individuals in the educational system. Three essential
conditions have consistently emerged from the research on technology integration in the
classroom (Glennan & Melmed, 1996; Kelley & Ringstaff, 2002; Sandholtz, Ringstaff, &
Dwyer, 1997). First, teachers must have access to technology, such as laptop computers
and tool-based software, in the classroom (Fisher, Dwyer, & Yocam, 1996; Mann, 1999;
and Stratham & Torell, 1999). Second, teachers must develop a student-centered learning
environment in which technology can be utilized for a higher level of integration (Means,
Blando, Olson, & Middleton, 1993; Penuel & Means, 1999; Silverstein, Frechtling, &
Miyoaka, 2000; Statham & Torell, 1999). Finally, technology tasks must be embedded in
the curriculum framework (Coley, Cradler, & Engle, 1997; Sandholtz, Ringstaff, &
Dwyer, 1997; Silverstein, Frechtling, & Miyoaka, 2000).
Access to Technology
In the last 20 years, there has been a major transformation in the access to
computers for students in the classroom (NCES, 2005; Trotter, 2005). Since the early
1980’s, the primary intent of federal funding has been to reduce the student to computer
ratio. Nationally and locally there has been a significant progress toward this goal. In

23
1983, the ratio was 92 students per computer (at school); five years later, the ratio
decreased to 27 students per computer, and ten years later, the ratio was just under 6
students for each computer (Technology Counts, 2005).
While studies have shown a decrease in the student/computer ratio, teachers
continue to report that the lack of access to computers in the classroom is a significant
barrier to technology integration. The location of the computers affects the accessibility
for teachers in the classroom (Livingston & Wirt, 2005; Statham & Torrell, 1999).
Computers maybe distributed among the classrooms, centralized in one area of the
school, or a combination of the two approaches (Mann, 1999). However, computers in
the classroom rather than in a separate computer lab are more likely to facilitate positive
social interactions and students’ use of technology a tool in the curricula (Clements,
2002; Knapp & Glenn, 1996).
Laptop computers. Almost a decade ago, education reformers began
implementing initiatives in which both students and teachers were provided their own
laptop computer. In 1996, the Learning with Laptops program began in Beaufort County
School District in South Carolina when 300 sixth grade students were given laptop
computers (Stevenson, 1999). That same year, Microsoft and Toshiba began the Anytime
Anywhere Learning project with 19 pioneer schools in the United States receiving laptop
computers (Rockman et al., 1998). Large-scale initiatives, such as those in Henrico
County, Virginia, and the state of Maine, have placed 24/7 accesses to laptop computers
in the hand of tens of thousands of teachers and students (Rockman, 2003; Zucker, 2004).
24
Another strategy has been to obtain a classroom set of laptop computers that is
stored on a recharging cart, allowing access for any classroom in a school (Rockman,
2003). These class sets serve as portable labs that provide access to laptop computers for
classroom use to complete a given task that utilizes technology in the curricula. While
access is limited to the availability of the laptop cart in this strategy, this approach does
overcome one barrier to the integration of technology by providing all students access to
laptop computers.
The emergence of laptop computers in the classroom has enabled a shift in the
focus of research for technology. Rather than focusing on the adoption of technology in
the classroom, researchers have begun to examine the integration of laptops in the school
infrastructure, the unique advantages of laptops in the classrooms, and student motivation
with laptop computers (Rockman, 1998; Fouts & Stuen, 1997; Stevenson, 1998).
Unfortunately, the majority of this research has been limited to those universities and
districts implementing laptop computers in classrooms of students with high achievement
and high socioeconomic status.
For three years, Rockman and an independent research organization evaluated
Microsoft’s Anytime, Anywhere Learning Program. This three-year study included eight
school sites with three of the schools matched and five of the schools unmatched. A total
of four hundred sixty students from grades 7 through 11 and 47 teachers from both public
and private schools were involved in the study (Rockman, 1998).
The first year of the study examined the challenges and success of the
implementation of laptops in the classroom. The second and third year focused on the
25
impact of teaching and learning in the laptop classroom and how it supported the
constructivist pedagogy. The data collected for this study included student and teacher
questionnaires, test scores, student and teacher computer usage logs, interviews with
administrators, and the analysis of standardized test scores (Rockman, 1998).
The study found that students who had access to technology increased their use of
technology. In addition, more opportunities existed for individual access; laptop students
used the Internet more frequently and for longer periods of time than non-laptop students.
The laptop users spent more time doing their homework and used the computer at home
for a variety of tasks (Rockman, 1998). Finally, researchers noted a move toward
constructivist ideals and pedagogy. The ubiquitous technology was a catalyst for the
change to more independent efforts and less direct instruction (Fouts, 2000; Rockman,
1998; Rockman, 2000).
In another study that focused on Title I schools, Ross studied the effectiveness of
providing fifth and sixth grade students in Walled Lake Consolidated schools with access
to laptop computers. This study concentrated on the use of laptop computers with regard
to learning activities, technology usage, and writing achievement. The district had been
part of the Anytime Anywhere Learning program since 1996. The laptop computers were
available for a lease of fifty dollars a month. The training of teachers was based on
framework to develop problem-based lessons that utilize real-world resources, student
collaboration, and the use of computer tools to reach solutions. The lessons were
structured around projects which engage students in examining community and global
issues (Lowther, Ross, & Morrison, 2001).

26
The data collected included classroom observations, student writing test scores,
student surveys and focus groups, teacher surveys and interviews, and parent surveys and
interviews. Observation instruments included the School Observation Measure (SOM)
and the Survey of Computer Use (SCU). The SOM was based on 60 continuous minutes
of observation, divided into four, fifteen-minute segments. The four observation periods
were then summarized on one SOM Data Summary form. The SCU was completed as
part of the 60-minute observation sessions, only if students were using technology during
that time (Lowther, Ross, & Morrison, 2001).
Researchers found that teachers in the laptop classrooms tended to integrate
technology more in their curriculum with student-centered strategies such as project-
based learning, inquiry research, and cooperative learning. Observers found that laptop
classrooms were engaged with the computer as an educational tool. The majority of
teachers reported they were teaching differently than before by integrating technology
into both existing lessons and newly developed lessons. The implication from the
multiple data sources was as a consequence of all students having continual access to
individual computers an active learning environment was created in the classroom
(Lowther, Ross, & Morrison, 2001).
Student-Centered Learning Environment
The second condition for effective technology integration is the development of a
student-centered learning environment. Kelley and Ringstaff (2002) stated that if
technology is to be used in powerful ways, the role of the teacher in the classroom must
change. The traditional model of instruction is the lecture-recitation-seat work model in

27
which the teacher is the focus of the instruction and the only source of knowledge. In a
student-centered environment, the teachers’ role becomes one of a facilitator for learning
as students were guided to take an active role in constructing their knowledge (Penuel &
Means, 1999; Silverstein, Frechtling, & Miyoaka, 2000; Statham & Torell, 1999).
Students become active learners because they are engaged in collaborative and project-
based learning environments with an emphasis on higher-order thinking skills (Penuel,
Golan, Means, & Korback, 2000).
In a 1995 report to the U.S Congress, the Office of Technology Assessment
(1995) proposed that using computers could change the way teachers teach. This report
stated that some teachers use computers in a traditional “teacher-centered” method, such
as drill and practice for mastery of basic skills, or to supplement teacher-controlled
activities. However, other teachers use technology to support more student-centered
approaches to instruction, such as providing students with the opportunity to conduct
their own scientific inquires and engage in collaborative activities while the teacher
assumes the role of facilitator or coach. The learner-centered framework focuses on the
learners and their perceptions, needs and motivations (McCombs, 2000). Teachers who
fall into this second group are the more enthusiastic technology users, because
technology is particularly well suited to support this style of instruction (OTA, 1995).
Ausubel (1963) contends that meaningful learning occurs when new experiences
are relative to what a learner already knows. While developing expert systems, Jonassen,
Wilson, Wang, and Grabigner (1993) found that the people who seem to learn the most
from the design of instructional materials are the designers themselves. When students
28
are provided the opportunity to produce their own knowledge, it becomes a powerful
learning experience. The use of technology as a cognitive tool requires students to think
in meaningful ways about the application’s capabilities (Jonassen & Reeves, 1996).
The traditional use of the computer in the classroom has been to teach or tutor
students. Thomas Reeves (1998) describes this process as learning “from” computers in
which the primary goal is to increase student’s basic skills and knowledge. Learning
from computers takes on a variety of tutoring systems, such as computer-based
instruction (CBI), computer assisted instruction (CAI), and integrated learning systems
(ILS), in which content is provided from the computer (Ringstaff & Kelley, 2002).
The term learning “with” computers refers to students using technology as a tool
for problem solving, conceptual development, and critical thinking (Culp, Hawkins, &
Honey, 1999; Sandholtz, Ringstaff, & Dwyer, 1997; Means, 1994; Reeves, 1998). When
the computer takes on the role of a cognitive tool, it is an intellectual partner to enable
higher-order learning (Reeves, 1998). Rather than treating students as recipients of
knowledge, Jonassen and Reeves (1996) proposed that computers be used as a cognitive
tool allowing students to use the computer to interpret and organize their knowledge. The
computer as a tool allows teachers and students flexibility to creatively enhance the
curriculum and instruction. Examples of tool–based software include: spreadsheets,
databases, and multimedia software (Ringstaff & Kelley, 2002).
The more advanced uses of the computer support the constructivist view of
learning in which the teacher is a facilitator of learning rather than the classroom’s only
source of knowledge (Trilling & Hood, 1999; Penuel & Means, 1999; Statham & Torrell,

29
1999). In studies of students using the computer as a tool for instruction, teachers have
reported it provides them the opportunity to create a student-centered environment. The
teachers become more open to multiple perspectives on problems and are willing to
experiment in their teaching (Knapp & Glenn, 1996). Table 1 illustrates the contrasting
views of instruction with technology and construction with technology as a tool
(Sandholtz, Ringstaff, and Dwyer, 1997):
Table 1.
Contrasting Views of Instruction and Construction
Instruction Construction
Classroom activity teacher-centered
didactic
learner-centered
interactive
Teacher role fact teller
always expert
collaborative
sometimes learner
Student role listener
always learner
collaborators
sometimes expert
Instructional emphasis facts
memorization
relationships
inquiry and investigation
Concept of knowledge accumulation of facts transformation of facts
Demonstration of success quantity quality of understanding
Assessment norm-referenced criterion-referenced
portfolios and performances
Technology use drill and practice communication, collaborative,
information, access, expression

30
Project-based learning. One method for integrating cognitive technology tools in
a student-centered environment is to implement a project-based learning environment.
Project-based learning is organized around projects that allow students to encounter and
learn the central concepts of the subject. A project involves students in a constructive
goal directed process that entails inquiry, knowledge building, and resolution. The most
important aspect of project-based learning is that the projects are realistic and give the
students a feeling of authenticity (Thomas, 2000). Project-based learning gives control to
the learner to make decisions about the content, style and design.
Research on project-based learning has reported gains in student achievement,
problem solving capabilities, understanding of the given subject matter, comprehension
of specific skills and strategies in introduced in the project, and changes in problem
solving skills (Thomas, 2000). The Challenge 2000: Multimedia Project is an example of
project-based learning. The Multimedia Project was developed through a joint venture
with the San Mateo County Office of Education and Silicon Valley, a partnership of area
businesses focused on improving the quality of life in the Silicon Valley region in
northern California. The projects were expected to include seven components:
• Be anchored in core, curriculum; multidisciplinary
• Involve students in sustained effort over time
• Involve student decision-making
• Be collaborative
• Have a clear real-world connection
• Use a systematic assessment: both along the way and end product
31
• Take advantage of multimedia as a communication tool (Penuel, & Means, 1999).
To accomplish the goals of the Multimedia Project, support was provided to teachers in
learning how to implement projects by forming a peer community of learners. This
community was comprised of veteran teachers, who could share their teaching
experiences, and technology coordinators, who brought their technology related skills.
Through the implementation of a peer learning community, student-centered projects, and
the provision of support for teachers, the classroom processes were expected to change.
The design called for classrooms in which:
• Students engage in longer-term, more complex assignments
• Teachers act as coaches and facilitators of student learning
• Students engage in more small group collaborative activities
• Greater involvement with external resources is emphasized, including
heightened attention to external audiences for student work
These benchmarks were established to indicate that the project would meet its objectives
for student learning (Penuel, & Means, 1999).
The Stanford Research Institute (SRI) used case studies, interviews, teacher
surveys, classroom observations, and school-wide indicators of achievement and
performance assessment to evaluate the Multimedia Project. In year three of the study,
nineteen classrooms were chosen from among the Challenge 2000 classrooms across
grade levels. Principals from these schools then nominated three technology classrooms
engaged in the project and three non-technology classrooms. The results of the study

32
established that technology had made a difference in the classroom (Penuel & Means,
1999).
In the fall, students in the technology classrooms were only slightly more likely
than students in non-technology classrooms to be engaged in long-term projects.
However, by spring the gap was very wide, with 67% of technology classrooms involved
in extended projects compared to 14% in the non-technology using classrooms. Similarly,
in the fall, only 56% of technologies using classrooms were involved in the constructing
products, while 39% of non-technology using classrooms were involved in constructing
products. In the spring, 73% of technology using classrooms engaged students in small
group collaboration, compared to the 38% in the non-technology using classrooms
(Penuel & Means, 1999).
The study determined that teachers in Multimedia Project classrooms assumed the
role of coaches or facilitators. In the spring semester of the study, only 29% of time in the
technology-classrooms was devoted to teacher led activities, versus 62% in non-
technology classrooms. Teachers in the technology classrooms were more likely to spend
time explaining concepts, providing information, or questioning students about their
understanding of material. Finally, the study found that students in the Multimedia
Project classrooms were more likely to spend time engaged in small group collaboration.
In the spring portion of the study, only 3% of the time in the technology classrooms was
devoted to instructional or known answer questions compared to 72% of the time in the
non-technology classrooms. The study found that teachers had an eagerness to use
33
collaborative learning as a tool to promote a greater mastery of content and skill in
cooperating and working with others (Penuel & Means, 1999).
Technology in the Curricular Framework
The final condition for effective technology integration involves teachers’
development of student tasks that make use of technology as a tool within the curriculum
framework (Coley, Cradler, & Engle, 1997). Before technology can become a critical
element of the curriculum process, teachers must move beyond using it to simply
improve students’ basic skills. Teachers need to understand and appreciate the role
technology can perform within their curriculum. Hence, students will be given tasks that
employ the use of technology to construct their knowledge on a given topic, rather than
being an “add-on” to the curriculum (Sandholtz, Ringstaff, & Dwyer, 1997).
Researchers (Sandholtz, Ringstaff, & Dwyer, 1997) from ACOT recognized that
as teachers transformed their instructional methods, they progressively changed their use
of technology in the curriculum framework. For example, in the entry stage, technology
was used sparingly in the curriculum. Teachers used computer-based or tutorial programs
to reinforce concepts taught in the curriculum. However, in the appropriation stage,
students used technology as a tool to complete interdisciplinary, project-based tasks.
Students were provided access to tool-based programs, such as spreadsheets,
presentation, and multimedia authoring programs to complete their projects (Ringstaff,
Yocam, & Marsh, 1997).
Means and Olson (1995) anticipated that technology could expand learning
opportunities for all students when teachers utilized it as a tool in the curriculum and
34
instructional framework. As teachers develop an understanding for the impact technology
can have on the curriculum, there tends to be a shift in learning “from” technology to
learning “with” technology. In this manner, teachers and students have flexibility to
creatively enhance the curriculum and instruction, as technology is used as a tool to
gather, organize, and analyze that is used to solve problems and construct knowledge
(Means, Blando, Olson, & Middleton, 1993). Effective integration of technology depends
on the teachers’ understanding and development of tasks for students in the curriculum
framework (Baker, Herman, & Gerhart, 1996).
North Central Texas. When technology is implemented as a tool within the
curriculum, students are encouraged to develop higher-order thinking skills. Hopson,
Simms, and Knezek (2002) examined fifth and sixth grade students in a suburban school
district to determine if students in technology enriched classrooms demonstrated better
use of high-order thinking skills than students in a traditional classroom. The treatment
group was composed of students enrolled in a technology-enriched magnet school in a
North Central Texas school district during the 1996-97 and 1997-98 school years. The
treatment group included students selected at random from the students who applied for
the program. The comparison group included students not accepted to the magnet
program, along with students from comparable campuses without a technology-enriched
classroom (Hopson, Simms, & Knezek, 2002).
The research design for this study was a posttest and quasi-experimental design.
The treatment and comparison groups were given the Ross Test of Higher Cognitive
Process. The Ross Test is a 105-item test to determine the effectiveness of curricula or

35
instructional methodology to teach the higher-order thinking skills of analysis, synthesis,
and evaluation. Four distinct groups were identified for the study based on demographics
and grade level (Hopson, Simms, & Knezek, 2002).
The treatment groups were provided access to the computer as a tool for learning,
and instructed using the fifth grade curriculum for a technology-rich environment. Each
of the treatment classrooms was equipped with one computer for every two students
allowing the students to use spreadsheet, database, and word processing software as tools
to take notes, produce assignments, and construct projects. In addition, the teachers were
equipped with a multimedia teaching station and trained on the use of technology as a
tool for learning (Hopson, Simms, & Knezek, 2002).
The comparison groups were instructed in a traditional classroom setting with the
district’s curriculum for fifth grade. The comparison classrooms had no access to
computers in the classroom and only limited access to computers in the campus computer
lab for computer literacy and remediation. The teachers did not have access to computer
based teaching stations and received no training in the use of technology as a tool for
learning (Hopson, Simms, & Knezek, 2002).
A univariate analysis of variance was used to establish initial equivalence for the
treatment and comparison groups on the Ross Test. The results of the ANOVA indicated
no significant difference between the fifth-grade treatment and comparison groups. A
one-way ANOVA on the posttest data indicated differences between the sixth grade
groups was significant, so an analysis of covariance was required. The fifth and sixth
grade treatment group students exhibited a higher level of evaluation skill as measured by
36
the Ross Test. No significance difference was noted in the performance of the two groups
on the analysis and synthesis subtests. The technology-enriched classroom environment
had a minimal but positive effect on student acquisition of higher-order thinking skills
(Hopson, Simms, & Knezek, 2002).
This study adds to the limited research on the use of computers to enhance the
development of higher-order thinking skills. The teachers reported that learning in the
technology enriched classrooms was more student-centered and less teacher/textbook
driven. An environment was created that facilitated the use of cooperative groups with
students focused on knowledge construction rather than acquisition (Hopson, Simms, &
Knezek, 2002).
Summary
Computers and technology can provide students with the opportunity to construct
their own knowledge. However, computers in and of themselves do very little to aid in
the learning process, and the presence of technology in the classroom does not
automatically inspire teachers to rethink their teaching or students to adopt new modes of
learning. In order for a change to occur, both teachers and learners need to learn how to
take advantage of technology to enhance learning (Coley, Cradler, & Engel, 2000). It is
the role of the teachers to implement and use technology as a tool for learning with their
students.

37
Technology and Students of Low Socioeconomic Status
Research has found that poverty is one factor associated with student achievement
and school dropout rates (Leroy & Symes, 2001). Other factors associated with low
achievement include racial or ethnic background, single-parent family, mother with low
education, limited proficiency in English, and low expectations for success (Miller, 1993;
Huang & Waxman, 1996; Strahan, 2003). Often, students who are likely to fail in school
or in life because of their life’s social curriculum are generally termed “at-risk students”
(Slavin & Madden, 1983). These students are at-risk of failure because of broken homes
and a culture of poverty.
In the Conditions of Education (NCES, 2002), researchers stated that poverty has
the potential to be a serious threat to students access to quality learning opportunities and
their success in school. According to the 2000 Census, 15% of all children lived in
households where the annual income in the previous year was below poverty level.
Students from low SES can be found throughout the United States; the state of Florida
has an average with 18% of students living at the poverty level (Kidscount Snapshot,
2004).
Title I Schools
In 1965, Congress established the Elementary and Secondary Education Act. The
goals of the Title I program were to improve schooling in areas of high poverty areas and
to advance the equality of education outcomes (Borman, 2003). Since that time, the
federal government has appropriated nearly eight billion dollars each year for Title I
programs designed to assist economically disadvantaged students (Citizen’s Commission

38
on Civil Rights, 1998). Recently, the largest funding in history was given to the Title I
program calling for stronger accountability mandates and holding schools and districts
responsible for the achievement of outcomes of minority students, low-income students,
and English-language learners (Borman, 2003).
Several critical issues have been associated with the low achievement of students
from high-poverty Title I schools. While researchers realize the most serious concerns are
basic funding and political beliefs, there are still several amendable issues with possible
improvements for at-risk students (Melendez, 1993). Three critical issues are: shortage of
qualified teachers; teachers' low expectations; and teaching practices that consist
predominantly of basic skills (Waxman, Padron, & Arnold, 2001).
Frequently, the most under-prepared teachers are assigned to schools and
classrooms in areas with the highest level of poverty (Darling-Hammond, 1992, 1997).
Teachers from high poverty schools tend to have lower literacy skills on teacher
certification tests than teachers from advantaged schools. Those differences in teacher
qualities often have an impact on student achievement (Ferguson, 1998). Furthermore,
teachers of at-risk students have been found less skilled at implementing more complex
approaches to instruction and less capable of identifying students’ needs (Darling-
Hammond, 1992, 1997).
The second critical issue has to do with teacher expectations of students from
high-poverty Title I schools. Lower teacher expectations result in an overemphasis on
repetition of content through drill and practice (Knapp & Shields, 1990; Lehr & Harris,
1988). Often, at-risk students are not provided tasks to promote higher-order thinking

39
skills because it is believed they must first demonstrate lower levels of knowledge before
they can be taught higher level skills (Rivera & Zehler, 1991; Waxman, Padron, &
Knight, 1991). When teachers underestimate the potential of students from high poverty
schools, the achievement gap widens between minority and majority students (Ferguson,
1998).
The final issue is the teacher-centered model of instruction found in schools that
serve at-risk students (Brookhart & Rusnak, 1993; Haberman, 1991, Waxman, Huang, &
Padron, 1995). The teacher-centered model of instruction emphasizes lecture, drill and
practice, remediation, and student seatwork, consisting mostly of worksheets (Stephen,
Varble, & Taitt, 1993). Haberman (1991) calls this emphasis on teacher directed
instruction in high poverty schools with at-risk students a “pedagogy of poverty.” He
went on to state that when teachers are “making” students learn, the students usually
assume a passive role with low engagement in tasks that are not generally authentic
(Haberman, 1991).
Characteristics of Students
Often, students living in poverty have different basic value and belief systems
from the schools they attend, which operate within middle class norms. It becomes the
role of teacher and school to mediate the student’s belief system with the teacher’s belief
system. Payne (2001) describes poverty as “the extent to which an individual does
without resources” (p. 16). These resources include financial, emotional, mental,
spiritual, physical, support systems, relationships, and knowledge of hidden rules of class.

40
Schools become the only environment in which students of poverty have the opportunity
to access a number of these resources (Payne, 2001).
Students of poverty often come to school with different expectations than their
peers and teachers. Researchers have found that poverty affects a student’s growth,
cognitive development and academic achievement (Alaimo, Olson, & Frangillo, 2001).
Often, students of poverty lack a motivation to learn, because they live in environments
over which they have little control. When they are at school, they lack a vision for their
future and see themselves remaining in this situation for the rest of their lives (Bandura,
2001; Brophy, 1998). The students are unable to make the connection between acquiring
an education and creating an opportunity out of their situation.
In addition, a lack of readiness to learn exists because of their social situation.
They are deficient in the social and cognitive skills that are needed to succeed in life
because their social environment has affected their development (Renchler, 2000). Their
home environment has limited opportunity to organize perceptions and to develop higher-
order cognitive process. The students lack the ability to solve problems because of a lack
of parental involvement, which supports the development of independent thinking
(Benson, 1995; Bowman, 1994).
Student Achievement
Research has shown that poverty has a negative impact on student learning and
future success (Payne, 1998). In a research study on students of poverty in inner cities,
Renchler (1993) found those living in low socioeconomic areas were more likely to have
educationally damaging circumstances as part of their life experiences than higher SES
41
children. Poverty negatively effects a student’s cognitive development, academic
achievement, and physical and emotional health (Alaimo, Olson, & Frangillo, 2001).
Researchers conducted a two-year study in high poverty schools with a focus on
instructional practices designed to promote children’s understanding and build meaning
into the learning experience. The study included three states (California, Maryland, and
Ohio) and approximately 140 classrooms in 15 schools. During the first year, grades one,
three, and five were studied; the second year included grades two, four, and six. The
study focused on three subject areas (mathematics, reading, and writing) since these
subjects accounted for the majority of instructional time in elementary grades (Knapp,
Shields, & Turnbull, 1995).
After an analysis of instruction and student learning gains, the researchers
concluded that meaning-oriented instruction produces superior learning to more
traditional skills with both low performing and high performing students. Instruction that
emphasizes reasoning and problem solving is more effective at teaching advanced skills,
as effective at teaching basic skills, and better at engaging students in learning. Their
research offered a three-pronged argument for teaching meaning in high-poverty
classrooms. First, teachers construct and maintain a rich academic learning environment,
which reflects the students’ diverse cultural and SES backgrounds. Second, teachers
approach instruction in a method that produces a higher level of thinking by constructing
cognitively demanding tasks. Third, teachers are able to sustain this form of teaching
because of the instructional leadership, peer support, and uninterrupted blocks of
instructional time (Knapp, Shields, & Turnbull, 1995).

42
Technology in Schools with Low SES Student Population
Research examining the use of technology in high poverty, Title I elementary
schools is very limited. Some studies reveal that although millions of dollars have been
appropriated for technology in high poverty, Title I schools, it is not being utilized
effectively as a tool for higher order thinking skills (Waxman & Huang, 1996;
Wenglinsky, 1998; Waxman, Padron, & Arnold, 2001). Additional research findings
concluded that teachers from high poverty schools were less prepared to use computers
than teachers from economically advantaged schools (Wenglinsky, 1998).
Wenglinsky (1998) examined the relationship between educational technology
and student achievement in mathematics. Data were gathered from the 1996 National
Assessment of Education Progress in mathematics consisting of national samples of
6,227 fourth graders and 7,146 eighth graders. Data included the frequency of use for
mathematics in schools, access to computers at home and in school, professional
development of mathematics teachers in computer use, and the kinds of instructional use
of computers in the schools.
Wenglinsky (1998) concluded that the impact of technology depended on how
teachers used it and integrated in the curriculum with their students. The overall
frequency of school computer use for simulation and higher order thinking skills had a
positive impact to academic achievement. He concluded that “disadvantaged eighth-
graders seem to be less likely to be exposed to higher order learning through computers”
and that using “computers for drill and practice, the lower-order skills, is negatively
related to academic achievement" (1999, paragraph 4).

43
In the spring of 1998, the Teaching, Learning, and Computing (TLC) survey was
conducted with a national sample of principals, technology coordinators, and teachers
(Ravitz, Becker & Wong, 2000). Altogether, over 4,000 teachers from grades 4 through
12 in over 1,100 schools from across the United States chose to participate in the survey.
Between the fourth through sixth grade teachers in this sample who use computers for
instruction, teachers in predominately minority, poorer schools (N=120) showed no real
difference in the use of skill/game software than teachers in wealthier schools (N=189).
The use of word processing, however, was much more prevalent in economically
advantaged schools. Teachers in wealthier schools were also more likely to use
simulations, reference materials, spreadsheets/databases, multimedia, and web browsers
than were teachers who taught minority students in low SES schools (Becker, Ravitz, &
Wong, 1999).
Students of poverty need to develop cognitive skills and become designers of their
learning. Students learn and retain the most from thinking in meaningful ways. Using
technology as a cognitive tool enables students to apply concepts in a variety of contexts.
Those tools need to engage students in the cognitive strategies of learning such as
construct, collaborate, interact, and contextualize process (Roschelle, Pea, Hoadley,
Gordin, & Means, 2000). The more advanced uses of technology support the
constructivist view of learning in which the teacher is a facilitator of learning rather than
the classroom’s only source of knowledge (Penuel & Means, 1999; Statham & Torrell,
1999; and Trilling & Hood, 1999). However, little research exists on the use of this type
of technology with at-risk elementary students

44
In a recent study Page (2002) investigated the effects of technology on the
academic accomplishments of elementary students of low SES, the sense of worth for
those students, and the classroom among between students and with teachers, which
resulted from the exposure. The purpose of the study was to compare elementary
students’ attainments, such as self-esteem, classroom interactions with peers, and
academic achievement, in a technology-enriched environment with those of students in
traditional elementary classrooms. This quasi-experimental study was designed to
examine if the outcomes would be significantly different between the two groups (Page,
2002).
Participants in this study included 211 students from 10 classrooms (five
technology enriched and five without technology) at five elementary schools in
Louisiana. Two of the schools included third grade classes for the experimental and
control groups, while three of the schools included fifth-grade classrooms for the
experimental and control groups. Each of the classrooms involved in the study was a self-
contained classroom, with the students in each class typical of other students at their
particular schools. Most of the students were from lower-income families, and all were
classified as being low SES (Page, 2002).
The experimental and control classrooms were selected by each school’s principal
based on their teaching performance. The teacher in each of the experimental group
classrooms was fully trained in the use of technology and was made aware of innovative
uses of technology through workshops, in-service days, and university coursework.
Throughout the year, the experimental teachers began to integrate technology as a tool

45
into the curriculum. Experimental teachers made an effort to integrate technology into
every lesson, whether or not the learning opportunity appeared to be technology based.
The teachers were provided assistance from staff members on the Louisiana Challenge
with technical assistance, training in operational procedures, and technology integration
(Page, 2002).
The hardware in each of the experimental group classrooms included at a
minimum: a teacher computer; four student computers; five Internet connections; a
network laser printer; an inkjet printer; a large TV monitor; a presentation device; a
digital camera; a VCR; a classroom set of calculators; a laserdisc player with laserdiscs;
and a mini computer camera for videoconferencing. The software package included: an
integrated office-suite; a multimedia authoring tool; math curriculum programs; reference
programs; and a portfolio assessment.
Teachers in both the experimental and control groups followed the same
curriculum throughout the school year with different approaches (technology or
traditional). The control group teachers conducted their classroom in the traditional
manner. The majority of the classrooms contained a computer for teacher use, but with
little or no access for students to technology (Page, 2002).
Data for this study were collected from standardized achievement scores. Four
schools used the Iowa Tests of Basic Skills (ITBS) to measure student achievement in
math and reading (Hoover, Hieronymus, Frisbie, & Dunbar, 1996; Page, 2002). Pretests
were administered in April 1998 and posttests in March 1999. One school administered
the California Achievement Test (CAT, 1996) for reading and mathematics achievement.

46
CAT pretests were administered to all students in September 1998 and posttests in April
1999. All schools completed the Coopersmith Self-Esteem Inventories (CSEI) during the
two observation sessions for each school (Page, 2002).
Two additional observations in the experimental and control group classrooms
utilized an adapted version of the Flanders Interaction Analysis System (FIAS)
instrument to measure initiation/reaction patterns among students and teachers. A form
was developed that allowed the researcher to record both classroom activities and the
instances of classroom verbal exchange. The observation period was for an entire day in
which the researcher listened and recorded for a three-minute time period, then took a
three-minute rest from recording interactions. This process was repeated for the entire
observation period (Page, 2002).
Data from the ITBS, the CAT, and CESL were analyzed to determine if
significant differences existed between the adjusted posttest means of the experimental
and control groups. The ANCOVA analyses related to reading showed mixed results, as
there was no significant difference between the adjusted posttest means of the ITBS
Reading Total. However, there was a statistically significant difference on the adjusted
post means of the CAT Vocabulary, p<.001, and the CAT Comprehension, p<.001. In
regards to the math, the ANCOVA analyses were much more consistent than the reading.
There as a statistically significant difference, p<.05, with the ITBS Mathematical Total
scores and the CAT Mathematical Concepts and Applications, p<.001, and the Analytical
Mathematics, p<.001 (Page, 2002).

47
The researchers found a statistically significant difference, p<.05, with the
ANCOVA analysis between the experimental and control groups on the composite self-
esteem scores. The experimental group had a higher adjust pot means score with general
self-esteem, p<.001, and school self-esteem, p<.05. A statistically significant difference
was found in the analysis on classroom interactions, p<.001, between the experimental
and control group. In particular, the differences were found between the types of
classroom interactions. In the experimental group, the frequency of student to student
interaction was observed 51% of the time with the teacher to student frequency 31% of
the time. A contrast was seen in the control group, in which the student to student
interaction frequency was 16% of the time and the frequency of the teacher to student
interaction was 58% of the time.
The study concluded that when students of low SES have a technology enriched
elementary classroom, levels of mathematics achievement, self-esteem, and student-
centered learning environments. Students in technology-enriched classrooms scored
higher on standardized tests in mathematics. In addition, those same classrooms, students
were provided the opportunity to take control of their own learning environment, through
computer work groups and student to student interactions. The researcher recognized that
other variables were involved in the study, thus could not conclude that the computers
and technologies caused these positive outcomes (Page, 2002).
Summary
Research has demonstrated that students of poverty are more likely than other
students to attend schools with limited access to technology and receive only traditional

48
instruction consisting of lecture and drill-and-practice activities. Much of the research
involving students of poverty mirrors the “soft bigotry of low expectations” (U.S.
Department of Education, 2002) and has therefore focused on learning from technology
rather than learning with technology. A clear gap exists in the research on use of
technology as a tool for learning with students of poverty.
The school must take on the role of creating a culture in which all students from
various ethnicities and SES backgrounds can understand the vital role education plays in
their lives and futures (Bowman, 1994; Marlowe & Page, 1999). A social environment
must be created in which all students feel a part of the learning so they can take
responsibility for their lives. The students must be educated to reach beyond their current
poverty and given intellectual and social skills, to succeed more fully in life (Renchler,
2000). This goal will be achieved when school principal and instructional staff set high
expectations that are attainable for all students.
Schools provide the opportunity to increase students’ academic achievement and
allow them to reach their potential when students are viewed at-promise rather than at-
risk (Slavin, 1998). A learning environment at the school must be created that allows for
students to become more independent learners as they assume responsibility for their
learning. In order for schools to be successful in student learning, a pattern of attitudes,
beliefs and behaviors by the principal, teachers, and support staff needs to be developed
for high expectations and commitment to bring about student achievement (Good &
Brophy, 1996). In addition, schools with low SES students must have access to the same
levels of hardware and software tools as high SES schools.

49
CHAPTER THREE
METHOD
This chapter is divided into three major sections. The first section outlines the
research questions to be examined. The second section is background on the Technology
Resource Survey instrument. The final section is the research method that was employed
to answer the research questions.
Research Design
This study used secondary data to examine the use of technology in low and high
socioeconomic in public elementary schools in the state of Florida. Data from statewide
surveys related to technology were used to investigate differences in access and use of
technology in low and high SES schools. Specifically, this study used data from the
2005–06 School Technology Resource Survey to examine the following questions:
1. Is there a significant difference between students’ access to computers in high
and low socioeconomic schools?
a. Is there a significant difference in the total number (desktops and laptops)
of modern and non-modern computers?
b. Is there a significant difference in the locations of the computers for
student use?
2. Is there a significant difference in the types of software available on
computers between high and low SES schools?

50
3. Is there a relationship between the socioeconomic status of an elementary
school and the frequency of student use by software type?
4. Is there a relationship between socioeconomic status of an elementary school
and the teacher use of technology in the classroom?
Population
To answer the research questions, enrollment data for all elementary schools in
Florida were tabulated then categorized according to poverty level. These data were
provided from the Division of Accountability, Research and Measurement (ARM) in the
Florida Department of Education. It is the role of ARM to assist school districts in the
legislative requirement for reporting accurate information to the Master School
Identification Database (MSID). This file contains information for all public school PK-
12 schools such as school type, primary service, and Title I status.
The Title I status is designated by the school district based on the criteria in No
Child Left Behind legislation based on the students who were eligible to receive free and
reduced lunch. Under the National School Lunch and Breakfast Programs, students
unable to pay the full price of meals served have the opportunity to apply for free or
reduced price meals. Students eligible for this program come from households whose
household income is at or below the poverty level. The data on the students that are
eligible for the program are then aggregated to provide accurate information on the
poverty level of each of the schools.
For this study, data on elementary schools were used as it reflects the most
accurate information on the poverty level of a school. A factor for using elementary

51
schools over secondary was the higher concentration of schools that qualify for the
program. In addition, using eligibility for secondary schools is not as reliable because the
students may attach a stigma to receiving a school lunch subsidy (National Science
Foundation, 2006).
The data focused only on those public elementary schools with grade levels of
PK-6 (N=1591) for the school year of 2005-06. The elementary schools in the MSID file
were ranked from highest poverty level to the lowest poverty level. These data were then
broken into four quartiles with a focus on the top 25% of schools that have a larger
student population at poverty level and the bottom part 25% of schools that have a
smaller student population a poverty level. For this study, low SES schools were defined
as the top quartile of elementary schools with a high poverty, and high SES schools were
defined as those schools in the bottom quartile with low levels of poverty.
Instrument
For more than twenty years, the state of Florida, Office of Educational
Technology, has collected information from the 67 school districts about the access to
technology in the schools. Historically, the Computer Survey has focused on “counting
the boxes” – reporting how many computers were available in each school and the
age/type of each computer. In response to the NCLB legislation, the Florida Department
of Education significantly revised its annual technology survey in 2002 to provide more
meaningful information about technology integration and capacity in Florida’s schools.
The result of those modifications culminated in the School Technology and Readiness
(STaR) Chart and updated Technology Resource Survey.

52
Construct Definition
In the summer of 2002, educational technology leaders in Florida expressed a
desire to modify the Computer Survey, shifting the focus from simply the numbers and
types of computers per student to areas such as technology planning, integration, and
accountability. Content experts from across the state were assembled to define key
elements for the revised survey. Using a model from the state of Texas as a starting point,
strands and categories were identified and discussed. The result was the School
Technology and Readiness (STaR) chart, which was comprised of five strands, each
made up of 3 to 5 categories (See Table 2).

53
Table 2.
STaR Strands and Categories within Each Strand
Strand I Strand II Strand III Strand IV Strand V
Technology Administration
and Support
Technology Capacity
Educator Competency
and Professional Development
Learners and
Learning
Accountability
Technology Planning
Student Computer
Access
School Administrators
Student Use of
Technology
Student Technology Standards
Technical Support
Teacher Computer
Access
Professional Development
Budget
21st Century Classroom
Teacher Technology Standards
Instructional Technology
Support
Internet Access (not in
analysis)
Models of Professional Development
Secondary Technology
Courses
School Budget Video Capacity
Content of Professional Development
Community Outreach
Funding LAN/WAN
Cat
egor
y N
ame
Curriculum-based Tools
Survey Development
The STaR chart provided the initial structure for the subsequent Technology
Resource survey, which was developed with input from the Office of Educational
Technology (OET) and technology leaders from around the state. First, the Florida Center
for Instructional Technology (FCIT) staff at the University of South Florida worked
closely with OET representatives to create survey items and verify alignment with the
Florida STaR chart. Next, several work group sessions were held with content experts in

54
order to write and revise items. Item formats included multiple-choice, check-box, and
open-ended response. These review sessions began in August 2002, and continued
through December 2002.
In December 2002, experts in survey development at the University of South
Florida reviewed the draft survey, which was then posted on an FCIT server for comment
from technology leaders across the state. Throughout January 2003, FCIT staff visited
principals in their schools to observe them and elicit comments as they worked through
the draft survey. Each page of the draft survey also allowed for immediate email
feedback from principals or other content experts who were field-testing the survey.
Survey items were revised based on feedback from field-testing and emailed comments
from participants.
Pilot Test Implementation
The survey was initially programmed using open source software such as Apache,
PHP, and MySQL. An Xserve server was used, to ensure that the survey could withstand
hundreds of simultaneous connections with schools entering data. The survey was
designed so that a school could log on and answer some of the questions and then quit.
When the school logged back on, all of the previous answers were available for viewing
or revision. A menu page was provided to indicate the questions that had been answered
and those that had not yet been answered.
Survey Structure. The initial survey contained a base set of 47 items. The answer
for each of the initial questions determined which, if any, contingency (follow-up)
questions were asked. The contingency questions allowed for a more precise placement
55
within the STaR chart categories, and provided additional information for future item
development. Questions were presented one at a time; schools could skip and go back to
questions multiple times.
District Review. When a school finished with the survey, the district was informed
that the survey was ready for review. The appropriate district representative was then able
to review and accept or reject the survey. If it was accepted, the results were written into
a permanent database and were not available for revision. If rejected by the district for
inaccurate data, the school was able to revise the answers as directed by the district.
Data Review and Verification. Schools were given approximately six weeks to
complete the survey. Districts then had an additional three weeks to accept the completed
surveys. At this point, the data were downloaded and screened for missing, extreme, and
anomalous responses. A spreadsheet was provided to each district technology supervisor
with the response cells coded yellow for a response that was outside of the normal range,
orange for an anomalous or unusable response, and red for missing. Surveys were re-
opened so that corrected information could be recorded and the surveys re-accepted.
The implementation of the survey was an interactive process that entailed a
variety of individuals, from the district level technology personnel to the school-based
technology specialist. The district received the password for the survey system and had
the responsibility of sharing it with the individual schools. It was then the role of
individuals at the school level to gather and input all of the data necessary for completing
the survey. During this process, the district and schools were in constant communication
through email and phone calls to verify the accuracy of the data being reported. Accuracy

56
was determined when the data reflected the purchase invoices for the hardware and
software at the district level.
Current Implementation
The Technology Resource Survey has been implemented over the last three years
with all public schools in the state of Florida, which includes elementary, middle school,
combination, junior high school, high school and charter. In 2003-04 there were 2,514
respondents (97% response rate); in 2004-05 there were 2,553 respondents (96%
response rate); and in 2005-06 there were 2,667 respondents (97% response rate).
Each year, the survey has been implemented in the fall with districts being
provided with secure passwords for the district administrator and the school
administrator. The respondents are provided a nine-week time span to complete the
survey with guidance from the DOE on item verification. The district administrator
coordinates with all public schools, including charter and special centers to complete the
survey and verify data provided.
At the end of the data collection, the DOE provides districts with a spreadsheet on
the school data to examine any anomalies in the reporting. For example, a school may
have reported 5,000 modern computers in the general education lab, when it is actually
50 modern computers. The district administrator contacts the school to verify the data and
correct the information.
Over the past three years, revisions to the Technology Resource Survey have been
limited to ensure the integrity of the data for reporting purposes to the United States
Department of Education. At the end of each year, items are analyzed and revised with

57
input from experts in item development, technology, school leadership, and
programming. The majority of items have remained the same with only a tweaking of
terminology to ensure the item reflects the data that are required for a particular section.
A validation report was done in the summer of 2006 (Florida Center for
Instructional Technology, 2006), on the integrity of the web-based reporting tool. The
Structured Query Language (SQL) used to access the response data from the database
was analyzed for accuracy. The researchers examined the records for county level
analysis and school level analysis, and determined the reporting utility produced valid
records. In addition, the SQL statements appear to provide the correct grouping
information: elementary, middle/junior, high, and combination classifications. The
researchers concluded that the reporting software for the STAR online reporting utility
provides reliable information.
Data Source and Analysis
Data from 2005-06 School Technology Resource Survey were the primary source
of data for the research questions. Selected items from the Administrative and Technical
portions of the survey were analyzed for elementary schools. The data from the survey
were merged with the statewide data for student enrollment from public elementary
schools. Other factors that were considered in this analysis include issues such as urban
and rural settings, size of school, and ethnicity of the student population. This section will
address the reliability and validity of the items to be used from the survey and the type of
statistical analysis and descriptive statistics.

58
Research Question #1: Is there a significant difference between student access to
computers in high and low socioeconomic schools? Is there a significant difference
between total number (desktops and laptops) of modern and non-modern computers? Is
there a significant difference between the locations of the computers for student use?
Item #2 and #3 within the Access to Technology category of the Technology Resource
Survey provided the data on students' access to computers in the schools. These two
items have strong face validity in reporting the modern (purchased within the last three
years) and non-modern (purchased more than three years ago) computers, the types of
computers, and instructional location. Specifically, item #2 requires respondents to
provide data on the exact number of modern laptop and desktop computers available for
students in specific areas of instruction (See Figure 2).

59
Figure 2. Student access to modern computers.
Item #3 asked respondents to provide data on the exact number of non-modern
laptop and desktop computers available for students in specific areas of instruction (See
Figure 3).
Figure 3. Student access to non-modern computers
Data from items #2 and #3 were analyzed to answer the difference between the
total number of modern and non-modern computers available for student access. The two
categories of desktops and laptops were combined for each room location within the
modern computer group and the non-modern computer group. The next step was to
compute by dividing the school size by number of computers. The two variables of

60
modern computers and non-modern computers were then analyzed will an independent t-
test. The poverty level of students was a dichotomized as the median was used for the
high socioeconomic schools and the low socioeconomic schools.
To answer the question of location for computers, the data from the total number
of modern computers was split into two groups of classroom versus non-classroom or
labs. The classroom variable was the total number of modern computers in the classroom,
mobile labs, and computers assigned to students. The non-classroom variable was a
combination of the media center, general education lab, special education lab, vocational
education lab, and other student gathering places. A independent t-test was used to
examine the difference in high and low socioeconomic schools. Additional analysis
included descriptive statistics with graphical descriptions of the median and mode for the
high and low SES schools.
Research Question #2: Is there a significant difference between the types of
software available on the computers for high and low SES schools? In order to answer
this question, item #16 from Access to Technology section was used to provide data on
tool-based software (See Figure 4). Cronbach’s alpha measure of internal consistency
reliability of scores on this group of nine survey items was .76.
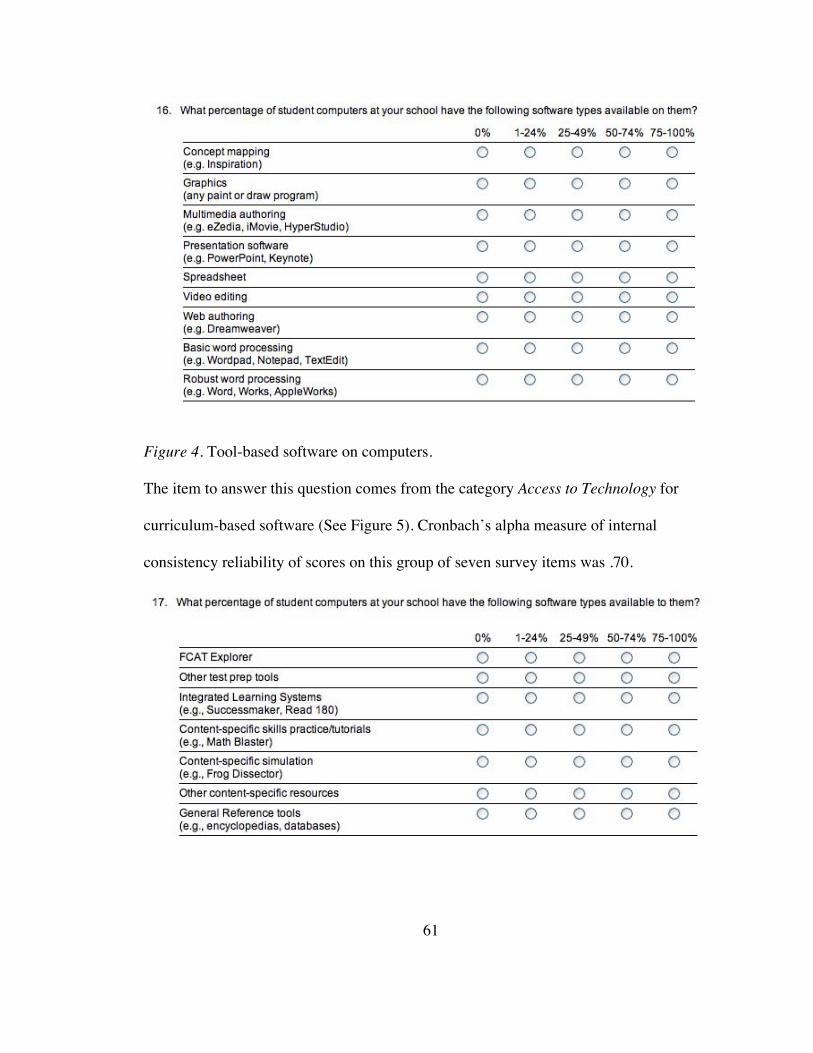
61
Figure 4. Tool-based software on computers.
The item to answer this question comes from the category Access to Technology for
curriculum-based software (See Figure 5). Cronbach’s alpha measure of internal
consistency reliability of scores on this group of seven survey items was .70.

62
Figure 5. Curriculum-based software on computers.
The two variables for this question are tool-based software and curriculum-based
software. The first item represents the availability of tool-based software on student
computers and the second item represents the availability of curriculum-based software.
The data from the tool-based software was collapsed down to one category of availability
on the computers in which the midpoint was calculated for the tool- based software. The
same procedure was then done for the curriculum-based software. A t-test was done to
examine the difference in the types of software available for high and low socioeconomic
students.
Research Question #3: Is there a relationship between the socioeconomic status of
an elementary school and the frequency of student use by software type? In order to
answer this question, data from item #43 in the category for Digital Learning
Environment was used. This item asks respondents for data on the frequency of student
use of various software types (See Figure 6).

63
Figure 6. Frequency of student use of software.
The indicators from this item represent the frequency of student use for the
variables of tool-based software and curriculum-based software. Cronbach’s alpha
measure of internal consistency reliability of scores on this group of seven survey items
was .77. Data from the indicators for multimedia, tool-based software, research, and
presentation software were collapsed into the tool-based category. Data from the
indicators for drill and practice software, integrated learning system, and simulation
software were collapsed into the curriculum-based category.
The categories for frequency were broken down to limited and regular. The
indicators, “not at all” and “once a month” were collapsed for the limited category. The
indicators, “once a week”, “several times a week”, and “everyday” were collapsed for the
regular category. A t-test was used to analyze the types of software, frequency of student
and use, and socioeconomic status.
Research Question #4: Is there a relationship between the socioeconomic status of
an elementary school and the teacher use of technology in the classroom? In order to
answer this question, data from item #1 in the category Digital Learning Environment
from the principal survey were used (See Figure 7).

64
Figure 7. Level of teacher use of technology.
The indicators from this item represent the teacher’s use for both tool-based
software and curriculum-based software with students. In addition, the indicators reflect
the levels of the technology integration for the teacher from entry to innovation.
Cronbach’s alpha measure of internal consistency reliability of scores on this group of
five survey items was .79. The midpoint for each composite variable was analyzed as a
continuous variable. Descriptive statistics were used to examine the levels of technology
integration in high poverty schools and low poverty schools.

65
CHAPTER FOUR
RESULTS
This chapter presents the analysis of the data from the 2005-06 Technology
Resource Survey. This chapter is divided into five sections to represent the verification of
the data and the research questions. The first section explains the process for the
verification of the data. The next section examines students' access to technology in high
and low socioeconomic schools. The third section examines the types of software
available on the computers. The next section examines the relationship between the
socioeconomic status of the school and frequency of student use by software type. The
final section examines the teacher use of technology in the classroom.
Verification of Data
The first step in the process for the data analysis was to acquire the data from the
Florida Innovates website. This website provides district contacts with access to results
from the Technology Resource Survey through a secure log in. These data can be
provided through a web interface and/or can be downloaded in raw format of a comma-
separated values file. Once the data were acquired from the 2005-06 survey, it was then
delineated to include only elementary schools, as defined to include all schools with
grades PREK-5, PREK-6, K -5, or K-6. A new file was created to include only the
schools that met the parameters of the research.
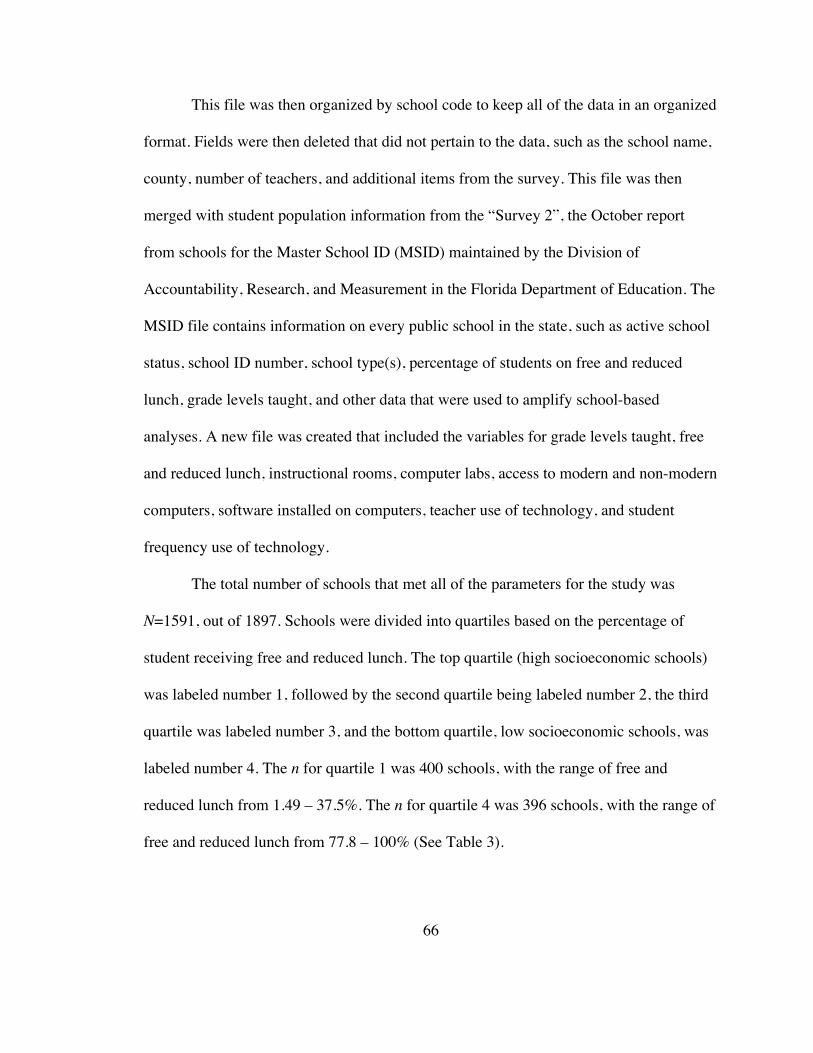
66
This file was then organized by school code to keep all of the data in an organized
format. Fields were then deleted that did not pertain to the data, such as the school name,
county, number of teachers, and additional items from the survey. This file was then
merged with student population information from the “Survey 2”, the October report
from schools for the Master School ID (MSID) maintained by the Division of
Accountability, Research, and Measurement in the Florida Department of Education. The
MSID file contains information on every public school in the state, such as active school
status, school ID number, school type(s), percentage of students on free and reduced
lunch, grade levels taught, and other data that were used to amplify school-based
analyses. A new file was created that included the variables for grade levels taught, free
and reduced lunch, instructional rooms, computer labs, access to modern and non-modern
computers, software installed on computers, teacher use of technology, and student
frequency use of technology.
The total number of schools that met all of the parameters for the study was
N=1591, out of 1897. Schools were divided into quartiles based on the percentage of
student receiving free and reduced lunch. The top quartile (high socioeconomic schools)
was labeled number 1, followed by the second quartile being labeled number 2, the third
quartile was labeled number 3, and the bottom quartile, low socioeconomic schools, was
labeled number 4. The n for quartile 1 was 400 schools, with the range of free and
reduced lunch from 1.49 – 37.5%. The n for quartile 4 was 396 schools, with the range of
free and reduced lunch from 77.8 – 100% (See Table 3).

67
Table 3.
Number of Schools and Student by Free and Reduced Lunch Status
N Minimum
Free/Reduced
Maximum
Free/Reduced
Total Students
Quartile 1 400 1.49 37.5 324,089
Quartile 2 397 37.6 59.7 294,774
Quartile 3 398 59.8 77.7 271,436
Quartile 4 396 77.8 100 251,784
Total 1591 1,142,083
The sample size of N=796 had 400 high SES schools and 396 low SES schools.
An additional parameter was to only include grades Kindergarten through 6, hence those
schools with students in Prekindergarten classrooms were excluded from the student
membership totals. The Florida Department of Education classifies school districts as
small, medium, or large based on the number of students that are served. A small district
serves a student population from 1–10,000; a medium district serves 10,000–100,000
students; and a large district serves over 100,000 students. The high SES sample schools
had a frequency of 7 percent from small districts, 40 percent from medium districts, and
53 percent from large districts (See Table 4). The low SES sample schools had 5 percent
from small districts, 24 percent from medium districts, and 71 percent from large
districts.

68
Table 4.
District Size for Sample Size
Small Medium Large
High SES 7% 40% 53%
Low SES 5% 24% 71%
After the data were organized into the data sets, abnormalities were noticed with
the data, such as schools that reported the same number for more than one variable. For
example, one school reported a value of 232 for classroom laptop computers and the
same value (232) for the number of mobile laptop computers. This irregularity was more
apparent when analyses were run with SPSS on the ratio of students to computers in
which the results reported that each student had access to two computers.
Since most of the irregularities found in the data related to the number of
computers, further analysis was conducted to compare the value for modern desktop
classroom computers to the value for non-modern desktop computers; the value for
modern classroom laptop computers to the value for mobile computer labs; and the value
for modern classroom laptop computers to the value for laptop computers assigned to
students. This analysis was conducted using SPSS, and the different variables were
compared for equivalent values. All of the cases were sorted by total modern computers,
so that the values could be examined for extreme cases and/or duplicate values for
different variables. In addition, new variables were created for the total number of
modern classroom computers, total number of modern lab computers, total modern

69
computers, total non-modern classroom computers, total non-modern lab computers, and
total non-modern computers.
The final step of verification was to compare the values for each of the new
variables with data collected from the 2006-07 Technology Resource Survey. The
method of gathering the data was designed differently for the 2006-07 survey than it was
for the 2005-06 survey. The revised 2005-06 06 survey placed the fields for the total
number of modern and of non-modern computers in two separate sections increasing the
potential for error in data entry. The new design would allow the users to view all of the
access to student computers in one location on the survey. In addition, there was a field
for the total number of computers for student use. This final step of the process helped to
ensure the accuracy of the data for the 2005-06 surveys.
Access to Computers
An essential condition for effective integration of technology in the curriculum is
students' access to computers. The first research question asked, Is there a significant
difference between students’ access to computers in high and low socioeconomic
schools? Two components to the question of student access were considered. The first
component of the access question explored the type of computers that students access in
high and low SES schools. A comparison was made between access to modern and non-
modern computers. The second component of the technology access question considered
the location of the computers available to high and low SES schools.
Data to answer this question were organized according to student access to
modern computers and non-modern computers in both classrooms and lab type settings.

70
Variables to examine classroom access included: student access to desktop computers,
laptop computers, mobile computer labs, and computers assigned to students. Variables
for lab type settings included: desktop and laptop computers in media centers, general
education labs, special education labs, and other student gathering places. The number of
computers used for vocational education was excluded from the data set of elementary
schools, as this type of program is not universally offered in all schools.
Total Modern and Non-Modern Computers
The first component of the access to technology question asked, Is there a
significant difference between total number (desktops and laptops) of modern and non-
modern computers? Variables used to examine modern computer access for students
included modern classroom computers and modern lab computers, which were then
combined for the variable total modern computers. The same procedure was done for
non-modern computers, in which the variables, non-modern classroom computers and
non-modern lab computers, were created and then combined to form the variable total
non-modern computers.
The descriptive statistics for total modern computers in high SES Schools (n=400)
resulted in a median of 121 (SD=105.91) and a mean of 145.12, with a range of three to
532 modern computers available at schools (See Table 5). There was a positive skewness
of 1.12 with a kurtosis of 0.74. The low SES Schools (n=396) resulted in a median of 114
(SD=90.16) and a mean of 114, as there was a range from zero to 448 for computers.
There was a positive skewness of 0.97 with a kurtosis of 0.41. An independent t-test
showed there was no significant difference (p=.005) with an extremely small effect size

71
(d=0.08) for the total number of modern computers at the schools. The results in the data
reveal there are extremes in the number of computers available at all schools. There was
variability in the number of modern computers in both the high and low SES schools, for
example one low SES school reported having zero modern computers.
Table 5.
Descriptive Statistics for Total Modern Computers by School SES
School SES N Min Max M Mdn SD Skewness Kurtosis
High SES 400 3 532 145.12 121 105.91 1.12 0.74
Low SES 396 0 448 136.82 114 90.16 0.97 0.41
*. p=.005. **d=0.08.
The total non-modern computers in high SES Schools (n=400) had a median of 93
(SD=84.56) and a mean of 102.32 compared to low SES Schools (n=396), in which the
median was 73.50 (SD=80.36) and a mean of 89.39 (see Table 6). The range of
computers in the high SES schools went from zero to 510 with a positive skewness of
1.02 and a kurtosis of 2.06. The range of computers in the low SES schools went from
zero to 527 with a positive skewness of 1.31 and a kurtosis of 2.63. In addition, there was
no significant difference (p=.188) for total non-modern computers (relative to SES level)
at p<.05 level with a small effect size (d=0.18). There continued to be variability in the
number of computers reported at the individual school level for both high and low SES
schools.

72
Table 6.
Descriptive Statistics for Total Non-Modern Computers by School SES
School SES N Min Max M Mdn SD Skewness Kurtosis
High SES 400 0 510 102.32 93.00 84.56 1.02 2.06
Low SES 396 0 527 89.39 73.50 80.36 1.31 2.63
* p=.188. **d=0.18.
A variable was created for total modern laptop computers by combining
classroom laptop computers, mobile lab laptops, and computers assigned to students. This
variable was limited to those schools that reported having modern laptops at high SES
schools. In high SES schools, there was a median of one (SD=76.28) with a mean of
39.96 (See Table 7). While in low SES schools, there was a median of zero (SD=47.05)
with a mean of 19.85. An independent-samples t-test analysis indicated significant
difference for total modern laptop computers (p=.000) in high and low SES schools. The
magnitude of the difference was medium (d=0.32). This descriptive data reveals there are
more modern laptop computers at high SES schools than at low SES schools.
Table 7.
Descriptive Statistics for Total Modern Laptop Computers by School SES
School SES N Min Max M Mdn SD Skewness Kurtosis
High SES 400 0 480 39.96 1 76.28 2.56 7.47
Low SES 396 0 348 19.85 0 47.05 3.49 14.41
*p=.000. **d=0.32.

73
Additional data were analyzed to examine the number of computers available in
classrooms and labs. A ratio was developed using total modern classroom computers
divided by the number instructional rooms. High SES schools had a median of 1.53
(SD=1.88), a mean of 2.04, and a range of zero to 9.93 computers per classroom (See
Table 8). Low SES schools had a median of 1.73 (SD=1.93), a mean of 2.16 and a range
of zero to 16.76 computers per classroom. An independent t-test found no significant
difference in the number of computers available in the classroom (p=.361) and no effect
size (d=0.00). Generally, there is a distribution of two modern computers available in the
classroom in both high and low SES classrooms.
Table 8.
Modern Computers per Classrooms by School SES
School SES N Min Max M Mdn SD Skewness Kurtosis
High SES 400 0 9.93 2.04 1.53 1.88 1.10 0.83
Low SES 396 0 16.76 2.16 1.73 1.93 1.85 8.11
*p=.361. **d=0.00.
The ratio for computers to labs was computed using the variable for total modern
lab computers divided by the total number of labs. High SES schools had a median of 31
(SD=24.21), while low SES schools had a median of 31.50 (SD=23.19) modern
computers per lab (See Table 9). An independent t-test found no significant difference in
the number of computers for modern computer labs (p=.153) and no effect size (d=0.00).
There was an equal distribution of modern computers in labs between high and low SES
schools.

74
Table 9.
Modern Computers per Labs by School SES
School SES N Min Max M Mdn SD Skewness Kurtosis
High SES 400 0 237 30.60 31.00 24.21 2.78 18.36
Low SES 396 0 157 33.18 31.50 23.19 1.14 2.97
*p=.153. **d=0.00.
Location of the Computers
The second component of the technology access question was, Is there a
significant difference between the locations of the computers for student use? To examine
student access to modern computers, the variables for student access to modern
classroom computers and lab computers were used. Variables representing modern
classroom computers access included: student access to desktop computers, laptop
computers, mobile computer labs, and computers assigned to students. Variables
representing modern lab type settings included: desktop and laptop computers in media
centers, general education labs, special education labs, and other student gathering places.
Data were analyzed to examine the ratio of students to total modern computers
and total non-modern computers in high and low SES schools. The variable of total
number of students was divided by the total modern computers. The median for students
to total modern computers in high SES schools was 7.40 (SD=35.68) with a mean of
16.35 (See Table 10). The ratio for students to modern computers ranged from 1 to 461,
with an extreme skewness of 7.36 and a kurtosis of 72.93. The median for students to
total modern computers in low SES schools was 5.37 (SD=56.75) with a mean of 12.71.

75
The ratio for students to modern computers extended from 1 to 1053, with a positive
skewness of 16.38, and a kurtosis of 294.83. An independent t-test showed there was no
significant difference (p=.285) for the ratio of students to modern computers between
high and low SES schools. The effect size for ratio of students to modern computers was
extremely small (d=0.07).
Table 10.
Student Access to Modern Computers
School SES N Min Max M Mdn SD Skewness Kurtosis
High SES 400 1.00 461 16.35 7.40 35.68 7.36 72.93
Low SES 396 1.00 1053 12.71 5.37 56.75 16.38 294.83
Note. Ratio of students to total modern computers. *p=.285. **d=0.07
The same method was employed for determining the ratio of students to total non-
modern computers in which the students were the numerator and the computers were the
denominator. Students' access to non-modern computers in high SES schools exhibited a
median of 7.34 (SD=91.29) and a mean of 22.41 (See Table 11). The range for students
to non-modern computers was large extending from 1.81 to 1172, with an extreme
skewness of 9.35 and a kurtosis of 98.45. The median for students' access to total non-
modern computers in low SES schools was 6.27 (SD=38.97) with a mean of 15.92. The
ratio of students to non-modern computers ranged from 1.42 to 566, with a positive
skewness of 9.65, and a kurtosis of 12.75. An independent t-test showed there was no
significant difference (p=.228) for the ratio of students to non-modern computers
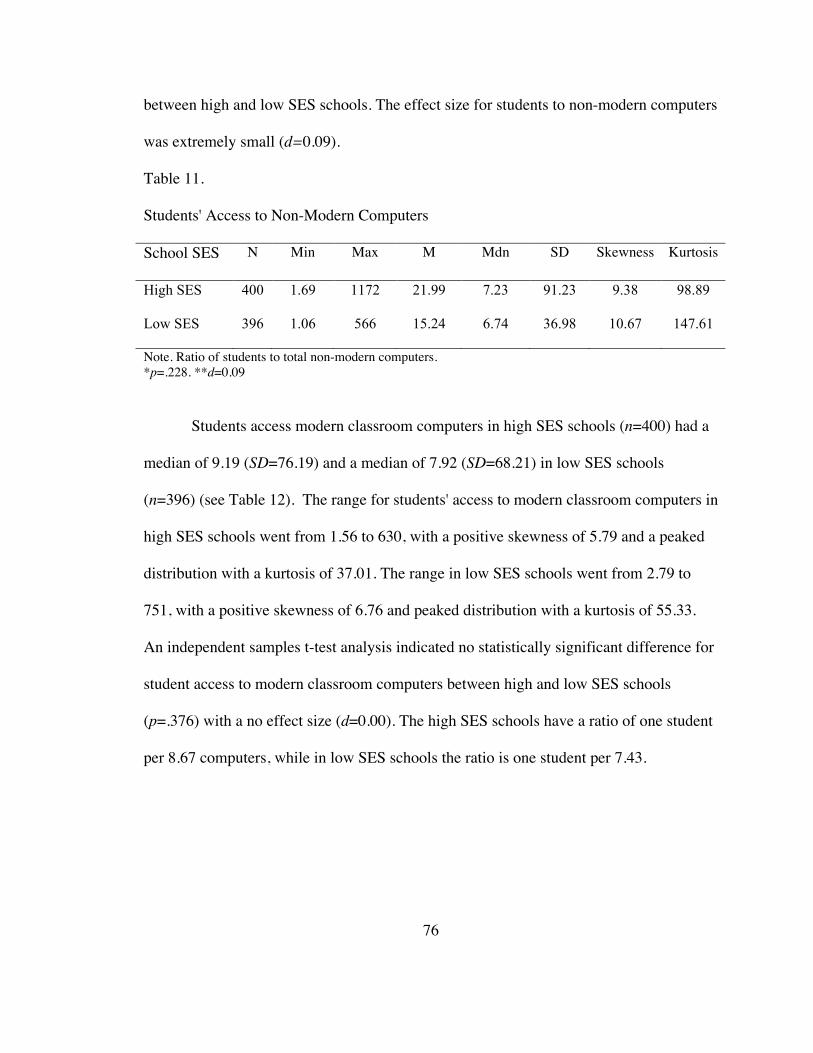
76
between high and low SES schools. The effect size for students to non-modern computers
was extremely small (d=0.09).
Table 11.
Students' Access to Non-Modern Computers
School SES N Min Max M Mdn SD Skewness Kurtosis
High SES 400 1.69 1172 21.99 7.23 91.23 9.38 98.89
Low SES 396 1.06 566 15.24 6.74 36.98 10.67 147.61
Note. Ratio of students to total non-modern computers. *p=.228. **d=0.09
Students access modern classroom computers in high SES schools (n=400) had a
median of 9.19 (SD=76.19) and a median of 7.92 (SD=68.21) in low SES schools
(n=396) (see Table 12). The range for students' access to modern classroom computers in
high SES schools went from 1.56 to 630, with a positive skewness of 5.79 and a peaked
distribution with a kurtosis of 37.01. The range in low SES schools went from 2.79 to
751, with a positive skewness of 6.76 and peaked distribution with a kurtosis of 55.33.
An independent samples t-test analysis indicated no statistically significant difference for
student access to modern classroom computers between high and low SES schools
(p=.376) with a no effect size (d=0.00). The high SES schools have a ratio of one student
per 8.67 computers, while in low SES schools the ratio is one student per 7.43.

77
Table 12.
Students' Access to Modern Classroom Computers
School SES N Min Max M Mdn SD Skewness Kurtosis
High SES 400 1.47 630.00 23.27 8.67 65.05 6.89 54.01
Low SES 396 1.37 751.00 22.97 7.43 66.66 7.05 59.57
Note. Ratio of students to modern computers in classroom settings. *p=.376. **d=0.00
The median for students' access to modern lab computers in high SES schools was
25 (SD=143.54) with a mean of 68.36 (See Table 10). The range for students to modern
computers went from 4.01 to 1112, with a positive skewness of 4.63 and a peaked
distribution with a kurtosis of 23.93. The median for students' access to modern lab
computers in low SES schools was 16.92 (SD=99.03) with a mean of 42.07. The range
for students to modern computers was large as it went from 2.79 to 1053, with a positive
skewness of 6.75, and peaked distribution with a kurtosis of 55.38. An independent t-test
showed there was a statistically significant difference in student access to modern lab
computers (p =.004). The effect size based on Cohen's d revealed the difference in the
means was small (d=0.21).
Table 13.
Students' Access to Modern Lab Computers
School SES N Min Max M Mdn SD Skewness Kurtosis
High SES 400 4.59 1112.00 58.95 24.43 125.64 5.47 34.93
Low SES 396 2.79 940 3.92 15.39 76.39 7.11 66.76
Note. Ratio of students to modern computers in lab settings.*p=.004. **d=0.21.

78
Summary Access to Computers
The first research question examined students’ access to technology by focusing
specifically on their access to computers in high and low SES schools. Data analysis
between high and low SES schools found no significant difference between total modern
computers, total non-modern computers modern classroom computers, and modern
computers labs. There was a higher distribution of modern laptop computers in high SES
schools than low SES schools. However, low SES schools have a significantly higher
ratio student to total modern computers, total non-modern computers, modern computers
in classroom settings, and modern computers in lab settings.
Software Types on Student Computers
Another essential condition for the integration of technology in the curriculum is
development of a student-centered learning environment. The second research question
was, Is there a significant difference between the types of software available on
computers between schools serving high and low SES schools? This question focused on
the availability of types of software (tool-based and curriculum-based) on student
computers. Tool-based software refers to application-based programs that provide
opportunity for teachers and students to perform a task. Curriculum-based software refers
to those programs that deliver content for student consumption.
Tool-Based Software on Student Computers
The data analyzed for this question came from items on the survey that required
the respondent to report the approximate percentage range of software types on each
given computer. The response scales used were: “0%”; “1-24%”; “25-49%”; “50-74%”;
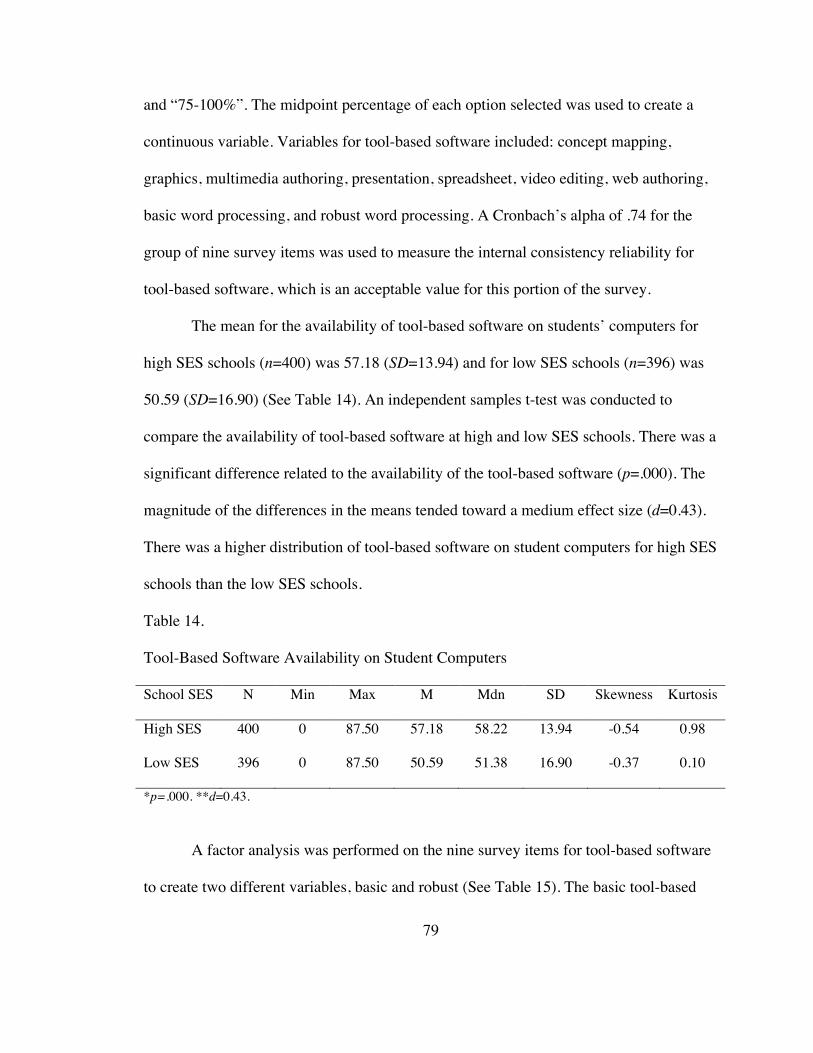
79
and “75-100%”. The midpoint percentage of each option selected was used to create a
continuous variable. Variables for tool-based software included: concept mapping,
graphics, multimedia authoring, presentation, spreadsheet, video editing, web authoring,
basic word processing, and robust word processing. A Cronbach’s alpha of .74 for the
group of nine survey items was used to measure the internal consistency reliability for
tool-based software, which is an acceptable value for this portion of the survey.
The mean for the availability of tool-based software on students’ computers for
high SES schools (n=400) was 57.18 (SD=13.94) and for low SES schools (n=396) was
50.59 (SD=16.90) (See Table 14). An independent samples t-test was conducted to
compare the availability of tool-based software at high and low SES schools. There was a
significant difference related to the availability of the tool-based software (p=.000). The
magnitude of the differences in the means tended toward a medium effect size (d=0.43).
There was a higher distribution of tool-based software on student computers for high SES
schools than the low SES schools.
Table 14.
Tool-Based Software Availability on Student Computers
School SES N Min Max M Mdn SD Skewness Kurtosis
High SES 400 0 87.50 57.18 58.22 13.94 -0.54 0.98
Low SES 396 0 87.50 50.59 51.38 16.90 -0.37 0.10
*p=.000. **d=0.43.
A factor analysis was performed on the nine survey items for tool-based software
to create two different variables, basic and robust (See Table 15). The basic tool-based
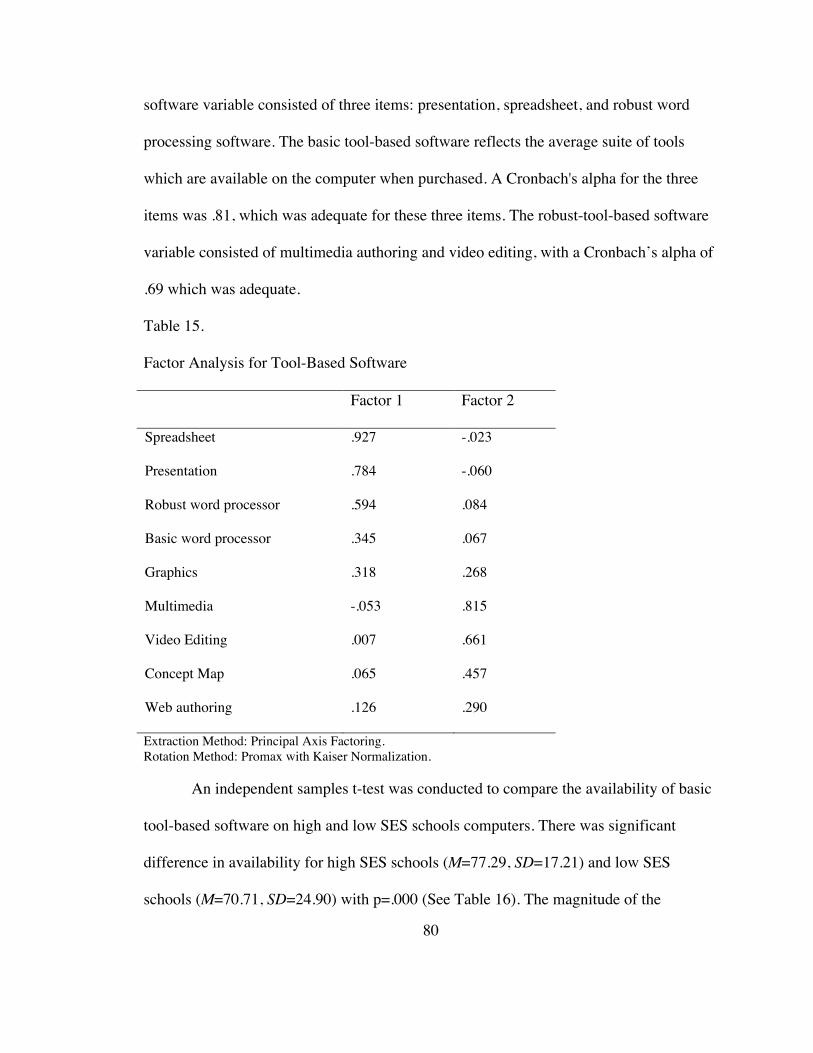
80
software variable consisted of three items: presentation, spreadsheet, and robust word
processing software. The basic tool-based software reflects the average suite of tools
which are available on the computer when purchased. A Cronbach's alpha for the three
items was .81, which was adequate for these three items. The robust-tool-based software
variable consisted of multimedia authoring and video editing, with a Cronbach’s alpha of
.69 which was adequate.
Table 15.
Factor Analysis for Tool-Based Software
Factor 1 Factor 2
Spreadsheet .927 -.023
Presentation .784 -.060
Robust word processor .594 .084
Basic word processor .345 .067
Graphics .318 .268
Multimedia -.053 .815
Video Editing .007 .661
Concept Map .065 .457
Web authoring .126 .290
Extraction Method: Principal Axis Factoring. Rotation Method: Promax with Kaiser Normalization. An independent samples t-test was conducted to compare the availability of basic
tool-based software on high and low SES schools computers. There was significant
difference in availability for high SES schools (M=77.29, SD=17.21) and low SES
schools (M=70.71, SD=24.90) with p=.000 (See Table 16). The magnitude of the
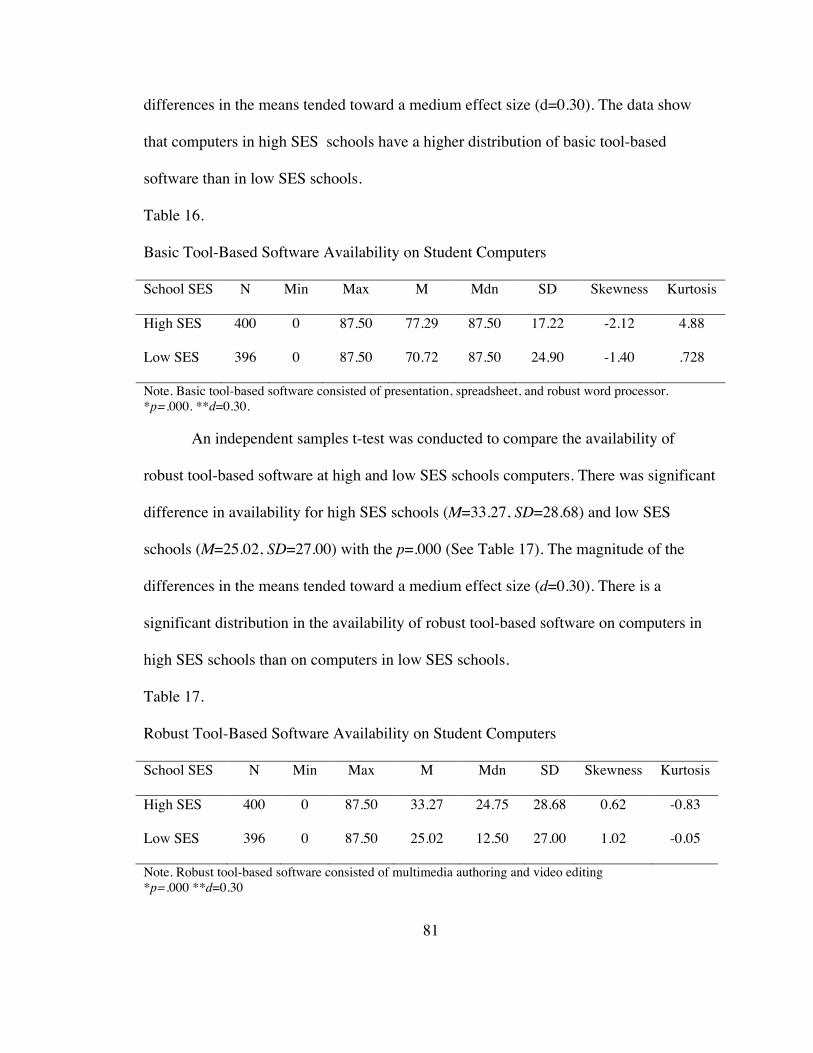
81
differences in the means tended toward a medium effect size (d=0.30). The data show
that computers in high SES schools have a higher distribution of basic tool-based
software than in low SES schools.
Table 16.
Basic Tool-Based Software Availability on Student Computers
School SES N Min Max M Mdn SD Skewness Kurtosis
High SES 400 0 87.50 77.29 87.50 17.22 -2.12 4.88
Low SES 396 0 87.50 70.72 87.50 24.90 -1.40 .728
Note. Basic tool-based software consisted of presentation, spreadsheet, and robust word processor. *p=.000. **d=0.30. An independent samples t-test was conducted to compare the availability of
robust tool-based software at high and low SES schools computers. There was significant
difference in availability for high SES schools (M=33.27, SD=28.68) and low SES
schools (M=25.02, SD=27.00) with the p=.000 (See Table 17). The magnitude of the
differences in the means tended toward a medium effect size (d=0.30). There is a
significant distribution in the availability of robust tool-based software on computers in
high SES schools than on computers in low SES schools.
Table 17.
Robust Tool-Based Software Availability on Student Computers
School SES N Min Max M Mdn SD Skewness Kurtosis
High SES 400 0 87.50 33.27 24.75 28.68 0.62 -0.83
Low SES 396 0 87.50 25.02 12.50 27.00 1.02 -0.05
Note. Robust tool-based software consisted of multimedia authoring and video editing *p=.000 **d=0.30

82
Curriculum-Based Software on Student Computers
Variables for curriculum-based software included: FCAT Explorer, other test prep
tools, Integrated Learning Systems, content-specific skills practice/tutorials, content-
specific simulation, other content-specific resources, and general reference tools. The
composite variable for each software type was created by finding the mean of all options
selected. Cronbach’s alpha for the seven survey items was used to measure the composite
variables for curriculum-based software was .68, which is acceptable for internal
consistency with the items.
An independent samples t-test was conducted to compare the availability of
curriculum-based software at high and low SES schools. There was no significant
difference in availability for high SES schools (M=55.36, SD=17.80) and low SES
schools (M=54.74, SD=18.45) with the p=.628 (See Table 18). The effect size was
extremely small (d=0.03). There tends to be an equal distribution of curriculum-based
software on computers in high and low SES schools.
Table 18.
Curriculum-Based Software Availability on Student Computers
School SES N Min Max M Mdn SD Skewness Kurtosis
High SES 400 00 87.50 55.36 55.35 17.80 -0.22 -0.33
Low SES 396 00 87.50 54.74 53.57 18.45 -0.12 -0.47
*p=.628. **d=0.03.

83
Summary of Software Types on Student Computers
The second research question focused on the availability of tool-based and
curriculum-based software on student computers. There was a statistically significant
difference in the basic tool-based software, with a mean of 77.29 for high SES schools
and 70.72 for low SES schools. In addition, there was a statistically significant difference
with the robust tool-based software, with a mean of 33.27 in high SES schools and 25.02
in low SES schools. A single variable was created for curriculum-based software
available on students’ computers. There was no statistically significant difference in the
curriculum software, with the mean of 55.36 in high SES schools and 53.57 in low SES
schools.
Student Use of Software Types
The third research question was, Is there a relationship between the
socioeconomic status of an elementary school and the frequency of student use by
software type? This question expanded on the availability of the software types on the
computers, to examine the frequency of use by the student. The data analyzed for this
question came from the item on the survey that required the respondent to report the
frequency of student use of software types. A composite score was developed for each of
the variables by adding the categories for frequency of student use.
Limited and Regular Use of Software Types
Two categories "limited" and "regular" were used to examine the frequency of
student use of software. The limited category included the total frequencies for “not at
84
all”, “once a month”, and “once a week” while the regular category included the total
frequencies for “several times a week” and “everyday”. A frequency table was developed
to examine these two categories for each of the variables for student use of software types
(See Table 19). The frequency table reveals that students in low SES schools use
Integrated Learning Systems and drill software on a regular basis with limited use of
other software types. The high SES schools had regular use of drill and research based
software with limited use of the other software types.

85
Table 19.
Student Limited and Regular Use of Software
High SES Low SES
Multimedia Limited 76% 85%
Regular 24% 15%
Presentation Limited 79% 90%
Regular 21% 10%
Tool-based Limited 50% 64%
Regular 50% 36%
Research Limited 41% 46%
Regular 59% 54%
Simulation Limited 87% 97%
Regular 13% 03%
Integrated Learning System Limited 42% 24%
Regular 58% 76%
Drill Limited 36% 25%
Regular 64% 75%
Note. Limited category consisted of the total frequencies for “not at all”, “once a month”, and “once a week”. The Regular category consisted of the total frequencies for “several times a week” and “everyday.”
The data in each of the software types exhibits there is extreme use of software
types within high and low SES schools. The use of simulation type software in high SES

86
schools was limited to 87% with only 13% regular use. While presentation types of
software in low SES schools was limited to 90% with regular use of 10%. The tool based
and research types of software showed an even distribution of student use within the high
and low SES schools.
Frequency of Student Use of Software
The indicators, “not at all”, “once a month”, “once a week”, “several times a
week”, and “everyday” were assigned a corresponding value of 0, 25, 50, 75, and 100. A
variable was created for frequency of student software that included: tool-based,
presentation, multimedia, research, simulation, drill and skill, and Integrated Learning
System. An independent samples t-test was conducted to compare the frequency of
student software use between high and low SES schools. There was a significant
difference in frequency of student use for high SES schools (M=51.01, SD=17.50) and
low SES schools (M=47.42, SD=16.07) with the p=.003 (See Table 22). The magnitude
of the differences in the means was small (d=0.24).
Table 20.
Frequency of Student Software Use
School SES N Min Max M Mdn SD Skewness Kurtosis
High SES 400 0 100 51.01 50.00 17.50 0.18 -0.10
Low SES 396 0 100 47.42 46.42 16.07 0.32 -0.09
*p=.003. **d=0.24.
Factor analysis was performed on the frequency of use for software types to
create a variable for frequency of student tool-based software use (See Table 21).

87
Variables for frequency of student tool-based software included: tool-based, presentation,
multimedia, and research with a Cronbach’s alpha of .78.
Table 21.
Factor Analysis for Frequency of Student Use
Factor 1 Factor 2
Tool-based .765 .023
Presentation .712 -.101
Multimedia .638 .027
Research .620 .132
Simulation .398 .033
Drill and skill -.027 .720
Integrated Learning System .022 .497
Extraction Method: Principal Axis Factoring. Rotation Method: Promax with Kaiser Normalization. An independent samples t-test was conducted to compare the frequency of student
tool-based software use between high and low SES schools. There was a significant
difference in frequency of student use for high SES schools (M=50.18, SD=20.55) and
low SES schools (M=41.84, SD=20.30) with p=.000 (See Table 22). The magnitude of
the differences in the means was medium (d=0.40).
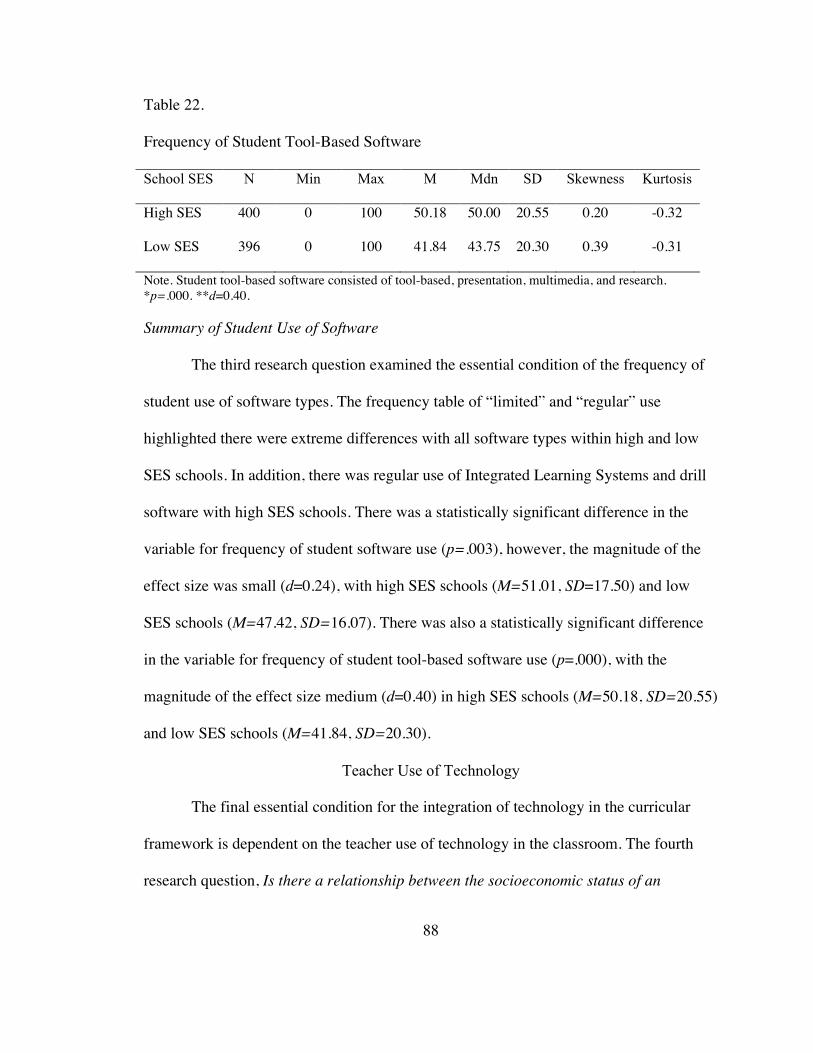
88
Table 22.
Frequency of Student Tool-Based Software
School SES N Min Max M Mdn SD Skewness Kurtosis
High SES 400 0 100 50.18 50.00 20.55 0.20 -0.32
Low SES 396 0 100 41.84 43.75 20.30 0.39 -0.31
Note. Student tool-based software consisted of tool-based, presentation, multimedia, and research. *p=.000. **d=0.40. Summary of Student Use of Software
The third research question examined the essential condition of the frequency of
student use of software types. The frequency table of “limited” and “regular” use
highlighted there were extreme differences with all software types within high and low
SES schools. In addition, there was regular use of Integrated Learning Systems and drill
software with high SES schools. There was a statistically significant difference in the
variable for frequency of student software use (p=.003), however, the magnitude of the
effect size was small (d=0.24), with high SES schools (M=51.01, SD=17.50) and low
SES schools (M=47.42, SD=16.07). There was also a statistically significant difference
in the variable for frequency of student tool-based software use (p=.000), with the
magnitude of the effect size medium (d=0.40) in high SES schools (M=50.18, SD=20.55)
and low SES schools (M=41.84, SD=20.30).
Teacher Use of Technology
The final essential condition for the integration of technology in the curricular
framework is dependent on the teacher use of technology in the classroom. The fourth
research question, Is there a relationship between the socioeconomic status of an

89
elementary school and the teacher use of technology in the classroom? examined the
teachers’ level of use of technology in the classroom with students.
Basic Teacher Use of Technology
The data analyzed for this question came from the item on the survey that
required the respondent to report the percentage of teachers' use of technology in the
classroom. A midpoint score was given for each of the responses, “0%”, “1-24%”, “25-
49%”, “50-74%”, and “75-100%”, for percentage of time in which the teacher uses
technology in the classroom. A basic teacher use of technology variable was developed
that encompassed the sum of the means for the variables that included: delivery method,
supplement to instruction, instructional tool, core curriculum, and daily curriculum tool.
The basic teacher use of technology variable represents the teacher's overall method for
the use of technology in the classroom with students.
An independent samples t-test was conducted to compare basic teacher use of
technology between high and low SES schools. There was a significant difference in the
combined teacher use for high SES schools (M=51.56, SD=19.96) and low SES schools
(M=48.55, SD=20.51) with p =.036 (See Table 23). The magnitude of the differences in
the means was extremely small (d=0.14). The mean for high SES schools was 51% of the
time, while in low SES schools it was 48% of the time.

90
Table 23.
Frequency of Basic Teacher Use of Technology
School SES N Min Max M Mdn SD Skewness Kurtosis
High SES 400 0 87.50 51.56 52.10 19.96 -0.05 -0.72
Low SES 396 0 87.50 48.55 47.20 20.50 0.05 -0.90
*p=.036 **d=0.14
Curriculum-Focused Use of Technology
A factor analysis on the teacher use of technology examined those variables with
similar characteristics (see Table 24). The “daily instructional tool” variable and “core
curriculum tool” variable were closely aligned to form a new variable curriculum-focused
use of technology as a tool with Cronbach's alpha of .86.
Table 24.
Factor Analysis for Teacher Use of Technology
Factor 1 Factor 2
Daily instructional tool .981 -.085
Core curriculum tool .759 .099
Delivery of instruction .387 .229
Instructional tool .027 .728
Supplement to instruction .025 .528
Extraction Method: Principal Axis Factoring. Rotation Method Promax with Kaiser Normalization.
An independent samples t-test was conducted to compare curriculum-focused use
of technology as tool between high and low SES schools. There was a significant

91
difference in frequency of student use for high SES schools (M=47.46, SD=26.29) and
low SES schools (M=43.06, SD=27.31) with p=.021 (See Table 25). The magnitude of
the differences in the means was small (d=0.16).
Table 25.
Frequency of Teacher Curriculum-Focused Use of Technology as a Tool
School SES N Min Max M Mdn SD Skewness Kurtosis
High SES 400 0 87.50 47.46 46.62 26.29 0.12 -0.72
Low SES 396 0 87.50 43.06 37.00 27.31 0.31 -1.20
Note. The curriculum-focused use of technology as tool consisted of "daily instructional tool" and "core curriculum tool. *p=.021 **d=0.16
Summary of Teacher Use of Technology
Data for this question came from an item that examined the percentage of
teachers' use of technology in the classroom. Two variables were developed from the
items: the basic teacher use of technology in the classroom and the curriculum-focused
use of technology as a tool. There was a statistically significant difference with the basic
teacher use of technology in the classroom variable (p=.036), however, the magnitude of
the difference was extremely small (d=0.14). There was also a significant difference in
the curriculum focused use of technology as a tool (p=.021), however, the magnitude of
the difference was small (d=0.16), with high SES schools (M=47.46, SD=26.29) and low
SES schools (M=43.06, SD=27.31).
92
CHAPTER FIVE
DISCUSSION AND RECOMMENDATIONS
In response to the NCLB legislation, the Florida Department of Education
(FLDOE) defined technology integration in the classroom as the students’ seamless use
of technology as a productivity tool to accomplish a given task in a disciplined study that
promotes higher-order thinking skills. The FLDOE put into practice an annual
technology resource survey to provide more meaningful information about technology
integration in Florida’s schools. The purpose of this study was to examine the use of
technology with low and high socioeconomic students in the state of Florida.
Findings from this study expand our knowledge about the use of technology in
high and low SES schools. Data from this study informs policy makers and state/district
level administrators on how to plan for the high level integration of technology in all
public schools. In addition, the data provide guidance on professional development for
teachers on the use of technology with low SES students.
Summary of Questions and Results
Data for this study were from the 2005-06 Technology Resource survey with
elementary schools (N=1591) that responded in the fall of 2005. The schools were then
ranked by the percentage of students who received free and reduced lunch and divided
into four quartiles. High SES schools (n=400) had a range students who qualified for the
free and reduced lunch program with an average of 810 students per school. The low SES

93
schools (n=396) had a range of students who qualified for free and reduced lunch, with an
average of 636 students per school.
The first research question was divided into two separate components for
examining students’ access to computers in high and low SES elementary schools. The
first component was: Is there a significant difference between the total number of modern
and non-modern computers? The results showed there was no significant difference
found between total modern computers, total non-modern computers, and modern
computer labs. There was a significant difference for total modern laptop computers
(p=.000), however, the magnitude of the difference was medium (d=0.32). The
descriptive data made known there are more modern laptop computers in high SES
schools than at low SES schools.
The second component of the question was: Is there a significant difference
between the locations of the computers for student use? Items from the survey were
categorized into two groups of classroom versus non-classroom or labs. The classroom
variable was the total number of modern computers, including desktop and laptop
computers, in the classrooms, mobile labs, and computers assigned to students. The non-
classroom variable was a combination of modern computers in the media center, general
education labs, special education labs, and other student gathering places. Data analyzed
for this question found no significant difference in students’ access to modern computers
in the classroom with the p =.376. The ratio for students to modern classroom computers
in high SES schools was 8.67 to 1, and it was 7.43 to 1 in low SES schools.

94
A statistically significant difference was found in students’ access to modern labs
(p=. 004), however, the effect size was small (d=0.21), which meant the difference was
trivial. The ratio of students to computers in modern labs for high SES schools using the
median was 25.00 to 1, and it was 16.92 to 1 in low SES schools. There was a statistically
significant difference for access to the modern laptop computers (p=.000, d=0.35)
between high and low SES schools.
The second research question stated: Is there a significant difference between the
types of software available on the computers? The two items examined for this question
had the respondents provide the percentage of tool-based software and curriculum-based
software on student computers. The tool-based software variable included: concept
mapping, graphics, multimedia authoring, presentation, spreadsheet, video editing, web
authoring, basic word processing, and robust word processing. There was a significant
difference (p=.000) with a medium effect size (d=0.43). The curriculum-based software
variable included: FCAT Explorer, other test prep tools, Integrated Learning Systems,
content-specific skills practice/tutorials, content specific simulation, other content-
specific resources, and general reference tools. There was no significant difference
(p=.628) in the availability of curriculum-based software on student computers in high
and low SES schools.
The third research question stated: Is there a relationship between the
socioeconomic status of an elementary school and the frequency of student use by
software type? Data for this question came from an item that examines the frequency of
student use of computer software programs. The variable for frequency of student

95
software use included: tool-based, presentation, multimedia, research, simulation, drill
and skill, and Integrated Learning System. There was a significant difference in the
variable for frequency of student software use (p=.003), however, the magnitude of the
effect size was small (d=0.24). A factor analysis developed a second variable for student
tool-based software that included: tool-based, presentation, multimedia, and research.
There was also a statistically significant difference in the variable for frequency of
student tool-based software use (p=.000), with the magnitude of the effect size medium
(d=0.40) in high and low SES schools.
The final question stated: Is there a relationship between the socioeconomic
status of an elementary school and the teacher use technology in the classroom? Data for
this question came from an item that examined the percentage of teachers' use of
technology in the classroom. The basic teacher use of technology in the classroom
variable included: delivery method, supplement to instruction, instructional tool, core
curriculum, and daily curriculum tool. There was a statistically significant difference with
the basic teacher use of technology in the classroom variable (p=.036), however, the
magnitude of the difference was extremely small (d=0.14). A factor analysis developed a
the curriculum-focused use of technology as a tool variable that included daily
instructional tool and core curriculum tool. There was also a significant difference in the
curriculum focused use of technology as a tool (p=.021), however, the magnitude of the
difference was small (d=0.16).

96
Discussion
The following discussion addresses the results with regard to the essential
conditions for technology integration in the classroom in Florida’s elementary schools.
Researchers have identified the conditions to be: (a) students' access to technology, (b)
the development of a student-centered learning environment, and (c) integration of
technology in the curricular framework (Glennan & Melmed, 1996: Kelley & Ringstaff,
2002; Sandholtz, Ringstaff, & Dwyer, 1997). All three conditions are crucial aspects to
the effective integration of technology in the classroom. The final section will address the
essential condition’s impact in the low SES schools.
Student Access to Technology
The process for the collection and analysis of the data for this study was much
more rigorous than current national studies on student access to computers. For example,
in the Technology Counts 2007 report, the process for gathering data was to interview
selected 4th and 8th math teachers across the state of Florida on their access to computers
(Bausel and Klemick, 2007). In contrast, the data from Florida’s Technology Resource
Survey involves a coordinated effort between the survey programmer, the state
technology director, district personnel, and the school technology specialists to ensure the
accuracy of the data. The data from the Technology Counts 2007 stated that Florida had
3.2:1 ratio of students to computers in the classroom (Bausel and Klemick, 2007). This
study showed that median access for computers in the classroom for high SES schools
was 8.67:1 and in low SES schools was 7.43:1. Although this difference was not

97
statistically significant (relative to SES level), it does illustrate a higher ratio than is being
reported nationally.
In reports on effective integration of technology in the classroom, teachers have
stated one of the main barriers for the integration of technology in the classroom is the
access to computers (Ringstaff & Kelley, 2002). Data were analyzed in this study to
determine the average number of computers per classroom. The average number of
computers per classroom in sample in Florida was less than two. This limited access to
computers in the classroom affirms teachers' concerns that access is only one barrier to
effective integration of technology in the classroom.
Nearly a decade ago, education reformers began implementing laptop computer
programs across the nation as a method for increasing access to computers in the
classroom (Rockman et al, 1998). Strategies for providing access to laptop computers
have ranged from providing one computer for every child to providing a set of mobile
carts that can travel from room to room. When teachers have access to laptop computers
in the classroom, they can be utilized as an educational tool for the movement toward
constructivist ideals and pedagogy that engages students in the learning process (Fouts,
2000; Lowther, Ross, & Morrision, 2001; and Rockman, 2000). Results from this study
revealed there was a statistically significant difference for the availability of laptop
computers with low SES schools (p=.000, d=0.35). Data from this study shows that low
SES have limited opportunities to use technology as a tool for constructing knowledge in
the classroom, particularly when considering laptop computers.

98
Student-Centered Learning Environment
The second condition for effective technology integration is the development of a
student-centered learning environment in which technology is used as a cognitive tool for
learning (Culp, Hawkins, & Honey, 1999; Means, 1994; and Reeves, 1998). The
computer as a tool allows teachers and students the opportunity to construct knowledge
that enhances curriculum and instruction (Ringstaff & Kelley, 2002). In order to facilitate
this type of environment, adequate software needs to be available on the computer that
enables the use of the computer as a tool. This type of software includes tool-based
software, such as word processing, spreadsheet, presentation, concept mapping, and
video editing programs.
Studies have shown that technology will have the greatest impact in the classroom
if it is used for higher order learning activities with students. However, when technology
is used for drill and practice, there tends to be a negative impact on student achievement
(Wenglinsky, 1998). Students of low SES schools need to develop cognitive skills and
independent thinking, which are often lacking due to their social situation (Renchler,
2000). Frequently, the students live in environments over which they have little control
and lack the vision for their future (Brophy, 1998; Bandura, 2001).
The results from this study affirmed there is a statistically significant difference in
the availability of software types on the computers between high and low SES schools.
The high SES schools had an average of basic tool based software on 77% of the
computers, while the low SES schools had a frequency of 71% (See Table 16). These
data do not support the 1998 Teaching, Learning, and Computing (TLC) national survey,

99
that found no significant difference in the availability of skill/game software between
high and low SES schools (Becker, Ravitz, & Wong, 1999).
However, the largest practical difference was in the availability of additionally
purchased software, such as robust tool-based software. This type of software requires the
school to make a conscious effort to purchase specific programs that are not built into the
computer or part of a basic software package. The robust tool-based software was on
approximately 33% of the computers in high SES schools and 25% of low SES schools
(See Table 17). When computers are equipped with robust tool-based software, such as
those in the Multimedia Project Classrooms, a student-centered learning environment can
be created (Penuel & Means, 1999). In this type of learning environment, there can be an
increase in the frequency of student use for robust tool-based software, such as concept
mapping, video editing, and multimedia authoring.
Technology in the Curricular Framework
The frequency for the utilization of tool-based software programs confirmed there
was limited use, between none to once a week, with low SES schools (See Table 19). For
example, in high SES schools the frequency of use for tool-based software was 50%
limited and 50% regular, while in low SES schools it was 64% limited and 36 % regular.
However, the frequency for drill and practice software in high SES schools was 36%
limited and 64% regular and in low SES schools 25% limited and 75% regular. The
discrepancy with the frequency of student tool-based software user reveals that students
in low SES schools may not be provided the same opportunity to develop higher order
thinking skills (Knapp & Shields, 1990; Waxman, Padron, &Knight, 1991). The students

100
are learning “from” the software programs rather than “with” the software programs,
hence the computers are being used as tutor rather than a cognitive tool for learning.
The results obtained from this study support the need for professional
development on the integration of technology in the curricular framework. A significant
difference was found with basic teacher use of technology in the classroom (p =.036,
d=0.14) for high SES schools (M=51.56, SD=19.96) and low SES schools (M=48.55,
SD=20.51). The data mirrors the information that has been stated by researchers when
there is limited access to the technology, the teachers will not be able to make the shift
toward the use of technology as a tool for instruction (Sandholtz, Ringstaff, & Dwyer,
1997). In order for change to occur, teachers need to learn how to take advantage of
integrating technology in the classroom, hence there needs to be an increase in
professional development on the use of technology in the classroom.
The role of technology must move beyond the teacher’s use of technology to
improve students’ basic skills. Teachers’ beliefs about the use of technology need to
transform learning “from” technology to learning “with” technology (Ringstaff & Kelley,
2002). The essential condition of technology in the curricular framework depends on
teachers’ understanding and development of tasks that engage students in the learning
process (Baker, Herman, & Gerhart, 1996). Data from this study reveals that just having
computers in the schools does not ensure effective use of the technology. There needs to
be a sustained professional development effort for teachers in high and low SES schools
on the use of technology as a tool for learning in curriculum.

101
Recommendations
Based on the results of this research and literature review, this section offers
recommendations for policy makers, modifications to the survey and future research.
Recommendations to Policymakers
Policymakers at both the federal and state level need to develop a common
definition for technology integration in the curriculum that can be disseminated to all
stakeholders. A common definition for technology integration will address three main
issues of student access to technology in the classroom, integration of technology a tool
for learning, and professional development of educators. Policy needs to be established
that ensures all students have access to technology in the classroom. There needs to a set
of target dates for a student to computer ratio in classrooms at every grade level. In
addition, policymakers need to identify innovative methods of students to bring existing
computers to the classroom.
A second recommendation for policy is to develop common goals for the use of
technology as a tool for learning in the classroom. Data from this study show there is still
a gap in student access to computers, however there is a larger gap in the frequency of
software types on the computer. There have been tremendous strides in providing
students access to curriculum-based software, however, there is amble room for growth in
the area of tool-based software. Students need to have access to those software tools,
such as multimedia, web-based, presentation, and video editing, that will allow them to
be productive citizens in the 21st century.
102
A third recommendation for policy is the development of a sustainable
professional development plan for educators on the use of technology in the classroom.
As the data reveals, while there is access to computers at the school it does necessarily
ensure the computers are being used in the classroom for core curriculum instruction.
Further analysis of the data could show the current methods of professional development
being done with those schools that high level of teacher technology use as a tool.
A final recommendation for policymakers is a common method for reporting the
use of funds needs to be developed at the state and federal level. It is imperative that data
gathered on this issue be as accurate as possible to ensure accountability for the
expending of federal dollars for technology. The data elements need to reflect the use of
technology in the classroom that promote higher order thinking skills. The data used from
the Technology Resource Survey provide a framework for the elements that could be
used at a federal level.
Recommendations for Modifications to the Survey
After using data from the Technology Resource Survey, it became apparent there
are gaps in the survey. A key limitation in the survey was the lack of a mechanism in the
access to technology portion that ensured the accuracy of the data being collected. A
mechanism needs to be developed within the user input that ensures that the reporting of
computers in each area is accurate. Verification for each field in the location of modern
and non-modern computers needs to be added to the survey.
Further analysis needs to be done on the items in the survey to ensure the data
being provided represent the actual use of technology in the classroom. This could be
103
done by rewording the items to be consistent and specific through a common terms
glossary. For example, the item that examines the types of software on the computers
needs to be clearly defined so that there is no repetition among items, such as the
delineation between "Integrated Learning System" and "Drill and Practice" software. A
common set of terms needs to be clearly defined for the survey.
Recommendations for Future Research
Data from this research revealed there is still a lack of information on the actual
use of technology in the classroom with low SES students. Further research needs to be
done on the actual work being done by students with technology. Is a learning
environment being created with high expectations for all students in the use of
technology? Researchers need to be in the actual classroom to understand all the aspects
of the classroom and the method in which technology is being integrated into the
curriculum with the low SES students.
Additional research needs to be done on those schools that are integrating
technology in the curriculum as a tool with high and low SES students. It is important to
understand all of the aspects of the school that has created a learning environment for
technology to be integrated as tool in the curriculum. For example, the method in which
technology is integrated into the school's improvement plan and the philosophical beliefs
of the principal and teachers about the use of technology with low SES students. An
observation tool which examines the levels of technology integration in the classroom.
Further research also needs to be conducted on the teachers in high and low SES
schools. This can be done by examining teaching experience, philosophy on classroom
104
instruction and level of degree. In addition, examining the actual professional
development the teacher has received on the use of technology in the classroom would be
beneficial. For example, was the focus of the training an actual software program or the
creation of a student product, such as a digital book? In addition, there should be
interviews with educator on how the use of technology, concerns for high-stakes testing,
and curriculum goals for technoloby.
Summary
This purpose of this study was to examine the use of technology in low and high
SES elementary schools in Florida. Through an iterative process with districts and
schools, the Florida Department of Education conducts an annual survey in which they
gather data on the capacity of technology in the schools. Data from the 2005-06
Technology Resource Survey were used to examine the essential conditions for
technology integration: access to technology, student-centered learning environment, and
technology in the curricular framework. The variables examined in this study were
students' access to computers, the types of software available on the computer, the
frequency of student use of software programs, and the teacher use of technology.
Findings from this study expand our knowledge about the essential conditions for
the integration of technology in high and low SES schools. The Technology Resource
Survey data provided information on access to technology, student-centered learning
environment, and the use of technology in the curricular framework. However, additional
research must be done on the actual use of technology in the classroom with high and low
SES students. As education continue to have increased high stakes testing, we need to

105
ensure that technology is being used as a tool to develop high order thinking skills for
students. This study should serve as the launching point for an in-depth examination of
the use of technology in low SES classrooms.

106
REFERENCES
Alaimo, K., Olson, C. M., & Frongillo, E. A., Jr., (2001). Food insufficiency, family
income, and health in US preschool and school-aged children, American Journal
of Public Health, 91(5), 781-786.
Ausubel, D. (1963). The psychology of meaningful verbal learning. New York : Grune &
Stratton.
Avery, P. G. (1999). Authentic instruction and assessment. Social Education, 65(6), 368-
373.
Baker, E. L., M. Gerhart & J. L. Herman. (1994). Evaluating the Apple classrooms of
tomorrow. In Technology Assessment in Education and Training, edited by E .L.
Baker, and H .F. O’Neil, Jr. Hillsdale: Lawrence Erlbaum.
Bandura, A. (2001). Social cognitive theory: An agentive perspective. Annual Review of
Psychology, 54 (1), 1-26.
Bausel, C. V., & Klemick, E. (May 2007). Tracking U.S. trends, Technology counts
2007: A digital decade. [Online] Available at:
http://www.edweek.org/ew/toc/2007/03/29/index.html
Becker, H., & Ravitz, J. (1998). The equity threat of promising innovations: Pioneering
internet-connected schools. Journal of Educational Computing Research, 18(4).
Berkowitz, B., & Serim, F. (May / June 2002), Moving every child ahead: The Big6
success strategy, MultiMedia Schools. [Online] Available:
http://www.infotoday.com/MMSchools/may02/berkowitz.htm
107
Becker, H. J., Ravitz, J. L., & Wong, Y. T. (1999, November). Teacher and teacher
directed student use of computers and software. Teaching, Learning, and
Computing: 1998 National Survey Report #3.
Benson, A. (1995). Review and analysis of Vygotsky’s Thought and language. Article
from website for UHCL. http://129.7.160.115/inst5931/Vygotsky.html
Biddle, B. J., & Berliner, D. C. (2002). Unequal school funding in the United States.
Educational Leadership, 59(8), 48.
Borman, G.D. (2003). How can Title I improve achievement? Educational
Leadership,60, 4, 49-53.
Bowman, B. (1994). The challenge of diversity. Phi Delta Kappan, 76 , 234-38.
Bozeman W. C., & Baumbach, D. J. (1995). Educational technology: Best practices from
America's schools. New York: Eye on Education, Inc. pp.174-176.
Brophy, J. (1998). Motivating students to learn. New York: McGraw-Hill
Brookhart, S., & Rusnak, T. (1993). A pedagogy of enrichment, not poverty: Successful
lessons of exemplary urban teachers. Journal of Teacher Education, 44(1), 17-26.
Brown, J. S., Collins, A., & Duguid, P. (1989). Situated cognition and the culture of
learning. Educational Research, 18(1), 32-42.
Chang, H., Henriquez, A., Honey, M., Light, D., Moeller, B., & Ross, N. (1998). The
Union City story: Education reform and technology – Students’ performance on
standardized tests. Technical report. EDC/Center for Children and Technology.
108
Citizens' Commission on Civil Rights. (1998). Title I at midstream: The fight to improve
schools for poor kids. Corrine M. Yu and William L. Taylor, eds. Washington,
DC: Citizens' Commission on Civil Rights.
Clements, D. H. (2002). Computers in early childhood mathematics. Contemporary
Issues in Early Childhood, Volume 3, Number 2, 2002, pg. 160 - 181
Coley, R., Crandler, J., & Engel, P. (1997). Computers and classrooms: The status of
technology in U.S. schools. Educational Technology Testing Service. Retrieved
from ftp://ftp.ets. Org/pub/res/compclss.pdf
Culp, K., Hawkins, J., & Honey, M. (1999). Review paper on educational technology
research and development. New York: Education Development Center, Center for
Children and Technology.
Dalton, D. W., & Goodrum, D. A. (1991). The effects of computer programming on
problem-solving skills and attitudes. Journal of Educational Computing Research,
7(4), 483-506.
Darling-Hammond, L. (1997) The right to learn: A blueprint for creating schools that
work. Jossey-Bass: San Francisco.
Dickard, N. (2003) The sustainability challenge: taking ed tech to the next level. Benton
Foundation. Retrieved from:
http://www.benton.org/publibrary/sustainability/sus_challenge.html
Dooley, K. E. (1999) Towards a holistic model for the diffusion of educational
technologies: An integrative review of educational innovative studies.
Educational Technology & Society, 1999; 2(4):1236 4522.

109
Dixon-Krauss, L. (1996). Vygotsky in the classroom: Mediated literacy instruction and
assessment. New York: Longman Publishers.
Ferguson, R. (1998). Can schools narrow the black-white test score gap? In C. Jencks and
M. Phillips (Eds.). The black-white test score gap. Washington, DC: Brookings
Institution Press.
Fisher, C., Dwyer, D, & Yocam, K. (1996). Education & technology: Reflections on
computing in classrooms. San Francisco: Josey-Bass Publishers.
Fosnot, C. T. (1996). Constructivism: A psychological theory of learning. In C. T. Fosnot
(Ed.) Constructivism: theory, perspectives, and practice (pp. 8-33). New York:
Teachers College Press.
Fouts, J. (2000). Research on computers and education: Past, present, and future. Seattle,
WA: Bill & Melinda Gates Foundation.
Fouts, J. T. & Stuen, C. (1997). Copernicus Project: Learning with laptops: Year 1
evaluation report. ERIC Document ED 416947.
Gagne, R.M. (1985). The conditions of learning and theory of instruction. Fort Worth,
TX: Holt, Rinehart, and Winston, Inc.
Glennan, T. K., & Melmed, A. (1996 ). Fostering the use of educational technology:
Elements of a national strategy (MR-682-OSTP/ED). Santa Monica, CA: RAND.
Retrieved from http://www.rand.org/publications/MR/MR682/.
Good, T.L., & Brophy, J.E. (1996). Looking in classrooms. (7th ed.) New York:
Longman.
Haberman, M. (1991). Pedagogy of poverty versus good teaching. Phi Delta Kappan, 73,
290-294.

110
Hall, G. E., & Hord, S. M. (2001). Implementing change: Patterns, principles, and
potholes. Boston: Ally & Bacon.
Haycock, K. (2001). Closing the achievement gap. Educational Leadership (March), 6-
11.
Hoover, H. D., Hieronymus, A. N., Frisbie, D. A., & Dunbar, S. B. (1996). Iowa tests of
basic skills, Form M. Itasca, IL: Riverside Publishing.
Hopson, M. H., Simms, R. L., & Knezek, G. A. (2002, Winter). Using a technologically
enriched environment to improve higher-order thinking skills. Journal of
Research on Technology in education, 34(2), 109-119.
Huang, S. Y. L., & Waxman, H. C. (1996). Classroom observations of middle school
students’ technology use in mathematics. School Science and Mathematics, 96
(10),28-34.
International Society for Education. (2000). National Educational Technology Standards
for students: Connecting curriculum and technology. Oregon: ISTE.
International Society for Education. (2004). National Educational Technology Standards
for students: Connecting curriculum and technology. Oregon: ISTE.
Jonassen, D. H., Wilson, B. G., Wang, S., & Grabinger, R. S. (1993). Constructivist uses
of expert systems to support learning. Journal of Computer-Based Instruction ,20
(3), 86-94.
Jonassen, D. H., & Reeves, T. C. (1996). Learning with technology: Using computers as
cognitive tools. In D. H. Jonassen, (Ed.), Handbook of research on educational
communications and technology (pp. 693-719). New York: Macmillan.

111
Kelley, L., & Ringstaff, C. (2002). The learning return on our educational technology
investment: A review of findings from research. San Francisco: WestEd.
Available: http://www.WestEd.org/online_pubs/learning_return.pdf.
Knapp, M. (1995). Teaching for meaning in high poverty classrooms. New York:
Teachers College Press.
Knapp, M., & Shields, P. (1990, June). Reconceiving academic instruction for the
children of poverty. Phi Delta Kappan, 71, 753-58.
Knapp, M., Shields, P., & Turnbull, B. (1995). Academic challenge in high-poverty
classrooms, Phi Delta Kappan 76, no. 10: 770-776.
Knapp, L. R., & Glenn, A. D. (1996). Restructuring schools with technology. Boston:
Allyn and Bacon.
Kritt, D. (1993). Authenticity, reflection, and self- evaluation in alternative assessment.
Middle School Journal, 25 (2), 43-45.
Lehr, J. B., & Harris, H. W. (1988). At-risk, low-achieving students in the classroom.
Washington, D.C.: National Educational Association Professional Library.
Leroy, C. & Symes, B. (2001). Teachers' perspectives on the family backgrounds of
children at risk. McGill Journal of Education, 36, 1 45-60. Wilson Web July 9,
2001.
Livingston, A., & Wirt, J. (2005). The condition of education 2005 in brief (NCES 2005–
095). U.S. Department of Education, National Center for Education Statistics.
Washington, DC: U.S. Government Printing Office.

112
Mann, D. (1999). Documenting the effects of instructional technology: A fly-over of
policy questions (Secretary’s Conference on Educational Technology). Retrieved
from http://www.ed.gov/Technology/TechConf/1999/whitepapers/paper6.html
Marlowe, B. & Page, M. (1999). Making the most of the classroom mosaic: A
constructivist perspective. Multicultural Education, 6, (4),19-21.
McMillan-Culp, K., Honey, M., & Mandinach, E. (2003). A retrospective on twenty years
of education technology policy. Washington, DC, U.S. Department of Education,
Office of Educational Technology. Retrieved from
http://www.nationaledtechplan.org/participate/20years.pdf.
McCombs, B. (2000, September). Assessing the role of educational technology in the
teaching and learning process: A learner-centered perspective. Paper presented at
the Secretary's Conference on Educational Technology: Measuring the Impacts
and Shaping the Future, Washington, DC. (a) Retrieved from
http://www.ed.gov/Technology/techconf/2000/mccombs_paper.html
Means, B., Blando, J., Olson, K., & Middleton, T. (1993). Using technology to support
education reform. Washington, DC: Office of Educational Research and
Improvement.
Means, B., & Olson, K. (1995). Technology and education reform: Technical research
report. Volume 1: Findings and conclusions . Menlo Park, CA: SRI International.
Melendez, M. (1993). Bilingual education in California: A status report. Thrust for
Educational Leadership, 22 (6), 35-38.
Miller, D. E. (1993). The literature project: Using literature to improve the self-concept
of at-risk adolescent females. Journal of Reading, 36 (6), 442–448.

113
National Center for Education Statistics. (1999). Teacher quality: A report on the
preparation and qualifications of public school teachers. NCES 1999–080.
Washington, DC: U.S. Department of Education.
National Center for Education Statistics. (2002). The condition of education 2002. NCES
2002–025. Washington, DC: U.S. Department of Education.
National Center for Education Statistics. (2003). The condition of education 2003. NCES
2003–067. Washington, DC: U.S. Department of Education.
Newmann, F.M. (1996). Authentic achievement: Restructuring schools for intellectual
quality. San Francisco, CA: Jossey-Bass
Newmann, F. M., Bryk, A. S. & Nagaoka, J. K. (2001, January). Authentic intellectual
work and standardized tests: conflict or coexistence? Chicago: Consortium on
Chicago School Research.
Newmann, F. M., Secada, W. G., & Wehlage, G. G. (1995). A guide to authentic
instruction and assessment: Vision, standards and scoring. Madison, WI:
Wisconsin Center for Education Research.
Newmann, F. M., Marks, H. M., & Gamoran, A. (1996). Authentic pedagogy and student
performance. American Journal of Education 104 (8), 280-312.
Newmann, F. M., & Wehlage, G. G. (1995). Successful school restructuring: a report to
the public and educators. Madison, WI: University of Wisconsin, Education
Center.
Newmann, F. M., Wehlage, G.G., & Lamborn. S.D. (1992). The significance and sources
of student engagement, Student engagement and achievement in American

114
secondary schools, edited by F.M. Newmann, pp. 11–30. New York: Teachers
College Press.
Niemiec, R. P., & Walberg, H. J. (1992). The effects of computers on learning.
International Journal of Educational Research 17, 99-108.
Office of Technology Assessment, U.S. Congress. (1995). Teachers and technology:
Making the connection. Washington, DC: U.S. Government Printing Office. [On-
line] Available: http://www.wws.princeton.edu/~ota/disk1/1995/9541.html
Padron, Y. N., & Waxman, H. C. (1999). Classroom observations of the five standards of
effective teaching in urban classrooms with English language learners. Teaching
and change, 7(1), 79-100.
Page, M. (2002). Technology-enriched classrooms: Effects on students of low
socioeconomic status. In D. Ayersman & W. M. Reed (Eds.), Journal of Research
on Technology in Education (389-409). Oregon:ISTE, Publishers.
Painter, S. R. (2001). Issues in the observation and evaluation of technology integration
in K-12 classrooms. Journal of Computing in Teacher Education, 17(4), 21-25.
Partnership for 21st Century Skills. (2002). Learning for the 21st century. Retrieved from
http://www.21stcentruyskills.org.
Payne, R. K. (1998). A framework for understanding poverty (Revised Ed). RFT
Publishing Co: Baytown, TX.
Payne, R. K. (2001). A framework for understanding poverty (Revised Ed). RFT
Publishing Co: Baytown, TX.
Penuel, W., & Means, B. (1999). Observing classroom practices in project-based
learning using multimedia: A tool for evaluators. In The Secretary's Conference

115
on Educational Technology Web site [Online]. Available:
http://www.ed.gov/Technology/TechConf/1999/whitepapers/paper3.html
Penuel , W. R., Means , B., Golan , S., & Korbak , C. (2000). Challenge 2000 year 4
evaluation report. Menlo Park: SRI International
Ravitz, J. L., Becker, H. J., & Wong, Y. T. (2000). Constructivist-compatible beliefs and
practices among U.S. teachers. Teaching, Learning, and Computing: 1998
National Survey, Report 4. Center for Research on Information Technology and
Organizations, University of California, Irvine.
Reeves, T. (1998, February). The impact of media and technology in schools. A research
report prepared for the Berteslemann Foundation. Retrieved from
http://www.athensacademy.org/instruct/media_tech/reeves0.html
Reid, K. S. (2001). Technology counts 2001: Racial disparities. Education Week, XX(35),
16-17.
Reilly, B. (1992) .The negotiations of group authorship among second graders using
multimedia composing software. Apple Classrooms of Tomorrow Report No. 14.
Cupertino, CA: Apple Computer. [On-line] Available:
http://www.apple.com/education/k12/leadership/acot/library.html.
Renchler, R. (2000). Grade span. Research Roundup, 16(3), 1-4.
Ringstaff, C., Sandholtz, J. H. & Dwyer, D. C. (1991). Trading places: when teachers
utilize student expertise in technology-intensive classrooms. ACOT Report 15.
Cupertino, CA: Apple Computer. [On-line] Available:
http://www.apple.com/education/k12/leadership/acot/library.html.

116
Ringstaff, C., Yocam, K., & Marsh, J. (1996). Integrating Technology into Classroom
Instruction: An Assessment of the Impact of the ACOT Teacher Development
Center Project. ACOT Report #22. Apple Computer, Inc. [On-line] Available:
http://www.apple.com/education/k12/leadership/acot/library.html.
Ringstaff, C. & Kelley, L. (2002). The learning return on our educational technology
investment: A review of findings from research. WestEd Regional Technology in
Education Consortium in the Southwest.
Rivera, C., & Zehler, A. M. (1991). Assuring the academic success of language minority
students: Collaboration in teaching and learning. Journal of Education, 173, 52-
77.
Rockman, et. al. (1998). Powerful tools for schooling: Second year study of the laptop
program, Rockman, et. al: San Francisco, CA. [Online]. Available:
http://rockman.com/projects/laptop/
Rockman, S. (2000). A more complex picture: Laptop use and impact in the context of
changing home and school access. San Francisco: Rockman et al. [Online]
Available: http://rockman.com/projects/laptop/
Rockman, S. (2003). Learning from Laptops, Threshold. Retrieved from:
www.ciconline.org.
Roschelle, J., Pea, R., Hoadley, C., Gordin, D., & Means, B. (2000). Changing how and
what children learn in school with computer-based technologies. The Future of
Children, 10(2), 76-101. [On-line] Available:
http://ctl.sri.com/publications/displayPublication.jsp?ID=114

117
Sandholtz, J., Ringstaff, C., & Dwyer, D. (1990). Teaching in high tech environments:
classroom management revisited, first-fourth year findings. [On-line] Available:
http://www.apple.com/education/k12/leadership/acot/library.html.
Sandholtz, J. H., Ringstaff, C., & Dwyer, D. C. (1994a). Student engagement revisited:
Views from technology-rich classrooms. [On-line] Available:
http://www.apple.com/education/k12/leadership/acot/library.html.
Sandholtz, J., Ringstaff, C., & Dwyer, D. (1997). Teaching with technology: Creating
student-centered classrooms. New York: Teachers College Press.
Silverstein, G., Frechtling, J., & Miyoaka, A. (2000). Evaluation of the use of technology
in Illinois public schools: Final report, prepared for Research Division, Illinois
State Board of Education. Rockville, MD: Westat.
Slavin, R. (1998). Can education reduce social inequity? Educational Leadership, 55, 6-
10.
Stephen, V. P., Varble, M. E., & Taitt, H. (1993). Instructional and organizational
change to meet minority and at risk student needs. Journal of Staff Development,
14(4), 40-43.
Stevenson, K. R. (1998). Evaluation report - year 2: Schoolbook laptop project (No. 2).
Beaufort: University of South Carolina Department of Educational Leadership
and Policies. [Online] Available:
http://www.beaufort.k12.sc.us/district/ltopeval.html
Strahan, D. (2003). General patterns and particular pictures: Lessons learned from reports
from "beating the odds" schools. Journal of Curriculum and Supervision, 18, 296-
305.

118
Statham, D. S., & Torrell, C. R. (1999). Technology in public education in the United
States. Retrieved from http://www.tea.state.tx.us/Textbooks/archives/litrevie.htm
Thomas, J. (2000). Executive summary. A review of research on project-based learning.
San Rafael, CA: Autodesk Foundation.
Tiene, D., & Luft, P. (2002). The technology-rich classroom. American School Board
Journal, 189(8), 37-39.
Trilling, B., & Hood, P. (1999). Learning, technology, and education reform in the
knowledge age or “We’re wired, webbed, and windowed, now what?”
Educational Technology, 39(3), 5-18.
Trotter, A. (May 2005). Federal Role Seen Shifting, Technology Counts 2005: Electronic
Transfer: Moving Technology Dollars in New Directions, [Online] Available at:
http://www.edweek.org/ew/toc/2005/05/05/index.html
U.S. Department of Education. (January 2001). High standards for all students: A report
from the National Assessment of Title I on progress and challenges since the 1994
reauthorization. Prepared for the Planning and Evaluation Service, Office of the
Under Secretary, U.S. Department of Education.
U.S. Department of Education. (2002). No Child Left Behind Act. Washington, D.C.: U.S.
Government Printing Office.
U.S. Department of Education (2003, March 12). Press Release of remarks made by
Secretary Rod Paige to Commonwealth Club of California, Palo Alto, CA.
Retrieved from http://www.ed.gov/PressRelease/03-2003/03122003.html

119
Waxman, H. C., & Huang, S. L. (1996). Classroom instruction differences by level of
technology use in middle school mathematics. Journal of Educational Computing
Research, 14(2), 157-169.
Waxman, H. C., Huang, S. L., & Padron, Y. N. (1995). Investigating the pedagogy of
poverty in inner city middle level school. Research in Middle Level Education, 18
(2), 1-22.
Waxman, H. C., & Padron, Y. N. (1995). Improving the quality of classroom instruction
for students at risk of failure in urban schools. Peabody Journal of Education, 70
(2), 44-65.
Waxman, H. C., Padron, Y. N., & Knight, S. L. (1991). Risks associated with students'
limited cognitive mastery. In M. C. Wang, M. c. Reynolds, and H. J. Walberg
(Eds.), Handbook of special education: Research and practice. New York:
Pergamon.
Waxman, H. C., Padron, Y.N. & Arnold, K. M. (2001). Effective instructional practices
for students placed at risk of academic failure. In G.D.Borman, S.C.Stringfield &
R.E.Slavin (Eds.), Title 1: Compensatory education at the crossroads (pp.137 –
170). Mahwah: NJ: Lawerence Erlbaum Associates, Inc.
Wenglinsky, H. (1998). Does it compute? The relationship between educational
technology and student achievement in mathematics Princeton, NJ: Educational
Testing Service. Retrieved from ftp://ftp.ets.org/pub/res/technolog.pdf.
Wenglinsky, H. (2005) Using Technology Wisely: The Keys to Success in Schools.
Teachers College Press, New York.
120
Wiggins, G. (1998). Educative assessment: Designing assessments to inform and
improve student performance. San Francisco, CA: Jossey-Bass Publishers.
Wiggins, G. (1989). Teaching to the (authentic) test. Educational Leadership,46 , 41-47.
Wilhelm, T., Carmen, D., & Reynolds, M. (2002, June). Connecting Kids to Technology:
Challenges and Opportunities. Baltimore: The Annie E. Casey Foundation. (ED
467 133) Retrieved November 1, 2002, http://www.kidscount.org
Zucker, A. A. (2004). Developing a research agenda for ubiquitous computing in schools.
Journal of Educational Computing Research, 30(4), 371-386.

ABOUT THE AUTHOR
Kate Kemker is a life-long educator who views technology as a tool that can level
the learning field and enrich all students lives.
Kate recently completed her doctorate at the University of South Florida in the
area of Curriculum and Instruction, in which she examined Florida's elementary students
access to technology in high and low socioeconomic schools. She also received from
USF her Masters in Education Degree for Instructional Technology and Bachelor’s in
Science Degree for Music Education. She has presented and conducted workshops at
various state and national conferences, such as the Florida Educational Technology
Conference (FETC), the Annual Conference of the Association for Supervision and
Curriculum Development (ASCD), and the National Educational Computing Conference
(NECC). In addition, she has published articles, chapters, and websites on the utilization
of technology as tool for learning.