test instrumentation and handbook
TRANSCRIPT
NBSIR 84-2911
National Bureau of StandardsPassive Solar Test Facility -
Instrumentation and Site
Handbook
U.S. DEPARTMENT OF COMMERCENational Bureau of Standards
National Engineering Laboratory
Center for Building Technology
Building Equipment Division
Gaithersburg, MD 20899
June 1984
Issued August 1984
Q.Z/0 o
no.M-Mt
im
Prepared for:
U.S. Department of EnergyOffice of Solar Heat TechnologiesPassive and Hydrid Solar Energy Division
Experimental System Research ProgramWashington, DC 20585

nationalOr ST?.'.
I
'
NBSIR 84-2911
NATIONAL BUREAU OF STANDARDSPASSIVE SOLAR TEST FACILITY -
INSTRUMENTATION AND SITE
HANDBOOK
Bal M. Mahajan
U S. DEPARTMENT OF COMMERCENational Bureau of Standards
National Engineering Laboratory
Center for Building Technology
Building Equipment Division
Gaithersburg, MD 20899
June 1984
Issued August 1984
Prepared for:
U.S. Department of EnergyOffice of Solar Heat TechnologiesPassive and Hydrid Solar Energy Division
Experimental System Research ProgramWashington, DC 20585
bureau. -cardsARY
U.S. DEPARTMENT OF COMMERCE, Malcolm Baldrige, Secretary
NATIONAL BUREAU OF STANDARDS, Ernest Ambler. Director

ABSTRACT
The National Bureau of Standards (NBS), under the sponsorship of the U.S.
Department of Energy (DOE) has constructed a passive solar test facility. As a
part of the DOE's Experimental Systems Research Program, the NBS test facilityhas been constructed for the purpose of acquiring and distributing to partici-pating researchers class A level performance data for different passive systems.
These data are acquired for use in: detailed building energy analysis andmodel/algorithm validation; and performance characterization of passive sub-
systems .
This handbook provides a complete description of the test building, thermo-physical properties of the building material, location of the sensors installedat the test facility, and data acquisition system and procedures.
iii
NOTES FOR THE FIGURES
1. All dimensions shown in the figures are nominal.
2. The test facility was constructed using the nominal dimensions in EnglishUnits. Expression of the dimension in Metric Units would suggest inordi-nately small dimensional tolerances. Hence the dimensions are shown inEnglish Units. For the convenience of the readers, the Metric equivalentof English Units are given below.
1 foot = 0.3048 meter1 inch = 0.0254 meter
iv
TABLE OF CONTENTS
Page
1. INTRODUCTION 1
2. GENERAL ENVIRONMENTS 3
3. DESCRIPTION OF THE BUILDING 5
3.1 General 3
3.2 Ceiling/Roof 8
3.3 Floor 8
3.4 Walls 12
3.5 Windows 18
3.6 Individual Cells 18
3.7 Material Properties and Heat Loss Coefficient of Test Cells 33
3.8 Auxiliary Heating and Cooling System 33
4. INTRU MENTATION 37
4.1 Outside 37
4.2 Cell #1 41
4.3 Cell #2 41
4.4 Cell #3 48
4.5 Cell #4 48
5. DATA ACQUISITION AND DISTRIBUTION 58
5.1 Data Acquisition System 58
5.2 Continuous Air Infiltration Monitoring System 58
5.3 Data Acquisition and Distribution 59
5.4 Estimates of Uncertainty in the Measured Data 59
6. CONCLUDING REMARKS 637. ACKNOWLEDGEMENT 638. REFERENCES 64
8. APPENDIX A. A Copy of Data Documentation 66
v

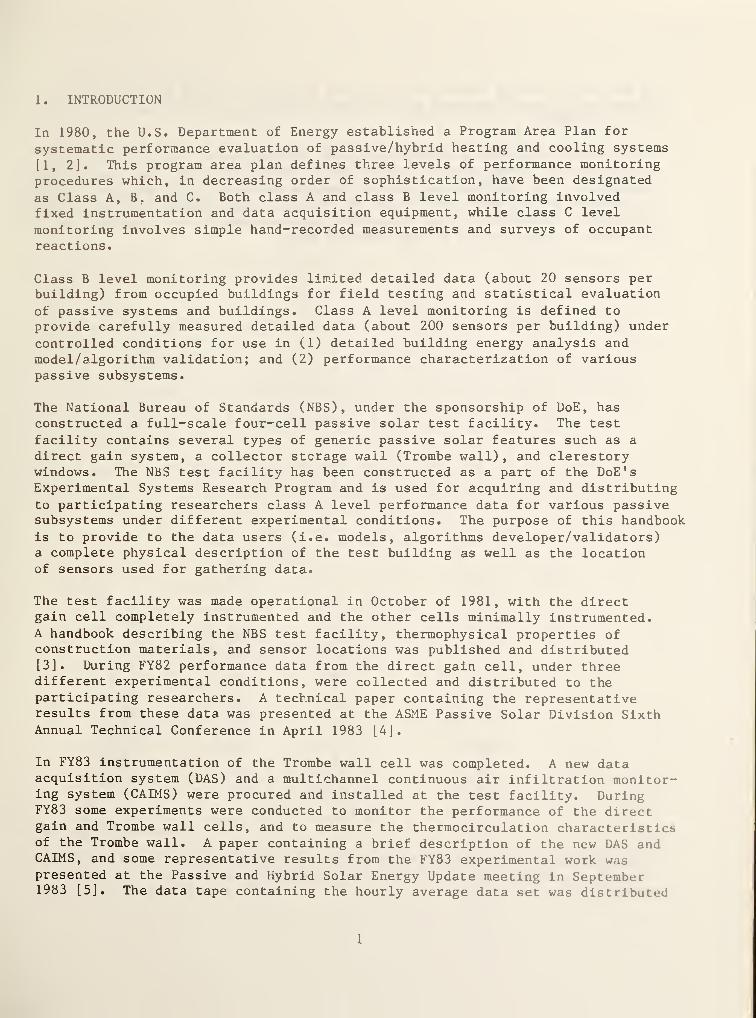
1. INTRODUCTION
In 1980, the U.S. Department of Energy established a Program Area Plan for
systematic performance evaluation of passive/hybrid heating and cooling systems
[1, 2]. This program area plan defines three levels of performance monitoringprocedures which, in decreasing order of sophistication, have been designated
as Class A, B, and C. Both class A and class B level monitoring involvedfixed instrumentation and data acquisition equipment, while class C level
monitoring involves simple hand-recorded measurements and surveys of occupantreactions.
Class B level monitoring provides limited detailed data (about 20 sensors perbuilding) from occupied buildings for field testing and statistical evaluation
of passive systems and buildings. Class A level monitoring is defined toprovide carefully measured detailed data (about 200 sensors per building) under
controlled conditions for use in (1) detailed building energy analysis andmodel/algorithm validation; and (2) performance characterization of variouspassive subsystems.
The National Bureau of Standards (NBS), under the sponsorship of DoE, hasconstructed a full-scale four-cell passive solar test facility. The test
facility contains several types of generic passive solar features such as a
direct gain system, a collector storage wall (Trombe wall), and clerestorywindows. The NBS test facility has been constructed as a part of the DoE’sExperimental Systems Research Program and is used for acquiring and distributingto participating researchers class A level performance data for various passivesubsystems under different experimental conditions. The purpose of this handbookis to provide to the data users (i.e. models, algorithms developer/validators)a complete physical description of the test building as well as the locationof sensors used for gathering data.
The test facility was made operational in October of 1981, with the directgain cell completely instrumented and the other cells minimally instrumented.A handbook describing the NBS test facility, thermophysical properties ofconstruction materials, and sensor locations was published and distributed[3]. During FY82 performance data from the direct gain cell, under threedifferent experimental conditions, were collected and distributed to theparticipating researchers. A technical paper containing the representativeresults from these data was presented at the ASME Passive Solar Division SixthAnnual Technical Conference in April 1983 [4].
In FY83 instrumentation of the Trombe wall cell was completed. A new dataacquisition system (DAS) and a multichannel continuous air infiltration monitor-ing system (CAMS) were procured and installed at the test facility. DuringFY83 some experiments were conducted to monitor the performance of the directgain and Trombe wall cells, and to measure the thermocirculation characteristicsof the Trombe wall. A paper containing a brief description of the new DAS andCAIMS, and some representative results from the FY83 experimental work waspresented at the Passive and Hybrid Solar Energy Update meeting in September1983 [5]. The data tape containing the hourly average data set was distributed
1
to the participating researchers. In the beginning of FY84 some additionalthermocouples were installed in the direct gain cell (cell #4) and the control
cell (cell #3).
This handbook contains a complete physical description of the test facility,as well as the thermophysical properties of the building materials and buildingcomponents. The handbook contains a complete directory (type and location) ofthe sensors installed in and around the building, and a brief description of DAS
and CAIMS. The handbook also describes the data acquisition procedures andestimates of uncertaintiy in the measured data.
2
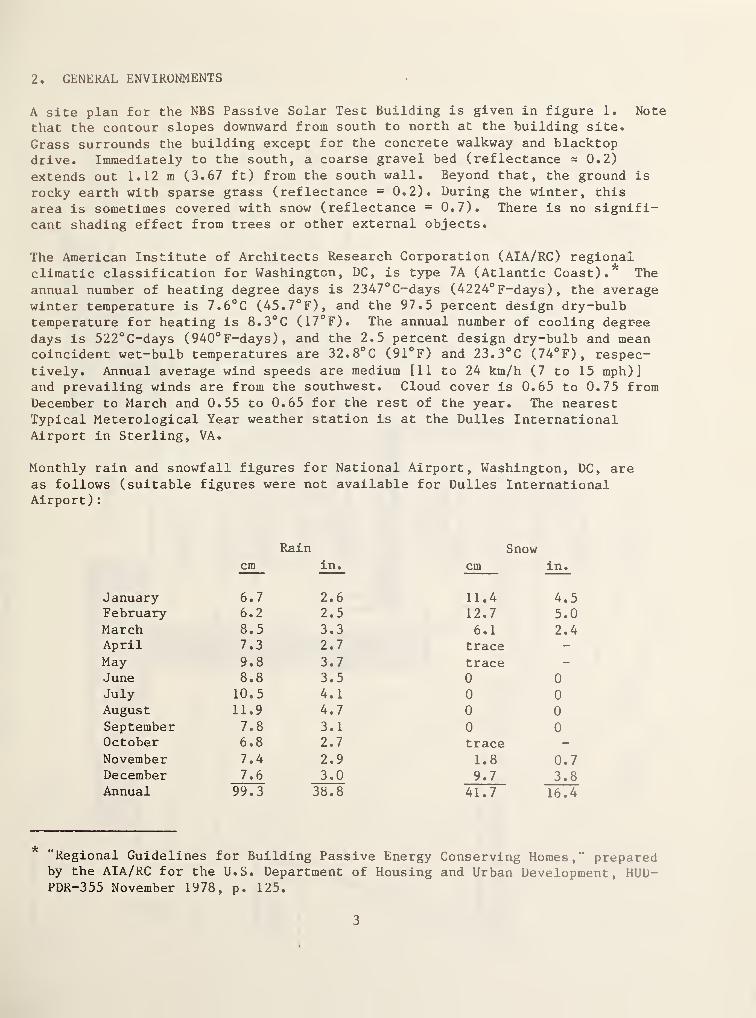
2. GENERAL ENVIRONMENTS
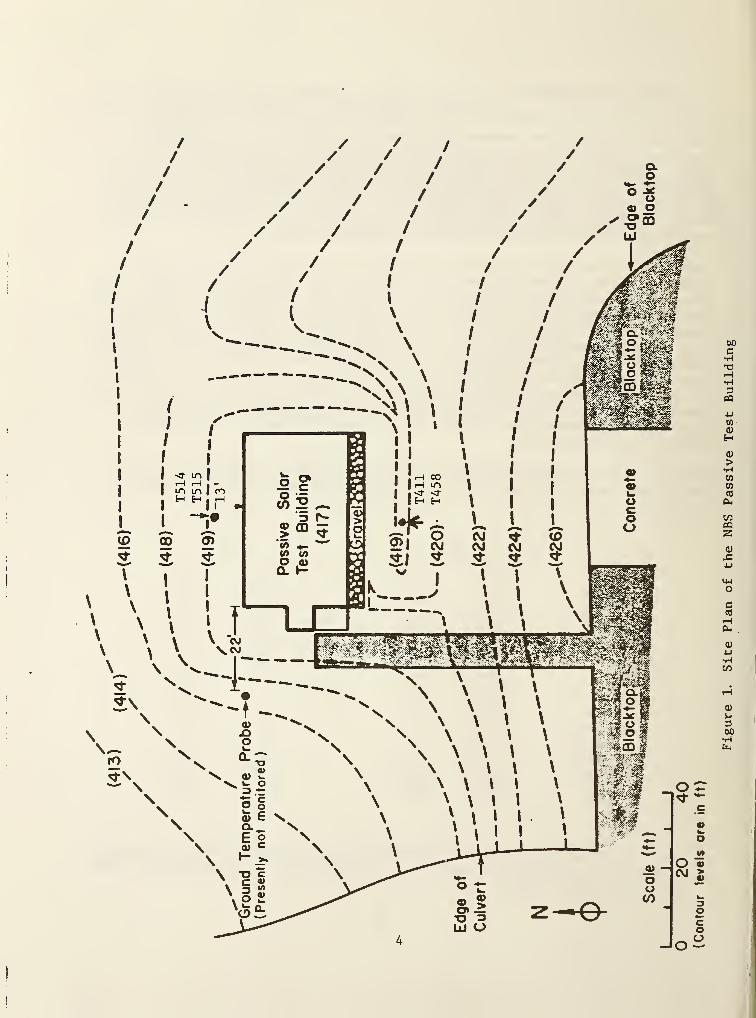
A site plan for the NBS Passive Solar Test Building is given in figure 1. Note
that the contour slopes downward from south to north at the building site.
Grass surrounds the building except for the concrete walkway and blacktopdrive. Immediately to the south, a coarse gravel bed (reflectance - 0.2)
extends out 1.12 m (3.67 ft) from the south wall. Beyond that, the ground is
rocky earth with sparse grass (reflectance = 0.2). During the winter, this
area is sometimes covered with snow (reflectance = 0.7). There is no signifi-cant shading effect from trees or other external objects.
The American Institute of Architects Research Corporation (AIA/RC) regionalclimatic classification for Washington, DC, is type 7A (Atlantic Coast).* The
annual number of heating degree days is 2347°C-days (4224°F-days), the average
winter temperature is 7.6°C (45.7°F), and the 97.5 percent design dry-bulbtemperature for heating is 8.3°C (17°F). The annual number of cooling degreedays is 522°C-days (940°F-days) ,
and the 2.5 percent design dry-bulb and meancoincident wet-bulb temperatures are 32.8°C (91°F) and 23.3°C (74°F), respec-tively. Annual average wind speeds are medium [11 to 24 km/h (7 to 15 mph)
]
and prevailing winds are from the southwest. Cloud cover is 0.65 to 0.75 fromDecember to March and 0.55 to 0.65 for the rest of the year. The nearestTypical Meterological Year weather station is at the Dulles InternationalAirport in Sterling, VA.
Monthly rain and snowfall figures for National Airport, Washington, DC, areas follows (suitable figures were not available for Dulles InternationalAirport)
:
Rain Snowcm in. cm in.
January 6.7 2.6 11.4 4.5February 6.2 2.5 12.7 5.0March 8.5 3.3 6.1 2.4April 7.3 2.7 trace -
May 9.8 3.7 trace -
June 8.8 3.5 0 0
July 10.5 4.1 0 0
August 11.9 4.7 0 0
September 7.8 3.1 0 0October 6.8 2.7 trace -
November 7.4 2.9 1.8 0.7December 7.6 3.0 9.7 3.8Annual 99.3 38.8 41.7 16.4
"Regional Guidelines for Building Passive Energy Conserving Homes," preparedby the AIA/RC for the U.S. Department of Housing and Urban Development, HUD-PDR-355 November 1978, p. 125.
3
i
Figure
1.
Site
Plan
of
the
NBS
Passive
Test
Building
3. DESCRIPTION OF THE BUILDING
3.1 GENERAL
The NBS Passive Solar Test Facility is located in Gaithersburg, MD, (latitude39° N, longitude 77.3°W) on an open field with no shading from the surroundings.
The building is a rectangular one-story, slab on grade, frame structure, withthe long axis running from east to west. The building is especially designed
to be reconf igurable so that passive solar features can be installed withminimum cost and effort. For example, the interior walls are not load bearingand thus can be removed or redesigned. Also, the structure of the south ceilingcould support a 0.3 m (12 in) roof pond.
A photograph showing the south elevation of the building is presented in figure
2, and the floor plane of the current configuration is shown in figure 3. The
current configuration provide four cells of equal floor area and an "entry"adjoining cell #1 on the west of the building. Each cell has a floor area of
30.1 m^ (324 ft^) and a total volume of 88.4 m^ (3122 ft^). A description ofthe cells will be given later in this section.
The building envelope or the envelope of each cell may be divided into fourtypes of surfaces/components: ceiling/roof, floor, walls, and windows. Adescription of construction details and material properties for each surfacetype are given below.
5
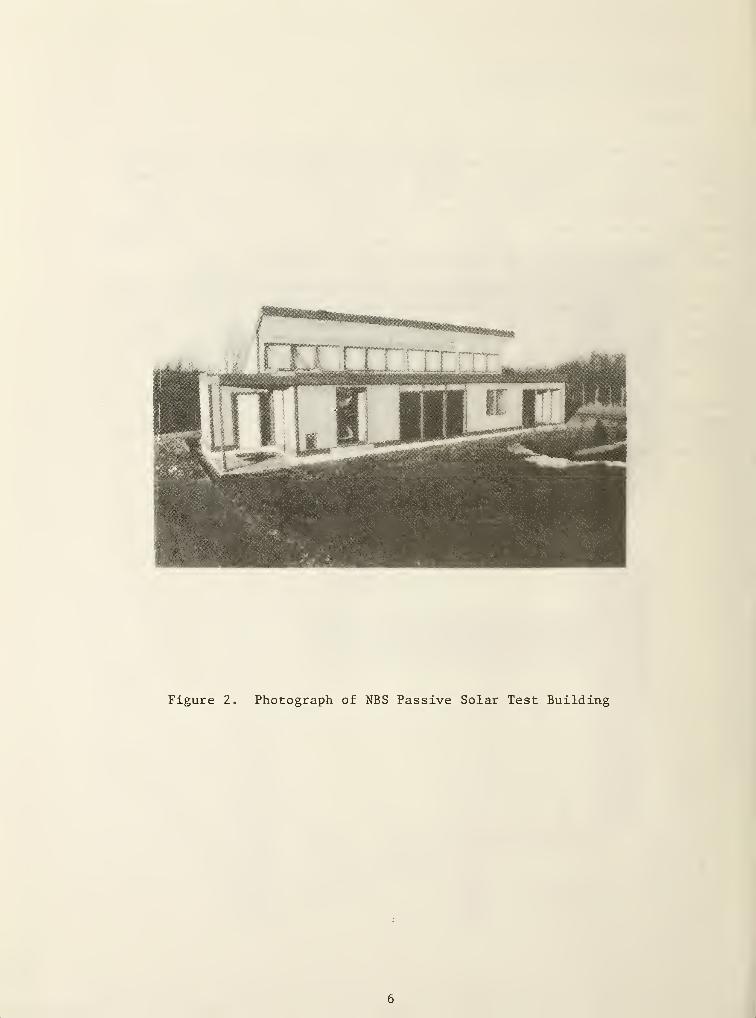
Figure 2. Photograph of NBS Passive Solar Test Building
7
floor
surface
is
above
the
ground
Surface.
Figure
3.
Floor
Plan
of
the
NBS
Passive
Test
Building
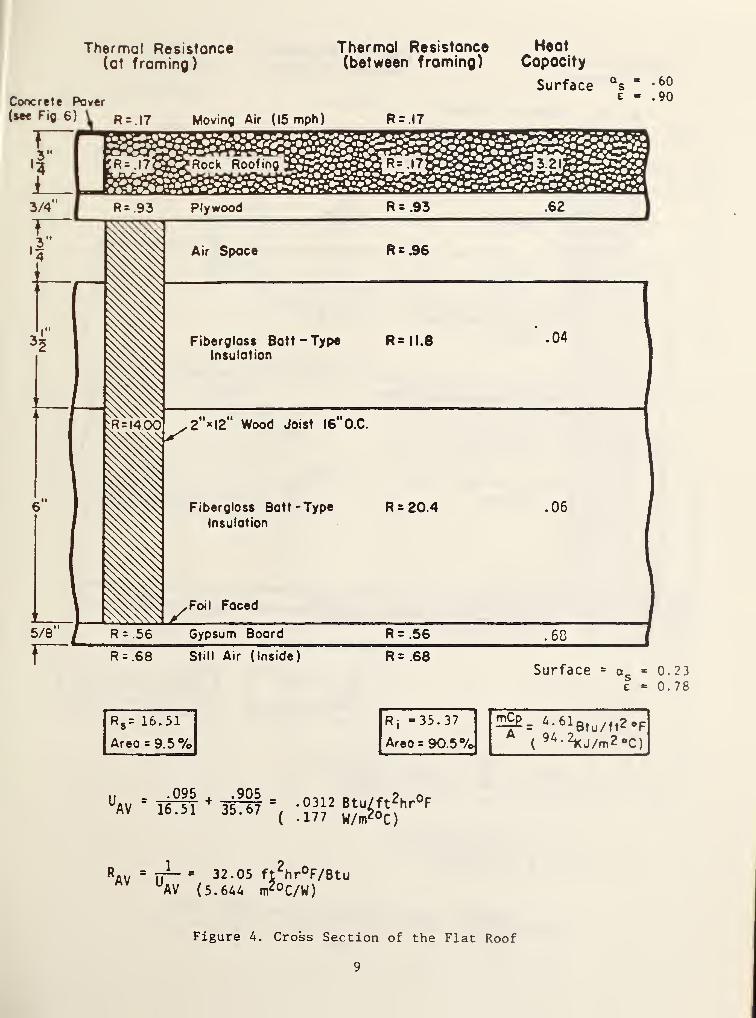
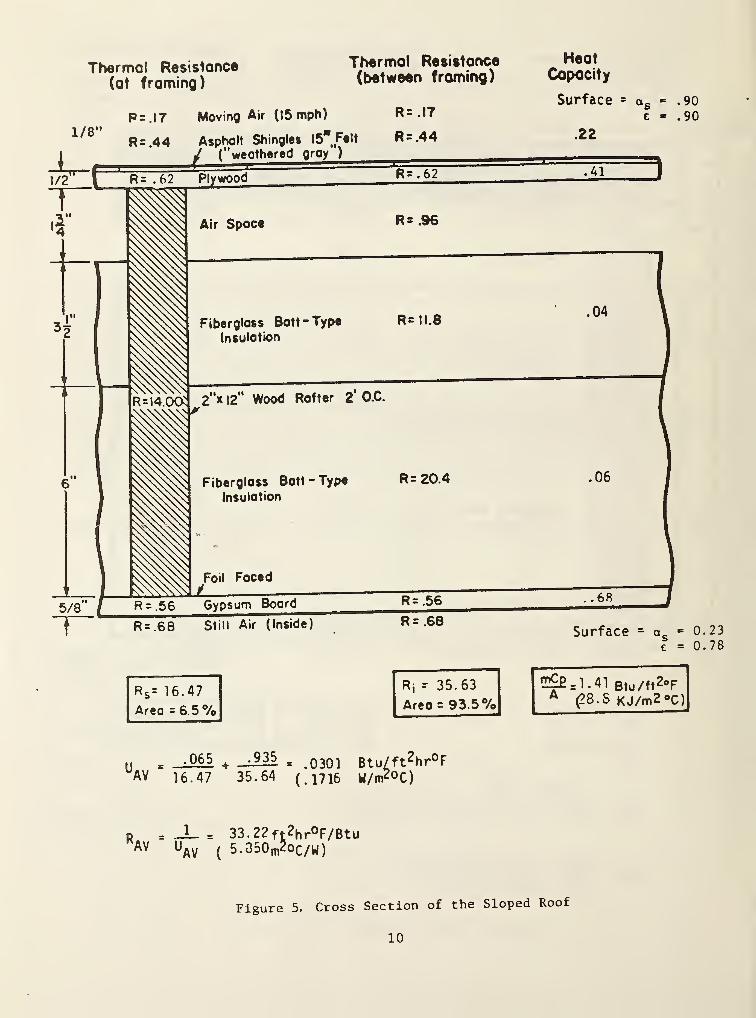
3.2 CEILING/ROOF
The roof is divided into two parts: a 4.77 m (15.67 ft) south section of flat
builtup construction and a 4.58 m (11.25 ft) north section of asphalt shingle
covered sloped roof to accommodate clerestory windows. Both sections of theroof are insulated with 240 mm (9.5 in) of fiberglass bat insulation. Theceiling height under the flat roof is 2.45 m (8.08 ft). The ceiling heightunder the sloped roof section varies from 4.64 m (15.25 ft) at the south end to
2.45 (8.08 ft) at the north end. A section view of both the flat and slopedroof are shown in figures 4 and 5, respectively. The properties of the construc-tion materials as well as the total R-value of the component are also given inthe figures.
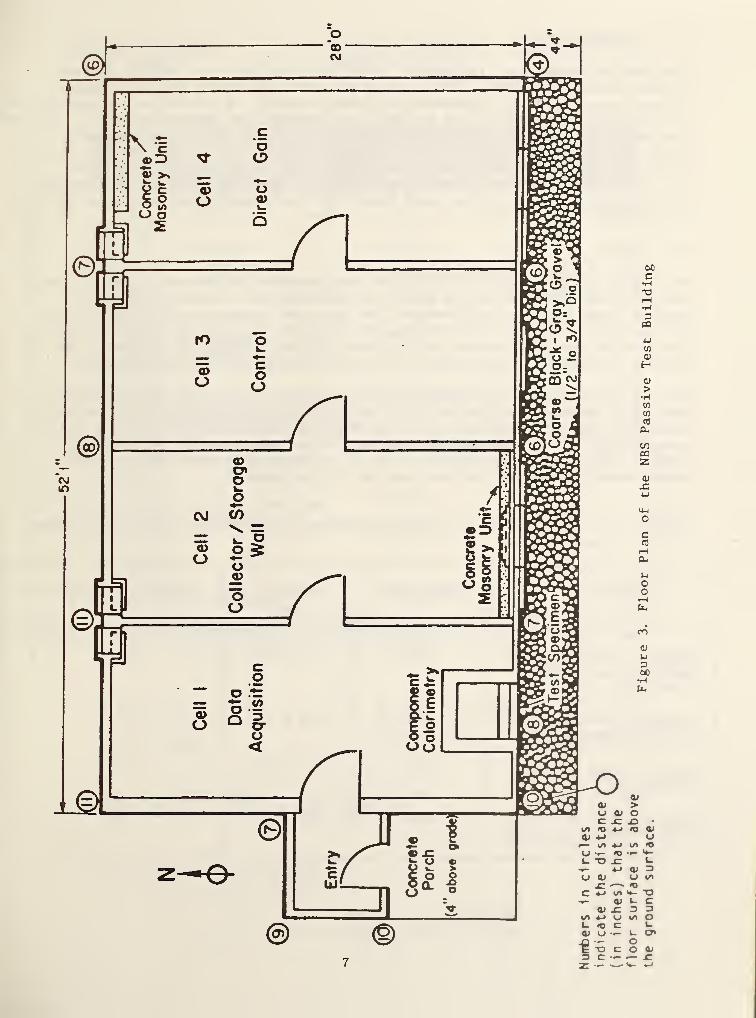
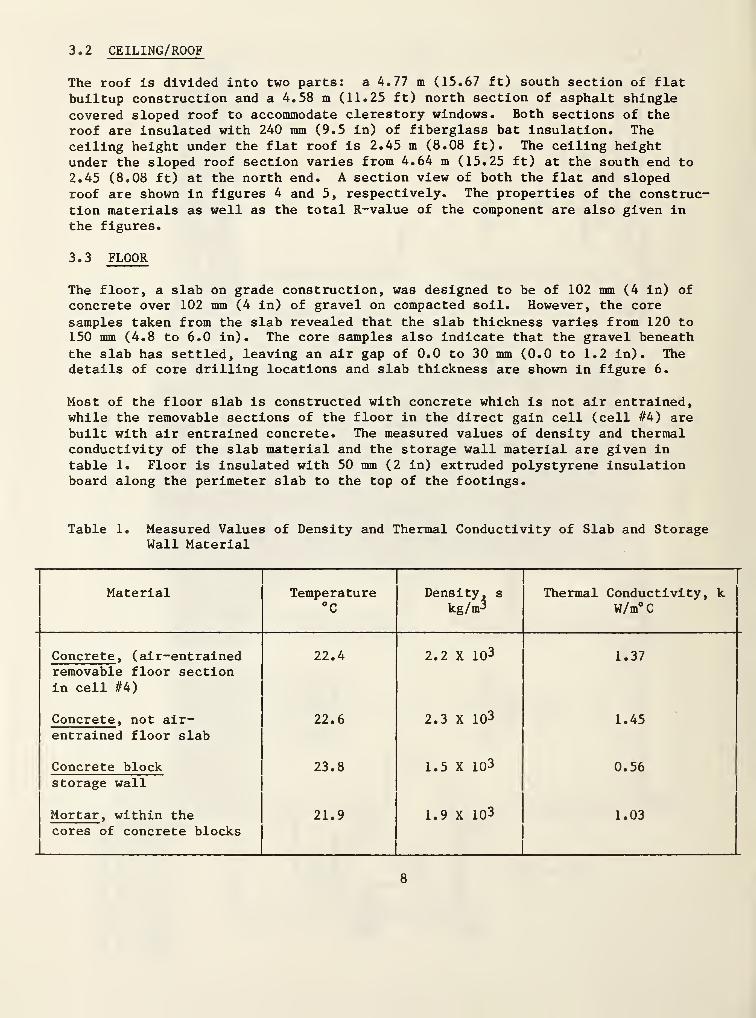
3.3 FLOOR
The floor, a slab on grade construction, was designed to be of 102 mm (4 in) of
concrete over 102 mm (4 in) of gravel on compacted soil. However, the core
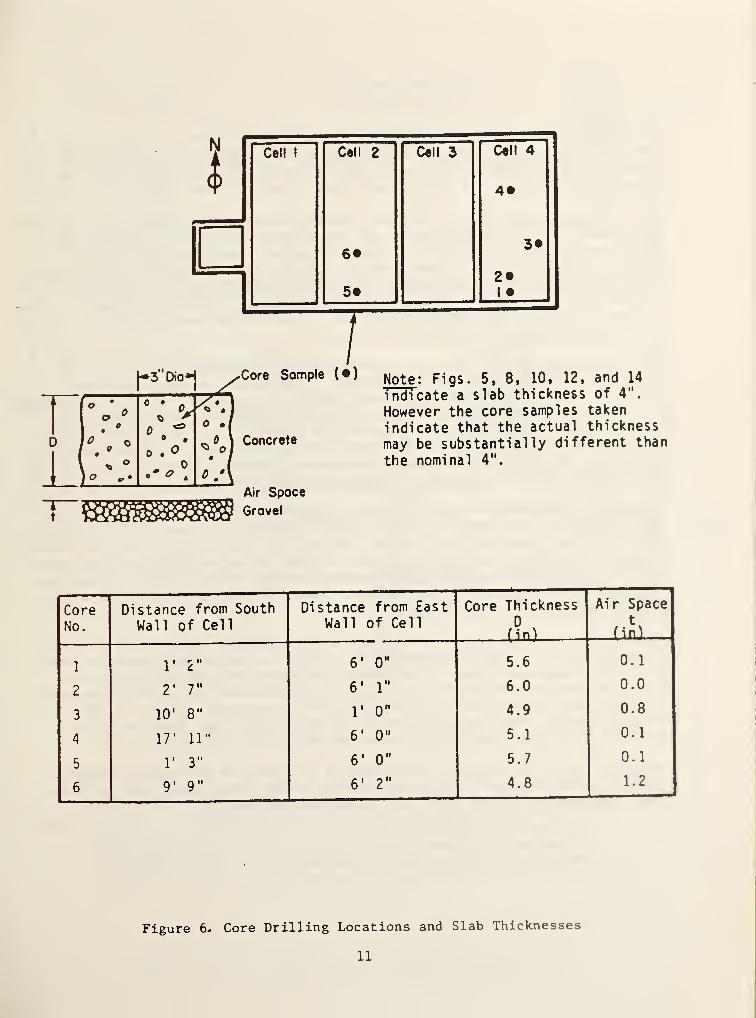
samples taken from the slab revealed that the slab thickness varies from 120 to150 mm (4.8 to 6.0 in). The core samples also indicate that the gravel beneath
the slab has settled, leaving an air gap of 0.0 to 30 mm (0.0 to 1.2 in). Thedetails of core drilling locations and slab thickness are shown in figure 6.
Most of the floor slab is constructed with concrete which is not air entrained,while the removable sections of the floor in the direct gain cell (cell #4) arebuilt with air entrained concrete. The measured values of density and thermalconductivity of the slab material and the storage wall material are given in
table 1. Floor is insulated with 50 mm (2 in) extruded polystyrene insulationboard along the perimeter slab to the top of the footings.
Table 1. Measured Values of Density and Thermal Conductivity of Slab and StorageWall Material
Material Temperature°C
Density, s
kg/m^Thermal Conductivity, k
W/m° C
Concrete, (air-entrainedremovable floor sectionin cell #4)
22.4 2.2 X 10³ 1.37
Concrete, not air-entrained floor slab
22.6 2.3 X 10³ 1.45
Concrete blockstorage wall
23.8 1.5 X 10³ 0.56
Mortar, within thecores of concrete blocks
21.9 1.9 X 10³ 1.03
8
Thermal Resistance(at framing)
Concrete Rover(see Fig 6 ) \ 17
1
Moving Air (15 mph)
Thermal Resistance(between framing)
R = .17
R = .68 Still Air (Inside) R = .68
HeatCapacity
Surface °s .60
.90
Surface = as = 0.23e - 0.78
Rs= 16.51 Ri -35.37 mCp
_ 4 - 61 Btu/ft2»FArea = 9.5% Areo = 90.5%
Ai
94> 2KJ/m2°C)
uav - TOT * 3$f -
(
Rav=TT~ ' 32 * 05 n 2
hr°F/BtuUAV (5.644 m*°C/W)
Figure 4. Cross Section of the Flat Roof
9
Ml**
Thermal Resistance(at framing)
p= .17 Moving Air (I5mph)
Thermal Resistance(between framing)
R= .17
R s = 16.47
Area = 6 5%
HeatCopocity
Surface = a .90
.90
Rj r 35.63
Area = 93.5%^£ = 1-41 Btu/ft 2oFA (?8.S KJ/m2°C)
n =- 065 + . = .0301 Btu/ft 2hr°F
AV 16.47 35.64 (.1716 W/m2o C)
p = J_ = 33.22ft2hr°F/BtuAV U
AV (5.350 m2o C /w)
Figure 5. Cross Section of the Sloped Roof
10
Core Sample (•)
Concrete
Air Space
Gravel
Note : Figs. 5, 8, 10, 12, and 14
TndTcate a slab thickness of 4".
However the core samples taken
indicate that the actual thickness
may be substantially different than
the nominal 4".
CoreNo.
Distance from South
Wall of Cell
Distance from EastWall of Cell
Core ThicknessDCluj
Air Space
Cin)
1 1‘ 2" 6' 0" 5.6 0.1
2 2' 7" 6' 1" 6.0 0.0
3 10' 8" 1* 0" 4.9 0.8
4 17' 11" 6' 0" 5.1 0.1
5 1' 3" 6' 0" 5.7 0.1
6 9' 9" 6' 2" 4.8 1.2
Figure 6. Core Drilling Locations and Slab Thicknesses
11
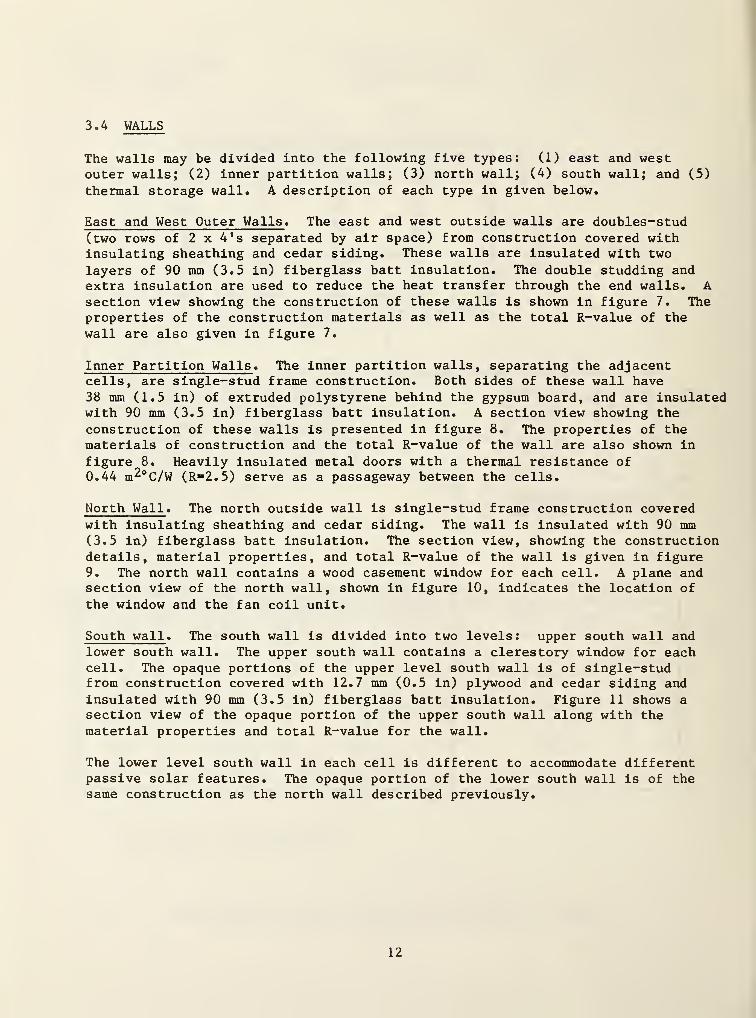
3 . 4 WALLS
The walls may be divided into the following five types: (1) east and westouter walls; (2) inner partition walls; (3) north wall; (4) south wall; and (5)
thermal storage wall. A description of each type in given below.
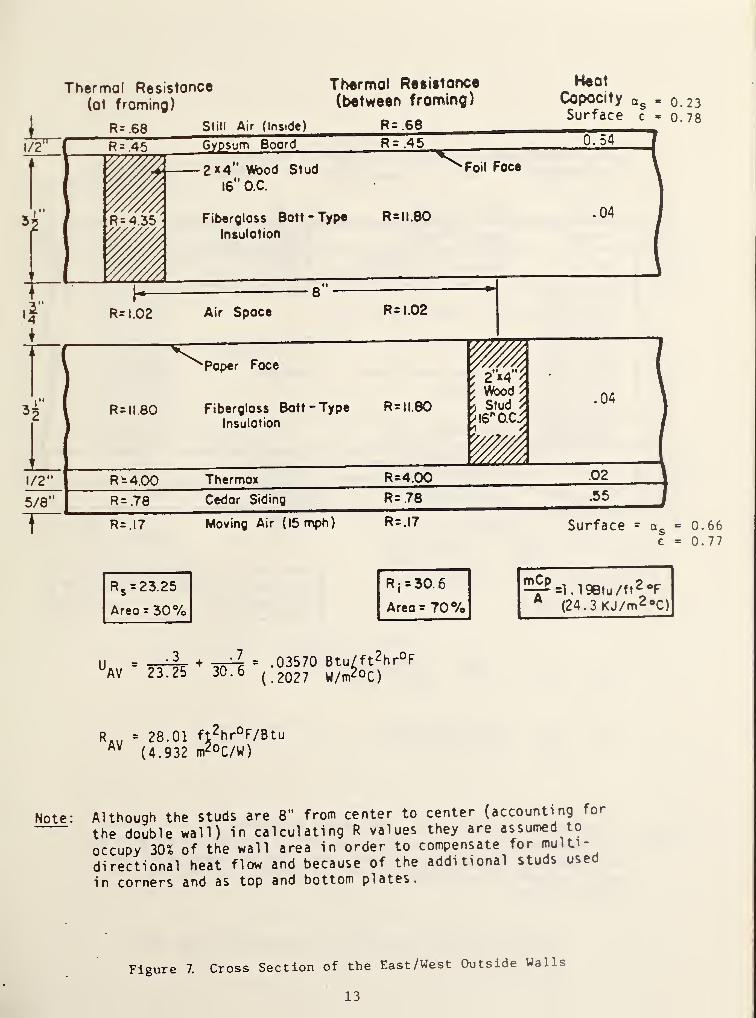
East and West Outer Walls . The east and west outside walls are doubles-stud(two rows of 2 x 4’s separated by air space) from construction covered withinsulating sheathing and cedar siding. These walls are insulated with two
layers of 90 mm (3.5 in) fiberglass batt insulation. The double studding andextra insulation are used to reduce the heat transfer through the end walls. Asection view showing the construction of these walls is shown in figure 7. Theproperties of the construction materials as well as the total R-value of the
wall are also given in figure 7.
Inner Partition Walls . The inner partition walls, separating the adjacentcells, are single-stud frame construction. Both sides of these wall have38 mm (1.5 in) of extruded polystyrene behind the gypsum board, and are insulatedwith 90 mm (3.5 in) fiberglass batt insulation. A section view showing the
construction of these walls is presented in figure 8. The properties of thematerials of construction and the total R-value of the wall are also shown in
figure 8. Heavily Insulated metal doors with a thermal resistance of0.44 m2°C/W (R=2.5) serve as a passageway between the cells.
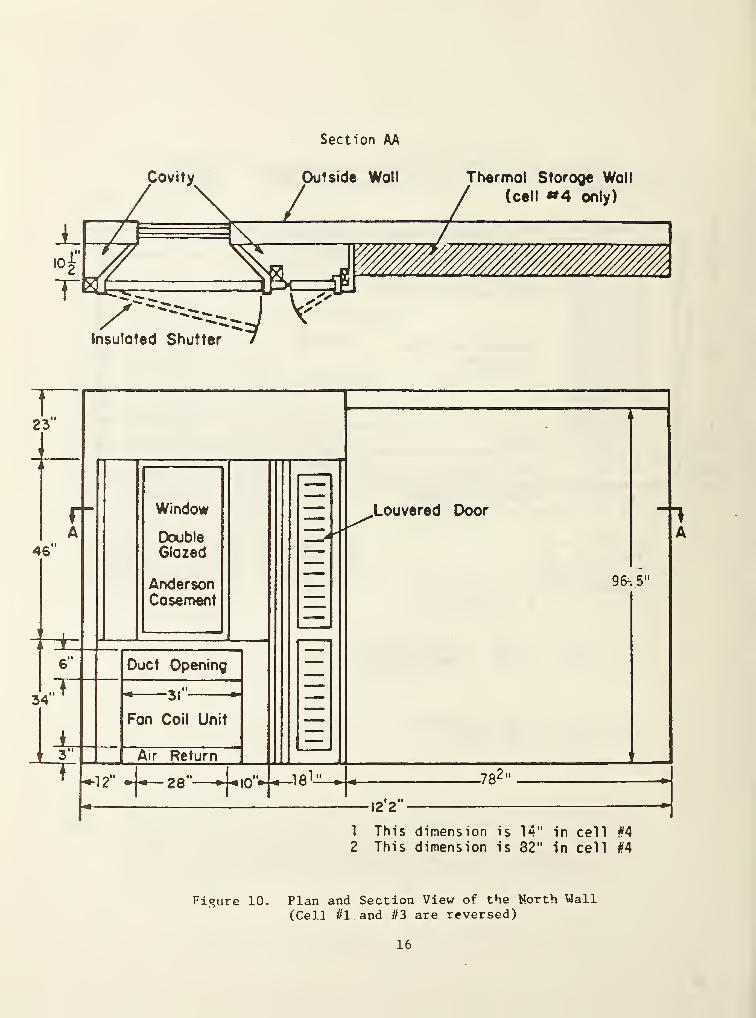
North Wall . The north outside wall is single-stud frame construction coveredwith insulating sheathing and cedar siding. The wall is insulated with 90 mm(3.5 in) fiberglass batt insulation. The section view, showing the constructiondetails, material properties, and total R-value of the wall is given in figure9. The north wall contains a wood casement window for each cell. A plane andsection view of the north wall, shown in figure 10, indicates the location of
the window and the fan coil unit.
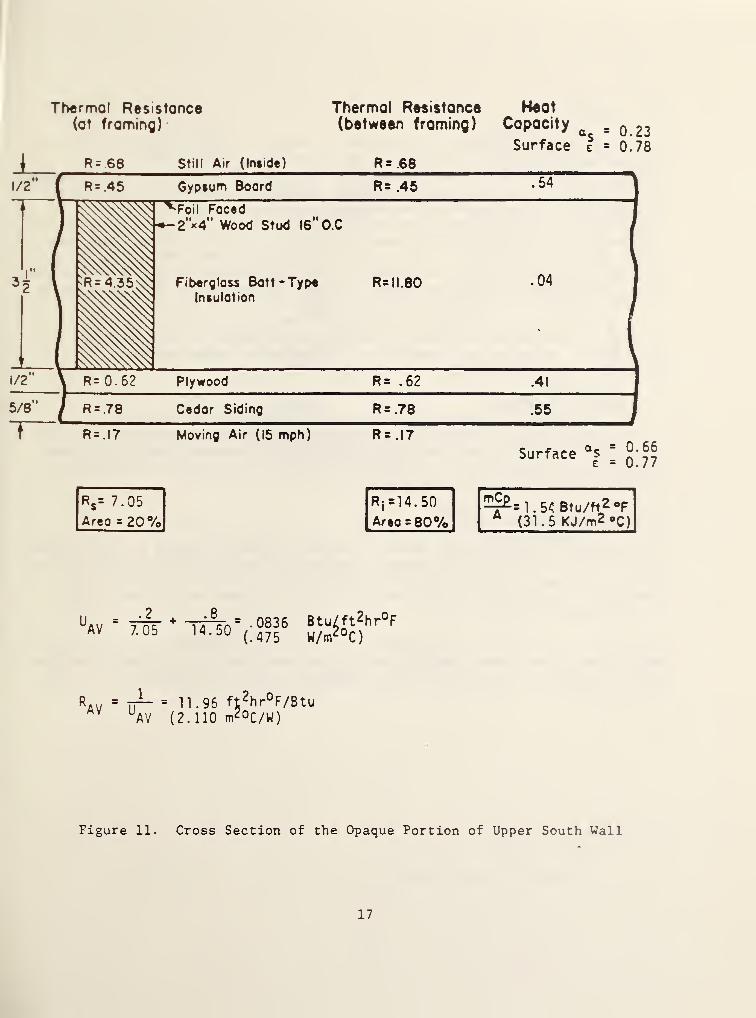
South wall . The south wall is divided into two levels: upper south wall andlower south wall. The upper south wall contains a clerestory window for eachcell. The opaque portions of the upper level south wall is of single-studfrom construction covered with 12.7 mm (0.5 in) plywood and cedar siding and
insulated with 90 mm (3.5 in) fiberglass batt insulation. Figure 11 shows asection view of the opaque portion of the upper south wall along with thematerial properties and total R-value for the wall.
The lower level south wall in each cell is different to accommodate differentpassive solar features. The opaque portion of the lower south wall is of thesame construction as the north wall described previously.
12
i1/2
,r'4
v
4'
1 /2'
Thermal Resistance
(at framing)
R= .68 Still Air (Inside)
5/8“
T~
Thermal Resistance
(between framing)
R = .68
R = .45 Gypsum Boord R= .45
2x4" Wood Stud16" O.C.
Fiberglass Batt-Type
Insulation
Foil Foce
R = 11.80
R= 1.02 Air Space R= 1.02
Paper Foce
R = ll.80 Fiberglass Batt-Type R = ll.80
Insulation
r .'«/
^2X4
/^ Wood /
* Stud >
>\6n0.C^
HeatCopocity a
Surface0.230.78
0.54
.04
.04
R-4.00 Thermo* R=4.00 .02 \
COr*-
iicr Cedor Siding 00N.II(Z .55 /
R= .17 Moving Air (15 mph) R = .I7 Surface = a se
Rs=23.25 R
i
= 30.
6
— =1 . 1 9Btu /ft 2 °F
Area = 30% Area = 70% A(24. 3 KJ/m2#C)
i = -3. + = .03570 Btu/ft 2 hr°F~AV 23.25 JU - b
(.2027 W/m2o C)
0.660.77
R... = 28.01 ft 2hr°F/BtuAV
(4.932 m2o C/W)
Note: Although the studs are 8" from center to center (accounting for
the double wall) in calculating R values they are assumed to
occupy 30% of the wall area in order to compensate for multi-
directional heat flow and because of the additional studs used
in corners and as top and bottom plates.
Figure 7. Cross Section of the East/West Outside Walls
13

3±“32
Thermal Resistance(at framing)
R = .68 Still Air (Inside)
Thermal Resistance(between framing)
R = .68
1/2
3/4"
R- .45 Gypsum Board
(Extruded
R = .45
R = 3.75 Sl >'r0,00mpolystyrene)
R=J75
2”x4 Wood Stud 16 O.C.
Fiberglass Batt-TypeInsulation
Foil Faced
R= II.BO
HeatCapocity
Surface0.230.78
0.54
.03
0.04
3/4“ 1
t I
R= 3.75 Styrofoam (Extrudedpolystyrene)
R= 3.75 .03
1/2"( R = .45 Gypsum Board R= .45 0.54
|
~r R= .68 Still Air R= .68Surface as
=JJc = 0
Rs = 14.11 Rj =21.56 ^=l- 18 Btu/ft Z »F
Area = 20% Area = 80% (24.2 KJ/m2oC)
14.11 21.56= .05128 Btu/ft 2hr°F
(.2910 W/m2o C
)
Rflv
. = TT- = l 9 - 50 ft^hrOF/BtuAV U
AV (3.434 m2o C/W)
Note : Although the studs are 16" from center to center, in calculating
R values, they are assumed to occupy 20% of the wall area in order
to compensate for multidirectional heat flow and because of the
additional studs used around doors, in corners, and as top and
bottom pi ates
.
Figure 8. Cross Section of the Inside Partition Wall
14

Thermal Resistance(at framing)
Thermal Resistance Heat
(between framing) Capacity
Surfaceas
“ 0,23c - 0.78
R s = 10.43•
Area = 20%
Rj = 17.88mJP s1.15 Btu/ft2°F
Area =80%A
^3.5KJ/m2*C)
UAV
=10.43
+.8
17.88= .06392 Btu/ft
2hr°F
(.3629 W/m2oc)
r = _L = 16-65 ft2 hr°F/Btu
AV UAV (2.755 rrr°C/W
)
Figure 9. Cross Section of the North Wall
15
Section AA
Figure 10. Plan and Section View of the North Wall(Cell #1 and #3 are reversed)
16
Thermal Resistance(at framing)
Thermal Resistance(between framing)
HeatCapacity . 0 23Surface e = 0.78
Rs= 7.05 Rj =14. 50 ^=1.54 Btu/ft 2 °F
Areo = 20% Area =80% A(31.5 KJ/m2°C)
— = .083614.50
(.475
Btu/ft 2hr°FW/m2o C)
rp- « 11.96 ft 2hr°F/BtuUAV (2. 110 m2oC/W)
Figure 11. Cross Section of the Opaque Portion of Upper South Wall
17
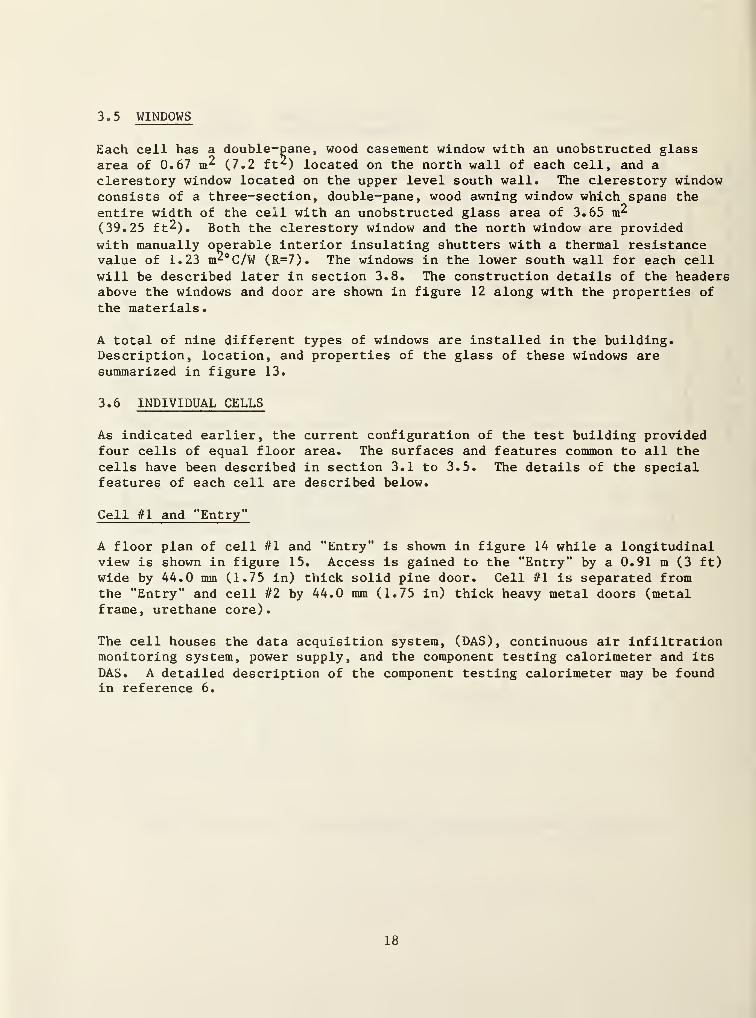
3.5 WINDOWS
Each cell has a double-pane, wood casement window with an unobstructed glassarea of 0.67 m^ (7.2 ft^) located on the north wall of each cell, and a
clerestory window located on the upper level south wall. The clerestory windowconsists of a three-section, double-pane, wood awning window which spans the
entire width of the cell with an unobstructed glass area of 3.65(39.25 ft^). Both the clerestory window and the north window are provided
with manually operable interior insulating shutters with a thermal resistancevalue of 1.23 m^°C/W (R=7). The windows in the lower south wall for each cell
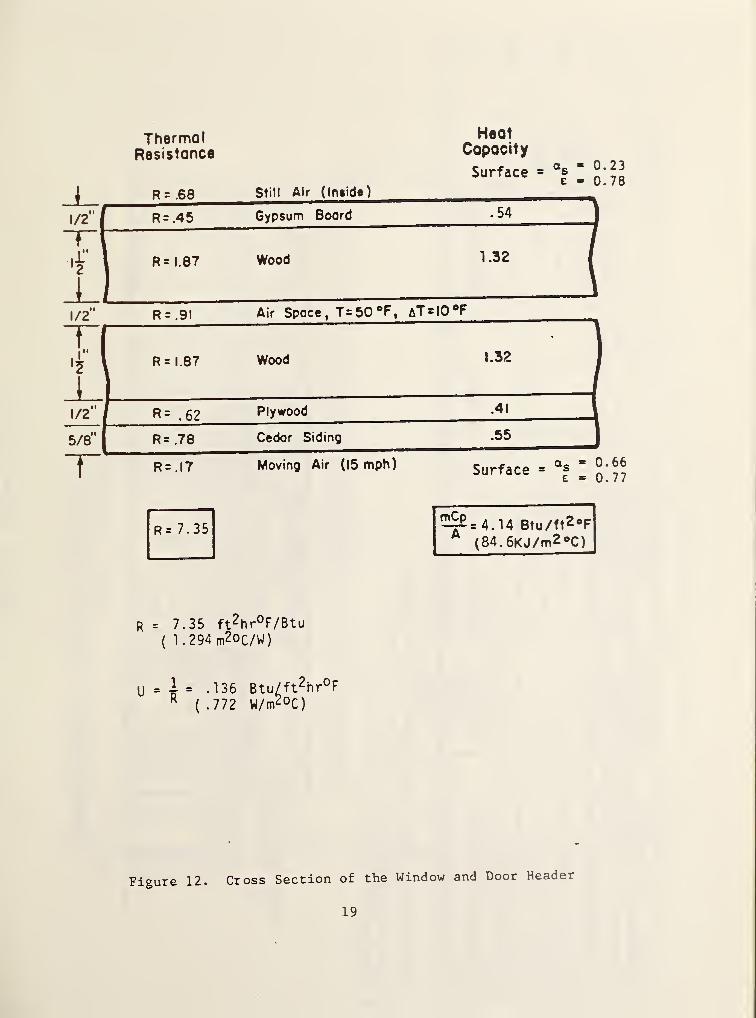
will be described later in section 3.8. The construction details of the headersabove the windows and door are shown in figure 12 along with the properties of
the materials.
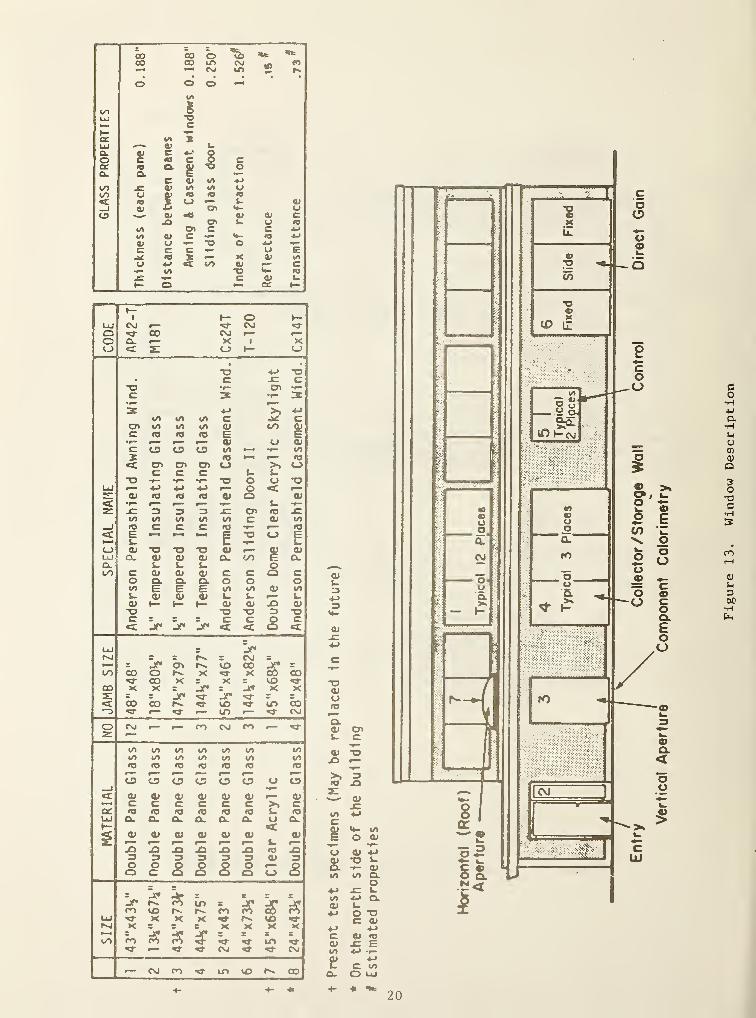
A total of nine different types of windows are installed in the building.Description, location, and properties of the glass of these windows aresummarized in figure 13.
3.6 INDIVIDUAL CELLS
As indicated earlier, the current configuration of the test building providedfour cells of equal floor area. The surfaces and features common to all thecells have been described in section 3.1 to 3.5. The details of the specialfeatures of each cell are described below.
Cell #1 and "Entry”
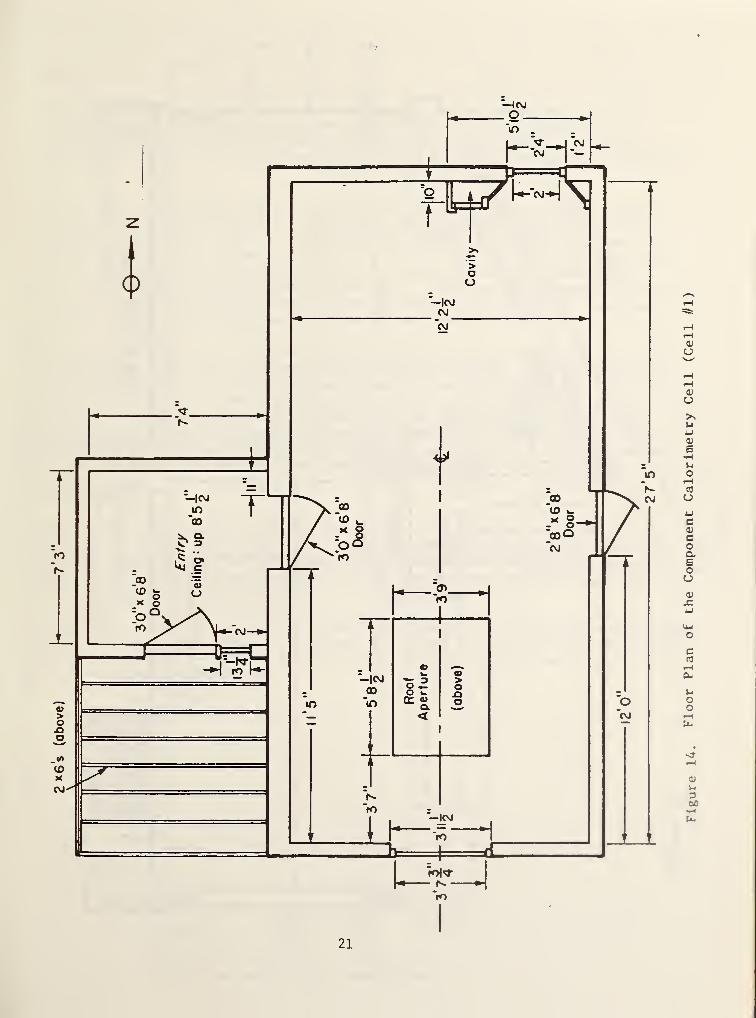
A floor plan of cell it l and "Entry" is shown in figure 14 while a longitudinalview is shown in figure 15. Access is gained to the "Entry" by a 0.91 m (3 ft)
wide by 44.0 mm (1.75 in) thick solid pine door. Cell #1 is separated fromthe "Entry" and cell it2 by 44.0 mm (1.75 in) thick heavy metal doors (metalframe, urethane core).
The cell houses the data acquisition system, (DAS), continuous air infiltrationmonitoring system, power supply, and the component testing calorimeter and its
DAS. A detailed description of the component testing calorimeter may be foundin reference 6.
18
ThermalResistance
HeatCapacity
Surface _ a
Still Air (Inside)
0.230.78
1/2"j
R = .45 Gypsum Board .54 ]
/if 1
|
1 R= 1.87 Wood 1.32 I
1/2" R = .91 Air Space,T= 50 ®F, aT = u.oO
t 1
f 1
|
R = 1.87 Wood 1.32 1
1/2"1 R= .62 Plywood .41 \
5/8"j
R= .78 Cedar Siding .55 |
T TO ii ^4 Moving Air (15 mph) Surface = Qs=
^E = 0
R= 7.35 ^=4.14 Btu/ft2°F
(84.6KJ/m2°C)
R = 7.35 ft 2 hr°F/Btu
(1.294 m2oC/W )
U r
\ = 136 Btu/ft 2hr°FK
(• 772 W/m2o C)
Figure 12. Cross Section of the Window and Door Header
19
1
*7 t— o t-UJ CM r— CMo O' CO CM r— p-==
o Q_ Cr—
“
X 8 XC_> <=c z c_> h- C_5
•o 4_» O• E .c: c
X> •>{=> e?i •p—
e «>*=» 3•p— e*=»
3 x>CO CO CO E E
cn CO CO CO eu uo &e to <o f© E E‘f= r— p=- F=— QJ u eue o o CO CO lc-=3 05=- CO
2 f0 re< cn a> cn o >» 0c E E U E
"O «*=> •f— =S o u “OUJ p=° x» X> •M r*— o c ff=“!*~ oj «e <o ra ai o a»«c •r- (F*~ e*=* •v=* s_z x 3 3 3 Cr> <© X
co CO CO CO CO E &> CO«=J re E c e •v— p— fa
«s E *—fl 13 (_>—*1 <u 1C «V=> uc_> 0) "O "O a <u C=— <y ai
I U! CL ej O) ej a. fjo E ClCL e E E 0to E ft> a) QJ c E 0 E
o CL CL Q. Q O Oco E E E CO CO QJ COe 0) 0J cu E t. e=-= EQJ t— If- i— a» a> XI QJ•o "O -a 3 oE z ” S c E 0 E<£ jf* _>r JT* <t C 0 <
UJ . jf*f"vl S z S CM r—
>
r j
f
o> r~- V£> co zco CO o X X CO
CO X z X COco X X z jr* X Xz: z s jr or z zc 00 oo UD LO coz> *
—
in *— CM
o CNJ m CM CO <2^-
z
—
CO CO CO CO CO CO COCO CO CO CO CO CO COH3 tO to to rer— r~ f— r—
•
r— #—* r—co o CJ o o 0 u 0o> a» a* <y 0) 0) C— QJ
t
—
9 E c E E E E >, Eat KS re <© «© «o E «5UJ CL a. CL CL CL CL O Cl*— «E
a* ai cj &J &» QJp~ r~ {<—*> E P=*»
xs X5 xs XI x> «© X3 3 3 3 3 3 0) 3O O S O £ 0 r*-=> OQ c o 0 u O
>n r«v
co5?r-'-
U">r- fo ^ k k
UJ X X X KT «xCM K r r e X X X XOO co s 3 £ ir Lft <^r
r- *sf CsJ CM....
•— CM ro <*3* LH cO CO
4-» *->
c a* »oeu xr Eui •<->
o> *->
C c */>
CL O UJ
+- * +-**=20
Figure
13.
Window
Description
2*6$
(above)
JCM
21
Figure
14.
Floor
Plan
of
the
Component
Calorimetry
Cell
(Cell
//
1
)
22
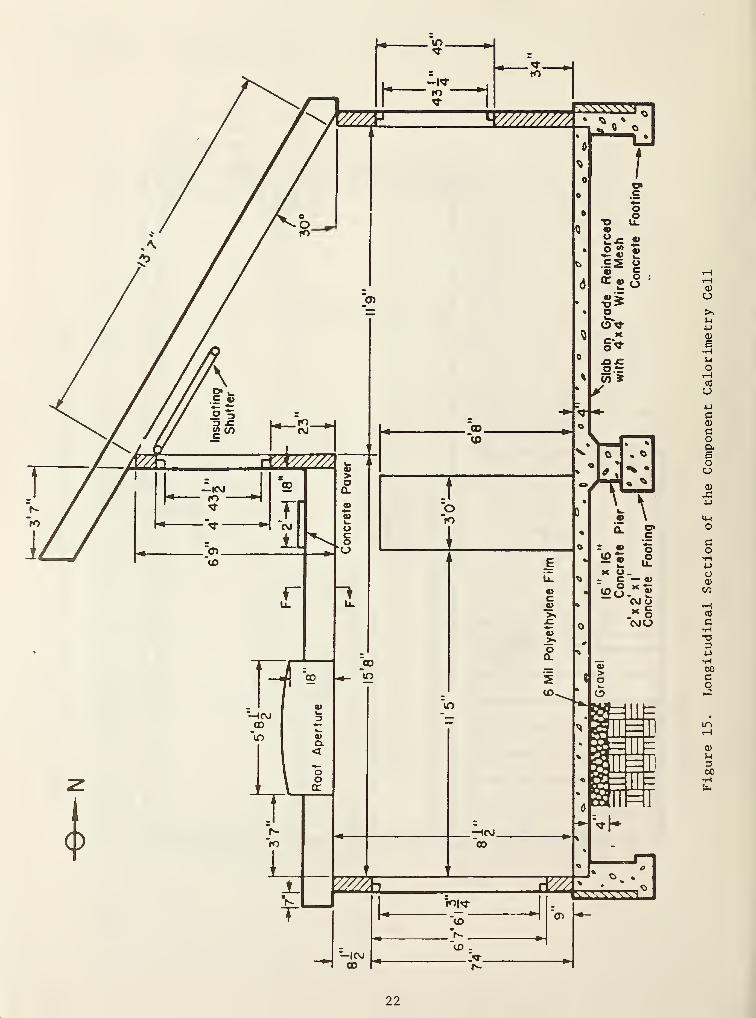
Figure
15.
Longitudinal
Section
of
the
Component
Calorimetry
Cell
Cell it!
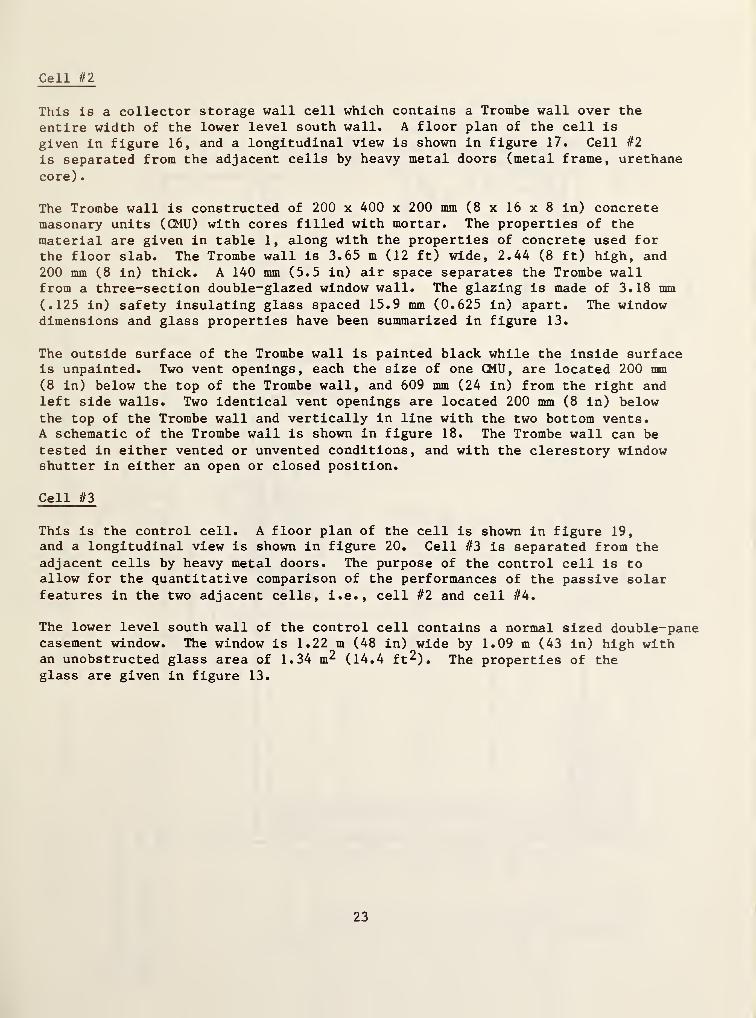
This is a collector storage wall cell which contains a Trombe wall over the
entire width of the lower level south wall. A floor plan of the cell is
given in figure 16, and a longitudinal view is shown in figure 17. Cell it 2
is separated from the adjacent cells by heavy metal doors (metal frame, urethane
core)
.
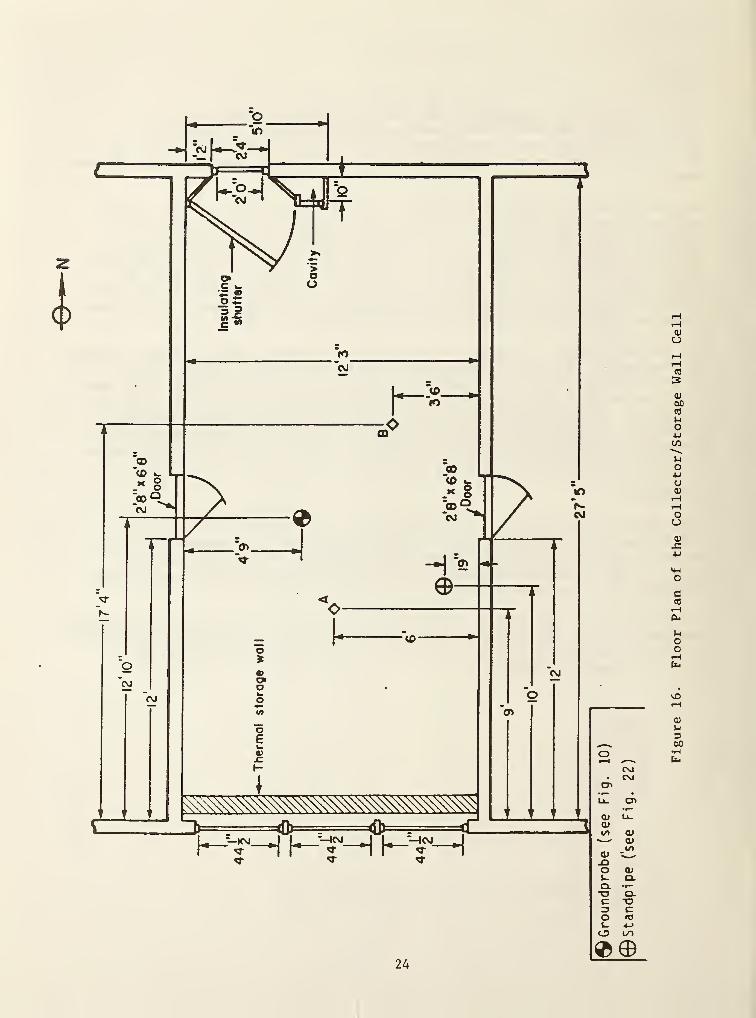
The Trombe wall is constructed of 200 x 400 x 200 mm (8 x 16 x 8 in) concretemasonary units (CMU) with cores filled with mortar. The properties of the
material are given in table 1, along with the properties of concrete used forthe floor slab. The Trombe wall is 3.65 m (12 ft) wide, 2.44 (8 ft) high, and
200 mm (8 in) thick. A 140 mm (5.5 in) air space separates the Trombe wallfrom a three-section double-glazed window wall. The glazing is made of 3.18 mm(.125 in) safety insulating glass spaced 15.9 mm (0.625 in) apart. The windowdimensions and glass properties have been summarized in figure 13.
The outside surface of the Trombe wall is painted black while the inside surfaceis unpainted. Two vent openings, each the size of one CMU, are located 200 mm(8 in) below the top of the Trombe wall, and 609 mm (24 in) from the right andleft side walls. Two identical vent openings are located 200 mm (8 in) belowthe top of the Trombe wall and vertically in line with the two bottom vents.A schematic of the Trombe wall is shown in figure 18. The Trombe wall can be
tested in either vented or unvented conditions, and with the clerestory windowshutter in either an open or closed position.
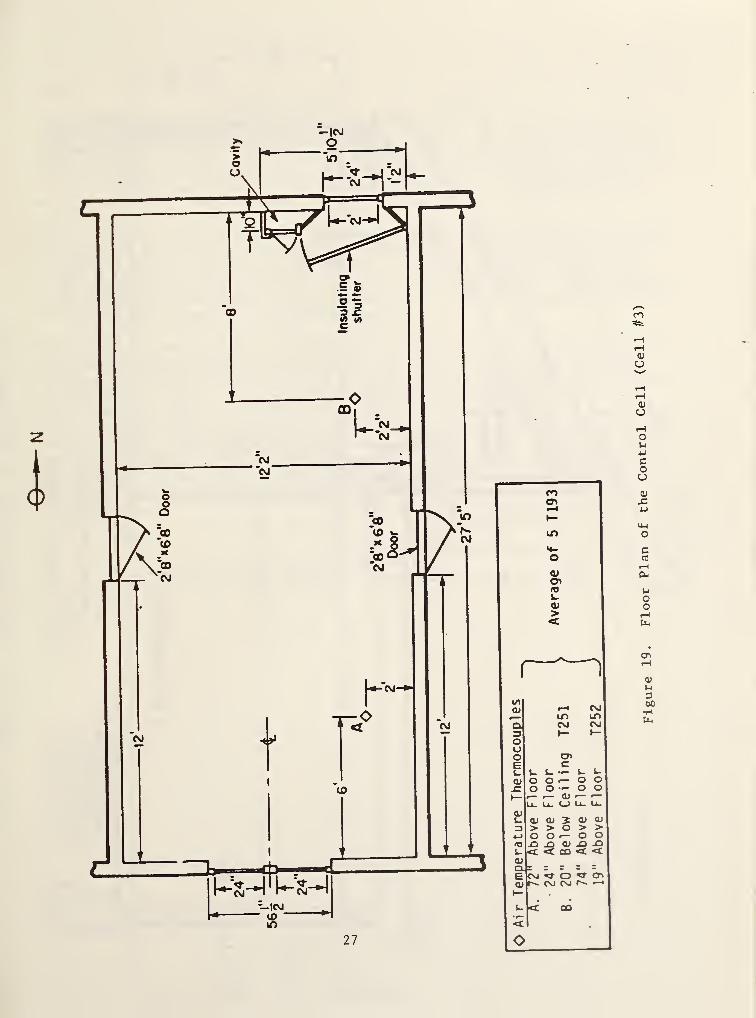
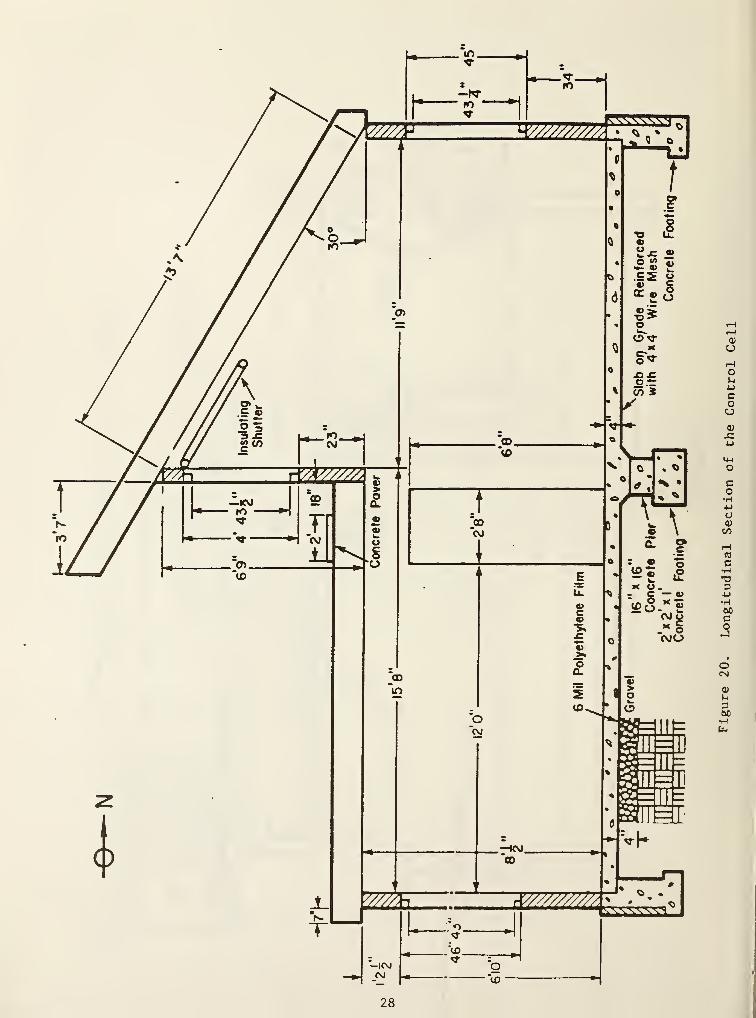
Cell it 3
This is the control cell. A floor plan of the cell is shown in figure 19,and a longitudinal view is shown in figure 20. Cell #3 is separated from theadjacent cells by heavy metal doors. The purpose of the control cell is toallow for the quantitative comparison of the performances of the passive solarfeatures in the two adjacent cells, i.e., cell it2 and cell it4.
The lower level south wall of the control cell contains a normal sized double-panecasement window. The window is 1.22 m (48 in) wide by 1.09 m (43 in) high withan unobstructed glass area of 1.34 m^ (14.4 ft^). The properties of theglass are given in figure 13.
23
24
Figure
16.
Floor
Plan
of
the
Collector/Storage
Wall
Cell

25
Longitudinal
Section
of
the
Collector/Storage
Wall
Cell
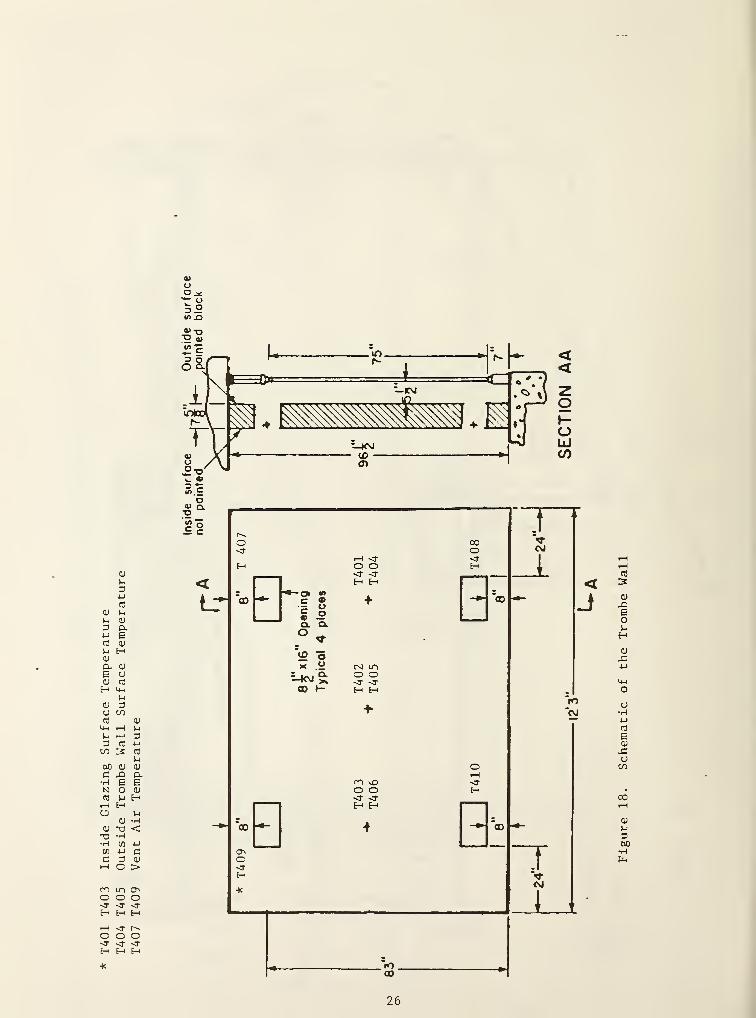
T401
T403
Inside
Glazing
Surface
Temperature
T404
T405
Outside
Trombe
Wall
Surface
Temperature
T407
T409
Vent
Air
Temperature
-K
OPOo_*T* uD 2ifi JD
26
Figure
18.
Schematic
of
the
Trombe
Wall
-ICNJ
Figure
19.
Floor
Plan
of
the
Control
Cell
(Cell
#3)
28
Figure
20.
Longitudinal
Section
of
the
Control
Cell
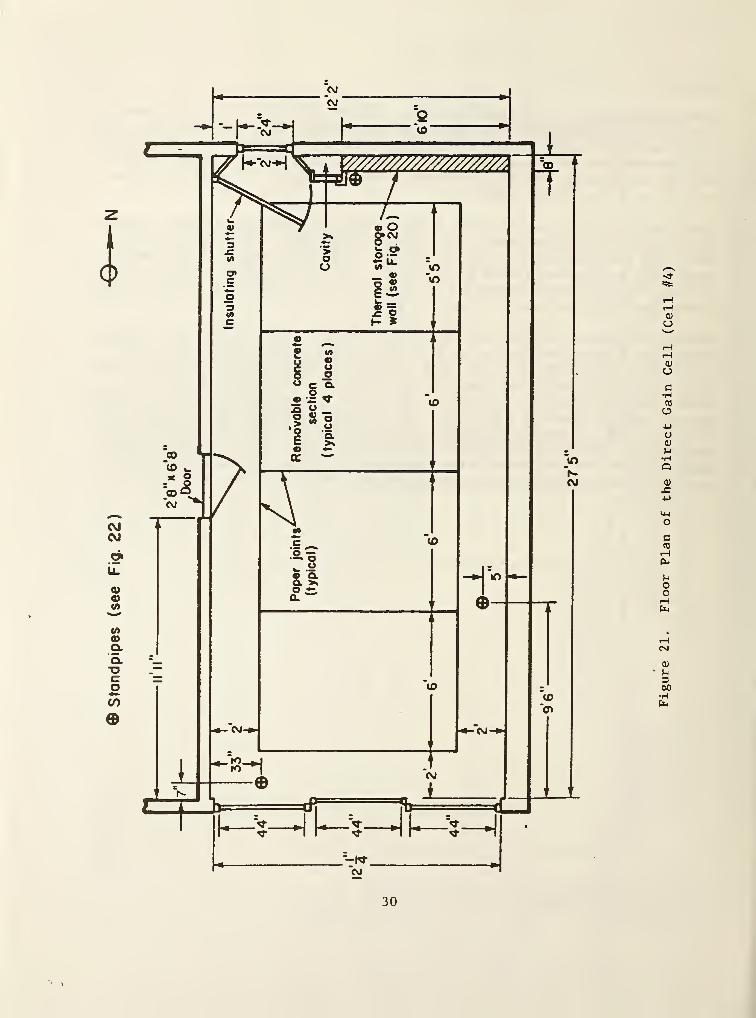
Cell //4
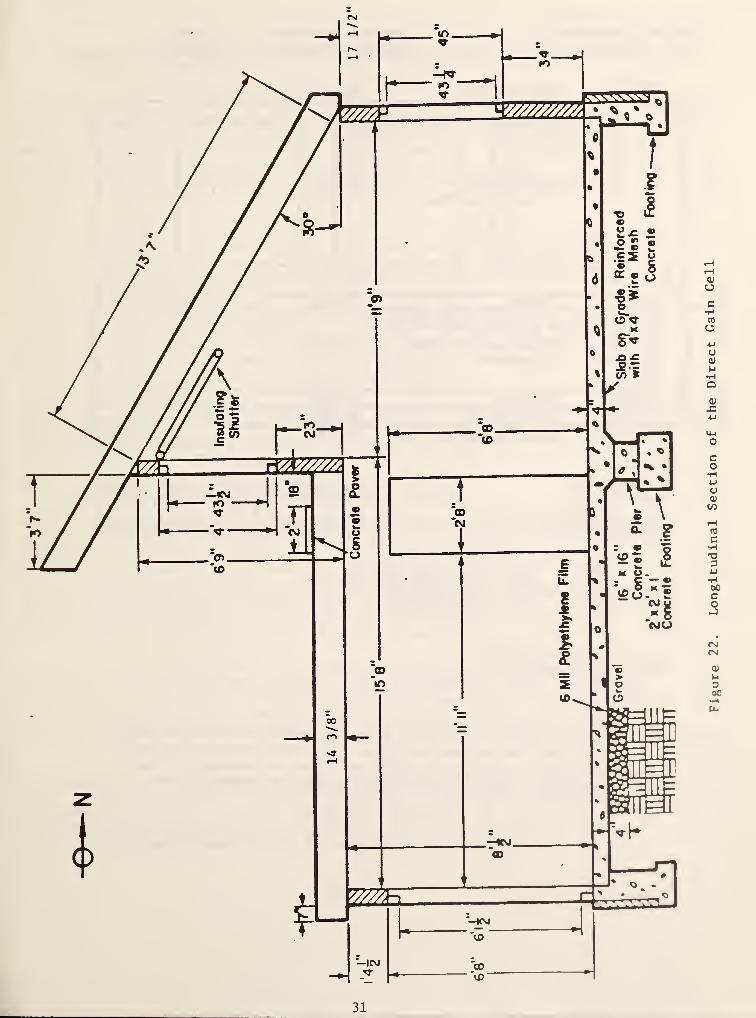
This is a direct gain fenestration cell. A floor plan of the cell is shown infigure 21, and a longitudinal view is shown in figure 22. Note that there are
four removable concrete floor sections bordered with paper joints. The purposeof these sections is to allow for the future addition of an underground rock
storage or any other configuration modifications. Cell #4 is separated fromcell #3 by a heavy metal door.
The direct gain fenestration is a double-pane wood sliding glass door coveringthe entire width of the lower south wall. The sliding glass door consists of
two fixed sections and one sliding section. All three sections are of equalarea. The total unobstructed glass area is 6.27 (67.53 ft^). The propertiesof the glass have been summarized in figure 13. As indicated earlier the upperlevel south wall contains a clerestory window.
Besides the thermal storage provided by the concrete floor, this cell containsadditional thermal storage in the form of a 2.08 m (6.83 ft) wide by 2.46 m(8.08 ft) high by 200 mm (8 in) thick concrete masonary unit (CMU) wall locatedinside the north wall. The cores of the CMU's are filled with mortar, thesame material as used for Trombe wall in cell #2. A section view of the thermalstorage wall is shown in figure 23. The surfaces of the thermal storage wallare unpainted. A description of the direct gain cell, i.e., cell #4, is alsoavailable in reference 7. However, references 1 and 5 do not contain any inf ormation on the new data acquisition system, air infiltration monitoring system,and the sensors installed in cells #2, #3, and #4 in FY83 and FY84.
29
©Standpipes
(see
Fig.
22)
30
Figure
21.
Floor
Plan
of
the
Direct
Gain
Cell
(Cell
#4)
Csl
31
Figure
22.
Longitudinal
Section
of
the
Direct
Gain
Cell
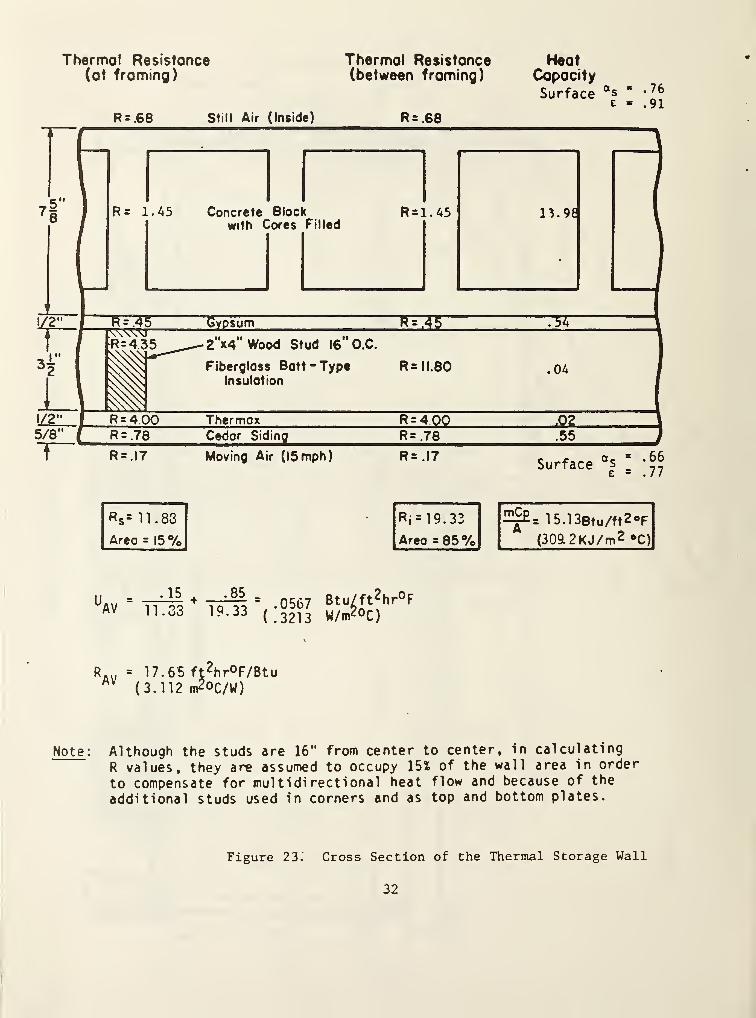
Thermal Resistance(at froming)
Thermal Resistance(between framing)
R = .68 Still Air (Inside) R=.68
HeatCapacity
Surface a s * 76t *= .91
R s = 11.83
Area = 15%Rj = 1 9. 32 15.13eiu/f|2»F
Area = 85% (309L2KJ/m 2 °C)
11.33
.85 .
19.33"
, .0567( .3213
Btu/ft2hr°FW/nr°C)
= 17.65 ft 2hr°F/BtuAV
(3.112 m^oc/W)
Note : Although the studs are 16" from center to center, in calculating
R values, they are assumed to occupy 15% of the wall area in order
to compensate for multidirectional heat flow and because of the
additional studs used in corners and as top and bottom plates.
Figure 23. Cross Section of the Thermal Storage Wall
32
3.7 MATERIALS PROPERTIES AND HEAT LOSS COEFFICIENTS OF THE TEST CELLS
Properties of various building materials are summarized in table 2 and 3. These
properties, when not measured, are taken from the ASHRAE Handbook of Fundamen-
tals, 1981. Although the values of thermal resistance and heat capacity are
given to two decimal places it should be noted that this degree of accuracy is
not necessarily known. In fact, the material properties can vary with ambient
temperature and humidity, as well as with the age of the products. Also thereis an uncertainty in the fraction of the wall area that is occupied by wood
framing (see the note at the bottom of figures 7, 8, and 23.
In determining a total R-value for the wall, a thermal resistance of .03 m^°C/W(.17 ft^hr°F/Btu) was chosen for "moving air" on the outside wall surfaces.This corresponds to a wind speed of 24 km/h suggested by ASHRAE for wintercalculations. (The thermal resistance suggested for summer is .044 correspondingto a wind speed of 12 km/h.) Some users of this manual may want to substitutea different value corresponding to the actual measured wind speed. Another"correction" that some users may want to include is the fact that 12.7 mmplywood was used instead of Thermax sheathing within 1.2 m of all exteriorcorners for structural purposes. (Thus, the R-value of .704 should be replacedby an R-value of 11 for the corners of the building.)
The values of overall heat loss coefficient "UA" for various components orheat transfer surfaces of cells #2, #3, and #4 are estimated by using the ASHRAEsteady-state method and the material properties discussed above. The values of"UA" are presented in table 4.
3.8 HEATING, VENTILATING, AND AIR-CONDITIONING SYSTEM
Auxiliary heating and cooling is provided with a fan coil unit installed ineach cell under the north window. The location of the fan coil unit is shownin figure 10. Heating is provided by a 3.76 kW, 208 V electric heater in thefan coil unit. Cooling is provided by diverting the flow of fluid to thecooling coil of the fan coil unit. The flow of the chiller fluid from thebypass loop is diverted by a solenoid control diverter valve which is actuatedby the cooling thermostat. The chiller fluid, a 50-50 water and propyleneglycol solution, is chilled by a 2.64 kW air cooled chiller.
The space temperature in each cell is controlled by positive off-setting thermo-stats with + 0.5°C deadbands. Each cell has two thermostats, one for coolingand the other for heating. The power supply to the heater and diverter valvecan be cut off if desired. Also the power supply to the heater and the divertervalve is wired via an interlock system so that the auxiliary heating and coolingcannot by supplied simultaneously.
In addition, two destratifying fans are placed near the center of the floor ofcell it4. One fan takes the room air from the floor level and discharges it atthe sloped ceiling level near the clerestory window; and the other fan doesthe reverse. The combined action of the two fans causes the room air to mixand reduce stratification.
33
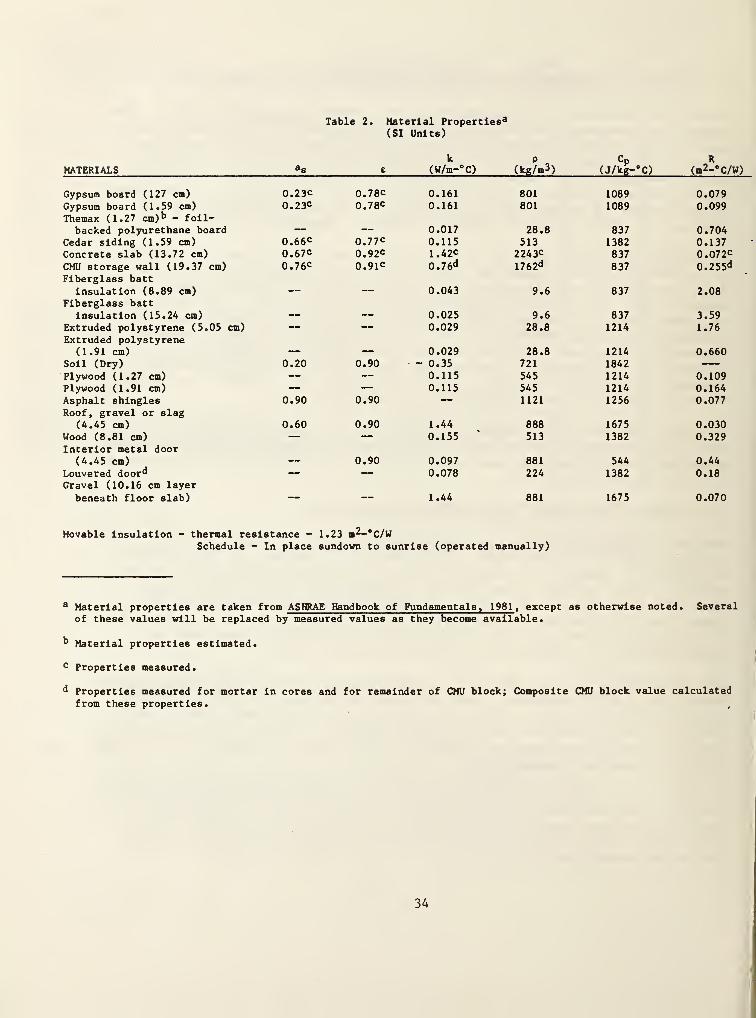
Table 2. Material Properties3
(SI Units)
MATERIALS a8 e
k(W/m-°C) (kg/m3 )
cp(J/kg-°C)
R(m2-°C/W)
Gypsum board (127 cm) 0.23c 0.78 c 0.161 801 1089 0.079Gypsum board (1.59 cm)
Themax (1.27 cm) b - foil-0.23c 0.78c 0.161 801 1089 0.099
backed polyurethane board — — 0.017 28.8 837 0.704Cedar siding (1.59 cm) 0.66c 0.77C 0.115 513 1382 0.137Concrete slab (13.72 cm) 0.67C 0.92c 1.42c 2243c 837 0.072c
CMU storage wall (19.37 cm)
Fiberglass batt0.76c 0.91 c 0.76** 1762** 837 0.255<*
insulation (8.89 cm)
Fiberglass batt
"" 0.043 9.6 837 2.08
insulation (15.24 cm) — — 0.025 9.6 837 3.59Extruded polystyrene (5.05 cm)
Extruded polystyrene0.029 28.8 1214 1.76
(1.91 cm) — — 0.029 28.8 1214 0.660Soil (Dry) 0.20 0.90 ~ 0.35 721 1842 —Plywood (1.27 cm) — — 0.115 545 1214 0.109Plywood (1.91 cm) — — 0.115 545 1214 0.164Asphalt shinglesRoof, gravel or slag
0.90 0.90 1121 1256 0.077
(4.45 cm) 0.60 0.90 1.44 888 1675 0.030Wood (8.81 cm)
Interior metal door
—
—
0.155 513 1382 0.329
(4.45 cm) — 0.90 0.097 881 544 0.44Louvered door**
Gravel (10.16 cm layer
— — 0.078 224 1382 0.18
beneath floor slab) —
Movable insulation - thermal resistance -
Schedule - In place
1.44 881
1.23 m2-°C/Wsundown to sunrise (operated manually)
1675 0.070
3 Material properties are taken from ASHRAE Handbook ofof these values will be replaced by measured values as
Fundamentalsthey become
, 1981, exceptavailable.
as otherwise noted. Several
b Material properties estimated.
c Properties measured.
** Properties measured for mortar in cores and for remainder of CMU block; Composite CMU block value calculatedfrom these properties.
34
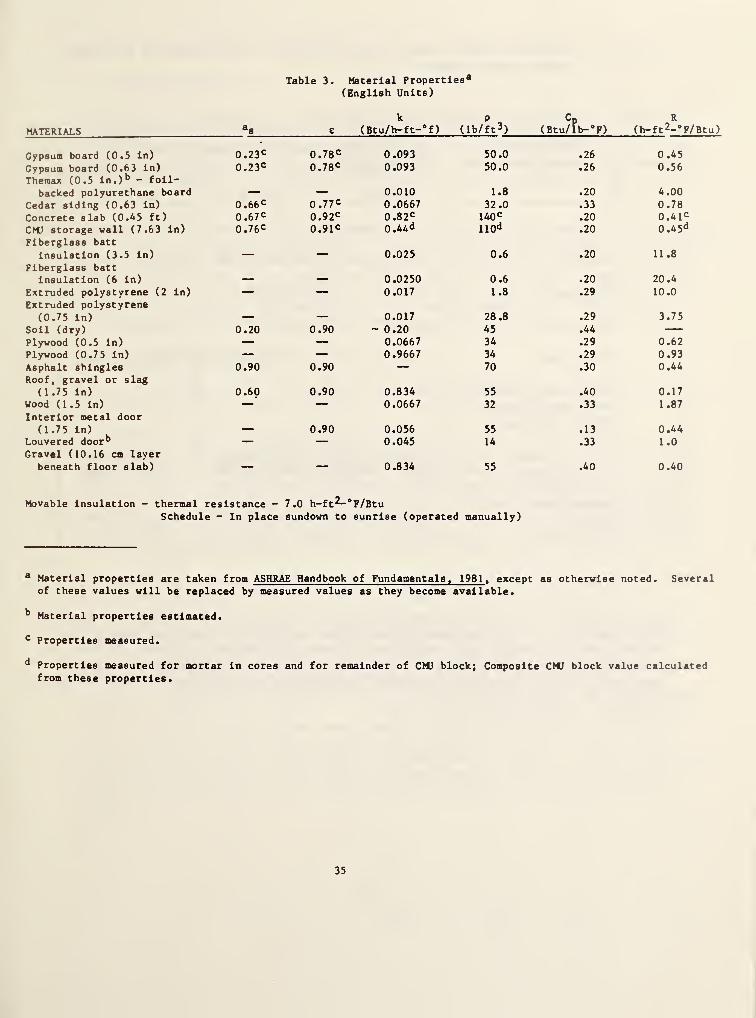
Table 3. Material Properties3
(English Units)
MATERIALS 3s e
k(Btu/h-ft-°f
)
(lb/ft 3) (Btu/fb-'F)
R(h— ft 2-°F/Bti
Gypsum board (0.5 in) 0.23 c 0.78 c 0.093 50.0 .26 0.45
Gypsum board (0.63 In) 0.23c 0.78 c 0.093 50.0 .26 0.56
Themax (0.5 ln.) b - foil-
backed polyurethane board _ 0.010 1.8 .20 4.00
Cedar siding (0.63 in) 0.66 c 0.77 c 0.0667 32.0 .33 0.78
Concrete slab (0.45 ft) 0.67 c 0.92 c 0.82c 140c .20 0 .4 lc
CMJ storage wall (7.63 in) 0.76 c 0.91 c 0.44d 110d .20 0.45d
Fiberglass batt
insulation (3.5 In) 0.025 0.6 .20 11.8
Fiberglass batt
Insulation (6 In) 0.0250 0.6 .20 20.4
Extruded polystyrene (2 In) — — 0.017 1.8 .29 10.0
Extruded polystyrene
(0.75 In) 0.017 28 .8 .29 3.75
Soli (dry) 0.20 0.90 ~ 0.20 45 .44 —Plywood (0.5 In) — — 0.0667 34 .29 0.62
Plywood (0.75 in) — — 0.9667 34 .29 0.93Asphalt shingles 0.90 0.90 — 70 .30 0.44Roof, gravel or slag
(1.75 In) 0.60 0.90 0.834 55 .40 0.17Wood (1.5 In) — — 0.0667 32 .33 1.87
Interior metal door(1.75 in) 0.90 0.056 55 .13 0.44
Louvered door b — — 0.045 14 .33 1.0Gravel (10.16 cm layer
beneath floor slab) 0.834 55 .40 0.40
Movable Insulation - thermal resistance -7.0 h-ft 2-°F/BtuSchedule - In place sundown to sunrise (operated manually)
3 Material properties are taken from ASHRAE Handbook of Fundamentals, 1981 . except as otherwise noted. Severalof these values will be replaced by measured values as they become available.
b Material properties estimated.
c Properties measured.
d Properties measured for mortar In cores and for remainder of CMJ block; Composite CMJ block value calculatedfrom these properties.
35
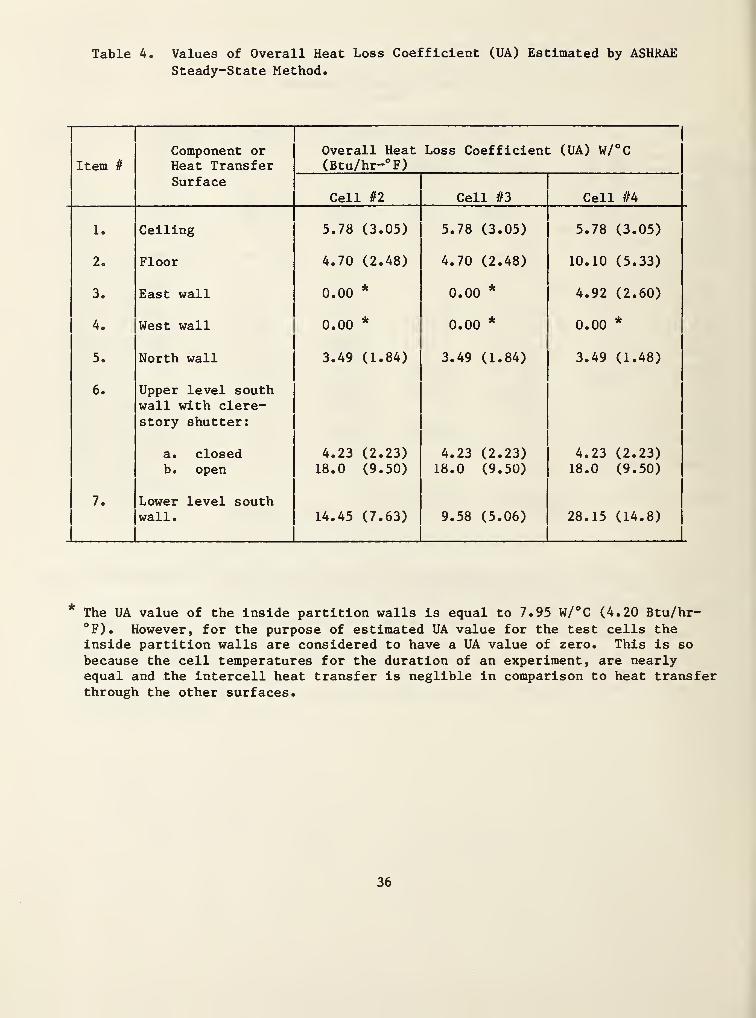
Table 4. Values of Overall Heat Loss Coefficient (UA) Estimated by ASHRAE
Steady-State Method.
Item #
Component orHeat Transfer
Overall Heat(Btu/hr-°F)
Loss Coefficient (UA) W/°C
Surfaceceil n Cell #3 Cell #4
1 . Ceiling 5.78 (3.05) 5.78 (3.05) 5.78 (3.05)
2. Floor 4.70 (2.48) 4.70 (2.48) 10.10 (5.33)
3. East wall 0.00*
0.00*
4.92 (2.60)
4. West wall 0.00 * 0.00 * 0.00 *
5. North wall 3.49 (1.84) 3.49 (1.84) 3.49 (1.48)
6. Upper level southwall with clere-story shutter:
a. closedb. open
4.23 (2.23)18.0 (9.50)
4.23 (2.23)18.0 (9.50)
4.23 (2.23)18.0 (9.50)
7. Lower level southwall. 14.45 (7.63) 9.58 (5.06) 28.15 (14.8)
* The UA value of the inside partition walls is equal to 7.95 W/°C (4.20 Btu/hr-°F). However, for the purpose of estimated UA value for the test cells theinside partition walls are considered to have a UA value of zero. This is so
because the cell temperatures for the duration of an experiment, are nearlyequal and the intercell heat transfer is neglible in comparison to heat transferthrough the other surfaces.
36
4. INSTRUMENTATION
A total of 457 sensors are installed in and around the building. There are 26
sensors outside the building, and 6, 173, 26, and 226, respectively, are in
cell #1, cell #2, cell #3, and cell #4. These include flow meters, heat flux
meters, pyronometers,resistance thermometers, thermocouples, watt-hour meters,
and weather sensors. The general location of these sensors is summarized in
table 5.
The sensors in this handbook are labeled by a letter and a number. The lettersinclude H (radiation), Q (heat flux), R (resistance thermometer), T (temperature),
W (weather), and WH (watt-hour). The number, for the sensors installed priorto FY83, correspond to the sensor in references 1 and 5. The sensors labeled
T267 to T271 in cell #2 in reference 1 have been removed and replaced by newsensors. The sensors labeled T400 to T520 were installed in FY83 and FY84.
The details of the sensor locations are described below.
4.1 OUTSIDE THE BUILDING
There are 4 solar radiation sensors, a ground reflectance sensor, a wind speedand wind direction sensor, and 19 thermocouples outside the building.
A pyronometer (H215) mounted on the lower wall of cell #3, 0.5 m (20 in) fromthe west of cell #4 and 1.2 m (48 in) above ground is used to measure totalradiation on a south vertical surface. Two pyronometers mounted on the upperroof are used to measure sky irradiation (H216) and total horizontal radiation(H217). Ground reflectance is measured by an inverted pyronometer (H218)located about 4 m from the south wall and 5 m (197 in) from the east wall of
the building. Normal beam radiation is measured by a pyrheliometer (H219)mounted on the lower roof.
The wind speed and wind direction is measured by an anemometer and vanesystem located about 61 m (200 ft) southwest of the test building.
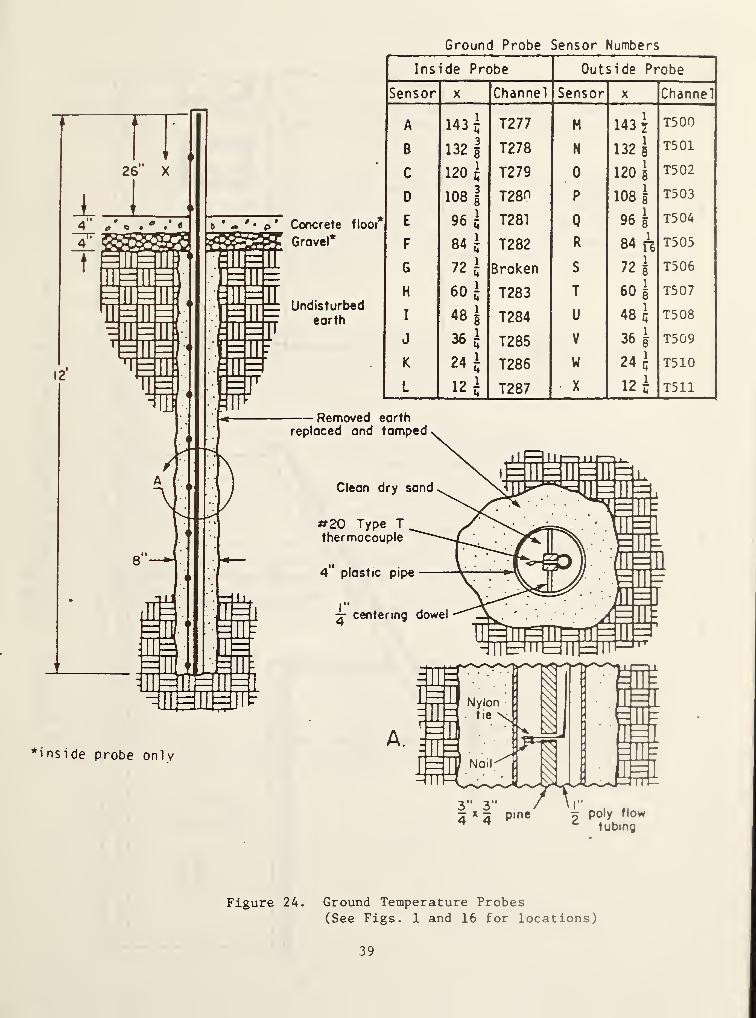
Four mechanically aspirated and shielded thermocouples are used to measure theoutside ambient air temperature. Two of these thermocouples, about 20 mm(.8 in) apart from each other, are about 1.2 m (48 in) above ground and about2.5 m (99 in) south of the test building; the other two thermocouples aresimilarly situated on the north of the building. The location of these thermo-couples is indicated in figure 1. A ground probe containing 12 thermocouplesis used to monitor the ground temperature. The ground probe is located at a
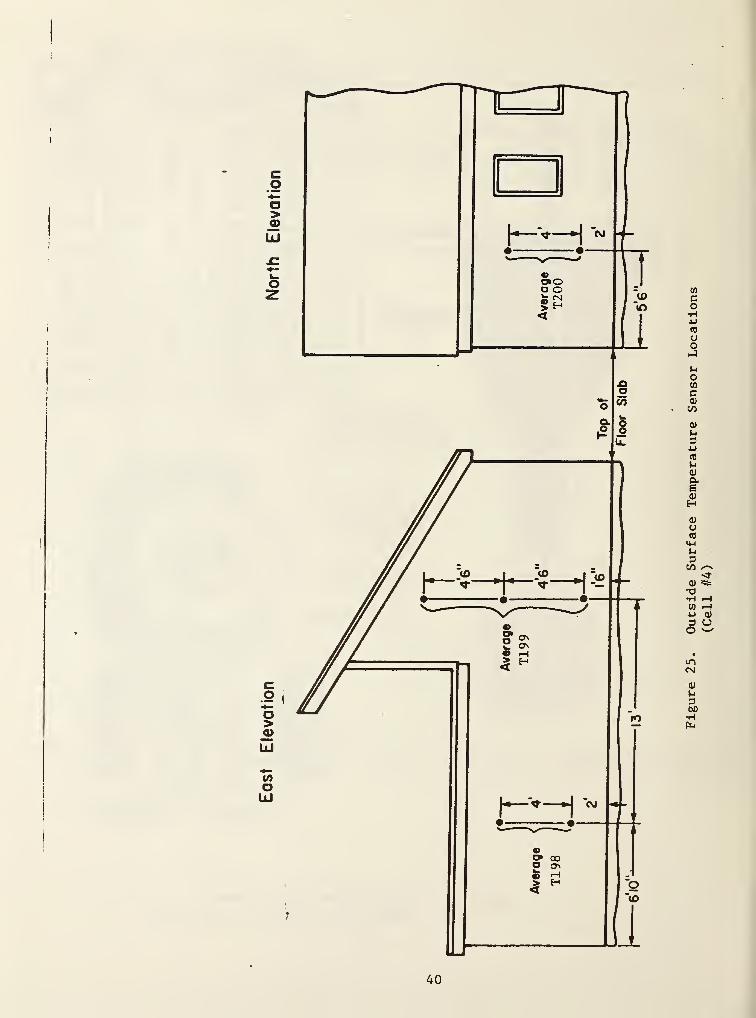
distance of 6.7 m (22 ft) from the northwest corner of the building. Thelocation of the outside ground probe is indicated in figure 1, while the detailsare given in figure 24. The location of the thermocouples for monitoring theoutside surface temperatures of east and north walls of cell #4 are shown infigure 25.
37
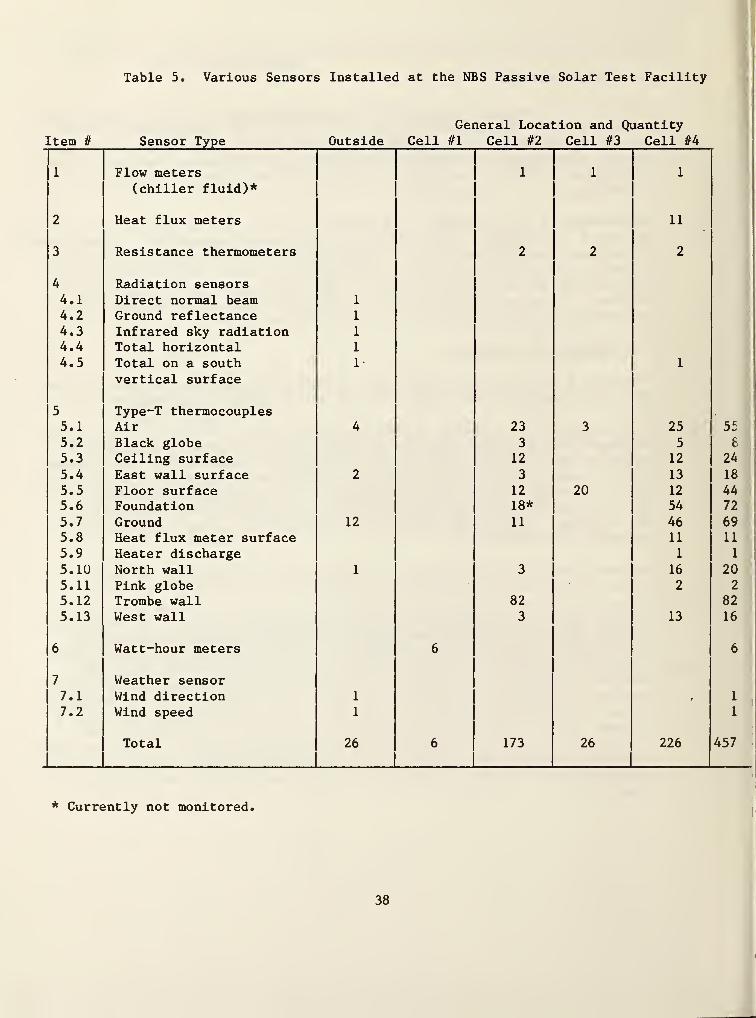
Table 5. Various Sensors Installed at the NBS Passive Solar Test Facility
General Location and QuantityItem it Sensor Type Outside Cell #1 Cell in Cell #3 Cell H
1 Flow meters 1 1 1 ]
(chiller fluid)*
2 Heat flux meters 11
3 Resistance thermometers 2 2 2
4 Radiation sensors4.1 Direct normal beam 1
4.2 Ground reflectance 1
4.3 Infrared sky radiation 1
4.4 Total horizontal 1
4.5 Total on a south 1 1
vertical surface
5 Type-T thermocouples5.1 Air 4 23 3 25 55
5.2 Black globe 3 5 8
5.3 Ceiling surface 12 12 24
5.4 East wall surface 2 3 13 18
5.5 Floor surface 12 20 12 44
5.6 Foundation 18* 54 72
5.7 Ground 12 11 46 695.8 Heat flux meter surface 11 11
5.9 Heater discharge 1 1
5.10 North wall 1 3 16 20
5.11 Pink globe 2 2
5.12 Trombe wall 82 82
5.13 West wall 3 13 16
6 Watt-hour meters 6 6
7 Weather sensor7.1 Wind direction 1 r 1
7.2 Wind speed 1 1
Total 26 6 173 26
J226 457
* Currently not monitored.
38
Ground Probe Sensor Numbers
Gravel*
Undisturbedearth
Inside Probe Outside Probe
Sensor X Channel Sensor X Channel
A 143 l T277 M 143 7T500
B 132 !T278 N 132 8
T501
C 120 l T279 0 120 8T502
D 108 1T28H P 108 g
T503
E 96 J T281 Q 96 §T504
F 84 l T282 R 84 ii T505
G 72 J Broken S 72 §T506
H 60 l T283 T 60 |T507
I 48 | T284 U 48 l T508
J 36 i T285 V 36 J T5G9
K 24 J T286 W 24 J T510
L 12 i T287 • X 12 J T511
Removed earthreplaced and tamped
Clean dry sand
<*20 Type Tthermocouple
4 plastic pipe
qcentering dowel
*1A.
inside probe only
z
1
| |
Nylontie \- —
1
• X 4
-1 ^ - -
n )NoiK
|j|—1
1
1 1 i—
3" 3" / \ I"7*7 pine 5 poly flow* * c
tubing
Figure 24. Ground Temperature Probes(See Figs. 1 and 16 for locations)
39
40
Figure
25.
Outside
Surface
Temperature
Sensor
Locations
(Cell
H)
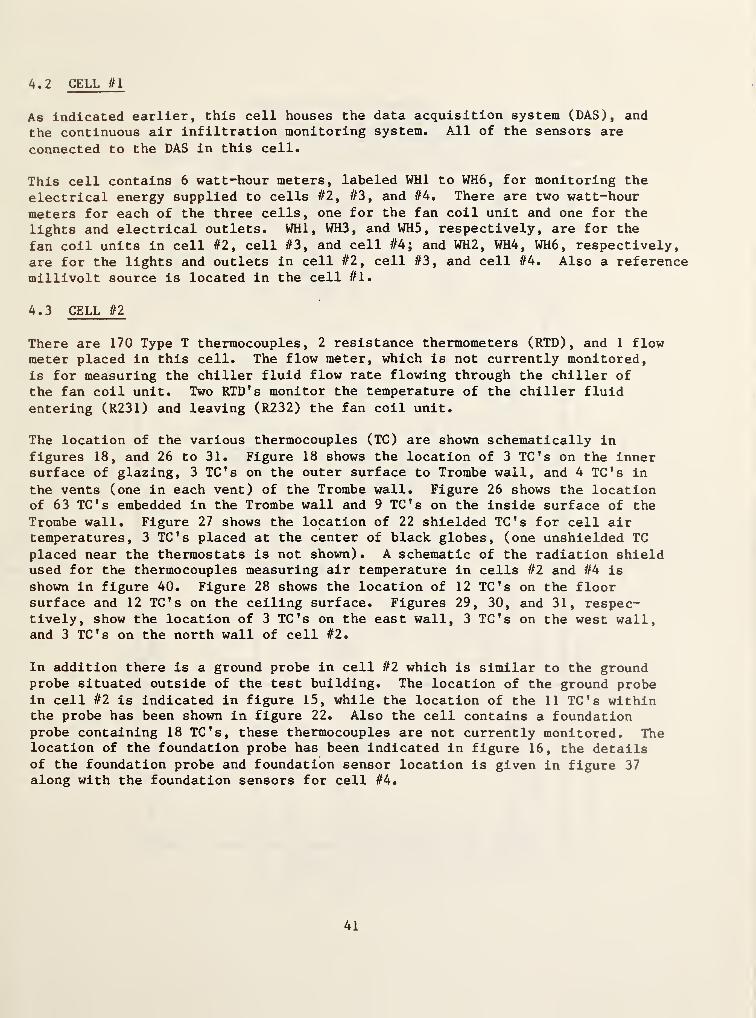
4.2 CELL //I
As indicated earlier, this cell houses the data acquisition system (DAS), and
the continuous air infiltration monitoring system. All of the sensors are
connected to the DAS in this cell.
This cell contains 6 watt-hour meters, labeled WH1 to WH6, for monitoring the
electrical energy supplied to cells #2, #3, and #4. There are two watt-hour
meters for each of the three cells, one for the fan coil unit and one for the
lights and electrical outlets. WHl , WH3, and WH5, respectively, are for the
fan coil units in cell it2, cell #3, and cell it4; and WH2, WH4, WH6, respectively,are for the lights and outlets in cell it2, cell It3, and cell it4. Also a referencemillivolt source is located in the cell it 1.
4.3 CELL it2
There are 170 Type T thermocouples, 2 resistance thermometers (RTD), and 1 flowmeter placed in this cell. The flow meter, which is not currently monitored,is for measuring the chiller fluid flow rate flowing through the chiller of
the fan coil unit. Two RTD's monitor the temperature of the chiller fluidentering (R231) and leaving (R232) the fan coil unit.
The location of the various thermocouples (TC) are shown schematically in
figures 18, and 26 to 31. Figure 18 shows the location of 3 TC's on the innersurface of glazing, 3 TC's on the outer surface to Trombe wall, and 4 TC's in
the vents (one in each vent) of the Trombe wall. Figure 26 shows the locationof 63 TC's embedded in the Trombe wall and 9 TC's on the inside surface of the
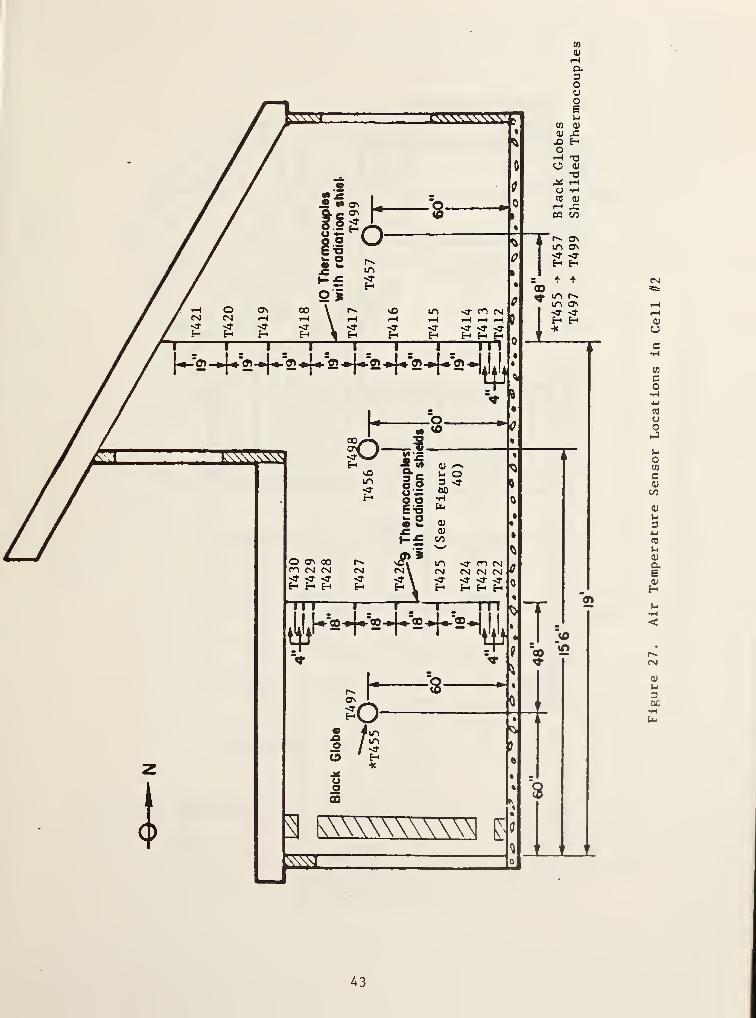
Trombe wall. Figure 27 shows the location of 22 shielded TC's for cell airtemperatures, 3 TC's placed at the center of black globes, (one unshielded TC
placed near the thermostats is not shown). A schematic of the radiation shieldused for the thermocouples measuring air temperature in cells itl and it4 is
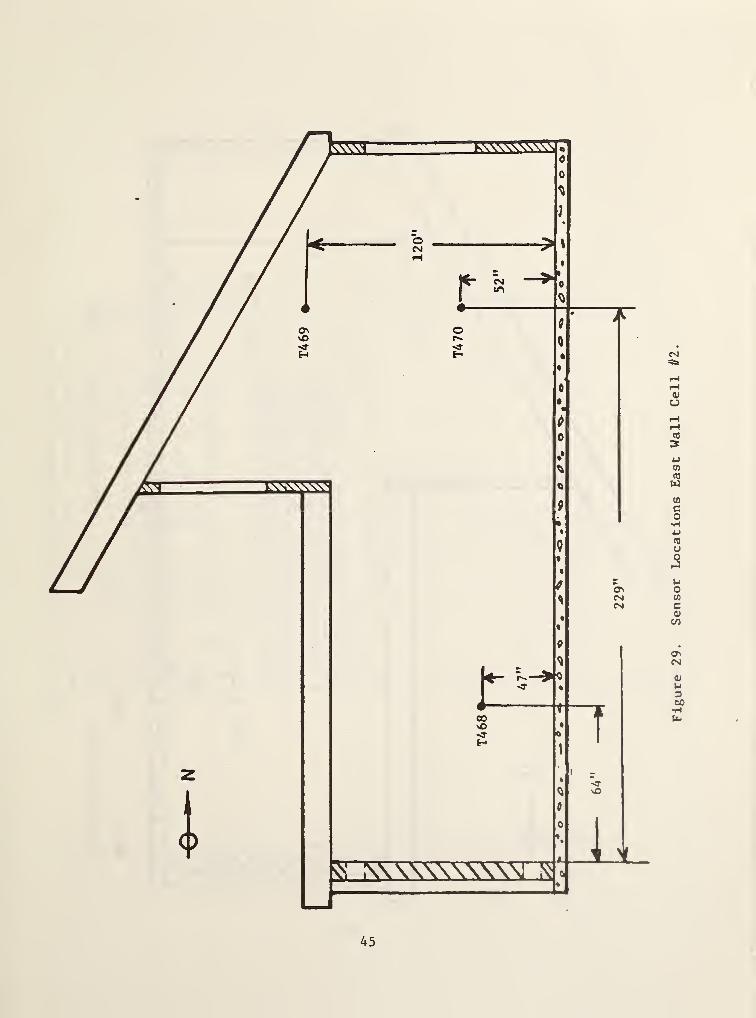
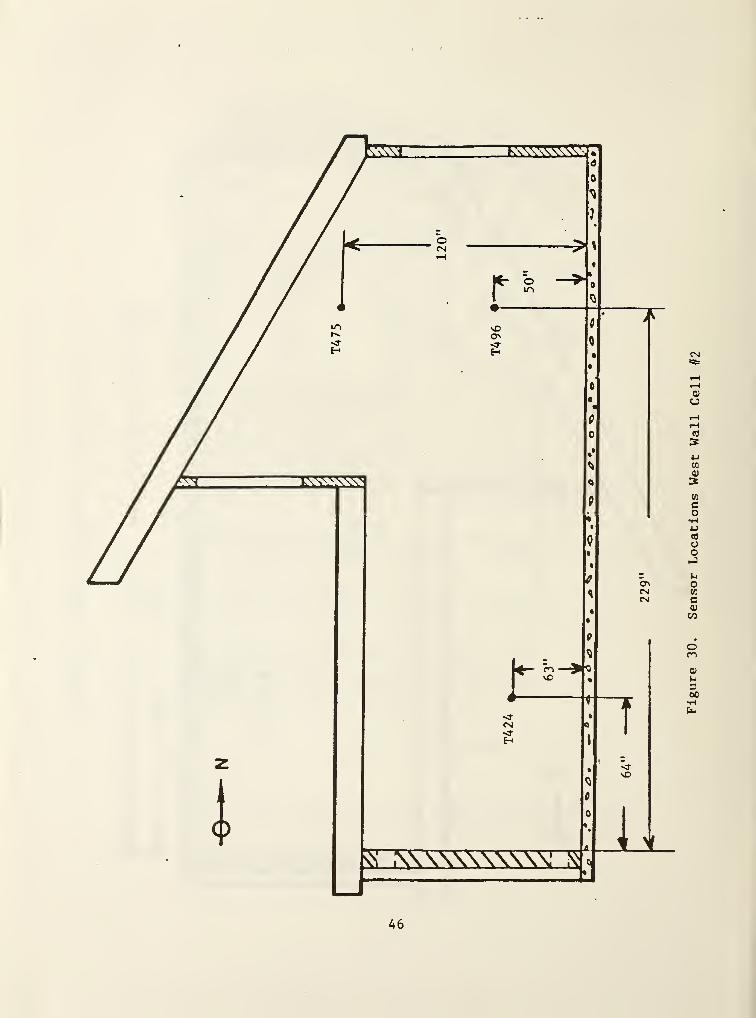
shown in figure 40. Figure 28 shows the location of 12 TC's on the floorsurface and 12 TC's on the ceiling surface. Figures 29, 30, and 31, respec-tively, show the location of 3 TC's on the east wall, 3 TC's on the west wall,and 3 TC's on the north wall of cell it2.
In addition there is a ground probe in cell it
2
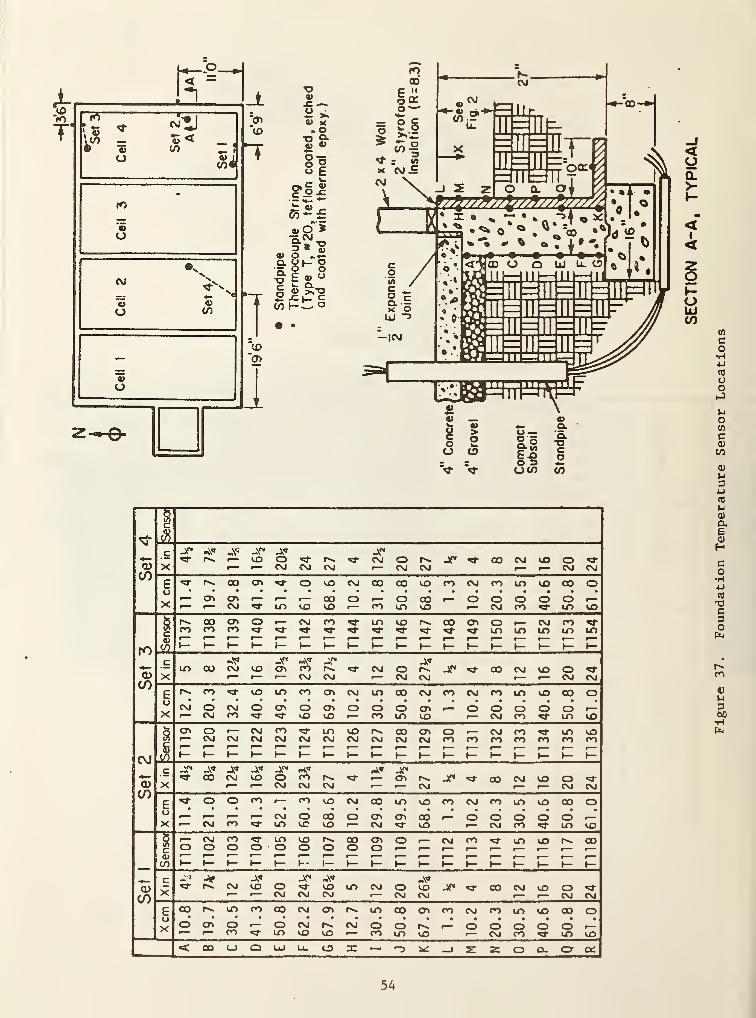
which is similar to the groundprobe situated outside of the test building. The location of the ground probein cell itl is indicated in figure 15, while the location of the 11 TC's withinthe probe has been shown in figure 22. Also the cell contains a foundationprobe containing 18 TC's, these thermocouples are not currently monitored. Thelocation of the foundation probe has been indicated in figure 16, the detailsof the foundation probe and foundation sensor location is given in figure 37along with the foundation sensors for cell #4.
41
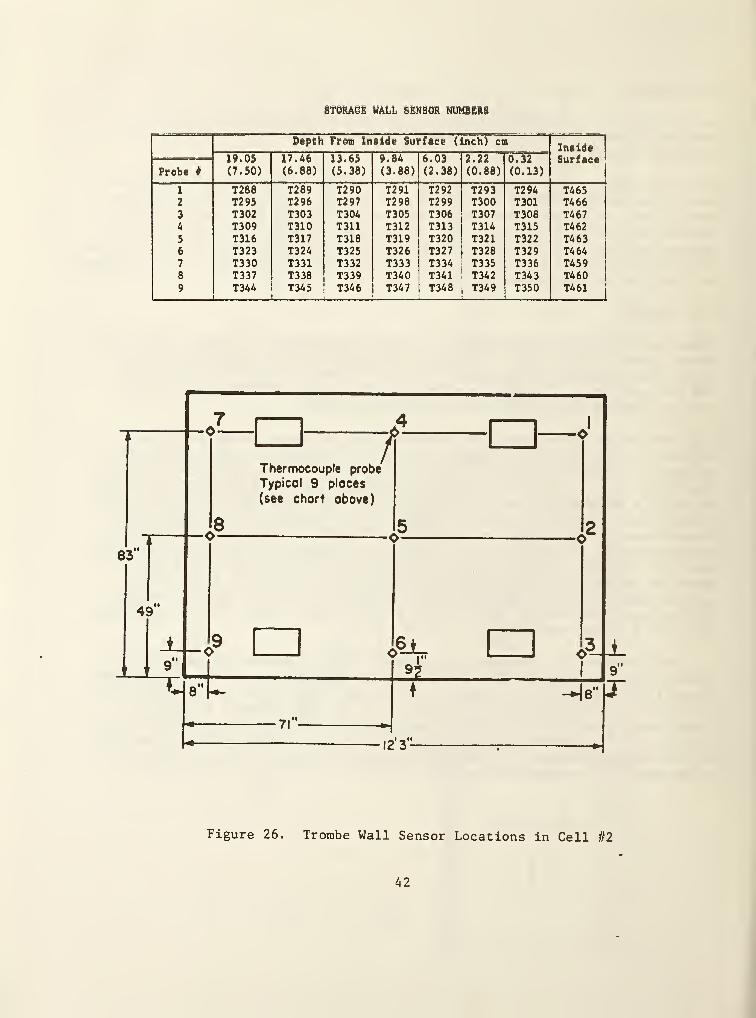
STORAGE MALL SENSOR NUMBERS
Depth From Inside Surface (inch) cmInsideSurface
Probe #
19.05(7.50)
17.46(6.88)
13.65(5.38)
9.84
(3.88)
6.03(2.38)
2.22
(0.88)
0.32
(0.13)
1 T288 T289 T290 T291 T292 T293 T294 T4652 T295 T296 T297 T298 T299 T300 T301 T4663 T302 T303 T304 T305 T306 T307 T308 T4674 T309 T310 T311 T312 T313 T314 T315 T4625 T316 T317 T318 T319 T320 T321 T322 T4636 T323 T324 T325 T326 T327 T328 T329 T4647 T330 T331 T332 T333 T334 T335 T336 T4598 T337 T338 T339 T340 T341 T342 T343 T4609 T344 T345
LT346
L- — -T347 T348 T349 T350 T461
1
81
1
Thermocouple probe
Typicol 9 places
(see chort above)
r a
49
,6±_
I"
-^ 8"
•71’
123
Figure 26. Trorabe Wall Sensor Locations in Cell #2
42
w0)
1—1
o-3oCJ
CN
<y
u
co
co
«0
oohJ
uoCO
c0)
00
0)
u34-1
to
J-l
0)
c.eHVJ•H<
CNI
01
u3oc
-»-»
U-
43
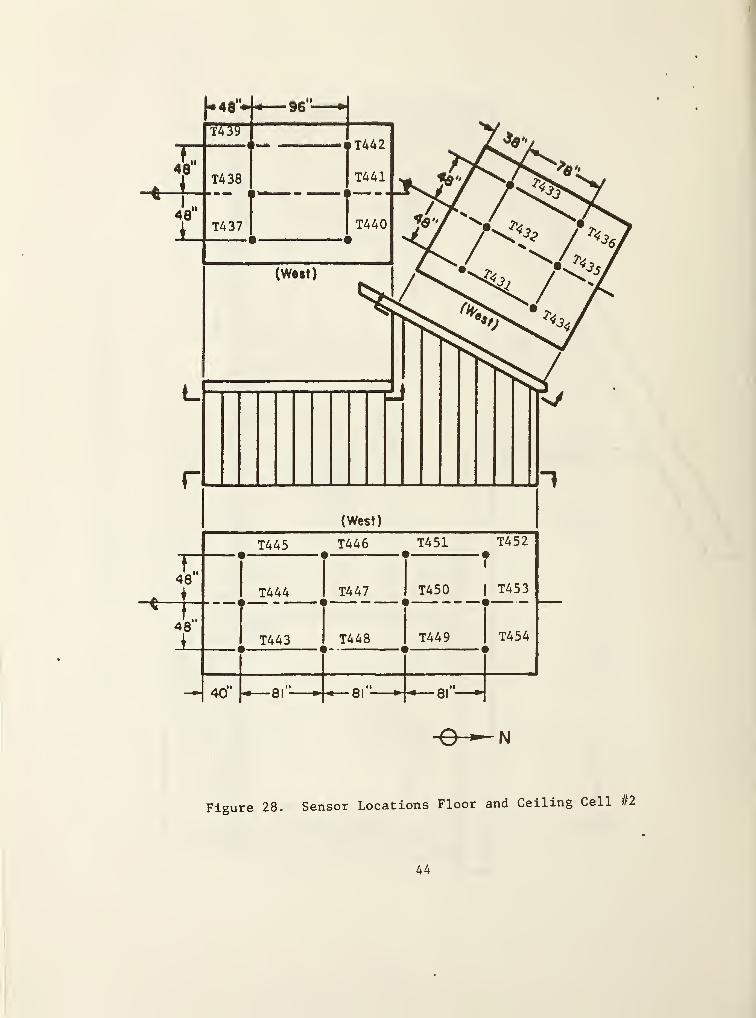
Figure 28. Sensor Locations Floor and Ceiling Cell #2
44
45
Figure
29.
Sensor
Locations
East
Wall
Cell
//2.
46
Figure
30.
Sensor
Locations
West
Wall
Cell
//2
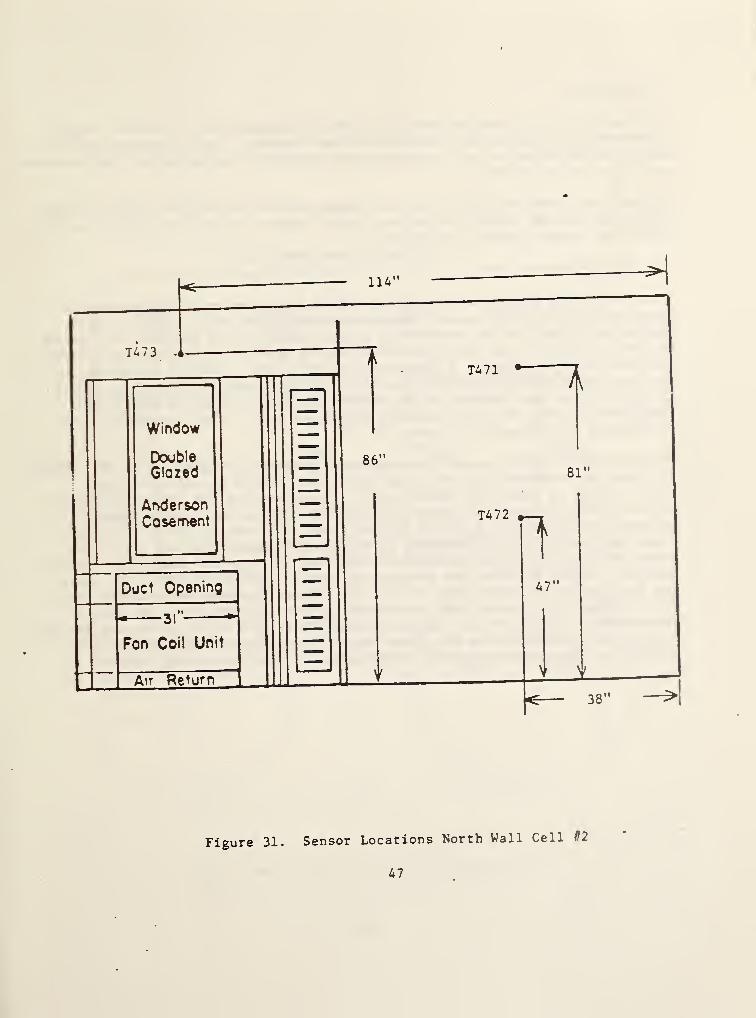
Figure 31. Sensor Locations North Wall Cell #2
47
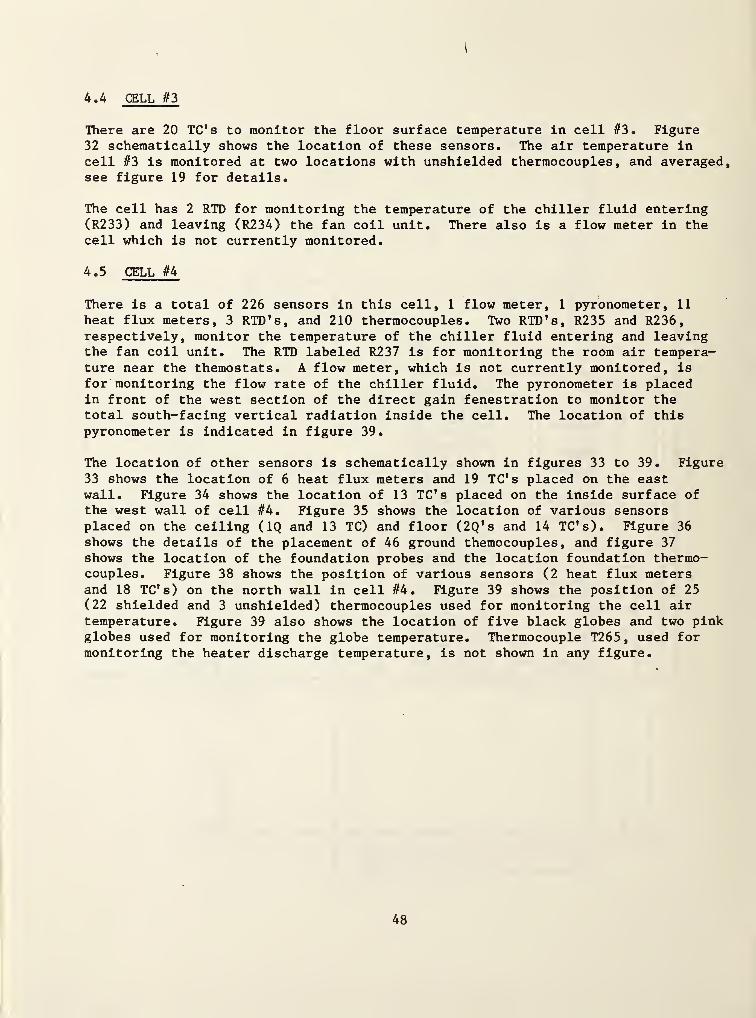
4.4 CELL #3
\
There are 20 TC's to monitor the floor surface temperature in cell #3. Figure32 schematically shows the location of these sensors. The air temperature incell #3 is monitored at two locations with unshielded thermocouples, and averaged,see figure 19 for details.
The cell has 2 RTD for monitoring the temperature of the chiller fluid entering(R233) and leaving (R234) the fan coil unit. There also is a flow meter in thecell which is not currently monitored.
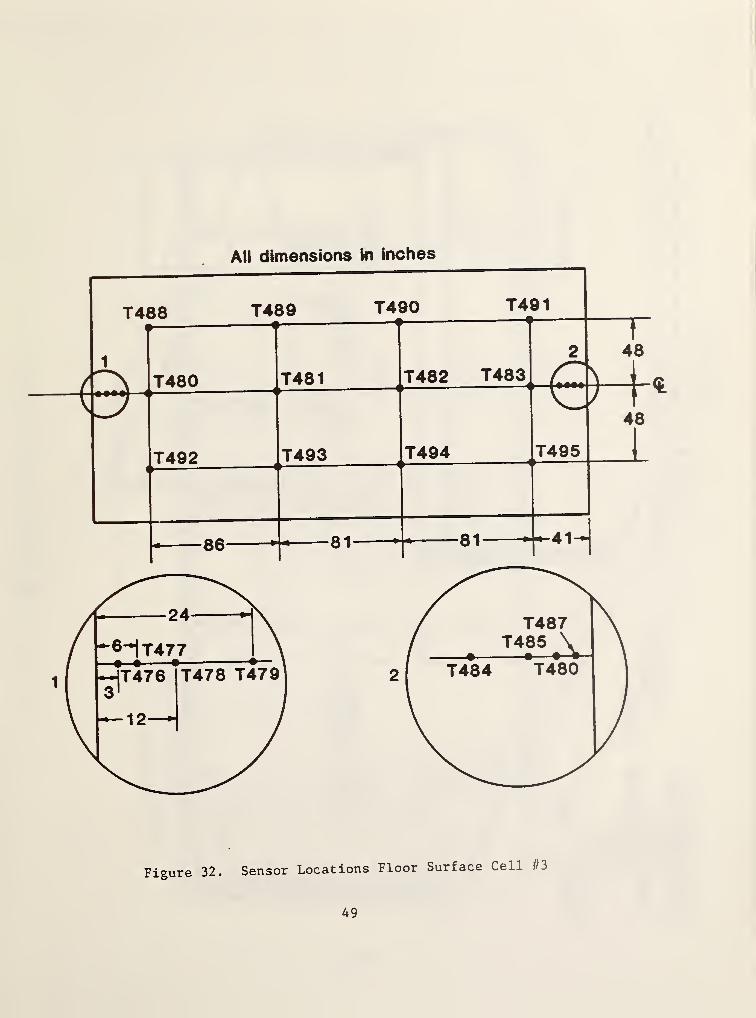
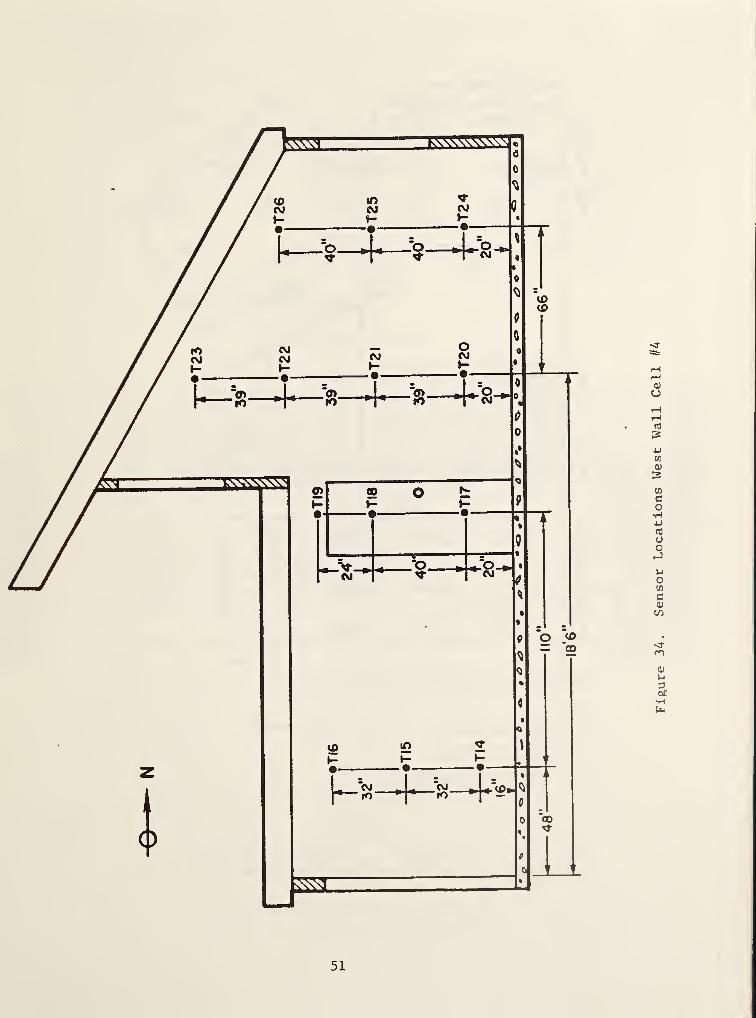
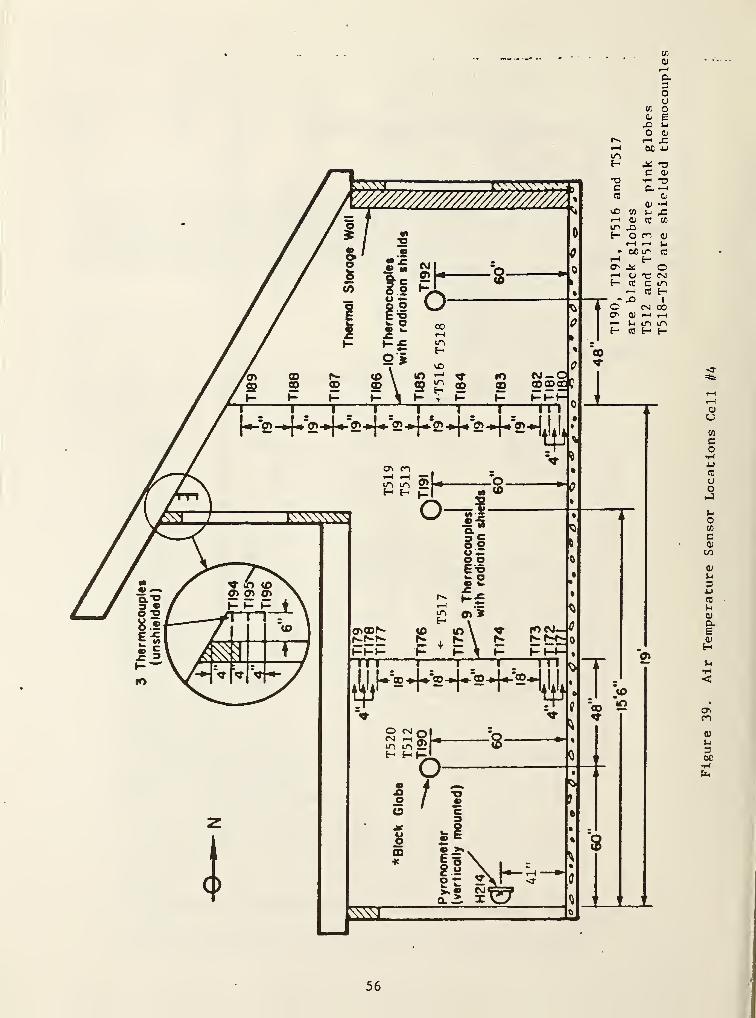
4.5 CELL #4
There is a total of 226 sensors in this cell, 1 flow meter, 1 pyronometer, 11
heat flux meters, 3 RTD's, and 210 thermocouples. Two RTD's, R235 and R236,respectively, monitor the temperature of the chiller fluid entering and leavingthe fan coil unit. The RTD labeled R237 is for monitoring the room air tempera-ture near the themostats. A flow meter, which is not currently monitored, is
for monitoring the flow rate of the chiller fluid. The pyronometer is placedin front of the west section of the direct gain fenestration to monitor thetotal south-facing vertical radiation inside the cell. The location of thispyronometer is indicated in figure 39.
The location of other sensors is schematically shown in figures 33 to 39. Figure
33 shows the location of 6 heat flux meters and 19 TC’s placed on the eastwall. Figure 34 shows the location of 13 TC’s placed on the inside surface ofthe west wall of cell #4. Figure 35 shows the location of various sensorsplaced on the ceiling (IQ and 13 TC) and floor (2Q's and 14 TC's). Figure 36
shows the details of the placement of 46 ground themocouples , and figure 37
shows the location of the foundation probes and the location foundation thermo-couples. Figure 38 shows the position of various sensors (2 heat flux metersand 18 TC's) on the north wall in cell #4. Figure 39 shows the position of 25
(22 shielded and 3 unshielded) thermocouples used for monitoring the cell airtemperature. Figure 39 also shows the location of five black globes and two pinkglobes used for monitoring the globe temperature. Thermocouple T265, used formonitoring the heater discharge temperature, is not shown in any figure.
48
All dimensions In Inches
Figure 32. Sensor Locations Floor Surface Cell #3
49
50
Figure
33.
Sensor
Locations
East
Wall
Cell
//
4
51
Figure
34.
Sensor
Locations
West
Wall
Cell
//4
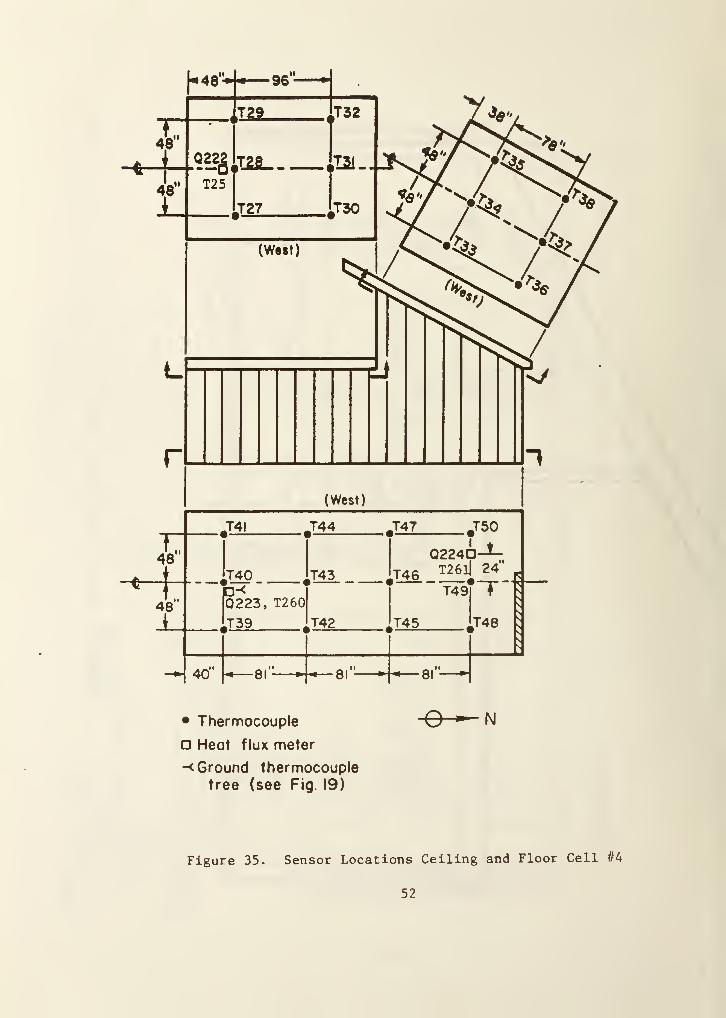
• Thermocouple O m N
Heat flux meter
-< Ground thermocoupletree (see Fig 19)
Figure 35. Sensor Locations Ceiling and Floor Cell #4
52
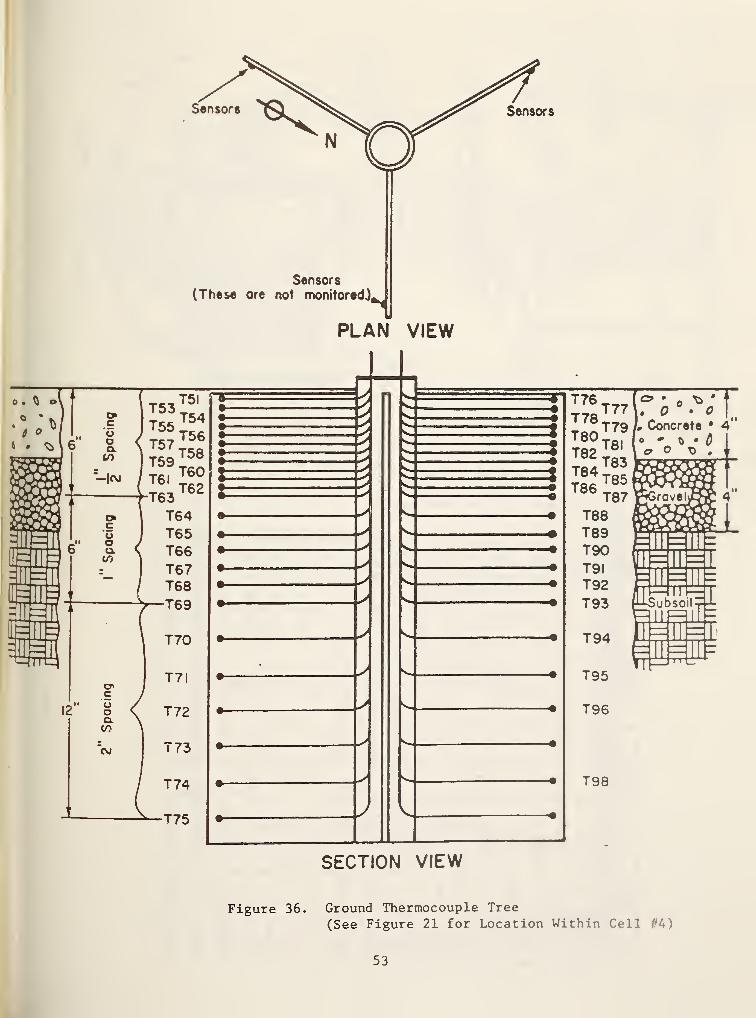
Figure 36. Ground Thermocouple Tree
(See Figure 21 for Location Within Cell ;'4)
53
TOft)
jC
£ »« X- o
-O c.« ft)
o —o o° EC ft)
C o-c
& -aa>0 *7? CM9- « -o
ft) o >"
Cl o )— O= O O°E£°I -ClT’c
• •
lC JP A" A* AN
«*- CO o *3“ CXI o JT* 00 CXJ CO oa; X *“ '
—
CXI CXI CXI r— CXI CXJ
—
CXJ CXI
U)e CO CD o CO CXI 00 CO CO ro CXI ro in CO CO oo
r- CD CD ,— r— od o o CO o O o o o r_X CXI in 'O CO *
—
CO in CO CXJ ro in CO
<5 r-~- co CD O CXI CO *3“ in co CO CD O CXJ roro CO CO *3* *3“ *3" <3- *3- cr in in in in inr— r—
-
P”“ F““ F““ r“ r— r— r— r— r— r— r— r—
roi— i— 1— 1— 1— i— 1— h- i— *— 1— )- H i— l— l— t—
c A™ ~v» WM A*in CO CXI CO CD CO *3- CXI o r^~ Aw oo CXI CO o
d) X '
—
' CXI CXI '
—
CXI CXJ r— r— CXJ CXJ
l/}
E i
—
CO *T CO CO CO CD CXI in 00 CXI ro CXJ ro in CO 00 oo
CXI o CXI o CD o CD o o o CD o O o o oX CXJ CO *d* «3“ CO CO •
—
CO ID CO CXI ro *d- in COwO CO o CXI CO in CO oo CD o , CXJ ro in COifi r— CXI CXI CXI CXI CXI CXI CXI CXI CXI CXI ro ro ro ro ro ro roS r— r— r— r— r— r— r— r— r— f—' r—
»
rmmm r— r—
CVJi
—
i— 1— h~ 1— 1— 1— 1— i— 1— i— i— 1— i— i— t— i— i—
C A" J? A* A~ a* A"“ CO CXI CO o co *a- CD 'S’ 00 CXI CO oa>CO
X '
—
e“~ CXI CXI CXI CXI CXI CXJ
EXT o o CO •
—
CO CO CXI CO in CO ro CXJ ro in CO 00 oO
,
—
r— ,
—
CXI o 00 o CD CD 00 , o O o o o r_X ' CXI co uo CO CO '
—
CXJ «3* CO CXI ro d- in CO
& CXI CO >*T m CO oo CD o , CXI ro *d" ID CO 00c O o o O o o o o O »
—
r—a> r— r— t— f r— r— r— r— r— r—
-
f—
—
r—- f—— r—
.
f— f—CO )— !
—
I— h- — h- i— »— i— i— »— 1— H i— k— »— i—
c -* a* A" «v» a*<D
— *3* CXI CO o CO in CXI o CO "IT oo CXJ co oCO
X '
—
CXI CXI CXI • CXI CXJ r— CXI CXJ
E CO r-. in CO GO CXI CD rv. uo oo CD ro CXI ro in CO 00 oo o CD o o CXI CXI o o O O o o o ,
' 9 CO in CO CO * co in CO CXJ ro in CO
< CO <_> Q UJ u. o 1 - _i z: z O Q- O' QC
54
Figure
37.
Foundation
Temperature
Sensor
Locations
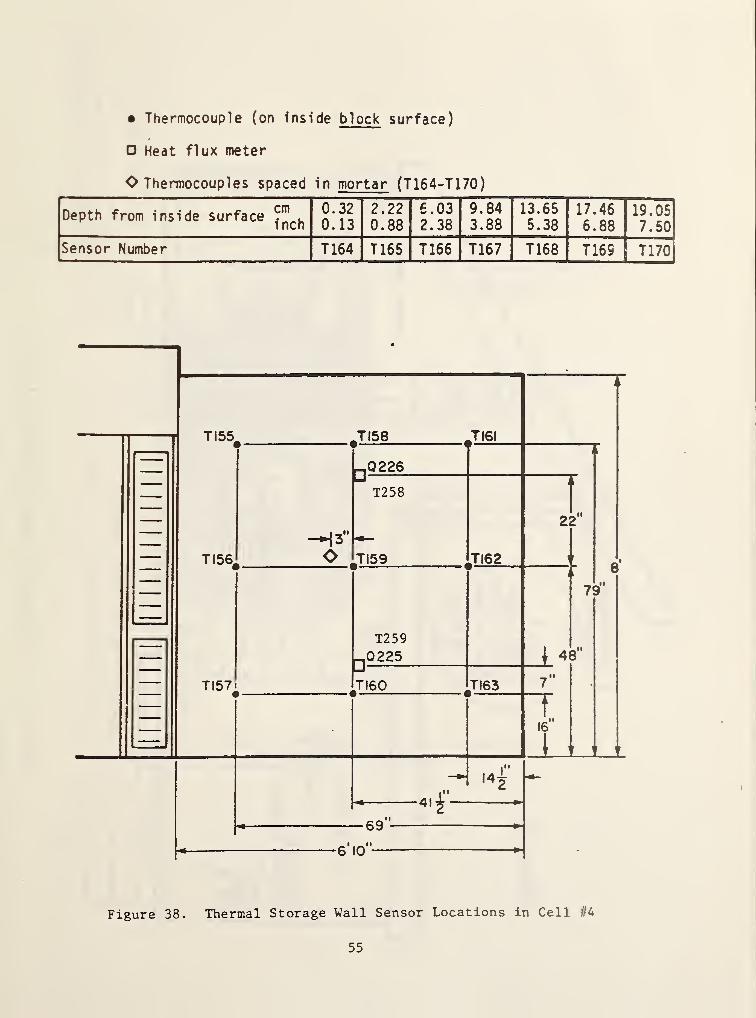
• Thermocouple (on inside block surface)
Heat flux meter
O Thermocouples spaced in mortar (T164-T170)
Depth from inside surface<
rm
,
l nch0.320.13
2.220.88
6.032.38
9.843.88
13.655.38
17.46
6.8819.057.50
Sensor Number T164 T165 T166 T167 T168 T169 T170
Figure 38. Thermal Storage Wall Sensor Locations in Cell //4
35
3
Thermocouples
(unshielded)
vocn
co
CC
Uo•J
l-
0cn
c01
mcu
3•u
«
0)
aEQ)HVj•H<
O'
0)
l-l
3toC
56
T190,
T1
91,
T516
and
T517
are
black
globes
T512
and
T513
are
pink
globes
T518-T520
are
shielded
thermocouples
I
11
Dia. Aluminum Tube(— I/I6
mthick)
2n
Dia. Aluminum Tube(~'3/l6
wthick)
Exposed Thermocouple
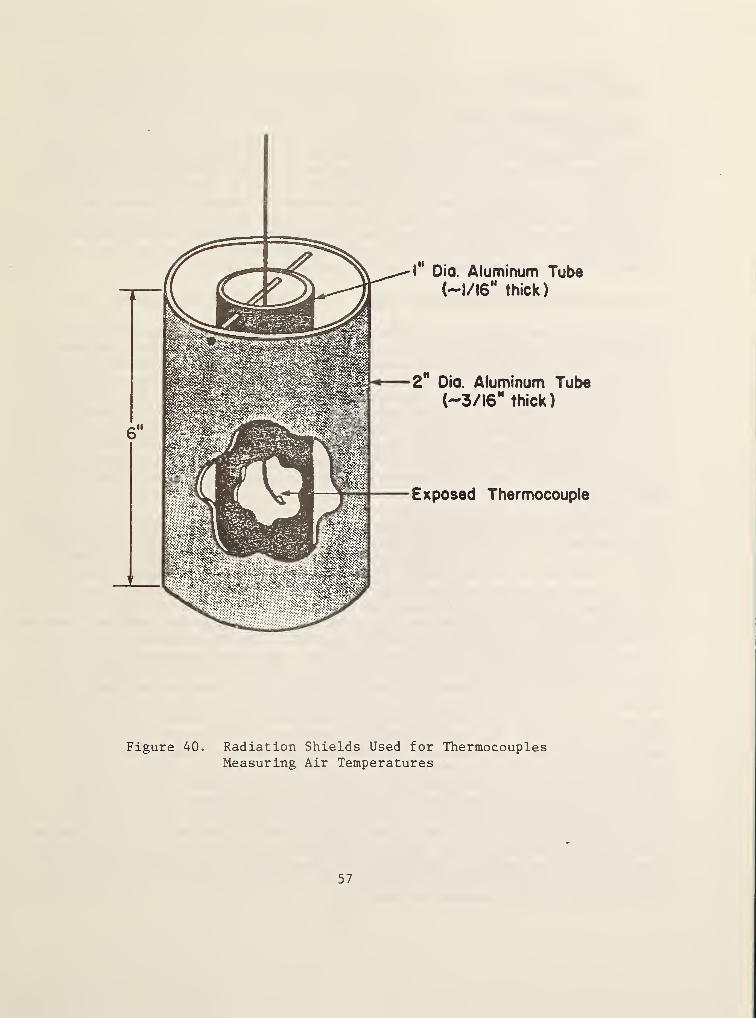
Figure 40. Radiation Shields Used for ThermocouplesMeasuring Air Temperatures
57
5. DATA ACQUISITION
5.1 DATA ACQUISITION SYSTEM
The new data acquisition system (DAS) consists of a desktop computer with 575Kbytes of memory, a real time clock, and a scanner with an integrating digitalvoltmeter having one microvolt resolution. This system provides greater capacityand improved reliability than the original system. Currently, the DAS is
capable of handling about 500 data channels and its capacity can be expandedto handle 700 channels. The system has two cassette drives, and a 9-track,1600 BPI magnetic tape drive for data and software storage. The DAS was receivedin March 1983, and its installation was completed in May 1983.
5.2 AIR INFILTRATION MONITORING SYSTEM
The multi-zone automated air infiltration monitoring system using the tracergas decay method was designed and built by Dr. Richard Grot of NBS. The systemconsists of: a S-1Q0 bus microcomputer with two 8-inch floppy disc drives; a
real time clock; a CRT terminal; an electron capture gas chromatograph detectorwhich measures the sulfur hexafluoride (SF(j) tracer gas in parts per billionrange with an accuracy of 2.5 percent; a ten port sample manifold; a group of
five tracer gas injection units; a bank of ten auxiliary sample pumps; inputdata terminals for the wind speed and direction and the ambient and indoorzone temperatures; and the associated software which monitor and control theoperation of the system. A detailed description of the system is contained in
reference [8].
The tracer gas decay method was used: it consists of a single injection followedby the measuring of the concentration decay of the tracer gas over a three-hourperiod. The amount of tracer gas injection through each of the five injectionunits is determined and controlled independently by the microcomputer on the
basis of the concentration decay history of the individual injection zones.Ten sampling locations can be selected within a maximum of five zones. Asmall amount of the air drawn by the auxiliary sample pumps from the ten locationsis fed to the gas chromatograph-detector sequentially for measuring of the
tracer gas concentration at the ten locations. Extra-pure argon gas (Ar) is
used to flush out the detector system between samples. A one-minute time
interval is required for measuring each of the sample concentrations and flushingthe detector system after the measurement, resulting in a sampling interval of
ten minutes for all ten sampling ports. Therefore, five concentration datapoints per hour for each of the sampling locations are obtained (the last
ten-minute interval is reserved for writing data onto the floppy disc, andinjection of tracer gas if necessary). These five data points are used to
determine the air infiltration rate in terms of air changes per hour on thebasis of tracer decay theory and the least-square technique. Since all the
ten-minute concentration data are stored on the floppy disc, more accurateleast-square analysis based on 15 data points over a three-hour interval (betweeninjections of tracer gas) can also be performed later if necessary. At present,insufficient data exist for purposes of precision and accuracy determination.A reasonable estimate of the uncertainty in a given air change rate determinationis of the order of 10 percent or less [9].
58
or Che present passive solar test house, only three of the five injection
units and nine of the ten sampling ports are used. An injection unit with
three sampling ports serves each cell. In each cell the injection port is
located at the outlet of the fan-coil unit with the fan running continuously
to obtain a uniform mixing of the injected tracer gas within the test cell.
The three sampling ports within each cell are located at the south, center,
and north side of the cell midway between the floor and the ceiling at eachlocation. For the first series of experiments the doors between the cells are
kept closed and any opening through the walls between the cells is sealed to
prevent air movement between the cells. Infiltration data for each samplinglocation are computed individually on an hourly basis and the averaged valueof the three locations is computed to be the infiltration data for the test
cell.
5.3 DATA ACQUISITION AND DISTRIBUTION
With the exception of air infiltration data which is on a separate system, alldata are taken by the new data acquisition system and stored on the magnetictape. The solar radiation and weather data are taken at one-minute intervals,watt-hour data are taken at one-hour inervals, and all other data are taken at
ten-minute intervals. These data are later numerically integrated and averagedto create hourly average data sets. The hourly average data sets includinghourly air infiltration data are recorded onto a magnetic tape in a prioragreed format. A documentation file containing the test conditions and an
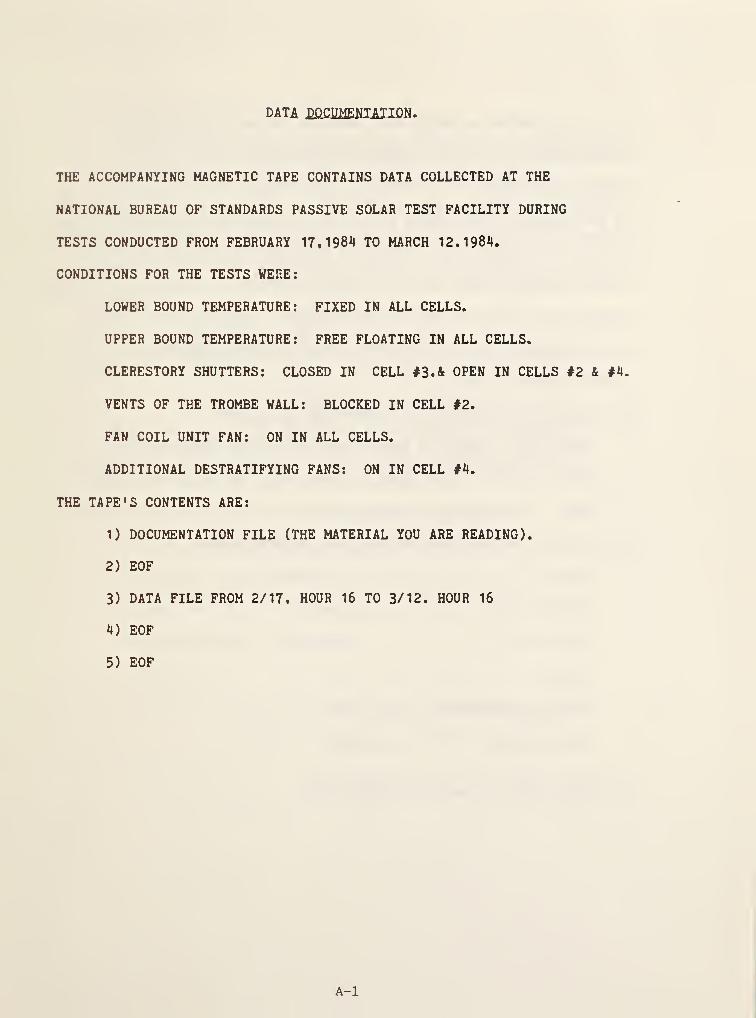
index to the data records is also recorded onto the magnetic tape. A printoutof the "Data Documentation" is given in Appendix A as an example. The datatape along with a printout of the documentation is distributed to the participantresearchers for their use. The hourly average data sets are also archived at
the National Bureau of Standards from where they are available upon request.
5.4 ESTIMATES OF UNCERTAINTY IN THE MEASURED DATA
Some of the factors that contribute to the uncertainty in the measured datainclude type of measurement or data, type of sensor used and the material of
its construction, application environment and sensor mounting techniques, datascanning and logging equipment, and conversion from electrical signals of
sensors to engineering quantities. Estimates of measurement uncertainty forvarious types of data taken at the NBS test facility are given in table 6, andare discussed below:
59
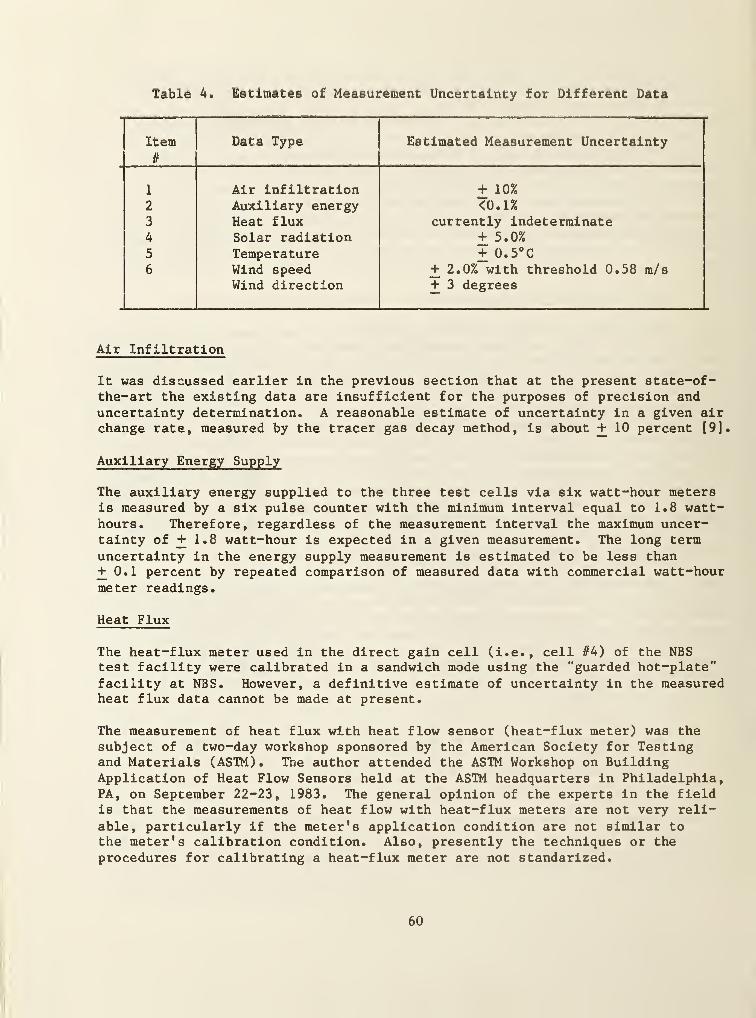
Table 4. Estimates of Measurement Uncertainty for Different Data
Item
#
Data Type Estimated Measurement Uncertainty
1 Air infiltration + 10%
2 Auxiliary energy <0.1%3 Heat flux currently indeterminate4 Solar radiation + 5.0%
5 Temperature + 0. 5°C
6 Wind speed +2.0% with threshold 0.58 m/sWind direction + 3 degrees
Air Infiltration
It was discussed earlier in the previous section that at the present state-of-the-art the existing data are insufficient for the purposes of precision anduncertainty determination. A reasonable estimate of uncertainty in a given airchange rate, measured by the tracer gas decay method, is about + 10 percent [9].
Auxiliary Energy Supply
The auxiliary energy supplied to the three test cells via six watt-hour metersis measured by a six pulse counter with the minimum interval equal to 1.8 watt-hours. Therefore, regardless of the measurement interval the maximum uncer-tainty of + 1.8 watt-hour is expected in a given measurement. The long term
uncertainty in the energy supply measurement is estimated to be less than+0.1 percent by repeated comparison of measured data with commercial watt-hourmeter readings.
Heat Flux
The heat-flux meter used in the direct gain cell (i.e., cell #4) of the NBStest facility were calibrated in a sandwich mode using the "guarded hot-plate"facility at NBS. However, a definitive estimate of uncertainty in the measuredheat flux data cannot be made at present.
The measurement of heat flux with heat flow sensor (heat-flux meter) was thesubject of a two-day workshop sponsored by the American Society for Testingand Materials (ASTM). The author attended the ASTM Workshop on BuildingApplication of Heat Flow Sensors held at the ASTM headquarters in Philadelphia,PA, on September 22-23, 1983. The general opinion of the experts in the fieldis that the measurements of heat flow with heat-flux meters are not very reli-
able, particularly If the meter's application condition are not similar to
the meter's calibration condition. Also, presently the techniques or the
procedures for calibrating a heat-flux meter are not standarized.
60
Some of the factors which contribute to uncertainty of heat flow measurement
include: (1) thermal and radiometeric properties of the meter material with
respect to those of the test structure material; (2) contact resistance due to
contact between the meter and test article; (3) convection around the meter;
(4) multidimensional conduction; (5) thermal inertia of meter with respect to
that of the test structure; and (6) instability of heat field or unsteady nature
of heat transfer process [10]. More experimental research is needed to quantifythe effects of the abovementioned factors on the heat flow data measured by
heat-flux meters.
Solar Radiation
Solar radiometry is an inexact science with international comparisons showingdisagreement of as much as 7 percent [11]. The sensitivity of Normal IncidentPyrheliometers (NIP's) is in general shown to be within 0.5 percent of absolutecavity radiometers that defines the World's Radiometric Reference Scale [12,13].The NIP used at the test facility has been calibrated within the year andintercompared within 1 percent to other NIPs. Since the NIP readings are sensi-tive to the alignment, the tracer of the NIP is realigned twice a day for theduration of each tests at the NBS test facility.
A sensitivity intercomparison of four side-by-side PSP pyronometers showed anagreement of within 1 percent [14], In this intercomparison the temperaturecorrection was not made and cosine response was not determined. Instantaneousvalues may be uncertain by as much as 3 percent depending on conditions. The
instruments used at the NBS test facility are by one manufacturer and areperiodically recalibrated by the supplier. Also, these instruments have beenperiodically intercompared at the test facility and the data agreed within 1
percent. Some uncertainty in the pyronometer data may also arise due to mis-alignment of the instrument. A conservative estimate of overall uncertaintyin the solar radiation data is + 5 percent.
Temperatures
The thermocouples at the NBS test facility were installed by following the"procedures for minimizing error" described in the ASTM Special TechnicalPublication, ASTM SPT-470 [15]. Some of the thermocouples, before theirinstallation were calibrated in standard ice and hot water baths by followingthe procedures described in the ASTM Standard E-220-80 [14]. These thermocoupleswere calibrated over the temperature range of 0.0 to 60° C, and thermocoupledata were within + 0.2°C of the reading of the standard thermometer. Thevoltage data from thermocouples are converted to temperatures in degree Celsius(°C) by using the quadratic expansion equation and the values of expansioncoefficients given in reference 17. The uncertainty due to long leads of thethermocouples is considered to be negligible. Additional unknown uncertaintiesdue to inhomogeneity and change in material properties is anticipated.
The thermocouples used for measuring the room air temperature in cells if 2
and #4 are provided with double radiation shields (see figure 40). Theeffectiveness of the sheilds were tested at NBS as: the data from shieldedthermocouples were compared with data from mechanically aspirated and shielded
61
thermocouples the readings were within + 0.1° of each other. An estimate of
the maximum overall uncertainty in the thermocouples data, including errors
due to reference, multiplexing, and conversion, is + 0.5°C.
Wind Speed and Direction
The anemometer and vane used for measuring the wind speed is factory calibratedand has a claimed uncertainty of + 2 percent with a threshold of 0.58 m/s; and
wind direction is + 3 degrees.
Data Scanner
For verifying the resolution of the digital voltmeter of the data scanner andfor assuring that the DAS is functioning properly, the DAS is provided withone reference, one millivolt signal, and five reference zero volt signals. Thezero volt signals are produced by electrically shorting a data channel on a
multiplexing card. The reference signals are placed on five different strategi-cally selected multiplexing cards. The one millivolt reference channel and one
of the reference zero volt channel are scanned at one-minute intervals, andall of the six reference voltage channels are scanned at ten-minute intervals.
The one-minute interval data are only displayed on the CRT (screen), while theten-minute interval data from these reference channels in addition to being dis-placed on the CRT is also recorded on the magnetic tape along with other data.The data taken to-date has assured us that the system had been functioningproperly during the experiments, and has also verified the acclaimed 1 microvoltresolution of the voltmeter.
6. CONCLUDING REMARKS
As a part of the DoE's Experimental Systems Research Program, the NBS PassiveSolar Test facility has been constructed in Gaithersburg, Maryland. The testfacility is used to collect class A level performance monitoring data fordifferent passive solar system under different experimental conditions. The
data is distributed to various researchers for use in: (1) detailed buildingenergy analysis and models/algorithms validation; and (2) performance character-ization of passive solar systems. This handbook provides, for the users of
these data (i.e., models/algorithms developers/validators), a complete physicaldescription of the test building, sensor locations, data acquisition procedures,and an estimate of uncertainty in the measured data.
The following items are available from the National Bureau of Standards: (1)
This handbook; (2) data documentation (see appendix); and (3) magnetic tapescontaining hourly average sets of data collected at the NBS test facility.Additional information concerning the NBS Passive Solar Test Facility andExperimental Data may be obtained from:
Bal MahajanBuilding Equipment Group/Building Equipment DivisionCenter for Building TechnologyNational Bureau of Standards/Building 226/ Room B306Washington, D.C. 20234
Phone (301)-921-3294
7 . ACKNOWLEDGEMENT
This work is sponsored by the Passive and Hybrid Solar Division, Office ofSolar Heat Technologies, U.S. Department of Energy, Washington, DC 20585, as
part of the experimental system research program.
The author wishes to express his sincere gratitude to Dr. Kent A. Reed andDr. Stanley T. Liu for their many valuable suggestions.
63
I. ffiFSmNGI
1. "FEegfam km& Flan? Ferfepmaaea Evaluation of Fassive/Hybrid Solar Heatingand Cooling Systems Solar Energy Research Institute Report SERX/FR-721-788,October 1980 ,
Golden, CO*
2. Hamilton, B. L. and Scofield, P. M*, "National Passive/Hybrid PerformanceEvaluation Program for System Development," Proceedings of the 5th NationalPassive Solar Conference, Amherst, MA, October 1980.
3. Lindler, Keith W., "National Bureau of Standards Passive Solar Test BuildingHandbook," NBS-GCR-82-398, August 1982, National Bureau of StandardsWashington, DC 20234.
4. Mahajan, Bal M. and Liu, Stanley T. , "Initial Results from the NBS PassiveSolar Test Facility," Proceedings of the ASME Solar Division Sixth AnnualTechnical Conference, April 19-21, 1983
5. Mahajan, Bal M. and Liu Stanley T., "Results from the NBS Passive TestFacility - A Status Report," Proceedings of the Passive and Hybrid SolarEnergy Update, September 26-28, 1983.
6. McCabe, M. E., Bushby, S., and Ducas, W. , "Conceptual Design and PerformanceSpecification for the Passive Solar Component Calorimeter," NBS Letter Reportto DoE, March 1982.
7. "National Bureau of Standards Direct-Gain Test Cell Site Handbook," LosAlamos National Laboratory Report No. LA-9786-MS, edited by Nancy Sheheen,
Q Division, 1983.
8. Grot, R. A., Hunt, C. M., and Harrje, D. T., "Automatic Air Infiltration
Measurements in Large Buildings," Proceeding of the First AIC ConferenceInfiltration and Measuring Techniques; Windsor, U. K. ,
October 8-10, 1980.
9. ASTM Standard E741.80, "Standard Practice for Measuring Air Leakage Rate UsingTracer Dilution Method," ASTM, 1980.
10. Johannesson, Gudni., "Heat Flow Measurements: Thermoelectrical Meters
,
Function Principles and Sources of Errors," Lund Institute of TechnologyReport TVBH-3003, Lund, Sweden, 1979. Translated by U.S. Army Corps of
Engineering, March 1982.
11. Proceedings of the International Energy Agency Conference on PyronometerMeasurements, Final Report," SERI/TR-642-1156R, March 1981, Solar Energy
Research Institute, Boulder, CO.
12. Zerlant, G. A., Bern, J. , Maybee, J.,and Nooring, W.
,"The 1981 Intercom-
parison of Pyronometers and Normal Incident Beam Pyrheliometers at NewRiver, Arizona, I. Pyrheliometers," DSET Report 81-1218L, December 1981.
64
13. Zerlaut, G. A., Bern, J.,Maybee, J.
,and Nooring, W. , "The Second New
River Intercomparison of Pyronometers and Normal Beam Pyrheliometers ,
" DSETReport 82-0703E, July 1982.
14. Zerlaut, G. A., Bern, J.,Maybee, J. ,
and Nooring, W. , "The 1981 Intercom-parison of Pyronometers and Normal Incident Pyrheliometers at New River,
Arizona. II. Pyronometers," DSET Report 82-0104L, January 4, 1982.
13. "Manual on the Use of ThermocouplesSpecial Technical Publication, ASTM
16. ASTM, "Calibration of Thermocouples1980.
17. Powel, R. L. et al., "Thermocouples68;" NBS Monograph 125, March 1974.
in Temperature Measurement," AS1MSTP-470, 1980.
by Comparison," ASTM Standard E228-80;
Reference Tables Based on the JPTS-
65

APPENDIX A
A copy of the "Data Documentation" distribution to various researchers along
with the data tapes.
66
DATA
THE ACCOMPANYING MAGNETIC TAPE CONTAINS DATA COLLECTED AT THE
NATIONAL BUREAU OF STANDARDS PASSIVE SOLAR TEST FACILITY DURING
TESTS CONDUCTED FROM FEBRUARY 17.1984 TO MARCH 12.1984.
CONDITIONS FOR THE TESTS WERE:
LOWER BOUND TEMPERATURE: FIXED IN ALL CELLS.
UPPER BOUND TEMPERATURE: FREE FLOATING IN ALL CELLS.
CLERESTORY SHUTTERS: CLOSED IN CELL #3.& OPEN IN CELLS #2 & #4.
VENTS OF THE TROMBE WALL: BLOCKED IN CELL #2.
FAN COIL UNIT FAN: ON IN ALL CELLS.
ADDITIONAL DESTRATIFYING FANS: ON IN CELL #4.
THE TAPE'S CONTENTS ARE:
1) DOCUMENTATION FILE (THE MATERIAL YOU ARE READING).
2) EOF
3) DATA FILE FROM 2/17. HOUR 16 TO 3/12. HOUR 16
4) EOF
5) EOF
A-l

THE DATA FILES ARE ARRANGED INTO ROWS AND COLUMNS WITH EACH ROW
CORRESPONDING TO A LOGICAL RECORD ON THE MAGNETIC TAPE AND EACH
COLUMN CORRESPONDING TO AN ENTRY IN THE RECORD. THE FIRST ENTRY
IN EACH RECORD IS THE NUMBER OF THE ROW TO WHICH THE RECORD CORRESPONDS.
WHILE THE FOLLOWING EIGHT ENTRIES IN THE RECORD REPRESENT THE HOURLY
AVERAGE READINGS. EACH SET OF 56 ROWS CONSTITUTES A PHYSICAL BLOCK ON THE
MAGNETIC TAPE. EACH PHYSICAL BLOCK CONTAINS A COMPLETE SET OF HOURLY
AVERAGE READINGS FOR A GIVEN HOUR , FOR THE SENSORS MONITORED AT THE
PASSIVE TEST FACILITY.
THE READINGS FOR THE AVERAGES WERE TAKEN AS FOLLOWS
EVERY HOUR - AUXILIARY ENERGY SUPPLIED AND AIR INFILTRATION.
EVERY 1 MINUTE - WIND SPEED AND DIRECTION. AND SOLAR RADIATION.
EVERY 10 MINUTES - ALL OTHER READINGS.
THE DATA ARE WRITTEN WITH THE FOLLOWING SPECIFICATIONS
FORMAT (I2.8F9.2)
CHARACTER SET ASCII
TAPE DENSITY 1600 BPI
TRACKS. 9
CHARACTERS/RECORD 80
RECORDS/BLOCK 56
ALL TIMES REFER TO EASTERN STANDARD TIME
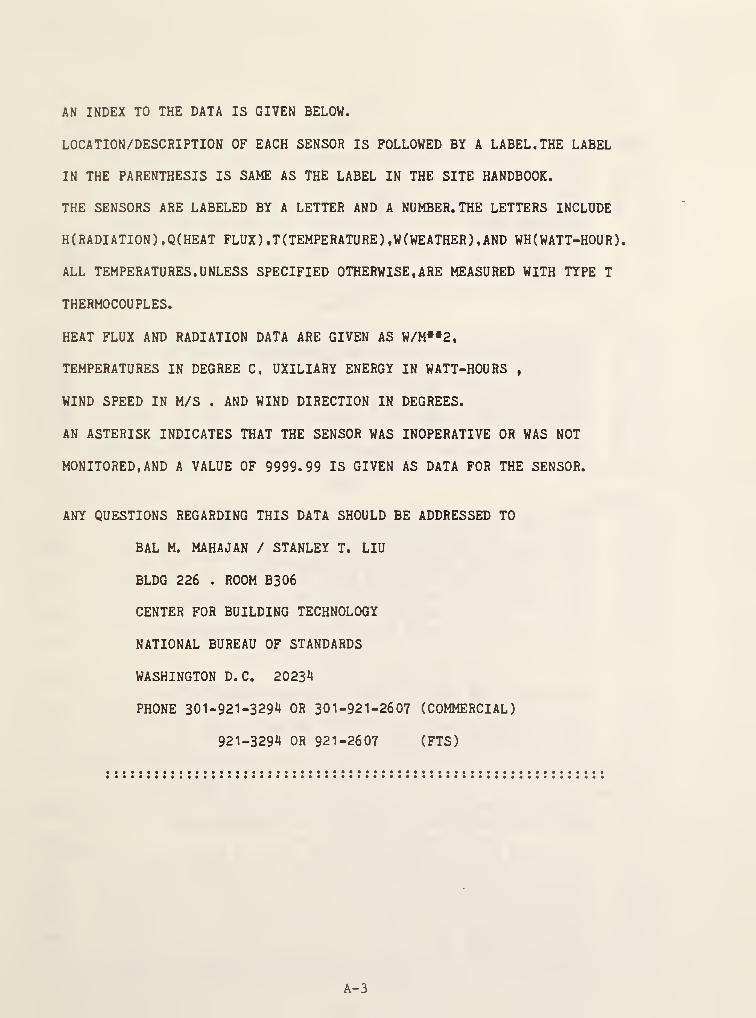
AN INDEX TO THE DATA IS GIVEN BELOW.
LOCATION/DESCRIPTION OF EACH SENSOR IS FOLLOWED BY A LABEL. THE LABEL
IN THE PARENTHESIS IS SAME AS THE LABEL IN THE SITE HANDBOOK.
THE SENSORS ARE LABELED BY A LETTER AND A NUMBER. THE LETTERS INCLUDE
H(RADIATION) ,Q(HEAT FLUX ) ,T( TEMPERATURE ) , W ( WEATHER ) , AND WH ( WATT-HOU R )
.
ALL TEMPERATURES. UNLESS SPECIFIED OTHERWISE, ARE MEASURED WITH TYPE T
THERMOCOUPLES.
HEAT FLUX AND RADIATION DATA ARE GIVEN AS W/M**2,
TEMPERATURES IN DEGREE C, UXILIARY ENERGY IN WATT-HOURS ,
WIND SPEED IN M/S . AND WIND DIRECTION IN DEGREES.
AN ASTERISK INDICATES THAT THE SENSOR WAS INOPERATIVE OR WAS NOT
MONITORED, AND A VALUE OF 9999-99 IS GIVEN AS DATA FOR THE SENSOR.
ANY QUESTIONS REGARDING THIS DATA SHOULD BE ADDRESSED TO
BAL M. MAHAJAN / STANLEY T. LIU
BLDG 226 . ROOM B306
CENTER FOR BUILDING TECHNOLOGY
NATIONAL BUREAU OF STANDARDS
WASHINGTON D. C. 20234
PHONE 301-921-3294 OR 301-921-2607 (COMMERCIAL)
921-3294 OR 921-2607 (FTS)
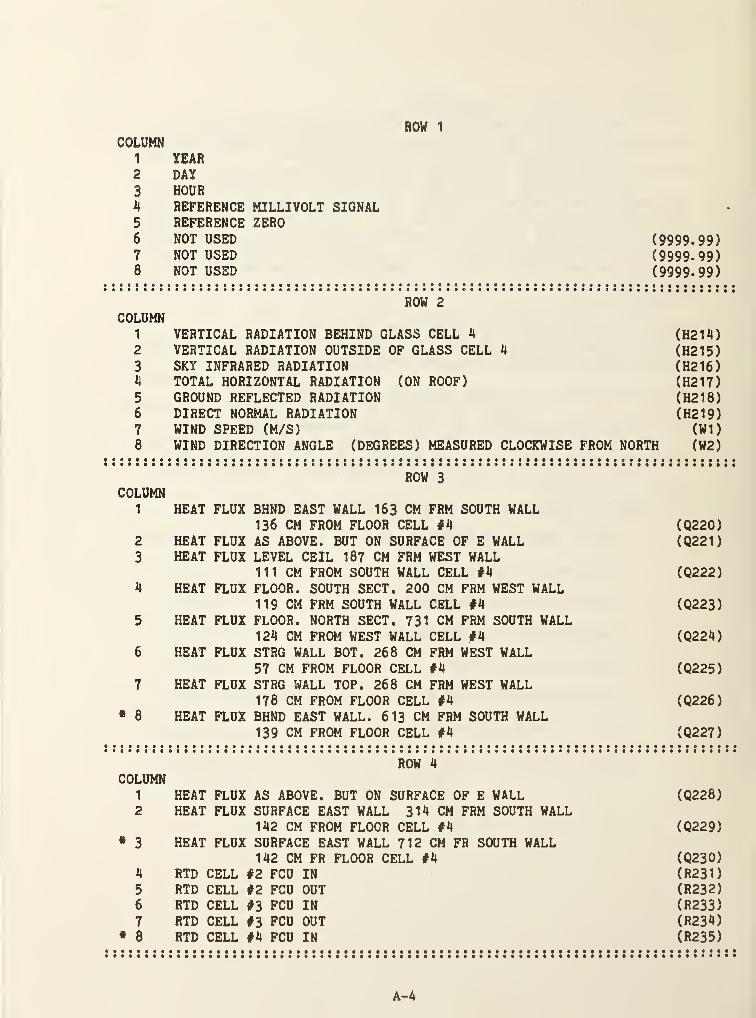
ROW 1
COLUMN1 YEAR2 DAY
3 HOUR4 REFERENCE MILLIVOLT SIGNAL -
5 REFERENCE ZERO6 NOT USED (9999.99)7 NOT USED (9999.99)8 NOT USED (9999.99)
ROW 2
COLUMN1 VERTICAL RADIATION BEHIND GLASS CELL 4 (H214)2 VERTICAL RADIATION OUTSIDE OF GLASS CELL 4 (H215)
3 SKY INFRARED RADIATION (H216)4 TOTAL HORIZONTAL RADIATION (ON ROOF) (H217)
5 GROUND REFLECTED RADIATION (H218)6 DIRECT NORMAL RADIATION ( H2 1 9
)
7 WIND SPEED (M/S) (W1)
8 WIND DIRECTION ANGLE (DEGREES) MEASURED CLOCKWISE FROM NORTH (W2)
ROW 3
COLUMN1 HEAT FLUX BHND EAST WALL 163 CM FRM SOUTH WALL
136 CM FROM FLOOR CELL #4 (Q220)2 HEAT FLUX AS ABOVE. BUT ON SURFACE OF E WALL (Q221
)
3 HEAT FLUX LEVEL CEIL 187 CM FRM WEST WALL111 CM FROM SOUTH WALL CELL #4 (Q222)
4 HEAT FLUX FLOOR. SOUTH SECT, 200 CM FRM WEST WALL119 CM FRM SOUTH WALL CELL #4 (Q223)
5 HEAT FLUX FLOOR. NORTH SECT. 731 CM FRM SOUTH WALL124 CM FROM WEST WALL CELL #4 (Q224)
6 HEAT FLUX STRG WALL BOT. 268 CM FRM WEST WALL57 CM FROM FLOOR CELL #4 (Q225)
7 HEAT FLUX STRG WALL TOP. 268 CM FRM WEST WALL178 CM FROM FLOOR CELL #4 (Q226)
* 8 HEAT FLUX BHND EAST WALL. 613 CM FRM SOUTH WALL139 CM FROM FLOOR CELL #4 (Q227)
ROW 4
COLUMN1 HEAT FLUX AS ABOVE. BUT ON SURFACE OF E WALL (Q228)2 HEAT FLUX SURFACE EAST WALL 314 CM FRM SOUTH WALL
142 CM FROM FLOOR CELL #4 (Q229)• 3 HEAT FLUX SURFACE EAST WALL 712 CM FR SOUTH WALL
142 CM FR FLOOR CELL #4 (Q230)4 RTD CELL #2 FCU IN (R231)
5 RTD CELL #2 FCU OUT (R232)
6 RTD CELL #3 FCU IN (R233)
7 RTD CELL #3 FCU OUT (R234)• 8 RTD CELL #4 FCU IN (R235)
A-4
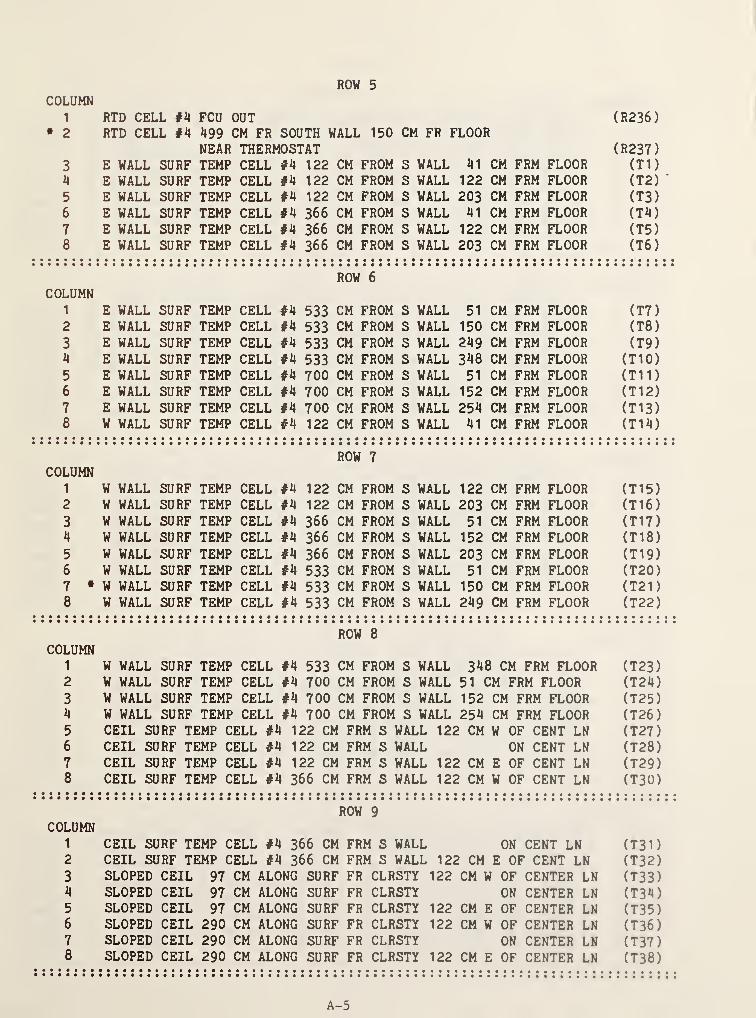
ROW 5
COLUMN
1
RTD CELL #4 FCU OUT (R236)• 2 RTD CELL #4 499 CM FR SOUTH WALL 150 CM FR FLOOR
NEAR THERMOSTAT (R237)
3 E WALL SURF TEMP CELL #4 122 CM FROM S WALL 41 CM FRM FLOOR ( T 1
)
4 E WALL SURF TEMP CELL #4 122 CM FROM S WALL 122 CM FRM FLOOR (T2)
5 E WALL SURF TEMP CELL #4 122 CM FROM s WALL 203 CM FRM FLOOR (T3)
6 E WALL SURF TEMP CELL #4 366 CM FROM s WALL 41 CM FRM FLOOR (T4)
7 E WALL SURF TEMP CELL #4 366 CM FROM s WALL 122 CM FRM FLOOR (T5)
8 E WALL SURF TEMP CELL #4 366 CM FROM s WALL 203 CM FRM FLOOR (T6)
ROW 6
COLUMN1 E WALL SURF TEMP CELL #4 533 CM FROM s WALL 51 CM FRM FLOOR (T7
)
2 E WALL SURF TEMP CELL #4 533 CM FROM s WALL 150 CM FRM FLOOR (T8)
3 E WALL SURF TEMP CELL #4 533 CM FROM s WALL 249 CM FRM FLOOR (T9)
4 E WALL SURF TEMP CELL #4 533 CM FROM s WALL 348 CM FRM FLOOR (T10)
5 E WALL SURF TEMP CELL #4 700 CM FROM s WALL 51 CM FRM FLOOR (Til)
6 E WALL SURF TEMP CELL #4 700 CM FROM s WALL 152 CM FRM FLOOR (T12)
7 E WALL SURF TEMP CELL #4 700 CM FROM s WALL 254 CM FRM FLOOR (T13)8 W WALL SURF TEMP CELL #4 122 CM FROM s WALL 41 CM FRM FLOOR (T14)
ROW 7COLUMN
1 W WALL SURF TEMP CELL #4 122 CM FROM s WALL 122 CM FRM FLOOR (T15)2 w WALL SURF TEMP CELL #4 122 CM FROM s WALL 203 CM FRM FLOOR (T16
)
3 w WALL SURF TEMP CELL #4 366 CM FROM s WALL 51 CM FRM FLOOR ( T 1 7
)
4 w WALL SURF TEMP CELL #4 366 CM FROM s WALL 152 CM FRM FLOOR (T18)
5 w WALL SURF TEMP CELL #4 366 CM FROM s WALL 203 CM FRM FLOOR ( T 1 9
)
6 w WALL SURF TEMP CELL #4 533 CM FROM s WALL 51 CM FRM FLOOR (T20)
7 * w WALL SURF TEMP CELL #4 533 CM FROM s WALL 150 CM FRM FLOOR (T21
)
8 w WALL SURF TEMP CELL #4 533 CM FROM s WALL 249 CM FRM FLOOR (T22)
ROW 8
COLUMN1 W WALL SURF TEMP CELL #4 533 CM FROM S WALL 348 CM FRM FLOOR (T23)2 W WALL SURF TEMP CELL #4 700 CM FROM S WALL 51 CM FRM FLOOR (T24)
3 W WALL SURF TEMP CELL #4 700 CM FROM S WALL 152 CM FRM FLOOR (T25)4 W WALL SURF TEMP CELL #4 700 CM FROM S WALL 254 CM FRM FLOOR (T26)
5 CEIL SURF TEMP CELL #4 122 CM FRM S WALL 122 CM W OF CENT LN (T27)6 CEIL SURF TEMP CELL #4 122 CM FRM S WALL ON CENT LN (T28)
7 CEIL SURF TEMP CELL #4 122 CM FRM S WALL 122 CM E OF CENT LN (T29)8 CEIL SURF TEMP CELL #4 366 CM FRM S WALL 122 CM W OF CENT LN (T30)
ROW 9
COLUMN1 CEIL SURF TEMP CELL, #4 366 CM FRM S WALL ON CENT LN (T31)2 CEIL SURF TEMP CELL, #4 366 CM FRM S WALL 122! CM E: OF CENT LN (T32)
3 SLOPED CEIL 97 CM ALONG SURF FR CLRSTY 122 CM W OF CENTER LN (T33)4 SLOPED CEIL 97 CM ALONG SURF FR CLRSTY ON CENTER LN (T34)5 SLOPED CEIL 97 CM ALONG SURF FR CLRSTY 122 CM E OF CENTER LN (T35)6 SLOPED CEIL 290 CM ALONG SURF FR CLRSTY 122 CM W OF CENTER LN (T36)7 SLOPED CEIL 290 CM ALONG SURF FR CLRSTY ON CENTER LN (T37)8 SLOPED CEIL 290 CM ALONG SURF FR CLRSTY 122 CM E OF CENTER LN (T38)
A-5
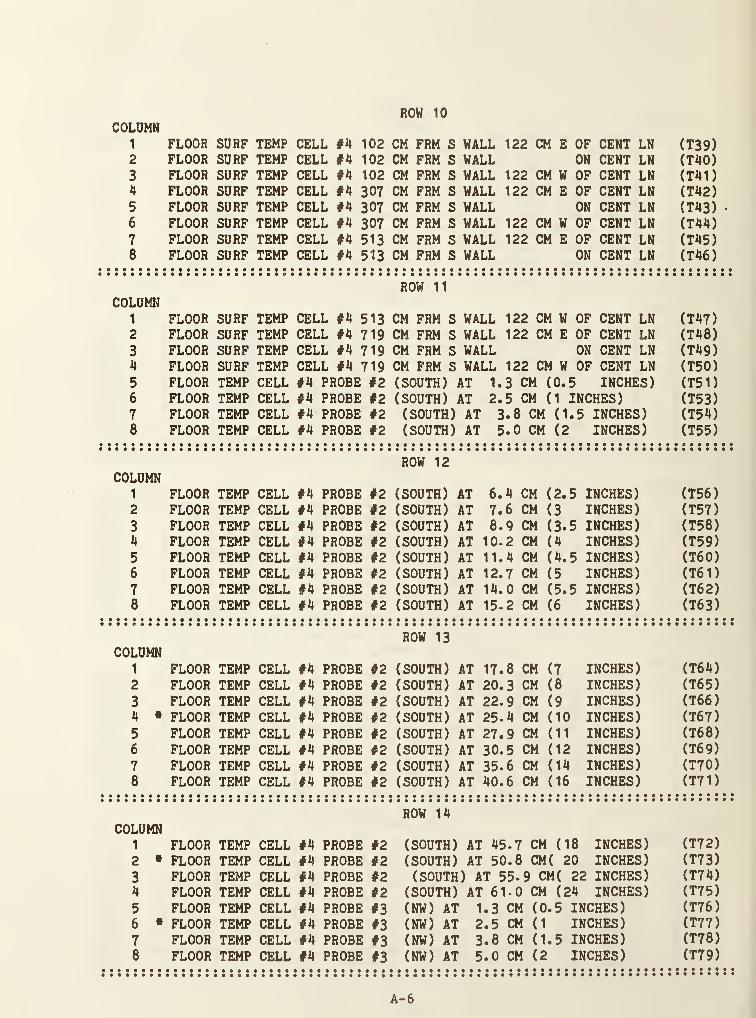
ROW 10
COLUMN1 FLOOR SURF TEMP CELL #4 102 CM FRM S WALL 122 CM E OF CENT LN (T39)2 FLOOR SURF TEMP CELL #4 102 CM FRM S WALL ON CENT LN (T40)
3 FLOOR SURF TEMP CELL #4 102 CM FRM S WALL 122 CM W OF CENT LN (T41)4 FLOOR SURF TEMP CELL #4 307 CM FRM S WALL 122 CM E OF CENT LN (T42)
5 FLOOR SURF TEMP CELL #4 307 CM FRM S WALL ON CENT LN (T43)6 FLOOR SURF TEMP CELL #4 307 CM FRM S WALL 122 CM W OF CENT LN (T44)
7 FLOOR SURF TEMP CELL #4 513 CM FRM S WALL 122 CM E OF CENT LN (T45)8 FLOOR SURF TEMP CELL #4 513 CM FRM S WALL ON CENT LN (T46)
ROW 11
COLUMN1 FLOOR SURF TEMP CELL #4 513 CM FRM S WALL 122 CM W OF CENT LN (T47)2 FLOOR SURF TEMP CELL #4 719 CM FRM S WALL 122 CM E OF CENT LN (T48)
3 FLOOR SURF TEMP CELL #4 719 CM FRM S WALL ON CENT LN (T49)4 FLOOR SURF TEMP CELL #4 719 CM FRM S WALL 122 CM W OF CENT LN (T50)
5 FLOOR TEMP CELL #4 PROBE #2 (SOUTH) AT 1.3 CM (0.5 INCHES) (T51)6 FLOOR TEMP CELL #4 PROBE #2 (SOUTH) AT 2.5 CM (1 INCHES) (T53)
7 FLOOR TEMP CELL #4 PROBE #2 (SOUTH) AT 3.8 CM (1.5 INCHES) (T54)
8 FLOOR TEMP CELL #4 PROBE #2 (SOUTH) AT 5.0 CM (2 INCHES) (T55)
ROW 12
COLUMN1 FLOOR TEMP CELL #4 PROBE #2 (SOUTH) AT 6.4 CM (2.5 INCHES) (T56)2 FLOOR TEMP CELL #4 PROBE #2 (SOUTH) AT 7.6 CM (3 INCHES) (T57)
3 FLOOR TEMP CELL #4 PROBE #2 (SOUTH) AT 8.9 CM (3.5 INCHES) (T58)4 FLOOR TEMP CELL #4 PROBE #2 (SOUTH) AT 10-2 CM (4 INCHES) (T59)
5 FLOOR TEMP CELL #4 PROBE #2 (SOUTH) AT 11.4 CM (4.5 INCHES) (T60)
6 FLOOR TEMP CELL #4 PROBE #2 (SOUTH) AT 12.7 CM (5 INCHES) (T61)
7 FLOOR TEMP CELL #4 PROBE #2 (SOUTH) AT 14.0 CM (5.5 INCHES) (T62)
8 FLOOR TEMP CELL #4 PROBE #2 (SOUTH) AT 15.2 CM (6 INCHES) (T63)
ROW 13
COLUMN1 FLOOR TEMP CELL #4 PROBE #2 (SOUTH) AT 17.8 CM (7 INCHES) (T64)
2 FLOOR TEMP CELL #4 PROBE #2 (SOUTH) AT 20.3 CM (8 INCHES) (T65)
3 FLOOR TEMP CELL #4 PROBE #2 (SOUTH) AT 22.9 CM (9 INCHES) (T66)
4 • FLOOR TEMP CELL #4 PROBE #2 (SOUTH) AT 25.4 CM (10 INCHES) (T67)
5 FLOOR TEMP CELL #4 PROBE #2 (SOUTH) AT 27.9 CM (11 INCHES) (T68)
6 FLOOR TEMP CELL #4 PROBE #2 (SOUTH) AT 30.5 CM (12 INCHES) (T69)
7 FLOOR TEMP CELL #4 PROBE #2 (SOUTH) AT 35.6 CM (14 INCHES) (T70)
8 FLOOR TEMP CELL #4 PROBE #2 (SOUTH) AT 40.6 CM (16 INCHES) (T71)
ROW 14
COLUMN1 FLOOR TEMP CELL #4 PROBE #2 (SOUTH) AT' 45-7 CM (18 INCHES) (T72)
2 • FLOOR TEMP CELL #4 PROBE #2 (SOUTH) AT' 50.8 CM( 20 INCHES) (T73)
3 FLOOR TEMP CELL #4 PROBE #2 (SOUTH) AT 55.9 CM( 22 INCHES) (T74)
4 FLOOR TEMP CELL #4 PROBE #2 (SOUTH) AT' 61-0 CM (24 INCHES) (T75)
5 FLOOR TEMP CELL #4 PROBE #3 (NW) AT 1 .3 CM (0.5 INCHES) (T76)
6 * FLOOR TEMP CELL #4 PROBE #3 (NW) AT 2!.5 CM (1 INCHES) (T77)
7 FLOOR TEMP CELL #4 PROBE #3 (NW) AT 31.8 CM (1.5 INCHES) (T78)
8 FLOOR TEMP CELL #4 PROBE #3 (NW) AT 5i.O CM (2 INCHES) (T79)
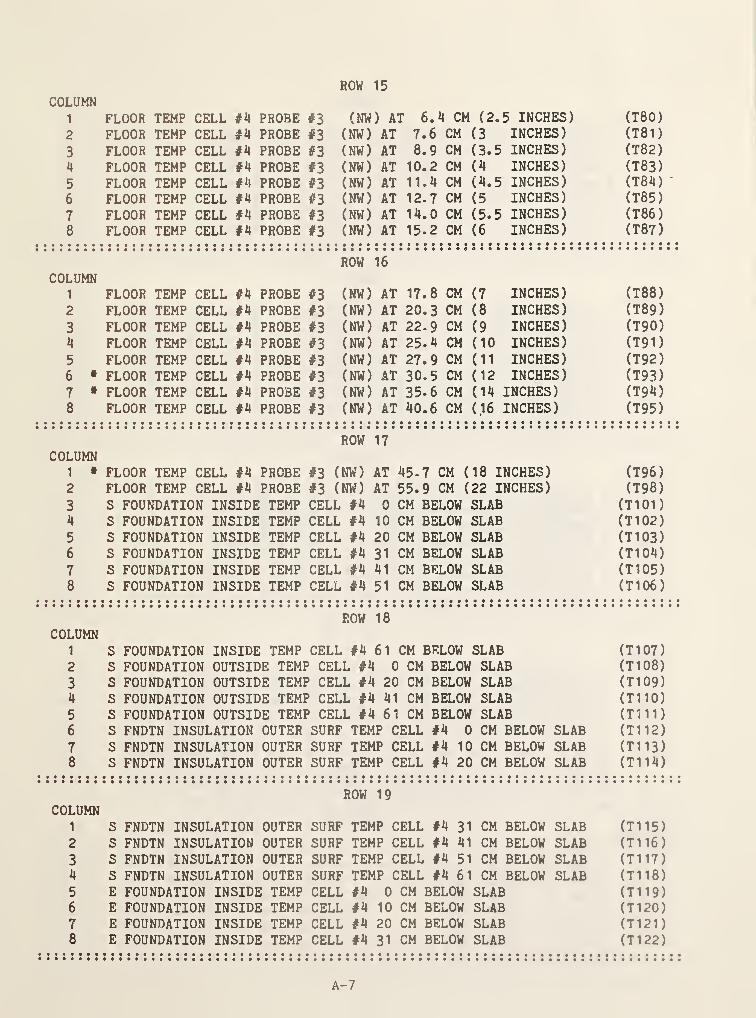
ROW 15
COLUMN1 FLOOR TEMP CELL #4 PROBE #3 (NW) AT' 6.11 CM[ (2. 5 INCHES) (T80)
2 FLOOR TEMP CELL #4 PROBE #3 (NW) AT 7.6 CM (3 INCHES) (T81)
3 FLOOR TEMP CELL #4 PROBE #3 (NW) AT 8.9 CM (3.5 INCHES) (T82)
4 FLOOR TEMP CELL #4 PROBE #3 (NW) AT 10.2 CM (4 INCHES) (T83)
5 FLOOR TEMP CELL #4 PROBE #3 (NW) AT 11.4 CM (4.5 INCHES) (T84)•
6 FLOOR TEMP CELL #4 PROBE #3 (NW) AT 12.7 CM (5 INCHES) (T85)
7 FLOOR TEMP CELL #4 PROBE #3 (NW) AT 14.0 CM (5.5 INCHES) (T86
)
8 FLOOR TEMP CELL #4 PROBE #3 (NW) AT 15-2 CM (6 INCHES) (T87)
ROW 16
COLUMN1 FLOOR TEMP CELL #4 PROBE #3 (NW) AT 17.8 CM (7 INCHES) (T88)
2 FLOOR TEMP CELL #4 PROBE #3 (NW) AT 20.3 CM (8 INCHES) (T89)
3 FLOOR TEMP CELL #4 PROBE #3 (NW) AT 22-9 CM (9 INCHES) (T90)
4 FLOOR TEMP CELL #4 PROBE #3 (NW) AT 25-4 CM (10 INCHES) (T9 1
)
5 FLOOR TEMP CELL #4 PROBE #3 (NW) AT 27.9 CM (11 INCHES) (T92)
6 • FLOOR TEMP CELL #4 PROBE #3 (NW) AT 30-5 CM (12 INCHES) (T93)
7 • FLOOR TEMP CELL #4 PROBE #3 (NW) AT 35-6 CM (14 INCHES) (T94)
8 FLOOR TEMP CELL #4 PROBE #3 (NW) AT 40.6 CM (.16 INCHES) (T95)
ROW 17
COLUMN1 • FLOOR TEMP CELL #4 PROBE #3 (NW) AT 45-7 CM (18 INCHES)2 FLOOR TEMP CELL #4 PROBE #3 (NW) AT 55.9 CM (22 INCHES)
3 S FOUNDATION INSIDE TEMP CELL #4 0 CM BELOW SLAB4 S FOUNDATION INSIDE TEMP CELL #4 10 CM BELOW SLAB
5 S FOUNDATION INSIDE TEMP CELL #4 20 CM BELOW SLAB6 S FOUNDATION INSIDE TEMP CELL #4 31 CM BELOW SLAB
7 S FOUNDATION INSIDE TEMP CELL #4 41 CM BELOW SLAB8 S FOUNDATION INSIDE TEMP CELL #4 51 CM BELOW SLAB
ROW 18
COLUMN1 S FOUNDATION INSIDE TEMP CELL #4 61 CM BELOW SLAB (T107)
2 S FOUNDATION OUTSIDE TEMP CELL #4 0 CM BELOW SLAB (T108)
3 S FOUNDATION OUTSIDE TEMP CELL #4 20 CM BELOW SLAB (T109)
4 S FOUNDATION OUTSIDE TEMP CELL #4 41 CM BELOW SLAB (T110)
5 S FOUNDATION OUTSIDE TEMP CELL #4 61 CM BELOW SLAB (Till)
6 S FNDTN INSULATION OUTER SURF TEMP CELL #4 0 CM BELOW SLAB (T112)
7 S FNDTN INSULATION OUTER SURF TEMP CELL #4 10 CM BELOW SLAB (T113)8 S FNDTN INSULATION OUTER SURF TEMP CELL #4 20 CM BELOW SLAB (T114)
(T96)
(T98)
( T 1 0 1
)
(T102)(T103)(T104)(T105)(T106
)
COLUMN1 S FNDTN INSULATION OUTER2 S FNDTN INSULATION OUTER
3 S FNDTN INSULATION OUTER4 S FNDTN INSULATION OUTER5 E FOUNDATION INSIDE TEMP6 E FOUNDATION INSIDE TEMP7 E FOUNDATION INSIDE TEMP8 E FOUNDATION INSIDE TEMP
ROW 19
SURF TEMP CELL #4 31 CM BELOWSURF TEMP CELL #4 41 CM BELOWSURF TEMP CELL #4 51 CM BELOWSURF TEMP CELL #4 61 CM BELOWCELL #4 0 CM BELOW SLABCELL #4 10 CM BELOW SLABCELL #4 20 CM BELOW SLABCELL #4 31 CM BELOW SLAB
SLAB ( T 1 15)
SLAB ( T 1 16 )
SLAB (T117)
SLAB ( T 1 18)
( T 1 19)
(T120)(T121
)
(T122)
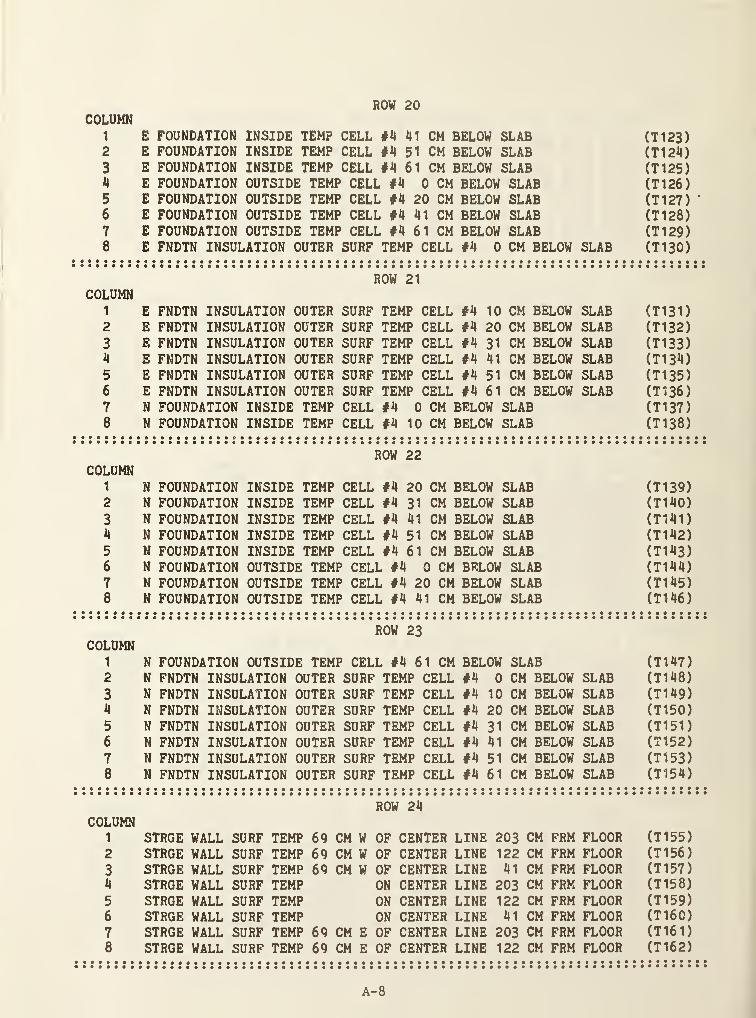
ROW 20COLUMN
1 E FOUNDATION INSIDE TEMP CELL #4 41 CM BELOW SLAB (T123)2 E FOUNDATION INSIDE TEMP CELL #4 51 CM BELOW SLAB (T124)
3 E FOUNDATION INSIDE TEMP CELL #4 61 CM BELOW SLAB (T125)4 E FOUNDATION OUTSIDE TEMP CELL #4 0 CM BELOW SLAB (T126)5 E FOUNDATION OUTSIDE TEMP CELL #4 20 CM BELOW SLAB (T127)
'
6 E FOUNDATION OUTSIDE TEMP CELL #4 41 CM BELOW SLAB (T128)7 E FOUNDATION OUTSIDE TEMP CELL #4 61 CM BELOW SLAB (T129)8 E FNDTN INSULATION OUTER SURF TEMP CELL #4 0 CM BELOW SLAB (T130)
ROW 21
COLUMN1 E FNDTN INSULATION OUTER SURF TEMP CELL #4 10 CM BELOW SLAB (T131)2 E FNDTN INSULATION OUTER SURF TEMP CELL #4 20 CM BELOW SLAB (T132)
3 E FNDTN INSULATION OUTER SURF TEMP CELL #4 31 CM BELOW SLAB (T133)4 E FNDTN INSULATION OUTER SURF TEMP CELL #4 41 CM BELOW SLAB (T134)
5 E FNDTN INSULATION OUTER SURF TEMP CELL #4 51 CM BELOW SLAB (T135)6 E FNDTN INSULATION OUTER SURF TEMP CELL #4 61 CM BELOW SLAB (T136)
7 N FOUNDATION INSIDE TEMP CELL #4 0 CM BELOW SLAB (T137)8 N FOUNDATION INSIDE TEMP CELL #4 10 CM BELOW SLAB (T138)
ROW 22COLUMN
1 N FOUNDATION INSIDE TEMP CELL #4 20 CM BELOW SLAB (T139)2 N FOUNDATION INSIDE TEMP CELL #4 31 CM BELOW SLAB (T140)
3 N FOUNDATION INSIDE TEMP CELL #4 41 CM BELOW SLAB (T141)4 N FOUNDATION INSIDE TEMP CELL #4 51 CM BELOW SLAB (T142)
5 N FOUNDATION INSIDE TEMP CELL #4 61 CM BELOW SLAB (T143)6 N FOUNDATION OUTSIDE TEMP CELL #4 0 CM BELOW SLAB (T144)
7 N FOUNDATION OUTSIDE TEMP CELL #4 20 CM BELOW SLAB (T145)8 N FOUNDATION OUTSIDE TEMP CELL #4 41 CM BELOW SLAB (T146)
ROW 23COLUMN
1 N FOUNDATION OUTSIDE TEMP CELL #4 61 CM BELOW SLAB (T147)2 N FNDTN INSULATION OUTER SURF TEMP CELL #4 0 CM BELOW SLAB (T148)
3 N FNDTN INSULATION OUTER SURF TEMP CELL #4 10 CM BELOW SLAB (T149)4 N FNDTN INSULATION OUTER SURF TEMP CELL #4 20 CM BELOW SLAB (T150)
5 N FNDTN INSULATION OUTER SURF TEMP CELL #4 31 CM BELOW SLAB (T151
)
6 N FNDTN INSULATION OUTER SURF TEMP CELL #4 41 CM BELOW SLAB (T152)
7 N FNDTN INSULATION OUTER SURF TEMP CELL #4 51 CM BELOW SLAB (T153)
8 N FNDTN INSULATION OUTER SURF TEMP CELL #4 61 CM BELOW SLAB (T 1 54
)
ROW 24COLUMN
1 STRGE WALL SURF TEMP 69 CM W OF CENTER LINE 203 CM FRM FLOOR (T 1 55
)
2 STRGE WALL SURF TEMP 69 CM W OF CENTER LINE 122 CM FRM FLOOR (T 1 56
)
3 STRGE WALL SURF TEMP 69 CM W OF CENTER LINE 41 CM FRM FLOOR (T157)
4 STRGE WALL SURF TEMP ON CENTER LINE 203 CM FRM FLOOR (T158)
5 STRGE WALL SURF TEMP ON CENTER LINE 122 CM FRM FLOOR (T159)
6 STRGE WALL SURF TEMP ON CENTER LINE 41 CM FRM FLOOR (T160)
7 STRGE WALL SURF TEMP 69 CM E OF CENTER LINE 203 CM FRM FLOOR (T161)
6 STRGE WALL SURF TEMP 69 CM E OF CENTER LINE 122 CM FRM FLOOR (T162)
• • • •••••••• • ••••• • ••••••
A-8
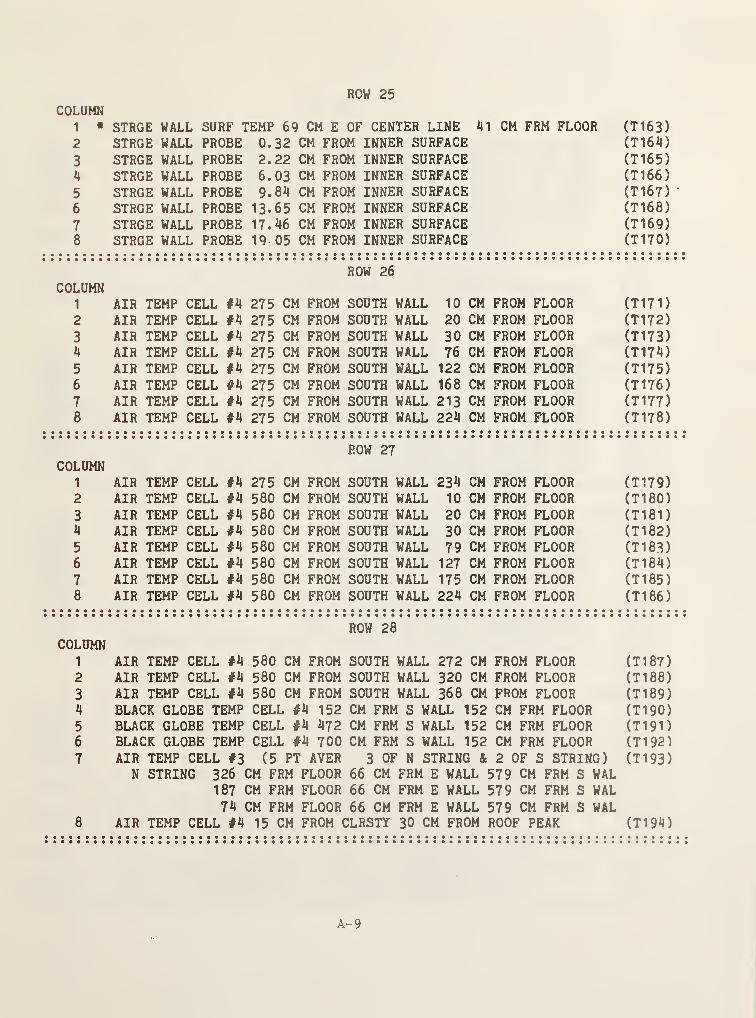
ROW 25
COLUMN1 • STRGE WALL SURF TEMP 69 CM E OF CENTER LINE 41 CM FRM FLOOR (T163)
2 STRGE WALL PROBE 0.32 CM FROM INNER SURFACE (T164)
3 STRGE WALL PROBE 2.22 CM FROM INNER SURFACE (T 1 6 5
)
4 STRGE WALL PROBE 6.03 CM FROM INNER SURFACE (T166)
5 STRGE WALL PROBE 9.84 CM FROM INNER SURFACE (T 1 67 )’
6 STRGE WALL PROBE 13.65 CM FROM INNER SURFACE (T168)
7 STRGE WALL PROBE 17.46 CM FROM INNER SURFACE (T 1 6 9
)
8 STRGE WALL PROBE 19 05 CM FROM INNER SURFACE (T 1 7 0
)
ROW 26
COLUMN1 AIR TEMP CELL #4 275 CM FROM SOUTH WALL 10 CM FROM FLOOR (T 17 1
)
2 AIR TEMP CELL #4 275 CM FROM SOUTH WALL 20 CM FROM FLOOR (T172)
3 AIR TEMP CELL #4 275 CM FROM SOUTH WALL 30 CM FROM FLOOR (T173)4 AIR TEMP CELL #4 275 CM FROM SOUTH WALL 76 CM FROM FLOOR (T 1 7 4
)
5 AIR TEMP CELL #4 275 CM FROM SOUTH WALL 122 CM FROM FLOOR (T 1 75
)
6 AIR TEMP CELL #4 275 CM FROM SOUTH WALL 168 CM FROM FLOOR (T176)
7 AIR TEMP CELL #4 275 CM FROM SOUTH WALL 213 CM FROM FLOOR ( T 1 77
)
8 AIR TEMP CELL #4 275 CM FROM SOUTH WALL 224 CM FROM FLOOR ( T 1 78
)
ROW 27
COLUMN1 AIR TEMP CELL #4 275 CM FROM SOUTH WALL 234 CM FROM FLOOR (T179)2 AIR TEMP CELL #4 580 CM FROM SOUTH WALL 10 CM FROM FLOOR (T180)
3 AIR TEMP CELL #4 580 CM FROM SOUTH WALL 20 CM FROM FLOOR (T 1 8 1
)
4 AIR TEMP CELL #4 580 CM FROM SOUTH WALL 30 CM FROM FLOOR (T182)
5 AIR TEMP CELL #4 580 CM FROM SOUTH WALL 79 CM FROM FLOOR (T183)6 AIR TEMP CELL #4 580 CM FROM SOUTH WALL 127 CM FROM FLOOR (T184)
7 AIR TEMP CELL #4 580 CM FROM SOUTH WALL 175 CM FROM FLOOR (T185)8 AIR TEMP CELL #4 580 CM FROM SOUTH WALL 224 CM FROM FLOOR (T186)
ROW 28COLUMN
1 AIR TEMP CELL #4 580 CM FROM SOUTH WALL 272 CM FROM FLOOR ( T 1 87
)
2 AIR TEMP CELL #4 580 CM FROM SOUTH WALL 320 CM FROM FLOOR ( T 1 88
)
3 AIR TEMP CELL #4 580 CM FROM SOUTH WALL 368 CM FROM FLOOR ( T 1 89
)
4 BLACK GLOBE TEMP CELL #4 152 CM FRM S WALL 152 CM FRM FLOOR (T190)
5 BLACK GLOBE TEMP CELL #4 472 CM FRM S WALL 152 CM FRM FLOOR ( T 1 9 1
)
6 BLACK GLOBE TEMP CELL #4 700 CM FRM S WALL 152 CM FRM FLOOR (T192)
7 AIR TEMP CELL #3 (5 PT AVER 3 OF N STRING & 2 OF S STRING) ( T 1 93
)
N STRING 326 CM FRM FLOOR 66 CM FRM E WALL 1579 CM FRM S WAL187 CM FRM :FLOOR 66 CM FRM E WALL 579 CM FRM S WAL74 CM FRM :FLOOR 66 CM FRM E WALL 579 CM FRM S WAL
8 AIR TEMP CELL #4 15 'CM ;FROM CLRSTY 30 CM FROM ROOF ]PEAK (T1 94
)
A-9
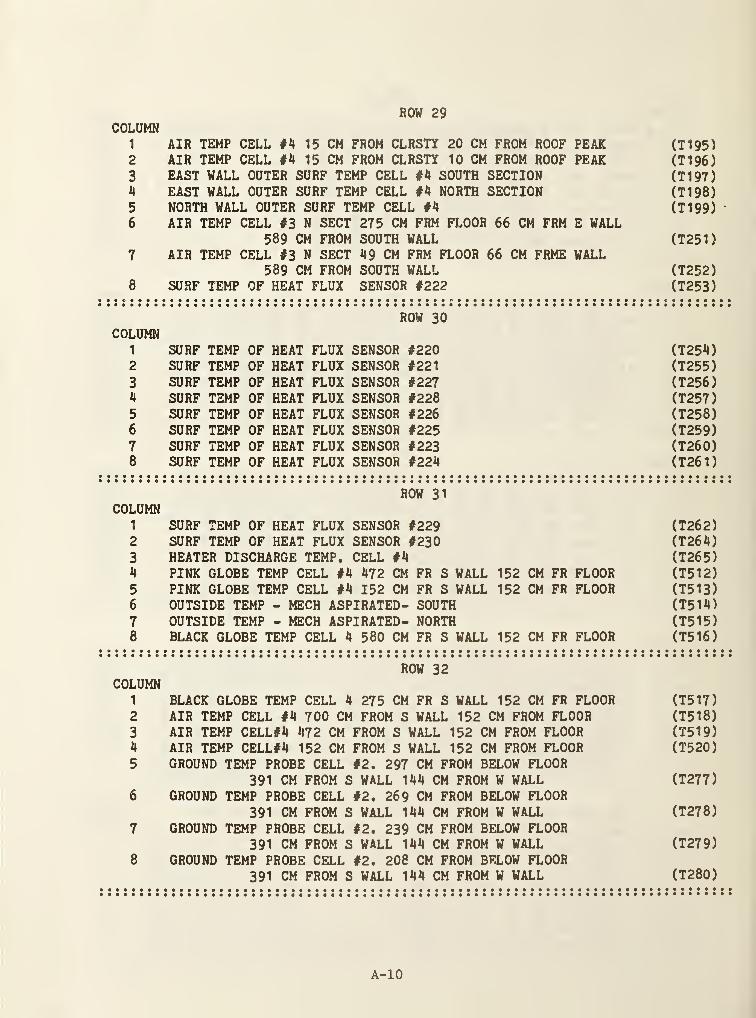
ROW 29COLUMN
1 AIR TEMP CELL #4 15 CM FROM CLRSTY 20 CM FROM ROOF PEAK2 AIR TEMP CELL #4 15 CM FROM CLRSTY 10 CM FROM ROOF PEAK
3 EAST WALL OUTER SURF TEMP CELL #4 SOUTH SECTION4 EAST WALL OUTER SURF TEMP CELL #4 NORTH SECTION5 NORTH WALL OUTER SURF TEMP CELL #46 AIR TEMP CELL #3 N SECT 275 CM FRM FLOOR 66 CM FRM E WALL
589 CM FROM SOUTH WALL7 AIR TEMP CELL #3 N SECT 49 CM FRM FLOOR 66 CM FRME WALL
589 CM FROM SOUTH WALL8 SURF TEMP OF HEAT FLUX SENSOR #222
(T195)(T196)
( T 1 97
)
(T1 98)
(T 1 99)
(T251)
(T252)(T253)
ROW 30COLUMN
1 SURF TEMP OF HEAT FLUX SENSOR #220 (T254)2 SURF TEMP OF HEAT FLUX SENSOR #221 (T255)
3 SURF TEMP OF HEAT FLUX SENSOR #227 (T256)4 SURF TEMP OF HEAT FLUX SENSOR #228 (T257)
5 SURF TEMP OF HEAT FLUX SENSOR #226 (T258)6 SURF TEMP OF HEAT FLUX SENSOR #225 (T259)
7 SURF TEMP OF HEAT FLUX SENSOR #223 (T260)8 SURF TEMP OF HEAT FLUX SENSOR #224 (T261)
ROW 31
COLUMN1 SURF TEMP OF HEAT FLUX SENSOR #229 (T262)2 SURF TEMP OF HEAT FLUX SENSOR #230 (T264)
3 HEATER DISCHARGE TEMP, CELL #4 (T265)4 PINK GLOBE TEMP CELL #4 472 CM FR S WALL 152 CM FR FLOOR (T512)
5 PINK GLOBE TEMP CELL #4 152 CM FR S WALL 152 CM FR FLOOR (T513)
6 OUTSIDE TEMP - MECH ASPIRATED- SOUTH (T514)
7 OUTSIDE TEMP - MECH ASPIRATED- NORTH (T515)8 BLACK GLOBE TEMP CELL 4 580 CM FR S WALL 152 CM FR FLOOR (T516)
ROW 32COLUMN
1 BLACK GLOBE TEMP CELL 4 275 CM FR S WALL 152 CM FR FLOOR (T517)2 AIR TEMP CELL #4 700 CM FROM S WALL 152 CM FROM FLOOR (T518)
3 AIR TEMP CELL#4 472 CM FROM S WALL 152 CM FROM FLOOR (T519)
4 AIR TEMP CELL#4 152 CM FROM S WALL 152 CM FROM FLOOR (T520)
5 GROUND TEMP PROBE CELL #2. 297 CM FROM BELOW FLOOR
391 CM FROM S WALL 144 CM FROM W WALL (T277)
6 GROUND TEMP PROBE CELL #2. 269 CM FROM BELOW FLOOR
391 CM FROM S WALL 144 CM FROM W WALL (T278)
7 GROUND TEMP PROBE CELL #2. 239 CM FROM BELOW FLOOR391 CM FROM S WALL 144 CM FROM W WALL (T279)
8 GROUND TEMP PROBE CELL #2, 208 CM FROM BELOW FLOOR391 CM FROM S WALL 144 CM FROM W WALL (T280)
• ••••••••••••••••••••••••••••••••••••••••••••••••••••••••••••••••••••••••ft**• •••••••••••••••••••••••••••••••••••••••••*•••••••••••••••••••••••••••••••••
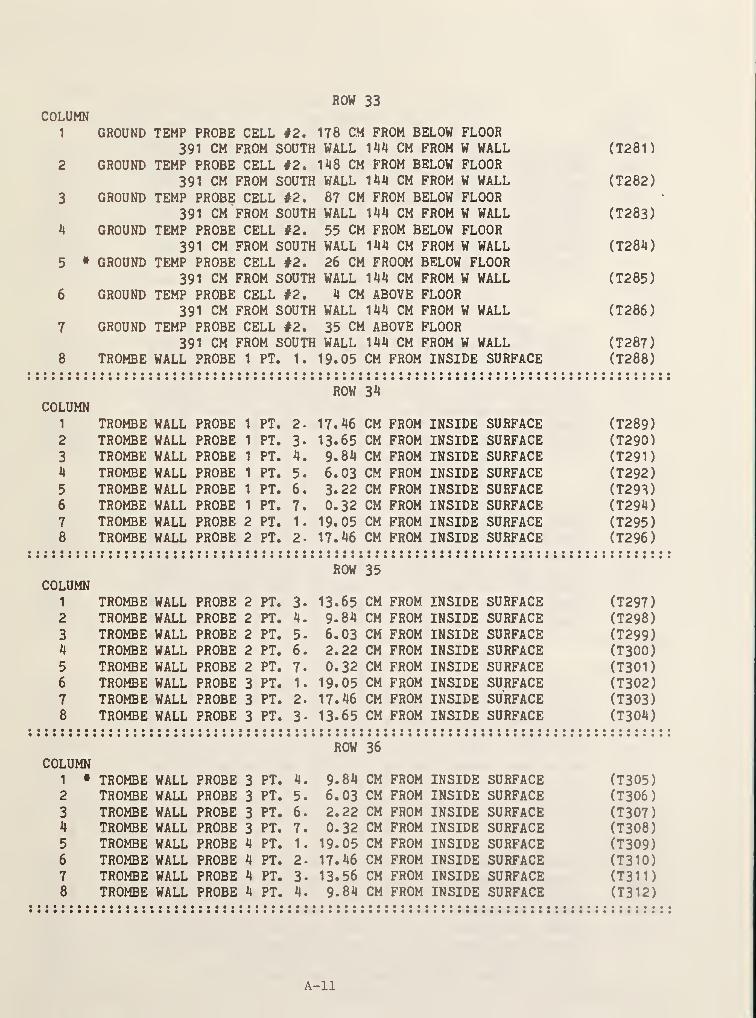
ROW 33COLUMN
1 GROUND TEMP PROBE CELL #2. 178 CM FROM BELOW FLOOR391 CM FROM SOUTH WALL 144 CM FROM W WALL (T281)
2 GROUND TEMP PROBE CELL #2. 148 CM FROM BELOW FLOOR391 CM FROM SOUTH WALL 144 CM FROM W WALL (T282)
3 GROUND TEMP PROBE CELL #2. 87 CM FROM BELOW FLOOR391 CM FROM SOUTH WALL 144 CM FROM W WALL (T283)
4 GROUND TEMP PROBE CELL #2. 55 CM FROM BELOW FLOOR391 CM FROM SOUTH WALL 144 CM FROM W WALL (T284)
5 • GROUND TEMP PROBE CELL #2. 26 CM FROOM BELOW FLOOR391 CM FROM SOUTH WALL 144 CM FROM W WALL (T285)
6 GROUND TEMP PROBE CELL #2. 4 CM ABOVE FLOOR391 CM FROM SOUTH WALL 144 CM FROM W WALL (T286)
7 GROUND TEMP PROBE CELL #2, 35 CM ABOVE FLOOR391 CM FROM SOUTH WALL 144 CM FROM W WALL (T287)
8 TROMBE WALL PROBE 1 PT. 1. 19.05 CM FROM INSIDE SURFACE (T288)
ROW 34COLUMN
1 TROMBE WALL PROBE 1 PT. 2- 17.46 CM FROM INSIDE SURFACE (T289)2 TROMBE WALL PROBE 1 PT. 3* 13.65 CM FROM INSIDE SURFACE (T290)
3 TROMBE WALL PROBE 1 PT. 4. 9.84 CM FROM INSIDE SURFACE (T291)4 TROMBE WALL PROBE 1 PT. 5. 6.03 CM FROM INSIDE SURFACE (T292)5 TROMBE WALL PROBE 1 PT. 6. 3.22 CM FROM INSIDE SURFACE (T293)6 TROMBE WALL PROBE 1 PT. 7. 0.32 CM FROM INSIDE SURFACE (T294)
7 TROMBE WALL PROBE 2 PT. 1. 19.05 CM FROM INSIDE SURFACE (T295)8 TROMBE WALL PROBE 2 PT. 2- 17.46 CM FROM INSIDE SURFACE (T296)
ROW 35COLUMN
1 TROMBE WALL PROBE 2 PT. 3- 13.65 CM FROM INSIDE SURFACE (T297)2 TROMBE WALL PROBE 2 PT. 4. 9-84 CM FROM INSIDE SURFACE (T298)
3 TROMBE WALL PROBE 2 PT. 5. 6.03 CM FROM INSIDE SURFACE (T299)4 TROMBE WALL PROBE 2 PT. 6. 2.22 CM FROM INSIDE SURFACE (T300)
5 TROMBE WALL PROBE 2 PT. 7. 0.32 CM FROM INSIDE SURFACE (T301)6 TROMBE WALL PROBE 3 PT. 1. 19.05 CM FROM INSIDE SURFACE (T302)
7 TROMBE WALL PROBE 3 PT. 2. 17.46 CM FROM INSIDE SURFACE (T303)
8 TROMBE WALL PROBE 3 PT. 3- 13.65 CM FROM INSIDE SURFACE (T304)
ROW 36
COLUMN1 * TROMBE WALL PROBE 3 PT. 4. 9-84 CM FROM INSIDE SURFACE (T305)2 TROMBE WALL PROBE 3 PT. 5. 6.03 CM FROM INSIDE SURFACE (T306)
3 TROMBE WALL PROBE 3 PT. 6. 2.22 CM FROM INSIDE SURFACE (T307)4 TROMBE WALL PROBE 3 PT. 7. 0.32 CM FROM INSIDE SURFACE (T308)
5 TROMBE WALL PROBE 4 PT. 1. 19.05 CM FROM INSIDE SURFACE (T309)6 TROMBE WALL PROBE 4 PT. 2- 17.46 CM FROM INSIDE SURFACE (T3 10 )
7 TROMBE WALL PROBE 4 PT. 3- 13.56 CM FROM INSIDE SURFACE (T311)8 TROMBE WALL PROBE 4 PT. 4. 9.84 CM FROM INSIDE SURFACE (T312)
A-ll
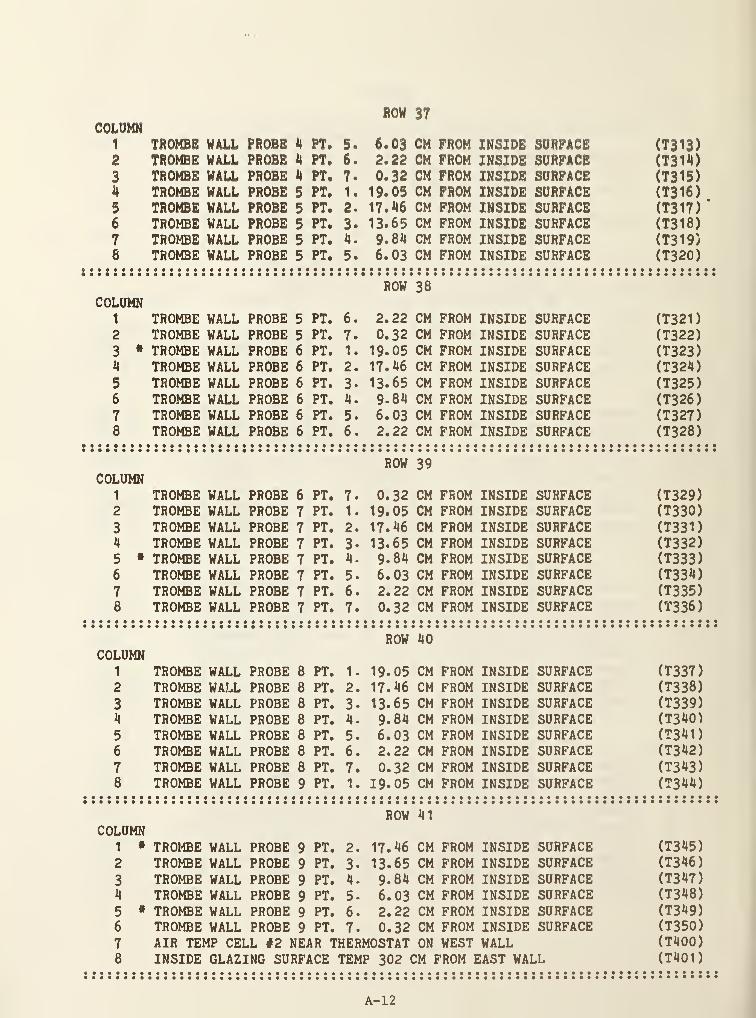
ROW 37COLUMN
1 TROMBE WALL PROBE 4 FT# 5. 6.03 CM FROM INSIDE SURFACE (T313)2 TROMBE WALL PROBE 4 PT. 6. 2.22 CM FROM INSIDE SURFACE (T314)
3 TROMBE WALL PROBE 4 PT. 7. 0.32 CM FROM INSIDE SURFACE (T315)4 TROMBE WALL PROBE 5 PT. 1. 19.05 CM FROM INSIDE SURFACE (T316)
5 TROMBE WALL PROBE 5 PT. 2. 17.46 CM FROM INSIDE SURFACE (T317)'
6 TROMBE WALL PROBE 5 PT. 3. 13.65 CM FROM INSIDE SURFACE (T3 18)
7 TROMBE WALL PROBE 5 PT. 4. 9.84 CM FROM INSIDE SURFACE (T319)6 TROMBE WALL PROBE 5 PT. 5. 6.03 CM FROM INSIDE SURFACE (T320)
ROW 38COLUMN
1 TROMBE WALL PROBE 5 PT. 6 . 2. 22 CM FROM INSIDE SURFACE (T321)2 TROMBE WALL PROBE 5 PT. 7. 0.32 CM FROM INSIDE SURFACE (T322)
3 • TROMBE WALL PROBE 6 PT. 1. 19.05 CM FROM INSIDE SURFACE (T323)4 TROMBE WALL PROBE 6 PT. 2. 17.46 CM FROM INSIDE SURFACE (T324)
5 TROMBE WALL PROBE 6 PT. 3- 13.65 CM FROM INSIDE SURFACE (T325)
6 TROMBE WALL PROBE 6 PT. 4. 9-84 CM FROM INSIDE SURFACE (T326)
7 TROMBE WALL PROBE 6 PT. 5. 6.03 CM FROM INSIDE SURFACE (T327)8 TROMBE WALL PROBE 6 PT. 6. 2.22 CM FROM INSIDE SURFACE (T328)
ROW 39COLUMN
1 TROMBE WALL PROBE 6 PT. 7. 0.32 CM FROM INSIDE SURFACE (T329)2 TROMBE WALL PROBE 7 PT. 1. 19.05 CM FROM INSIDE SURFACE (T330)
3 TROMBE WALL PROBE 7 PT. 2. 17.46 CM FROM INSIDE SURFACE (T331)4 TROMBE WALL PROBE 7 PT. 3* 13.65 CM FROM INSIDE SURFACE (T332)
5 • TROMBE WALL PROBE 7 PT. 4- 9.84 CM FROM INSIDE SURFACE (T333)
6 TROMBE WALL PROBE 7 PT. 5. 6.03 CM FROM INSIDE SURFACE (T334)
7 TROMBE WALL PROBE 7 PT. 6. 2.22 CM FROM INSIDE SURFACE (T335)
8 TROMBE WALL PROBE 7 PT. 7. 0.32 CM FROM INSIDE SURFACE (T336)
ROW 40COLUMN
1 TROMBE WALL PROBE 8 PT. 1. 19-05 CM FROM INSIDE SURFACE (T337)
2 TROMBE WALL PROBE 8 PT. 2. 17.46 CM FROM INSIDE SURFACE (T338)
3 TROMBE WALL PROBE 8 PT. 3- 13.65 CM FROM INSIDE SURFACE (T339)
4 TROMBE WALL PROBE 8 PT. 4- 9-84 CM FROM INSIDE SURFACE (T340)
5 TROMBE WALL PROBE 8 PT. 5. 6.03 CM FROM INSIDE SURFACE (T341)
6 TROMBE WALL PROBE 8 PT. 6. 2.22 CM FROM INSIDE SURFACE (T342)
7 TROMBE WALL PROBE 8 PT. 7. 0.32 CM FROM INSIDE SURFACE (T343)
8 TROMBE WALL PROBE 9 PT. 1. 19-05 CM FROM INSIDE SURFACE (T344)
ROW 41
COLUMN1 • TROMBE WALL PROBE 9 PT. 2. 17.46 CM FROM INSIDE SURFACE (T345)
2 TROMBE WALL PROBE 9 PT. 3- 13.65 CM FROM INSIDE SURFACE (T346)
3 TROMBE WALL PROBE 9 PT. 4. 9.84 CM FROM INSIDE SURFACE (T347)
4 TROMBE WALL PROBE 9 PT. 5- 6.03 CM FROM INSIDE SURFACE (T348)
5 * TROMBE WALL PROBE 9 PT. 6 . 2. 22 CM FROM INSIDE SURFACE (T349)
6 TROMBE WALL PROBE 9 PT. 7. 0.32 CM FROM INSIDE SURFACE (T350)
7 AIR TEMP CELL #2 NEAR THERMOSTAT ON WEST WALL (T400)
8 INSIDE GLAZING SURFACE TEMP 302 CM FROM EAST WALL (T401)
A-12

ROW 42COLUMN
1 INSIDE GLAZING SURFACE TEMP 180 CM FROM EAST WALL (T402)
2 INSIDE GLAZING SURFACE TEMP 71 CM FROM EAST WALL (T403)
3 OUTSIDE T-WALL SURFACE TEMP 302 CM FROM EAST WALL (T404)4 OUTSIDE T-WALL SURFACE TEMP 180 CM FROM EAST WALL (T405)
5 OUTSIDE T-WALL SURFACE TEMP 71 CM FROM EAST WALL (T406)
6 UPPER WEST SIDE VENT AIR TEMP IN TROMBE WALL (T407)
7 LOWER WEST SIDE VENT AIR TEMP IN TROMBE WALL (T408)8 UPPER EAST SIDE VENT AIR TEMP IN TROMBE WALL (T409)
ROW 43
COLUMN1 LOWER EAST SIDE VENT AIEt TEMP IN TROMBE WALL (T410)2 OUTSIDE AIR TEMP NORTH SIDE (MECH ASPIRATED SHIELD) (T411)
3 AIR TEMP CELL #2 580 CM FROM S WALL 10 CM FROM FLOOR (T412)4 AIR TEMP CELL #2 580 CM FROM S WALL 20 CM FROM FLOOR ( T4 1 3
)
5 AIR TEMP CELL #2 580 CM FROM S WALL 30 CM FROM FLOOR (T414)6 AIR TEMP CELL #2 580 CM FROM S WALL 80 CM FROM FLOOR (T415)
7 AIR TEMP CELL #2 580 CM FROM S WALL 127 CM FROM FLOOR (T416)8 AIR TEMP CELL #2 580 CM FROM S WALL 175 CM FROM FLOOR (T417)
ROW 44
COLUMN1 AIR TEMP CELL #2 580 CM FROM S WALL 224 CM FROM FLOOR (T418)2 AIR TEMP CELL #2 580 CM FROM S WALL 272 CM FROM FLOOR (T419)
3 AIR TEMP CELL #2 580 CM FROM S WALL 320 CM FROM FLOOR (T420)4 AIR TEMP CELL #2 580 CM FROM S WALL 368 CM FROM FLOOR (T421
)
5 AIR TEMP CELL #2 275 CM FROM S WALL 10 CM FROM FLOOR (T422)6 AIR TEMP CELL #2 275 CM FROM S WALL 20 CM FROM FLOOR (T423)
7 AIR TEMP CELL #2 275 CM FROM S WALL 30 CM FROM FLOOR (T424)8 AIR TEMP CELL #2 275 CM FROM S WALL 76 CM FROM FLOOR (T425)
ROW 45
COLUMN1 AIR TEMP CELL #2 275 CM FROM S WALL 122 CM FROM FLOOR (T426
)
2 AIR TEMP CELL #2 275 CM FROM S WALL 168 CM FROM FLOOR (T427)
3 AIR TEMP CELL #2 275 CM FROM S WALL 213 CM FROM FLOOR (T428)4 AIR TEMP CELL #2 275 CM FROM S WALL 224 CM FROM FLOOR (T429)
5 AIR TEMP CELL #2 275 CM FROM S WALL 234 CM FROM FLOOR (T430)6 SLOPED CEIL TEMP 97 CM FROM CLRSTRY 122 CM W OF CENTER LINE (T43 1
)
7 * SLOPED CEIL TEMP 97 CM FROM CLRSTRY ON CENTER LINE (T432)8 SLOPED CEIL TEMP 97 CM FROM CLRSTRY 122 CM E OF CENTER LINE (T433)
ROW 46
COLUMN1 SLOPED CEIL TEMP 290 CM FROM CLRSTRY 122 CM W OF CENTER LINE (T434)2 SLOPED CEIL TEMP 290 CM FROM CLRSTRY ON CENTER LINE (T4 35
)
3 SLOPED CEIL TEMP 290 CM FROM CLRSTRY 122 CM E OF CENTER LINE (T4 36
)
4 FLAT CEIL TEMP 122 CM FROM S WALL 122 CM W OF CENTER LINE (T4 37
)
5 FLAT CEIL TEMP 122 CM FROM S WALL ON CENTER LINE ( T4 38
)
6 FLAT CEIL TEMP 122 CM FROM S WALL 122 CM E OF CENTER LINE (T439)7 FLAT CEIL TEMP 366 CM FROM S WALL 122 CM W OF CENTER LINE (T440)8 FLAT CEIL TEMP 366 CM FROM S WALL ON CENTER LINE (T441)
A-13
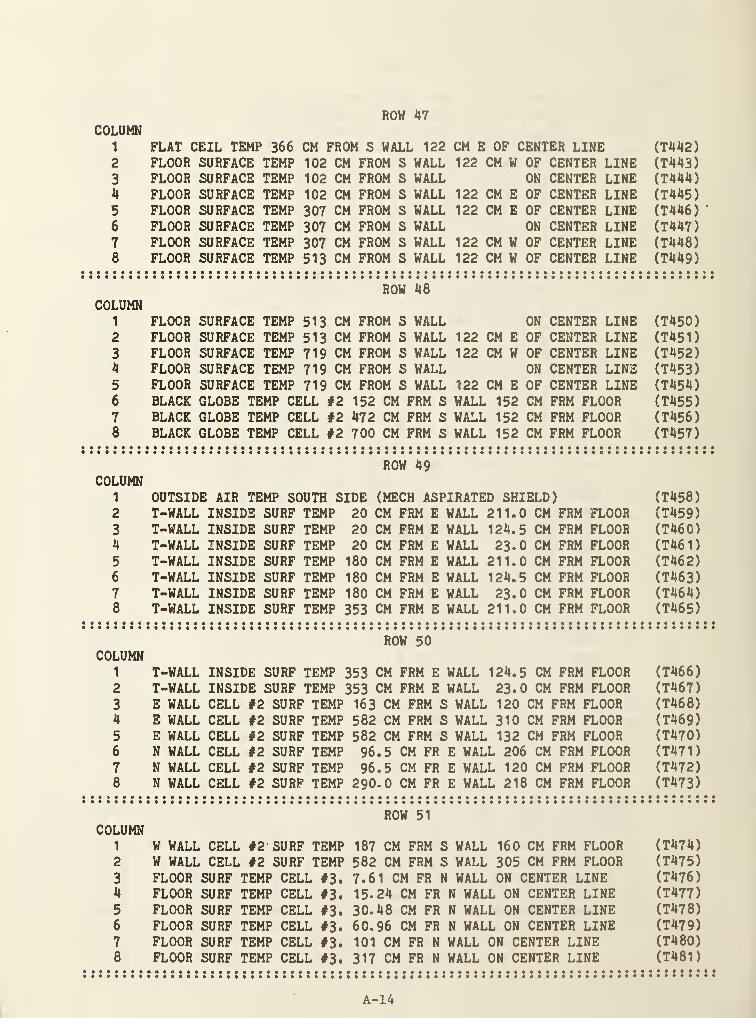
ROW 47COLUMN
1 FLAT CEIL TEMP 366 CM FROM S WALL 122 CM E OF CENTER LINE (T442)2 FLOOR SURFACE TEMP 102 CM FROM S WALL 122 CM W OF CENTER LINE (T443)
3 FLOOR SURFACE TEMP 102 CM FROM S WALL ON CENTER LINE (T444)4 FLOOR SURFACE TEMP 102 CM FROM S WALL 122 CM E OF CENTER LINE (T445)
5 FLOOR SURFACE TEMP 307 CM FROM S WALL 122 CM E OF CENTER LINE (T446)’
6 FLOOR SURFACE TEMP 307 CM FROM S WALL ON CENTER LINE (T447)
7 FLOOR SURFACE TEMP 307 CM FROM S WALL 122 CM W OF CENTER LINE (T448)8 FLOOR SURFACE TEMP 513 CM FROM S WALL 122 CM W OF CENTER LINE (T449)
ROW 48COLUMN
1 FLOOR SURFACE TEMP 513 CM FROM S WALL ON CENTER LINE (T450)2 FLOOR SURFACE TEMP 513 CM FROM S WALL 122 CM E OF CENTER LINE (T451)
3 FLOOR SURFACE TEMP 719 CM FROM S WALL 122 CM W OF CENTER LINE (T452)4 FLOOR SURFACE TEMP 719 CM FROM S WALL ON CENTER LINE (T453)
5 FLOOR SURFACE TEMP 719 CM FROM S WALL 122 CM E OF CENTER LINE (T454)6 BLACK GLOBE TEMP CELL #2 152 CM FRM S WALL 152 CM FRM FLOOR (T455)
7 BLACK GLOBE TEMP CELL #2 472 CM FRM S WALL 152 CM FRM FLOOR (T456)8 BLACK GLOBE TEMP CELL #2 700 CM FRM S WALL 152 CM FRM FLOOR (T457)
ROW 49COLUMN
1 OUTSIDEI AIR TEMP SOUTH SIDE (MECH ASPIRATED SHIELD) (T458)2 T-WALL INSIDE SURF TEMP 20 CM FRM E WALL 211.0 CM FRM FLOOR (T459)
3 T-WALL INSIDE SURF TEMP 20 CM FRM E WALL 124.5 CM FRM FLOOR (T460)4 T-WALL INSIDE SURF TEMP 20 CM FRM E WALL 23.0 CM FRM FLOOR (T46 1
)
5 T-WALL INSIDE SURF TEMP 180 CM FRM E WALL 211.0 CM FRM FLOOR (T462)6 T-WALL INSIDE SURF TEMP 180 CM FRM E WALL 124.5 CM FRM FLOOR (T463)
7 T-WALL INSIDE SURF TEMP 180 CM FRM E WALL 23.0 CM FRM FLOOR (T464)8 T-WALL INSIDE SURF TEMP 353 CM FRM E WALL 211.0 CM FRM FLOOR (T465)
ROW 50COLUMN
1 T-WALL INSIDE SURF TEMP 353 CM FRM E WALL 124.5 CM FRM FLOOR (T466)
2 T-WALL INSIDE SURF TEMP 353 CM FRM E WALL 23.0 CM FRM FLOOR (T467)
3 E WALL CELL #2 SURF TEMP 163 CM FRM S WALL 120 CM FRM FLOOR (T468)
4 E WALL CELL #2 SURF TEMP 582 CM FRM S WALL 310 CM FRM FLOOR (T469)
5 E WALL CELL #2 SURF TEMP 582 CM FRM S WALL 132 CM FRM FLOOR (T470)6 N WALL CELL #2 SURF TEMP 96.5 CM FR E WALL 206 CM FRM FLOOR (T471)
7 N WALL CELL #2 SURF TEMP 96.5 CM FR E WALL 120 CM FRM FLOOR (T472)8 N WALL CELL #2 SURF TEMP 290-0 CM FR E WALL 218 CM FRM FLOOR (T473)
COLUMN1 W WALL CELL #2 SURF TEMP2 W WALL CELL #2 SURF TEMP
3 FLOOR SURF TEMP CELL #3.4 FLOOR SURF TEMP CELL #3.
5 FLOOR SURF TEMP CELL #3.6 FLOOR SURF TEMP CELL #3.
7 FLOOR SURF TEMP CELL #3.8 FLOOR SURF TEMP CELL #3.
• •••••••••••••••••••••••••••a**
ROW 51
187 CM FRM S WALL 160 CM FRM FLOOR582 CM FRM S WALL 305 CM FRM FLOOR7.61 CM FR N WALL ON CENTER LINE15.24 CM FR N WALL ON CENTER LINE30.48 CM FR N WALL ON CENTER LINE60.96 CM FR N WALL ON CENTER LINE101 CM FR N WALL ON CENTER LINE
317 CM FR N WALL ON CENTER LINE
(T474)(T475)
(T476)(T477)
(T478)
(T479)(T480)
(T481)
A-14
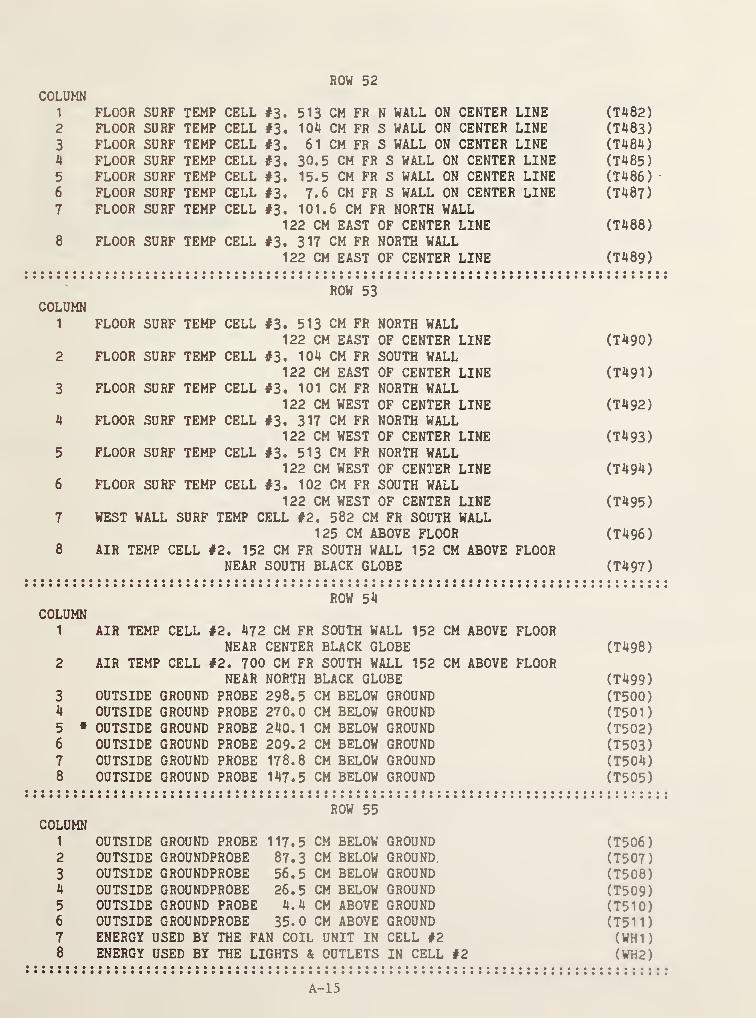
ROW 52COLUMN
1 FLOOR SURF TEMP CELL #3. 513 CM FR N WALL ON CENTER LINE (T482)2 FLOOR SURF TEMP CELL #3. 104 CM FR S WALL ON CENTER LINE (T483)
3 FLOOR SURF TEMP CELL #3. 61 CM FR S WALL ON CENTER LINE (T484)4 FLOOR SURF TEMP CELL #3. 30.5 CM FR S WALL ON CENTER LINE (T485)
5 FLOOR SURF TEMP CELL #3. 15.5 CM FR S WALL ON CENTER LINE (T486
)
6 FLOOR SURF TEMP CELL #3. 7.6 CM FR S WALL ON CENTER LINE (T487)
7 FLOOR SURF TEMP CELL #3. 101.6 CM FR NORTH WALL122 CM EAST OF CENTER LINE (T488)
8 FLOOR SURF TEMP CELL #3. 317 CM FR NORTH WALL122 CM EAST OF CENTER LINE (T489)
ROW 53COLUMN
1 FLOOR SURF TEMP CELL #3. 513 CM FR NORTH WALL122 CM EAST OF CENTER LINE (T490)
2 FLOOR SURF TEMP CELL #3. 104 CM FR SOUTH WALL122 CM EAST OF CENTER LINE (T491)
3 FLOOR SURF TEMP CELL #3. 101 CM FR NORTH WALL122 CM WEST OF CENTER LINE (T492)
4 FLOOR SURF TEMP CELL #3. 317 CM FR NORTH WALL122 CM WEST OF CENTER LINE (T493)
5 FLOOR SURF TEMP CELL #3. 513 CM FR NORTH WALL122 CM WEST OF CENTER LINE (T494)
6 FLOOR SURF TEMP CELL #3. 102 CM FR SOUTH WALL122 CM WEST OF CENTER LINE (T495)
WEST WALL SURF TEMP CELL #2, 532 CM FR SOUTH WALL125 CM ABOVE FLOOR (T496)
AIR TEMP CELL #2. 152 CM FR SOUTH WALL 152 CM ABOVE FLOORNEAR SOUTH BLACK GLOBE (T497)
ROW 54COLUMN
1 AIR TEMP CELL #2. 472 CM FR SOUTH WALL 152 CM ABOVE FLOORNEAR CENTER BLACK GLOBE (T498)
2 AIR TEMP CELL #2. 700 CM FR SOUTH WALL 152 CM ABOVE FLOORNEAR NORTH BLACK GLOBE (T499)
3 OUTSIDE GROUND PROBE 298.5 CM BELOW GROUND (T500)4 OUTSIDE GROUND PROBE 270.0 CM BELOW GROUND (T501)
5 • OUTSIDE GROUND PROBE 240.1 CM BELOW GROUND (T502)6 OUTSIDE GROUND PROBE 209-2 CM BELOW GROUND (T503)
7 OUTSIDE GROUND PROBE 178.8 CM BELOW GROUND (T504)8 OUTSIDE GROUND PROBE 147.5 CM BELOW GROUND (T505)
• •••••••••••••••••••••••••••••••••••••••••••••••••••••••••••••••••••••a*******ROW 55
COLUMN1 OUTSIDE GROUND PROBE 117.5 CM BELOW GROUND (T506)2 OUTSIDE GROUNDPROBE 87.3 CM BELOW GROUND. (T507)
3 OUTSIDE GROUNDPROBE 56.5 CM BELOW GROUND (T508)4 OUTSIDE GROUNDPROBE 26.5 CM BELOW GROUND (T509)5 OUTSIDE GROUND PROBE 4.4 CM ABOVE GROUND (T510)6 OUTSIDE GROUNDPROBE 35.0 CM ABOVE GROUND (T511)7 ENERGY USED BY THE FAN COIL UNIT IN CELL #2 (WH1
)
8 ENERGY USED BY THE LIGHTS & OUTLETS IN CELL #2 (WH2)
A-15
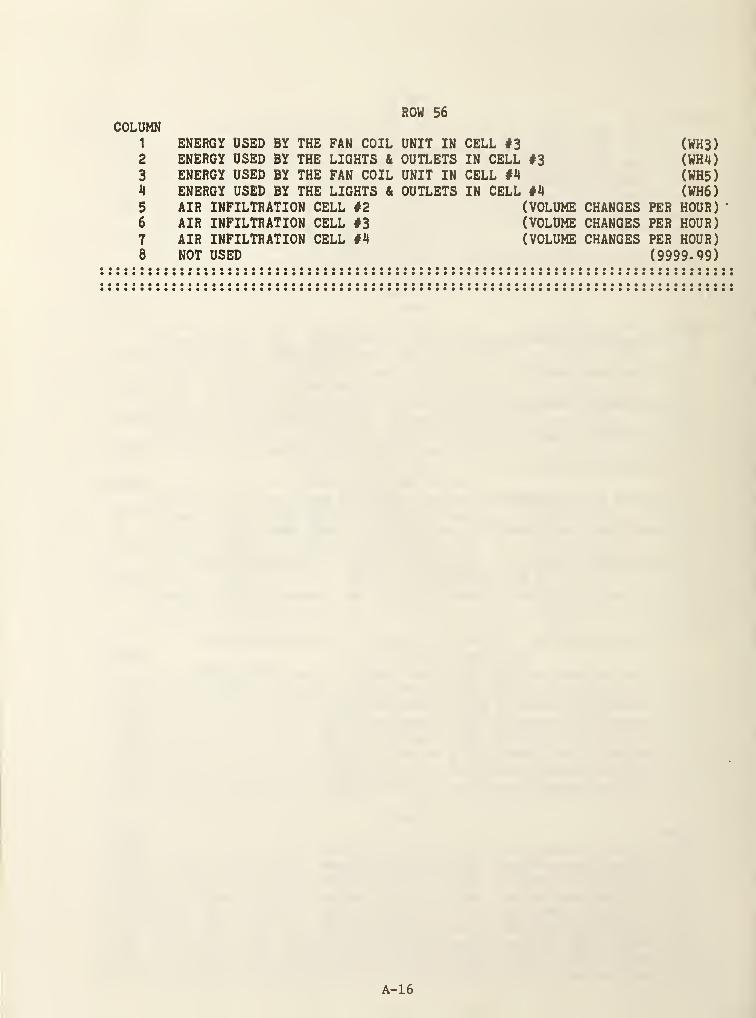
ROW 56COLUMN
1
2
3
4
5
6
7
8
ENERGY USED BY THE FAN COIL UNIT INENERGY USED BY THE LIGHTS & OUTLETSENERGY USED BY THE FAN COIL UNIT IN
ENERGY USED BY THE LIGHTS & OUTLETSAIR INFILTRATION CELL #2AIR INFILTRATION CELL #3AIR INFILTRATION CELL #4NOT USED
CELL #3 (WH3)IN CELL #3 (WH4)CELL #4 (WHS
)
IN CELL #4 (WH6)
(VOLUME CHANGES PER HOUR)(VOLUME CHANGES PER HOUR)(VOLUME CHANGES PER HOUR)
(9999-99)
A-16
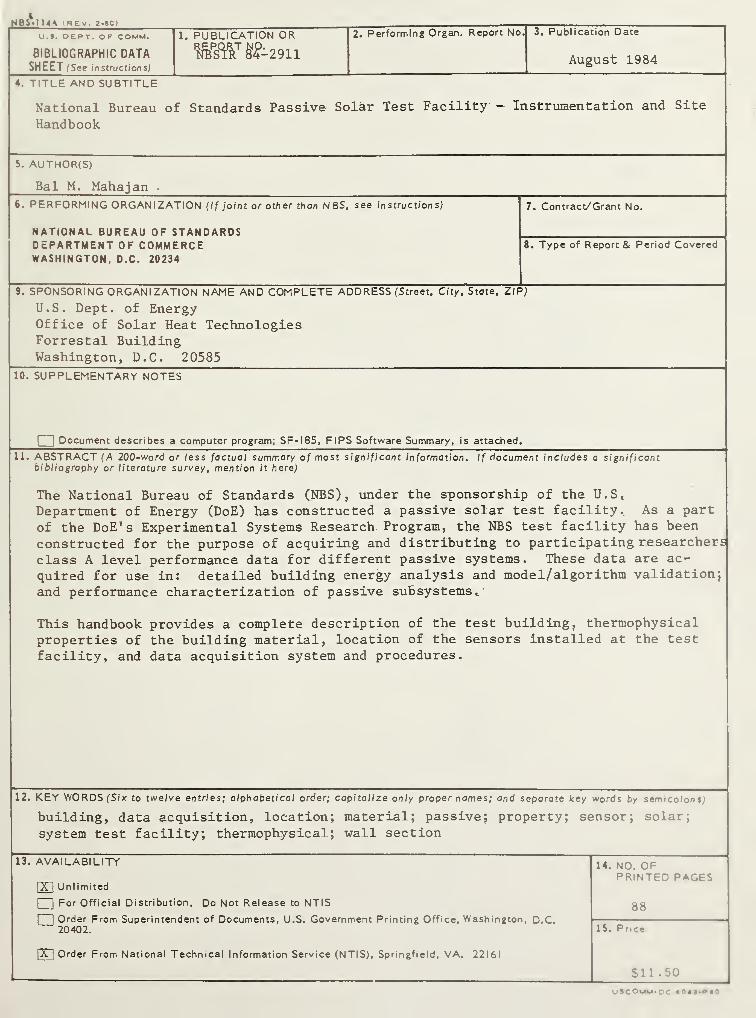
HBS»1 14A (rev. 2 »ac)
U.». DEPT. OF COMM.
BIBLIOGRAPHIC DATASHEET (See i instruction s)
1. PUBLICATION OR
2911
2. Performing Organ. Report No 3. Publication Date
August 1984
4. TITLE AND SUBTITLE
National Bureau of Standards Passive Solar Test Facility - Instrumentation and Site
Handbook
5. AUTHOR(S)
Bal M. Mahajan -
6. PERFORMING ORGANIZATION (If joint or other than NBS, see instructions)
national bureau of standardsDEPARTMENT OF COMMERCEWASHINGTON, D.C. 20234
7. Contract/Grant No.
8. Type of Report & Period Covered
9. SPONSORING ORGANIZATION NAME AND COMPLETE ADDRESS (Street, City, State, ZIP)
U.S. Dept, of EnergyOffice of Solar Heat TechnologiesForrestal BuildingWashington, D.C. 20585
10. supplementary notes
_j Document describes a computer program; SF-185, FIPS Software Summary, is attached.
11. ABSTRACT (A 200-word or less factual sumrr.ary of most significant information. If document includes a significantbibliography or literature survey, mention it here)
The National Bureau of Standards (NBS), under the sponsorship of the U.S,
Department of Energy (DoE) has constructed a passive solar test facility. As a part
of the DoE’s Experimental Systems Research Program, the NBS test facility has been
constructed for the purpose of acquiring and distributing to participating researchers
class A level performance data for different passive systems. These data are ac-
quired for use in: detailed building energy analysis and model/algorithm validation}
and performance characterization of passive subsystems.
This handbook provides a complete description of the test building, thermophysicalproperties of the building material, location of the sensors installed at the test
facility, and data acquisition system and procedures.
12. KEY WORDS (Six to twelve entries; alphabetical order ; capitalize only proper names; and separate key words by sc^
'
colon s,
building, data acquisition, location; material; passive; property; sensor; solar;
system test facility; thermophysical; wall section
13. AVAILABILITY
|XI
Unlimited
| |For Official Distribution. Do Not Release to NTIS
~j Order From Superintendent of Documents, U.S. Government Printing Office, Washington, D.C.20402.
X_ Order From National Technical Information Service (NTIS), Springfield, VA. 22161
14. NO. OFPRINTED PAGES
88
15. Pr.c<
$11.50