test report for eiao version 2.2 of the observatory software
TRANSCRIPT
EIAOEuropean Internet Accessibility Observatory
Project no.: IST2003004526 STREP
Test report for EIAO version 2.2 of the Observatory software
D 5.3.14
Version: 1.0Date: 20080508
Author: Morten Goodwin Olsen, Nils UlltveitMoe, Annika Nietzio, Mikael Snaprud, Anand B. Pillai
Dissemination Level: PublicStatus: Release Candidate
License:
This work is licensed under the Creative Commons AttributionShareAlike License. To view a copy of this license, visit http://creativecommons.org/licenses/bysa/2.5/ or send a letter to Creative Commons, 543 Howard Street, 5th Floor, San Francisco, California, 94105, USA.
This document consists of 52 pages including this cover


D5.3.14 Version: 0.73
Abstract
In this document we present results from testing version 2.2 of the Observatory. Most significantly, we have completed the most important requirement a complete crawl and evaluation of more than 2 500 public European web sites based on UWEM1.2. The currently achieved evaluation capacity is 100 sites per day.
1

D5.3.14 Version: 0.73
Test overview
Test Short description
Unit tests
Doc tests Functions perform according to the specified input / output.
Known paths Paths are automatically tested.
Unknown/critical paths Test cases are written for all registered bugs and errors, to avoid that old errors reappear.
Integration
Endtoend test All parts of the Observatory are able to communicate with each other.
Conformance / Repeatability tests
Repeatability tests The evaluation of one web site is repeatable.
UWEM Conformance Testing is in conformance with UWEM.
System test
System tests Tests specifically designed to test parts of the Observatory (including the complete Observatory).
Regression tests Repeat of previous tests.
Performance tests
Performance Results from optimisation process.
Time Profiling The amount of time used by each part of the Observatory.
CPU Profiling The amount of CPU used by each part of the Observatory.
Memory Profiling The amount of Memory used by each part of the Observatory.
Scalability Indications of the scalability of the Observatory.
Table 1: General test overview
2
Unit
Integration
Conformance
System
Performance

D5.3.14 Version: 0.73
Version Control
Version Status Date Change Author0.1 DRAFT 20080217 Initial Draft Morten Goodwin Olsen0.2 DRAFT 20080221 Updated and added more detailed
performance data,added conclusion, abstract.General cleanup.
Morten Goodwin Olsen
0.3 DRAFT 20080226 Integrated comments from Nils UlltveitMore, Annika Nietzio and Terje Gjøsæter
Morten Goodwin Olsen
0.4 DRAFT 20080427 Large update of scalability analysis. Update of tests according to new requirements. General update according to new data.
Morten Goodwin Olsen
0.5 RC 20080428 Updated based on data from the most recent test run.
Morten Goodwin Olsen
0.6 RC 20080504 Integrated comments from Nils UlltveitMoe, Annika Nietzio, Terje Gjøsæter, and Mikael Snaprud
Morten Goodwin Olsen
0.7 RC 20080508 Uptaded with data in the online reporting tool.Integrated URL analysis from Anand.Updated open issues.
Morten Goodwin Olsen
0.71 RC 20080508 Minor update based on fix in the Sampler.
Morten Goodwin Olsen
0.72 RC 20080513 Integrated comments from Nils UlltveitMoe.
Morten Goodwin Olsen
0.73 RC 20080513 Updated wrong performance increase of WAM
Morten Goodwin Olsen, Nils UlltveitMoe
1.0 FINAL 20080514 Made Final Morten Goodwin Olsen
3

D5.3.14 Version: 0.73
Table of Contents1 Introduction............................................................................................................................................................6
1.1 Scope.............................................................................................................................................................61.2 Objective.......................................................................................................................................................61.3 Related work and readers instructions..........................................................................................................61.4 Test overview ...............................................................................................................................................6
2 Test status.............................................................................................................................................................92.1 Fault density of the EIAO Observatory........................................................................................................10
2.1.1 Crawler fault density............................................................................................................................112.1.2 Sampler fault density..........................................................................................................................122.1.3 WAM fault density...............................................................................................................................122.1.4 Data Warehouse and online reporting tool fault density....................................................................12
2.2 Open bug reports........................................................................................................................................133 Achievements......................................................................................................................................................15
3.1 Crawler optimisations..................................................................................................................................163.1.1 Optimised download protocol..............................................................................................................163.1.2 Performance optimisations.................................................................................................................16
3.2 WAM optimisations......................................................................................................................................173.3 Other achievements....................................................................................................................................173.4 ETL load optimisation..................................................................................................................................183.5 Data Warehouse optimisations...................................................................................................................183.6 Online reporting tool (GUI) optimisations..................................................................................................19
4 Observatory robustness......................................................................................................................................205 Scalability.............................................................................................................................................................23
5.1 Observatory Scalability...............................................................................................................................235.1.1 Initial phase 60<t<200 (60 hours to 200 hours)..................................................................................245.1.2 Middle phase 200<t<1700 (200 hours to 1700 hours)........................................................................255.1.3 Final phase t>1700 (more than 1700 hours).......................................................................................26
5.2 Crawler Scalability......................................................................................................................................295.3 Sampler Scalability.....................................................................................................................................31
5.3.1 URL repository interaction..................................................................................................................345.4 WAM Scalability..........................................................................................................................................345.5 ETL Scalability............................................................................................................................................36
6 Conformance and repeatability............................................................................................................................38
4
D5.3.14 Version: 0.73
7 Endtoend test....................................................................................................................................................398 Conclusion...........................................................................................................................................................409 Further work.........................................................................................................................................................4010 Appendix A Unit testing.....................................................................................................................................42
10.1 Doc tests....................................................................................................................................................4210.2 Tests of known paths................................................................................................................................4210.3 Tests of unknown / critical paths...............................................................................................................43
11 Appendix B Performance testing.......................................................................................................................4411.1 Optimisation process.................................................................................................................................44
12 Appendix C: System Tests.................................................................................................................................4513 Appendix D: Calcultion of Linear Regression....................................................................................................50
5

D5.3.14 Version: 0.73
1 Introduction
1.1 Scope
This report describes the tests and test results for the current Observatory software version towards release R2.2. This version is based on release 2.1 with added support for UWEM 1.2 tests. Observatory release 2.1 focuses on performance enhancements, to improve the crawling speed and stability to support more extensive crawling of web sites. Both areas of the Observatory capabilities are covered by the tests described in this document.
An endtoend test, including crawling, sampling and loading of data was demonstrated for version 2.2. It verified that the production line of components in the Observatory are able to handle 600 samples per web site, and it demonstrated crawling of 2 500 web sites1, with up to 6 000 pages crawled per site.
1.2 Objective
The objective of the test report is to provide information on the status towards large scale automatic accessibility evaluation and status of the test coverage with respect to the system test case list.
1.3 Related work and readers instructions
The document is related to the following documents:
– The UWEM Indicator refinement paper [2] contains a detailed requirement analysis of the statistical properties of several algorithms.
– The Documented Source Code includes a description of our current implementation.
1.4 Test overview
The following tests have been run on the Observatory:● Unit tests:
● Doc tests of many functions with return statements or state changing. A doc test is a simple test specifying the input and output of a function.
● Unit tests of known paths. Critical parts of the implemented software have been unit tested.
● Unit test of unknown paths. Previous errors that are easily repeatable have been inserted as unit tests.
1 The 2 500 sites have been collected for the Capgemini 20 services report, and are intended to be representative sites for each European country [1]. Additional URLs on the European level have been provided by Francois Junique, the EIAO project officer. Note that original list of sites from Capgemeni is larger than 2 500. However, several of these sites have been discarded as explained in chapter 4.
6

D5.3.14 Version: 0.73
● Performance tests:The performance tests are used to locate the most critical bottlenecks in the Observatory that limits the performance in terms of speed. ● Time and CPU profiling:
These tests show how much time and CPU each part of the Observatory uses. These profiling tests were used to identify the worst bottlenecks.
● Scalability test:Test if the Observatory is able to scale to 2 500 web sites and more.
● Memory test:Check that there is no memory leak in the Observatory. The memory usages does not increase as the Crawler is running over time.
● Conformance / Repeatability tests:The conformance tests show that the output produced is corresponding to the expected output. In the Observatory we show that the reported test results are valid results. This includes:● Repeatability: Evaluation of one web site several times ends up in similar retrieved accessibility scores.
● UWEM conformance:● WAM results are in conformance with UWEM● All sampling is according to our uniform sampling strategy.
● Endtoend test:An endtoend test is an extension of integration testing, it shows that all parts of the Observatory are able to communicate. The endtoend test is simply an integration test when all parts of the Observatory have been integrated. In the endtoend test we do not prove that the communication is without errors, only that the data flow of all software components in the Observatory are working. The validity of the results is tested in the conformance tests.
● System tests:The system tests are designed to test different parts of the EIAO Observatory (including the complete Observatory). In contrast to the endtoend test, the System tests are performed when the complete Observatory is implemented and do not focus on the communications between the components (which is done in an endtoend test) but proves that different parts of the Observatory are working correctly.
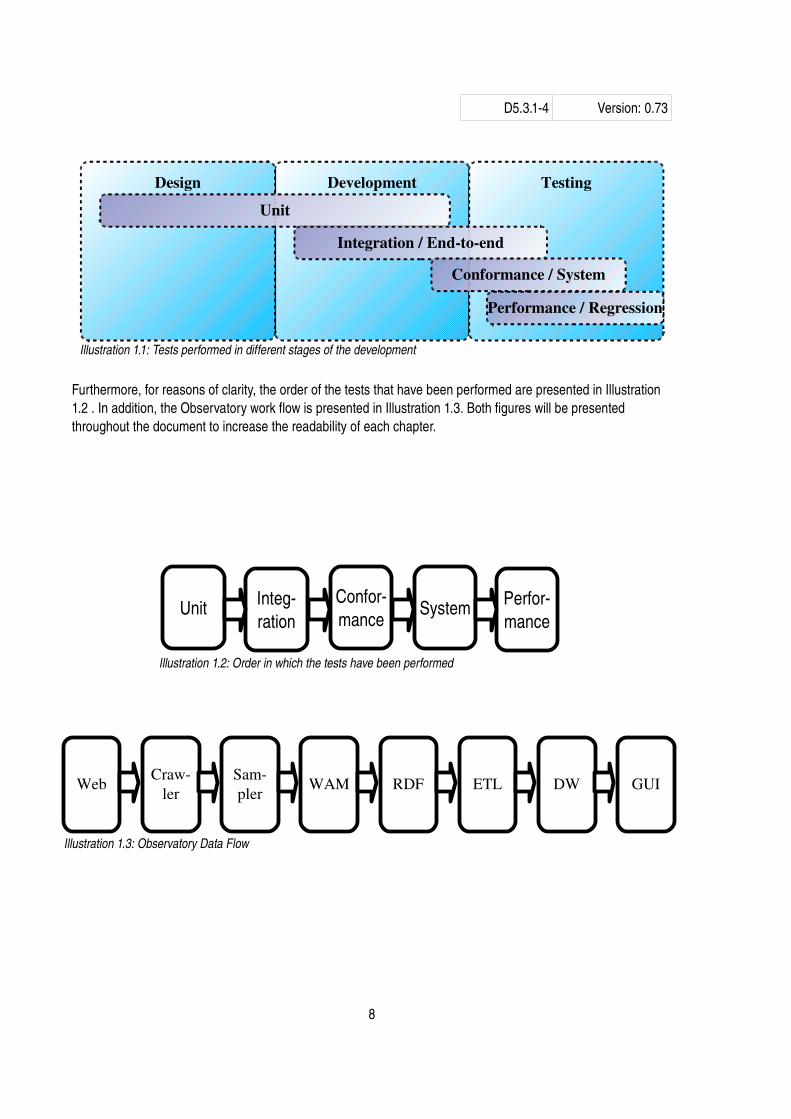
All tests are performed in different stages of the development. The stages / tests are shown in illustration 1.1.
7
D5.3.14 Version: 0.73
Furthermore, for reasons of clarity, the order of the tests that have been performed are presented in Illustration1.2 . In addition, the Observatory work flow is presented in Illustration 1.3. Both figures will be presented throughout the document to increase the readability of each chapter.
8
Illustration 1.3: Observatory Data Flow
WebCraw
lerSampler
WAM RDF ETL DW GUI
Illustration 1.1: Tests performed in different stages of the development
Development TestingDesign
Unit
Integration / Endtoend
Performance / Regression
Conformance / System
Illustration 1.2: Order in which the tests have been performed
Integration
Conformance
Unit System Performance

D5.3.14 Version: 0.73
2 Test status
Illustration 1 shows the overview of tests passed, failed and not yet executed during the testing phase of version 2.2 of the Observatory.
9
Illustration 1: Tests passed, failed, not yet executed
EndTo
End Scalab
ility
Conf. W
AMCon
f.
Crawler
Conf.
Sample
r
URL / ETL
DW / GUI
Install
. /
Maintan
.
0
4
8
12
16
20
24
28
Not Yet Executed
FailPassNu
mbe
r of t
ests

D5.3.14 Version: 0.73
Of all the executed tests, only two fail so far:T3.2.1.7 Crawler stop criterion.
The Crawler occasionally is not able to stop crawling after it has reached 6000 pages. A result of this is that web site coverage is better than the requirement. I.e. this issue only impacts the precision of the results in a positive manner, which is the reason this bug has not been prioritized. However, this of course impacts the performance of the Observatory in a negative manner.
Furthermore, test cases that have the highest importance have all passed. This includes test cases such as running a complete endtoend test of the Observatory. In total, 61 of the 80 tests have passed (76.25%). 2 tests have failed (1.25%) while 18 tests (22.5%) have not been executed.
The first complete endtoend test run using UWEM 1.0 test was started in January 2008, further elaborated in [3] (from this point on referred to as the January test run). The second complete endtoend test run using UWEM 1.2 test was started in February 2008 (from this point on referred to as the February test run).
2.1 Fault density of the EIAO Observatory
At this point we have 3 remaining high priority bugs. During the Implementation, Integration, System Test and Performance improvement phases of the EIAO Observatory, we have reported 315 bugs (45 with the highest priority). 232 bugs (42 with the highest priority) have been fixed and 84 bugs (3 with the highest priority) are still open. See chapter 2.2 for a description of open high priority issues including remedies of how these are planned to be fixed. Note that these high priority issues do not keep us from running evaluations.Table 2 below shows the distribution of high priority trouble reports vs. Observatory component2.
2 Note that issues that are still open but have been solved by a workaround rather than a complete fix is not part of this table. Example of such an issue is memory problems in the Crawler. A Crawler that exceeds memory usage when crawling a site will be restarted. However, issues where we have a functional workaround has a low priority.
10

D5.3.14 Version: 0.73
Component Fixed bugs Open bugs Reported bugs
Crawler 13 2 15
AWAM 8 0 8
Data Warehouse 7 0 7
Sampler 2 0 2
Online reporting tool 2 0 2
RDF repository 2 0 2
URL repository 2 0 2
BWAM 2 0 2
Page Handling 2 0 2
Other 2 0 2
Relaxed 1 0 1
ETL 1 0 1
Sum 43 2 45
Table 2: Progress and status on high priority issues since April 2007
2.1.1 Crawler fault density
The Crawler has clearly been the component with the most reported bugs over the last year. These bugs have been unveiled by the sharply increased performance and stability requirements that were needed to perform budged based scans for URLs of entire web sites. The serious problems which caused deadlocks have been fixed now. Less critical, yet in some cases blocking problems (e.g. Unicode errors) have also been fixed. We have seen a significant decline in new bug reports for the Crawler, so this component is considered to be stabilised now.Several of the remaining issues in the Crawler have been worked around rather than fixed. The reason for this is that workarounds requires less effort than a complete fix, freeing some development time. The most important one is the large memory footprint of the Crawler that increases over time3. This has been worked around by restarting crawlers that use more than 350 MB of memory. Note that each Crawler commits downloaded URLs roughly every minute, including URL state. The crawlers are able to restart from this state, meaning that a restart of a Crawler will at most lose one minute worth of URLs. Since this is a workaround and not a fix, the bug remains open, but at a low priority. However, in order for the Observatory to be stable enough to use, the workaround is sufficient. Additionally, both the Crawler and Sampler occasionally ended abnormally with a segmentation fault. For the Crawler this was traced back to a threading issue with the URL repository connection; several Crawler threads tried to create the same data base connection at the same time. This was one of the harder thread programming
3 Thrashing is an extensive swapping of memory blocks between the swap area on disk and memory and occurs when the memory footprint of actively used blocks in memory exceeds the available physical memory.
11

D5.3.14 Version: 0.73
issues to locate by the team. Once the problem was identified, fixing it was straight forward by making sure that only one thread could create this connection.
2.1.2 Sampler fault density
For the Sampler, segmentation fault happened in roughly 14% of the cases. Note that these problems were not deterministic4, meaning that resampling the site in most cases worked well. This was true even when exactly the same pages were part of the evaluation, which is the case for web sites with only a small number of pages detected.This turned out to be a problem with low level python string encoding which became visible in the SOAPpy interaction between the Sampler and the WAM.Our workaround included letting the WAM, which uses Jython2.1, download each page instead of the Sampler. This solved the problem for all web sites using the HTTP protocol. However, Jython 2.1 has no native support for HTTPS5. Because of this, web sites using the HTTPS cannot be downloaded from the WAM.The strategy we chose for this was to let all HTTP pages be downloaded from the WAM while letting all HTTPS pages be downloaded from the Sampler. A result of this is that HTTPS sites may at times trigger segmentation faults in the Sampler. However, none of the 11 HTTPS sites tested triggered this bug during the February test run. As mentioned above, this happens to roughly 14% of our web sites during page download from the Sampler. However, since this problem is not deterministic, sampling a site that has previously caused a segmentation fault in the Sampler will not necessarily make the Sampler trigger another segmentation fault. A possible workaround include porting the Sampler to Python2.5 or Jython. Note that very similar bugs have been reported in the Python language itself [4].Attempts have been made to port the Sampler to Python2.5 (from Python2.4). So far this has not been successful, due to a 4 times performance reduction. Details about why this happens has not yet been fully investigated. However, hotshot6 analysis has indicated that this is related to threading issues.We have had additional problems with the Sampler calculating the score wrongly as 0. This also turned out to be due to threading issues in the Sampler. In short, the sampler calculated the final score before it could guarantee that all threads had finished. This sometimes resulted in, if few samples were available, that the score was calculated based on no pages, making the score wrongly 0. It further resulted in the score being calculated on fewer pages than the result indicated. This has been fixed by forcing the Sampler calculate the final score of the site only after all threads had finished.
2.1.3 WAM fault density
Some bugs have been fixed for the WAM. The most important fix was migrating to SUN JDK1.6 to avoid severe memory leaks in the exception handling of SUN JDK1.5. Most of the other bugs have been UWEM conformance issues in the WAM evaluation machinery that have been detected during testing. The WAM passes all conformance tests for the BWAMs, defined in D3.4.1 (for details see [6]).
4 Note that even though this problem is not deterministic, even on page level, there might be a correlation between which web sites are evaluated and when this problem occurs – even though we have not been able to show this yet.
5 The observatory currently needs to run under Jython 2.1, and not the newer version 2.2, because of a bug in the reflection of the Java XML interfaces to Python, which causes SOAPpy to not work.
6 Hotshot analysis detects parts of an application is most time consuming. [5]
12
D5.3.14 Version: 0.73
2.1.4 Data Warehouse and online reporting tool fault density
The Data Warehouse, online reporting tool caching and performance of the online reporting tool are now satisfactory, after refactoring the most critical materialised views in the Data Warehouse.
2.2 Open bug reports
The main open issues in the Observatory, are currently :
13

D5.3.14 Version: 0.73
Bug ID Explanation Mitigation Priority
#833
Some web site administrators are complaining that the Observatory are flooding the web sites and has because of this restricted the Crawler from their site.
We believe this is why many web sites that are working correctly from most machines but are not available from the EIAO machines .
Increase the number of crawlers and add deliberate waiting times. This will distribute the crawling load better.
1
#827 Sites we are unable to crawl. Add additional seed URLs for each page.
Improve JavaScript handling.
Analysis and debugging of the Crawler in order to understand where / why this is happening.
1
Table 3: Open issues
Of the bugs listed in Table 3, none of the high priority bugs open are expected to have an impact on the results. They only have an effect on the stability of the Observatory and how many web sites that can be successfully evaluated, and has because of this no effect on the correctness of the results.
14
D5.3.14 Version: 0.73
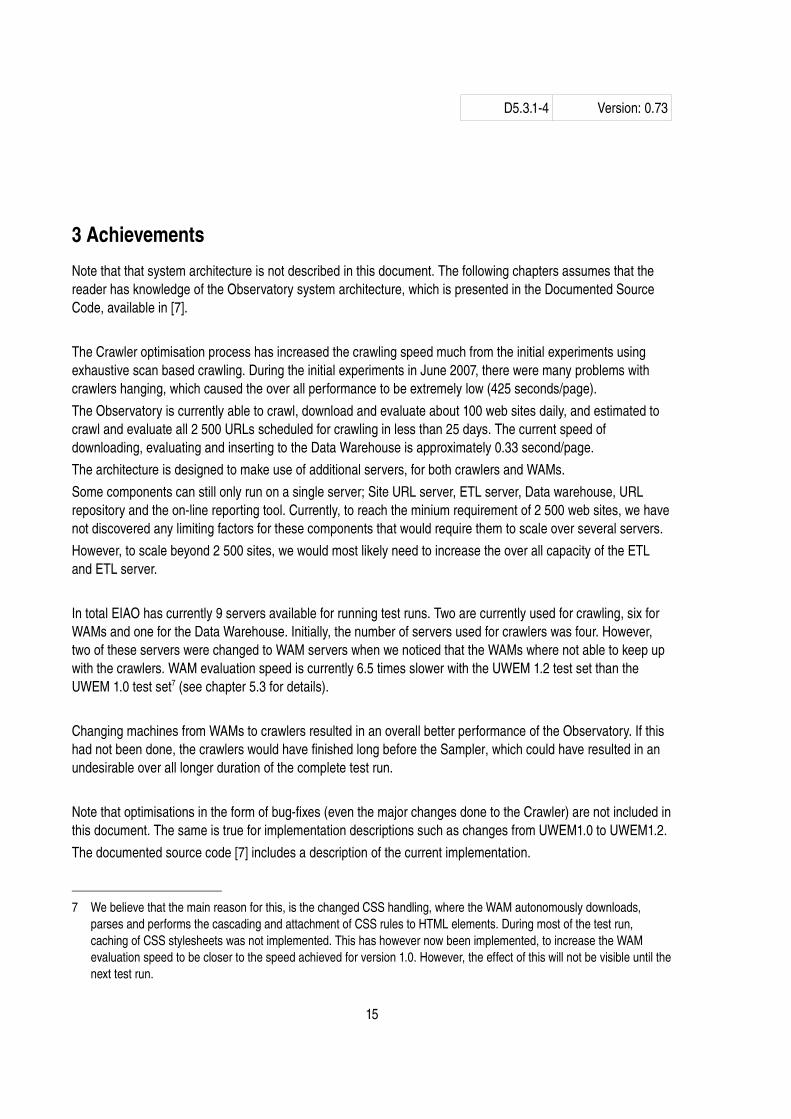
3 AchievementsNote that that system architecture is not described in this document. The following chapters assumes that the reader has knowledge of the Observatory system architecture, which is presented in the Documented Source Code, available in [7].
The Crawler optimisation process has increased the crawling speed much from the initial experiments using exhaustive scan based crawling. During the initial experiments in June 2007, there were many problems with crawlers hanging, which caused the over all performance to be extremely low (425 seconds/page). The Observatory is currently able to crawl, download and evaluate about 100 web sites daily, and estimated to crawl and evaluate all 2 500 URLs scheduled for crawling in less than 25 days. The current speed of downloading, evaluating and inserting to the Data Warehouse is approximately 0.33 second/page.The architecture is designed to make use of additional servers, for both crawlers and WAMs.Some components can still only run on a single server; Site URL server, ETL server, Data warehouse, URL repository and the online reporting tool. Currently, to reach the minium requirement of 2 500 web sites, we have not discovered any limiting factors for these components that would require them to scale over several servers. However, to scale beyond 2 500 sites, we would most likely need to increase the over all capacity of the ETL and ETL server.
In total EIAO has currently 9 servers available for running test runs. Two are currently used for crawling, six for WAMs and one for the Data Warehouse. Initially, the number of servers used for crawlers was four. However, two of these servers were changed to WAM servers when we noticed that the WAMs where not able to keep up with the crawlers. WAM evaluation speed is currently 6.5 times slower with the UWEM 1.2 test set than the UWEM 1.0 test set7 (see chapter 5.3 for details).
Changing machines from WAMs to crawlers resulted in an overall better performance of the Observatory. If this had not been done, the crawlers would have finished long before the Sampler, which could have resulted in an undesirable over all longer duration of the complete test run.
Note that optimisations in the form of bugfixes (even the major changes done to the Crawler) are not included in this document. The same is true for implementation descriptions such as changes from UWEM1.0 to UWEM1.2.The documented source code [7] includes a description of the current implementation.
7 We believe that the main reason for this, is the changed CSS handling, where the WAM autonomously downloads, parses and performs the cascading and attachment of CSS rules to HTML elements. During most of the test run, caching of CSS stylesheets was not implemented. This has however now been implemented, to increase the WAM evaluation speed to be closer to the speed achieved for version 1.0. However, the effect of this will not be visible until the next test run.
15

D5.3.14 Version: 0.73
3.1 Crawler optimisations
In this chapter we give an overview of the main results reached from the optimisation process started in July 2007 8.
3.1.1 Optimised download protocol
In contrast to the performance optimisations mentioned in chapter 3.1.2, and 3.2 the optimisations of the download protocol have not yet been fully tested. The speed increase mentioned in relation to the download protocol are only an estimation of the expected performance increase
● Support for persistent HTTP connections has given a speed increase of around 18%.
● Support for lastmodified and ifmodifiedsince timestamps is estimated to give 33 36% decrease in the number of web pages that need to be handled in the second and subsequent test runs when the web site has less than minimum 6 000 pages available. However, many web sites have more than 6 000 pages available. For these, the performance increase is assumed to be significantly less.
Furthermore, the time saving will be less than the indicated numbers, since the crawlers still experience the round trip time to the web server.
3.1.2 Performance optimisations
The software architecture and methodological improvements carried out in the Crawler are summarised below:
● Regular flushing of the URL lists kept the size of internal URL dictionaries small, which caused a 28% speed increase.
● Increase from 1 to 10 Crawler threads running HTTP get requests in parallel towards a given web site gave a 24% speed increase.
8 In this chapter the duration of the test runs named “Release 1“ and “Parallelisation” are both average duration per web site when crawling the initial 123 web sites in 2006. In contrast, the other test run durations are examples from crawling one single web site.
16
WebCraw
lerSampler
WAM RDF ETL DW GUI

D5.3.14 Version: 0.73
● More aggressive crawling, by dropping deliberate internal delays in HarvestMan. This has increased the speed of crawling with 45%.
● Modifying the Crawler queue to convey plain URLs instead of UWEM page collection objects, and to only cache part of the Crawler queue in memory and keep the rest in a database, has fixed the excessive memory use problems we observed when crawling large web sites. This made it possible for the Crawler to avoid ending up thrashing9 when crawling large web sites, which is a prerequisite to be able to sustain the crawling speed.
● Limiting the amount of information that is cached on URLs that violate Crawler filter rules (e.g. URLs that are out of scope) causes the filter output to be limited, instead of growing without bounds on large web sites. This also limits the memory footprint, to avoid thrashing.
● Adding a Crawler state machine to ensure a safe termination criterion and safe Crawler state transitions has improved reliability.
● Debugging and fixing race and deadlock conditions have improved reliability and improved over all performance, since more crawlers can work in parallel.
3.2 WAM optimisations
● 70% WAM evaluation speed improvement achieved by upgrading to Xalan 2.7 and caching the parsed XSLT stylesheets used for Schematron processing in memory.
● Java memory leak problem fixed by upgrading to JDK 1.610.
● Adding CSS cascading support has decreased the performance of the WAM. However, adding a CSS cache has to some extent limited this loss11.
3.3 Other achievements
A positive side effect of the URL queue modification, is that we have fixed a bug that caused several web sites to be incompletely crawled. The number of web sites that could be successfully crawled, (“successfully” meaning that at least 30 pages are identified), increased from 14% to 55% after this fix. Note that the number of pages was measured from a count in the URL repository, not sites present in the online reporting tool (at the end of the Observatory work flow). Because of this, problems with the Observatory that were only visible after a site has been crawled, such as in evaluation of the web sites, did not have any impact on this measurement.
9 Thrashing is an extensive swapping of memory blocks between the swap area on disk and memory and occurs when the memory footprint of actively used blocks in memory exceeds the available physical memory.
10 The memory leak problem was inherent in SUN JDK's exception handling in versions prior to version 1.6. 11 The CSS cache improvement have only been tested towards the very end of the in a large test run.
17
D5.3.14 Version: 0.73
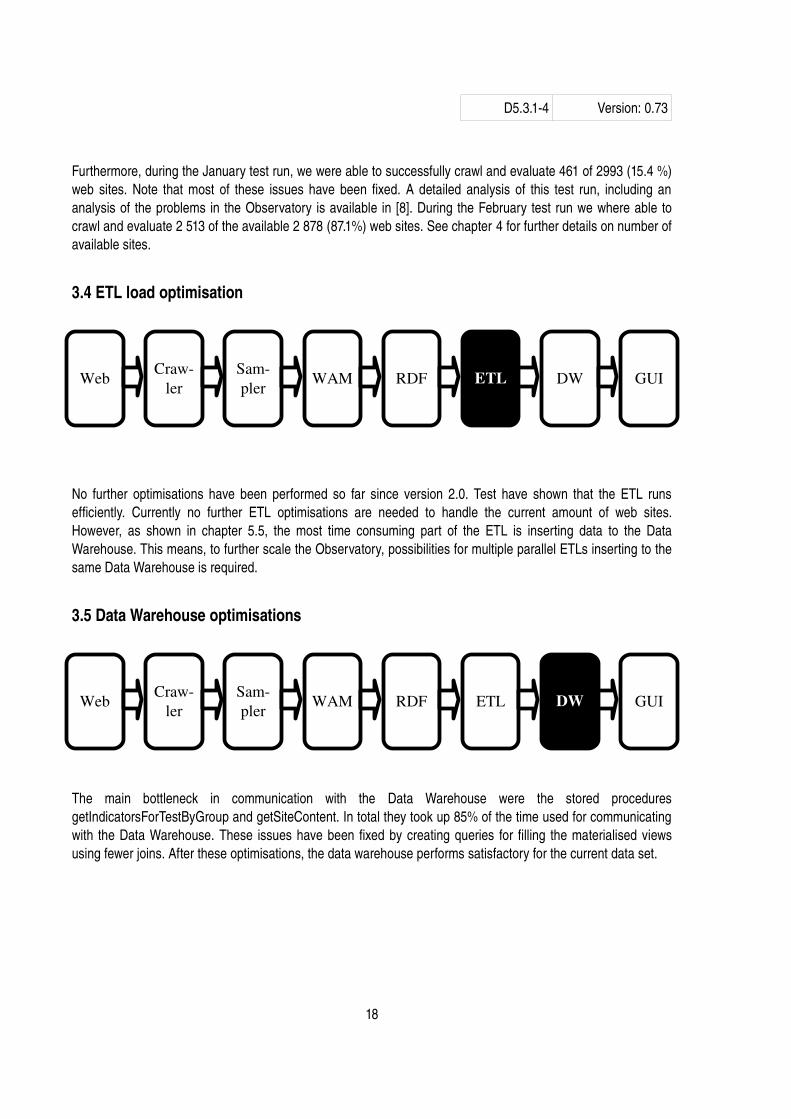
Furthermore, during the January test run, we were able to successfully crawl and evaluate 461 of 2993 (15.4 %) web sites. Note that most of these issues have been fixed. A detailed analysis of this test run, including an analysis of the problems in the Observatory is available in [8]. During the February test run we where able to crawl and evaluate 2 513 of the available 2 878 (87.1%) web sites. See chapter 4 for further details on number of available sites.
3.4 ETL load optimisation
No further optimisations have been performed so far since version 2.0. Test have shown that the ETL runs efficiently. Currently no further ETL optimisations are needed to handle the current amount of web sites. However, as shown in chapter 5.5, the most time consuming part of the ETL is inserting data to the Data Warehouse. This means, to further scale the Observatory, possibilities for multiple parallel ETLs inserting to the same Data Warehouse is required.
3.5 Data Warehouse optimisations
The main bottleneck in communication with the Data Warehouse were the stored procedures getIndicatorsForTestByGroup and getSiteContent. In total they took up 85% of the time used for communicating with the Data Warehouse. These issues have been fixed by creating queries for filling the materialised views using fewer joins. After these optimisations, the data warehouse performs satisfactory for the current data set.
18
WebCraw
lerSampler
WAM RDF ETL DW GUI
WebCraw
lerSampler
WAM RDF ETL DW GUI

D5.3.14 Version: 0.73
3.6 Online reporting tool (GUI) optimisations
• The simplified Online reporting tool (GUI) with local caching of results have a drastically improved speed compared to previous releases. All data from the Data Warehouse is cached inmemory. This was implemented to avoid waiting time by users due to slow Data Warehouse queries. However, since the performance of the Data Warehouse has been drastically improved, such online reporting tool cache is no longer required for performance reasons. However, since this implementation is expected to reduce the load of the Data Warehouse in case of high loads of the online reporting tool, it is still kept in.
• Furthermore, running the Data Warehouse reader (connection between online reporting tool and Data Warehouse) without logging (debugging information disabled) increases performance significantly (715 times for different reports in tests performed in June). Because of this, we include the debugging information only in a testing period of the online reporting tool.
19
WebCraw
lerSampler
WAM RDF ETL DW GUI

D5.3.14 Version: 0.73
4 Observatory robustness
It is furthermore essential that the Observatory is robust. During the January test run of the Observatory, all but 461 sites where discarded / lost in various components. The most significant source of error was incorrect classification of web sites, essentially making the Observatory unaware of which country most of the sites belong to. This has been fixed. In the February test run, this was significantly improved; only 183 (6.32%) sites where lost due to limitations of the Observatory. An additional 322 sites where discarded during the cleanup of URLs, 173 lost due to the fact the web site was not available, and 31 where not downloadable due to restrictions by robots.txt.
20
Illustration 2: Issues in February Test Run
322 Sites: Cleanup of URLs
173 Sites: Web site unavailable
114 Sites: Problems in Crawler
31 Sites: Restricted by robots.txt
55 Sites: Problems in Sampler
79.7%
0.97%3.55%
1.71%
5.39%10.0%

D5.3.14 Version: 0.73
In total 644 sites from the initial URL list have been discarded. However, only 183 sites where discarded due to limitations, bugs or implementation issues in the Observatory. The above information has been presented in Illustration 2. Note that the sites that have been discarded due to limitations in the Observatory are explained in chapter 2.2. Several issues with the Crawler have already been fixed, yet not tested. However, these issues were fixed after the test run had been completed. Remaining issues are continually being addressed.
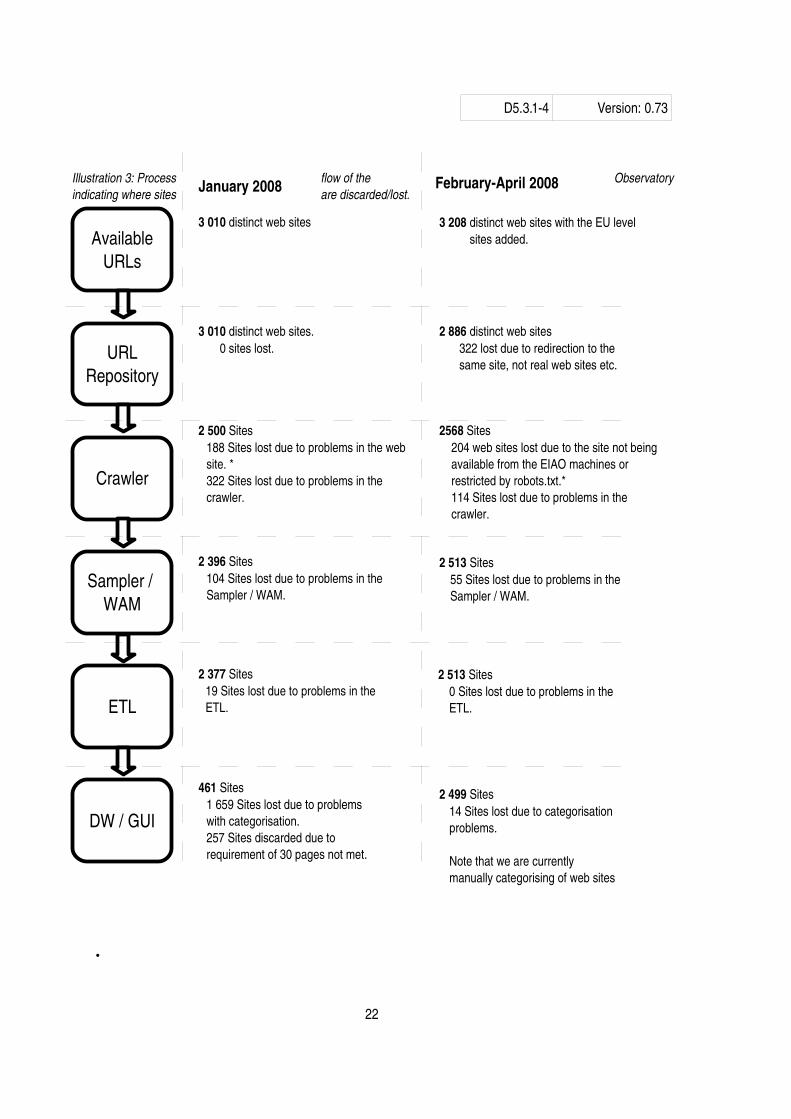
Illustration 3 shows the process flow of the Observatory with an indication where sites are discarded/lost. Note that the number of distinct URLs are slightly less in the February test run than January due to missing categorisation of the URLs for the January test run [3].
Note that several of the problems are not caused by limitations in the Observatory, but limitations with the evaluated web sites themselves. As an example, if a web site is completely unavailable or only produces HTTP 500 errors when downloaded, it is clear that no crawl / evaluation is possible. Because of this, no results from such web sites can be expected. Such problems are marked with * in Illustration 3.
Of the 114remaining sites that where discarded in the Crawler component due to problems, the following problems were identified:
• 43% of the sites were discarded due to parsing issues. Most significantly due to JavaScript that was unparsable by our implementation such as link menus in the sites build completely from JavaScript.
• 20% of the sites were crawlable when running the crawler a second time from another machines.• 18% was discarded due to parsing problems in the Crawler that have been fixed. Example of such sites
are enabling of query links and enabling of simple JavaScript parsing in the Crawler. Such properties are normally not enabled in the crawler due to performance issues. However, for later test runs, it should be enabled for these web sites.
• 16% of the sites where discarded due to bugs in the Crawler that has now been fixed.• 3% of the sites have not been analysed so far.
This indicates that with the current implementation, we expect 204+49 = 253 (7.89%) of the web sites to be crawled for the next test run, due to that fact that the web sites are unabailable from the EIAO machines or that the sites are unparsable by the Crawler. Furher note that we do not expect any other parts of the Observatory to loose web sites.
* Web sites discarded or lost due to limitations in the web sites that cannot be expected to be solved by the Observatory, such as web site being unavailable.
21
D5.3.14 Version: 0.73
•
22
Illustration 3: Process flow of the Observatory indicating where sites are discarded/lost.
CapgeminiURLs
AvailableURLs
Sampler / WAM
Crawler
URLRepository
ETL
DW / GUI
3 208 distinct web sites with the EU level sites added.
2 886 distinct web sites322 lost due to redirection to the same site, not real web sites etc.
2568 Sites204 web sites lost due to the site not being available from the EIAO machines or restricted by robots.txt.*114 Sites lost due to problems in the crawler.
2 513 Sites55 Sites lost due to problems in the Sampler / WAM.
2 513 Sites0 Sites lost due to problems in the ETL.
2 499 Sites14 Sites lost due to categorisation problems.
Note that we are currently manually categorising of web sites
3 010 distinct web sites
3 010 distinct web sites. 0 sites lost.
2 500 Sites188 Sites lost due to problems in the web site. *322 Sites lost due to problems in the crawler.
2 396 Sites104 Sites lost due to problems in the Sampler / WAM.
2 377 Sites19 Sites lost due to problems in the ETL.
461 Sites1 659 Sites lost due to problemswith categorisation.257 Sites discarded due to requirement of 30 pages not met.
FebruaryApril 2008January 2008

D5.3.14 Version: 0.73
23

D5.3.14 Version: 0.73
5 ScalabilityThis section describes how the different components of the Observatory have been found to perform during the system tests.Note that several of the sub chapters show performance results only from the initial days of the test run. The reason for this is that after this point, the Observatory bugs were continuously identified and fixed. These bugs caused idle time of the Observatory and of course affected the performance. We also had a period of time with disk problems, resulting in 10 days of idle time.However, as we show in the scalability analysis of the entire Observatory, after bugs were fixed, the performance of the Observatory was very similar to the early parts of the test run. Thus, if we were to run the complete test run again, the over all performance would be drastically improved – as we would not have down periods due to bug fixing. In fact, this indicates that 2 500 sites can be evaluated in 25 days.
5.1 Observatory Scalability
The Observatory is not yet able to demonstrate the capacity needed to crawl 10 000 web sites monthly. To demonstrate this with the current implementation we estimate that we would need 4050 servers of a similar capacity like the ones we are currently using.In this chapter we present the Observatory capacity and empirically show that the scalability of the Observatory is close to linear. Chapter 5.1 contains a scalability analysis of the complete Observatory based on the results from the February test run. Chapter 5.2 to 5.5 shows a further analysis of the individual components based on the first parts of the February test run. Illustration 4 shows a plot of number of sites loaded with respect to duration. Note that the performance measurements started 60 hours into the test run.
It is clear from the graph that our Observatory went through several phases. For reason of clarity, we analyse the different phases in the subchapters of this chapter.
24
WebCraw
lerSampler WAM RDF ETL DW GUI

D5.3.14 Version: 0.73
5.1.1 Initial phase 60<t<200 (60 hours to 200 hours)
In this phase, the performance in terms of number of sites loaded per unit of time, seems to be close to linear. The number of sites loaded could be estimated with simple linear regression (function plotted in Illustration 4 labelled as Linear regression t<200). Details on the steps taken to arrive at the regression formulas are presented in chapter 13.
The first phase gives us the following formula.
Equation 1: Linear regression Initial Phase
25
Illustration 4: Observatory scalability
60 101
143
185
227
269
311
352
394
436
478
520
562
604
645
687
729
771
813 . .
1513
1555
1597
1639
1681
1723
1764
0
250
500
750
1000
1250
1500
1750
2000
2250
2500
2750
True Data
Linear regression t<200
Linear regression t>1700
Linear regression t>=200
Requirement / Goal
Observatory down
Hours
Num
ber o
f site
s
Y sites=7.32t−306.09for60t200

D5.3.14 Version: 0.73
This further gives us a correlation coefficient (rvalue) of 0.9957, indeed indicating that the linear regression fits very well to the observed values.
Furthermore, this indicates that no part of the Observatory has a negative impact on the performance as the number of sites increases. An example of the opposite, would be if the URL repository operated slower when more sites were stored, thus making the duration for evaluating site slower when the number of sites already evaluated increased. However, this is empirically shown not be be true in Illustration 4 for 60t200 and thus 178Y
sites1157 .
Equation 2: Calculation of duration for crawling and evaluating the 2 500 web sites based only on the initial phase
Note that the function calculates the number of web sites ( Y sites ) for a give hour ( t ). Furthermore, as is normal with any linear function, the formula is written as Y sites=mtb . For us , m incicates the evaluation speed (in web sites per hour) , b indicates the offset and Y indicates the number of sites.
Since the function is derived from data where t0 , b (in the above 306) needs to be included in the calculations, the linear function will not go through 0. I.e only using Y sites=7.32t will not result the correct number of web sites. However, only m (in the above function 7.32) is related to the estimates the evaluation speed. For futher details on how to perform linear regression based on sampled data see chapter 13.
Note also that the duration for the 2 500 web sites are slightly less than indicated in [3] and less than end phase of the Observatory.The estimation could be further take number of pages into calculation. The average 100 firsts sites inserted had a sample size of 303.01 pages per site12. By including number of pages in the estimation we following number of pages inserted per hour;
Equation 3: Pages inserted per house in the initial phase
.
12 Note that this is the average number of pages evaluated, not number of pages downloaded by the Crawler. Clearly, the number of pages downloaded by the Crawler also influences the results. However, since the sample size in average is significantly less than 600, it is expected that the number of pages downloaded by the Crawler is also less than 600.
26
Ysites
=7.32t−306=2500
t=2500306.9
7.32≈383.4 hours≈15.9days
apages
=
Number of sites per hour ∗Average number of pages per site =
7.32∗303.01=2218.03pages
hour

D5.3.14 Version: 0.73
5.1.2 Middle phase 200<t<1700 (200 hours to 1700 hours)
In this phase the effect of bugs in the Observatory became evident which clearly influences the Observatory performance. These bugs where continually fixed. Most significantly, we had a period where the Observatory was completely down at 800<t<1500 due to disk issues. This part is marked as Observatory Down in Illustration4. We also had a period where we deliberately had the Observatory down to be able to extract preliminary results for data analysis. Extracting results from the Data Warehouse and inserting results compete for the same resources. Furthermore, extracting data at the same time as data was inserted could have resulted in an invalid state of the results since the queries for extracting data are not atomic. For example, we extracted both (1) number of sites and (2) which tests have applied as two separate queries for data analysis. If data from a new site had been inserted between (1) and (2), the results from (2) could be wrong. However, for most parts of this duration, the Observatory still crawled and evaluated some web sites – though it is evident from Illustration 4 that the performance was not linear.
5.1.3 Final phase t>1700 (more than 1700 hours)
At t=1700, we had several bug fixes. Most significantly, we deleted 204 web sites in the Data Warehouse. The reason for this is that we discovered that some sites where massively oversampled and some sites did not include a score (the score was either wrongly set to 0 or missing). These sites needed to be sampled and evaluated again. Because of this, the number of sites completed dropped 204 at t=1700. From the perspective of scalability, it gave us the opportunity to again measure performance.Using the same calculations outlined in chapter 5.1.1 gives us the following regression.
Equation 4: Linear regression for t>1700
Or number of pages inserted by hour.
Equation 5: Pages inserted per house in the final phase
This regression is plotted as Linear regression t>1700 in Illustration 4.Note that this is only true for t>1700. However, it is clear that these bug fixes gave the Observatory a better performance than the middle phase, at 92% of the initial speed 13. . Thus, we can with confidence assume that the Observatory would have this performance if all bug fixes was implemented from the very start or if we were to run a new test run.
13The linear regression function is based on number of sites that had been going through the Observatory. In fact, the numer of sites passed through the Observatory at each time instance is the only reliable measurement we have of the performance and the linear regression needs to be based on this. However, as shown in this chapter, the function can be further elaborated into number of web pages based on an average of web site size at the beginning and end of the test run. Despite of this,
27
Ysites
=4.04t−4510.5
apages
=
Number of sites per hour ∗Average number of pages per site =
4.04∗505.09=2 040.56pages
hour
D5.3.14 Version: 0.73
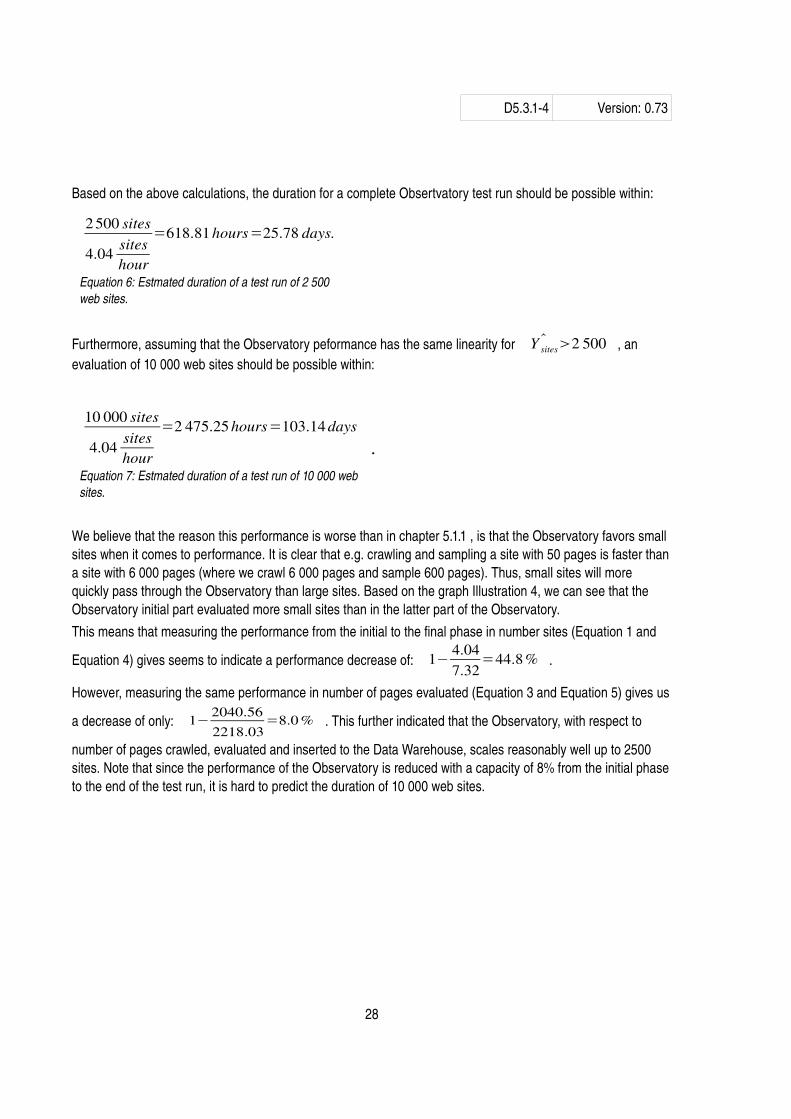
Based on the above calculations, the duration for a complete Obsertvatory test run should be possible within:
Equation 6: Estmated duration of a test run of 2 500 web sites.
Furthermore, assuming that the Observatory peformance has the same linearity for Y sites2 500 , an evaluation of 10 000 web sites should be possible within:
Equation 7: Estmated duration of a test run of 10 000 web sites.
.
We believe that the reason this performance is worse than in chapter 5.1.1 , is that the Observatory favors small sites when it comes to performance. It is clear that e.g. crawling and sampling a site with 50 pages is faster than a site with 6 000 pages (where we crawl 6 000 pages and sample 600 pages). Thus, small sites will more quickly pass through the Observatory than large sites. Based on the graph Illustration 4, we can see that the Observatory initial part evaluated more small sites than in the latter part of the Observatory.This means that measuring the performance from the initial to the final phase in number sites (Equation 1 and
Equation 4) gives seems to indicate a performance decrease of: 1−4.047.32
=44.8 % .
However, measuring the same performance in number of pages evaluated (Equation 3 and Equation 5) gives us
a decrease of only: 1−2040.562218.03
=8.0 % . This further indicated that the Observatory, with respect to
number of pages crawled, evaluated and inserted to the Data Warehouse, scales reasonably well up to 2500 sites. Note that since the performance of the Observatory is reduced with a capacity of 8% from the initial phase to the end of the test run, it is hard to predict the duration of 10 000 web sites.
28
2 500 sites
4.04siteshour
=618.81hours=25.78 days.
10 000 sites
4.04siteshour
=2 475.25 hours=103.14 days

D5.3.14 Version: 0.73
5.2 Crawler Scalability
The Crawler has a fixed budget of downloading 6 000 pages from each site, or the complete web site. As explained in chapter 3, we initially started with 4 servers for Crawler but reduced this to 2 when it became evident that the Sampler / WAM was a more important limiting factor than the Crawler. Furthermore, for 20.75 hours we ran with only one server for crawling since one of the Crawler machines was needed for the online reporting tool, and a stable online reporting tool could not be running on the same machines as a Crawler due to the fact that both compete for the same resources. Note that the performance results presented in this chapter is from only the initial part of the test run. A complete analysis is available in chapter 5.1.Each Crawler machine runs with 50 simultaneous processes. For measurements of scalability/performance of the Crawler with respect number of processes see [8]. Note also that the Crawler was down 13.75 hours due to diskproblems. The Sampler/WAM was available still running during this. As shown in chapter 5.1, because Sampler/WAM was unaffected to this problem running during this time, the overall performance of the Observatory was only slightly reduced. During this time, the queue containing sites scheduled for sampling had enough sites for both the Sampler and WAMs to be fully active during this period.
29
WebCraw
lerSampler
WAM RDF ETL DW GUI
D5.3.14 Version: 0.73
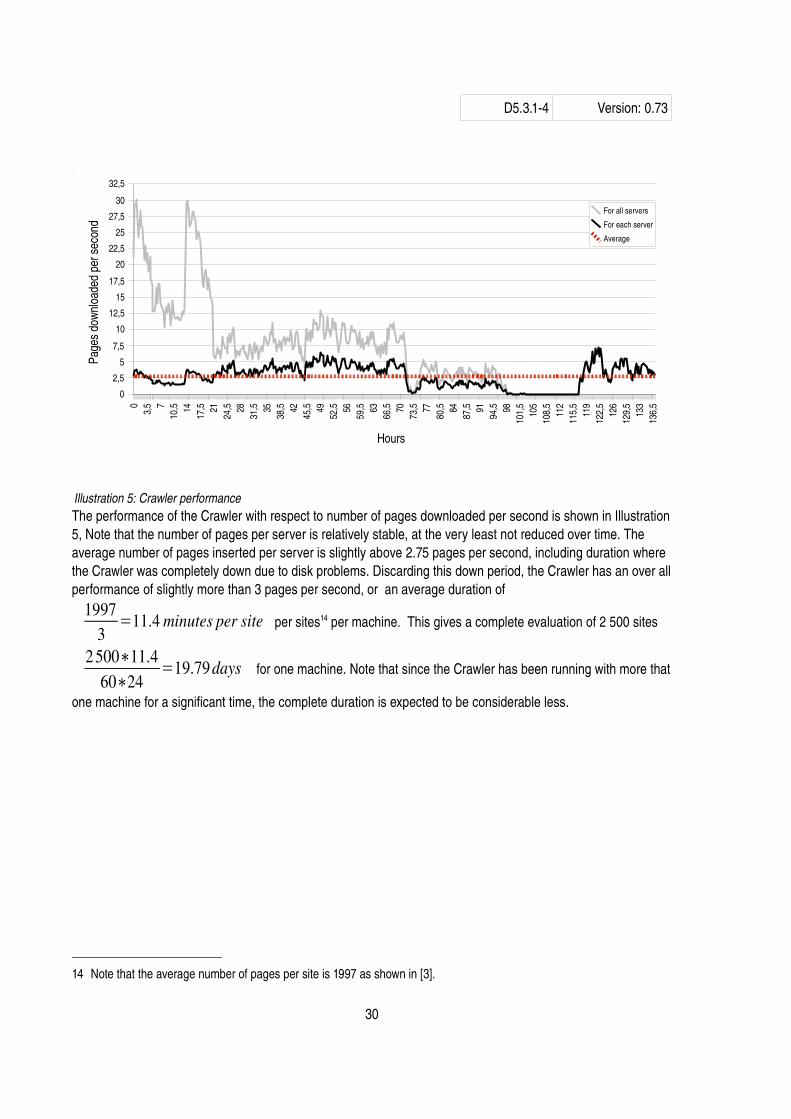
The performance of the Crawler with respect to number of pages downloaded per second is shown in Illustration5, Note that the number of pages per server is relatively stable, at the very least not reduced over time. The average number of pages inserted per server is slightly above 2.75 pages per second, including duration where the Crawler was completely down due to disk problems. Discarding this down period, the Crawler has an over all performance of slightly more than 3 pages per second, or an average duration of
19973
=11.4 minutes per site per sites14 per machine. This gives a complete evaluation of 2 500 sites
2 500∗11.460∗24
=19.79days for one machine. Note that since the Crawler has been running with more that
one machine for a significant time, the complete duration is expected to be considerable less.
14 Note that the average number of pages per site is 1997 as shown in [3].
30
Illustration 5: Crawler performance
03,
5 710
,5 1417
,5 2124
,5 2831
,5 3538
,5 4245
,5 4952
,5 5659
,5 6366
,5 7073
,5 7780
,5 8487
,5 9194
,5 9810
1,5
105
108,
511
211
5,5
119
122,
512
612
9,5
133
136,
5
0
2,5
5
7,5
10
12,5
15
17,5
20
22,5
25
27,5
30
32,5
For all servers
For each server
Average
Hours
Page
s do
wnlo
aded
per
sec
ond

D5.3.14 Version: 0.73
5.3 Sampler Scalability
In this chapter we present results based on the over all performance of the Sampler based on calculations presented in chapter 5.1 . The reason for this is that we implemented caching of CSS files in the WAM during the ongoing February test run – minimising the number of downloads and thus improving the performance. Note that the main activity of the Sampler is to interact with the WAM. In addition, the Sampler writes to the RDF database, interacts with the URL repository, which has an impact on the performance. Therefore, the performance of the Sampler is expected to be slightly worse than the performance of the WAM itself.
A performance test of the WAM was conducted in [9] using UWEM 1.0. This experiement used a sample size of 400 pages. Note that the February test run uses 600 pages (50% more). In the presented test, the WAM had an over all performance of 375 seconds per site using two servers, or
375 seconds400 pages
∗2 servers=1.875seconds
page(per machine).
Assuming that the performance is the Sampler is completely linear with respect to number of pages evaluated, the equivalent duration of 600 pages would be 375∗1.5=562.5 seconds , using two WAM machines. Further assuming that the Sampler scales completely linearly with number of WAM servers, using one WAM server would have given the average duration per site of 562.5∗2=1125 seconds .
In contrast, the February test run was performed with 6 servers. Following the same assumptions, this would give a average duration per site using only one WAM machine
1227∗6=7362 seconds , or 73621125
≈6.54 times as slow with UWEM1.2 without cache compared to
UWEM1.0
Further note that caching of CSS files was implemented in the last phase of the testrun, presented in chapter
5.1. With this implementation, the sampler manages to evaluted 2 040 pages over hours, or 34pages
minutes
using 6 WAM machines. Per machine performance is then
34pagesminute
for complete Observatory
6 machiness=5.67
pagesminute
per WAM machine=10.58seconds
page.
31
WebCraw
lerSampler WAM RDF ETL DW GUI

D5.3.14 Version: 0.73
Furthermore, the final part of the test run, where CSS cache was implemented, the Observatory was able to evaluate one page in 10.7 seconds. Compared to results in [9] the WAM implemented with UWEM1.2 including
CSS Cache is 10.58
secondspage
1.875seconds
page
=5.64 .
Comparing the difference, with and without CSS cache, in performance difference
1−5.64 performance difference from UWEM1.2 CSS Cache to UWEM 1.06.54 performance difference from UWEM1.2 No Cache to UWEM 1.0
=13.76 % .
32

D5.3.14 Version: 0.73
10.7
secondspage
UWEM1.2 CSS Cache
1.875seconds
pageUWEM1.0
=5.71 times as slow.
UWEM with CSS cache, last part of the test run, has the speed of Furthermore, UWEM1.2 without Cache
Again note that the Sampler performance is expected to the slightly worse the the performance of the WAM itself as the Sampler also includes downloading of web pages, interaction with the RDF repository and URL repository. Because of this, the above assumption that the Sampler scales linearly with number of WAM servers is not completely true. However, since we assume the WAM to be the most significant contributor to the Sampler duration, shown to be wellgrounded for the experiments with previous versions of the Sampler / WAM in [9], it is logical that the RDFreading etc. will have little impact on the results. This is further supported by the fact the only the WAM has been undergoing major modifications since version 2.1 while all modifications to the remaining parts of the Sampler has been minor.
5.3.1 URL repository interaction
Another possible limiting factor of the Sampler could have been interaction with the URL repository. A wrongly designed database could work slower as the number of sites in the database increased. Running a simple test selecting 600 random web pages from the URL repository after 1 600 sites have been crawled, is done within roughly 0.1 second. Such selections are done by each Sampler at the beginning of sampling. A rough estimation for the complete duration of all available sites this would sum up to
0.1∗2 500=250 seconds=4.16 minutes 15, suggesting that the URL repository interaction from the Sampler is not seen as a bottle neck of the Observatory.
5.4 WAM Scalability
15 Note that 600 random web pages is precisely the same as number of pages selected by the Sampler. Furthermore, note that 4.16 minutes compared to a complete test run of ~25 days is close to insignificant.
33
WebCraw
lerSampler
WAM RDF ETL DW GUI

D5.3.14 Version: 0.73
Experiments in the document “Revision of EIAO sampling approach” [8] have shown that one WAM server has a capacity of evaluating on average 1.19 pages / sec with the UWEM 1.0 test set. Note that the UWEM 1.2 test set has not been performance tested, since we need the WAM resources for the February test run. However, since the main functionality of the Sampler is interactions with the WAM, the Sampler performance information is expected to be closely related to the performance of the WAM interaction, since this is the main interaction of the Sampler. See chapter 5.3 for more details. A lot of the decrease in speed of the WAM, is probably due to extra network latencies and computational effort added, since the WAM now performs downloading and evaluation of the CSS itself. On the other hand, offloading the crawler from this task has probably increased the overall crawler performance somewhat.
34
D5.3.14 Version: 0.73
5.5 ETL Scalability
35
WebCraw
lerSampler
WAM RDF ETL DW GUI
Illustration 6: Duration of ETL
1 13 25 37 49 61 73 85 97 109
121
133
145
157
169
181
193
205
217
229
241
253
265
277
0
250
500
750
1000
1250
1500
1750
2000
2250
2500Average duration
Duration in seconds
ETL run number
Dura
tion
in s
econ
ds

D5.3.14 Version: 0.73
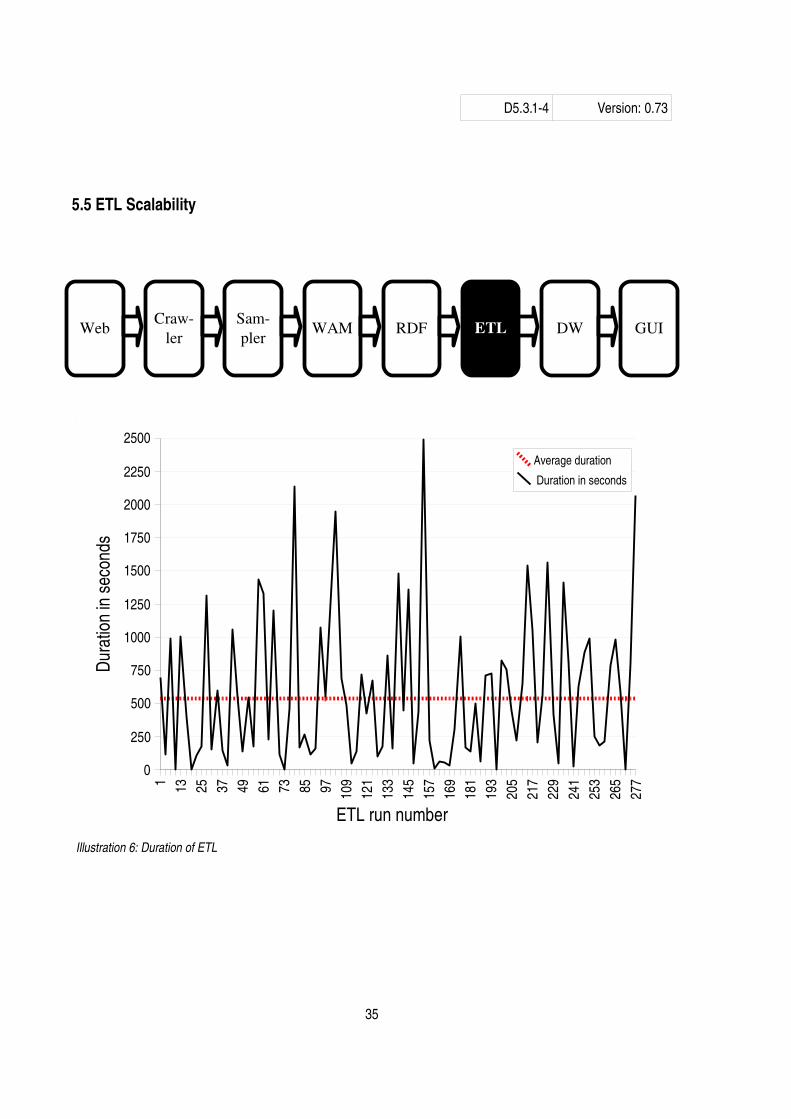
The durations of the ETL runs16 are presented in Illustration 6. Note that this is extracted from only the 279 most recent ETL runs. The reason for this is that ETL logs are in general not kept to avoid excessive disk usage for the Observatory. However, we believe that these 279 ETL runs are representative for all ETL runs. A complete analysis is available in chapter 5.1.
The graph also shows that the complete duration of the 2 500 available sites duration is estimated to be:
538.8seconds
sites
3600∗24∗2500 sites≈15.6days
. Note that the estimation does not consider discarded sites –
the true complete duration of the ETL is because of this expected to be less.
In other words, the ETL is running just within the complete duration of the ongoing crawl (see chapter 5.1 for complete estimates). It should be noted that during the January test run, the ETL was inserting data to a Data
16 An ETL run is the complete duration of running the ETL towards one site. One ETLrun includes Extracting data from the RDF graph, Transforming data and Loading this in the Data Warehouse.
36
Illustration 7: Percentage of work used by reading RDF and writing to the Data Warehouse by the ETL
1 13 25 37 49 61 73 85 97 109
121
133
145
157
169
181
193
205
217
229
241
253
265
277
0%
10%
20%
30%
40%
50%
60%
70%
80%
90%
100%Duration of processing and inserting to DW
Duration on reading RDF
ETL Run Number
Perc
enta
ge o
f com
plet
e du
ratio
n
D5.3.14 Version: 0.73
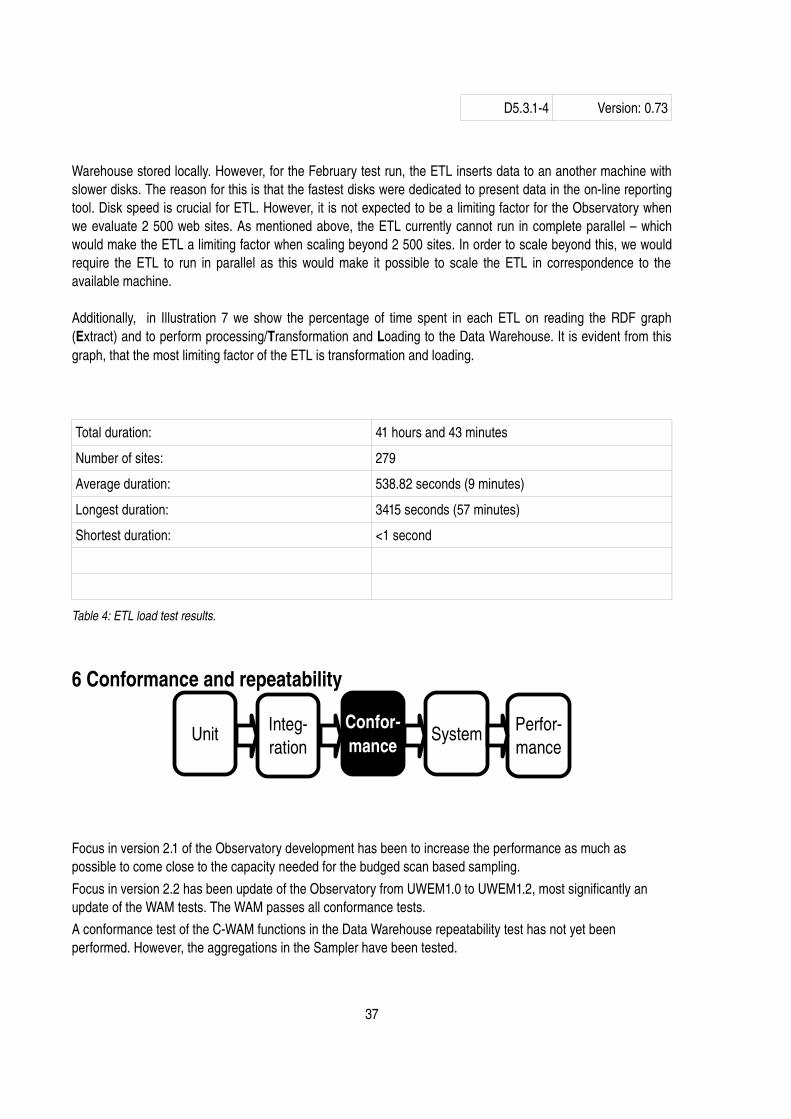
Warehouse stored locally. However, for the February test run, the ETL inserts data to an another machine with slower disks. The reason for this is that the fastest disks were dedicated to present data in the online reporting tool. Disk speed is crucial for ETL. However, it is not expected to be a limiting factor for the Observatory when we evaluate 2 500 web sites. As mentioned above, the ETL currently cannot run in complete parallel – which would make the ETL a limiting factor when scaling beyond 2 500 sites. In order to scale beyond this, we would require the ETL to run in parallel as this would make it possible to scale the ETL in correspondence to the available machine.
Additionally, in Illustration 7 we show the percentage of time spent in each ETL on reading the RDF graph (Extract) and to perform processing/Transformation and Loading to the Data Warehouse. It is evident from this graph, that the most limiting factor of the ETL is transformation and loading.
Total duration: 41 hours and 43 minutes
Number of sites: 279
Average duration: 538.82 seconds (9 minutes)
Longest duration: 3415 seconds (57 minutes)
Shortest duration: <1 second
Table 4: ETL load test results.
6 Conformance and repeatability
Focus in version 2.1 of the Observatory development has been to increase the performance as much as possible to come close to the capacity needed for the budged scan based sampling. Focus in version 2.2 has been update of the Observatory from UWEM1.0 to UWEM1.2, most significantly an update of the WAM tests. The WAM passes all conformance tests. A conformance test of the CWAM functions in the Data Warehouse repeatability test has not yet been performed. However, the aggregations in the Sampler have been tested.
37
Integration
Conformance
Unit System Performance

D5.3.14 Version: 0.73
Note that CWAM calculations are done in the Sampler and reused in the Data Warehouse. This means that the results presented in the online reporting tool on site level have been calculated by the Sampler, not the Data Warehouse. Because of this, we feel it is sufficient to verify the aggregation done by the Sampler. However, note that during the conformance test of the Sampler we found a major issue related to calculation of the complete site score, which has now been fixed.
38

D5.3.14 Version: 0.73
7 Endtoend test
Endtoend testing involves testing of a complete Observatory environment in a situation that is equal to a realworld use, including retrieving scenarios from web sites, performing accessibility measurements, storing the results and presenting these in the Data Warehouse. This test is only meant to show that each part of the Observatory is able to interact with each other. In other words, that the Crawler is able to download web pages, Sampler measure the deviations etc. If the endtoend test produces output, we know that all components are able to interact with each other. This test can also be seen as an extended integration test. Each time a new functionality is developed, it must be tested that it works with the already existing underlying functionality, thus testing that the integration of the new functionality works. The endtoend test is intended to show that all parts of the Observatory are able to communicate. Furthermore, the endtoend test is not meant to test that the output is valid, only that output is produced for each web site. Such tests are part of the conformance testing.
The endtoend test is performed using the set of URLs available to EIAO by crawling up to a limited set of pages (6 000), and then perform sampling and WAM evaluation of a subset of 600 pages, and load the result into the Data Warehouse by using the ETL. This should produce a similar amount of data in the Data Warehouse and online reporting tool as we can expect during real operation, so it should be a realistic “pressure test” of the rest of the Observatory. An endtoend test has already been performed on all sites, with UWEM1.0 test (January test run [3]) and an additional endtoend test using UWEM1.2 tests (February test run).
39
WebCraw
lerSampler WAM RDF ETL DW GUI
Integration
Conformance
Unit System Performance
D5.3.14 Version: 0.73
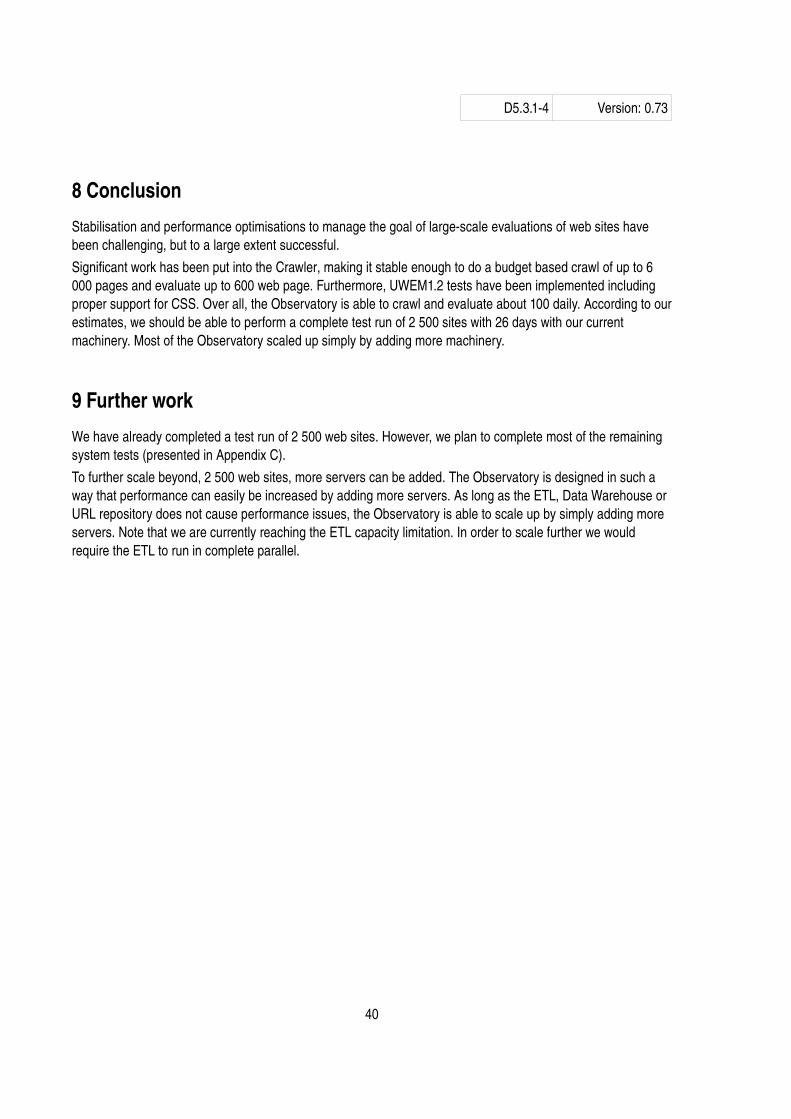
8 ConclusionStabilisation and performance optimisations to manage the goal of largescale evaluations of web sites have been challenging, but to a large extent successful. Significant work has been put into the Crawler, making it stable enough to do a budget based crawl of up to 6 000 pages and evaluate up to 600 web page. Furthermore, UWEM1.2 tests have been implemented including proper support for CSS. Over all, the Observatory is able to crawl and evaluate about 100 daily. According to our estimates, we should be able to perform a complete test run of 2 500 sites with 26 days with our current machinery. Most of the Observatory scaled up simply by adding more machinery.
9 Further workWe have already completed a test run of 2 500 web sites. However, we plan to complete most of the remaining system tests (presented in Appendix C).To further scale beyond, 2 500 web sites, more servers can be added. The Observatory is designed in such a way that performance can easily be increased by adding more servers. As long as the ETL, Data Warehouse or URL repository does not cause performance issues, the Observatory is able to scale up by simply adding more servers. Note that we are currently reaching the ETL capacity limitation. In order to scale further we would require the ETL to run in complete parallel.
40
D5.3.14 Version: 0.73
Bibliography[1] Capgemini Results of Capgemini's 7th annual EU online service study 2007
Online:http://www.capgemini.com/m/en/n/pdf_Results_of_Capgemini___s_7th_Annual_EU_Online_Services_Study_Released_.pdf
[2] Annika Nietzio, Nils UlltveitMoe, Terje Gjøsæter and Morte Goodwin Olsen UWEM indicator refinement 0.9 2007 Online:http://www.wabcluster.org/uwem1_1/
[3] Annika Nietzio, Morten Goodwin Olsen Report on EIAO large crawl: January 2008 2008 Online:http://www.eiao.net/publications/
[4] Python Software Foundation Buffer overrun in repr() for UCS4 encoded unicode strings 2006 Online:http://www.python.org/news/security/PSF2006001/
[5] Annika Nietzio Final Version of EIAO WAMs 2008 Online:http://www.eiao.net/publications/
[6] Nils UlltveitMoe, Morten Goodwin Olsen, Anand B. Pillai and Terje Gjøsæter Online:http://www.eiao.net/publications/
[7] Annika Nietzio, Nils UlltveitMoe, Morten Goodwin Olsen, Mikael Snaprud Revision of EIAO sampling approach 2007 Online:http://ws.eiao.net/WorkPackages/WP3/WP3%20Deliverables/samplingrevision/
[8] TNL.net How many Google machines Online:http://www.tnl.net/blog/2004/04/30/howmanygooglemachines/
[9] T. Goldsmith The Unbreakable Google Monopoly Online:http://www.searchenginehonesty.com/Google_Monopoly.pdf
[10] Nils UlltveitMoe, Morten Goodwin Olsen Test report for EIAO version 2.1 of the Observatory 2007 Online:http://www.eiao.net/publications
[11] Wikipedia Linear Regression Online:http://en.wikipedia.org/wiki/Linear_regression
41

D5.3.14 Version: 0.73
10 Appendix A Unit testing
10.1 Doc tests
A doc test shows and documents the known and common ways to use a function. Only functions with known output (including functions that are state changing) have been doc tested. These tests are written prior to the implementation, according to the test driven development methodology.All doc tests have been written using the doctest module of the Python Unittest Framework. Unit testing with doctest example: def capitalise(self, varname):
"""Create CamelCase of a variable name
Keyword arguments:
varname Variable to be CamelCased
Returns a CameledCased string
Example:
hmi = HarvestManImport()
hmi.capitalise('cachecontrol')
'CacheControl'
hmi.capitalise('cache')
'Cache'
hmi.capitalise('')
''
"""
return ''.join(map(string.capitalize, varname.split('')))
These unit tests are run by running doctest.testmod(module) and produce the outputmodule.py : m of n tests passed.In the example above, the hmi.capitalize('cachecontrol') test expects the result 'CacheControl' when running the function capitalize with the parameter 'cachecontrol'. If this is the case, the test is successful and the capitalize function performs as expected. Otherwise the test fails and the function (not the test) needs to be adjusted.
10.2 Tests of known pathsThe tests of known paths have been written using the PyUnit framework by defining test cases for known paths. This is in contrast to the doc tests, which are only meant to test individual functions, while the tests of known paths test more complex behaviour. Furthermore, we have defined unit tests for the most essential functionality of the third party tools integrated. These tests are written prior to the implementation, according to the test driven development methodology.
42
Integration
Conformance
Unit System Performance
D5.3.14 Version: 0.73
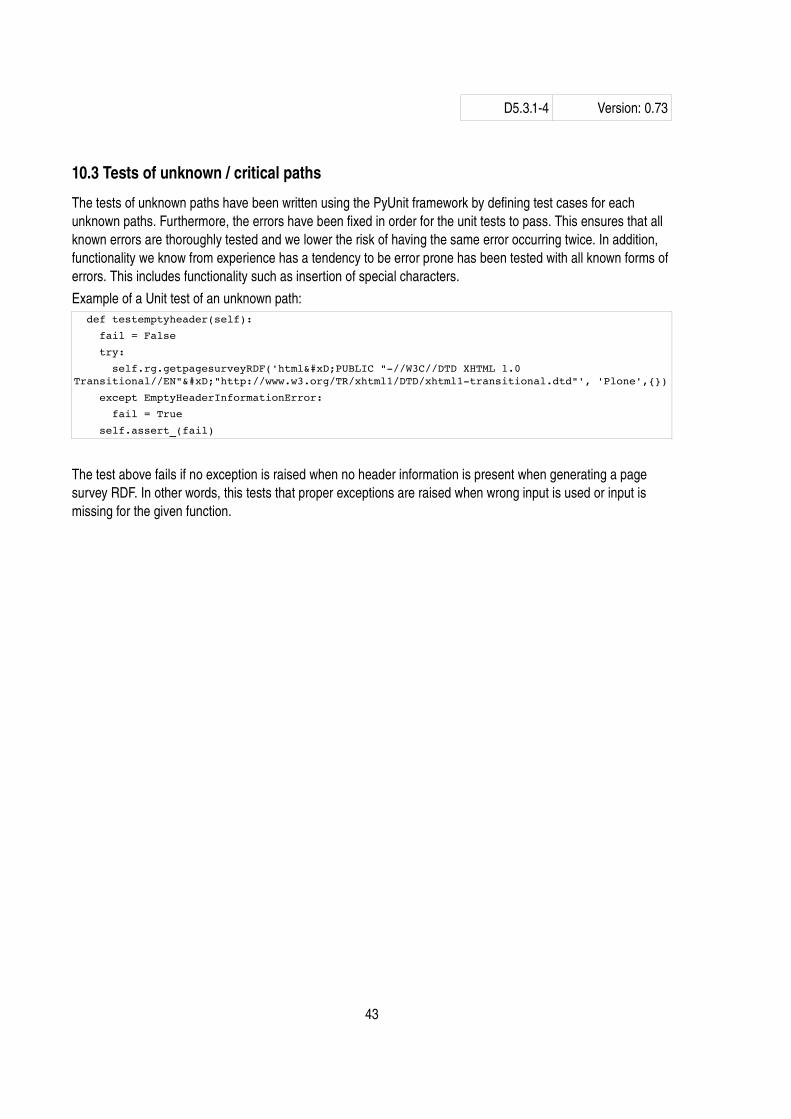
10.3 Tests of unknown / critical paths
The tests of unknown paths have been written using the PyUnit framework by defining test cases for each unknown paths. Furthermore, the errors have been fixed in order for the unit tests to pass. This ensures that all known errors are thoroughly tested and we lower the risk of having the same error occurring twice. In addition, functionality we know from experience has a tendency to be error prone has been tested with all known forms of errors. This includes functionality such as insertion of special characters. Example of a Unit test of an unknown path: def testemptyheader(self):
fail = False
try:
self.rg.getpagesurveyRDF('html
PUBLIC "//W3C//DTD XHTML 1.0 Transitional//EN"
"http://www.w3.org/TR/xhtml1/DTD/xhtml1transitional.dtd"', 'Plone',{})
except EmptyHeaderInformationError:
fail = True
self.assert_(fail)
The test above fails if no exception is raised when no header information is present when generating a page survey RDF. In other words, this tests that proper exceptions are raised when wrong input is used or input is missing for the given function.
43
D5.3.14 Version: 0.73
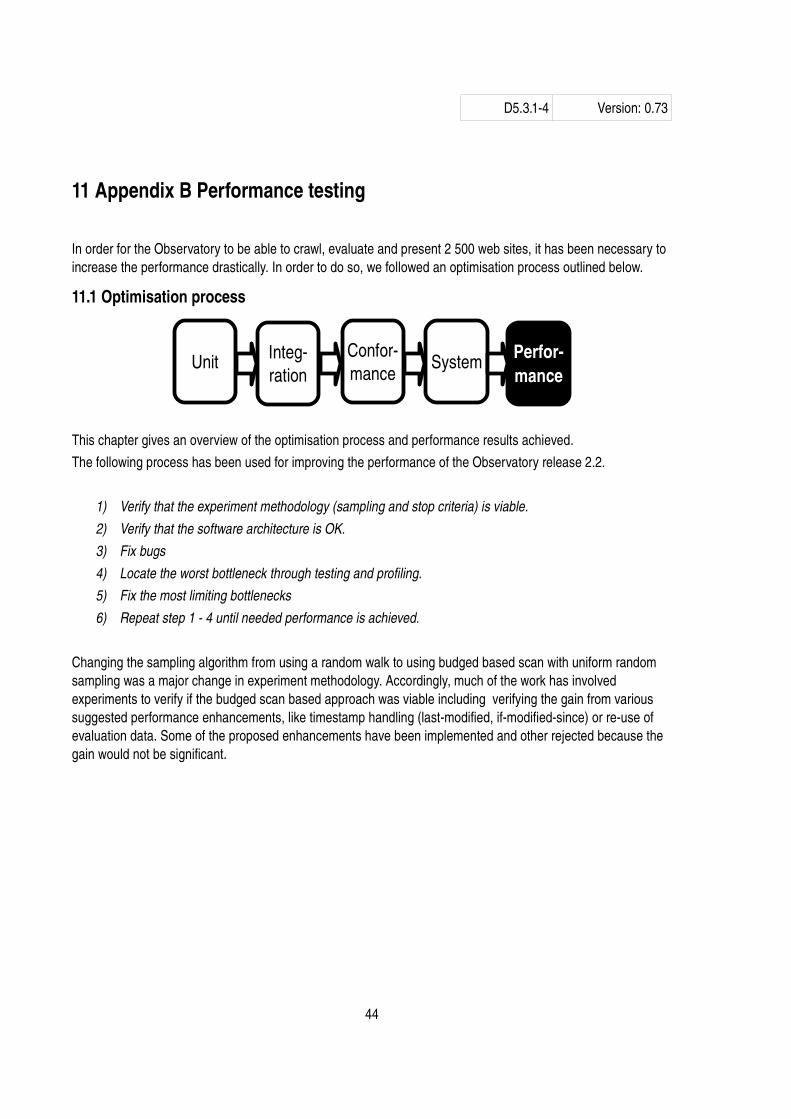
11 Appendix B Performance testing
In order for the Observatory to be able to crawl, evaluate and present 2 500 web sites, it has been necessary to increase the performance drastically. In order to do so, we followed an optimisation process outlined below.
11.1 Optimisation process
This chapter gives an overview of the optimisation process and performance results achieved. The following process has been used for improving the performance of the Observatory release 2.2.
1) Verify that the experiment methodology (sampling and stop criteria) is viable.2) Verify that the software architecture is OK.3) Fix bugs4) Locate the worst bottleneck through testing and profiling.5) Fix the most limiting bottlenecks6) Repeat step 1 4 until needed performance is achieved.
Changing the sampling algorithm from using a random walk to using budged based scan with uniform random sampling was a major change in experiment methodology. Accordingly, much of the work has involved experiments to verify if the budged scan based approach was viable including verifying the gain from various suggested performance enhancements, like timestamp handling (lastmodified, ifmodifiedsince) or reuse of evaluation data. Some of the proposed enhancements have been implemented and other rejected because the gain would not be significant.
44
Integration
Conformance
Unit System Performance

D5.3.14 Version: 0.73
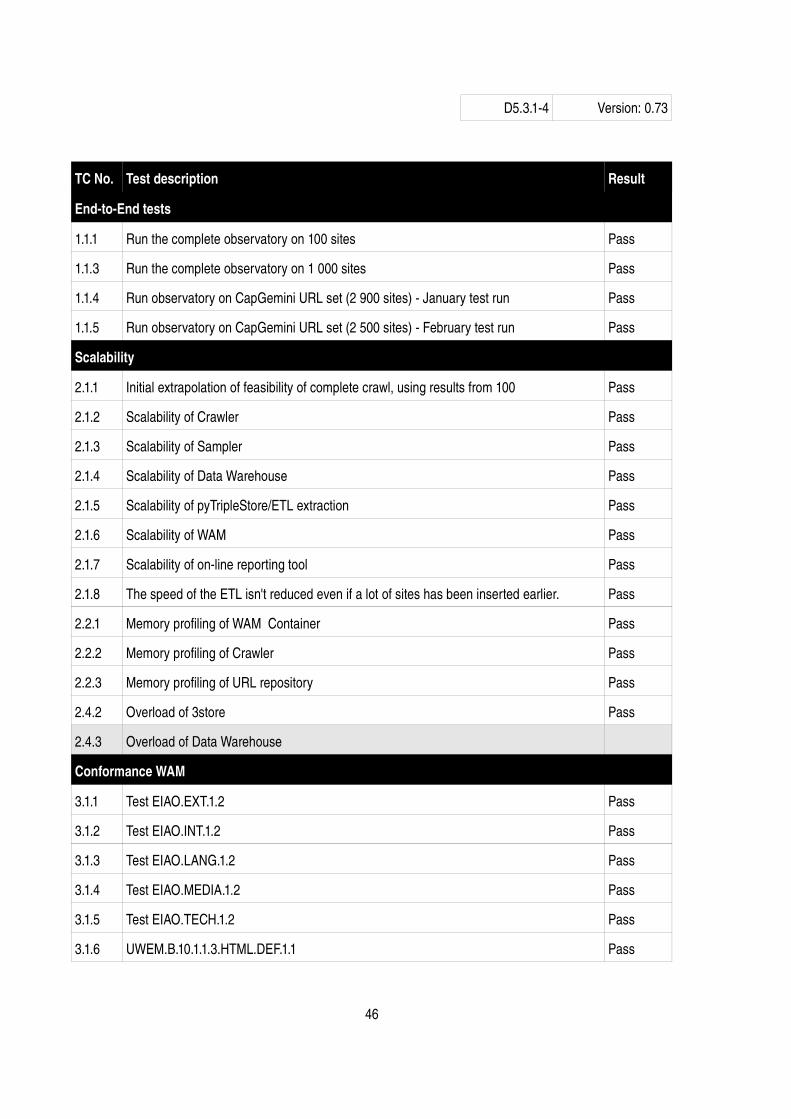
12 Appendix C: System Tests
The system tests are test specifically designed to test different parts (including complete parts) of the EIAO Observatory. Each test is passed when the Observatory has been run according to the description. E.g. if test case 3.2.2.3 “Crawler does not write the more than one site to the DB” is passed when a crawl is run, then it has been manually verified that this is true. The table below shows the status of the system test. However, no result is present, the test have not yet been carried out.
45
Integration
Conformance
Unit System Performance
D5.3.14 Version: 0.73
TC No. Test description Result
EndtoEnd tests
1.1.1 Run the complete observatory on 100 sites Pass
1.1.3 Run the complete observatory on 1 000 sites Pass
1.1.4 Run observatory on CapGemini URL set (2 900 sites) January test run Pass
1.1.5 Run observatory on CapGemini URL set (2 500 sites) February test run Pass
Scalability
2.1.1 Initial extrapolation of feasibility of complete crawl, using results from 100 Pass
2.1.2 Scalability of Crawler Pass
2.1.3 Scalability of Sampler Pass
2.1.4 Scalability of Data Warehouse Pass
2.1.5 Scalability of pyTripleStore/ETL extraction Pass
2.1.6 Scalability of WAM Pass
2.1.7 Scalability of online reporting tool Pass
2.1.8 The speed of the ETL isn't reduced even if a lot of sites has been inserted earlier. Pass
2.2.1 Memory profiling of WAM Container Pass
2.2.2 Memory profiling of Crawler Pass
2.2.3 Memory profiling of URL repository Pass
2.4.2 Overload of 3store Pass
2.4.3 Overload of Data Warehouse
Conformance WAM
3.1.1 Test EIAO.EXT.1.2 Pass
3.1.2 Test EIAO.INT.1.2 Pass
3.1.3 Test EIAO.LANG.1.2 Pass
3.1.4 Test EIAO.MEDIA.1.2 Pass
3.1.5 Test EIAO.TECH.1.2 Pass
3.1.6 UWEM.B.10.1.1.3.HTML.DEF.1.1 Pass
46

D5.3.14 Version: 0.73
TC No. Test description Result
3.1.7 UWEM.B.10.1.1.3.HTML.DEF.6.1 Pass
3.1.8 UWEM.B.10.2.2.3.HTML.DEF.1.1 Pass
3.1.9 UWEM.B.10.3.2.3.HTML.DEF.1.1 Pass
3.1.10 UWEM.B.10.3.2.3.HTML.DEF.2.1 Pass
3.1.11 UWEM.B.10.3.5.3.HTML.DEF.3.1 Pass
3.1.12 UWEM.B.10.3.6.3.HTML.DEF.3.1 Pass
3.1.13 UWEM.B.10.6.4.3.HTML.DEF.1.1 Pass
3.1.14 UWEM.B.10.7.2.3.HTML.DEF.1.1 Pass
3.1.15 UWEM.B.10.7.3.3.HTML.DEF.1.1 Pass
3.1.16 UWEM.B.10.7.4.3.HTML.DEF.1.1 Pass
3.1.17 UWEM.B.10.7.5.3.HTML.DEF.1.1 Pass
3.1.18 UWEM.B.10.9.1.3.HTML.DEF.1.1 Pass
3.1.19 UWEM.B.10.11.1.3.HTML.DEF.1.1 Pass
3.1.20 UWEM.B.10.11.2.3.HTML.DEF.1.1 Pass
3.1.21 UWEM.B.10.11.2.3.HTML.DEF.2.1 Pass
3.1.22 UWEM.B.10.12.1.3.HTML.DEF.1.1 Pass
3.1.23 UWEM.B.10.12.3.3.HTML.DEF.1.1 Pass
3.1.24 UWEM.B.10.12.3.3.HTML.DEF.4.1 Pass
3.1.25 UWEM.B.10.12.4.3.HTML.DEF.1.1 Pass
3.1.26 UWEM.B.10.12.4.3.HTML.DEF.2.1 Pass
3.1.27 UWEM.B.10.13.1.3.HTML.DEF.1.1 Pass
Conformance Crawler
3.2.0.2 Pages with lastmodified prior to the last crawl are not recrawled.
3.2.1.1 Web pages (page scenarios) are correct.
3.2.1.2 Aggregation is correct Pass
3.2.1.4 Crawling the same web site twice gives roughly the same result
47

D5.3.14 Version: 0.73
TC No. Test description Result
3.2.1.7 Crawler stop criterion Fail
Conformance Sampler
3.2.2.1 Valid RDF Generation Pass
3.2.2.2 Crawler does not write to the same database more than once Pass
3.2.2.3 Crawler does not write the more than one site to the DB Pass
3.2.2.4 Crawler handles sites with redirect, even to a separate domain. Pass
3.2.2.5 Sites crawled with a low change frequency are not passed to the Data Warehouse. Pass
3.2.4.1 The URL repository is able to handle many crawlers in parallel Pass
Conformace Site URL server, URL repository
3.2.4.2 URL repository does not send the same data more than once to the ETL
3.2.4.3 URL repository does not send out the same link more than once, even with large data sets
3.2.5.1 Handling of pages that are unreachable (once) Pass
3.2.5.2 Handling of pages with wrong HTML
3.2.5.3 Handling of pages that have problems in analysis
3.2.5.4 Handling of pages where the CSS is not available
3.2.5.6 Handling crawlers that fail Pass
3.2.5.7 Handling ETLs that fail
Data Warehouse and Online Reporting Tool
3.3.1.1 Aggregation (Cwam) test
3.3.2.1 Data Warehouse consistency test with focus on ETL correctness
3.4.1 Robustness test
3.4.2 Data Wareouse Not Available test
3.4.3 SQL injection is not possible
3.4.4 Redirection to another site (when the online reporting tool changes) works
3.4.5 Only dynamic URLs in the online reporting tool
Installation and Maintanance
48
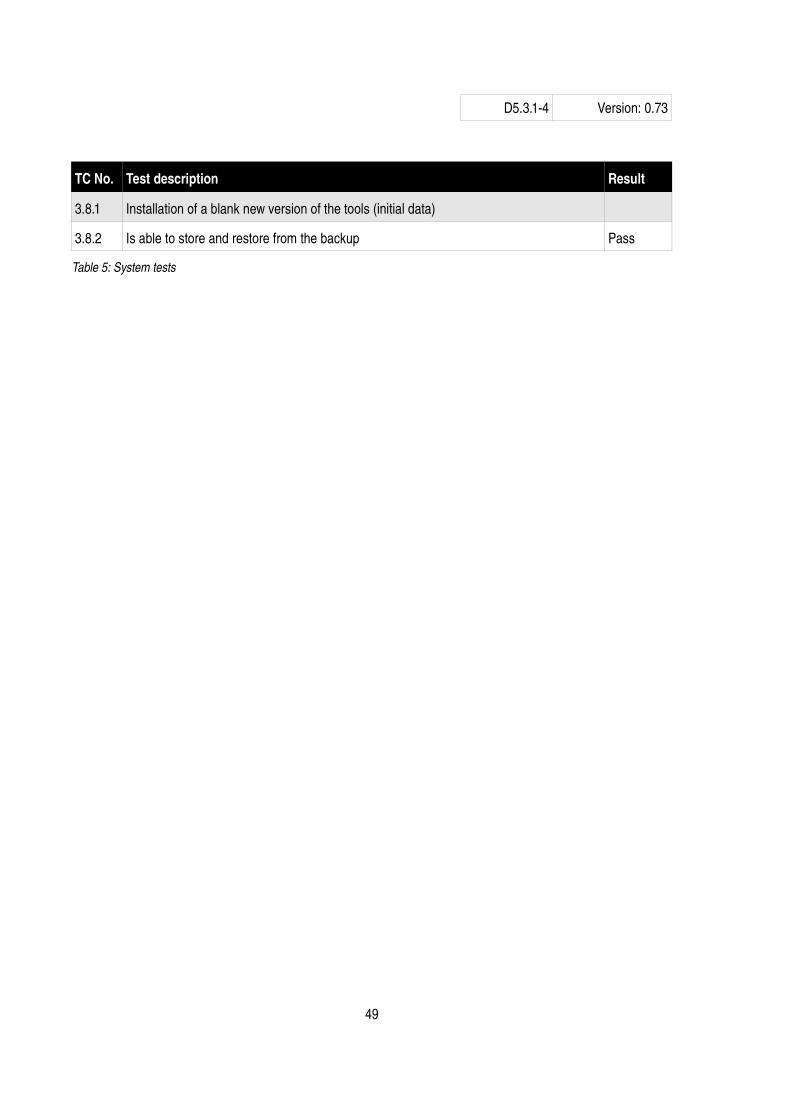
D5.3.14 Version: 0.73
TC No. Test description Result
3.8.1 Installation of a blank new version of the tools (initial data)
3.8.2 Is able to store and restore from the backup Pass
Table 5: System tests
49

D5.3.14 Version: 0.73
13 Appendix D: Calcultion of Linear RegressionIn this chapter we present calculations to reach the linear regression ([10]).
A linear function is defiled as f t =atb . Using linear regression based on sampled data from our performance mesurements gives us the following.
Y =atb
where t is number of hours,
and a is the number of sites inserted per hour
and Y is predicted number of sites,
and is error.
For reason of clarity, the linear regressions are calculated as following
b=∑ x
i−x y
i−y
∑ xi– x
2
and
a=y – b x
where xi represents observed value of an hour and y
i represents observed value of number of sites.
Note that to further verify a linear regression, the correlation coefficient ( r value) between the linear regression and the true data can be caclulated as following:
r=n∑ xy−∑ x∑ y
[n∑ x 2–∑ x2][n∑ y2–∑ y
2]
. An r value close to 1, indicates that there is a significant correlation between the true performance results and the results based on linear regression. Thus, indicating that the data indeed are linear.
50