testing solar and heat pump systems in laboratory … · subtask b report b2 ... testing solar and...
TRANSCRIPT

Subtask B Report B2 – Laboratory Test Report Page 1
Testing Solar and Heat Pump Systems in laboratory
A technical report of Subtask B of SHC Task 44 - HPP Annex 38
Report B2
Date: December 11th, 2013
Michael Hartl
AIT Austrian Institute of Technology GmbH, Energy Department, Giefinggasse 2, 1210 Vienna, Austria
Phone : +43 50 550 6040 Fax : +43 50 550 6679 e-mail : [email protected]
Ivan Malenković
AIT Austrian Institute of Technology GmbH, Energy Department, Giefinggasse 2, 1210 Vienna, Austria
Jorge Facão
Laboratório Nacional de Energia e Geologia, LNEG, Lisbon, Portugal
Ivan Katic
Danish Technological Institute, DTI, Denmark
Robert Haberl, Andreas Reber, Michel Y. Haller
Institut für Solartechnik, SPF, Rapperswil, Switzerland

Subtask B Report B2 – Laboratory Test Report Page 2
IEA Solar Heating and Cooling Programme
The Solar Heating and Cooling Programme was founded in 1977 as one of the first multilateral
technology initiatives ("Implementing Agreements") of the International Energy Agency. Its mission
is “to enhance collective knowledge and application of solar heating and cooling through
international collaboration to reach the goal set in the vision of solar thermal energy meeting 50% of
low temperature heating and cooling demand by 2050.
The member countries of the Programme collaborate on projects (referred to as “Tasks”) in the field of
research, development, demonstration (RD&D), and test methods for solar thermal energy and solar
buildings.
A total of 52 such projects have been initiated to-date, 39 of which have been completed. Research
topics include:
Solar Space Heating and Water Heating (Tasks 14, 19, 26, 44)
Solar Cooling (Tasks 25, 38, 48)
Solar Heat or Industrial or Agricultural Processes (Tasks 29, 33, 49)
Solar District Heating (Tasks 7, 45)
Solar Buildings/Architecture/Urban Planning (Tasks 8, 11, 12, 13, 20, 22, 23, 28, 37, 40, 41, 47,
51, 52)
Solar Thermal & PV (Tasks 16, 35)
Daylighting/Lighting (Tasks 21, 31, 50)
Materials/Components for Solar Heating and Cooling (Tasks 2, 3, 6, 10, 18, 27, 39)
Standards, Certification, and Test Methods (Tasks 14, 24, 34, 43)
Resource Assessment (Tasks 1, 4, 5, 9, 17, 36, 46)
Storage of Solar Heat (Tasks 7, 32, 42)
In addition to the project work, there are special activities:
SHC International Conference on Solar Heating and Cooling for Buildings and Industry
Solar Heat Worldwide – annual statistics publication
Memorandum of Understanding with solar thermal trade organizations
Workshops and conferences
Country Members
Australia Germany Portugal
Austria Finland Singapore
Belgium France South Africa
China Italy Spain
Canada Mexico Sweden
Denmark Netherlands Switzerland
European Commission Norway United States
SponsorMembers
ECI ECREEE RCREEE
Further information:
For up to date information on the IEA SHC work, including many free publications, please visit
www.iea-shc.org.

Subtask B Report B2 – Laboratory Test Report Page 3
IEA Heat Pump Programme
This project was carried out within the Solar Heating and Cooling Programme and also within the Heat Pump
Programme, HPP which is an Implementing agreement within the International Energy Agency, IEA. This
project is called Task 44 in the Solar Heating and Cooling Programme and Annex 38 in the Heat pump
Programme.
The Implementing Agreement for a Programme of Research, Development, Demonstration and Promotion of
Heat Pumping Technologies (IA) forms the legal basis for the IEA Heat Pump Programme. Signatories of the IA
are either governments or organizations designated by their respective governments to conduct programmes in
the field of energy conservation.
Under the IA collaborative tasks or “Annexes” in the field of heat pumps are undertaken. These tasks are
conducted on a cost-sharing and/or task-sharing basis by the participating countries. An Annex is in general
coordinated by one country which acts as the Operating Agent (manager). Annexes have specific topics and
work plans and operate for a specified period, usually several years. The objectives vary from information
exchange to the development and implementation of technology. This report presents the results of one Annex.
The Programme is governed by an Executive Committee, which monitors existing projects and identifies new
areas where collaborative effort may be beneficial.
The IEA Heat Pump Centre
A central role within the IEA Heat Pump Programme is played by the IEA Heat Pump Centre (HPC). Consistent
with the overall objective of the IA the HPC seeks to advance and disseminate knowledge about heat pumps, and
promote their use wherever appropriate. Activities of the HPC include the production of a quarterly newsletter
and the webpage, the organization of workshops, an inquiry service and a promotion programme. The HPC also
publishes selected results from other Annexes, and this publication is one result of this activity.
For further information about the IEA Heat Pump Programme and for inquiries on heat pump issues in general
contact the IEA Heat Pump Centre at the following address:
IEA Heat Pump Centre
Box 857
SE-501 15 BORÅS
Sweden
Phone: +46 10 16 55 12
Fax: +46 33 13 19 79
Visit the Heat Pump Programme website - http://www.heatpumpcentre.org/ - to find more publications and to
learn about the HPP Programme.
Legal Notice Neither the IEA Heat Pump Centre nor the SHC Programme nor any person acting on their
behalf: (a) makes any warranty or representation, express or implied, with respect to the information contained in
this report; or (b) assumes liabilities with respect to the use of, or damages, resulting from the use of this
information. Reference herein to any specific commercial product, process, or service by trade name, trademark,
manufacturer, or otherwise, does not necessarily constitute or imply its endorsement recommendation or
favouring. The views and opinions of authors expressed herein do not necessarily state or reflect those of the
IEA Programmes, or any of its employees. The information herein is presented in the authors’ own words.

Subtask B Report B2 – Laboratory Test Report Page 4
Contents
Contents ................................................................................................................................ 4
Nomenclature ........................................................................................................................ 5
1 Overview of Systems tested ............................................................................................ 7
2 Test of a direct expansion domestic hot water SHP system (number 1) .......................... 9
3 DHW heat pump/solar collector system test (number2) ..................................................17
4 Laboratory tests of five SHP systems (number 3 – 7) .....................................................23
5 Conclusion......................................................................................................................31

Subtask B Report B2 – Laboratory Test Report Page 5
Nomenclature
CED Cumulative Energy Demand P Power in W
COP Coefficient of Performance Q Thermal power in W
Energy flux in W PER Primary Energy Ratio
GWP Global Warming Potential SCOP Seasonal COP
Solar irradiation in W SPF Seasonal Performance Factor
Subscripts, capital BU Back-up unit HS Heat source C Cooling, low temperature HX Heat exchanger COM Cooling operation mode NRE Non-renewable CU Control unit PE Primary energy DHW Domestic hot water SC Solar collector(s) FE Final energy SH Space heating H High temperature SHP Solar and heat pump
HOM Heating operation mode SHP+ Solar and heat pump plus energy distribution system
HP Heat pump UE Useful energy HR Heat rejection Subscripts, small bSt Before storage el Electrical coll Collector(s) rad Radiative sys System
Subtask B Report B2 – Laboratory Test Report Page 6
Executive summary
This report is part of Subtask B of the joint activity called “Solar and heat pump (SHP) systems” of the Solar Heating and Cooling (SHC) Task 44 and the Heat pump programme (HPP) Annex 38 (also designated as T44A38).
Within the T44A38 as many as 13 different system tests could be performed successfully. Three different test methods were conducted, a modified bin method, a test based on EN255-3 and five tests according to the concise cycle test (CCT). The test with the modified bin method and the test based on EN255-3 were conducted on the same system. The comparison of the two test methods showed a good agreement in the results, although the boundary conditions were slightly different. The test based on EN255-3 was more time consuming and depending on the weather conditions. Therefore the test seems also not to be repeatable with the same conditions. The modified bin method, which is based on a Trnsys simulation model, needs only to perform some specific experiments for parameter identification. The whole system test method CCT proved to be a valuable tool both for system development as well as for performance evaluation. The advantage of this kind of system test is that non-ideal component interactions and the influence of hydraulics and control under transient operating conditions can be detected and evaluated precisely. The test delivers within 12 days information about all operating conditions that may occur during a whole year and is thus much faster than field testing.

Subtask B Report B2 – Laboratory Test Report Page 7
1 Overview of Systems tested
This report is part of Subtask B of the joint activity called “Solar and heat pump (SHP) systems” of the Solar Heating and Cooling (SHC) Task 44 and the Heat pump programme (HPP) Annex 38 (also designated as T44A38).
T44A38 participants have tested several “solar and heat pump” systems in laboratory. This report presents the methodology and the results obtained by the laboratories that have accepted to share within T44A38 their experience.
Table 1 gives an overview of the tested systems that are reported according to the format developed and provided to participating laboratories by the Task 44 / Annex 38.
For detailed information on the performance figures used throughout this report and their definitions, please refer to the report B1 of T44A38. As a complement, in depth information on the various test procedures are provided in the report B3.
Table 1: Overview on the test results according to the Task 44 / Annex 38 definitions
Number Configuration Functionality Source Method Institute
1 Serial DHW Solar collector Modified bin method
LNEG, Portugal
2 Serial DHW Solar collector Based on EN255-3
DTI, Denmark
3 Parallel Space Heating /DHW
Ground Concise Cycle Test (CCT)
SPF, Switzerland
4 Parallel Space Heating /DHW
Air Concise Cycle Test (CCT)
SPF, Switzerland
5 Serial / Parallel Space Heating /DHW
Solar Collector /Air
Concise Cycle Test (CCT)
SPF, Switzerland
6 Serial / Parallel Space Heating /DHW
Solar Collector /Air
Concise Cycle Test (CCT)
SPF, Switzerland
7 Parallel Space Heating /DHW
Air Concise Cycle Test (CCT)
SPF, Switzerland
8 Parallel Space Heating /DHW
Ground Concise Cycle Test (CCT)
SPF, Switzerland
9 Parallel Space Heating /DHW
Ground Concise Cycle Test (CCT)
SPF, Switzerland

Subtask B Report B2 – Laboratory Test Report Page 8
10 Parallel Space Heating /DHW
Ground Concise Cycle Test (CCT)
SPF, Switzerland
11 Parallel Space Heating /DHW
Ground Concise Cycle Test (CCT)
SPF, Switzerland
12 Serial / Parallel Space Heating /DHW
Solar collector Concise Cycle Test (CCT)
SPF, Switzerland
13 Serial / Parallel Space Heating /DHW
Solar collector Concise Cycle Test (CCT)
SPF, Switzerland

Subtask B Report B2 – Laboratory Test Report Page 9
2 Test of a direct expansion domestic hot water SHP system (number 1)
Institute/Company: LNEG, Lisbon, Portugal Summary written by: Jorge Facão, Mars 2013 Published in (if available): Jorge Facão and Maria João Carvalho, 2013, New test methodologies to
analyse direct expansion solar assisted heat pumps for DHW, submitted to Solar Energy
Purpose / idea of the study
Development of new test methodologies to analyse direct expansion solar assisted heat pumps for DHW. Two systems with different thermal stores volume were analysed.
Method used
Two methodologies were developed for performance measurement: modified BIN method with daily average air temperature as an input and long term performance prediction with a Trnsys model validated with specific experimental conditions. The long term performance prediction is a methodology similar to the already obtained for solar thermal systems. The seasonal performance factor was calculated for three cities in Portugal (Lisbon, Porto and Bragança) and for additional four cities in Europe (Davos, Athens, Helsinki and Strasburg).
The BIN method was validated for daily average temperatures above 7°C, the minimum possible temperature in Lisbon. With the Trnsys model it is possible to calculate the performance for all climatic conditions. The parameters in Trnsys grey-box model were optimized with specific experimental tests.
Description of the tested system and measurement equipment
We present an analysis of DX-SAHP of the company “Energie”. The taping cycle in thermal storage and SPF calculation is according to EN 16147:2001. The outside air temperature was variable contrarily to the standard and there is an influence of solar radiation in evaporator, which is not the case in EN 16147:2011. With our test facility it was possible to control the inlet water temperature near 10 °C only after June 2012, after the installation of a chiller. Nevertheless in tapping cycles the energy calculation takes the real inlet water temperature into account. It was also impossible to control rigorously the ambient temperature where the thermal storage was located around 20°C as cited by the standard.
The analysis presented is for a system with a heat storage tank of 300 litters, evaporator of 1.6 m2 and set-point of 50°C. According to the tests done in the laboratory the tapping cycle adequate for the system was the L. A new system with a heat storage tank of 250 litters, set-point of 52°C was also tested. For the new system the tapping cycle more adequate was the XL and we have got higher SPF values.
The systems in analysis are presented in figure 1 to 2. Table 1 present the principal dimensions of the systems. Figure 4 presents the hydraulic scheme of the system and figure 5 presents the classification of the systems according to Task 44 – Annex 38.
Table 2 presents a description of the sensors used. Besides the sensors used to calculate the useful heat extracted in storage tanks and the total electrical energy consumption, we have used sensors to characterize the unglazed solar collector evaporator: pyranometer, anemometer and hygro-thermo transmitter.

Subtask B Report B2 – Laboratory Test Report Page 10
Figure 1 Direct expansion solar evaporator.
Figure 2 Storage Tank and compressor. Volume = 300 l (left) and 250 l( right).
Table 2 Principal characteristics of the systems.
System 300 litters System 250 litters
Rotary compressor nominal power 455 W
Fluid R134a
Tank nominal volume 300 l 250 l
Aero-solar evaporator surface 0.2 x 2 = 1.6 m2
Set-Point 50°C 52°C
DT differential 5°C

Subtask B Report B2 – Laboratory Test Report Page 11
Figure 3 Hydraulic scheme of tested
Figure 4 Energy flow diagram
Classification of the system according to Task 44 / Annex 38 nomenclature:

Subtask B Report B2 – Laboratory Test Report Page 12
Table 3 Used sensors.
Type Measured
quantity
Description of
measured qty.
Type of
device Range Accuracy
Data logging /
signal
Kipp and
Zonen CMP
11
Solar irradiance Pyranometer 0 – 4000 W/m2 ISO Secondary
standard
0-20 mVDC
ABB V Volumetric Flow
Rate
Electromagn
etic Flow
Meter
2.22 – 44 l/min ±0,40%
4 – 20mA
Thies Clima V_wind Wind velocity anemometer 0.5 – 40 m/s ±0,5 m/s 0 – 10 V
Thies Clima RH
Tair
Humidity
Temperature
Hygro-
thermo
transmitter
0 – 100 %
-40 - + 80°C
±2%
±0,2 K
0 – 1 V
Pt 100 4 wires 100
Ohm at 0°C
IST AG Twater Temperature Pt100 -50 - +200°C Class B Four wire 100
Ohm at 0°C
Flouro Tint Indoor air
temperature
Pt100 -20 – 40°C Class A Four wire 100
Ohm at 0°C
Camille
Bauer Sineax
A210
W Power
consumption
Multifunctio
nal Power
Monitor
0 – 0.5 kVA ±1% 4 – 20 mA
Boundary Conditions used
The tapping cycles used in the systems were in agreement with EN 16147:2011. We have used the cycle L for the system with 300 l and cycle XL for the system with 250 l. Seasonal performance factor was calculated supposing constant tapping cycles all over the year. Only the outside conditions where the solar evaporator was placed change.
Figure 5 presents the thermal energy extracted in storage tank according to tapping cycle L. The big extractions occur in the morning – 7:00 to 8:00 – and in the evening -20:00 to 21:00. This fact forces the compressor to run in these periods. Figure 6 presents the ON-OFF-cycles of the compressor and solar irradiance in summer and winter. The compressor is running majority in periods with low irradiance. Therefore the influence of solar irradiation in system performance was smaller than as expected and it is due to the profile of taping cycle recommended.
Figure 5 Thermal energy extracted in tapping cycle L.
0
0.5
1
1.5
2
2.5
3
3.5
4
7 8 9 10 11 12 13 14 15 16 17 18 19 20 21
Ene
rgy
[kW
h]
Time
Tapping cycle L

Subtask B Report B2 – Laboratory Test Report Page 13
Figure 6 On-off-cycles of the compressor and solar irradiance in winter and summer with tapping cycle L.
Definition of performance figures
The SPF is calculated according to EN16147:2011.
SPF=QTC/WEL-TC
QTC is the useful heat and WEL-TC is the total electrical energy consumption during the whole tapping cycle both in kWh.
Test Results
The systems were tested in Lisbon during one year covering the almost all local possible weather conditions with the evaporator outside. The performance of the system with 300 l is presented in figures 7 to 10 as a function of outdoor conditions: daily average ambient temperature, daily average dew point temperature and daily solar irradiation. The thermal performance of the heat pump presents a correlated dependence with daily average ambient temperature and with daily average dew point temperature. For daily solar irradiation was difficult to determine a dependency of SPF with it. As explained above the compressor runs principally during the morning and evening, periods with low solar input.
0
200
400
600
800
1000
0
1
0 5 10 15 20 25 30 35
G [
W/m
2]
ON
/OFF
time [h]
3 Fev
ON/OFF
G
0
200
400
600
800
1000
0
1
0 5 10 15 20 25 30 35
G [
W/m
2]
ON
/OFF
time [h]
25 Jan
ON/OFF
G
0
200
400
600
800
1000
0
1
0 5 10 15 20 25 30G
[W
/m2]
ON
/OFF
time [h]
24 Jun
ON/OFF
G
0
200
400
600
800
1000
1200
1400
0
1
-5 0 5 10 15 20 25 30
G [
W/m
2]
ON
/OFF
time [h]
14 Jun
ON/OFF
G

Subtask B Report B2 – Laboratory Test Report Page 14
Figure 7 Daily SPF as a function of daily average dew point temperature (300l).
Figure 8 Daily SPF as a function of daily solar irradiation (300l).
Figure 9 Daily SPF as a function of daily average outside air temperature (300 l).
y = 0.0518x + 1.3455R² = 0.6471
0.00
0.50
1.00
1.50
2.00
2.50
3.00
-10.00 -5.00 0.00 5.00 10.00 15.00 20.00 25.00
dai
ly S
PF
Tdp [ºC]
y = -0.0025x + 1.9842R² = 0.0032
0
0.5
1
1.5
2
2.5
3
0 5 10 15 20 25 30 35
dai
ly S
PF
H [MJ/(m2day)]
y = 0.051x + 1.1091R² = 0.6033
0
0.5
1
1.5
2
2.5
3
0.00 5.00 10.00 15.00 20.00 25.00 30.00 35.00
dai
ly S
PF
Tair [ºC]

Subtask B Report B2 – Laboratory Test Report Page 15
Figure 10 Daily SPF as a function of daily average outside air temperature and solar irradiation (300l).
A new system with a different storage tank (more slim), 250 liters, was tested and analysed since the mid of July 2012 until the end of October 2012. The temperature inside storage tank seems to be more stratified. The system is composed by the same evaporator and it is able to produce domestic hot water for XL tapping cycle instead of cycle L as the previous system. Figure 11 presents daily SPF as a function of daily average outside air temperature.
Figure 11 Daily SPF as a function of daily average outside air temperature for the system with 250l.
BIN
The heat pumps seasonal performance factor for domestic hot water preparation is calculated for fixed conditions of ambient temperature. The European standard EN 14825 presents a methodology to calculate the heat pump SPF for space heating for several part loads, i.e. for several cold source temperature. The BIN used is the hourly average evaporator ambient air temperature. Here is
0.00
0.50
1.00
1.50
2.00
2.50
3.00
0.00 5.00 10.00 15.00 20.00 25.00 30.00 35.00
dai
ly S
PF
Tair [ºC]
H 25 - 31
H 19-24
H 13 -18
H 7-12
H 1-6
y = 0.0735x + 1.2824R² = 0.8499
0.00
0.50
1.00
1.50
2.00
2.50
3.00
3.50
0.00 5.00 10.00 15.00 20.00 25.00 30.00 35.00
dai
ly S
PF
Tair [ºC]

Subtask B Report B2 – Laboratory Test Report Page 16
present a methodology based in BIN method, which uses as an input the daily average evaporator ambient air temperature and daily SPF from experimental analysis. The SPF is calculated from the equation below.
LTPP
Using the model and characteristic parameters determined by simulation and experimental validation is possible determine the long term performance prediction based in a simulation for several climatic conditions.
Table 4 summarizes the results and compare the LTPP with BIN method. It must be noted that the SPF fitting used in modified BIN method was obtained with experimental tests without the required conditions, i.e. indoor temperature of 20°C and inlet water temperature of 10°C. The experimental tests were done for daily average temperature above 7°C. Some cities present much lower daily average temperatures. In LTPP based on the numerical model developed the system was simulated with the required conditions.
The BIN method is more time consuming, it require one year test or a climatic chamber with solar simulator. With grey-box model developed in TRNSYS, only specific experimental tests are required for parameters identification.
Table 4 Annual performance factor evaluated by LTPP and BIN method
300 l system 250 l system
City Annual average ambient temperature
[°C]
SPF
LTPP
SPF
BIN method
SPF
LTPP
Lisbon 16.8 2.19 1.96 2.80
Porto 14.5 2.18 1.84 2.79
Bragança 12.2 2.13 1.69 2.71
Athens 18.4 2.21 2.00 2.82
Davos 2.8 1.77 1.27 2.26
Helsinki 5.6 1.78 1.36 2.27
Strasburg 11.0 2.06 1.61 2.63

Subtask B Report B2 – Laboratory Test Report Page 17
3 DHW heat pump/solar collector system test (number2)
Institute/Company: Danish Technological Institute Summary written by: Ivan Katic, March 2013 Published in (if available): Lasse Søe, October 2009, Test Report no 288028a, DTI Heat Pump Lab
Purpose / idea of the study: Experimental investigation of the system performance was carried out for a commercial customer who wanted to import the system package Solar PST300IS, a DHW heat pump with direct evaporation of the refrigerant in two uncovered solar collectors.
Method used
EN255-3 is used, except that the requirement for long term testing could not be fulfilled. The standard test method is normally used for test of DHW heat pumps in our lab.
Test procedure
1. The storage tank is filled with cold water. The time and energy consumption for heating to the desired temperature is measured.
2. COP under load is determined. A volume of 150 l (half tank) is drawn off when the thermostat switches off the heat pump for the first time. When the water has been re-heated and the thermostat switches off again, another 150 l is tapped. COP is determined af the tapped energy divided by the supplied electricity to the unit.
3. The average temperature of the tapped water under maximum load is determined by continuous tapping until a hot water temperature of 40°C has been reached.
4. Determination of stand-by power consumption during 48 hours with closed valve.
5. After sequence #4 water is tapped continuously until a hot water temperature of 40°C has been reached. The maximum volume of useful hot water at 40°C is calculated from the temperature and flow recording, assuming that cold water for mixing at the tap valve has a temperature of 15°C
Description of the tested system and measurement equipment
System classification:
Short description of the control system / operation modes:

Subtask B Report B2 – Laboratory Test Report Page 18
Fig. 1 System as described by the manufacturer ( www.solarpst.com )
The system is providing tap water only and has an integrated control system that responds to the measured temperature of the storage tank.
Laboratory equipment:
• Platform without shadows for installation of solar collectors
• Water and electricity supply to the main unit
• Computer and tapping robot for controlled DHW consumption
• kWh meters, flow meters, temperature sensors, pyranometer, humidity meter
The system was installed in the laboratory according to supplier’s instructions (not in climate chamber as usual heat pump tests). The solar panel was installed on the roof of the building, more than 5 m above the tank and the length of the piping was 2 x 11.1 m. The 1.6m2 absorber plate was mounted due south with an inclination of 45 degrees. The circuit was charged with 1,4 kg refrigerant R134a.

Subtask B Report B2 – Laboratory Test Report Page 19
Before the test the built-in electric heater was disconnected so only the heat pump energy consumption was measured.
The following values have been measured:
• Ambient temperature near the solar panels
• Relative humidity near the solar panels
• In-plane total irradiance
• Cold supply water temperature to the storage
• Flow of cold supply water
• Hot water temperature from the storage
• Electric energy delivered to the heat pump unit
• Ambient temperature near the storage
The flow of hot water was controlled by a solenoid valve mounted on the storage and controlled by the measurement computer.
Table 1: Item list
Type Measured
quantity
Description of
measured qty.
Type of
device Range Accuracy
Data logging /
signal
1.Pyranomet
er
G In plane
irradiance
Pyranomet
er, Eppley
0-1200 W/m2 3% mV
2.Pt100 Tamb Outdoor air
temperature
Pt100 0-100 … Ohm
3.Pt100 Tin,DHW Water inlet
temperature
Pt100 0-100 Ohm
4.Pt100 Tout,DHW Water outlet
temperature
Pt100 0-100 Ohm
5.Flow Q Volume flow of
tap water
Magnetic
flow meter
mV

Subtask B Report B2 – Laboratory Test Report Page 20
Figure 2: Hydraulic scheme of tested system with all relevant measurement devices referenced to the items of Table 1 and system boundary for performance evaluation
WaterGroundWasteHeat
Sun
EnergyCarrier
HeatPump
Storage (source)
DHW
SpaceHeating
Cold
Air
DHW Tank
PST 300
Solar
Collector
Electricity
Backup
Water
Brine
Refrigerant
Driving Energy
Figure 3: Energy flow diagram of the system under test
Boundary Conditions used
Load profiles / measurement points (graphically): See figure below
Climate conditions (graphically): 15 measurement series have been recording during the period December 2008 to June 2009 in order to test the system under relevant climatic conditions.
Supply / return / set temperatures, mass flows etc.
Data acquisition and processing
Irradiance
Tamb
Tout, DHW
Tin, DHW
Flow

Subtask B Report B2 – Laboratory Test Report Page 21
Sampling rate
Error estimation (give a full description of the estimated error for the results based on the method used and the devices applied)
Definition of performance figures
Boundary 6 (COP) is used
Fig. 4 Illustration of load cycles used in the test. Temperatures are indicative only
Test Results
The measured COP under test sequence#2 varies from month to month according to the following table:
Month December January June July
COP 2.15-2.40 2.13-2.32 2.70 (only one recording) 2.4-3.36
Subtask B Report B2 – Laboratory Test Report Page 22
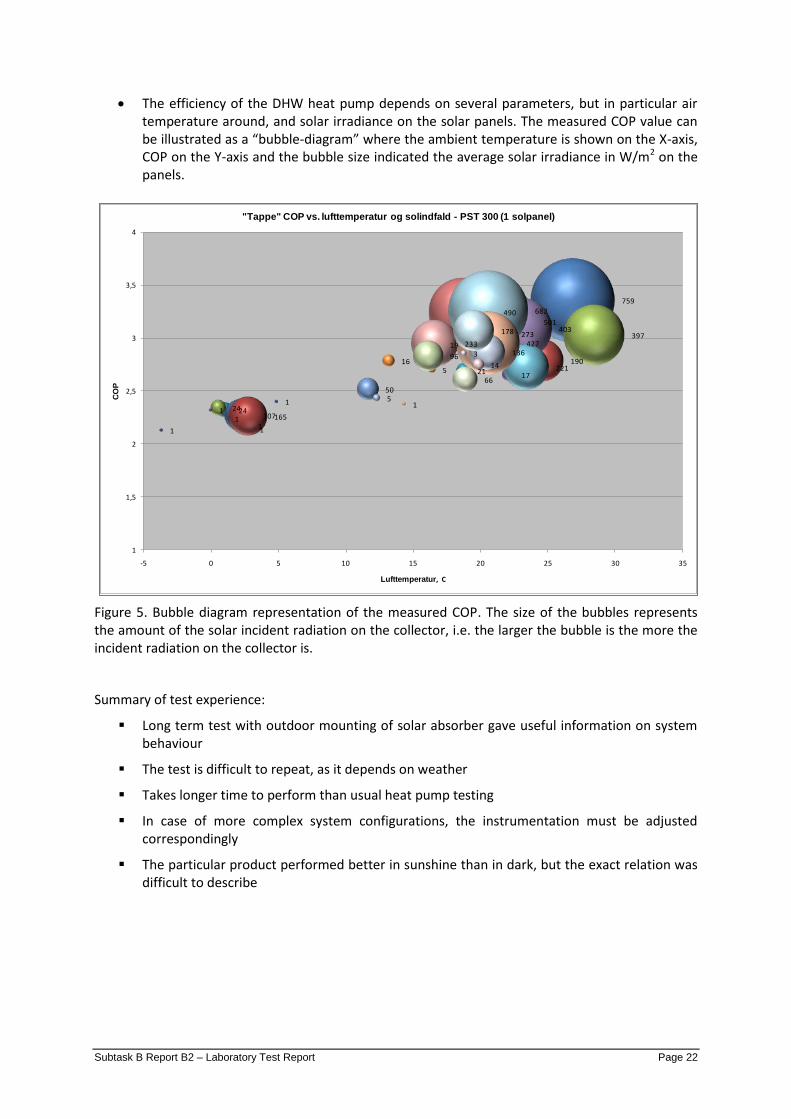
The efficiency of the DHW heat pump depends on several parameters, but in particular air temperature around, and solar irradiance on the solar panels. The measured COP value can be illustrated as a “bubble-diagram” where the ambient temperature is shown on the X-axis, COP on the Y-axis and the bubble size indicated the average solar irradiance in W/m2 on the panels.
Figure 5. Bubble diagram representation of the measured COP. The size of the bubbles represents the amount of the solar incident radiation on the collector, i.e. the larger the bubble is the more the incident radiation on the collector is.
Summary of test experience:
Long term test with outdoor mounting of solar absorber gave useful information on system behaviour
The test is difficult to repeat, as it depends on weather
Takes longer time to perform than usual heat pump testing
In case of more complex system configurations, the instrumentation must be adjusted correspondingly
The particular product performed better in sunshine than in dark, but the exact relation was difficult to describe
1
111
241 107165
241
215
759
190
397
17
19
16
50
490501
403
221
15
233
96
273
682
427136
14
66
3
178
1
1,5
2
2,5
3
3,5
4
-5 0 5 10 15 20 25 30 35
CO
P
Lufttemperatur, C
"Tappe" COP vs. lufttemperatur og solindfald - PST 300 (1 solpanel)
Subtask B Report B2 – Laboratory Test Report Page 23
4 Laboratory tests of eleven SHP systems (number 3 – 14)
Institute/Company: Institut für Solartechnik, SPF, Rapperswil, Switzerland Summary written by: Robert Haberl, Andreas Reber, Michel Y. Haller, October 2013 Published in (if available): A final report will be pulished as an SFOE (Swiss Federal Office of
Energy) report for the project SOL-HEAP by early 2014. Part of the results are also discussed in more detail in Haberl et al. (2013).
Purpose / idea of the study: Within the project SOL-HEAP that was supported by the Swiss Federal Office of Energy (SFOE), the Institut für Solartechnik SPF from the University of Applied Sciences HSR extended its whole system test method CCT for the application to ground source, air source, and series connected solar and heat pump systems. The CCT method was previously used for testing solar thermal combisystems in combination with gas, heating oil or pellets (Vogelsanger 2002; Haller & Vogelsanger 2005; Konersmann et al. 2007; Haberl et al. 2009).
The goal of this kind of test method is to evaluate the performance of complete heating systems that combine solar thermal collectors with heat pumps as a whole, including all component interactions and system dynamics as well as system control. The results of this test can be used in the development phase of a system concept in order to detect malfunctions or inefficient operating conditions much faster and with higher accuracy than in field tests, and it can be used for final products on the market in order to show the energetic efficiency of the whole system.
Within the SOL-HEAP project, the test method was applied to several systems from different manufacturers in order to show the capabilities of the test method itself as well as the energetic efficiency of the various tested systems, including potentials for improvements of system concepts.
Method used
The test method used is called the Concise Cycle Test (CCT). In this test, a heating system – usually a solar combisystem – is installed with all its components on the test rig1. The system with its own controller(s) is left to cover the building load and the domestic hot water demand, both simulated and emulated by the test rig, over a time-span of 306 hours (18 hours pre-conditioning, followed by the 12 core test days that are evaluated). Simulation and emulation of the collector field and of the building load are implemented by real-time TRNSYS simulation in combination with the appropriate testrig hardware that is connected to the tested system. The simulations/emulations take into account the real behavior of the tested system. Annual performance data are calculated based on annual simulations using a model that is parameterized based on the 12-day test results plus additional component test results where needed. Further details on the test method can be found in (Vogelsanger 2002; Haberl et al. 2009; Haller et al. 2013).
Boundary Conditions used
1 with the exception of the solar collectors that are simulated and emulated during the test

Subtask B Report B2 – Laboratory Test Report Page 24
The climate data used for the 12 days test as well as for the annual simulation were obtained based on 10-min measured data of several years for Zürich SMA in the Swiss midlands (own compilation of a test reference year. The emulated building of the original CCT method from the year 2002 represented a single-family house with an annual het demand of 100 kWh/(m2a), approximately 15500 kWh/a in total. However, since building standards are developing and 100 kWh/(m2a) is a high value even for a refurbished building in this location, the building definition was adapted in 2011 in order to match more closely a contemporary "refurbished" building (60 kWh/(m2a). One of the tested systems was intended for passive houses only, and therefore was also tested with lower space heating demand of 15 kWh/(m2a). For all systems, low temperature floor heating systems have been assumed. The DHW load was derived from statistical tools that were developed in the IEA SHC Task 26 (Jordan & Vajen 2003). Different categories or types of draw-offs with different mass flow rates have been defined.
Description of the tested system and measurement equipment
A total of 11 system tests have been performed on systems from six different manufacturers, including parallel ground source and air source heat pump systems as well as series & parallel combinations and one "series only" system that used only solar thermal collectors as a heat source. The energy flow charts and letter codes for the system hydraulic concepts are shown in Figure 12 to Figure 16, information on the components of the systems can be found in Table 5, Table 6 and Table 7.
Systems I & II were parallel air source and ground source solar and heat pump systems available on the market from the same company, i.e. the same storage tank was used with different heat pumps. The air source heat pump was capacity controlled.
System tests III & IV were performed with a combined parallel and series concept available on the market, tested once with 15 m2 covered flat plate collectors and once with 20 m2 selective uncovered collectors.
System V was a parallel air source solar and heat pump system available on the market, with a capacity controlled heat pump.
System tests VI, VII & VIII were performed with a parallel ground source solar and heat pump system that was tested three times with different hydraulics and/or control configurations.
System IX is a parallel ground source solar and heat pump system with the condenser of the heat pump integrated into a solar combi-storage. The system contains other innovative features and is a prototype to be released into the market soon.
Systems X & XI were "series only" solar and heat pump systems that used 30 m2 façade integrated flat plate collectors as the only heat source for the heat pump. The two systems were from the same prototype development of one manufacturer, once measured at the beginning of the development phase and once at the end, after improving the concept based on the feedback from the first system test. This system is intended for passivehouse applications only and has therefore be tested with a lower space heating demand of 15 kWh(m2a).
More details on the hydraulic concepts and concepts for the control of these systems are not given in order to maintain the anonymity and protect the intellectual property rights of the involved manufacturers.

Subtask B Report B2 – Laboratory Test Report Page 25
Figure 12: Energy flow chart for systems I, VI, VII & VIII.
Figure 13: Energy flow chart for system II & V.
Figure 14: Energy flow chart for systems III & IV.
Figure 15: Energy flow chart for system IX.
Figure 16: Energy flow chart for systems X & XI.
HeatPump
Air WaterGround
Combi Tank
WasteHeat
Sun
System I, VI, VII, VIII
Flat-plate Collector
Electricity
Water
Brine
Refrigerant
Driving Energy
DHW
SpaceHeating
ColdStorage (source)
EnergyCarrier
Backup
,
Sol G
skS skS SHSHP
System II, V
HeatPump
Air WaterGround
Storage (source)
Combi Tank
WasteHeat
Sun
EnergyCarrier
Flat-plate Collector
Electricity
Water
Brine
Refrigerant
Driving Energy
DHW
SpaceHeating
Cold
,
Sol Air
skS skS SHSHP
System III + IV
HeatPump
Air WaterGround
Storage (source)
Combi Tank
DHW
SpaceHeating
WasteHeat
Sun
ColdEnergyCarrier
Collector
Electricity
Backup
Water
Brine
Refrigerant
Driving Energy
, ,
, ,
Sol Air Air S
skS HP skS SHSHP
HeatPump
Air WaterGround
Combi Tank
WasteHeat
Sun
System IX
Flat-plate Collector
Electricity
Water
Brine
Refrigerant
Driving Energy
DHW
SpaceHeating
ColdStorage (source)
EnergyCarrier
Backup
Sol G
skS skSSHP
System X, XI
HeatPump
WaterGround
BrineTank
Combi Tank
DHW
SpaceHeating
WasteHeat
Sun
ColdEnergyCarrier
Flat-plate Collector
Electricity
Backup
Water
Brine
Refrigerant
Driving Energy
Air
, ,
Sol srS
skS srS skS SHSHP

Subtask B Report B2 – Laboratory Test Report Page 26
Table 5: Heat pump of the tested systems (based on manufacturer's data).
Min. / Max. thermal power [kW]
Max. el. power consumption [kW]
COP
I 8.2 (a)
1.7 4.9 (a)
II 3.1 / 8.3 (b)
2.4 3.7 (b)
III + IV n/a n/a n/a
V 1.3 / 5.6 (b)
1.7 3.2 (b)
VI – VIII 8.3 (a)
1.8 4.6 (a)
IX n/a 2.4 n/a
X + XI n/a n/a n/a (a)
B0W35; (b)
A2W35
Table 6: Storage tank(s) of the tested systems.
Storage Volume
[m
3]
Diameter with
insulation [m]
Diameter without
insulation [m]
Storage height
[m]
IHX solar DHW preparation
I + II 0.9 1.0 0.8 2.1 Yes TiT
III + IV 1.0 1.1 0.8 2.0 No Ext.
V 1.0 1.0 0.8 2.2 Yes IHX
VI - VIII 0.9 1.0 0.8 2.1 No Ext.
IX 0.8 0.9 0.8 2.0 Yes IHX
X + XI 1.0 (a)
1.0 0.8 2.2 Yes TiT
TiT = Tank In Tank; Ext. = External heat exchanger; IHX = Immersed heat exchanger; (a) an additional 0.080 m3
glycol storage tank has been used on the cold side of the heat pump.
Table 7: Collector field of the tested systems (orientation: south).
Size of collector field [m
2]
Eta0(a)
[-]
A1(a)
[W/(m2K)]
A2(a)
[W/(m2K
2)]
Type Slope
I + II 12 0.73 3.5 0.01 Flat plate 45° III 15 0.75 3.4 0.01 Flat plate 45° IV 20 0.84 7.9 0.01 Selective Uncovered 45° V 10 0.73 3.7 0.01 Flat plate 45°
VI - VIII 13 0.79 3.1 0.02 Flat plate 45° IX 10 0.72 3.3 0.02 Flat plate 45°
X + XI 30 0.79 3.4 0.01 Flat plate 90° (a)
based on the collector gross area.
All systems have been installed completely (i.e. with all pumps, controllers and hydraulic connections) in the test room that was kept at 20 °C during the whole test. The outdoor units of air source systems have been installed in a climatic chamber that was close (6 m) to this test room. Inlet and outlet temperatures of fluid circulating between the tested systems and the test-rig has been measured with in-house calibrated 4-wire Pt100 sensors (uncertainty < 0.05 K), and mass flow rates have been measured either with in-house calibrated magnetic inductive or coriolis flow sensors (accuracy better than 0.5 %). The main electric energy consumption of the heat pump has been measured with a polyphase power measurement device with auto scaling measuring range by measuring and analyzing the effective values in each quadrant of the alternating current (accuracy better than 0,3%%). If the system allowed, the electricity of independent subsystems like space heat pumps, space heat mixing valves, solar pumps or the solar system controlling units have been measured by a universal single phase power measuring device with fixed measuring range (accuracy better than 2.5W).

Subtask B Report B2 – Laboratory Test Report Page 27
Data acquisition and processing
Data sampling was performed in one second time steps, power values based on mass flow rates and temperatures were equally calculated and integrated at one second time steps, and data logging was performed dependent on a threshold for change of the monitored variable.
Test Results
Results of the 12-days test sequence are summarized in Table 8. However, a direct comparison of the results from different system tests is difficult for several reasons:
The design space heat demand of the simulated building differed from 100 kWh/(m2a) for the first tests performed to 60 kWh/(m2a) for the new test standard applied, down to 15 kWh(m2a) for the special case of a system that is only intended for the use in a passive house.
The simulated space heat supplied deviates substantially from the design space heat demand, because the systems were let to deliver space heat according to their own control (thermostatic valves closing gradually when the simulated room temperature increased from 20 to 22 °C were simulated and the flow in the space heating loop reduced accordingly). As can be seen from the results, many systems delivered up to 50 % more space heat than needed for the most efficient space heat distribution control, and system VII with particularly unfavorable control settings delivered twice as much space heat as needed.
Different collector areas were applied from 10 – 15 m2 for the "normal" cases, with the exceptions of 20 m2 for uncovered selective absorbers instead of flat plate collectors and 30 m2 façade integrated flat plate collectors as the only source for the heat pump.
Table 8: Results of 12-day measurements.
standard space heat load (QSH) 100 kWh/(m2a)
PFSHP+ [-] Wel,tot [kWh] QSH [kWh] QDHW [kWh] QHP,DHW/QDHW [%]
I 4.8 128.0 519.7 99.9 100 II 3.5 184.2 566.8 72.0
(a) 114
(a)
standard space heat load (QSH) 60 kWh/(m2a)
PFSHP+ [-] Wel,tot [kWh] QSH [kWh] QDHW [kWh] QHP,DHW/QDHW [%]
III 3.2 95.1 203.7 99.8 - IV 3.0 106.6 223.7 100.1 - V 2.7 139.7 280.5 96.3 165 VI 4.0 105.2 315.6 102.1 112 VII 4.8 111.5 430.6 101.6 86 VIII 4.0 104.3 312.3 100.5 158 IX 4.5 95.3 334.7 91.6 -
standard space heat load (QSH) 15 kWh/(m2a)
PFSHP+ [-] Wel,tot [kWh] QSH [kWh] QDHW [kWh] QHP,DHW/QDHW [%]
X 3.1 41.5 62.3 68.3 n/a XI 3.5 47.7 95.1 70.0 40
(a) A piece of rigid foam blocked the mechanism of the thermostatic mixing valve for scalding protection after day 9
of the test period. That is why no draw-offs were possible during the last 3 test days.
Annual performance figures had only been calculated for four systems. The main results of the simulations are shown in Table 9.
Table 9: Results of annual simulations.
standard space heat load (QSH) 100 kWh/(m2a)

Subtask B Report B2 – Laboratory Test Report Page 28
SPFSHP+ [-] QSH [MWh] QDHW [MWh] Wel,tot [MWh] QHP,DHW/QDHW [%] Program
I 4.5 15.5 2.9 4.1 100 TRNSYS II 3.2 15.5 2.9 5.7 159 TRNSYS
standard space heat load (QSH) 60 kWh/(m2a)
SPFSHP+ [-] QSH [MWh] QDHW [MWh] Wel,tot [MWh] QHP,DHW/QDHW [%] Program
V 2.9 11.7 2.8 5.0 166 TRNSYS
standard space heat load (QSH) 15 kWh/(m2a)
SPFSHP+ [-] QSH [MWh] QDHW [MWh] Wel,tot [MWh] QHP,DHW/QDHW [%] Program
XI 3.7 2.5 2.2 1.7 - Polysun
Discussion
Performance factors: The performance factors that were reached on the 12-day tests range from 2.7 to 4.8 (compare Figure 17). But it is difficult to interpret or compare these numbers because the determining factors were not identical.
Two of the ground source systems (I and VII) reached a performance factor of 4.8 during the 12-day. System I had to cover the SFH100 load, system VII the SFH60 load. The analysis of the results of system VII showed two problems: On the one hand the comfort requirements for DHW were not met and on the other hand the space heating load was much higher than necessary due to a wrong parameter that lead to a continuous operation of the space heat distribution pump also in the summer period.
Electric energy consumption: The electric energy consumption during the 12-day tests can be seen in Figure 18. Of particular interest are the electric energy consumption of the systems VI, VII and VIII, especially in combination with the space heating load and the performance factors. These three systems had identical components. They differ only in hydraulics and control. One can see that system VII shows the highest el. energy consumption of the systems and at the same time the highest performance factor. The reason for this was the already mentioned space heating operation on summer days. In this case, the performance factor is not the appropriate value for system optimization.
Collector yield: Four of the tested systems were able to utilize the collector heat on the source side of the heat pump (in addition to direct charging of the combistore). The systems III and IV had to cover the load of an SFH60. System III with flat plate collectors reached more than 15 kWh/m2 in the 12 days while system IV with 20 m2 of uncovered collectors reached only 12 kWh/m2.
The systems X and XI used flat plate collectors in the southern façade of a building with a heat demand of only 15 kWh/(m2a) to charge a cold store on the source side of the heat pump or to charge a combistore directly. The resulting specific collector yield is in both cases comparably low, but one has to keep in mind that the heat demand was also very low and that the collectors in this case have the additional benefit of avoiding other air or ground heat source expenses.
Annual simulations: Subsequent to the 12-day test, the manufacturers had the choice to commission also annual simulations in order to obtain seasonal performance factors for comparable heat loads. This option was only chosen for a few of the tested systems.
DHW charging: Figure 21 shows the ratio of DHW heat delivered by the heat pump to heat supplied from the storage to the DHW distribution for six system tests where the corresponding energies have been measured. It can be seen clearly that the ratio is often close to or well above 100% on a yearly base, and much higher than 100% in winter. This is a strong indication that the DHW zone of the storage is disturbed by space heat operation, and the heat pump is charging the DHW zone more than would be necessary. A higher amount of heat delivered by the heat pump in DHW mode compared to the low temperature space hating mode reduces the annual performance facture of the heat pump significantly.

Subtask B Report B2 – Laboratory Test Report Page 29
More details on test results and optimization potentials that were detected can be found in (Haberl et al. 2013).
Figure 17: Performance factors of the tested systems during the 12-day test period.
Figure 18: Electric energy consumption of the tested systems during the 12-day test period.
Figure 19: Collector area and the specific collector yield of the 12-day tests.
Figure 20: Heat delivered to the heat distribution system during the 12-day tests.
Figure 21: Ratio of heat delivered by the heat pump in DHW-mode and heat consumed for DHW on the 12 days of the system tests.
0
1
2
3
4
5
6
I II III IV V VI VII VIII IX X XI
pe
rfo
rman
ce f
acto
r [-
]
PFSHP+
0
50
100
150
200
I II III IV V VI VII VIII IX X XI
en
erg
y [k
Wh
]
el. energy consumption
0
5
10
15
20
25
30
35
I II III IV V VI VII VIII IX X XI
colle
cto
r ar
ea [
m2]
spec
ific
co
llect
or
yiel
d [
kWh
/m2]
collector area specific collector yield
0
100
200
300
400
500
600
I II III IV V VI VII VIII IX X XI
ener
gy [
kWh
]
space heating
0%
100%
200%
300%
400%
500%
1 2 3 4 5 6 7 8 9 10 11 12 total
QH
P,D
HW
/QD
HW
test-day
I II V VI VIII XI

Subtask B Report B2 – Laboratory Test Report Page 30
Conclusion on the test method
The whole system test method CCT proved to be a valuable tool both for system development as well as for performance evaluation. The advantage of this kind of system test is that non-ideal component interactions and the influence of hydraulics and control under transient operating conditions can be detected and evaluated precisely. The test delivers within 12 days information about all operating conditions that may occur during a whole year and is thus much faster than field testing. Compared to field testing, the amount (number of sensors installed) and precision (high precision laboratory equipment used) of information that is obtained is much higher. Moreover, the results can be compared with other tests that were performed under the same boundary conditions. Repeatability is a major draw-back of field testing where the boundary conditions differ from case to case, which makes a direct comparison of the performance of solar and heat pump systems based on field testing extremely difficult or questionable.
A potential for improvement in the used test method lies in the fact that the space heat demand between the different tests was not identical. Instead, only the boundary for emulation of the space heat distribution and buildings were identical for QSH = 100, 60, and 15 respectively. As a consequence, the resulting electricity consumption and performance factors were highly influenced by the controller's settings for space heat distribution (i.e. settings for heating curve and heating season). Thus, a direct comparison of the system performance in terms of total electricity used and SPF required annual system simulations and thus a large effort and highly skilled experts. Further work will be done to find a method to achieve identical amounts of space heat energy supplied by different systems, while at the same time letting the system control the space heat distribution on its own as much as possible.
References
Haberl, R., Frank, E. & Vogelsanger, P., 2009. Holistic System Testing - 10 Years of Concise Cycle Testing. In: Solar World Congress 2009, Johannesburg, South Africa, 351–360.
Haberl, R., Haller, M.Y. & Frank, E., 2013. Combining heat pumps with combistores: detailed measurements reveal demand for optimization. In: SHC conference 2013 - accepted for publication, Freiburg, Germany.
Haller, M. & Vogelsanger, P., 2005. Combisystem Performance Investigation. In: J. C. Hadorn, Ed. Thermal Energy Storage for Solar and Low Energy Buildings - State of the Art by the IEA Solar Heating and Cooling Task 32. IEA-SHC, pp. 41–45.
Haller, M.Y., Haberl, R., Persson, T., Bales, C., Kovacs, P., Chèze, D. & Papillon, P., 2013. Dynamic whole system testing of combined renewable heating systems – The current state of the art. Energy and Buildings, 66, p.667–677.
Jordan, U. & Vajen, K., 2003. 3.4 Hot Water Consumption. In: W. Weiss, Ed. Solar Heating Systems for Houses - A Design Handbook for Solar Combisystems. James & James, London.
Konersmann, L., Haller, M. & Vogelsanger, P., 2007. PelletSolar - Leistungsanalyse und Optimierung eines Pellet-Solarkombinierten Systems für Heizung und Warmwasser. im Auftrag des Bundesamt für Energie BFE, Bern.
Vogelsanger, P., 2002. The Concise Cycle Test Method - A Twelve Day System Test - A Report of IEA SHC - Task 26. International Energy Agency Solar Heating and Cooling Programme.

Subtask B Report B2 – Laboratory Test Report Page 31
5 Conclusion
Test approaches like the modified bin method and the whole system test method CCT proved to be valuable tools both for system development as well as for performance evaluation.
The advantage of this kind of system test is that non-ideal component interactions and the influence of hydraulics and control under transient operating conditions can be detected and evaluated precisely.
In the case of the CCT method, the test delivers within 12 days information about all operating conditions that may occur during a whole year and is thus much faster than field testing.
Compared to field testing, the amount (number of sensors installed) and precision (high precision laboratory equipment used) of information that is obtained is much higher. Moreover, the results can be compared with other tests that were performed under the same boundary conditions.
Repeatability is a major draw-back of field testing where the boundary conditions differ from case to case, which makes a direct comparison of the performance of solar and heat pump systems based on field testing extremely difficult or questionable.