texas early childhood education needs ece needs...texas early childhood education needs assessment...
TRANSCRIPT

Texas Early Childhood Education
Needs Assessment
Gaps Between Need and Availability of Early Care and Education
Deanna Schexnayder Cynthia Juniper Daniel Schroeder October 2012
3001 Lake Austin Blvd., Suite 3.200 Austin, TX 78703 (512) 471‐7891

This report was prepared with funds provided from The University of Texas Health Science Center at Houston Grant Award Number 744‐1113 to the Ray Marshall Center for the Study of Human Resources at the University of Texas at Austin. The views expressed here are those of the authors and do not represent the positions of the funding agencies or The University.

i
TABLE OF CONTENTS
List of Figures ............................................................................................................................. ii
List of Tables .............................................................................................................................. ii
Acronyms .................................................................................................................................. iii
Introduction .............................................................................................................................. 1
Service Gaps for Early Care and Education ............................................................................... 2
Service Gaps for All Young Children .................................................................................... 2
Service Gaps for Young Children of Working Parents ........................................................ 7
Service Gaps in Programs Serving Low‐Income Children ................................................. 15
Public School Pre‐K ..................................................................................................... 15
Head Start and Early Head Start ................................................................................. 18
Child Care Development Fund .................................................................................... 20
Service Gaps for Other Care and Services ........................................................................ 23
Private School Pre‐Kindergarten ................................................................................. 23
Military Child Care ...................................................................................................... 23
Individual with Disabilities Education Act Programs .................................................. 23
School‐Age Care .......................................................................................................... 24
The Gap Between Available Programs and Those Meeting Quality Standards ................ 24
State Certification Programs ....................................................................................... 25
National Quality Accreditation Programs ................................................................... 28
Summary ........................................................................................................................... 28
Detailed Data Gaps ................................................................................................................. 30
References .............................................................................................................................. 32
Appendix A: Detailed Population Estimates and County Slots per 100 Children ................. A‐1
Appendix B: Statistical Model Comparing Actual to Predicted Demand for Formal Care in Sub‐State Areas ............................................................................................. B‐1

ii
LIST OF FIGURES
Figure 1. 2010, Percentages of 0‐12 Child Population Counts by Age .................................... 2
Figure 2. Proportion of Unduplicated Formal ECE Slots by County per 100 Children Under Age 5 in 2010 ................................................................................................. 6
Figure 3. Relative Supply of Current Unduplicated Early Care and Education Slots by Projected Child Population Growth for the 20 Largest Texas Counties for 2015 ........................................................................................................................ 14
Figure 4. Public School Pre‐K Services Gap Between Income Eligible and Served 4 Year‐Olds for 2010 and Projected Gap for 2015 and 2040 .................................... 18
Figure 5. Share of Children in Low‐Income Families Served by CCDF in 2010 ...................... 22
Figure 6. Distribution of Quality Designated Sites by County ............................................... 25
Figure 7. Distribution of TRS Certified Sites Across the State by County .............................. 26
LIST OF TABLES
Table 1. 2010, 0‐12 Child Population Counts by Age ............................................................... 2
Table 2. 2010 Total Supply of Unduplicated Formal ECE Slots for Texas Children 0‐4 ............ 3
Table 3. 2010 Total Supply of Unduplicated Formal Early Care and Education Slots Per 100 Children 0‐4 by Council of Government Regions ....................................... 4
Table 4. 2010 Total Supply of Unduplicated Formal Early Care and Education Slots Per 100 Children 0‐4 by Metropolitan Statistical Areas .......................................... 5
Table 5. Texas Children, Ages 0‐5, by Family Structure and Parent Employment in 2010 .......................................................................................................................... 8
Table 6. Predictive Variables .................................................................................................. 10
Table 7. Actual vs. Predicted Early Care and Education Slots in 2010, Children Ages 0‐4, for 20 Most Populous Texas Counties ............................................................ 11
Table 8. Actual vs. Predicted Early Care and Education Slots in 2010, Children Ages 0‐2, for 20 Most Populous Texas Counties ........................................................... 12
Table 9. Actual vs. Predicted Early Care and Education Slots in 2010, Children Ages 3‐4, for 20 Most Populous Texas Counties ............................................................ 13
Table 10. Gap of Estimated Percentage of Eligible Pre‐K Students Not Served in Texas Public School Pre‐K Using TEA Method (2010) ............................................ 16
Table 11. 2010, Head Start programs ‐ Children Served by Program and Age ...................... 19
Table 12. Head Start and Early Head Start Services Gap Between Income Eligible and Number Served by Child Age and Year .................................................................. 20
Table 13. 2010 Texas School Ready! Certification ................................................................. 27
Table 14. 2010 Estimated Gap in Texas School Ready! Certification for Head Start and Public Pre‐K Classrooms .................................................................................. 27
Table 15. Desired Units of Analysis for Each Type of Measure in Needs Assessment .......... 30
Table 16. Types of Data Barriers Encountered When Performing This Research ................. 31

iii
ACRONYMS
ACS ......................................................................................... American Community Survey ACF ...................................................................... Administration for Children and Families Boards ...................................................................... Local Workforce Development Boards CCDF ...................................................................................... Child Care Development Fund COG ................................................................................................ Council of Governments DARS ................................................... Department of Assistive Rehabilitative and Services DOD ................................................................................................. Department of Defense TDFPS ................................................ Texas Department of Family and Protective Services ECI ........................................................................................... Early Childhood Intervention EHS .............................................................................................................. Early Head Start ERC ............................................................................................. Education Research Center FPG ............................................................................................. Federal Poverty Guidelines GAO ..................................................................................... Government Accounting Office HHS ............................................................ U.S. Department of Health and Human Services HS ......................................................................................................................... Head Start IDEA ...................................................................... Individual with Disabilities Education Act LEP ................................................................................................ Limited English Proficient MSA ......................................................................................... Metropolitan Statistical Area PPCD ......................................................... Preschool Program for Children with Disabilities PIR ........................................................................................... Program Information Report Pre‐K ........................................................................................................... Pre‐Kindergarten RMC ....................................................................................................... Ray Marshall Center SAC .............................................................................................................. School Age Care SMA ..................................................................................................... State Median Income TANF .................................................................... Temporary Assistance for Needy Families TEA .................................................................................................. Texas Education Agency TWC ....................................................................................... Texas Workforce Commission UTHSCH ........................................... University of Texas Health Science Center at Houston

1
INTRODUCTION
The first two reports in the Texas Early Childhood Education Needs Assessment
measure the size and geographic distribution of the population potentially eligible for Texas
early care and education (ECE) and school‐age care (SAC) and the existing supply of
available ECE and SAC. The goals of this report are to estimate the gap between the
demand for services and the available supply in 2010, and to estimate in which areas supply
would need to expand to better meet the projected increase in the overall size and
distribution of the Texas child population in 2015 and 2040.
The overall scope of this project limits all of the projections in this report to those
that can be estimated using available population and program data. To the extent feasible
with the available data, estimates are provided for selected sub‐state areas within Texas.
However, many gaps in available data have limited the ability of the project to fully estimate
service gaps for many of the desired sub‐state geographic regions.
The main chapter of this report presents multiple estimations of service gaps for
children under 5 years of age. The first is an ECE service gap estimate based on the total
2010 young child population. Then, more targeted gap estimates comparing the 2010 ECE
supply to the children of working parents (demand) as well as the predicted young child
population are presented.
Next, gap estimations for Pre‐ Kindergarten (Pre‐K), Head Start/Early Head Start
(HS/EHS), and the Child Care Development Fund (CCDF) are presented. Throughout each
section, service gaps are first estimated for the entire state of Texas in 2010, then expanded
to include sub‐state estimates when available data are sufficient for that purpose and to
estimate the extent to which the current service level would need to be expanded to meet
population growth. Due to limited data, it was not possible to calculate a detailed gap
analysis for school‐age children or programs with eligibility criteria based on anything
except family income. Therefore, the remaining programs and services, private school Pre‐
K, military child care, Early Childhood Intervention (ECI), Public Pre‐K for Children with
Disabilities (PPCD), and school‐age care receive a limited discussion regarding services
provided in 2010.
Finally, the quality gap among quality accredited and certified providers is discussed.
Accompanying this section is a discussion of the challenges facing programs striving to meet
quality standards.

2
SERVICE GAPS FOR EARLY CARE AND EDUCATION
SERVICE GAPS FOR ALL YOUNG CHILDREN
According to the U.S. Census, nearly 5 million children ages 0‐12 resided in the State
of Texas in 2010. (Murdock et al., 2012). Further analysis of the 2010 Census data shows
that 23 percent of these children were 2‐years‐old or younger in 2010 and 16 percent were
either 3‐ or 4‐years old. Thus, over 1.9 million children were potentially eligible for ECE in
2010, while an additional 3 million children ages 5‐12 were potentially eligible for SAC
(Table 1 and Figure 1). Appendix A presents age distributions for all Texas children sub‐
divided by age group for Council of Government regions (COGs) and Metropolitan Statistical
Areas (MSAs) in 2010, as well as projections for 2015 and 2040.
Table 1. 2010, 0‐12 Child Population Counts by Age
0‐2 3‐4 5‐12 Total
1,151,310 777,163 3,066,796 4,995,269
Source: U.S. Census Bureau, 2010 Census, Summary File
Figure 1. 2010, Percentages of 0‐12 Child Population Counts by Age N = 4,995,269
Source: U.S. Census Bureau, 2010 Census, Summary File
0‐2 years old23%
3‐4 years old16%
5‐12 years old61%
0‐2 years old 3‐4 years old 5‐12 years old

3
As discussed in the report describing the supply of ECE and SAC, the supply data
structure for the many types of ECE programs in Texas makes it difficult to estimate the
total number of unduplicated slots available for ECE in Texas (Schexnayder et al., 2012).
However, Ray Marshall Center researchers conservatively estimate that 867,628 formal ECE
slots were available to serve young Texas children in 2010. These slots include licensed
child care centers, family homes with various levels of governance, public pre‐kindergarten
and military installations. All other types of ECE are either sub‐sets of these types of care or
could not be measured at the desired geographical levels due to limitations of the available
data. Table 2 presents the unduplicated formal child care and education slots throughout
the state in 2010.
Table 2. 2010 Total Supply of Unduplicated Formal ECE Slots for Texas Children 0‐4
TDFPS Registry Slot Data Other Slots
Total Slots
Licensed Centers
Licensed Homes
Registered Homes
Listed Homes Total
Public Pre‐K
Military Installation
CDCs
State of Texas 586,923 12,600 30,557 10,155 640,235 224,287 3,106 867,628
Source: Supply and Quality of Early Care and Education and School‐Age Care, 2012
The demand for early childhood education and after‐school services is influenced by
factors related to supply of the services available and variation in socioeconomic and other
characteristics of the families located within a specific geographic area. There were an
estimated 867,628 early child education slots available in 2010. These slots could serve 45
percent of all children less than age five.
Table 3 and Table 4 present the variation in slot ratios by COGs and MSAs. The share
of formal ECE slots per 100 children range from a low of 36.6 in the Rio Grande COG to a
high of 58.5 in the Ark‐Tex COG. The lowest shares of slots per 100 children within the
state’s MSAs are in the Brownsville‐Harlingen and the Sherman‐Denison MSAs (36.7 slots
per 100) to a high of 78 slots per 100 children in Texarkana. Figure 2 shows the distribution
of the 2010 ECE slots per 100 children across all counties.1
1 The numerical values of total formal slots per 100 children for each county are included in Appendix Table A‐4.

4
In order to maintain the 2010 ratio (45 slots per 100 children) as Texas’ population
increases, an additional 51,752 ECE slots would be needed by 2015 and an additional
542,237 slots by 20402.
Table 3. 2010 Total Supply of Unduplicated Formal Early Care and Education Slots Per 100 Children 0‐4 by Council of Government Regions
Children ages 0‐4 Slots
Slots per 100 Children
Council of Government (COG) Region
Alamo Area 162,990 67,428 41.4
Ark‐Tex 18,832 11,021 58.5
Brazos Valley 20,184 10,052 49.8
Capital Area 133,835 68,196 51.0
Central Texas 39,100 19,801 50.6
Coastal Bend 40,324 19,643 48.7
Concho Valley 10,535 4,979 47.3
Deep East Texas 24,689 11,233 45.5
East Texas 55,011 24,461 44.5
Golden Crescent 13,468 6,667 49.5
Heart of Texas 23,777 10,999 46.3
Houston‐Galveston 480,760 222,795 46.3
Lower Rio Grande Valley 111,961 43,686 39.0
Middle Rio Grande 13,622 6,164 45.2
Nortex 14,549 7,069 48.6
North Central Texas 507,849 221,308 43.6
Panhandle 33,304 14,970 44.9
Permian Basin 34,131 13,566 39.7
Rio Grande 66,243 24,239 36.6
South East Texas 26,215 12,170 46.4
South Plains 30,765 14,453 47.0
South Texas 31,860 13,103 41.1
Texoma 12,501 4,765 38.1
West Central Texas 21,968 10,416 47.4
2 To compute this, determine 45 percent of the projected population for each year and subtract the slots available in 2010.

5
Table 4. 2010 Total Supply of Unduplicated Formal Early Care and Education Slots Per 100 Children 0‐4 by Metropolitan Statistical Areas
Children ages 0‐4 Slots
Slots per 100 Children
Metropolitan Statistical Area
State of Texas 1,928,473 858,513 44.5
Non‐Metropolitan 206,974 87,078 42.1
Metropolitan 1,721,499 771,435 44.8
Abilene 11,582 6,624 57.2
Amarillo 19,015
9586
50.4
Austin‐Round Rock 127,504 66,317 52.0
Beaumont‐Port Arthur 26,215 12,170 46.4
Brownsville‐Harlingen 35,854 13,172 36.7
College Station‐Bryan 14,742 7,508 50.9
Corpus Christi 30,025 15,810 52.7
Dallas‐Fort Worth‐Arlington 496,946 217,925 43.9
El Paso 64,621 24,169 37.4
Houston‐Sugar Land‐Baytown 472,212 216,355 45.8
Killeen‐Temple‐Fort Hood 36,281 19,011 52.4
Laredo 24,424 9,827 40.2
Longview 15,048 7,046 46.8
Lubbock 20,673 10,713 51.8
McAllen‐Edinburg‐Mission 74,538 29,954 40.2
Midland 11,001 5,539 50.4
Odessa 12,075 4,483 37.1
San Angelo 7,794 4,136 53.1
San Antonio 157,131 65,526 41.7
Sherman‐Denison 7,833 2,877 36.7
Texarkana 5,921 4,620 78.0
Tyler 14,954 7,275 48.7
Victoria 8,439 4,475 53.0
Waco 16,642 7,726 46.4
Wichita Falls 10,029 5,075 50.6
Note: Because of area specific estimation, the numbers of slots estimated at the county level, when summed to get a statewide figure, is not expected to equal the total number estimated at the MSA level.

6
Figure 2. Proportion of Unduplicated Formal ECE Slots by County per 100 Children Under Age 5 in 2010
Source: Supply and Quality of Early Care and Education and School‐Age Care, 2012
However, not all children need ECE services nor can one assume either a perfect
relationship between one child and one slot or perfect geographic distribution of available
slots throughout the state. Given the complex nature of services, eligibility requirements
for some of the ECE programs, and the data limitations, this number should only be
interpreted as a very rough indicator of the difference between the available supply of ECE
and the demand for that care.

7
SERVICE GAPS FOR YOUNG CHILDREN OF WORKING PARENTS
Typically, families seek ECE for two different reasons: because either parents are
working or in school and/or parents want a socialization or educational experience for their
children before the children enter kindergarten.3 However, it is not possible to easily divide
these into separate categories because parents often use early education services as part of
their child care arrangements so that they can work or attend school themselves. Prior
research has shown that a number of factors affect the type of care that families choose,
with the primary factors being family structure, parent employment status and family
income (Lippman et al, 2008; Overturf & Johnson, 2005).
This section will first estimate the gap between the available supply of care and the
demand from working parents of young children. Then, a statistical model incorporating
additional variables estimates the sub‐state variation for the 20 most populous counties in
2010 as well as how the 2010 ECE supply would need to expand or contract for those
counties based on the projected child population in 2015. Family characteristics, family
structure and family work status have changed rapidly over the past decade and are quite
susceptible to societal and economic influences that cannot be accurately projected into
future years. Therefore, future projections are solely based on changes in the size of
population of young children.
Statewide estimates. From American Community Survey data, it is possible to
estimate the employment status and family structure for Texas children, ages 0‐5. As
shown in Table 5, nearly six out of ten young Texas children reside in households in which
either both parents are employed (32%) or a single parent is employed (27%); these families
clearly need someone to care for their children while they are working.
3 School age care (SAC), which is typically sought for children of working parents, will be discussed in a different section of this report.

8
Table 5. Texas Children, Ages 0‐5, by Family Structure and Parent Employment in 2010
Total Children ages 0‐5 2,315,927
Children ages 0‐5 residing with one or both parents
2,230,481 100%
Married couples
Both parents employed 713,027 32%
One parent employed 663,852 30%
Neither parent employed 22,340 1%
Single parents
Employed 612,963 27%
Not employed 218,299 10%
Source: U.S Census Bureau, 2010 American Community Survey
Note: The total children include children residing in foster care, residential facilities, or with grandparents or other relatives.
Applying the percentage of working parents to the 2010 population of Texas
children ages 0‐4 (Table 1) indicates that nearly 1.1 million young children needed child care
or early education because all resident parents worked. Applying this estimated demand to
the supply of formal ECE slots (see Table 2), the existing supply could have potentially
served 78 percent of the estimated need for child care demand among working families in
2010 if those slots had been evenly distributed by geographic location and age of young
children. In order to maintain the 2010 ECE coverage (78 percent) for children of working
parents, an additional 260,000 ECE slots would be needed by 2015 and an additional
399,214 slots by 2040. These projections assume that the share of children of working
parents would not change and that the same share of working parents would use formal
ECE in lieu of informal arrangements.
The nature of market‐based child care services means that centers and family homes
regularly enter and leave the formal child care market in response to the local demand for
care. An analysis of these businesses’ duration has shown that over the course of a five
year study, 65 percent of the child care centers remained in business and only one‐third of
the registered family homes remained in operation (Schexnayder and Schroeder, 2008). To
estimate the future statewide demand for care, it is reasonable to expect that these types
of facilities will continue to adapt to meet future demand for care.
Sub‐state gap estimates. To get a better estimate of how the 2010 formal ECE
demand among working families varies across the state, the Ray Marshall Center
constructed an estimation model that includes a set of predictor variables that reflect
families’ child care needs due to employment or higher education. The detailed

9
information needed to construct this model was only available for 179 Texas counties.
Thus, its results can only be interpreted for the most populous counties in the state.
Together, these predictors explain 64 percent of the variation in child care demand across
the state. Table 6 lists the predictor variables. These are discussed briefly below, with
more complete model details included in Appendix B.
The first predictor measures the percent of two‐parent households with children
under six with both parents working, and the second measures the percent of single‐parent
working households. Data from the U.S. Census Survey of Income and Program
Participation (SIPP) in 2010 indicate that single‐parent households are more likely to rely on
non‐parental care than two‐parent households. Furthermore, children living in single‐
parent families enter into care earlier, spend more time in care arrangements, and are more
likely to be cared for in informal arrangements, such as home‐based child care, than
children from two‐parent families. As would be expected, counties with high percentages
of two‐parent families in which both are working and working single parents have more
slots per child.
The next set of predictors is intended to capture local variation in income and
earning levels. Within the literature, a family’s income level is one of the most consistent
determinants in child care selection. In general, higher family income is associated with
increased enrollment in center‐based care, while lower‐income families are more likely to
use less‐expensive arrangements, such as family home care or kin‐care (Fuller et al., 2002).
Data from the 2010 SIPP indicates that only 18 percent of low‐income children under the
age of five with employed mothers are enrolled in center‐based care versus 31 percent of
children with household incomes at least twice the federal poverty level.

10
Table 6. Predictive Variables
Variable Description
Both parents working, 2 parent families with children under 6
Parent is working, 1 parent families with children under 6
Median annual income, families with own children under 18
Earnings of those with less than HS education (1000s)
Earnings of HS graduates (1000s)
Earnings of those with some college or more education (1000s)
Grandparents living with and responsible for own grandchildren
Percent of males 18‐34 enrolled in college or grad school
Percent of females 18‐34 enrolled in college or grad school
Percent who leave home early for work (before 6:30am)
Percent who leave home late for work (after 9am)
Percent of low‐income (<150% FPL) workers who commute to work by driving alone
Percent of low‐income (<150% FPL) workers who commute to work by public transportation
Average time commuting to work, hours
Unemployment rate
Employment growth rate
Labor force growth rate
Mobility from outside county, children 1‐4
Percent of children 0‐12 who are very young (0‐4)
Percent of children 0‐4 who are Black
Percent of children 0‐4 who are Hispanic
Table 7 presents the difference in predicted ECE slots versus actual ECE slots for the
20 most populated counties in Texas. These counties accounted for 76 percent of the 2010 Texas child population. There is considerable variation in the range of predicted to actual
ECE slots among the 20 largest counties. According to this model, Nueces County would
have 14 percent more slots than expected while Fort Bend County would have 9 percent
fewer slots than expected. While these results may indicate an over‐ or under‐supply of
formal care in those counties, they also may reflect differences in community preferences
for certain types of care or variation in the employment patterns of parents not captured by
the Census data that may necessitate a higher or lower use of informal care. Analyzing the
reasons that certain communities may have different levels of formal care than other Texas
counties is beyond the scope of this study.

11
Table 7. Actual vs. Predicted Early Care and Education Slots in 2010, Children Ages 0‐4, for 20 Most Populous Texas Counties
Slot Gaps: Children 0 to 4
County Actual Slots Predicted Slots Gap
Harris 150,525 143,139 5.2%
Dallas 70,776 75,751 ‐6.6%
Tarrant 62,664 64,962 ‐3.5%
Bexar 55,561 57,472 ‐3.3%
Travis 39,377 41,069 ‐4.1%
Hidalgo 29,954 29,626 1.1%
El Paso 24,169 24,270 ‐0.4%
Collin 35,059 34,427 1.8%
Denton 29,072 27,311 6.4%
Fort Bend 19,803 21,827 ‐9.3%
Cameron 13,172 13,932 ‐5.5%
Williamson 19,009 17,221 10.4%
Montgomery 14,553 14,875 ‐2.2%
Bell 15,416 14,713 4.8%
Brazoria 12,307 12,053 2.1%
Webb 9,827 8,850 11.0%
Nueces 13,140 11,530 14.0%
Lubbock 10,621 10,566 0.5%
Galveston 12,575 11,068 13.6%
Jefferson 8,481 9,053 ‐6.3%
From the predictive model, it is also possible to refine the estimates of the relative
supply and demand for formal care for the 0‐2 and 3‐4 age groups. The formal supply of
early care and education varies considerably between very young children, ages 0‐2, and
pre‐school children, ages 3‐4. These are presented in Table 8 and Table 9. Almost all of the
demand for very young children stems from parents needing child care while they are
working or in school. However, for 3‐ and 4‐year‐olds, the demand for ECE includes both
child care needs for working parents and early education for children participating in Pre‐K
or some other school‐based program.

12
Table 8. Actual vs. Predicted Early Care and Education Slots in 2010, Children Ages 0‐2, for 20 Most Populous Texas Counties
Slot Gaps: Children 0 to 2
County Actual Slots
Predicted Slots Gap
Harris 65,333 66,350 ‐1.5%
Dallas 36,897 35,789 3.1%
Tarrant 31,225 33,607 ‐7.1%
Bexar 26,580 26,708 ‐0.5%
Travis 21,403 21,621 ‐1.0%
Hidalgo 12,062 11,153 8.1%
El Paso 10,699 10,539 1.5%
Collin 25,555 23,938 6.8%
Denton 18,510 16,364 13.1%
Fort Bend 12,482 13,859 ‐9.9%
Cameron 4,764 4,951 ‐3.8%
Williamson 9,067 9,825 ‐7.7%
Montgomery 8,035 8,216 ‐2.2%
Bell 6,545 5,578 17.3%
Brazoria 7,808 6,442 21.2%
Webb 4,402 4,045 8.8%
Nueces 6,002 5,424 10.7%
Lubbock 5,495 5,394 1.9%
Galveston 6,626 6,122 8.2%
Jefferson 4,108 4,426 ‐7.2%
As shown in Table 8, as controlling for the model variables, in 2010, Brazoria, Bell
and Denton counties had the largest supply of formal slots for children ages 0 to 2 relative
to the predicted need. Fort Bend and Williamson counties had the smallest supply of slots
for this age group relative to predicted need. A different pattern emerges when looking at
the relative distribution of slots for 3‐ and 4‐year‐olds, as shown in Table 9. Relative to
predicted need, Galveston, Webb and Bell counties had the largest supply of formal slots,
while Brazoria and Dallas counties had the smallest relative supply of slots for that age
group.

13
Table 9. Actual vs. Predicted Early Care and Education Slots in 2010, Children Ages 3‐4, for 20 Most Populous Texas Counties
Slot Gaps: Children 3 to 4
County Actual Slots
Predicted Slots Gap
Harris 68,850 63,304 8.8%
Dallas 27,935 33,562 ‐16.8%
Tarrant 24,825 24,175 2.7%
Bexar 23,525 24,394 ‐3.6%
Travis 11,958 12,076 ‐1.0%
Hidalgo 17,213 16,835 2.2%
El Paso 11,450 12,366 ‐7.4%
Collin 6,324 6,448 ‐1.9%
Denton 7,853 6,839 14.8%
Fort Bend 5,555 6,402 ‐13.2%
Cameron 8,231 8,239 ‐0.1%
Williamson 4,679 4,866 ‐3.8%
Montgomery 4,860 4,914 ‐1.1%
Bell 7,151 6,013 18.9%
Brazoria 3,263 4,125 ‐20.9%
Webb 5,361 4,488 19.5%
Nueces 4,284 4,625 ‐7.4%
Lubbock 3,651 3,753 ‐2.7%
Galveston 5,059 4,048 25.0%
Jefferson 3,592 4,111 ‐12.6%
Relative gaps based on future population growth. Figure 3 illustrates, for the 20
largest counties in the state, the relationship between the relative supply of unduplicated
ECE slots in 2010 and the projected population growth among 0‐4 year olds as of 2015.

14
Figure 3. Relative Supply of Current Unduplicated Early Care and Education Slots by Projected Child Population Growth for the 20 Largest Texas Counties for 2015
The counties in the lower‐right section of the graph represent counties with the
most projected need to create ECE capacity by 2015 based upon the projected population
growth among 0‐4 year‐olds.4 For example, in Travis County, the number of young children
who will need care is expected to increase by approximately 20 percent; however, the
capacity of the county to meet that need falls short by approximately 2.5 percent.
Conversely, Galveston County appears to have more formal ECE slots than expected based
upon the combination of variables controlled for in the RMC model. While these
estimations shed light on formal child care needs for 2015 in those counties, they also raise
questions for future analysis such as: which factors in different counties influence the size
of the formal child care market; how do parent choice and preferences influence the formal
4 Given the many assumptions and predictions underlying the future demand for ECE, conducting an analysis such as this one for 2040 would not produce reliable estimates.
Bell
Bexar
Brazoria
Cameron
Collin
Dallas
Denton
El Paso
Fort Bend
Galveston
Harris
Hidalgo
Jefferson
Lubbock
Montgomery
Nueces
Tarrant
Travis
Webb
Williamson
‐5.0%
‐2.5%
0.0%
2.5%
5.0%
7.5%
‐10% ‐5% 0% 5% 10% 15% 20% 25%
Relative Supply of Form
al Care and Education
Projected County population growth, 2010‐2015, children 0‐4
Less ECE supply .
More ECE supply

15
care market; and to what degree can normal market forces be expected to handle future
increases or decreases in the demand for ECE.
SERVICE GAPS IN PROGRAMS SERVING LOW‐INCOME CHILDREN
In addition to families’ general demand for ECE, various government programs
provide early education services for low‐income children considered at‐risk of not being
academically ready for kindergarten (e.g., public Pre‐K and Head Start). In addition, the
Child Care Development Fund (CCDF) subsidizes the cost of child care for parents receiving
or transitioning off public assistance and for low‐income parents who work, attend school
or participate in job training. The following sections estimate the gaps between available
services and estimated need for each of these types of services. To the extent feasible from
the available data, the service gaps between the 2010 supply and the number of children
eligible for these services are estimated for sub‐state areas and projected for future years
based on the anticipated growth in the child population.
Public School Pre‐K
TEA method. The Texas Education Agency (TEA) estimates that, in 2010‐2011, public
Pre‐K classrooms served approximately 28 percent of the total population of 3‐ and 4‐year‐
olds and 90 percent of eligible 4‐year‐olds, based on the number of kindergarten students
either classified as limited‐English proficient or economically disadvantaged in the following
year.5 This estimate was derived from 2009 population estimates based on 2000 U.S.
Census data.
In this needs assessment, a similar method was used to identify the number of 4‐
year‐old students eligible for, but not served, by Texas public school Pre‐K programs using
2010 U.S. Census information. This analysis was conducted both for the entire state and the
20 most child populous counties. Using this approach, 85 percent of the children eligible for
public Pre‐K due to either limited English proficiency or family income less than 185 percent
of poverty were served in public Pre‐K programs throughout the entire state, resulting in a
service gap of 15 percent of Pre‐K‐eligible children.
Table 10 presents an analysis of the demand and supply of Pre‐K service using TEA’s
method for the 20 most child populous counties. The analysis indicates wide variation in
the degree to which slots are available to serve the eligible Pre‐K population in these
counties. For example, Fort Bend County only appears to have enough slots to serve 60
5Source: Texas Pre‐Kindergarten Data

16
percent of the eligible children while the number of Bell County slots appears to equal 119
percent of the total children eligible for those slots.
Table 10. Gap of Estimated Percentage of Eligible Pre‐K Students Not Served in Texas Public School Pre‐K Using TEA Method (2010)
Fall 2010 Pre‐K Slots
‐ Any Eligibility
Fall 2011 Kindergarten Slots ‐
Economic Disadvantage or LEP
Percent of Kindergarten Slots Accounted for by
Pre‐K Slots = Pre‐K/K
Gap (Unaccounted)= 1‐(Pre‐K/K)
State of Texas 216,664 255,914 85% 15%
20 Most Child Populous Counties
Harris 45,653 46,974 97% 3%
Dallas 20,183 29,363 69% 31%
Tarrant 13,613 16,719 81% 19%
Bexar 15,910 17,478 91% 9%
Travis 7,385 8,450 87% 13%
Hidalgo 12,207 14,608 84% 16%
El Paso 7,420 10,513 71% 29%
Collin 2,668 4,109 65% 35%
Denton 2,715 3,398 80% 20%
Fort Bend 2,137 3,560 60% 40%
Cameron 5,728 6,548 87% 13%
Williamson 2,225 2,773 80% 20%
Montgomery 2,569 3,388 76% 24%
Bell 4,225 3,557 119% ‐19%
Brazoria 1,962 2,470 79% 21%
Webb 4,268 4,522 94% 6%
Nueces 2,213 3,392 65% 35%
Lubbock 1,667 2,475 67% 33%
Galveston 2,624 2,867 92% 8%
Jefferson 2,410 2,173 111% ‐11%
Source: RMC analysis of Texas Education Research Center (ERC) data
While this method can provide an estimate of the Pre‐K service gap for sub‐state
areas, several factors could affect the estimates’ accuracy. First, the eligibility definitions
vary from Pre‐K to kindergarten. Secondly, high rates of student mobility may cause the
number of Pre‐K eligible children to move before entering kindergarten. Children from low‐

17
income families are more likely than others to change schools frequently (GAO 2011).
Family mobility is also high among military families: Bexar, Bell and El Paso counties host
large populations of military families that typically move every two to three years
(Rumberger & Larson, 1998). Finally, even though Texas school districts are required to
provide Pre‐K services if the district has a minimum of 15 eligible four‐year‐old children,
districts can request waivers from this requirement. For example, Duncanville ISD, in Dallas
County, has received a TEA waiver granting an exemption from offering a Pre‐K program on
those campuses where the district would be required to construct classroom space to serve
the Pre‐K students. This may partially account for the large service gap (31 percent) in
Dallas County.
ACS method. An alternate method for estimating the children eligible for Texas
public Pre‐K is to use American Community Survey estimates of the number of children
younger than five living in families with income less than 185 percent of poverty. Children
in low‐income families make up 91 percent of eligible children participating in Texas Pre‐K
programs.6 Assuming that the same ratio of the children live in low‐income families over
time, it is possible to use this approach to estimate the additional Pre‐K slots that would be
needed in 2015 and 2040 based on future child population projections.7 Due to data
limitations, it is not possible to compute sub‐state estimates using this approach.
Based on these ACS estimates, Texas public Pre‐K programs served 92 percent of
income‐eligible children in 2010. An additional 15,000 slots would have been needed to
serve all income‐eligible children in 2010. Assuming static poverty and enrollment rates, by
2015 an additional 7,600 Pre‐K slots would be needed and an additional 98,000 slots by
2040 to meet the growth in Pre‐K income‐eligible children. Figure 4 compares the total
number of children who would need to be served, against total eligible children in 2010,
2015 and 2040.
6Ray Marshall Center analysis of Texas Education Research Center data 7 The limited size of the ACS sample makes it difficult to project future poverty rates for 4‐year‐olds. Thus, this projection assumes no change in the future poverty rate rather than using the projected two percent increase in the poverty rate for the entire group of 0‐12 year olds.

18
Figure 4. Public School Pre‐K Services Gap Between Income Eligible and Served 4 Year‐Olds for 2010 and Projected Gap for 2015 and 2040
Note: This graph assumes that 92 percent of income‐eligible children would be served in each year.
Head Start and Early Head Start
Of the children served by Early Head Start, Head Start and Migrant/Seasonal Head
Start, on average, 95 percent reside in households with incomes lower than 100 percent of
poverty. Table 11 illustrates the Texas children served by age for each program: EHS, HS
and the Migrant/Seasonal program for 2010.
307,815
199,684
191,380
283,190
183,709
176,078
24,625
15,975
15,302
0 100,000 200,000 300,000 400,000
2040
2015
2010
Number of 4 year olds
Year
Children eligible but notserved
Children enrolled in Pre‐K (income eligible only)
Children living inhouseholds below 185%FPG

19
Table 11. 2010, Head Start programs ‐ Children Served by Program and Age
0‐2 years old 3 years old 4 years old
Total Served 15,092 34,354 42,017
EHS 9,890 278 0
HS 700 31,858 40,876
Migrant/Seasonal 4,502 2,218 1,141
Income‐eligible served 14,337 32,637 39,917
Non‐income‐eligible served
755 1717 2,100
Source: 2010‐2011 Head Start Program Information Report
As shown in Table 12, Texas EHS and HS served only 5 percent of eligible 0‐2‐year‐
olds, 31 percent of eligible 3‐year‐olds and 39 percent of eligible 4‐year‐olds in 2010.8 As
the Texas child population ages 0‐4 grows, the need for EHS/HS services also will grow,
assuming that the share of income‐eligible children within each age group remains
constant. Table 12 also projects the number of income‐eligible children for HS or EHS in
2015 and 2040, and the number of additional children who would need to be served
assuming that HS/EHS funding is only adjusted for inflation and that current enrollment
rates remain the same. Because the HS/EHS data available for this analysis were
aggregated at the state‐level, it was not possible to conduct sub‐state analyses.
8 The numbers of 2010 enrolled, income‐eligible children are counts from the HS Program Information Report (PIR) that were adjusted to account for non‐eligible enrollment.

20
Table 12. Head Start and Early Head Start Services Gap Between Income Eligible and Number Served by Child Age and Year
Year of Service 2010
2015 2040
projected estimates
Total children 0‐2 years‐old 1,151,310 1,257,156 1,932,229
Income‐eligible children 307,745 335,661 515,905
Children enrolled in EHS 14,337 15,608 23,990
Children eligible but not served 293,408 320,053 491,195
Percentage of children eligible but not served 95.3% 95.3% 95.3%
Total children 3‐years‐old 390,262 407,903 628,946
Income‐eligible children 104,309 108,910 167,929
Children enrolled in HS 32,637 33,762 52,058
Children eligible but not served 71,672 75,148 115,871
Percentage of children eligible but not served 69% 69% 69%
Total children 4‐years‐old 386,901 403,728 622,352
Income‐eligible children 103,418 107,795 166,168
Children enrolled in HS 39,917 41,501 63,975
Children eligible but not served 63,501 66,294 102,193
Percentage of children eligible but not served 61.5% 61.5% 61.5%
Child Care Development Fund
CCDF, which is administered in Texas by 28 local Workforce Development Boards
(Boards), provides child care subsidies for low‐income TANF families to aid their transition
to employment and also provides child care subsidies for low‐income working families. Due
to the flexible nature of this program, these subsidies can be used for both formal and
informal care for children, ages 0‐12. In Texas, TANF families receive priority for service
under CCDF. Other income‐eligible families with child care needs can receive subsidies if
their income is less than the maximum income limits set by each local Board. CCDF income
limits vary across the state but 19 of the 28 Boards maintain an income limit of 85 percent
of State Medium Income (SMI), which roughly equals 240 percent of the federal poverty
level.
The flexible nature of the services that can be offered through CCDF, the family‐
based eligibility system (instead of a system restricted to specific services for children of a
certain age), and the ability of different workforce boards to set specific income‐eligibility
ceilings all make it difficult to precisely estimate service gaps for CCDF services using the

21
data available in this needs assessment. Because TANF families receive priority for CCDF
services, there should be no service gap for that portion of the eligible CCDF population.
But prior research has found that only a small fraction of children in working families who
are eligible for CCDF based on income actually receive services.
This program is highly sensitive to the amount of allocated funding, and the number
of CCDF‐eligible families far exceeds the available funds. Because families often know when
enrollment is closed, many do not apply for funds even though they are eligible. (Lein et al,
2007) It is typical for program waiting lists to briefly disappear whenever additional funding
is allocated — as occurred recently through the infusion of ARRA funds — only to re‐appear
as soon as families realize that funding is available and begin applying for child care
subsidies again.
Several different approaches have been used to estimate the share of eligible
families who actually receive CCDF subsidies. The simplest approach compares the number
of children receiving subsidies to the number of children, ages 0‐12, living in families whose
income is less than 185 percent of poverty (the same income eligibility threshold used to
allocate CCDF discretionary funding). In the state of Texas, 2,372,133 children ages 0‐12
met these income criteria in 2010. The average number of children served monthly by
CCDF in 2010 was 139,537, or less than 6 percent of children living in families below this
income level. (It is not possible to limit CCDF participation estimates to only working
families using such an approach.) Figure 5 displays the share of children, ages 0‐12, in
families with incomes less than 185 percent of poverty who actually received CCDF
subsidies in all Texas counties during an average month in 2010.

22
Figure 5. Share of Children in Low‐Income Families Served by CCDF in 2010
Using a more sophisticated approach, a team of multi‐state researchers used linked
individual‐level subsidy data, identifiable Census records and CCDF eligibility criteria to
develop a statistical model to determine the share of CCDF‐eligible families who actually
received subsidies in three states. These researchers found that less than ten percent of
income‐eligible Texas families actually received CCDF subsidies. (Goerge et al, 2009).9
Collection of the detailed information of each Board’s local eligibility requirements,
waiting lists and local family income and employment information needed to identify the
local gap in services for each Board region is beyond the scope of this study.
9 Two of the needs assessment’s co‐authors (Schexnayder and Schroeder) conducted the Texas portion of that study.

23
SERVICE GAPS FOR OTHER CARE AND SERVICES
Private School Pre‐Kindergarten
In 2009, 1,064 private school Pre‐K programs provided Pre‐K for 54,644 Texas
children. Assuming that the same number of students participated in Pre‐K at private
schools in 2010, combining the private and public Pre‐K enrollment indicates that Texas had
4,218 providers offering Pre‐K to 278,931 students. Of the 386,901 4‐year‐old children in
Texas in 2010, approximately 72 percent participated in some sort of school‐based Pre‐K
program in 2010.
Military Child Care
The Department of Defense (DOD) strives to ensure that DOD ECE funding provides
quality care. To reach this goal, the DOD is increasing on‐installation child care capacity by
constructing new CDCs across the country. The DOD estimates that adding over 21,000
additional child care slots to the current capacity would enable them to meet 80 percent of
the demand for military child care. In Texas, two new facilities at Ft. Hood and three at Ft.
Bliss will begin offering services in 2012. The Texas‐based Military Child Education Coalition
estimates that there were 100,000 children in Texas military families in 2010 but could not
provide estimates of the share of children eligible for care on military instillations.
Individual with Disabilities Education Act Programs
The Early Childhood Intervention (ECI) program and the Preschool Programs for
Children with Disabilities (PPCD) are both required to serve all eligible children and families.
Neither program maintains waiting lists of eligible children who are not receiving services.
Precise service gaps could not be computed for either of these programs due to the lack of
a suitable variable measuring developmental delay or disability in the Census data.
ECI: The Department of Assistive and Rehabilitative Services (DARS) estimates that
approximately three or four percent of children statewide have a medically diagnosed
condition or developmental delay that would make them eligible for comprehensive early
intervention services. In 2010, ECI provided comprehensive services and follow‐along
services to 66,648 children, or 5.8 percent of children, ages 0‐2. This figure exceeds the 4
percent estimate of statewide need yet is less than half the eligible children estimated by
other sources (Rosenberg et. al. 2008).
PPCD. PPCD refers to the services provided by the school district, not to the place
where they are provided. Eligible children receive PPCD services in various settings such as
Pre‐K, resource rooms, self‐contained classrooms, or in community settings including Head
Start and private pre‐school. In 2010, 41,494 children ages 3‐5, or 3.6 percent of all Texas

24
children in that age range, received PPCD services. The national average of children ages 3‐
5 served in this program is 5.9 percent.
School‐Age Care
In 2010, Texas was home to 3,066,796 children ages 5‐12 but a complete list of
Texas school‐age care providers was not available. Partial information for TDFPS‐listed
providers and CCDF‐subsidized school‐age care is discussed below.
TDFPS identifies 18,243 sites that provide school‐age care (SAC) in licensed centers,
licensed, registered, and listed homes; however, identifying the number of school‐age slots
is not currently possible within the registry system. The TDFPS list of SAC providers also
includes YMCA programs and private agencies that provide care on public school campuses.
Non‐state‐regulated SAC includes programs on military bases and public and private school
campuses, including programs that operate for educational purposes. There is no data
source identifying all programs providing SAC. In 2010, the CCDF provided services for
approximately 3 percent of the children ages 5‐12 living in households with incomes 185
percent of federal poverty guidelines.
Afterschool Alliance reported a 2009 survey of 1,129 Texas households regarding
afterschool care, in which parents and guardians were asked about the afterschool care
arrangements of students in grades K‐12 (America After 3 p.m. Survey). Survey respondents
reported that only 15 percent of K‐12 children participated in afterschool programs and that
26 percent of children in grades K‐12 were responsible for taking care of themselves after
school.
THE GAP BETWEEN AVAILABLE PROGRAMS AND THOSE MEETING QUALITY STANDARDS
There is no consistent approach to assigning quality to Texas ECE and SAC programs.
For the purpose of this study, the definition of quality was limited to a formal designation of
quality of existing programs by one of eight selected formal quality accreditation or
certification programs. Even with eight different organizations providing some sort of
quality designation, only 160 of Texas’s 254 counties had even one provider meeting any
quality seal of approval in 2010. Figure 6 shows those counties with any program meeting
an external quality designation in 2010. Assuming that no provider received more than one
type of quality designation, a maximum of 16 percent of child care centers and 12 percent
of public Pre‐K programs received a quality designation. Improvement in this area clearly
needs to occur to aid parents and case managers in selecting better care.

25
Figure 6. Distribution of Quality Designated Sites by County
Source: Supply and Quality of Early Care and Education and School‐Age Care, 2012
State Certification Programs
Texas Rising Star (TRS). Texas Rising Star (TRS) is a quality rating system that the
state originally developed for CCDF‐subsidized providers. TRS gives child care centers and
family homes ratings ranging from two to four stars that signal various levels of quality
improvements as providers go beyond the state’s Minimum Child Care Licensing Standards.
Providers are assessed according to health and safety records, group size, child/staff ratios,
caregiver training, and age‐appropriate curricula and activities. With over 1,200 accredited
sites in 160 out of 254 counties, TRS is the most frequently achieved quality certification in
the State (Figure 7). However, because local workforce boards now rely on local funds to
support quality programming, there is variability in the amount of funding to support this
system across the state.

26
Figure 7. Distribution of TRS Certified Sites Across the State by County
Source: Supply and Quality of Early Care and Education and School‐Age Care, 2012
Texas School Ready! (TSR!). Texas School Ready! (TSR!) is an early childhood quality
improvement and quality certification project administered by the Children’s Learning
Institute at the University of Texas Health Science Center at Houston (UTHSCH). The project
includes mentoring, professional development, progress monitoring, a research‐based
curricula and a quality certification system. TSR! certification identifies pre‐school programs
that are effective in preparing at‐risk Pre‐K children for kindergarten. Public schools, Head
Start, charter schools, nonprofit and for‐profit programs are eligible to enroll in the
certification process. TSR!‐certified programs are listed on the Children’s Learning
Institute’s website. In Texas for the 2010‐2011 school year, there were 1,765 TSR!‐certified
classrooms serving a total of 30,098 students, with an additional 1,452 in the process of
certification (Table 13.)

27
In March 2012, the Texas Education Agency (TEA) announced a new Kindergarten
Readiness System (KRS) to certify quality Pre‐K programs at no cost to the local programs.
This new certification program is part of the larger Texas Student Data System (TSDS)
initiative to improve upon the statewide longitudinal education data system. The TSR!
quality enhancement program will remain the same but the KRS will provide the
certification that identifies a Pre‐K classroom as a “Pre‐K Center of Excellence.”
Table 13. 2010 Texas School Ready! Certification
Type of Program Classrooms Teachers Students
Child Care 205 211 2,682
Head Start 337 349 4,660
Independent School District
1,173 1,021 21,923
Other 50 49 833
Total 1,765 1,630 30,098
Source: The Children's Learning Institute at the University of Texas – Houston. Texas School Ready! Beat. (December 2010) 21:19
Table 14 identifies the estimated gap in TSR!‐certified HS and public school Pre‐K
classrooms. The estimate of eligible classrooms was determined using the total number of
enrolled children, 4 year‐old HS children and all Pre‐K children, divided by 20 (the HS
maximum class size for a group of predominantly 4‐year‐old children). The number of child
care center classrooms potentially eligible to apply for TSR! certification is not available. As
shown in the table, an estimated 16 percent of HS classrooms and 11 percent of public Pre‐
K classrooms were certified by TSR! in 2010.
Table 14. 2010 Estimated Gap in Texas School Ready! Certification for Head Start and Public Pre‐K Classrooms
Type of Program Estimate of Eligible
Classrooms TSR! Classrooms Share of TSR! Classrooms
Head Start 2,040 337 16.5%
Independent School District
10,833 1,173 10.8%
Source: Head Start Program Information Report 2010‐2011, TEA Pre‐K Fact Sheet 2010‐2011, The
Children’s Learning Institute at the University of Texas Houston. Texas School Ready! Beat. (December 2010) 21:19

28
National Quality Accreditation Programs
Of the six national accreditation systems reviewed for this project, all use best‐
practice, research‐based standards to accredit programs but only two have a significant
presence across the state: the National Association for the Education of Young Children
(NAEYC), which accredits 250 programs across the state and the National Association for
Family Child Care (NAFCC), which accredits 81 family homes.
Understanding the accreditation process can offer insight into the challenges ECE
sites experience in pursuing national accreditation. For example, the NAEYC is often
described as the gold standard in ECE care. To earn NAEYC accreditation, sites conduct an
extensive self‐study, measuring the program and its services against the 10 NAEYC Early
Childhood Program Standards and more than 400 related accreditation criteria. A program
receives NAEYC Accreditation after a site visit by an NAEYC assessor to ensure that the
program meets each of the 10 program standards. The cost of NAEYC accreditation for a
center with 10‐60 children is $1,275, with an annual fee of $500 for a five‐year accreditation
term. Of the 250 accredited programs, 77 are HS/EHS programs, 18 are located on military
instillations and many of the remaining 155 appear to be affiliated with a university, public
school, corporation or religious organization. The majority of the ECE sites across the state
do not have resources that may be available to programs that are affiliated with larger
organizations.
Few formal program evaluations have been conducted on specific ECE services to
evaluate their effect on child outcomes. A recent longitudinal analysis of Texas public Pre‐K
found that children participating in public Pre‐K in the 2000‐2001 school year showed small
but significant gains in 3rd grade standardized test scores when compared to Pre‐K‐eligible
children who did not participate, with most of the gains concentrated among children from
very poor families and those who qualified by virtue of both family income and limited
English proficiency. (Huston et al, 2012). In 2009, Head Start programs received support to
implement the Classroom Assessment Scoring System (CLASS), a valid and reliable
research–based observational instruments that assesses classroom quality. CLASS is now
included in the triennial review for a sample of HS grantees but the results of those reviews
are currently unavailable.
SUMMARY
Service gaps between the unduplicated supply of ECE and the population of young
children were computed both for all young children and the sub‐sets of young children
living with employed parents. In 2010, the total available supply of formal ECE could have
potentially served 45 percent of all Texas children, ages 0‐4. In order to maintain the same

29
ratio of slots in 2015 and 2040, an additional 51,752 ECE slots would be needed by 2015 and
an additional 542,237 slots by 2040. Across the state, the share of children who could be
served by formal ECE in 2010 ranged from a low of 37 percent in the Brownsville‐Harlingen
and Sherman‐Denison MSAs to 78 percent in the Texarkana MSA.
Nearly 1.1 million young children needed child care or early education in 2010
because their parents were working. This demand was adjusted to reflect only those
children living in either in two‐parent households in which both parents were working or
single‐working parent households. Assuming that the demand for these slots was evenly
distributed by geographic location and age of young children, the total unduplicated supply
of formal ECE could have potentially served 78 percent of the estimated need for child care
among working families in 2010.
A statistical model was developed incorporating factors known to affect the demand
for ECE and applied to the counties for which sufficient data were available. The results
were then interpreted for the 20 most populous Texas counties by child age. After
controlling for the model variables, Brazoria, Bell, and Denton counties had the largest
supply of formal slots for children ages 0 to 2 relative to the entire state, while Fort Bend
and Williamson counties had the smallest relative supply of slots for this age group. For 3‐
and 4‐year‐olds, Galveston, Webb and Bell counties had the largest relative supply of slots
while Brazoria and Dallas counties had the smallest relative supply of slots needed for this
age group. The same model was used to compare the current supply of formal ECE to
predicted population growth in 2015 and displayed those counties most likely to need
additional ECE capacity in the future.
The degree to which service gaps could be determined for specific programs
providing ECE education and services or SAC was severely constrained due to data
limitations. Gaps could only be estimated for Pre‐K, HS/EHS and CCDF programs. Two
different methods were used to estimate service gaps for Pre‐K programs, which showed
that existing programs served 85‐92 percent of children eligible for this program in 2010.
Based on summary HS and EHS data, it appears that only five percent of eligible 0‐2‐year‐
olds, 31 percent of eligible 3‐year‐olds and 39 percent of eligible 4‐year‐olds were served in
Texas Head Start programs. Due to the flexible nature of the services offered through the
CCDF program and its family‐based eligibility system, it was difficult to precisely measure
the share of eligible children who received those services. But prior research has found that
less than ten percent of eligible CCDF families actually receive those services.
Only 160 of Texas’ 254 counties contain a provider meeting at least one of the
selected quality designations. A maximum of 16 percent of child care centers and 12
percent of public Pre‐K programs received any type of quality designation.

30
DETAILED DATA GAPS
Due to the local nature of the market for early care and education, a needs
assessment would be most useful if conducted for each local level. Ideally, local data
measuring the demand for ECE could be matched against the available local ECE supply,
including the cost and program eligibility information for each type of service. Program
quality would be measured using both structural and observational techniques and
published in a form that is readily available to parents and case managers who need to
make day‐to‐day decisions when choosing the best environments for young children and
children needing school‐age care.
Even for a needs assessment conducted solely from existing data, the level of detail
listed in Table 15 for each county would be required in order to fully complete the
requested analyses originally envisioned for this study. As a result of the many gaps in the
available supply data, the ability to measure the gaps between the demand for and supply
of early care and education was limited to the types of services for which full information
was available at the county level. To the extent possible, researchers used statistical
estimation techniques to account for these data deficiencies but, in general, the best
estimates for the gaps between supply and demand for services are those for the most
populous counties in the state.
Table 15. Desired Units of Analysis for Each Type of Measure in Needs Assessment
Type of Measure Desired Level of Detail
Number of children needing ECE or SAC By age
By family income
By family structure and work status
By geography (county preferred)
Number of providers By zip code (or county )
By number of slots per age group
By type of service provided
By waiting list vs. excess capacity
Number of providers meeting quality standards
Matched to list of providers
By type of quality standards
Number of ECE and SAC slots By child age
By full‐day or part‐day
By work week and season
By geography (county preferred)
By number of children served
By eligible vs. non‐eligible enrollees

31
Table 16 summarizes the types of population, supply and quality data barriers that
were encountered when conducting this study. Unless resolved, these barriers would
impede any future attempts to replicate this study.
Table 16. Types of Data Barriers Encountered When Performing This Research
Data Category
Type of Barrier Specific Issues and Data Files
Population Data
Limited sample size Important socioeconomic characteristics — income, employment, family structure — only available through ACS and could only be used for larger counties
Lack of variables needed to measure program eligibility
No variables for measuring disabilities, developmental delays or limited English within ACS
Program Data
Data access Only most recent data available (i.e. website updated dynamically with no historical record) – NAEYC, Head Start Center list
Data availability No comprehensive source of data for SAC
Level of reporting (summarized at state level vs. individual county)
Head Start – enrollment and demographic data only available at grantee level; ECI – demographic data only available at state level
Differing sub‐state geographical boundaries
Pre‐K at campus level; CCDF at county level; HS center zip codes available but service area (grantees) unclear
Inability to measure multiple services per provider
HS and Pre‐K overlap; LCCC and HS; LCCC and private Pre‐K
Lack of details re: types of service, ages of children served, service capacity, unit of service
Licensing data do not specify number of slots for each age group. Public Pre‐K data do not indicate if full‐day or half‐day slots.
Quality data Lack of common identifier Could not link any program directly to state licensing data or determine if one program had multiple accreditations

32
REFERENCES
Children’s Learning Institute. (n.d.) Texas School Ready!. Online. Available: http://www.childrenslearninginstitute.org/our‐programs/program‐overview/tx‐school‐ready/. Last accessed: 3/28/2012.
Fuller, B., Kagan, S. L., Caspary, G. & Gauthier, C. (2002). Welfare Reform and Child Care Options for Low‐income Families. Future of Children, 12, 97–119.
Goerge, Robert, Harris, Allison, Mackey Bilaver, Lucy, Franzetta, Kerry, Reidy, Mairead, Schexnayder, Deanna, Schroeder, Daniel G., Staveley, Jane, Kreader, J. Lee, Obenski, Sally, Prevost, Ronald C., Berning, Michael E. & Resnick, Dean M. (August 2009). Employment Outcomes for Low‐Income Families Receiving Child Care Subsidies in Illinois, Maryland and Texas. Chapin Hall for Children, University of Chicago.
Houston, Aletha, Gupta, Anjali and Schexnayder, Deanna (2012). Study of Early Education in Texas: The Relationship of Pre‐K Attendance to 3rd Grade Test Results. The University of Texas at Austin Ray Marshall Center. Available. Online: http://www.utexas.edu/research/cshr/rmc1/index.php/publications/education.html Accessed: 11/5/2012.
Lein, L, J. Beausoleil and Y. Tang. (October 2007) The Process of Devolution: Perceptions from Local Boards. Ray Marshall Center for the Study of Human Resources and the Center for Social Work Research, The University of Texas at Austin.
Lippman, L., Vandivere, S., Keith, J., & Atienza, A. (2008). Research Brief: Child Care Use by Low‐income Families: Variations across States. Washington, DC: Child Trends.
Murdock, S., Cline, M., Perez, D., Hough, G., Wilner Jeanty, P. (2012) Change in the Early Childhood and School Age Population in Texas, 2000 to 2010, and Projected to 2015.The Hobby Center for the Study of Texas, Rice University.
National Center for Children in Poverty. Texas Demographics of Low‐Income Children. Online. Available: http://nccp.org/profiles/TX_profile_6.html. Accessed: 10/4/2012.
Overturf Johnson, J. (2005). Who's Minding the Kids? Child Care Arrangements: Winter 2002. Current Population Reports, Household Economic Studies, 70‐101.
Patton, Z., Shelby, M., Chennisi, C., Calhoun, D., Texas Head Start State Collaboration Office Head Start/Early Head Start Needs Assessment Survey: 2008‐2009 Survey Results. Online. Available: http://thssco.uth.tmc.edu/Reports‐And‐Newsletters/documents/Head%20Start%20Needs%20Assessment%20Survey.pdf. Accessed: 5/1/2012.
Rumberger, R.W., and Larson, K.A., "Student Mobility and the Increased Risk of High School Dropout," American Journal of Education, 107(1), pp. 1‐35, 1998.

33
Rosenberg, S.A., Zhang, D. and Robinson, C.C. "Prevalence of Developmental Delays and Participation in Early Intervention Services for Young Children.” Pediatrics 121.6 (2008). Online. Available: http://pediatrics.aappublications.org/content/121/6/e1503.long. Accessed: 3/1/2012.
Schexnayder, D. & Schroeder D. March 2008 Child Care Devolution in Texas: The Relationship of Child Care Policies to Subsidy, Employment and Market Durations: Final Technical Report. Online. Available: http://www.utexas.edu/research/cshr/pubs/pdf/Final_ESI_Econometric_Report_5‐21‐2008.pdf. Accessed: 9/15/2012.
Schexnayder, D., Schroeder D., Juniper, C., Gupta, A. and Morales, V. August 2012 Texas Early Childhood Education Needs Assessment: Supply and Quality of Early Care and School‐Age Care. Unpublished manuscript.
Tarrant, David. "Texas' 100,000 Military Kids Suffer During Parents' Long Deployments.” Dallas Morning News 6 June 2010: n. pag. Dallas Morning News. Web. 28 Feb. 2012. Online. Available: <http://www.dallasnews.com/news/state/headlines/20100605‐Texas‐100‐000‐military‐kids‐1896.ece>. Accessed: 2/28/2012.
Texas After 3:00 p.m. 2009 /Afterschool Alliance. (n.d.) Afterschool in Texas. Online. Available: http://www.afterschoolalliance.org/documents/AA3PM_2009/AA3_Factsheet_TX_2009.pdf Last accessed: 2/3/2012.
Texas Department of Assistant and Rehabilitative Services. (n.d.) Early Childhood Intervention Services: Services and Eligibility. Online. Available: http://www.dars.state.tx.us/ecis/eligibility.shtml. Last accessed: 12/4/2011.
Texas Department of Assistive and Rehabilitative Services. (n.d.) Early Childhood Intervention Services Data and Reports. Online. Available: http://www.dars.state.tx.us/ecis/reports/index.shtml. Last accessed: 11/17/2011.
Texas Education Agency. (2012). Texas Pre‐Kindergarten Data. Online. Available: http://www.tea.state.tx.us/index2.aspx?id=2147487020&menu_id=2147483718. Last accessed: 2/15/2012.
Texas Education Agency Texas Pre‐K Fact Sheet 2010. Online. Available: http://www.tea.state.tx.us/index2.aspx?id=2147487020&menu_id=2147483718 Accessed: 5/12/2012.
Texas Education Agency. Waiver Online Report. Online. Available: http://mansfield.tea.state.tx.us/Tea.Waivers.Web/Default.aspx. Accessed 8/27/2012.
U. S. Census Bureau (2010). Who’s Minding the Kids? Child Care Arrangements: Spring 2010, detailed tables. Online. Available: http://www.census.gov/hhes/childcare/data/sipp/2010/tables.html. Accessed: 8/1/ 2012.

34
U.S. Census Bureau. (n.d.) American Fact Finder. Universe: Own Children Less than 18 Years 2008‐2010 American Community Survey 3‐Year Estimates. Online. Available: http://factfinder2.census.gov/faces/tableservices/jsf/pages/productview.xhtml?pid=ACS_10_3YR_B09002&prodType=table. Accessed: 8/1/ 2012.
U. S. Department of Health and Human Services. (n.d.) Head Start Performance Standards, Section 1305. Online. Available: http://eclkc.ohs.acf.hhs.gov/hslc/standards/Headpercent20Startpercent20Requirements/1305. Last accessed: 4/22/2012.
U.S. Department of Health and Human Services. (n.d.) Program Information Report. Online. Available: http://hses.ohs.acf.hhs.gov/pir. Last accessed: 5‐1‐2012.
U.S. Department of Health and Human Services. Administration for Children and Families Office of Child Care. CCDF Average Monthly Percentage of Children in Care by Age Group FY 2010. Online. Available: http://www.acf.hhs.gov/programs/occ/data/ccdf_data/10acf800_preliminary/table9.htm. Accessed: 8/17/2012.
U.S. Department of Health and Human Services. Administration for Children and Families Office of Child Care. CCDF Funding Allocations and Periods of Availability. September 2010. Online. Available: http://nccp.org/profiles/TX_profile_6.html. Accessed: 8/17/2012.
U.S. Department of Health and Human Services. Administration for Children and Families Office of Child Care. CCDF Funding Allocations and Periods of Availability, September 17, 2012. Available, Online: http://www.acf.hhs.gov/programs/occ/resource/ccdf‐funding‐allocations‐and‐periods‐of‐availability. Accessed: 10/6/2012.
U.S Department of Education, Office of Special Education Programs, Data Analysis System (DANS), OMB #1820‐0043: “Children with Disabilities Receiving Special Education Under Part B of the Individuals with disabilities Education. Available Online: https://www.ideadata.org/arc_toc12.asp#partbCC. Accessed: 10/6/2012.
U.S. Census Bureau. (n.d.). 2010 Single Years of Age and Sex. Retrieved from American Fact Finder. Online. Available: http://factfinder2.census.gov/faces/tableservices/jsf/pages/productview.xhtml?pid=DEC_10_SF1_QTP2&prodType=table. Accessed: 10/2/2012.
U.S. Government Accountability Office. Many Challenges Arise in Educating Students Who Change Schools Frequently GAO‐11‐40, Nov 18, 2011. Online. Available: http://www.gao.gov/assets/320/312480.pdf. Accessed: 8/27/2012.

A‐1
APPENDIX A: DETAILED POPULATION ESTIMATES AND
COUNTY SLOTS PER 100 CHILDREN
Total Texas Children
The first report in this series, Change in the Early Childhood and School‐Age
Population in Texas, 2000 to 2010, and Projected to 2015, presented the total number of
children ages 0‐12 in the state of Texas for three points in time: 2010, 2015 and 2040. The
age break‐downs represented in Tables A‐1, A‐2 and A‐3 (0‐2, 3‐4 and 5‐12) represent more
typical age groups needed to compare child population statistics to categories of care and
services for children of different ages. Ages 0‐2 are infants and toddlers, 3‐4 year‐old
children are considered pre‐school age and 5‐12 are school‐age children. Each of these age
groups of children have different care needs for different reasons. Tables A‐1 and A‐2
present numbers of children by age categories for the COGs and MSAs and Table A‐3
presents numbers of children by age categories for the 20 most child populous counties in
the state.

A‐2
Table A‐1. Child Population Estimates for 2010 and Projections for 2015 and 2040 by Age Group and COG
0‐2 3‐4 5‐12 Total
2010 2015 2040 2010 2015 2040 2010 2015 2040 2010 2015 2040
State of Texas 1,151,310 1,257,156 1,932,229 777,163 811,631 1,251,298 3,066,796 3,229,554 4,864,023 4,995,269 5,298,341 8,047,550
Council of Government (COG) Region
Alamo Area 96,937 104,631 140,573 66,053 67,676 92,632 267,514 278,005 374,967 430,504 450,312 608,172
Ark‐Tex 11,117 11,452 13,610 7,715 7,629 9,135 30,784 31,664 37,096 49,616 50,745 59,841
Brazos Valley 12,238 15,633 21,056 7,946 9,864 13,329 29,854 32,683 50,521 50,038 58,180 84,906
Capital Area 80,126 94,344 179,447 53,709 60,322 114,754 207,485 232,611 444,735 341,320 387,277 738,936
Central Texas 23,706 24,497 32,766 15,394 16,351 21,787 54,288 62,909 84,525 93,388 103,757 139,078
Coastal Bend 24,093 25,335 25,621 16,231 16,584 17,002 65,474 64,071 67,010 105,798 105,990 109,633
Concho Valley 6,309 6,352 6,481 4,226 4,192 4,324 16,128 16,663 17,217 26,663 27,207 28,022
Deep East Texas 14,631 15,686 19,059 10,058 10,465 12,672 39,504 40,861 50,226 64,193 67,012 81,957
East Texas 32,473 34,663 53,397 22,538 22,707 34,528 89,807 93,696 135,274 144,818 151,066 223,199
Golden Crescent 8,013 8,258 9,945 5,455 5,429 6,658 21,341 22,397 26,906 34,809 36,084 43,509
Heart Of Texas 14,209 15,515 16,651 9,568 9,936 10,941 38,186 38,681 43,390 61,963 64,132 70,982
Houston‐Galveston 289,009 311,604 496,032 191,751 201,116 321,589 752,439 809,225 1,253,846 1,233,199 1,321,945 2,071,467
Lower Rio Grande Valley 66,679 80,062 111,815 45,282 49,440 70,148 185,808 177,800 258,066 297,769 307,302 440,029
Middle Rio Grande 8,007 9,275 9,677 5,615 6,006 6,401 22,388 21,877 24,505 36,010 37,158 40,583
Nortex 8,700 8,748 8,934 5,849 5,908 6,030 23,011 23,757 24,633 37,560 38,413 39,597
North Central Texas 300,955 323,577 583,665 206,894 210,150 376,583 817,444 869,553 1,456,054 1,325,293 1,403,280 2,416,302
Panhandle 19,914 19,715 27,257 13,390 13,147 18,283 51,368 56,411 75,232 84,672 89,273 120,772
Permian Basin 20,789 21,489 26,823 13,342 14,074 17,592 50,539 55,392 69,008 84,670 90,955 113,423
Rio Grande 39,452 45,354 52,198 26,791 28,357 33,664 109,092 104,087 127,603 175,335 177,798 213,465
South East Texas 15,753 16,384 21,759 10,462 10,988 14,404 41,372 43,646 57,532 67,587 71,018 93,695
South Plains 18,676 19,607 22,485 12,089 12,716 14,823 46,658 49,049 57,808 77,423 81,372 95,116
South Texas 19,098 23,672 29,299 12,762 14,493 18,283 51,670 47,917 64,901 83,530 86,082 112,483
Texoma 7,413 7,493 9,738 5,088 4,983 6,392 20,622 20,823 25,307 33,123 33,299 41,437
West Central Texas 13,013 13,810 13,941 8,955 9,098 9,344 34,020 35,776 37,661 55,988 58,684 60,946
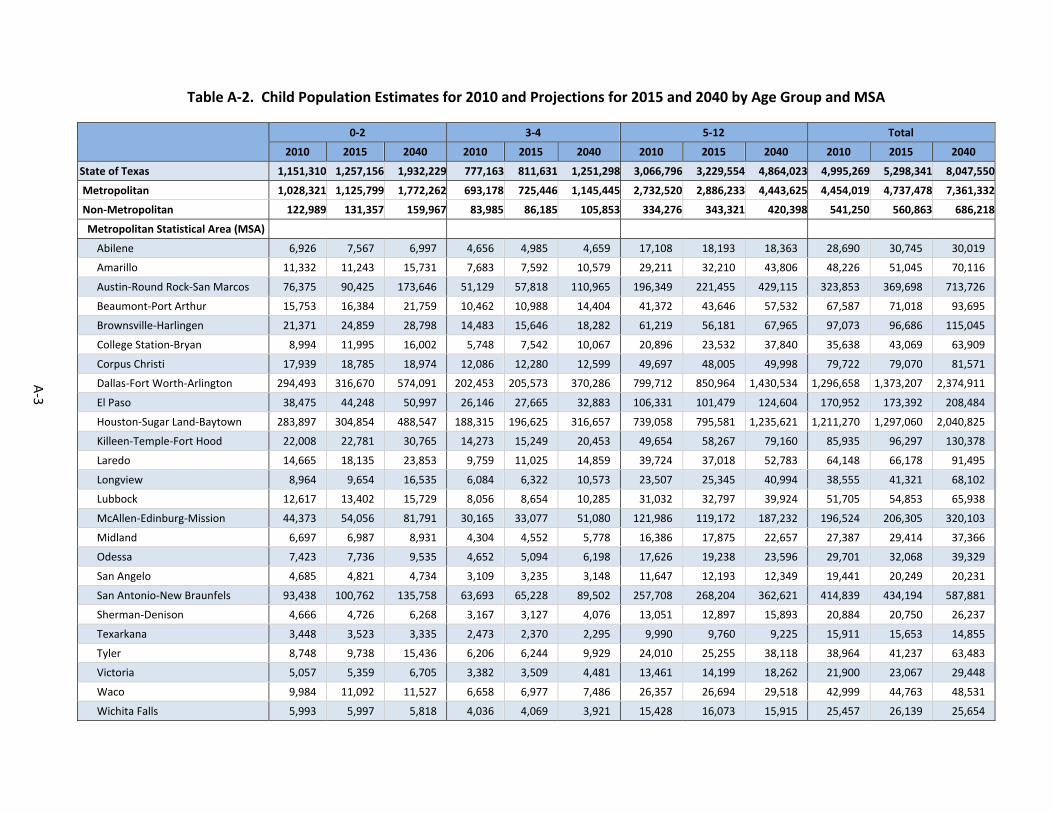
A‐3
Table A‐2. Child Population Estimates for 2010 and Projections for 2015 and 2040 by Age Group and MSA
0‐2 3‐4 5‐12 Total
2010 2015 2040 2010 2015 2040 2010 2015 2040 2010 2015 2040
State of Texas 1,151,310 1,257,156 1,932,229 777,163 811,631 1,251,298 3,066,796 3,229,554 4,864,023 4,995,269 5,298,341 8,047,550
Metropolitan 1,028,321 1,125,799 1,772,262 693,178 725,446 1,145,445 2,732,520 2,886,233 4,443,625 4,454,019 4,737,478 7,361,332
Non‐Metropolitan 122,989 131,357 159,967 83,985 86,185 105,853 334,276 343,321 420,398 541,250 560,863 686,218
Metropolitan Statistical Area (MSA)
Abilene 6,926 7,567 6,997 4,656 4,985 4,659 17,108 18,193 18,363 28,690 30,745 30,019
Amarillo 11,332 11,243 15,731 7,683 7,592 10,579 29,211 32,210 43,806 48,226 51,045 70,116
Austin‐Round Rock‐San Marcos 76,375 90,425 173,646 51,129 57,818 110,965 196,349 221,455 429,115 323,853 369,698 713,726
Beaumont‐Port Arthur 15,753 16,384 21,759 10,462 10,988 14,404 41,372 43,646 57,532 67,587 71,018 93,695
Brownsville‐Harlingen 21,371 24,859 28,798 14,483 15,646 18,282 61,219 56,181 67,965 97,073 96,686 115,045
College Station‐Bryan 8,994 11,995 16,002 5,748 7,542 10,067 20,896 23,532 37,840 35,638 43,069 63,909
Corpus Christi 17,939 18,785 18,974 12,086 12,280 12,599 49,697 48,005 49,998 79,722 79,070 81,571
Dallas‐Fort Worth‐Arlington 294,493 316,670 574,091 202,453 205,573 370,286 799,712 850,964 1,430,534 1,296,658 1,373,207 2,374,911
El Paso 38,475 44,248 50,997 26,146 27,665 32,883 106,331 101,479 124,604 170,952 173,392 208,484
Houston‐Sugar Land‐Baytown 283,897 304,854 488,547 188,315 196,625 316,657 739,058 795,581 1,235,621 1,211,270 1,297,060 2,040,825
Killeen‐Temple‐Fort Hood 22,008 22,781 30,765 14,273 15,249 20,453 49,654 58,267 79,160 85,935 96,297 130,378
Laredo 14,665 18,135 23,853 9,759 11,025 14,859 39,724 37,018 52,783 64,148 66,178 91,495
Longview 8,964 9,654 16,535 6,084 6,322 10,573 23,507 25,345 40,994 38,555 41,321 68,102
Lubbock 12,617 13,402 15,729 8,056 8,654 10,285 31,032 32,797 39,924 51,705 54,853 65,938
McAllen‐Edinburg‐Mission 44,373 54,056 81,791 30,165 33,077 51,080 121,986 119,172 187,232 196,524 206,305 320,103
Midland 6,697 6,987 8,931 4,304 4,552 5,778 16,386 17,875 22,657 27,387 29,414 37,366
Odessa 7,423 7,736 9,535 4,652 5,094 6,198 17,626 19,238 23,596 29,701 32,068 39,329
San Angelo 4,685 4,821 4,734 3,109 3,235 3,148 11,647 12,193 12,349 19,441 20,249 20,231
San Antonio‐New Braunfels 93,438 100,762 135,758 63,693 65,228 89,502 257,708 268,204 362,621 414,839 434,194 587,881
Sherman‐Denison 4,666 4,726 6,268 3,167 3,127 4,076 13,051 12,897 15,893 20,884 20,750 26,237
Texarkana 3,448 3,523 3,335 2,473 2,370 2,295 9,990 9,760 9,225 15,911 15,653 14,855
Tyler 8,748 9,738 15,436 6,206 6,244 9,929 24,010 25,255 38,118 38,964 41,237 63,483
Victoria 5,057 5,359 6,705 3,382 3,509 4,481 13,461 14,199 18,262 21,900 23,067 29,448
Waco 9,984 11,092 11,527 6,658 6,977 7,486 26,357 26,694 29,518 42,999 44,763 48,531
Wichita Falls 5,993 5,997 5,818 4,036 4,069 3,921 15,428 16,073 15,915 25,457 26,139 25,654

A‐4
Table A‐3. Child Population Estimates for 2010 and Projections for 2015 and 2040 by Age Group for 20 Most Child Populous Counties
0‐2 3‐4 5‐12 Total
2010 2015 2040 2010 2015 2040 2010 2015 2040 2010 2015 2040
20 Most Child Populous Counties
Harris 203,677 221,465 290,450 132,637 141,442 186,934 506,603 529,054 693,379 842,917 891,961 1,170,763
Dallas 115,587 129,145 144,347 77,251 82,861 92,526 288,630 289,968 337,772 481,468 501,974 574,645
Tarrant 84,930 90,910 153,492 57,969 58,812 99,015 228,222 244,012 381,111 371,121 393,734 633,618
Bexar 77,590 83,994 105,104 52,497 54,352 69,087 207,826 214,759 272,717 337,913 353,105 446,908
Travis 45,892 55,783 67,571 29,882 35,477 42,814 109,237 118,860 157,209 185,011 210,120 267,594
Hidalgo 44,373 54,056 81,791 30,165 33,077 51,080 121,986 119,172 187,232 196,524 206,305 320,103
El Paso 38,475 44,248 50,997 26,146 27,665 32,883 106,331 101,479 124,604 170,952 173,392 208,484
Collin 34,267 34,607 107,750 24,582 23,034 69,296 105,493 118,161 272,514 164,342 175,802 449,560
Denton 29,082 29,467 91,007 20,708 19,820 58,915 84,263 96,661 226,657 134,053 145,948 376,579
Fort Bend 25,447 25,030 73,829 18,301 16,899 48,991 79,535 95,475 212,525 123,283 137,404 335,345
Cameron 21,371 24,859 28,798 14,483 15,646 18,282 61,219 56,181 67,965 97,073 96,686 115,045
Williamson 19,729 20,873 65,643 13,802 13,542 42,151 56,289 67,073 168,306 89,820 101,488 276,100
Montgomery 19,513 21,145 58,991 13,711 13,599 37,795 57,147 66,386 156,797 90,371 101,130 253,583
Bell 17,391 18,865 25,347 10,974 12,389 16,584 38,202 43,803 61,622 66,567 75,057 103,553
Brazoria 14,807 15,278 30,830 9,921 10,252 20,171 38,869 44,597 80,198 63,597 70,127 131,199
Webb 14,665 18,135 23,853 9,759 11,025 14,859 39,724 37,018 52,783 64,148 66,178 91,495
Nueces 14,343 14,983 15,464 9,733 9,720 10,246 39,635 38,267 40,493 63,711 62,970 66,203
Lubbock 12,327 13,115 15,266 7,841 8,479 9,975 30,295 31,944 38,645 50,463 53,538 63,886
Galveston 11,898 12,699 15,769 8,081 8,448 10,576 33,274 34,015 42,753 53,253 55,162 69,098
Jefferson 10,337 11,073 15,280 6,825 7,303 9,962 26,001 27,486 38,557 43,163 45,862 63,799

Table A‐4. 2010 Total Supply of Unduplicated Formal Early Care and Education Slots Per 100 Children 0‐4 by County
A‐5
Children ages 0‐4 Slots
Slots per 100 Children
County
Anderson 3,135 1,399 44.6
Andrews 1,226 371 30.2
Angelina 6,506 3,344 51.4
Aransas 1,190 356 29.9
Archer 472 200 42.5
Armstrong 107 18 17.2
Atascosa 3,337 1,045 31.3
Austin 1,850 751 40.6
Bailey 682 222 32.5
Bandera 923 376 40.8
Bastrop 5,014 2,700 53.9
Baylor 228 144 63.3
Bee 1,937 787 40.6
Bell 28,365 15,416 54.3
Bexar 130,087 55,561 42.7
Blanco 551 159 28.9
Borden 28 9 33.8
Bosque 1,016 349 34.4
Bowie 5,921 4,618 78.0
Brazoria 24,728 12,307 49.8
Brazos 12,506 6,638 53.1
Brewster 542 345 63.7
Briscoe 103 15 14.6
Brooks 619 282 45.5
Brown 2,368 1,203 50.8
Burleson 1,074 392 36.5
Burnet 2,498 1,455 58.2
Caldwell 2,614 913 34.9
Calhoun 1,526 910 59.7
Callahan 779 252 32.3
Cameron 35,854 13,172 36.7
Camp 899 373 41.5
Carson 363 92 25.4
Cass 1,780 854 48.0
Castro 699 177 25.3
Chambers 2,438 809 33.2
Cherokee 3,627 1,328 36.6
Childress 424 194 45.7
Clay 602 215 35.8
Cochran 248 118 47.4
Coke 166 67 40.6
Coleman 501 211 42.2
Collin 58,849 35,059 59.6
Collingsworth 256 75 29.4
Colorado 1,326 675 50.9
Comal 6,211 2,991 48.2
Children ages 0‐4 Slots
Slots per 100 Children
County
Comanche 938 275 29.3
Concho 161 83 51.3
Cooke 2,687 752 28.0
Coryell 6,687 3,079 46.0
Cottle 78 35 44.5
Crane 335 91 27.2
Crockett 297 109 36.7
Crosby 505 141 27.8
Culberson 179 84 46.9
Dallam 624 418 67.0
Dallas 192,838 70,776 36.7
Dawson 1,055 460 43.6
Deaf Smith 1,841 796 43.2
Delta 309 93 30.0
Denton 49,790 29,072 58.4
De Witt 1,242 476 38.3
Dickens 132 42 31.5
Dimmit 819 465 56.8
Donley 203 81 39.8
Duval 844 316 37.4
Eastland 1,114 415 37.3
Ector 12,075 4,558 37.7
Edwards 114 79 69.7
Ellis 10,939 4,441 40.6
El Paso 64,621 24,169 37.4
Erath 2,397 1,149 47.9
Falls 1,069 322 30.1
Fannin 1,981 826 41.7
Fayette 1,377 569 41.3
Fisher 220 54 24.5
Floyd 493 260 52.7
Foard 57 36 64.0
Fort Bend 43,748 19,803 45.3
Franklin 699 254 36.4
Freestone 1,229 566 46.1
Frio 1,204 549 45.6
Gaines 1,819 277 15.2
Galveston 19,979 12,575 62.9
Garza 382 114 29.9
Gillespie 1,234 544 44.1
Glasscock 79 26 32.6
Goliad 385 183 47.5
Gonzales 1,530 689 45.0
Gray 1,636 546 33.4
Grayson 7,833 3,199 40.8
Gregg 9,081 5,154 56.8

Table A‐4. 2010 Total Supply of Unduplicated Formal Early Care and Education Slots Per 100 Children 0‐4 by County
A‐6
Children ages 0‐4 Slots
Slots per 100 Children
County
Grimes 1,580 633 40.0
Guadalupe 9,197 2,870 31.2
Hale 3,016 1,034 34.3
Hall 218 103 47.2
Hamilton 469 238 50.7
Hansford 466 159 34.1
Hardeman 269 144 53.6
Hardin 3,686 1,462 39.7
Harris 336,314 150,525 44.8
Harrison 4,676 1,895 40.5
Hartley 349 11 3.2
Haskell 311 171 54.9
Hays 10,571 5,175 49.0
Hemphill 326 118 36.3
Henderson 4,668 1,726 37.0
Hidalgo 74,538 29,954 40.2
Hill 2,291 957 41.8
Hockley 1,754 771 44.0
Hood 2,918 1,330 45.6
Hopkins 2,434 1,355 55.7
Houston 1,362 463 34.0
Howard 2,267 930 41.0
Hudspeth 242 56 23.2
Hunt 5,713 2,462 43.1
Hutchinson 1,601 593 37.1
Irion 68 23 33.2
Jack 485 125 25.8
Jackson 1,030 352 34.1
Jasper 2,439 979 40.2
Jeff Davis 89 29 32.1
Jefferson 17,162 8,481 49.4
Jim Hogg 460 219 47.5
Jim Wells 3,345 1,208 36.1
Johnson 10,780 4,463 41.4
Jones 949 343 36.1
Karnes 834 238 28.6
Kaufman 7,754 2,971 38.3
Kendall 1,764 801 45.4
Kenedy 27 16 59.3
Kent 38 7 18.4
Kerr 2,587 1,292 49.9
Kimble 235 95 40.5
King 11 ‐
Kinney 190 56 29.6
Kleberg 2,479 1,008 40.7
Knox 278 112 40.4
Children ages 0‐4 Slots
Slots per 100 Children
County
Lamar 3,187 1,713 53.7
Lamb 1,139 305 26.8
Lampasas 1,229 380 30.9
La Salle 412 167 40.5
Lavaca 1,227 603 49.2
Lee 1,079 550 50.9
Leon 1,023 318 31.1
Liberty 5,189 1,432 27.6
Limestone 1,530 919 60.0
Lipscomb 255 78 30.6
Live Oak 574 127 22.2
Llano 826 394 47.7
Loving 3 ‐ 0.0
Lubbock 20,168 10,621 52.7
Lynn 438 111 25.3
Madison 820 383 46.7
Marion 548 222 40.5
Martin 392 80 20.5
Mason 200 124 62.2
Matagorda 2,577 1,081 41.9
Maverick 4,762 2,094 44.0
McCulloch 536 238 44.4
McLennan 16,642 7,726 46.4
McMullen 28 14 50.0
Medina 2,971 978 32.9
Menard 128 38 29.3
Midland 11,001 5,592 50.8
Milam 1,698 716 42.1
Mills 298 84 28.1
Mitchell 490 201 41.1
Montague 1,234 427 34.6
Montgomery 33,224 14,553 43.8
Moore 2,028 470 23.2
Morris 836 264 31.6
Motley 63 14 22.2
Nacogdoches 4,434 2,146 48.4
Navarro 3,480 1,547 44.5
Newton 840 197 23.5
Nolan 1,128 675 59.9
Nueces 24,076 13,140 54.6
Ochiltree 953 388 40.7
Oldham 100 93 93.1
Orange 5,367 2,362 44.0
Palo Pinto 1,921 700 36.4
Panola 1,539 621 40.3
Parker 7,344 2,630 35.8

Table A‐4. 2010 Total Supply of Unduplicated Formal Early Care and Education Slots Per 100 Children 0‐4 by County
A‐7
Children ages 0‐4 Slots
Slots per 100 Children
County
Parmer 912 190 20.9
Pecos 1,177 353 30.0
Polk 2,612 963 36.9
Potter 10,326 5,112 49.5
Presidio 570 103 18.1
Rains 574 63 11.1
Randall 8,219 4,364 53.1
Reagan 277 84 30.5
Real 162 113 69.6
Red River 724 308 42.5
Reeves 914 229 25.1
Refugio 446 138 30.9
Roberts 73 14 19.2
Robertson 1,162 620 53.4
Rockwall 5,752 2,423 42.1
Runnels 700 288 41.2
Rusk 3,434 1,009 29.4
Sabine 541 229 42.3
San Augustine 476 308 64.8
San Jacinto 1,602 281 17.6
San Patricio 4,759 2,210 46.4
San Saba 354 118 33.2
Schleicher 344 53 15.5
Scurry 1,274 521 40.9
Shackelford 221 95 42.9
Shelby 1,921 757 39.4
Sherman 216 106 49.0
Smith 14,954 7,851 52.5
Somervell 496 208 41.9
Starr 5,513 2,447 44.4
Stephens 630 229 36.3
Sterling 88 9 9.9
Stonewall 82 68 82.8
Sutton 309 137 44.4
Swisher 614 226 36.8
Tarrant 142,899 62,664 43.9
Taylor 9,854 5,705 57.9
Terrell 65 11 16.9
Terry 1,003 367 36.6
Throckmorton 93 24 25.6
Titus 2,942 1,293 44.0
Tom Green 7,726 4,110 53.2
Travis 75,774 39,377 52.0
Trinity 817 349 42.7
Tyler 1,139 404 35.5
Upshur 2,533 746 29.4
Children ages 0‐4 Slots
Slots per 100 Children
County
Upton 249 55 22.3
Uvalde 2,035 1,306 64.2
Val Verde 4,079 1,456 35.7
Van Zandt 3,146 1,430 45.4
Victoria 6,528 3,450 52.8
Walker 3,241 2,016 62.2
Waller 3,140 1,044 33.2
Ward 813 239 29.4
Washington 2,019 1,185 58.7
Webb 24,424 9,827 40.2
Wharton 3,006 1,776 59.1
Wheeler 392 126 32.2
Wichita 8,955 4,662 52.1
Wilbarger 965 534 55.4
Willacy 1,569 708 45.1
Williamson 33,531 19,009 56.7
Wilson 2,641 934 35.4
Winkler 633 177 28.0
Wise 3,979 1,341 33.7
Wood 2,197 788 35.9
Yoakum 731 181 24.7
Young 1,204 621 51.6
Zapata 1,463 587 40.1
Zavala 1,049 626 59.7

B‐1
APPENDIX B: STATISTICAL MODEL COMPARING ACTUAL TO PREDICTED DEMAND FOR
FORMAL CARE IN SUB‐STATE AREAS
This section provides a detailed description of several statistical models developed
to account for variation in the number of slots available per child living in each county.
Overall Models for Children ages 0‐4
The first statistical models of slot ratios are shown in Appendix Table B‐1. These
models, the results of which were described in the main text, use various county‐level data
from the Census and other public data sources to estimate the ratio of formal child care
slots available to the number of children living in each county. In other words, they attempt
to estimate local demand, in terms of what share of young children require child care.
Table B‐1. Two County‐Level Models Predicting Overall Slot Ratio, or Number of Slots per 100 Children Ages 0‐4
Variable Description
Model A Model B
Rsq=.56 Rsq=.64
Num Counties = 251
Num Counties = 179
Intercept 0.288 0.667 **
Both parents working, 2 parent families with children under 6 0.004 0.007 *
Parent is working, 1 parent families with children under 6 0.010 ** 0.009 *
Median annual income, families with own children under 18 0.005 ** 0.004 **
Earnings of those with less than HS education (1000s) ‐0.009 ** ‐0.010 **
Earnings of HS graduates (1000s) ‐0.003 ‐0.002
Earnings of those with some college or more education (1000s) ‐0.004 * 0.000
Grandparents living with and responsible for own grandchildren ‐0.012 ‐0.013
Percent of males 18‐34 enrolled in college or grad school ‐0.001 ‐0.002
Percent of females 18‐34 enrolled in college or grad school 0.002 0.002
Percent who leave home early for work (before 6:30am) ‐0.004 ** 0.000
Percent who leave home late for work (after 9am) ‐0.002 0.000
Percent of low‐income (<150% FPL) workers who commute to work by driving alone ‐0.003 ** ‐0.003 **
Percent of low‐income (<150% FPL) workers who commute to work by public transportation ‐0.004 ‐0.001
Average time commuting to work, hours ‐0.576 **
Unemployment rate ‐0.006 ‐0.003
Employment growth rate ‐0.035 ** ‐0.037 **
Labor force growth rate 0.036 ** 0.037 **
Mobility from outside county, children 1‐4 0.000 0.000
Percent of children 0‐12 who are very young (0‐4) 0.014 ** 0.004
Percent of children 0‐4 who are Black 0.000 ‐0.001
Percent of children 0‐4 who are Hispanic ‐0.001 ** ‐0.002 **

B‐2
The models in Table B‐1, which predict the overall slot ratio for children ages zero to
four, are nearly identical, with the exception that the second model has an additional
predictor variable that is only available for a subset of the state's counties. Both models do
an acceptable job of accounting for variation in slot ratios, with R‐squared values of 0.56
and 0.64 indicating that they account for 56 and 64 percent, respectively, of the county‐
level variation in this measure of slots per child.
The average slot ratio for this age group is 0.45, indicating that on a statewide basis,
there are 45 child care slots for every 100 children, ages zero to four. Means for this
variable and all the predictors included in these two regressions are shown in Appendix
Table B‐2.
Table B‐2: Statewide Means for Variables in County‐Level Models Predicting Overall Slot Ratio10
Variable Description
Model A
Mean Standard Deviation
Dependent Variable: Number of child care slots per 100 children ages 0‐4 0.45 7.0
Both parents working, 2 parent families with children under 6 11.93 170.3
Parent is working, 1 parent families with children under 6 9.06 174.8
Median annual income, families with own children under 18 53.04 1374.3
Earnings of those with less than HS education (1000s) 18.28 225.0
Earnings of HS graduates (1000s) 25.67 278.5
Earnings of those with some college or more education (1000s) 41.90 548.5
Grandparents living with and responsible for own grandchildren 2.27 65.6
Percent of males 18‐34 enrolled in college or grad school 18.19 625.0
Percent of females 18‐34 enrolled in college or grad school 22.65 650.8
Percent who leave home early for work (before 6:30am) 22.10 451.7
Percent who leave home late for work (after 9am) 22.01 242.1
Percent of low‐income (<150% FPL) workers who commute to work by driving alone 68.74 463.7
Percent of low‐income (<150% FPL) workers who commute to work by public transportation 3.50 269.7
Average time commuting to work, hours 0.41 6.8
Unemployment rate 8.07 121.8
Employment growth rate 1.96 193.8
Labor force growth rate 3.51 191.3
Mobility from outside county, children 1‐4 8.15 350.5
Percent of children 0‐12 who are very young (0‐4) 38.68 145.1
Percent of children 0‐4 who are Black 11.23 663.0
Percent of children 0‐4 who are Hispanic 50.64 1839.0
10 Means and standard deviations for models A and B are virtually identical, thus only the first are shown.

B‐3
Models by Age
Since the dynamics of child care supply and demand vary critically depending on the
age of the children, separate models of slot ratios by age were also estimated. The first
model examines factors influencing the number of slots per child dedicated to children ages
two or younger. The second model predicts the number of slots per child for children ages
three or four.11
The slot model for infants and toddlers does even better at predicting slots per child
than the overall model, with an R‐squared of 0.73 indicating that 73 percent of the variation
in slots per child is accounted for. The slot model for preschoolers, those three and four
years of age, did not do as well at predicting slots per child as did the overall or the
infant/toddler models. An R‐squared value of 0.53 indicates that only 53 percent of the
variance in slots per child for older children can be accounted for. Although this is still a
good model, the reduction in variance accounted for could be instructive. The difference in
predictive power could in part be due to the inclusion of some five‐year‐old slots in the
dependent variable discussed earlier. Even more interesting, however, is the possibility that
the inclusion of free public Pre‐K among the slot supply measures means that the link to
parental income is not as strong in this instance.
Table B‐3 shows the results of these two models of slot ratios by age, presented
side‐by‐side with the second model from above for easier comparison. Means for these
predictors are included in Table B‐4. A complete analysis of model results is available upon
request.
11 Unfortunately, some of the slot supply measures for the 3‐4 year old model include slots for 5 year olds as well. For this reason, the average slots per child will not be interpreted for these models.

B‐4
Table B‐3: Three County‐Level Models Predicting Slot Ratio, Overall and by Age
Variable Description
Model B, ages 0‐4
Model C, ages 0‐2
Model D, ages 3‐4
Rsq=.64 Rsq=.73 Rsq=.53
Num Counties = 179
Num Counties = 179
Num Counties = 179
Intercept 0.667 ** 0.605 * 1.500 **
Both parents working, 2 parent families with children under 6 0.007 * 0.005 0.013 *
Parent is working, 1 parent families with children under 6 0.009 * 0.014 ** ‐0.003
Median annual income, families with own children under 18 0.004 ** 0.007 ** ‐0.002
Earnings of those with less than HS education (1000s) ‐0.010 ** ‐0.012 ** ‐0.005
Earnings of HS graduates (1000s) ‐0.002 ‐0.004 ‐0.004
Earnings of those with some college or more education (1000s) 0.000 0.004 ‐0.004
Grandparents living with and responsible for own grandchildren ‐0.013 0.004 ‐0.004
Percent of males 18‐34 enrolled in college or grad school ‐0.002 0.000 0.000
Percent of females 18‐34 enrolled in college or grad school 0.002 0.002 ‐0.001
Percent who leave home early for work (before 6:30am) 0.000 ‐0.003 0.006 *
Percent who leave home late for work (after 9am) 0.000 ‐0.003 0.001
Percent of low‐income (<150% FPL) workers who commute to work by driving alone ‐0.003 ** ‐0.002 ‐0.005 **
Percent of low‐income (<150% FPL) workers who commute to work by public transportation ‐0.001 0.002 ‐0.001
Average time commuting to work, hours ‐0.576 ** ‐0.494 ** ‐0.481 *
Unemployment rate ‐0.003 0.012 ‐0.007
Employment growth rate ‐0.037 ** 0.003 ‐0.070 **
Labor force growth rate 0.037 ** ‐0.003 0.067 **
Mobility from outside county, children 1‐4 0.000 ‐0.002 0.003
Percent of children 0‐12 who are very young (0‐4; 0‐2; 3‐4) 0.004 ‐0.008 ‐0.024
Percent of children (0‐4; 0‐2; 3‐4) who are Black ‐0.001 0.000 0.002
Percent of children (0‐4; 0‐2; 3‐4) who are Hispanic ‐0.002 ** ‐0.002 ** 0.000

B‐5
Table B‐4: Statewide Means for Variables in County‐Level Models Predicting Slot Ratio, by Age
Variable Description
Model C, Ages 0‐2 Model D, Ages 3‐4
Mean Standard Deviation Mean
Standard Deviation
Dependent Variable: Number of child care slots per 100 children ages 0‐2
0.37 9.4
Both parents working, 2 parent families with children under 6 11.95 148.4 11.97 123.5
Parent is working, 1 parent families with children under 6 9.08 154.5 9.04 128.5
Median annual income, families with own children under 18 53.16 1235.3 53.40 1032.7
Earnings of those with less than HS education (1000s) 18.31 197.5 18.31 163.4
Earnings of HS graduates (1000s) 25.70 246.8 25.72 204.6
Earnings of those with some college or more education (1000s) 42.04 489.6 42.06 406.0
Grandparents living with and responsible for own grandchildren 2.26 57.9 2.26 47.7
Percent of males 18‐34 enrolled in college or grad school 18.37 563.3 18.34 455.8
Percent of females 18‐34 enrolled in college or grad school 22.78 585.1 22.76 476.1
Percent who leave home early for work (before 6:30am) 22.10 409.6 22.10 336.5
Percent who leave home late for work (after 9am) 22.08 212.6 22.06 174.7
Percent of low‐income (<150% FPL) workers who commute to work by driving alone
68.62 408.6 68.68 334.3
Percent of low‐income (<150% FPL) workers who commute to work by public transportation
3.57 244.8 3.52 200.5
Average time commuting to work, hours 0.41 5.2 0.41 4.3
Unemployment rate 8.08 108.8 8.08 89.8
Employment growth rate 1.97 169.1 1.99 139.1
Labor force growth rate 3.53 167.3 3.54 137.7
Mobility from outside county, children 1‐4 8.11 303.3 8.15 249.9
Percent of children 0‐12 who are very young (0‐2; 3‐4) 23.12 100.6 15.57 29.4
Percent of children (0‐2; 3‐4) who are Black 11.29 593.2 11.49 500.7
Percent of children (0‐2; 3‐4) who are Hispanic 50.65 1644.4 50.09 1380.2