the aluminium industry, environment, technology, and production
DESCRIPTION
aluminiumTRANSCRIPT
Håvard Bergsdal Anders H. Strømman Edgar G. Hertwich
THE ALUMINIUM INDUSTRY
Environment, Technology and Production
NTNU Program for industriell økologi
Rapport nr: 8/2004
Reports and Working Papers from
Norwegian University of Science and Technology (NTNU) Industrial Ecology Programme (IndEcol)
Report no.8/2004 ISSN 1501-6153 ISBN 82-7948-042-0 (trykt) ISBN 82-7948-043-9 (pdf)
Editor-in-chief: Professor Edgar Hertwich, Programme Leader, IndEcol
Editors: Øivind Hagen, SINTEF Technology and society, IFIM Anders Strømman, IndEcol
Design and layout: Elin Mathiassen, Coordinator, IndEcol
Reports and Working Papers may be downloaded from the IndEcol web site:
Industrial Ecology Programme (IndEcol) NTNU NO-7491 Trondheim, Norway
Tel.: + 47 73598940 Fax.: + 47 73598943 E-mail: [email protected] Web: www.indecol.ntnu.no
Abstract
Aluminium resources are abundant and will cover the world demand for severalhundred years. Production of primary aluminium is increasing worldwide, andthe same holds for secondary aluminium, at an even higher rate. Aluminiumstocks in products have been growing, and a shift towards more reliance onand better utilization of these is taking place as more of these resources arereturned from products ending their lifetime. Bauxite, alumina and aluminiumproduction and consumption are described, and future primary aluminium de-mand projected for the next decades, showing strong growth in most parts ofthe world. Environmental implications from processes involved in aluminiumproduction are discussed, in particular emissions of CO2 and PFC compunds,which are both reduced in terms of specific emissions.

ii
Contents
Abstract i
Contents iii
List of figures v
List of tables vii
1 Introduction 1
2 Bauxite mining 22.1 Bauxite production . . . . . . . . . . . . . . . . . . . . . . . . . . 22.2 Bauxite mining - Environmental impacts . . . . . . . . . . . . . . 4
3 Alumina refining 53.1 Alumina production . . . . . . . . . . . . . . . . . . . . . . . . . 63.2 Alumina refining - Environmental impacts . . . . . . . . . . . . . 8
4 Aluminium smelting 104.1 Technology . . . . . . . . . . . . . . . . . . . . . . . . . . . . . . 104.2 Electricity consumption . . . . . . . . . . . . . . . . . . . . . . . 114.3 Aluminium production . . . . . . . . . . . . . . . . . . . . . . . . 134.4 Aluminium consumption . . . . . . . . . . . . . . . . . . . . . . . 144.5 The structure of the aluminium industry . . . . . . . . . . . . . . 174.6 Aluminium smelting - Environmental impacts . . . . . . . . . . . 18
5 Greenhouse gases 225.1 PFC emissions . . . . . . . . . . . . . . . . . . . . . . . . . . . . 225.2 Total CO2 emissions . . . . . . . . . . . . . . . . . . . . . . . . . 24
6 Recycling 27
7 The case of China 307.1 Bauxite and alumina . . . . . . . . . . . . . . . . . . . . . . . . . 317.2 Trade flows . . . . . . . . . . . . . . . . . . . . . . . . . . . . . . 317.3 Chinese aluminium production and consumption . . . . . . . . . 327.4 Energy and operating costs . . . . . . . . . . . . . . . . . . . . . 357.5 Energy shortage and over-supply . . . . . . . . . . . . . . . . . . 36

iv CONTENTS
8 Future primary aluminium demand 37
9 Conclusions 40
References 41

List of Figures
2.1 Different regions share of world bauxite production . . . . . . . . 3
3.1 Flow chart for the Bayer process . . . . . . . . . . . . . . . . . . 53.2 Different regions share of world alumina production . . . . . . . 63.3 World alumina production capacity and production volumes . . . 7
4.1 Illustrations of Prebake and Soderberg cells for aluminium smelting 114.2 Energy efficiency improvement in world primary aluminium pro-
duction . . . . . . . . . . . . . . . . . . . . . . . . . . . . . . . . 134.3 Energy sources for electrical power in primary aluminium pro-
duction, 2002 . . . . . . . . . . . . . . . . . . . . . . . . . . . . . 144.4 World primary aluminium production output . . . . . . . . . . . 154.5 Primary aluminium consumption by end use for the Western World 154.6 World primary aluminium consumption . . . . . . . . . . . . . . 164.7 Primary aluminium consumption by end use for the Western
World 2002 and US 1960 . . . . . . . . . . . . . . . . . . . . . . . 174.8 Fluoride emissions, Norwegian aluminium smelting industry 1960-
2000 . . . . . . . . . . . . . . . . . . . . . . . . . . . . . . . . . . 20
6.1 Restructuring of European secondary industry 1995-2000, andthe growth of recycling capacity for Hydro Aluminium . . . . . . 29
7.1 Chinese trade flows and net imports composition . . . . . . . . . 327.2 Chinese primary aluminium production and consumption, and
consumption/Capita vs. GDP/Capita . . . . . . . . . . . . . . . 337.3 Aluminium consumption by end use for the Western World and
China in 2002 . . . . . . . . . . . . . . . . . . . . . . . . . . . . . 347.4 Components of full operating costs as of 2002 . . . . . . . . . . . 35
8.1 Projections of future primary aluminium demand . . . . . . . . . 38

vi LIST OF FIGURES

List of Tables
2.1 Distribution of world bauxite production, reserves and reserve base 22.2 Rehabilitated mine use (1998) . . . . . . . . . . . . . . . . . . . . 4
3.1 World average operation and investment costs for alumina refining 73.2 Alumina refining inventory for world average production of alumina 83.3 Range of chemical composition in bauxite residues . . . . . . . . 9
4.1 Technology distribution of worldwide primary aluminium produc-tion . . . . . . . . . . . . . . . . . . . . . . . . . . . . . . . . . . 11
4.2 Electricity consumption in aluminium smelting . . . . . . . . . . 124.3 Electricity consumption for primary aluminium production in dif-
ferent regions . . . . . . . . . . . . . . . . . . . . . . . . . . . . . 124.4 Main producers of primary aluminium and their contribution to
world production in 2003 . . . . . . . . . . . . . . . . . . . . . . 184.5 Inventory for world average production of 1,000 kg primary alu-
minium . . . . . . . . . . . . . . . . . . . . . . . . . . . . . . . . 19
5.1 Worldwide emissions of GHG, world total emissions and alu-minium production . . . . . . . . . . . . . . . . . . . . . . . . . . 23
5.2 Technology specific emissions of PFC compounds and total emis-sions . . . . . . . . . . . . . . . . . . . . . . . . . . . . . . . . . . 23
5.3 Specific emission rates of CF4 for different regions, and partici-pation rates . . . . . . . . . . . . . . . . . . . . . . . . . . . . . . 24
5.4 Emissions of greenhouse gases from primary aluminium produc-tion unit processes . . . . . . . . . . . . . . . . . . . . . . . . . . 24
5.5 Regional CO2 emission factors for electricity production and spe-cific regional CO2 emissions from electrolysis . . . . . . . . . . . 25
6.1 Sources of aluminium recycling from old and new scrap (1998) . 276.2 Recycling requirements in the ELV directive . . . . . . . . . . . . 28
7.1 China’s position in the world economy measured in GDP andPPP-adjusted GDP in 2003 . . . . . . . . . . . . . . . . . . . . . 30
7.2 Chinese compounded annual growth rate 1995-2003 . . . . . . . . 337.3 Chinese power situation in 2002 . . . . . . . . . . . . . . . . . . . 35
8.1 Growth in PAD for the period 2000 to 2050 . . . . . . . . . . . . 388.2 α, β and R2 values for different regions . . . . . . . . . . . . . . . 39

viii LIST OF TABLES
Chapter 1
Introduction
Aluminium compounds make up 7,3% of the earth’s crust, making it the thirdmost common crustal element and the most common crustal metal on earth.Aluminium was first produced in 1808. There are three main steps in theprocess of aluminium production. First is the mining of aluminium ore, mostcommonly bauxite, referred to as bauxite mining. Second is the refining ofbauxite into aluminium oxide trihydrate (Al2O3), known as alumina, and thirdis the electrolytically reduction of alumina into metallic aluminium. The processrequires approximately two to three tonnes of bauxite for the production of onetonne of alumina, and in turn, approximately two tonnes of alumina is requiredfor making one tonne of aluminium.
Primary aluminium possesses a range of favorable material properties, making itattractive for a multitude of applications. These properties are not lost duringrecycling, and combined with low recycling costs and reduced environmentalstress, secondary aluminium is also a very attractive material.
Development in the aluminium producing industry, consumption and environ-mental implications are discussed, as well as aspects of future trends. This alsoincludes the preceding processes of bauxite mining and alumina refining. Eachof these process steps are described consecutively.
Chapter 2
Bauxite mining
Aluminium is the third most abundant element in the earth’s crust, but becauseof its chemical reactivity it is never found pure in nature, but always in oxidizedform. There are three main variants of bauxite, each containing hydrated formsof aluminium oxide. The variants depend on the number of molecules of waterof hydration and the crystalline structure, and are known as gibbsite, bohmiteand diaspore. The former exists in trihydrate form, as opposed to monohydratefor the other, and is currently the most dominant form being mined. Trihydrateforms contain approximately 50% alumina by weight [13].
2.1 Bauxite production
Bauxite mining takes place in four main climate groups. According to 1998figures, the distribution was; Tropical 48%, Mediterranean 39%, Subtropical13% and Temperate 0.5%. In the U.S. Geological Survey of 2004, world bauxitereserves presently economically extractable are estimated to 23bn tonnes. Thedistribution of reserves and potential reserve base are shown in Table 2.1, alongwith bauxite production figures. World estimates of bauxite reserve base haveroughly doubled every ten years for the last fifty years.
Table 2.1: Distribution of world bauxite production, reserves and reserve base(10e3 tonnes) [26].
Mine production Reserves Reserve base2002 2003
United States NA NA 20, 000 40, 000Australia 54, 000 55, 000 4, 400, 000 8, 700, 000Brazil 13, 900 13, 500 1, 900, 000 2, 500, 000China 12, 000 12, 000 700, 000 2, 300, 000Guinea 15, 700 16, 000 7, 400, 000 8, 600, 000Guyana 2, 000 1, 500 700, 000 900, 000India 9, 270 9, 000 770, 000 1, 400, 000Jamaica 13, 100 13, 400 2, 000, 000 2, 500, 000Russia 3, 800 3, 800 200, 000 250, 000
2.1 Bauxite production 3
Mine production Reserves Reserve base2002 2003
Suriname 4, 500 4, 500 580, 000 600, 000Venezuela 5, 000 5, 000 320, 000 350, 000Other countries 11, 200 10, 700 4, 300, 000 5, 000, 000
World total 144, 000 144, 000 23, 000, 000 33, 000, 000
The bauxite reserves are substantial, and the known reserves of high qualitybauxite from which most of the aluminium is produced, are sufficient to provideover 300 years supply. The major bauxite deposits are found in the Tropics andin the Caribbean and Mediterranean regions [16].
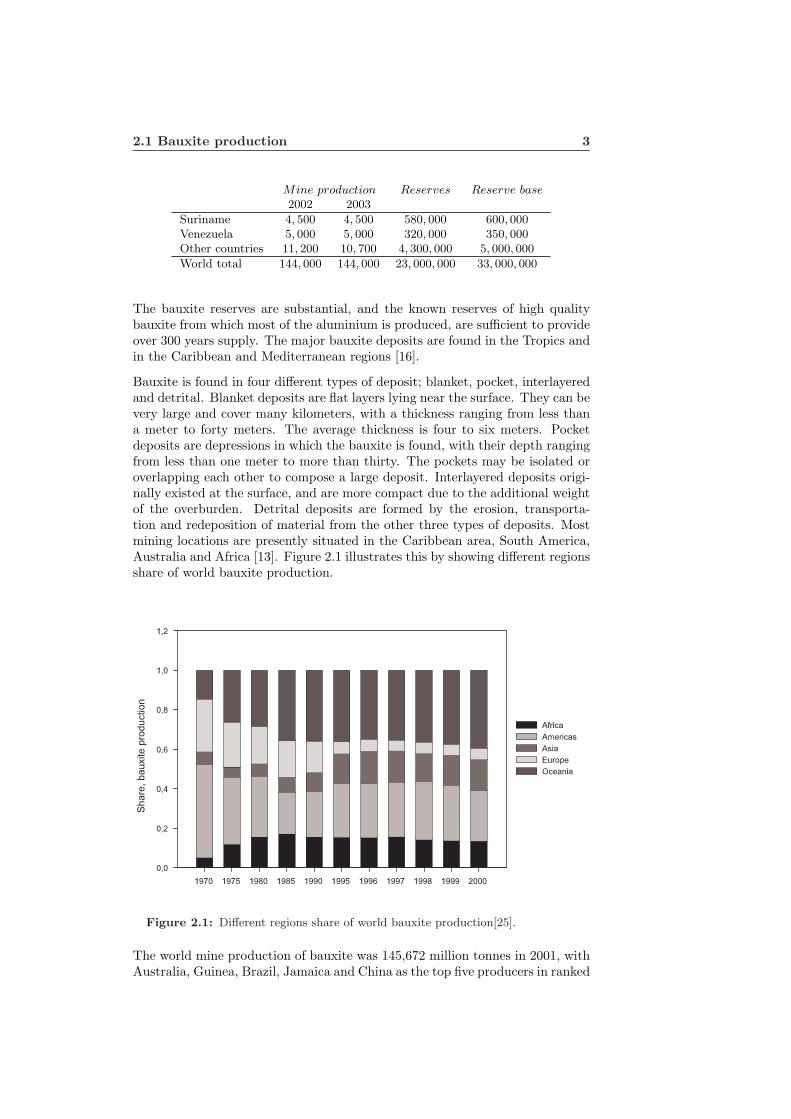
Bauxite is found in four different types of deposit; blanket, pocket, interlayeredand detrital. Blanket deposits are flat layers lying near the surface. They can bevery large and cover many kilometers, with a thickness ranging from less thana meter to forty meters. The average thickness is four to six meters. Pocketdeposits are depressions in which the bauxite is found, with their depth rangingfrom less than one meter to more than thirty. The pockets may be isolated oroverlapping each other to compose a large deposit. Interlayered deposits origi-nally existed at the surface, and are more compact due to the additional weightof the overburden. Detrital deposits are formed by the erosion, transporta-tion and redeposition of material from the other three types of deposits. Mostmining locations are presently situated in the Caribbean area, South America,Australia and Africa [13]. Figure 2.1 illustrates this by showing different regionsshare of world bauxite production.
Figure 2.1: Different regions share of world bauxite production[25].
The world mine production of bauxite was 145,672 million tonnes in 2001, withAustralia, Guinea, Brazil, Jamaica and China as the top five producers in ranked
4 Bauxite mining
order [28]. Surface mining accounts for approximately 90% of world bauxiteproduction, the remaining is extracted from deposits located on depths tenmeters and more below the surface. Annual mine production capacity rangesfrom 50,000 tonnes to more than 1 million tonnes. Small scale operations arefound mainly in India and Brazil, while 80% of western world’s mines havecapacities greater than 500,000 tonnes per year [19].
A survey performed by the International Aluminium Institute in 1998 showedthat exporting bauxite mines generated about US$1.4m in revenue per hectaremined, and that a typical mine employed about 200 people for each milliontonnes per year, or 11 employees per hectare mined [9]. World average costsof mining were estimated to US$199515/tOutput, distributed on 43% labor costs,46% operating costs and 11% energy costs [24].
2.2 Bauxite mining - Environmental impacts
Bauxite reserves are substantial, as seen from Table 2.1. Still it contributes toresource depletion, although at a rate which should decrease with time as morealuminium is released from product stocks and recycled into new products. Amore immediate impact is land use and habitat disturbance. Approximately90% of bauxite mining is related to surface mining, requiring removal of topsoil.Today, this topsoil is usually removed and stored for later mine rehabilitation.The area disturbed by bauxite mining increased by 14% to 1,591 hectares from1991 to 1998, with 80% being wildlife habitat. Currently, the annual minerehabilitation rate is 1,256 hectares, which corresponds to 79% of annual dis-turbance. In the same period, efficiency increased from producing an annualoutput of 52 thousand tonnes to 56.5 thousand tonnes. Table 2.2 shows reha-bilitation land use, based on the International Aluminium Institute’s study onbauxite mine rehabilitation from 1998 [9].
Table 2.2: Rehabilitated mine use (1998) [9].
Land Use Share
Native forest 70%Pasture and agriculture 17%Urban development 7%Commercial forest 3%Other 3%
The results are based on mining locations covering 72% of total bauxite pro-duction, and show that 70% is rehabilitated to native forest and 7% to urbanand industrial development, housing and recreational purposes.
Chapter 3
Alumina refining
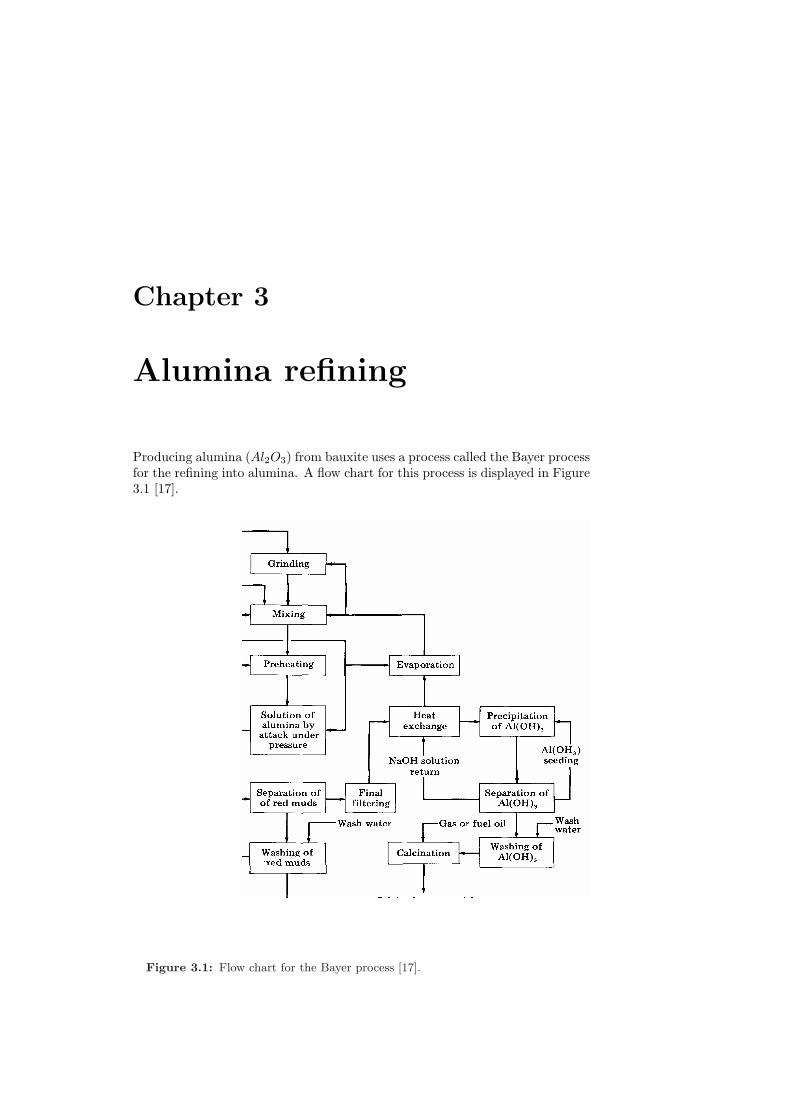
Producing alumina (Al2O3) from bauxite uses a process called the Bayer processfor the refining into alumina. A flow chart for this process is displayed in Figure3.1 [17].
Figure 3.1: Flow chart for the Bayer process [17].
6 Alumina refining
Bauxite is first washed, ground and dissolved in caustic soda (sodium hydroxide)at high pressure and temperature. This becomes a liquid containing a solutionof sodium aluminate and undissolved bauxite residues containing iron, siliconand titanium. Gradually, these residues sink to the bottom of the tank wherethey are removed. These residues are known as ”red mud”. The resulting clearsodium aluminate solution is fed to a precipitator to extract particles of purealumina. These are further passed through a rotary or calciner to drive offchemically combined water. A white powder of pure alumina is the end result[13].
3.1 Alumina production
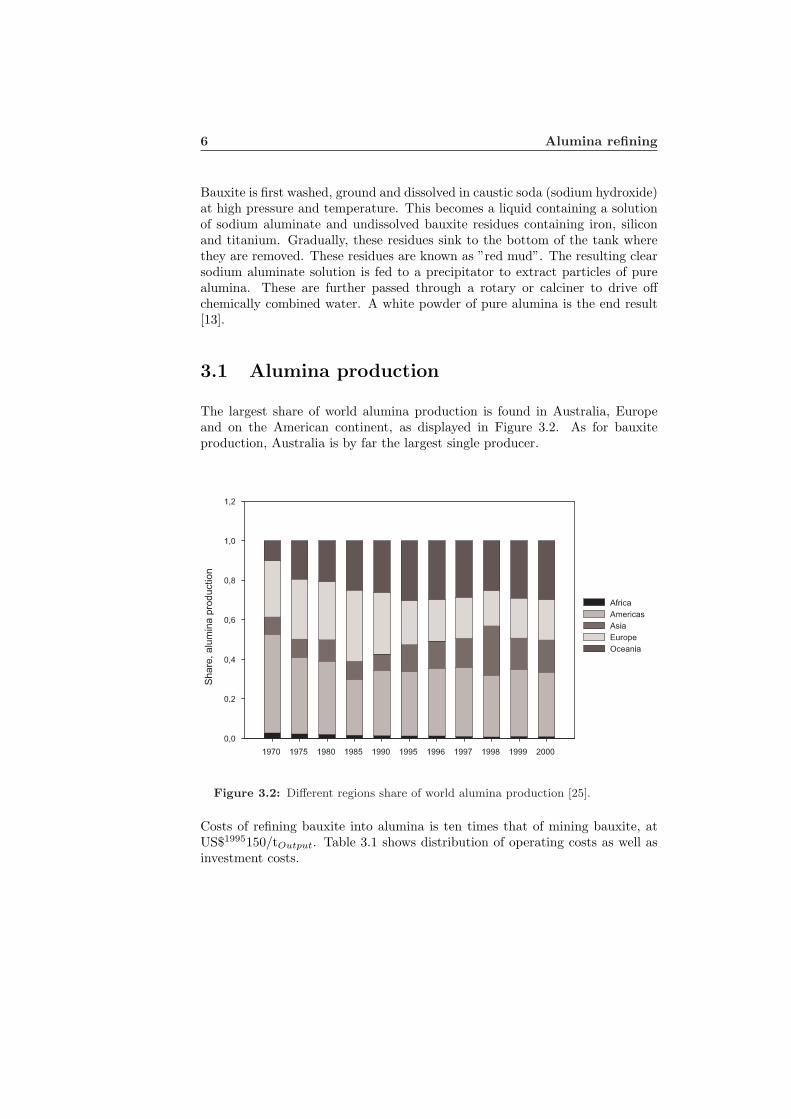
The largest share of world alumina production is found in Australia, Europeand on the American continent, as displayed in Figure 3.2. As for bauxiteproduction, Australia is by far the largest single producer.
Figure 3.2: Different regions share of world alumina production [25].
Costs of refining bauxite into alumina is ten times that of mining bauxite, atUS$1995150/tOutput. Table 3.1 shows distribution of operating costs as well asinvestment costs.
3.1 Alumina production 7
Table 3.1: World average operation and investment costs for alumina refining,in US$1995/tOutput [24].
Total operating costs
Bauxite 34%Labor 13%Electricity 3%Other energy 22%Caustic soda 13%Other operating costs 15%Capital costs
Upgrading $16− $24Brownfield expansion $35Greenfield expansion $70
With regards to operating costs, 59% are related to energy costs and raw ma-terial costs. Only 12% of energy costs are from electricity.
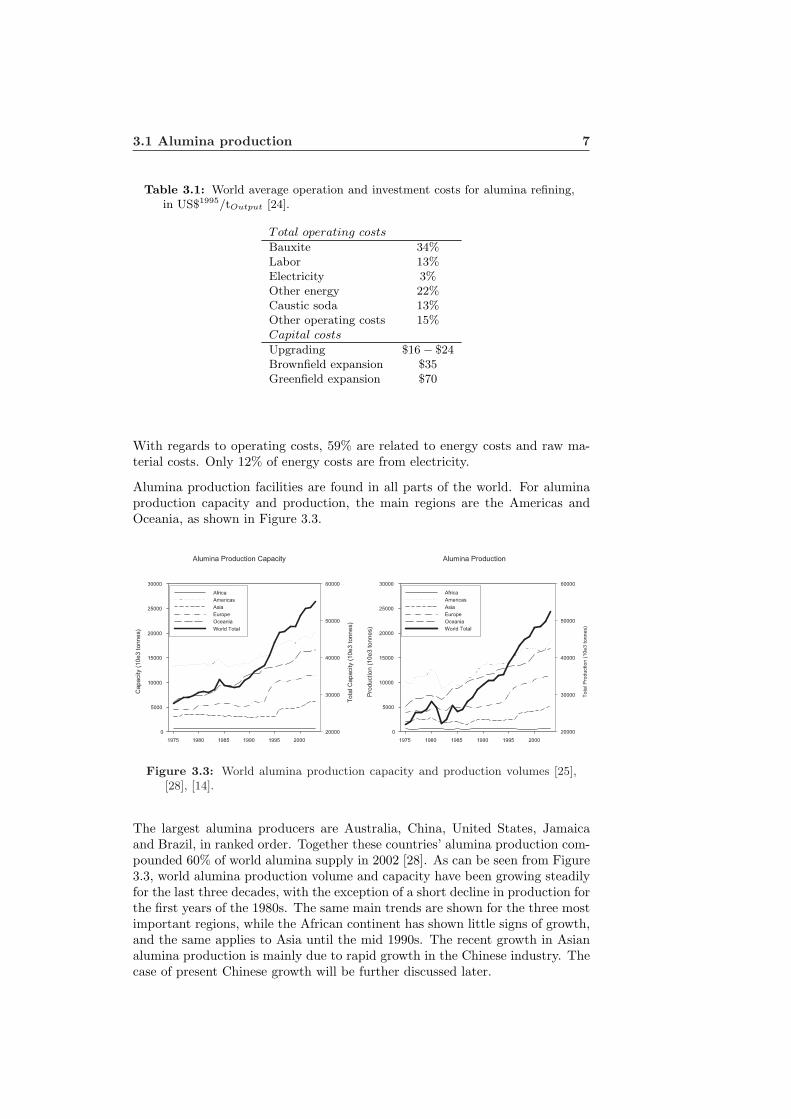
Alumina production facilities are found in all parts of the world. For aluminaproduction capacity and production, the main regions are the Americas andOceania, as shown in Figure 3.3.
Figure 3.3: World alumina production capacity and production volumes [25],[28], [14].
The largest alumina producers are Australia, China, United States, Jamaicaand Brazil, in ranked order. Together these countries’ alumina production com-pounded 60% of world alumina supply in 2002 [28]. As can be seen from Figure3.3, world alumina production volume and capacity have been growing steadilyfor the last three decades, with the exception of a short decline in production forthe first years of the 1980s. The same main trends are shown for the three mostimportant regions, while the African continent has shown little signs of growth,and the same applies to Asia until the mid 1990s. The recent growth in Asianalumina production is mainly due to rapid growth in the Chinese industry. Thecase of present Chinese growth will be further discussed later.
8 Alumina refining
3.2 Alumina refining - Environmental impacts
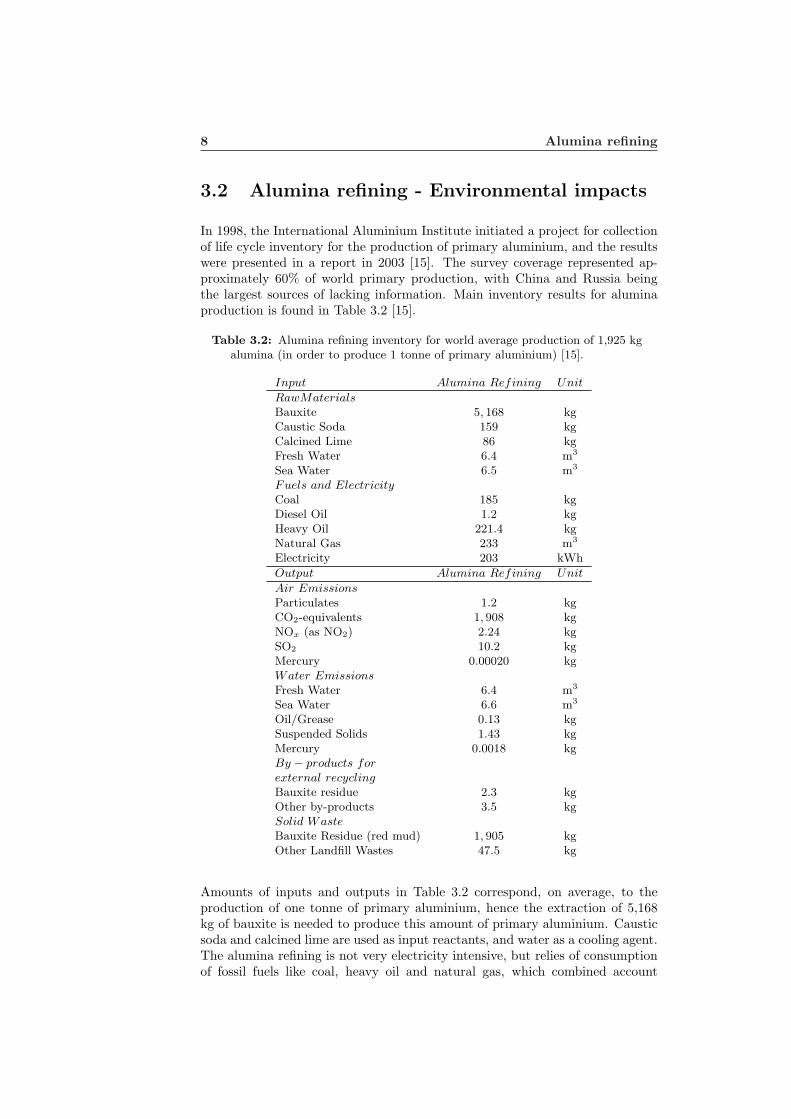
In 1998, the International Aluminium Institute initiated a project for collectionof life cycle inventory for the production of primary aluminium, and the resultswere presented in a report in 2003 [15]. The survey coverage represented ap-proximately 60% of world primary production, with China and Russia beingthe largest sources of lacking information. Main inventory results for aluminaproduction is found in Table 3.2 [15].
Table 3.2: Alumina refining inventory for world average production of 1,925 kgalumina (in order to produce 1 tonne of primary aluminium) [15].
Input Alumina Refining Unit
RawMaterialsBauxite 5, 168 kgCaustic Soda 159 kgCalcined Lime 86 kgFresh Water 6.4 m3
Sea Water 6.5 m3
Fuels and ElectricityCoal 185 kgDiesel Oil 1.2 kgHeavy Oil 221.4 kgNatural Gas 233 m3
Electricity 203 kWh
Output Alumina Refining Unit
Air EmissionsParticulates 1.2 kgCO2-equivalents 1, 908 kgNOx (as NO2) 2.24 kgSO2 10.2 kgMercury 0.00020 kgWater EmissionsFresh Water 6.4 m3
Sea Water 6.6 m3
Oil/Grease 0.13 kgSuspended Solids 1.43 kgMercury 0.0018 kgBy − products forexternal recyclingBauxite residue 2.3 kgOther by-products 3.5 kgSolid WasteBauxite Residue (red mud) 1, 905 kgOther Landfill Wastes 47.5 kg
Amounts of inputs and outputs in Table 3.2 correspond, on average, to theproduction of one tonne of primary aluminium, hence the extraction of 5,168kg of bauxite is needed to produce this amount of primary aluminium. Causticsoda and calcined lime are used as input reactants, and water as a cooling agent.The alumina refining is not very electricity intensive, but relies of consumptionof fossil fuels like coal, heavy oil and natural gas, which combined account
3.2 Alumina refining - Environmental impacts 9
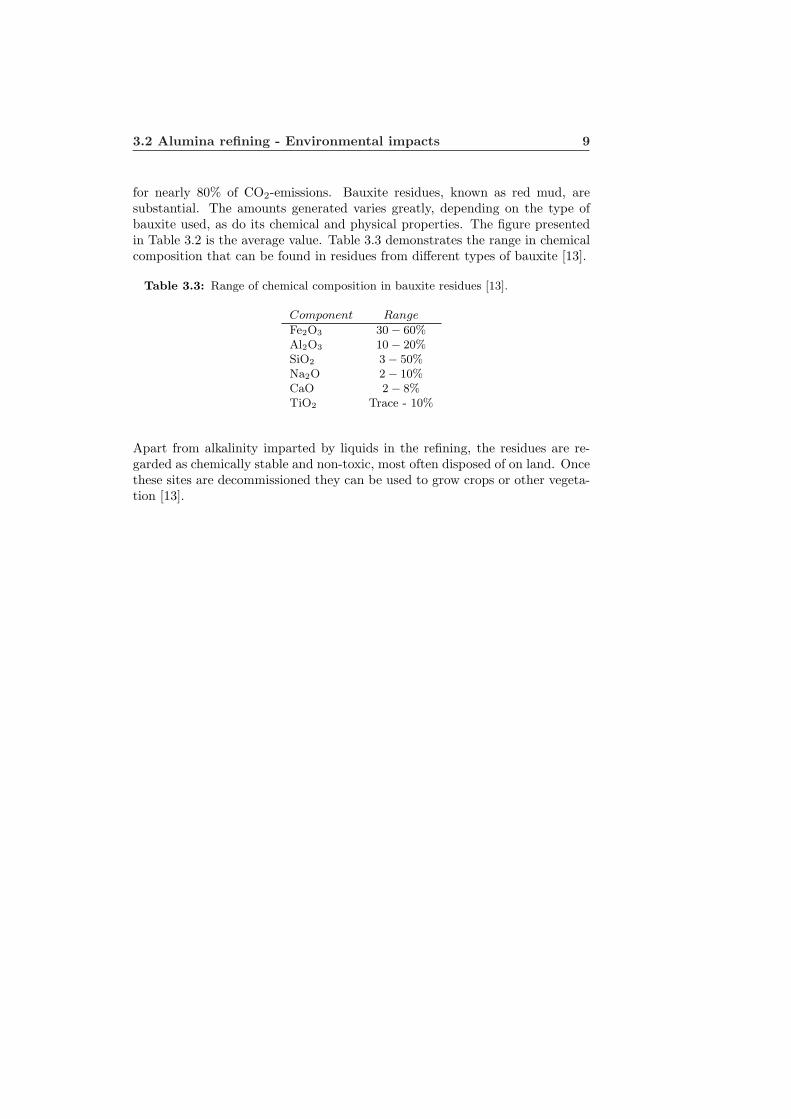
for nearly 80% of CO2-emissions. Bauxite residues, known as red mud, aresubstantial. The amounts generated varies greatly, depending on the type ofbauxite used, as do its chemical and physical properties. The figure presentedin Table 3.2 is the average value. Table 3.3 demonstrates the range in chemicalcomposition that can be found in residues from different types of bauxite [13].
Table 3.3: Range of chemical composition in bauxite residues [13].
Component Range
Fe2O3 30− 60%Al2O3 10− 20%SiO2 3− 50%Na2O 2− 10%CaO 2− 8%TiO2 Trace - 10%
Apart from alkalinity imparted by liquids in the refining, the residues are re-garded as chemically stable and non-toxic, most often disposed of on land. Oncethese sites are decommissioned they can be used to grow crops or other vegeta-tion [13].
Chapter 4
Aluminium smelting
The process used in modern primary aluminium smelting is based on the Hall-Heroult Process. Alumina is dissolved in an electrolytic bath of molten cryolite(sodium aluminium fluoride) within a large carbon or graphite lined steel pot(cell). An electric current is passed through the electrolyte at low voltage, butvery high current. The electric current flows between a carbon anode made ofpetroleum coke and pitch, and a cathode formed by the thick carbon or graphitelining of the pot. Molten aluminium is then deposited at the bottom of the pot[13].
4.1 Technology
All modern primary aluminium smelting plants are based on the Hall-Heroultprocess, invented in 1886. Alumina is reduced into aluminium in electrolyticcells, or pots. The pot consists of a carbon block (anode), formed by a mixtureof coke and pitch, and a steel box lined with carbon (cathode). An electrolyteconsisting of cryolite (Na3AlF6) lies between the anode and the cathode. Othercompounds are also added, among those are aluminium fluoride and calciumfluoride. The latter to lower the electrolyte’s freezing point. This mixture isheated to approximately 980 C. At this point the electrolyte melts and refinedalumina is added. Reduction of aluminium ions produce molten aluminiummetal at the cathode and oxygen at the anode, which react with the carbonanode itself to produce CO2. This process is shown in Equation 4.1.
2Al2O3 + 3C −− > 4Al + 3CO2 (4.1)
There are two main types of aluminium smelting technologies, known as Prebakeand Soderberg. The principal difference between them are the type of anodeused. Soderberg technology uses a continuous anode which is delivered to thecell in the form of a paste, and which bakes in the pot itself. Prebake technology,on the other hand, uses multiple anodes in each cell. These anodes are pre-baked

4.2 Electricity consumption 11
Figure 4.1: Illustrations of Prebake (left) and Soderberg (right) cells for alu-minium smelting [17].
in a separate facility and then suspended in the cell [13]. Figure 4.1 shows anillustration of a Prebake and a Soderberg cell [17].
Soderberg is the oldest technology and is being phased out in favor of Prebaketechnology, which is a more enclosed process. Fugitive emissions are much lower,and are being collected inside the cell and transported to scrubbing systems toremove particulates and gases. All new plants and most plant expansions areusing Prebake technology [13]. Regarding world production, 27% was producedusing Soderberg technology in 2001 [12]. Energy represents about 25% of thecosts associated with primary aluminium production, so the higher electricityconsumption of Soderberg plants make upgrading economically attractive aswell as lowering the indirect emissions caused by electricity production [16],[24]. Table 4.1 shows the worldwide smelter technology distribution as of 2001[12].
Table 4.1: Technology distribution of worldwide primary aluminium production[12].
Technology Prebake Soderberg
PFPB (Point Feeder Prebake) 58%CWPB (Center Work Prebake) 9%SWPB (Side Work Prebake) 6%HSS (Horizontal Stud Soderberg) 9%VSS (Vertical Stud Soderberg) 18%
Total 73% 27%
As can be seen from Table 4.1, 73% of world primary aluminium capacity wasprovided by Prebake technology in 2001.
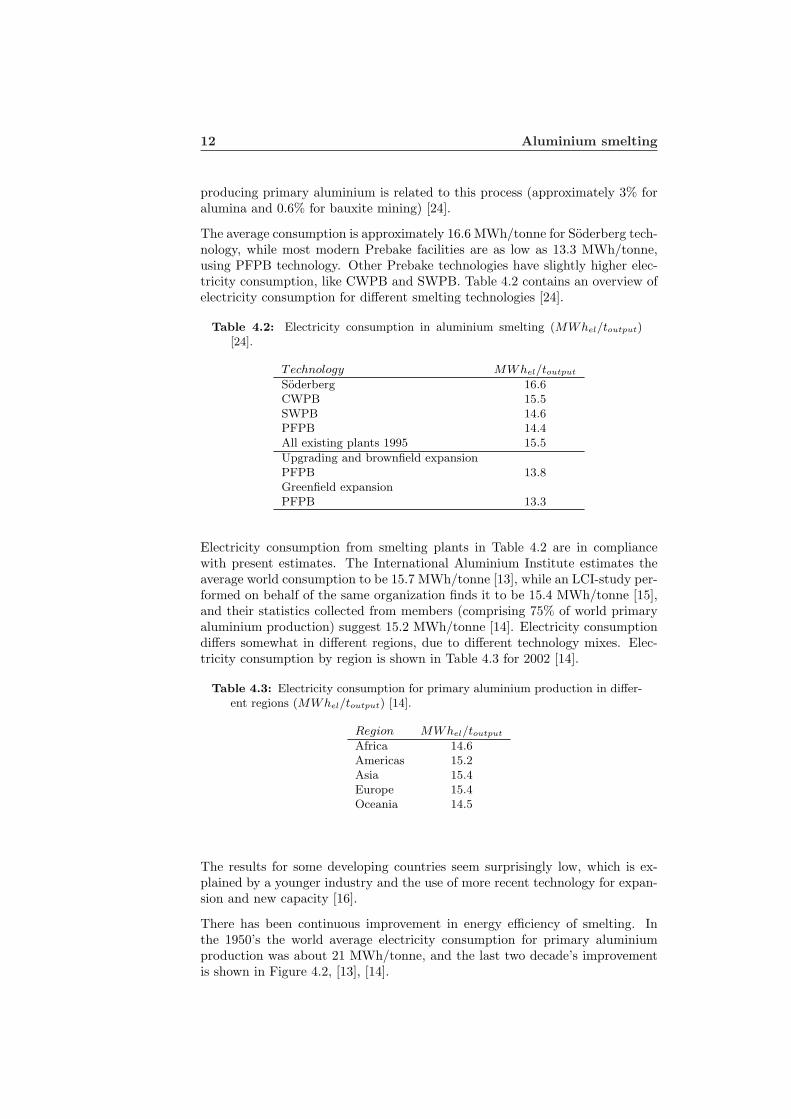
4.2 Electricity consumption
In addition to lower direct emissions from the smelting process, Prebake tech-nology also has lower electricity consumption. Being a very energy intensiveindustry, lowering the consumption for the smelting process is important forthe industry, knowing that approximately 96% of electricity consumption for
12 Aluminium smelting
producing primary aluminium is related to this process (approximately 3% foralumina and 0.6% for bauxite mining) [24].
The average consumption is approximately 16.6 MWh/tonne for Soderberg tech-nology, while most modern Prebake facilities are as low as 13.3 MWh/tonne,using PFPB technology. Other Prebake technologies have slightly higher elec-tricity consumption, like CWPB and SWPB. Table 4.2 contains an overview ofelectricity consumption for different smelting technologies [24].
Table 4.2: Electricity consumption in aluminium smelting (MWhel/toutput)[24].
Technology MWhel/toutput
Soderberg 16.6CWPB 15.5SWPB 14.6PFPB 14.4All existing plants 1995 15.5
Upgrading and brownfield expansionPFPB 13.8Greenfield expansionPFPB 13.3
Electricity consumption from smelting plants in Table 4.2 are in compliancewith present estimates. The International Aluminium Institute estimates theaverage world consumption to be 15.7 MWh/tonne [13], while an LCI-study per-formed on behalf of the same organization finds it to be 15.4 MWh/tonne [15],and their statistics collected from members (comprising 75% of world primaryaluminium production) suggest 15.2 MWh/tonne [14]. Electricity consumptiondiffers somewhat in different regions, due to different technology mixes. Elec-tricity consumption by region is shown in Table 4.3 for 2002 [14].
Table 4.3: Electricity consumption for primary aluminium production in differ-ent regions (MWhel/toutput) [14].
Region MWhel/toutput
Africa 14.6Americas 15.2Asia 15.4Europe 15.4Oceania 14.5
The results for some developing countries seem surprisingly low, which is ex-plained by a younger industry and the use of more recent technology for expan-sion and new capacity [16].
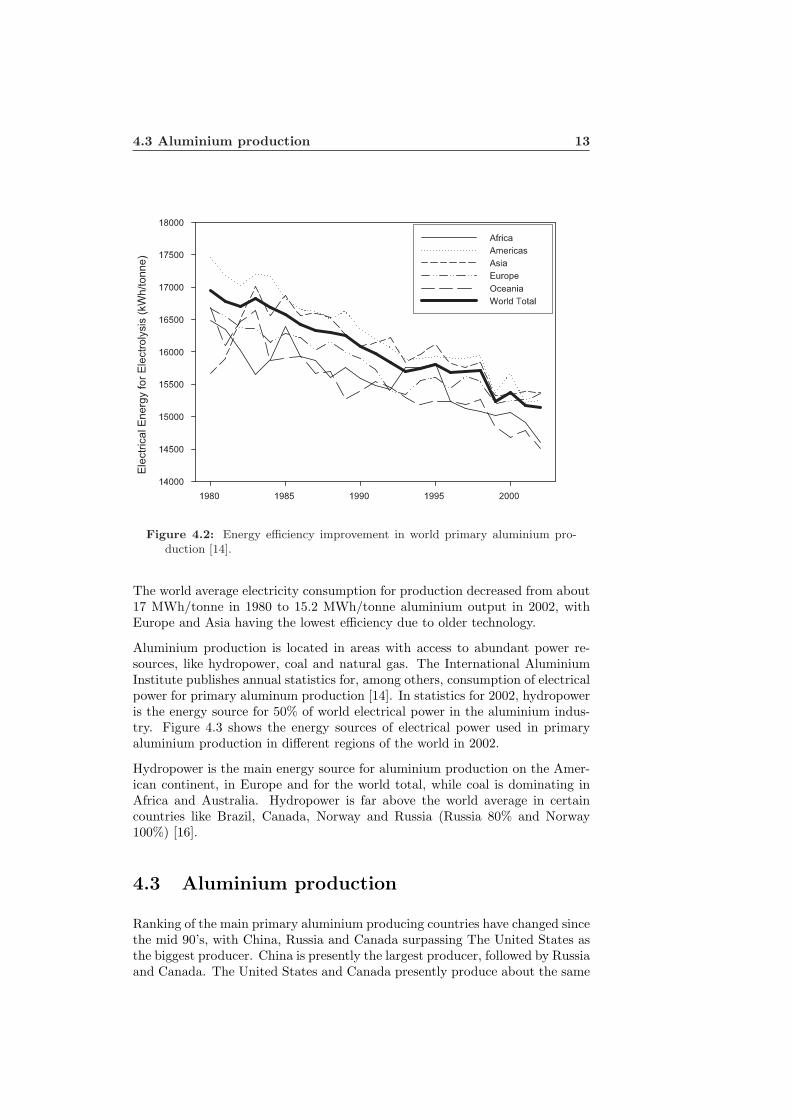
There has been continuous improvement in energy efficiency of smelting. Inthe 1950’s the world average electricity consumption for primary aluminiumproduction was about 21 MWh/tonne, and the last two decade’s improvementis shown in Figure 4.2, [13], [14].
4.3 Aluminium production 13
Figure 4.2: Energy efficiency improvement in world primary aluminium pro-duction [14].
The world average electricity consumption for production decreased from about17 MWh/tonne in 1980 to 15.2 MWh/tonne aluminium output in 2002, withEurope and Asia having the lowest efficiency due to older technology.
Aluminium production is located in areas with access to abundant power re-sources, like hydropower, coal and natural gas. The International AluminiumInstitute publishes annual statistics for, among others, consumption of electricalpower for primary aluminum production [14]. In statistics for 2002, hydropoweris the energy source for 50% of world electrical power in the aluminium indus-try. Figure 4.3 shows the energy sources of electrical power used in primaryaluminium production in different regions of the world in 2002.
Hydropower is the main energy source for aluminium production on the Amer-ican continent, in Europe and for the world total, while coal is dominating inAfrica and Australia. Hydropower is far above the world average in certaincountries like Brazil, Canada, Norway and Russia (Russia 80% and Norway100%) [16].
4.3 Aluminium production
Ranking of the main primary aluminium producing countries have changed sincethe mid 90’s, with China, Russia and Canada surpassing The United States asthe biggest producer. China is presently the largest producer, followed by Russiaand Canada. The United States and Canada presently produce about the same

14 Aluminium smelting
Figure 4.3: Energy sources for electrical power in primary aluminium produc-tion, 2002[14].
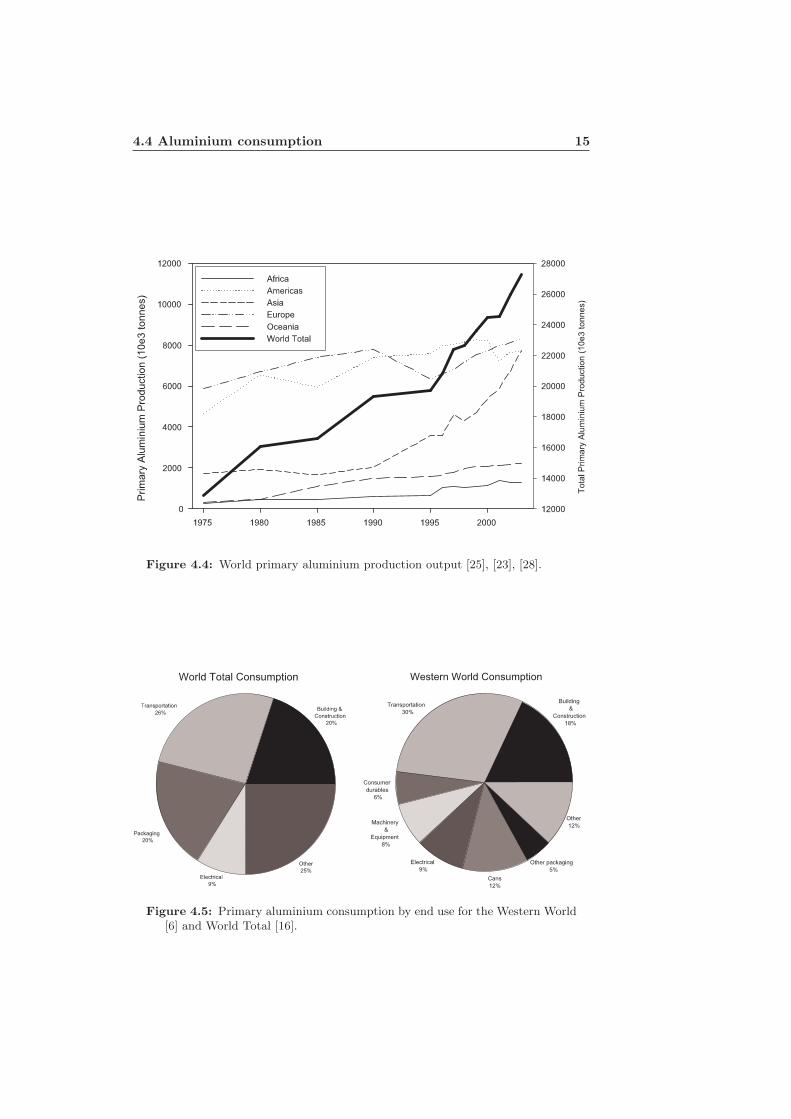
annual output, but while Canada has a positive growth the opposite is the factfor The United States. Together with the next three countries, Australia, Braziland Norway, these constitute 67% of world production output, all of them withseven figured annual production rates. Norway is the smallest of these with anannual output of approximately 1,150 tonnes in 2003 [25]. Primary aluminiumproduction is shown in Figure 4.4 for different regions as well as world total.
From Figure 4.4, Europe has surpassed the American continent and is presentlythe main region for aluminium production. However, looking at the growthrates, Asia will surely change this and become the largest producer, with Chinabeing responsible for this rapid growth. The importance of China’s growth isreflected in the curve for total world production, showing a similar form to thatof Asia.
4.4 Aluminium consumption
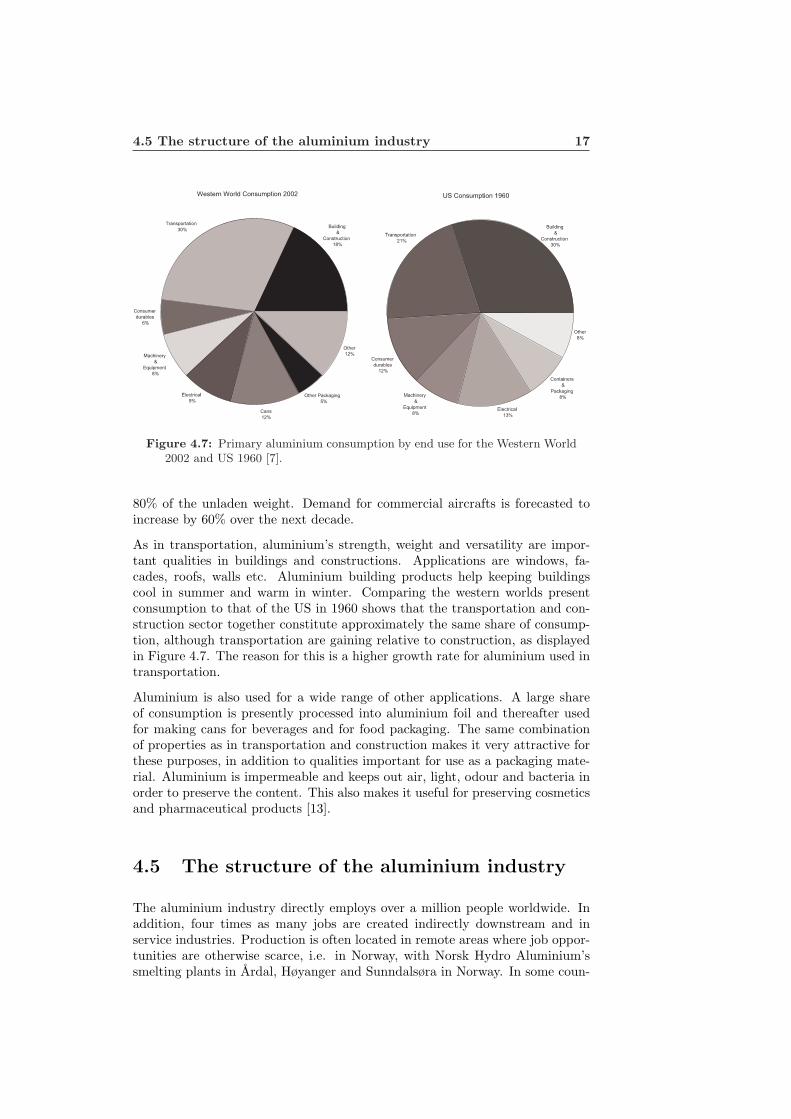
Aluminium is presently the second most commonly used metal and new areas ofapplication raise the consumption, as do increased use in existing applications.Figure 4.5 displays primary aluminium consumption by end use for the WesternWorld and for the world in total.
Both the world total and the western world consumption pattern show approxi-mately the same distribution, due to the western world’s dominant share of totalprimary aluminium consumption, with countries classified as developed coun-tries accounting for nearly 75% of world consumption [25]. The consumption
4.4 Aluminium consumption 15
Figure 4.4: World primary aluminium production output [25], [23], [28].
Figure 4.5: Primary aluminium consumption by end use for the Western World[6] and World Total [16].

16 Aluminium smelting
Figure 4.6: World primary aluminium consumption [25], [28], [23].
distribution for different regions is shown in Figure 4.6.
The regions with the highest consumption are Asia, Europe and the Americas.A drop in world consumption is shown for 2001. The same is true for worldproduction, as shown in Figure 4.4, although the decrease is smaller. However,the gap between production and consumption has been growing in the recentyears, leading to larger stocks. Without strong economic growth inventoriesmay not decline [23]. The aluminium industry expects aluminium consumptionto increase further, and their forecasts are relatively in accordance with eachother on a long term horizon. On a global basis, Hydro Aluminium estimatesthe long term annual growth rate for aluminium consumption to be 3% in onestatement [27], and as high as 4%-4.5% in another [22]. However, other sourcesagree on something in between, closer to 3%-3.5% [23], [3].
The most important use of aluminium is in transportation and construction,which presently make up nearly half of total consumption. The extensive usein these applications is due to the favorable material properties. Its low weightallows for weight reduction and smaller engines. An aluminium body on a smallcommercial vehicle may weigh 45% less than a corresponding steel body andtherefore saves fuel consumption and emissions, as each kilogram of automotivealuminium replacing traditional higher density materials can save a net 20 kilo-grams of CO2 equivalents over the lifetime of the vehicle. At the same time it isstrong and also absorbs kinetic energy well, making it safer for passengers in caseof a collision. Maintenance need is lower and lifetime longer since aluminiumhas a corrosion rate 1/25th that of high-resistance steel. Aluminium is alsowidely used in the aerospace industry, for sea freight and rail transportation aswell. Modern aircrafts use aluminium as the main material, comprising about
4.5 The structure of the aluminium industry 17
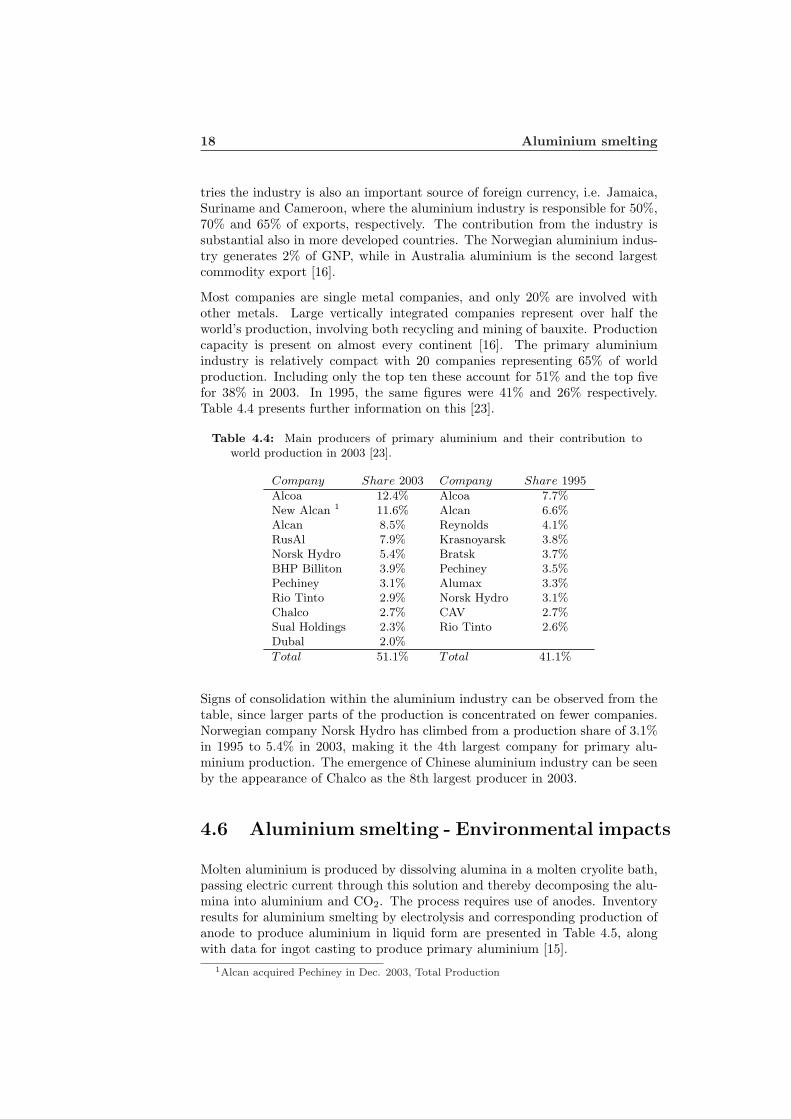
Figure 4.7: Primary aluminium consumption by end use for the Western World2002 and US 1960 [7].
80% of the unladen weight. Demand for commercial aircrafts is forecasted toincrease by 60% over the next decade.
As in transportation, aluminium’s strength, weight and versatility are impor-tant qualities in buildings and constructions. Applications are windows, fa-cades, roofs, walls etc. Aluminium building products help keeping buildingscool in summer and warm in winter. Comparing the western worlds presentconsumption to that of the US in 1960 shows that the transportation and con-struction sector together constitute approximately the same share of consump-tion, although transportation are gaining relative to construction, as displayedin Figure 4.7. The reason for this is a higher growth rate for aluminium used intransportation.
Aluminium is also used for a wide range of other applications. A large shareof consumption is presently processed into aluminium foil and thereafter usedfor making cans for beverages and for food packaging. The same combinationof properties as in transportation and construction makes it very attractive forthese purposes, in addition to qualities important for use as a packaging mate-rial. Aluminium is impermeable and keeps out air, light, odour and bacteria inorder to preserve the content. This also makes it useful for preserving cosmeticsand pharmaceutical products [13].
4.5 The structure of the aluminium industry
The aluminium industry directly employs over a million people worldwide. Inaddition, four times as many jobs are created indirectly downstream and inservice industries. Production is often located in remote areas where job oppor-tunities are otherwise scarce, i.e. in Norway, with Norsk Hydro Aluminium’ssmelting plants in Ardal, Høyanger and Sunndalsøra in Norway. In some coun-
18 Aluminium smelting
tries the industry is also an important source of foreign currency, i.e. Jamaica,Suriname and Cameroon, where the aluminium industry is responsible for 50%,70% and 65% of exports, respectively. The contribution from the industry issubstantial also in more developed countries. The Norwegian aluminium indus-try generates 2% of GNP, while in Australia aluminium is the second largestcommodity export [16].
Most companies are single metal companies, and only 20% are involved withother metals. Large vertically integrated companies represent over half theworld’s production, involving both recycling and mining of bauxite. Productioncapacity is present on almost every continent [16]. The primary aluminiumindustry is relatively compact with 20 companies representing 65% of worldproduction. Including only the top ten these account for 51% and the top fivefor 38% in 2003. In 1995, the same figures were 41% and 26% respectively.Table 4.4 presents further information on this [23].
Table 4.4: Main producers of primary aluminium and their contribution toworld production in 2003 [23].
Company Share 2003 Company Share 1995
Alcoa 12.4% Alcoa 7.7%New Alcan 1 11.6% Alcan 6.6%Alcan 8.5% Reynolds 4.1%RusAl 7.9% Krasnoyarsk 3.8%Norsk Hydro 5.4% Bratsk 3.7%BHP Billiton 3.9% Pechiney 3.5%Pechiney 3.1% Alumax 3.3%Rio Tinto 2.9% Norsk Hydro 3.1%Chalco 2.7% CAV 2.7%Sual Holdings 2.3% Rio Tinto 2.6%Dubal 2.0%
Total 51.1% Total 41.1%
Signs of consolidation within the aluminium industry can be observed from thetable, since larger parts of the production is concentrated on fewer companies.Norwegian company Norsk Hydro has climbed from a production share of 3.1%in 1995 to 5.4% in 2003, making it the 4th largest company for primary alu-minium production. The emergence of Chinese aluminium industry can be seenby the appearance of Chalco as the 8th largest producer in 2003.
4.6 Aluminium smelting - Environmental impacts
Molten aluminium is produced by dissolving alumina in a molten cryolite bath,passing electric current through this solution and thereby decomposing the alu-mina into aluminium and CO2. The process requires use of anodes. Inventoryresults for aluminium smelting by electrolysis and corresponding production ofanode to produce aluminium in liquid form are presented in Table 4.5, alongwith data for ingot casting to produce primary aluminium [15].
1Alcan acquired Pechiney in Dec. 2003, Total Production

4.6 Aluminium smelting - Environmental impacts 19
Table 4.5: Inventory for world average production of 1,000 kg primary alu-minium [15], [10].
Input Anode Electrolysis Ingot Unit
RawMaterialsAlumina 1, 925 kgPetrol Coke 349 kgPitch 92 kgAluminium Fluoride 17.4 kgCathode Carbon 6.1 kgAlloy additives 20 kgChlorine 0.068 kgFresh Water 0.5 2.95 3.15 m3
Sea Water 0.001 20.8 0.2 m3
Refractory Materials 5.5 6 kgSteel (for anodes) 1.4 kgSteel (for cathodes) 5.5 kgFuels and ElectricityCoal 0.9 kgDiesel Oil 1.4 0.1 kgHeavy Oil 6.2 10 kgNatural Gas 23 52 m3
Electricity 62 15, 365 81 kWh
Output Anode Electrolysis Ingot Unit
Air EmissionsFluoride, Gaseous (as F) 0.02 0.55 kgFluoride Particulate (as F) 0.004 0.5 kgParticulates 0.1 3.3 0.08 kgCO2 (eq) 374 1, 626 368 kgNOx (as NO2) 0.13 0.35 0.12 kgSO2 0.7 13.6 0.2 kgTotal PAH 0.02 0.13 kgBaP 0.0001 0.005 kgCF4 0.22 kgC2F6 0.021 kgHCl 0.067 kgWater EmissionsFresh Water 3.2 3.8 m3
Sea Water 20.9 m3
Fluoride (as F) 0.2 kgOil/Grease 0.008 0.009 kgPAH (6 Borneff components) 0, 00377 kgSuspended Solids 0.21 0.02 kgBy − products forexternal recyclingDross 13 kgFilter Dust 0.57 kgOther by-products 2.8 5.1 kgRefractory Material 3.1 0.5 0.5 kgScrap sold 2.2 kgSPL Carbon fuel/reuse 9.9 kgSPL Refr.bricks/reuse 5.5 kgSteel 1.7 6.9 kg
20 Aluminium smelting
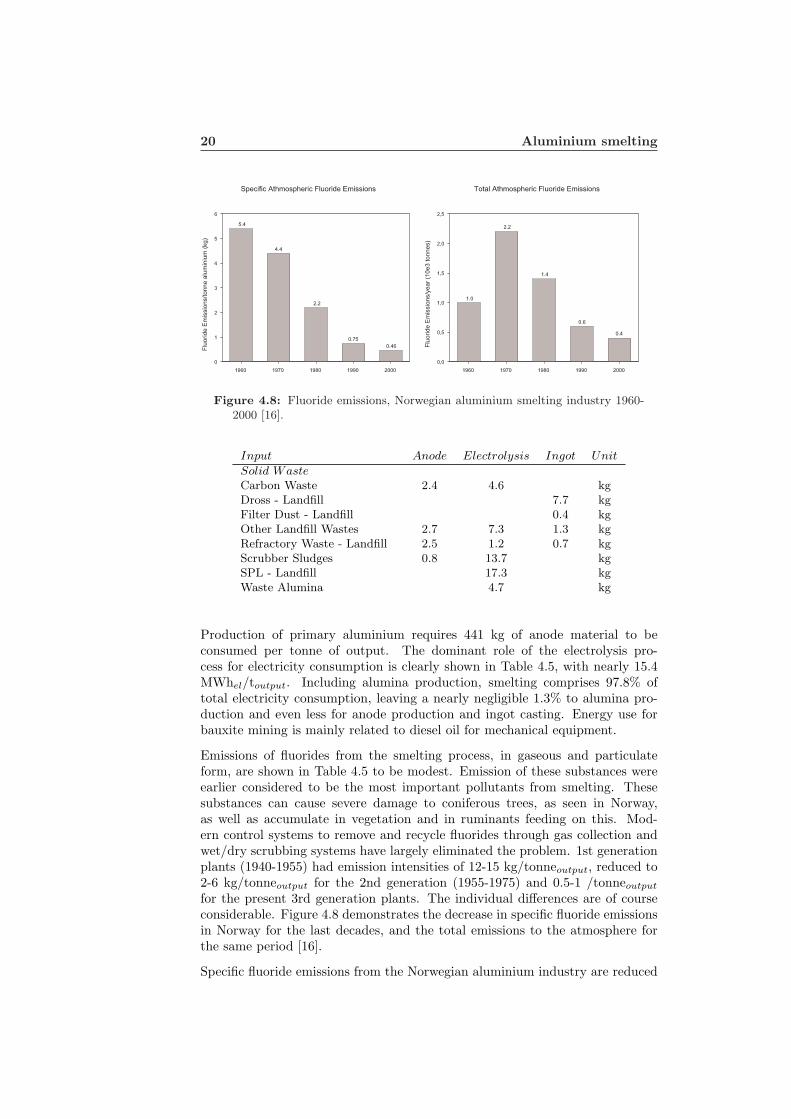
Figure 4.8: Fluoride emissions, Norwegian aluminium smelting industry 1960-2000 [16].
Input Anode Electrolysis Ingot Unit
Solid WasteCarbon Waste 2.4 4.6 kgDross - Landfill 7.7 kgFilter Dust - Landfill 0.4 kgOther Landfill Wastes 2.7 7.3 1.3 kgRefractory Waste - Landfill 2.5 1.2 0.7 kgScrubber Sludges 0.8 13.7 kgSPL - Landfill 17.3 kgWaste Alumina 4.7 kg
Production of primary aluminium requires 441 kg of anode material to beconsumed per tonne of output. The dominant role of the electrolysis pro-cess for electricity consumption is clearly shown in Table 4.5, with nearly 15.4MWhel/toutput. Including alumina production, smelting comprises 97.8% oftotal electricity consumption, leaving a nearly negligible 1.3% to alumina pro-duction and even less for anode production and ingot casting. Energy use forbauxite mining is mainly related to diesel oil for mechanical equipment.
Emissions of fluorides from the smelting process, in gaseous and particulateform, are shown in Table 4.5 to be modest. Emission of these substances wereearlier considered to be the most important pollutants from smelting. Thesesubstances can cause severe damage to coniferous trees, as seen in Norway,as well as accumulate in vegetation and in ruminants feeding on this. Mod-ern control systems to remove and recycle fluorides through gas collection andwet/dry scrubbing systems have largely eliminated the problem. 1st generationplants (1940-1955) had emission intensities of 12-15 kg/tonneoutput, reduced to2-6 kg/tonneoutput for the 2nd generation (1955-1975) and 0.5-1 /tonneoutput
for the present 3rd generation plants. The individual differences are of courseconsiderable. Figure 4.8 demonstrates the decrease in specific fluoride emissionsin Norway for the last decades, and the total emissions to the atmosphere forthe same period [16].
Specific fluoride emissions from the Norwegian aluminium industry are reduced

4.6 Aluminium smelting - Environmental impacts 21
to approximately 8.5% of the 1960 level. The impacts from this are reflectedin the reduction in total fluoride emissions for the same period, as aluminiumproduction increased from 185,000 tonnes in 1960 to 1,030,000 tonnes in 2000.Comparing fluoride emissions in Norwegian aluminium industry with the worldaverage figures in Table 4.5 shows an emission intensity less than half that ofworld production.
Present and recent concern about environmental impacts from aluminium smelt-ing is related to reduction of Greenhouse Gases (GHG).
Chapter 5
Greenhouse gases
In 1995, about 1% of worldwide energy related CO2 emissions were caused bythe production of primary aluminium [24]. Emissions of greenhouse gases aremainly related to the smelting process.
5.1 PFC emissions
Primary aluminium production has been identified as a major anthropogenicsource of two perfluorocarbon compounds (PFCs), tetrafluoromethane (CF4)and hexafluoroethane (C2F6). These compounds are very potent global warm-ing gases with long atmospheric lifetimes. Global warming potential, measuredin CO2 equivalents, is 6,500 and 9,200, respectively. Emission intensity of (CF4)is approximately ten times that of (C2F6). No measurable amounts of thesecompounds are generated during normal operating conditions, but forms dur-ing brief upsets conditions when the level of aluminium oxide in the electrolyticcell drops too low and the electrolytic bath itself begins to undergo electrolysis.These effects are known as ”anode effects”, and PFC emissions are directly pro-portional to anode effect intensity. To counter this, the aluminium industry hastaken measures towards reducing anode effect frequency and duration throughbetter process control. These measures have proven effective, with significantemissions reductions. The International Aluminium Institute carries out annualsurveys of PFC emissions for the purpose of tracking and inducing improve-ments, as well as for benchmarking between individual plants. In 2000, 66% ofworld production was covered in the survey, the remaining being assessed bytechnology and production weighted estimates. Table 5.1 shows the worldwideimprovement in PFC emissions from aluminium smelting in the period 1990 to2000 [11].
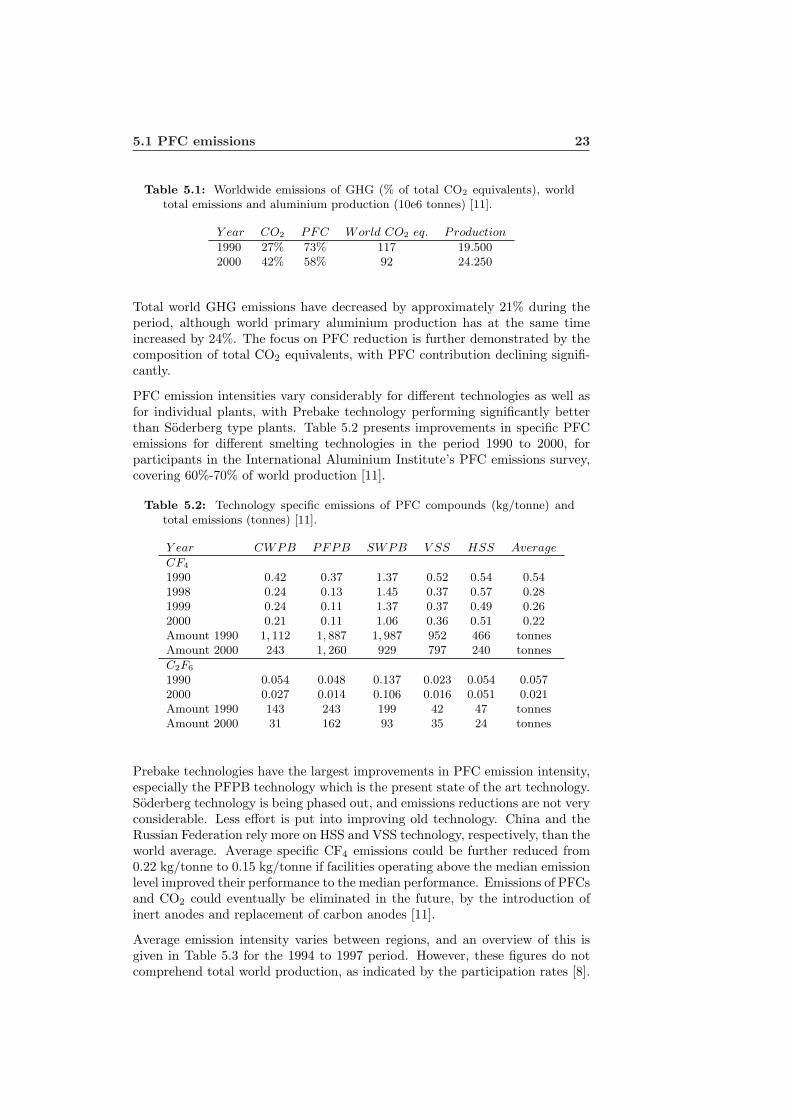
5.1 PFC emissions 23
Table 5.1: Worldwide emissions of GHG (% of total CO2 equivalents), worldtotal emissions and aluminium production (10e6 tonnes) [11].
Y ear CO2 PFC World CO2 eq. Production
1990 27% 73% 117 19.5002000 42% 58% 92 24.250
Total world GHG emissions have decreased by approximately 21% during theperiod, although world primary aluminium production has at the same timeincreased by 24%. The focus on PFC reduction is further demonstrated by thecomposition of total CO2 equivalents, with PFC contribution declining signifi-cantly.
PFC emission intensities vary considerably for different technologies as well asfor individual plants, with Prebake technology performing significantly betterthan Soderberg type plants. Table 5.2 presents improvements in specific PFCemissions for different smelting technologies in the period 1990 to 2000, forparticipants in the International Aluminium Institute’s PFC emissions survey,covering 60%-70% of world production [11].
Table 5.2: Technology specific emissions of PFC compounds (kg/tonne) andtotal emissions (tonnes) [11].
Y ear CWPB PFPB SWPB V SS HSS Average
CF4
1990 0.42 0.37 1.37 0.52 0.54 0.541998 0.24 0.13 1.45 0.37 0.57 0.281999 0.24 0.11 1.37 0.37 0.49 0.262000 0.21 0.11 1.06 0.36 0.51 0.22Amount 1990 1, 112 1, 887 1, 987 952 466 tonnesAmount 2000 243 1, 260 929 797 240 tonnes
C2F6
1990 0.054 0.048 0.137 0.023 0.054 0.0572000 0.027 0.014 0.106 0.016 0.051 0.021Amount 1990 143 243 199 42 47 tonnesAmount 2000 31 162 93 35 24 tonnes
Prebake technologies have the largest improvements in PFC emission intensity,especially the PFPB technology which is the present state of the art technology.Soderberg technology is being phased out, and emissions reductions are not veryconsiderable. Less effort is put into improving old technology. China and theRussian Federation rely more on HSS and VSS technology, respectively, than theworld average. Average specific CF4 emissions could be further reduced from0.22 kg/tonne to 0.15 kg/tonne if facilities operating above the median emissionlevel improved their performance to the median performance. Emissions of PFCsand CO2 could eventually be eliminated in the future, by the introduction ofinert anodes and replacement of carbon anodes [11].
Average emission intensity varies between regions, and an overview of this isgiven in Table 5.3 for the 1994 to 1997 period. However, these figures do notcomprehend total world production, as indicated by the participation rates [8].
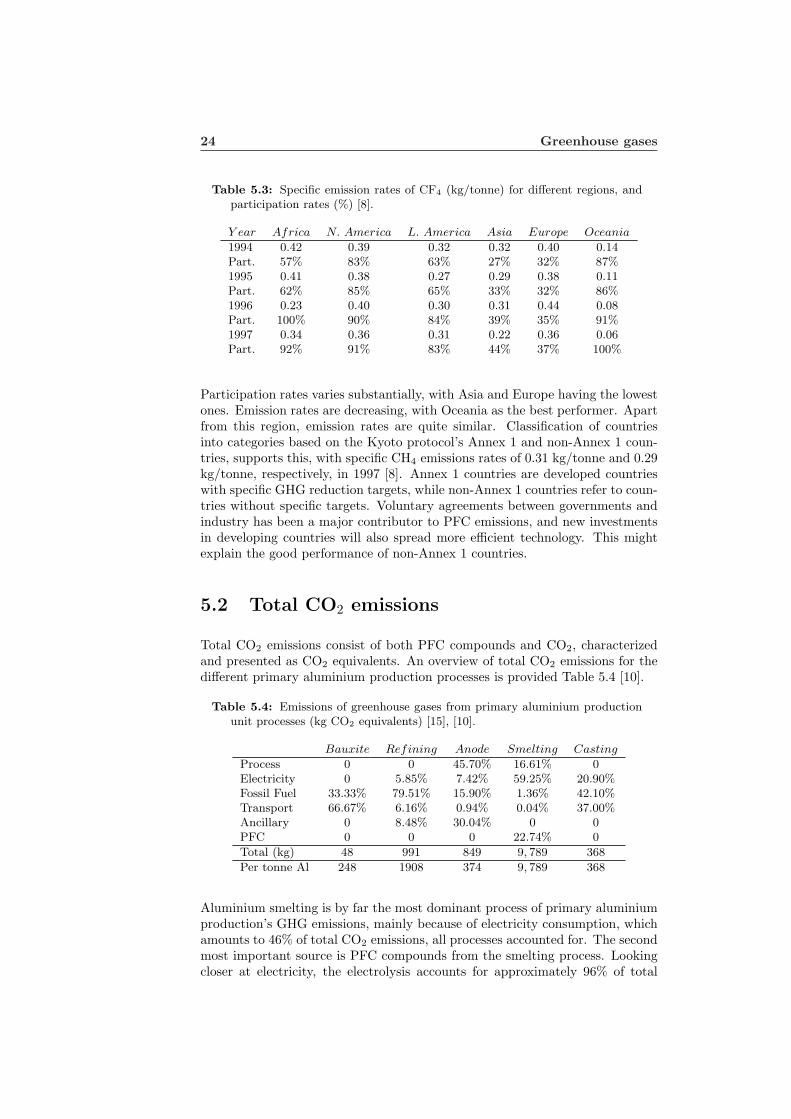
24 Greenhouse gases
Table 5.3: Specific emission rates of CF4 (kg/tonne) for different regions, andparticipation rates (%) [8].
Y ear Africa N. America L. America Asia Europe Oceania
1994 0.42 0.39 0.32 0.32 0.40 0.14Part. 57% 83% 63% 27% 32% 87%1995 0.41 0.38 0.27 0.29 0.38 0.11Part. 62% 85% 65% 33% 32% 86%1996 0.23 0.40 0.30 0.31 0.44 0.08Part. 100% 90% 84% 39% 35% 91%1997 0.34 0.36 0.31 0.22 0.36 0.06Part. 92% 91% 83% 44% 37% 100%
Participation rates varies substantially, with Asia and Europe having the lowestones. Emission rates are decreasing, with Oceania as the best performer. Apartfrom this region, emission rates are quite similar. Classification of countriesinto categories based on the Kyoto protocol’s Annex 1 and non-Annex 1 coun-tries, supports this, with specific CH4 emissions rates of 0.31 kg/tonne and 0.29kg/tonne, respectively, in 1997 [8]. Annex 1 countries are developed countrieswith specific GHG reduction targets, while non-Annex 1 countries refer to coun-tries without specific targets. Voluntary agreements between governments andindustry has been a major contributor to PFC emissions, and new investmentsin developing countries will also spread more efficient technology. This mightexplain the good performance of non-Annex 1 countries.
5.2 Total CO2 emissions
Total CO2 emissions consist of both PFC compounds and CO2, characterizedand presented as CO2 equivalents. An overview of total CO2 emissions for thedifferent primary aluminium production processes is provided Table 5.4 [10].
Table 5.4: Emissions of greenhouse gases from primary aluminium productionunit processes (kg CO2 equivalents) [15], [10].
Bauxite Refining Anode Smelting Casting
Process 0 0 45.70% 16.61% 0Electricity 0 5.85% 7.42% 59.25% 20.90%Fossil Fuel 33.33% 79.51% 15.90% 1.36% 42.10%Transport 66.67% 6.16% 0.94% 0.04% 37.00%Ancillary 0 8.48% 30.04% 0 0PFC 0 0 0 22.74% 0
Total (kg) 48 991 849 9, 789 368
Per tonne Al 248 1908 374 9, 789 368
Aluminium smelting is by far the most dominant process of primary aluminiumproduction’s GHG emissions, mainly because of electricity consumption, whichamounts to 46% of total CO2 emissions, all processes accounted for. The secondmost important source is PFC compounds from the smelting process. Lookingcloser at electricity, the electrolysis accounts for approximately 96% of total
5.2 Total CO2 emissions 25
CO2 emissions from electricity production. Specific emissions from electricityproduction are expected to decrease in the future, and there are three mainreasons for this [24]:
• Lower CO2 emission rates for electricity generated from fossil fuels
• Replacement of old Soderberg plants with more energy efficient PFPBtechnology (see Table 4.2)
• The production of primary aluminium is being shifted to regions withlarger share of electricity production relying on hydropower
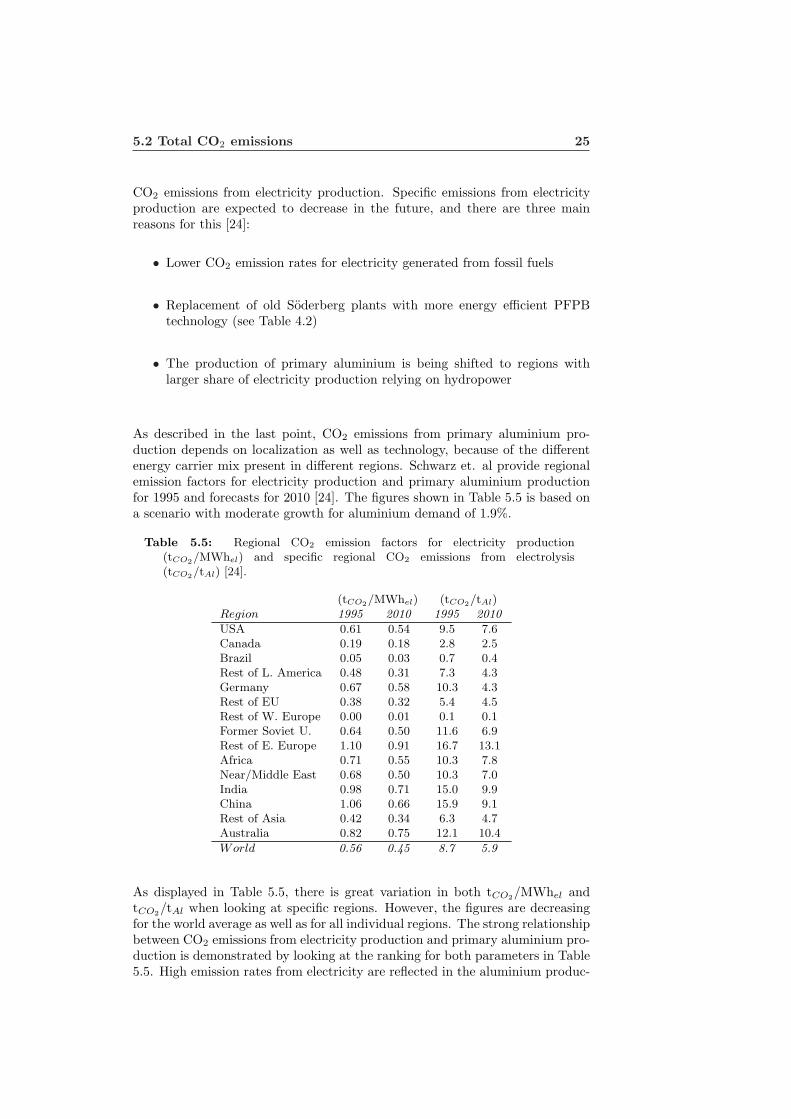
As described in the last point, CO2 emissions from primary aluminium pro-duction depends on localization as well as technology, because of the differentenergy carrier mix present in different regions. Schwarz et. al provide regionalemission factors for electricity production and primary aluminium productionfor 1995 and forecasts for 2010 [24]. The figures shown in Table 5.5 is based ona scenario with moderate growth for aluminium demand of 1.9%.
Table 5.5: Regional CO2 emission factors for electricity production(tCO2/MWhel) and specific regional CO2 emissions from electrolysis(tCO2/tAl) [24].
(tCO2/MWhel) (tCO2/tAl)Region 1995 2010 1995 2010
USA 0.61 0.54 9.5 7.6Canada 0.19 0.18 2.8 2.5Brazil 0.05 0.03 0.7 0.4Rest of L. America 0.48 0.31 7.3 4.3Germany 0.67 0.58 10.3 4.3Rest of EU 0.38 0.32 5.4 4.5Rest of W. Europe 0.00 0.01 0.1 0.1Former Soviet U. 0.64 0.50 11.6 6.9Rest of E. Europe 1.10 0.91 16.7 13.1Africa 0.71 0.55 10.3 7.8Near/Middle East 0.68 0.50 10.3 7.0India 0.98 0.71 15.0 9.9China 1.06 0.66 15.9 9.1Rest of Asia 0.42 0.34 6.3 4.7Australia 0.82 0.75 12.1 10.4
World 0.56 0.45 8.7 5.9
As displayed in Table 5.5, there is great variation in both tCO2/MWhel andtCO2/tAl when looking at specific regions. However, the figures are decreasingfor the world average as well as for all individual regions. The strong relationshipbetween CO2 emissions from electricity production and primary aluminium pro-duction is demonstrated by looking at the ranking for both parameters in Table5.5. High emission rates from electricity are reflected in the aluminium produc-

26 Greenhouse gases
tion. China is presently the world’s largest producer of primary aluminium, andhas the largest specific emissions. The fourth largest producer is the US, andbecause of its reliance on fossil fuels the country ranks at the level of the FormerSoviet Union, Africa and the Middle East concerning tCO2/MWhel. Brazil andthe region ”Rest of Western Europe” have by far the lowest emissions, due totheir dominant proportion of electricity production from hydropower. Canada,being the third largest producer, is also the third best performer in terms ofspecific emissions.
Chapter 6
Recycling
Aluminium’s material properties make it excellent for recycling, contributingto more efficient use of energy resources and raw materials. Energy demandof recycling is only 5%-10% that of primary aluminium production, reducingenvironmental damage from electricity production as well as from raw materialsextraction and processing. All aluminium can be melted and recycled repeat-edly without downcycling and property losses. Therefore it also has significanteconomic value, and it is recognized as the most cost effective material to recy-cle. The extensive use of aluminium for more applications as well as increaseduse in existing ones, leads to generation of increasing volumes in stocks, whichis thereby represents a considerate source for future aluminium demand. Therecovery and use of secondary aluminium is already an important component ofmetal supply in several countries [16], [20], [2].
The aluminium recycling industry is growing faster than the primary produc-tion industry, at an estimated annual rate of more than 4%, and already pro-duces substantial outputs from both old and new scrap [27]. The EuropeanAluminium Association (EAA) reports an annual production of recycled alu-minium of nearly 10 million tonnes worldwide, which is more than one third ofworld demand [2]. Recycled material’s share of consumption will increase fur-ther in the years to come [27]. The International Aluminium Institute reportedthe sources of scrap recycling in 1998 as shown in Table 6.1 [13].
Table 6.1: Sources of aluminium recycling from old and new scrap (1998)[13].
Source Share
Transport 38%Building 32%Packaging 17%Other 13%
The transport sector is the main source of aluminium for recycling, a positionthat is likely to be strengthened by the passing of the End-of-Life directive(ELV) into European law in 2000. This directive imposes quantitative recycling
28 Recycling
requirements for the automotive industry, as outlined in Table 6.2.
Table 6.2: Recycling requirements in the ELV directive (by weight) [27].
Y ear Material Energy Disposalrecovery recovery
2006 80% 5% 15%2015 85% 10% 5%
In accordance with future requirements, the recycling ability in new cars shouldbe 95% from 2005. In Europe, the average use of aluminium car components isestimated to increase from 85 kg per car in 1998 to 180 kg per car in 2010, fur-ther enhancing recycled amounts from this industry [27]. Recycled aluminiumalready accounts for 85% in auto castings and 11% in sheet and extrusions,according to 1999 figures [10]. However, in terms of environmental gains, theELV directive may contribute to counter the automotive industries efforts toreduce weight, because of the per weight recyclability requirement. A car withlight weight recyclable materials might not pass the legislation, while the samecar with heavier recyclables (95% of total weight) will, given the same amountof non-recyclables [2].
Aluminium is widely used in construction, as displayed in Table 6.1. Reportshave suggested recycling rates of approximately 95% in selected West Europeancountries [2]. This figure seems very high, and Hydro Aluminium estimatesthe same recycling rate to be 69% in 2010, for Western Europe in general [27].However, there is no doubt that considerable amounts of aluminium is tied upin building stocks, and that this will continue to be a major source of recycledmaterial.
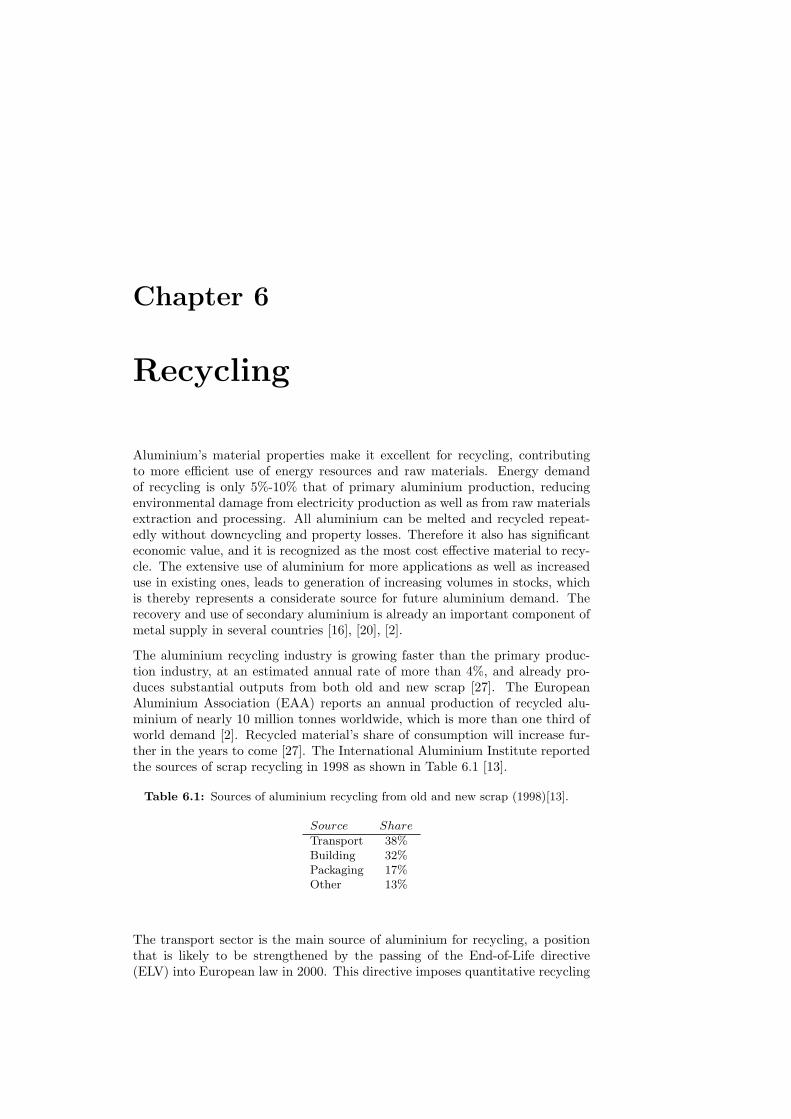
Aluminium scrap is a valuable resource, and the competition for this materialis increasing, pushing secondary material prices. China is an important andgrowing net importer of scrap, taking considerable amounts out of the US andEuropean scrap markets. Low Chinese labor costs make scrap separation moreeconomical [6], [27]. The increased competition is leading to a restructuring ofthe recycling industry, from small facilities to fewer and larger units. Figure 6.1displays this development for the European secondary industry, and also showsthe growth of secondary material processing capacity for Hydro Aluminium [27].
From 1995 to 2000 the number of small refiners with annual capacities below1,000 tonnes were reduced to nearly one third, while the largest facilities in-creased by more than a factor of 3. Combined, this increases transportationneed, although it also increases efficiency. This trend is likely to continue, since2/3 of process scrap is bound in closed loops with customers, making it harderfor small independent refiners to acquire scrap material [27].
The increasing importance of secondary aluminium is also shown in Figure 6.1,using Hydro Aluminium as an example. From constituting less than 1/3 thatof primary production capacity in 1992, secondary production capacity’s highergrowth rate made them nearly equal in 2001.
29
Figure 6.1: Restructuring of European secondary industry 1995-2000, and thegrowth of recycling capacity for Hydro Aluminium [27].
Chapter 7
The case of China
During the past decade, both aluminium production capacity and consumptionhave grown rapidly in China, and the country is a major participant in globalaluminium trade. Between 1995 and 2002 China accounted for 40% of the totalnet increase in world aluminium production, and for the first three quarters of2003 the same figure was 60%. This is due to the strong economic growth inthe Chinese economy. Over the past five years, China has accounted for 10%of global economic growth, reaching 4% of world GDP in 2003 and placing itas the worlds seventh largest economy [6]. However, if cost of living differencesare adjusted for in terms of Purchasing Power Parity (PPP), China is presentlythe 2nd largest economy with 12% of world GDP, only second to the US, asdisplayed in Table 7.1.
Table 7.1: China’s position in the world economy measured in GDP and PPP-adjusted GDP in 2003 [21].
Country Share of GDP Country Share of GDPPPP
US 31.1% US 19.2%Japan 12.0% China 12.0%Germany 6.9% Japan 6.3%UK 5.1% Germany 3.9%France 4.9% UK 2.9%Italy 4.3% France 2.9%China 4.0% Italy 2.7%
One of the main contributors to the strong economic growth is extensive amountsof foreign direct investment in the country. In 2002 this amounted to more thanUS$50bn, approximately 18 times that of Russia. Other contributing aspectsare massive government investment in infrastructure in cities and less devel-oped regions of the country, and a growing domestic consumption as a resultof higher income and lower prices for large consumer durables following sharpfalls in import duties imposed by the World Trade Organization (WTO) as acondition for membership [6], [21].
7.1 Bauxite and alumina 31
7.1 Bauxite and alumina
As described in Table 2.1, China has extensive bauxite resources. However, thequality is low, so China has developed a soda-lime sinter process which usesmore energy and larger quantities of soda per tonne of alumina produced thanan average Western plant, raising both costs and environmental impacts. Nometallurgical-grade bauxite is exported from China, and most of the productionis supplied to Chalco, which is a state-controlled company owning all the six alu-mina refineries in the country, and 20% of primary smelting capacity. Togetherthese make China the second largest alumina producer with 5.4 Mt of output in2002, which is still only a third of Australian production. Since 1995, however,China’s alumina production has had a compounded annual growth rate (CAGR)of 13.6%, but the country is still a net importer of alumina. Expectations ofcontinued growth has led to plans for capacity expansion, which is due to reach8 Mt in 2005, and a further 3 Mt increase later on. However, alumina demand isexpected to exceed 16 Mt by the middle of the present decade, the gap betweendomestic alumina production and local requirements continuing being filled byimports, presently at 5.61 Mt in 2003. Thus, about 50% of demand is coveredby imports, mainly from Australia and India, with 73% and 10% respectively[6], [7], [18].
Chinese bauxite production costs are higher than the world average, and to someextent, the same applies for alumina production. Full operating costs (FOC)are above the world average of US$151/t (in 2002) for four plants, while one isroughly the same and the last one below. Still, FOC remains below long-termalumina contract price and above alumina spot price. China’s dependency onpurchasing alumina on the spot market instead of having long term contracts orsucceeding in establishing ownership in alumina producers is a major contrib-utor to higher costs and increased vulnerability. China’s growing requirementspresently comprise more than 25% of world free market alumina, contributing topush the spot price further. Other important alumina buyers are CIS (formerSoviet Union/Commonwealth of Independent States), Hydro Aluminium andDubal, with 12%, 7.5% and 6 %, respectively [6].
7.2 Trade flows
China’s primary aluminium capacity has increased substantially for the lastdecade, and is presently about 6.5 Mt. The recent increase has, however, re-sulted in more modern smelters. More than 77% of the capacity rely on Prebaketechnology. In comparison, there is about twice as much Soderberg capacity inthe Western World and in Russia. Most Chinese smelters use Soderberg tech-nology, but the technology is related to small smelters, while the fifteen largestsmelters, comprising 45% of production, use Prebake technology [6].
Primary aluminium capacity has increased due to higher domestic consumptionas a result of strong economic growth, and so has the production output. Dur-ing the last half of the previous decade, China’s position as a net importer ofunwrought aluminium came to an end. For the last couple of years, the country
32 The case of China
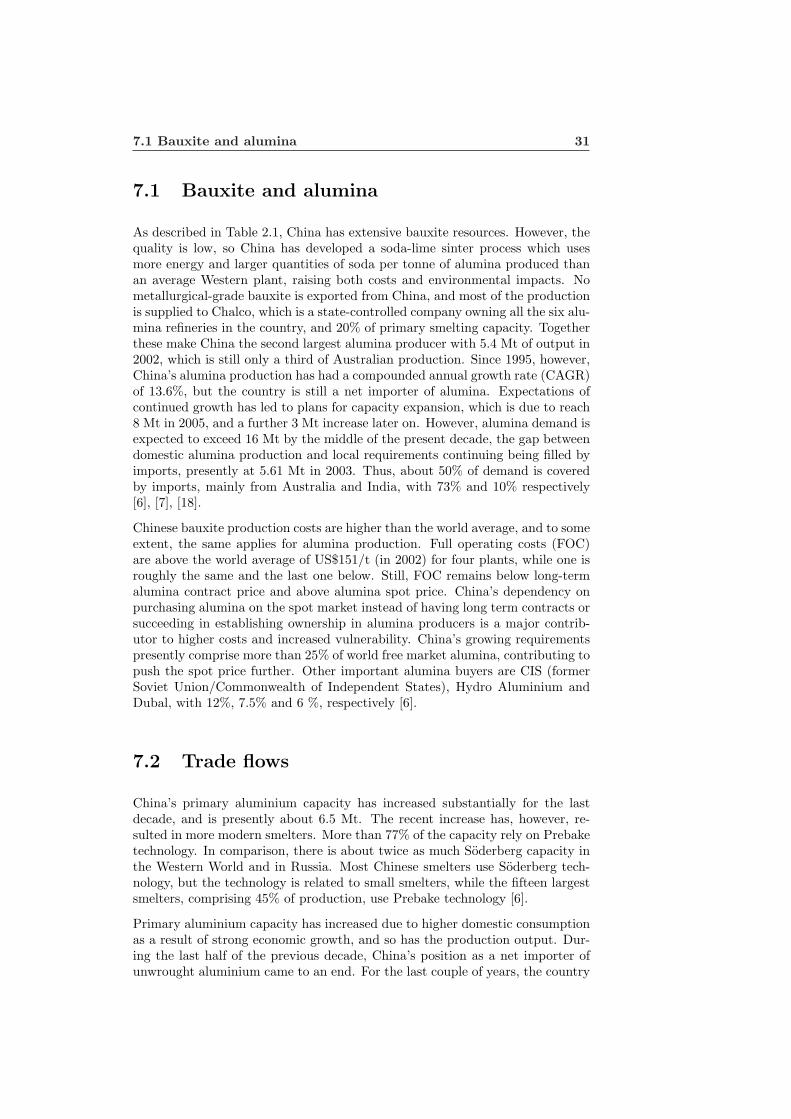
Figure 7.1: Chinese trade flows and net imports composition [6].
has instead registered significant net exports of primary aluminium. Figure 7.1gives an overview of Chinese trade flows and composition of net imports for therecent years.
Looking at net import of primary aluminium, a substantial decrease is shown,resulting in negative figures, i.e. net export. However, this is offset by netimports of scrap and semi-fabricated products, giving an altogether positivenet import. Total imports and exports are both increasing, indicating growingconsumption and production.
China’s scrap recycling rate is approximately 80%, but this still accounts for only25% of scrap demand. Scrap import constituted 70% of total domestic demandin 2003, mainly from the US (33%) and Hong Kong (25%). Low Chinese laborcosts make scrap separation more economical [6]. Higher energy costs do notoffset this because of aluminium’s low energy demand for recycling, 5%-10%that of primary aluminium energy demand.
Net import of semi-fabricated products have been fairly stable, as seen in Figure7.1. A considerable proportion of Chinese primary aluminium does not conformto international standards and requirements, and is thus unsuitable for furtherprocessing in high-speed rolling mills. This makes China an exporter of bars,rods and extrusions, and an importer of processed products like sheets, platesand foil. However, the quality of Chinese aluminium is improving [6].
7.3 Chinese aluminium production and consump-tion
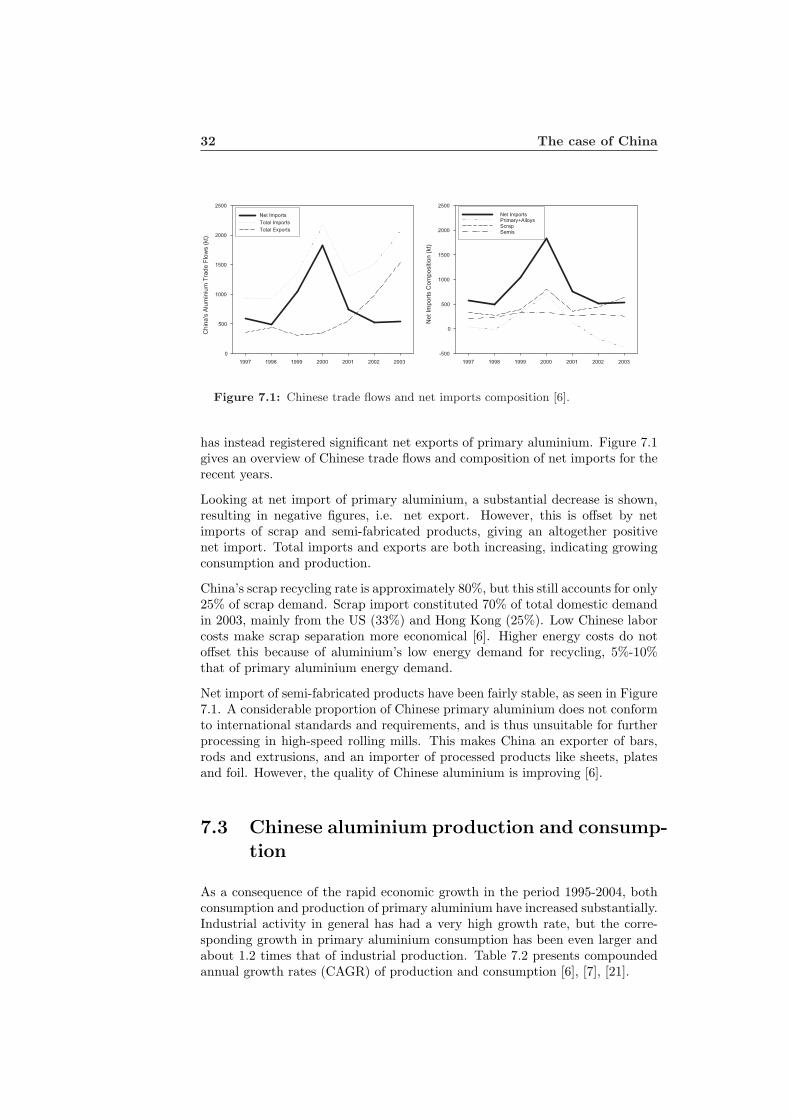
As a consequence of the rapid economic growth in the period 1995-2004, bothconsumption and production of primary aluminium have increased substantially.Industrial activity in general has had a very high growth rate, but the corre-sponding growth in primary aluminium consumption has been even larger andabout 1.2 times that of industrial production. Table 7.2 presents compoundedannual growth rates (CAGR) of production and consumption [6], [7], [21].
7.3 Chinese aluminium production and consumption 33
Figure 7.2: Chinese primary aluminium production and consumption, and con-sumption/Capita vs. GDP/Capita [6], [4].
Table 7.2: Chinese compounded annual growth rate 1995-2003 [6], [21].
1995-2000 2000-2003
Production 8.6% 25.6%Consumption 13.0% 14.5%
Production CAGR is higher than for consumption, as capacity is increased tokeep pace with the growing demand. The higher growth rate for aluminiumrelative to industrial output is not surprising. For the last four decades, de-veloping countries have experienced aluminium consumption of 1.3-1.5 timesthe CAGR of industrial production. As industrialization takes place, manu-facturing, construction and other materials-intensive activities expand, hencealuminium consumption is determined not only by growth in industrial produc-tion, but also by the intensity of use. When the need for capital investmentslike these move towards satisfaction, a decline in consumption growth is likelyto occur due to a shift to a less materials-intensive service industry [6].
China is already the world’s largest primary aluminium consumer, overtakingthe US in 2001 [1]. Still, it has an aluminium consumption per capita of onlyabout 12% that of industrialized countries. Figure 7.2 displays Chinese produc-tion and consumption in recent years, as well as aluminium consumption percapita vs. GDP per capita for selected economies [6], [21], [4].
Considerable growth for both production and consumption are shown, withproduction output overtaking consumption in recent years, as indicted by theCAGR-values of Table 7.2. Figure 7.2 shows correlation between aluminiumconsumption per capita and GDP per capita, indicating growth in the formervariable as GDP per capita grows. This is experienced earlier in developingeconomies. Measuring China’s GDP in terms of purchasing power parity (PPP),the country’s economy is at the level which other Asian countries like Taiwan,Korea and Japan were when their economies started to accelerate.
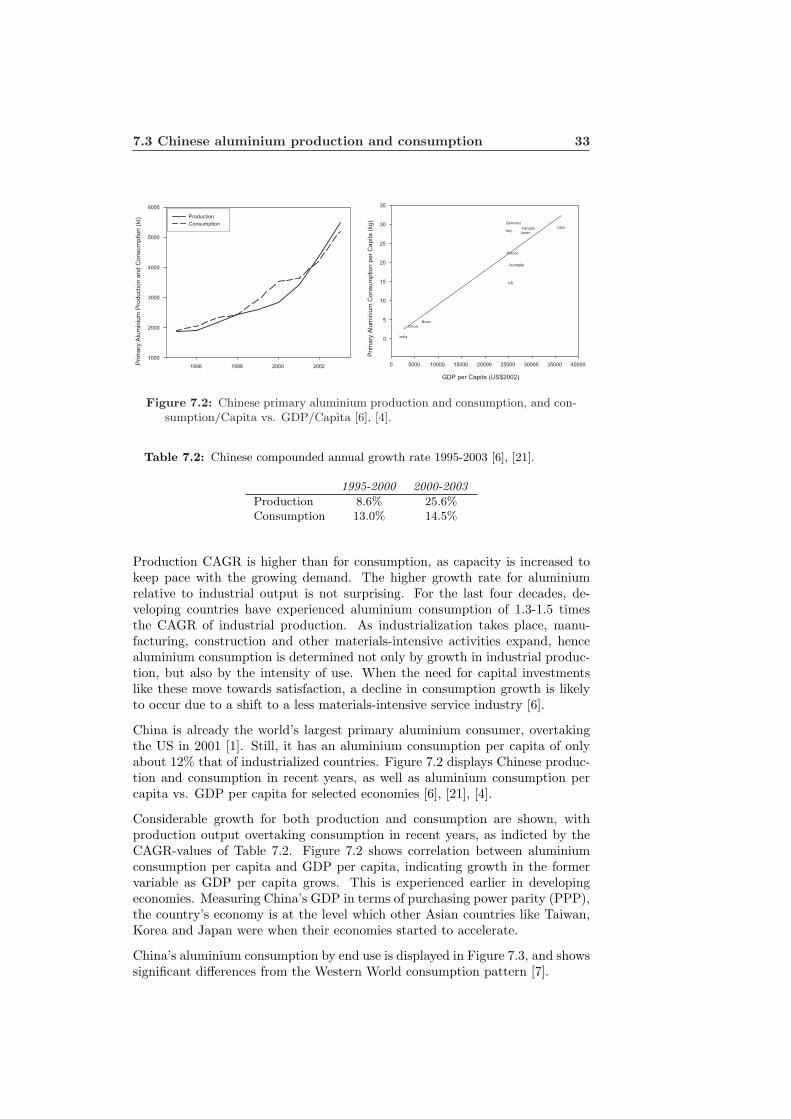
China’s aluminium consumption by end use is displayed in Figure 7.3, and showssignificant differences from the Western World consumption pattern [7].
34 The case of China
Figure 7.3: Aluminium consumption by end use for the Western World andChina in 2002 [7].
China has a larger share of consumption related to building and construction,electrical products and consumer durables than the Western World, while theopposite is true for transportation, cans and other packaging. Both residen-tial and non-residential construction activity is high, especially in the majorcities, and is expected to remain high as well. The main drivers for this arecontinued growth in per-capita incomes, foreign direct investment, domesticfixed investment and general improvement of the economy. In addition non-residential construction activity and corresponding aluminium demand will befurther stimulated by the 2008 Beijing Olympics and Shanghai’s 2010 EXPO.For the Olympics only, 42 stadiums and about 50 hotels are planned.
Aluminium for transportation purposes is significantly lower than for the West-ern World, but this about to change. Transportation is by far the fastest grow-ing market for aluminium. China is not only increasing in terms of cars percapita, but also emerging as an automotive producer, both of automotive partsas well as vehicles. Major international automotive manufacturers like GeneralMotors, Volkswagen, BMW, Honda, Toyota and Nissan are all increasing theirproduction capacity in China [6].
In general, the present aluminium consumption pattern of China strongly re-sembles the end use distribution of the US in 1960, as seen in Figure 4.7.
7.4 Energy and operating costs 35
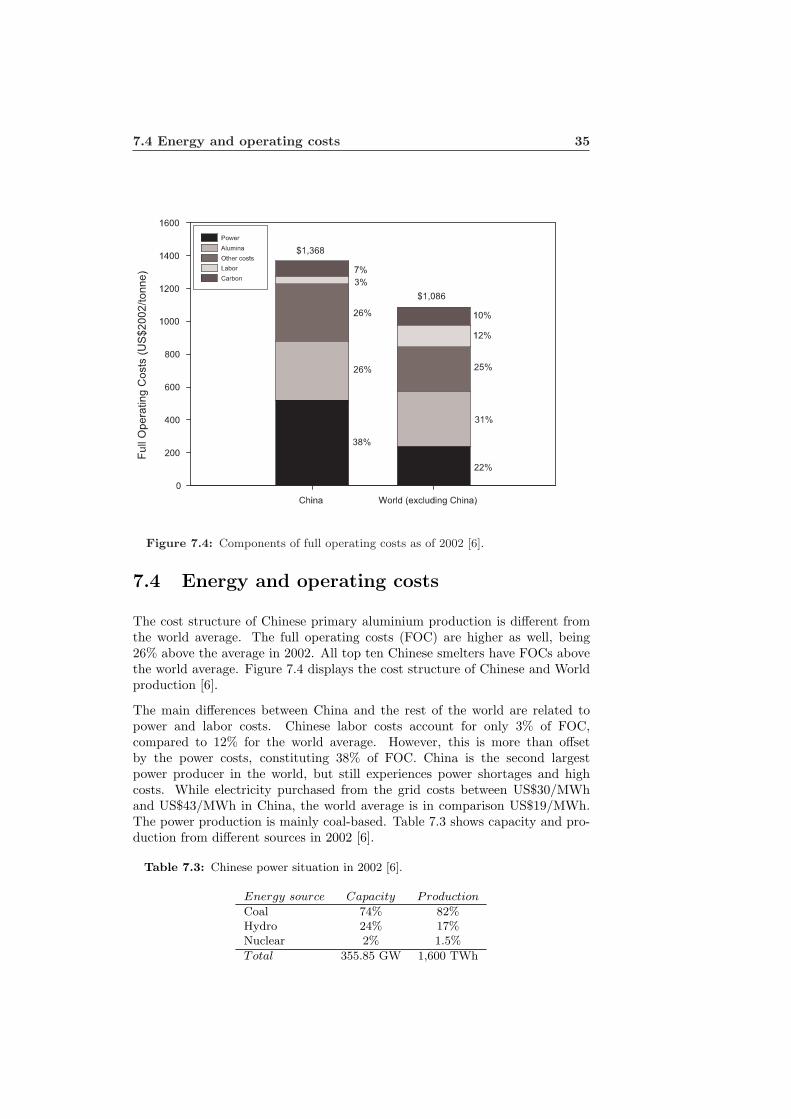
Figure 7.4: Components of full operating costs as of 2002 [6].
7.4 Energy and operating costs
The cost structure of Chinese primary aluminium production is different fromthe world average. The full operating costs (FOC) are higher as well, being26% above the average in 2002. All top ten Chinese smelters have FOCs abovethe world average. Figure 7.4 displays the cost structure of Chinese and Worldproduction [6].
The main differences between China and the rest of the world are related topower and labor costs. Chinese labor costs account for only 3% of FOC,compared to 12% for the world average. However, this is more than offsetby the power costs, constituting 38% of FOC. China is the second largestpower producer in the world, but still experiences power shortages and highcosts. While electricity purchased from the grid costs between US$30/MWhand US$43/MWh in China, the world average is in comparison US$19/MWh.The power production is mainly coal-based. Table 7.3 shows capacity and pro-duction from different sources in 2002 [6].
Table 7.3: Chinese power situation in 2002 [6].
Energy source Capacity Production
Coal 74% 82%Hydro 24% 17%Nuclear 2% 1.5%
Total 355.85 GW 1,600 TWh
36 The case of China
The non-renewable and CO2-intensive, coal-based share of production is evenhigher than for the capacity, on behalf of the more environmentally preferablehydropower alternative. Although production is very high, it still increasessubstantially, growing at an annual 8% for the last 20 years, and forecastedby the government to grow by a conservative 6% in the next five years. Thiscorresponds to an annual increase of 25 GW, or 1.4 the capacity of the ThreeGorges project. However, the general economic growth, rural electrification andproliferation of energy-intensive industry create an estimated annual demand of40 GW. For 2005, power demand is expected to increase by 15%, and already,energy shortages are reported to affect some smelters and lowering productionoutput [6], [1].
7.5 Energy shortage and over-supply
Due to emerging power shortages and a general concern for aluminium over-supply, Chinese authorities have specified policy measures to curb growth inaluminium capacity, focusing on:
• Accelerating the phase-out of Soderberg plants that are neither economi-cally nor environmentally sustainable
• Restricting alumina imports for smaller smelters
• Centralizing the power to approve new projects
• Loans to new projects by state banks are banned unless approved bycentral government
Stronger central governmental control is needed to fulfill a policy of closingdown all environmentally unacceptable smelters by 2007, as laid out by thecentral government itself. This will mainly affect Soderberg technology plants,and especially the smaller ones. However, this has not been easy, since most ofthese smelters are owned by local governments, more interested in preservingemployment and tax revenues. Attempts to close down this capacity have notbeen very successful, and sometimes resulted in expansions to boost outputabove minimum levels. This is why restricting alumina supply is proposed bythe central government, and some signs of this are already present.
State banks will no longer finance new aluminium smelter projects, and do-mestic financial institutions are warned of the potential risks of involvement insuch projects due to the perception that there already is excessive productioncapacity. Foreign investment will still be allowed, although subjected to stricterscreening procedures. China will prefer to encourage existing aluminium indus-try in developing into more centralized major aluminium enterprise groups withglobal competitiveness [6], [1].
Chapter 8
Future primary aluminiumdemand
Primary aluminium demand is expected to increase in the years to come, forthe world in general as well as for the different regions. In order to makeprojections about this future demand, macroeconomic relationships betweenaluminium consumption and national income is utilized. Primary aluminiumdemand (PAD) is econometrically estimated as a simple logarithmic functionof GDP for individual regions, attempting to capture the effect of ”marketsaturation” with rising income, as described by Harnisch et. al [5]. Equation8.1 shows the relationship between GDP and PAD.
PAD = α + βlnGDP (8.1)
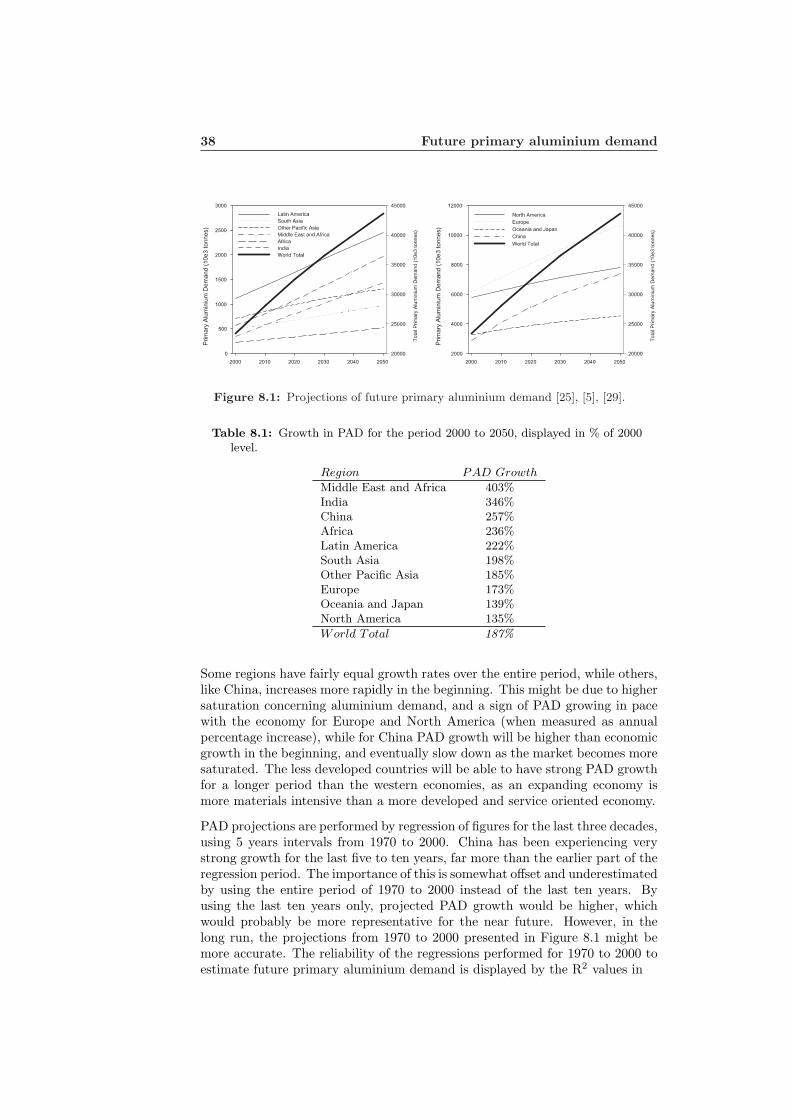
α and β is found by regression. GDP projections for different regions are pro-vided by UNCTAD [25], while Wilson et. al [29] provides the same for Chinaand India. India and China are examined on their own due to their large pop-ulations and potential growth. Figure 8.1 shows projected PAD for differentregions as well as the world total.
The demand curves in Figure 8.1 are all increasing, and world PAD is estimatedto nearly double for the next fifty years. Europe will by far experience the largestdemand, followed by North America and China. However, looking at growthrates, both Europe and China will experience substantially higher growth thanNorth America, which actually have the lowest growth of all regions. The regionof Middle East and Africa has the highest growth of all, followed by India andChina. PAD in 2050 is displayed in Table 8.1 for all regions relative to the 2000level, showing that developing countries will have the strongest growth.
38 Future primary aluminium demand
Figure 8.1: Projections of future primary aluminium demand [25], [5], [29].
Table 8.1: Growth in PAD for the period 2000 to 2050, displayed in % of 2000level.
Region PAD Growth
Middle East and Africa 403%India 346%China 257%Africa 236%Latin America 222%South Asia 198%Other Pacific Asia 185%Europe 173%Oceania and Japan 139%North America 135%
World Total 187%
Some regions have fairly equal growth rates over the entire period, while others,like China, increases more rapidly in the beginning. This might be due to highersaturation concerning aluminium demand, and a sign of PAD growing in pacewith the economy for Europe and North America (when measured as annualpercentage increase), while for China PAD growth will be higher than economicgrowth in the beginning, and eventually slow down as the market becomes moresaturated. The less developed countries will be able to have strong PAD growthfor a longer period than the western economies, as an expanding economy ismore materials intensive than a more developed and service oriented economy.
PAD projections are performed by regression of figures for the last three decades,using 5 years intervals from 1970 to 2000. China has been experiencing verystrong growth for the last five to ten years, far more than the earlier part of theregression period. The importance of this is somewhat offset and underestimatedby using the entire period of 1970 to 2000 instead of the last ten years. Byusing the last ten years only, projected PAD growth would be higher, whichwould probably be more representative for the near future. However, in thelong run, the projections from 1970 to 2000 presented in Figure 8.1 might bemore accurate. The reliability of the regressions performed for 1970 to 2000 toestimate future primary aluminium demand is displayed by the R2 values in
39
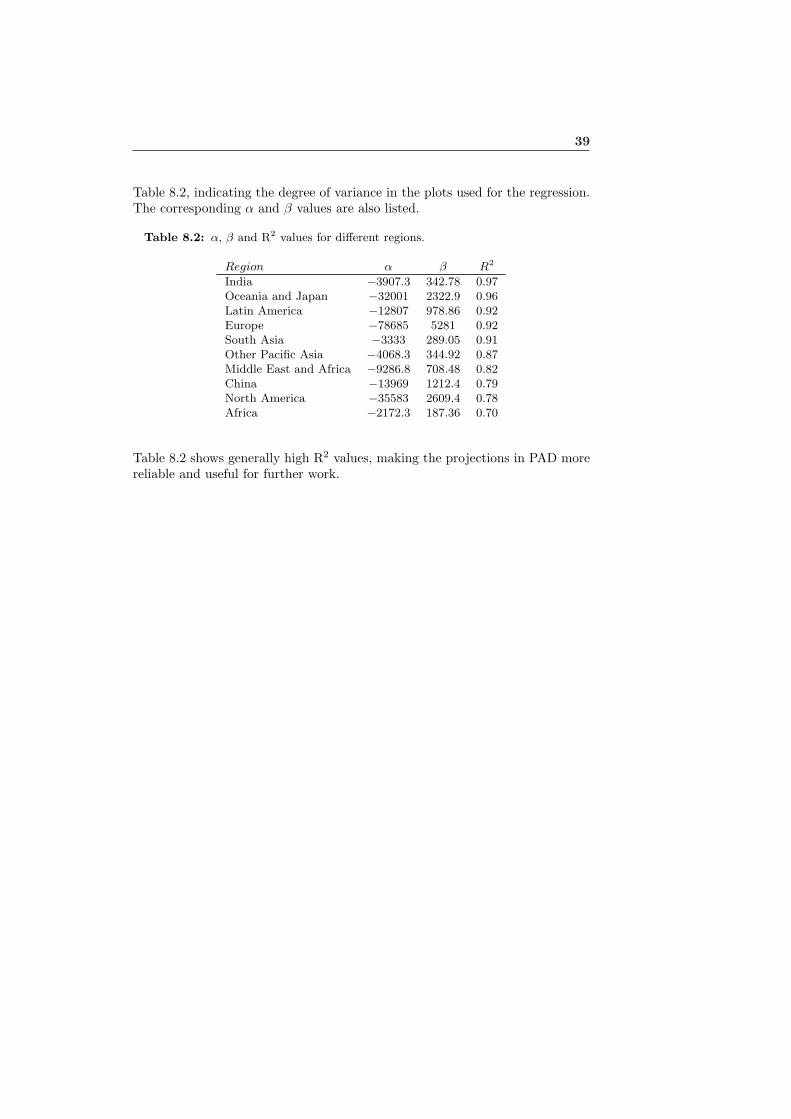
Table 8.2, indicating the degree of variance in the plots used for the regression.The corresponding α and β values are also listed.
Table 8.2: α, β and R2 values for different regions.
Region α β R2
India −3907.3 342.78 0.97Oceania and Japan −32001 2322.9 0.96Latin America −12807 978.86 0.92Europe −78685 5281 0.92South Asia −3333 289.05 0.91Other Pacific Asia −4068.3 344.92 0.87Middle East and Africa −9286.8 708.48 0.82China −13969 1212.4 0.79North America −35583 2609.4 0.78Africa −2172.3 187.36 0.70
Table 8.2 shows generally high R2 values, making the projections in PAD morereliable and useful for further work.
Chapter 9
Conclusions
Both primary and secondary aluminium production is growing, with the strongestgrowth taking place in China, due to its recent strong economic improvements.At the same time, secondary aluminium from recycling of old and new scrapis increasing even more due the release of more material from the substantialstocks in different products and applications, increased focus and improvementsin recycling systems and the lower costs and environmental stress from the re-cycling process.
Aluminium is finding its way into new applications and segments, as well asincreasing its importance in existing products, with the transportation sectorbeing the fastest growing one. However, the use of aluminium in different appli-cations vary within different regions of the world, but with development patternsshowing similar trends.
Environmental implications from aluminium production is mainly related to thesmelting, or electrolysis, process. Considerate reductions in PFC emissions arerecorded for the past decade, due to phase out of old technology and improve-ments in existing ones. CO2 emissions have also decreased, these emissionsbeing strongly dependent on electricity consumption and the energy carrier mixpresent in the different regions.
Through relations between GDP forecasts and aluminium consumption, projec-tions of future primary aluminium demand are estimated, indicating a nearlydoubling of world demand in 2050, with developing countries such as China andIndia in the lead.

Acknowledgement
The authors would like to thank Line Sommerfeldt for valuable help with cal-culating and organizing data for projections of future primary aluminium de-mand.
Bibliography
[1] R. Bahr. Aluminium - The China syndrome. Technical report, StandardBank London Ltd., 2004.
[2] G. Barrasso. EAA comments on the thematic strategy: Prevention andrecycling of waste COM(2003) 301 final. Technical report, European Alu-minium Association, 2003.
[3] BMO Nesbitt Burns. Western World and Alcan. Technical report, Alcan,2002.
[4] Central Intelligence Agency (CIA). The world factbook. Office of PublicAffairs, Washington, 2003.
[5] J. Harnisch, I. S. Wing, H. D. Jacoby, and R. G. Prinn. Primary aluminiumproduction: Climate policy, emissions and costs. 2000.
[6] Alcan Inc. China’s aluminum industry: Setting the record straigth. Tech-nical report, Alcan Inc, Industry Analysis Department, 2004.
[7] Alcan Inc. Primary aluminum: The China syndrome. Technical report,Alcan Inc, 2004.
[8] International Aluminium Institute. Anode effect survey 1994-1997 andperfluorocarbon compounds emissions survey 1990-1997. Technical report,International Aluminium Institute, 1998.
[9] International Aluminium Institute. The second bauxite mine rehabilitationstudy. International Aluminium Institute, Haymarket, London, 1998.
[10] International Aluminium Institute. Aluminium applications and society- Life Cycle Inventory of the worldwide aluminium industry with regardto energy consumption and emissions of greenhouse gases. InternationalAluminium Institute, Haymarket, London, 2000.
[11] International Aluminium Institute. Perfluorocarbon emissions reductionprogramme 1990-2000. Technical report, International Aluminium Insti-tute, 2001.
[12] International Aluminium Institute. The International Aluminium Insti-tute’s report on the aluminium industry’s global perfluorcarbon gas emis-sions reduction programme - Results of the 2001 anode effect survey. Tech-nical report, International Aluminium Institute, Haymarket, London, 2003.
BIBLIOGRAPHY 43
[13] International Aluminium Institute. Selection of articles from IAI-Web.Technical report, International Aluminium Institute, Haymarket, London,2004.
[14] International Aluminum Institute. Electrical power used in primary alu-minium production. Technical report, International Aluminium Institute,Haymarket, London, 2003.
[15] International Aluminum Institute. Life cycle assessment of aluminium:Inventory data for the worldwide primary aluminium industry. Technicalreport, International Aluminium Institute, Haymarket, London, 2003.
[16] International Aluminum Institute. The aluminum industry’s sustainabledevelopment report. International Aluminum Institute, Haymarket, Lon-don, 2003.
[17] Katholieke Universiteit Leuven. Electrowinning of Aluminium. Technicalreport, Katholieke Universiteit Leuven, 2002.
[18] A. MacMillan. The impact of the CIS and China on the global aluminiummarket to 2005. Technical report, Prudential-Bache International, 2004.
[19] S. Meath, J. Hanks, and K. Evans. Aluminium - Case study. Technicalreport, Pennsylvania State University, 2002.
[20] M. T. Melo. Statistical analysis of metal scrap generation: the case ofaluminium in Germany. Resources, Conservation and Recycling, pages 91–113, 1998.
[21] C. Nappi. China’s aluminium industry: Opportunities and challenges.Technical report, Alcan Inc, 2004.
[22] J. H. Nilsen. Performance and strategic progress. Technical report, HydroAluminium, 2003.
[23] D. A. Roling and M. Lynch. An analyst’s outlook for aluminium funda-mentals, metal price, and the value of equities. Technical report, PlattsAluminium Symposium: Targeting Transparency, 2004.
[24] H.G. Schwarz, S. Briem, and P. Zapp. Future carbon dioxide emissions inthe global material flow of primary aluminium. Energy, 2000.
[25] United Nations Conference on Trade and Development. Commodity year-book 2003. United Nations Conference on Trade and Development, 2003.
[26] U.S. Department of the Interior. U.S. Geological sur-vey. Technical report, U.S. Department of the Interior,http://minerals.usgs.gov/minerals/pubs/commodity/bauxite/index.html,2004.
[27] P. Vigeland. Aluminium recycling: The commercial benefits, the tech-nical issues and the sustainability imperative. Technical report, HydroAluminium Recycling, 2001.

44 BIBLIOGRAPHY
[28] W. Wagner. Canadian minerals yearbook 2002. Minerals and Metals Sector,Natural Resources Canada. Natural Resources Canada., Canada, 2003.
[29] D. Wilson and R. Purushothaman. Dreaming with BRICs: The path to2050. Technical report, The Goldman Sachs Group, Inc, 2003.
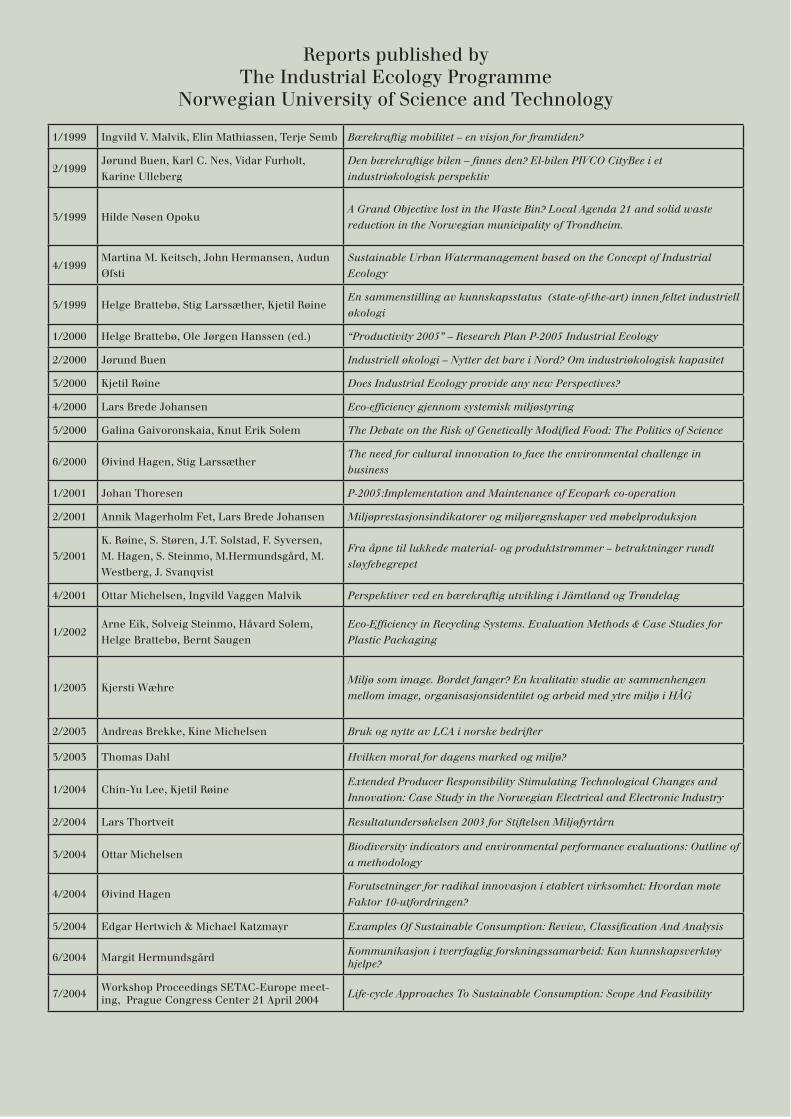
Reports published by The Industrial Ecology Programme
Norwegian University of Science and Technology
1/1999 Ingvild V. Malvik, Elin Mathiassen, Terje Semb Bærekraftig mobilitet – en visjon for framtiden?
2/1999Jørund Buen, Karl C. Nes, Vidar Furholt, Karine Ulleberg
Den bærekraftige bilen – finnes den? El-bilen PIVCO CityBee i et industriøkologisk perspektiv
3/1999 Hilde Nøsen OpokuA Grand Objective lost in the Waste Bin? Local Agenda 21 and solid waste reduction in the Norwegian municipality of Trondheim.
4/1999Martina M. Keitsch, John Hermansen, Audun Øfsti
Sustainable Urban Watermanagement based on the Concept of Industrial Ecology
5/1999 Helge Brattebø, Stig Larssæther, Kjetil RøineEn sammenstilling av kunnskapsstatus (state-of-the-art) innen feltet industriell økologi
1/2000 Helge Brattebø, Ole Jørgen Hanssen (ed.) “Productivity 2005” – Research Plan P-2005 Industrial Ecology
2/2000 Jørund Buen Industriell økologi – Nytter det bare i Nord? Om industriøkologisk kapasitet
3/2000 Kjetil Røine Does Industrial Ecology provide any new Perspectives?
4/2000 Lars Brede Johansen Eco-efficiency gjennom systemisk miljøstyring
5/2000 Galina Gaivoronskaia, Knut Erik Solem The Debate on the Risk of Genetically Modified Food: The Politics of Science
6/2000 Øivind Hagen, Stig LarssætherThe need for cultural innovation to face the environmental challenge in business
1/2001 Johan Thoresen P-2005:Implementation and Maintenance of Ecopark co-operation
2/2001 Annik Magerholm Fet, Lars Brede Johansen Miljøprestasjonsindikatorer og miljøregnskaper ved møbelproduksjon
3/2001K. Røine, S. Støren, J.T. Solstad, F. Syversen, M. Hagen, S. Steinmo, M.Hermundsgård, M. Westberg, J. Svanqvist
Fra åpne til lukkede material- og produktstrømmer – betraktninger rundt sløyfebegrepet
4/2001 Ottar Michelsen, Ingvild Vaggen Malvik Perspektiver ved en bærekraftig utvikling i Jämtland og Trøndelag
1/2002Arne Eik, Solveig Steinmo, Håvard Solem, Helge Brattebø, Bernt Saugen
Eco-Efficiency in Recycling Systems. Evaluation Methods & Case Studies for Plastic Packaging
1/2003 Kjersti WæhreMiljø som image. Bordet fanger? En kvalitativ studie av sammenhengen mellom image, organisasjonsidentitet og arbeid med ytre miljø i HÅG
2/2003 Andreas Brekke, Kine Michelsen Bruk og nytte av LCA i norske bedrifter
3/2003 Thomas Dahl Hvilken moral for dagens marked og miljø?
1/2004 Chin-Yu Lee, Kjetil RøineExtended Producer Responsibility Stimulating Technological Changes and Innovation: Case Study in the Norwegian Electrical and Electronic Industry
2/2004 Lars Thortveit Resultatundersøkelsen 2003 for Stiftelsen Miljøfyrtårn
3/2004 Ottar MichelsenBiodiversity indicators and environmental performance evaluations: Outline of a methodology
4/2004 Øivind HagenForutsetninger for radikal innovasjon i etablert virksomhet: Hvordan møte Faktor 10-utfordringen?
5/2004 Edgar Hertwich & Michael Katzmayr Examples Of Sustainable Consumption: Review, Classification And Analysis
6/2004 Margit Hermundsgård Kommunikasjon i tverrfaglig forskningssamarbeid: Kan kunnskapsverktøy hjelpe?
7/2004 Workshop Proceedings SETAC-Europe meet-ing, Prague Congress Center 21 April 2004 Life-cycle Approaches To Sustainable Consumption: Scope And Feasibility
Program for industriell økologi (IndEcol) er et tverrfaglig universitetsprogram etablert i 1998 for en periode på minst ti år ved Norges teknisk-naturvitenskapelige universitet (NTNU). Pro-grammet omfatter et studieprogram opprettet i 1999 og et stort antall doktorgradsprosjekter og forskningsprosjekter rettet mot vareproduser-ende industri, energi- og byggesektoren. Tverr-faglig forskning og undervisning står sentralt ved IndEcol, og målet er å knytte sammen tek-nologiske, naturvitenskapelige og samfunns-vitenskapelige bidrag i letingen etter bærekraft-ige løsninger på produksjon og forbruk av energi og ressurser.
The Industrial Ecology Programme (IndEcol) is a multidisciplinary university programme es-tablished at the Norwegian University of Science and Technology (NTNU) in 1998 for a period of minimum ten years. It includes a comprehensive educational curriculum launched in 1999 and a signifi cant number of doctoral students as well as research projects geared towards Norwegian manufacturing, energy and building industries. The activities at IndEcol have a strong attention to interdisciplinary research and teaching, bridg-ing technology, natural and social sciences in the search for sustainable solutions for production and consumption of energy and resources.
NTNU-IndEcolIndustrial Ecology ProgrammeNO-7491 Trondheim
Tel.: + 47 73 59 89 40Fax: + 47 73 59 89 43E-mail: [email protected]: www.indecol.ntnu.no ISSN 1501-6153ISBN 82-7948-042-0 (trykt)ISBN 82-7948-043-9 (pdf)