the basics of photometric measurement
TRANSCRIPT

© 2015 WTW GmbH, [June 2015]
The Basics of Photometric Measurement
Part 1: Principles, Optics, AQA, Test Kits I

© 2015 WTW GmbH, [June 2015] in cooperation with G.I.T. Laboratory Journal
BASICS OF PHOTOMETRIC MEASUREMENT
Introduction Phos (Greek) for light => Photometry is a measurement method to analyse (aqueous) solutions by means of a light source. Light (physical) is a spectra of electromagnetic waves, divided into different ranges: Visible light (white light) ranges from approx. 380 – 780 nm
Photometric / Colorimetric Analysis: Determination of substances by their specific colour reaction and light absorbance in dependance of their chemical properties at a specific wavelength.
2

© 2015 WTW GmbH, [June 2015] in cooperation with G.I.T. Laboratory Journal
BASICS OF PHOTOMETRIC MEASUREMENT
Introduction – Light Sources and Optics
3
Specific Wavelengths are obtained by
Different light sources • LEDs (λx) = lowest power consumption, lower light
intensity • Tungsten (white light halogene lamp) for VIS range • Xenon (UV-VIS) => Flash lamp with long life span • Deuterium (UV) => special lamp, expensive
Different optical techniques, such as • Monochromators • Polychromators • Filters • LED

© 2015 WTW GmbH, [June 2015] in cooperation with G.I.T. Laboratory Journal
BASICS OF PHOTOMETRIC MEASUREMENT
Optics: Filter and LED Photometer Filter photometer with reference beam: photoLab® S6/S12
LED λ + optical Filter – single beam: photoFlex® Series
4
© Oleksiy Mark – Fotolia.com #52288968

© 2015 WTW GmbH, [June 2015] in cooperation with G.I.T. Laboratory Journal
BASICS OF PHOTOMETRIC MEASUREMENT
Monochromator of photoLab® 7000 Series
5

© 2015 WTW GmbH, [June 2015] in cooperation with G.I.T. Laboratory Journal
BASICS OF PHOTOMETRIC MEASUREMENT
Measurement modes What type of measurement is performed in with a photometer? => 3 Measurement modes of photometric analysis and their relation 1) Transmission T(%): Ratio of light intensity after cuvette (I) and before (Io)
2) Absorbance: Abs λ = - log10 (T λ)
or „extinction of light“ passing the cuvette
3) Concentration: quantitative analysis of a substance (mg/l, ppm,…) at a defined wavelength based on a calibration curve
6

© 2015 WTW GmbH, [June 2015] in cooperation with G.I.T. Laboratory Journal
BASICS OF PHOTOMETRIC MEASUREMENT
Transmission measurement
Transmission is the ratio of passed light I / initial light I0:
Transmission measurement is also being used to measure turbidity at 180° angle (unit FAU, e.g. for quality control) and for turbidity correction in concentration measurement.
7
𝑇 % =𝐼I0
𝑥 100 I0 I
Detector

© 2015 WTW GmbH, [June 2015] in cooperation with G.I.T. Laboratory Journal
BASICS OF PHOTOMETRIC MEASUREMENT
Absorbance : Concentration Measurement Absorbance = „Extinction of light“: Each substance has a specific spectra with absorbance peak(s). => Run spectrum to define maximum or optimal peak = wavelength definition for concentration measurement
8
Concentration measurement: Measurement at specific wavelength, obtained by either matching LED, optical filters from white light or mono-chromator

© 2015 WTW GmbH, [June 2015] in cooperation with G.I.T. Laboratory Journal
BASICS OF PHOTOMETRIC MEASUREMENT
Relation %T : Absorbance : Concentration Transmission measurement: The transmission of a sample varies exponentially with thickness and concentration
9
Absorbance measurement: Absorbance of a sample is proportional to thickness of the sample and concentration
Transmission (T%)
Absorbance A = -log10 (T)
Concentration (mg/l)
100
0
0
10
1
4
1
2
8
0,1
3
12
=> Logarithmic correlation
=> linear correlation

© 2015 WTW GmbH, [June 2015] in cooperation with G.I.T. Laboratory Journal
BASICS OF PHOTOMETRIC MEASUREMENT
Relation %T : Absorbance : Concentration Lambert-Beer’s law
Experiments by BOUGUER (1698–1758) and LAMBERT (1728–1777) showed that the absorbance is dependent on the thickness of the absorbing layer of the cell used. The relationship between the absorbance and the concentration of the analyte in question was discovered by BEER (1825–1863). The combination of these two natural laws led to the derivation of Lambert-Beer’s law, which can be described in the form of the following equation:
A = ελ· c · d ελ = molar absorptivity, in l/mol x cm d = Path length of the cell, in cm c = Concentration of the analyte, in mol/l
10
Source: Operating Instructions of photoLab® S12, Part 1: General Information (www.wtw.com)

© 2015 WTW GmbH, [June 2015] in cooperation with G.I.T. Laboratory Journal
BASICS OF PHOTOMETRIC MEASUREMENT
Concentration Measurement The correlation of absorbance/concentration is determined by setting up a characteristic calibration curve for each substance (parameter). The chemical reaction must be known: Dilution series with defined concentrations, measured at defined λ and cuvette size (pathlength) ⇒ Characteristic (calibration) curve ⇒ Unknown sample concentration can be „read“ from the curve!
Methods/ programs in photometers contain all data and compute result automatically, including various cuvette sizes. Barcoded test kits additionally call up the respective method=program.
11
0
0,2
0,4
0,6
0,8
1
1,2
Abso
rban
ce
0 0,2 0,4 0,6 0,8 1 1,2 1,4 1,6
concentration (mg/l)
Unknown sample
© 2015 WTW GmbH, [June 2015] in cooperation with G.I.T. Laboratory Journal
BASICS OF PHOTOMETRIC MEASUREMENT
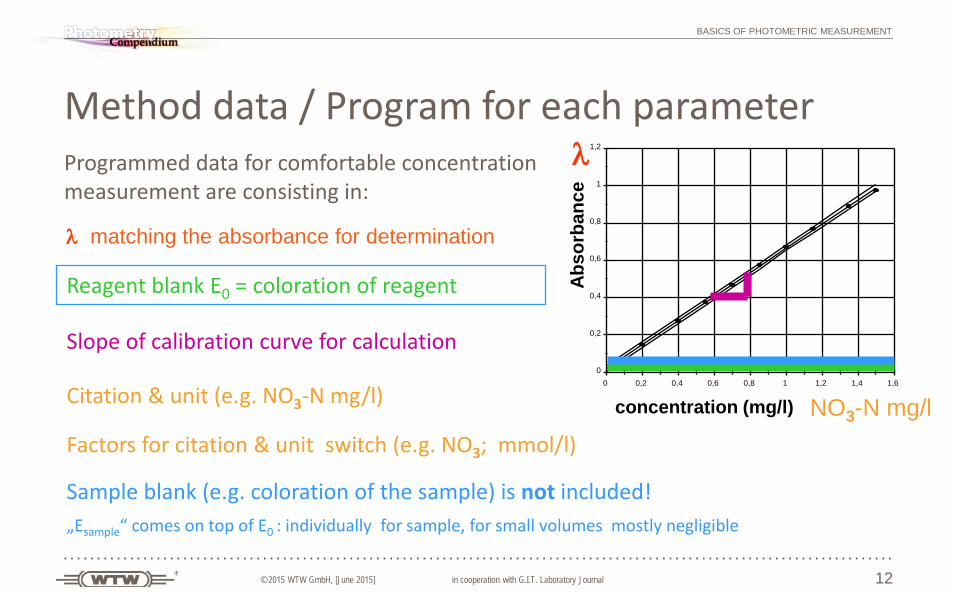
Method data / Program for each parameter Programmed data for comfortable concentration measurement are consisting in:
12
Reagent blank E0 = coloration of reagent
λ matching the absorbance for determination
Slope of calibration curve for calculation
Citation & unit (e.g. NO3-N mg/l)
Factors for citation & unit switch (e.g. NO3; mmol/l)
Sample blank (e.g. coloration of the sample) is not included! „Esample“ comes on top of E0 : individually for sample, for small volumes mostly negligible
0
0,2
0,4
0,6
0,8
1
1,2
Abso
rban
ce
0 0,2 0,4 0,6 0,8 1 1,2 1,4 1,6
concentration (mg/l)
λ
NO3-N mg/l

© 2015 WTW GmbH, [June 2015] in cooperation with G.I.T. Laboratory Journal
BASICS OF PHOTOMETRIC MEASUREMENT
Prerequisites for concentration measurement • Coloured solution contains dissolved dye • Absorption of light leads to a coloration(complementary to λ) • Color intensity is correlating with concentration • The chemical reaction of analyte leads to building or
disappearance (e.g. COD 4-40 mg/l) of dye in defined reaction time
• Reaction must be selective for the analyte – no cross reaction with other disturbing substances
• The developed dye must be stable for time of measurement => e.g. reading within 10 minutes after reaction time w/o color deterioration (see analytical instructions)
13
Defined reaction time for color development
t

© 2015 WTW GmbH, [June 2015] in cooperation with G.I.T. Laboratory Journal
BASICS OF PHOTOMETRIC MEASUREMENT
Instrument Check – AQA • Self calibration/check & warm up time (especially for kinetics and spectra)
• AutoCheck: photoLab® levels meter vs air in the background
• Zeroing/Baseline: correcting the meter to „E0“ => especially after transport or in
changing conditions (temperature…) meters E0 „drift“ some mAbs => readings become inaccurate (mostly too high)
• AQA Tools: • Optical or liquid filters • Color solutions, e.g. PhotoCheck® • Selected unscratched zero cuvettes • Control standards of the substance
14

© 2015 WTW GmbH, [June 2015] in cooperation with G.I.T. Laboratory Journal
BASICS OF PHOTOMETRIC MEASUREMENT
FAQ Commercial test kits in brief Measurement range: (MR) The range is meter (optics) dependent, the reaction has detection limits. MR-values are reaching approx. ± 2 - 2,5 Abs (test dependent!) At the lower end detection limits and tolerances of the procedure have the biggest influence on accuracy of readings: Limitation of chemical procedure, confidence interval and accuracy are often at the lower limit. => Scratches, pipette faults etc. additionally affect the accuracy of readings! Readings at the lower end become more inaccurate!
Measure in the middle of the MR, if possible!
15
a): Low end 0,20 mg/l confidence interval: ± 0,20 mg/l
b): Accuracy: ± 0,20 mg/l
Test: A6/25 Ammonium (WTW)

© 2015 WTW GmbH, [June 2015] in cooperation with G.I.T. Laboratory Journal
BASICS OF PHOTOMETRIC MEASUREMENT
FAQ – The importance of “photometric Zero” Performing a zero (see manuals!) LED meters, e.g. pHotoFlex® Series Portable meters require a zero due to changing conditions, transportation and optics. Filter photometers, e.g. photoLab® S12 In lab with stable conditions, slow drift and often stabilizing reference beam requires less zeroing. Spectrophotometers, e.g. photoLab® 7000 Series Zero/base line is required for many functions of spectral tasks, concentration mode is similar to filter photometers with reference beam
16
Influence of meter drift: => Zeroing Package leaflet of many tests show sensitivity by correlating absorbance A (E=A) to mg/l. Influence can be seen directly: For COD test 14560, 4-40 mg/l COD, an absorbance of 10 mE means 0.4 mg/l COD. 10 mE drift without zeroing means 0.4 mg/l or 10% evitable miss-reading in the low end!