the canadian neonatal network le réseau néonatal canadien
TRANSCRIPT

FMC
IWK
HSC
CHUQ
OTTA SJRH
HHSC
BCWH
SEHC
KGH
RCH
HSJ
EDM
RQHR
WRH
SBGH JGH
CHUS
RUH
GVS
CBRH MUHC
ECH JCHC
SUNY
SMH
ACH
MSH LHSC
™
™
The Canadian Neonatal Network ™
Le Réseau Néonatal Canadien ™
Annual Report 2015 Rapport Annuel
HSCC

i
Acknowledgements This report is based upon data collected from 30 Health Care Organizations from across Canada that were members of the Canadian Neonatal Network™ during the year 2015. In addition to all investigators and the funding agency, we would like to recognize the invaluable support of the Neonatal Intensive Care Units (NICUs) that contributed to this information, the support of all of the participating sites and most importantly, the dedication and hard work of the Site Investigators, NICU Medical Directors and Data Abstractors. Structure of the CNN The Canadian Neonatal Network™ (CNN) is a group of Canadian researchers who collaborate on research issues relating to neonatal care. The Network was founded in 1995 by Dr. Shoo Lee. The Network maintains a standardized neonatal database and provides unique opportunities for researchers to participate in collaborative projects on a national and an international scale. Health care professionals, health services researchers, and health care administrators participate actively in clinical, epidemiologic, outcomes, health services, health policy and informatics research aimed at improving quality, effectiveness and efficiency of neonatal care. Research results are published in Network reports and in peer-reviewed journals. Funding The CNN infrastructure is funded by the Canadian Institutes of Health Research. Individual participating sites provided additional funding for data collection and other related resources. The coordinating center, Maternal-Infant Care Research Center, is supported by Mount Sinai Hospital, Toronto, Ontario. Coordinating Centre of the CNN Maternal-Infant Care Research Centre, Mount Sinai Hospital, Toronto, Ontario Network Chairman: Dr. Shoo K. Lee, University of Toronto Network Director: Dr. Prakesh Shah, University of Toronto Executive Committee: Ms. Martine Claveau, McGill University Dr. Kimberly Dow, Queen’s University Dr. Walid El-Naggar, Dalhousie University Dr. Adele Harrison, University of British Columbia Dr. Abhay Lodha, University of Calgary Dr. Vibhuti Shah, University of Toronto
CNN Coordinator: Ms. Priscilla Chan, Mount Sinai Hospital Analyst: Mr. Eugene W. Yoon, Mount Sinai Hospital

ii
Report Review Committee: Dr. Alexander Allen, Dalhousie University Dr. Keith Barrington, University of Montreal Dr. Orlando Da Silva, University of Western Ontario Dr. Akhil Deshpandey, Memorial University Dr. Michael Dunn, University of Toronto Ms. Wendy Seidlitz, Hamilton Health Sciences Dr. Mary Seshia, University of Manitoba Dr. Prakesh Shah, University of Toronto (Chair) Dr. Nalini Singhal, University of Calgary Participating CNN Sites and Site Investigators for the 2015 Report: Victoria General Hospital, Victoria, British Columbia Dr. Adele Harrison BC Women’s Hospital, Vancouver, British Columbia Dr. Anne Synnes & Dr. Joseph Ting Royal Columbian Hospital, New Westminster, Dr. Zenon Cieslak
British Columbia Surrey Memorial Hospital, Surrey, British Columbia Dr. Rebecca Sherlock Foothills Medical Centre, Calgary, Alberta Dr. Wendy Yee Alberta Children’s Hospital, Calgary, Alberta Dr. Carlos Fajardo Royal Alexandra Hospital, Edmonton, Alberta Dr. Khalid Aziz &
& University of Alberta Hospital – Dr. Jennifer Toye Stollery Children's, Edmonton, Alberta
Royal University Hospital, Saskatoon, Saskatchewan Dr. Koravangattu Sankaran & Dr. Sibasis Daspal Regina General Hospital, Regina, Saskatchewan Dr. Zarin Kalapesi Winnipeg Health Sciences Centre, Winnipeg, Manitoba Dr. Mary Seshia St. Boniface General Hospital, Winnipeg, Manitoba Dr. Ruben Alvaro Windsor Regional Hospital, Windsor, Ontario Dr. Chuks Nwaesei London Health Sciences Centre, London, Ontario Dr. Orlando Da Silva Hamilton Health Sciences, Hamilton, Ontario Dr. Sandesh Shivananda Mount Sinai Hospital, Toronto, Ontario Dr. Prakesh Shah Hospital for Sick Children, Toronto, Ontario Dr. Kyong-Soon Lee Sunnybrook Health Sciences Centre, Toronto, Ontario Dr. Michael Dunn Kingston General Hospital, Kingston, Ontario Dr. Kimberly Dow Children’s Hospital of Eastern Ontario, Ottawa, Ontario Dr. Brigitte Lemyre
& The Ottawa Hospital, Ottawa, Ontario Jewish General Hospital, Montréal, Québec Dr. Ermelinda Pelausa Hôpital Sainte-Justine, Montréal, Québec Dr. Keith Barrington McGill University Health Centre, Montréal, Québec Dr. Daniel Faucher & (formerly Montréal Children’s Hospital and Ms. Martine Claveau Royal Victoria Hospital) Centre Hospitalier Universitaire de Québec, Sainte Foy, Dr. Bruno Piedboeuf &
Québec Dr. Christine Drolet Centre Hospitalier Universitaire de Sherbrooke, Sherbrooke, Dr. Valérie Bertelle &
Québec Dr. Edith Massé Dr. Everett Chalmers Hospital, Fredericton, New Brunswick Dr. Hala Makary

iii
Saint John Regional Hospital, Saint John, New Brunswick Dr. Cecil Ojah & Dr. Luis Monterrosa Moncton Hospital, Moncton, New Brunswick Dr. Rody Canning IWK Health Centre, Halifax, Nova Scotia Dr. Jehier Afifi Cape Breton Regional Hospital, Sydney, Nova Scotia Dr. Andrzej Kajetanowicz Janeway Children’s Health and Rehabilitation Centre, Dr. Akhil Deshpandey
St. John’s, Newfoundland Written & Prepared By: Dr. Prakesh Shah, Eugene W. Yoon, Priscilla Chan and Members of the Annual Report Review Committee Cover page adapted by Courtney Cheng and Priscilla Chan © www.123rf.com/profile_ kudryashka

iv
Table of contents Page
A. Executive Summary 1 B. CNN Site Characteristics 3 C. Information Systems 4 D. Descriptive Analyses 5 D.1. Analyses based on number of eligible admissions to participating Canadian sites Presentation #1 All admissions: Type of admissions: All sites 8
Presentation #2 All admissions: Admission illness severity scores (SNAP-II and SNAP-IIPE): Sites with complete data 10
D.2. Analyses based on number of eligible neonates admitted to participating Canadian sites Presentation #3 Gestational age distribution: All sites and all admitted neonates 13 Presentation #4 Survival to discharge by GA: All admissions including delivery room deaths 15 Presentation #5 Birth weight distribution: All sites and all admitted neonates 16 Presentation #6 Survival to discharge by BW: All admissions including delivery room deaths 17 Presentation #6b Survival to discharge by BW: BW < 1000g including delivery room deaths 18 Presentation #7 Maternal and peripartum characteristics: All neonates 19 Presentation #8a Resuscitation details: GA < 31 weeks 21 Presentation #8b Resuscitation details: GA ≥ 31 weeks 22 Presentation #9 Early onset sepsis: All GA 23 Presentation #10 Late onset sepsis: All GA 24 Presentation #11 Late onset sepsis: All BW 25 Presentation #12 Other diagnoses / interventions / procedures: All GA 26 D.3. Analyses based on number of very preterm (GA < 33 weeks) or VLBW (< 1500g) neonates Presentation #13 Patent ductus arteriosus treatments: GA < 33 weeks 29 Presentation #14 Patent ductus arteriosus treatments: BW < 1500g 30 Presentation #15 Neuroimaging findings: GA < 33 weeks 31 Presentation #16 Neuroimaging findings: BW < 1500g 33 Presentation #17 Necrotizing enterocolitis treatments: GA < 33 weeks 35 Presentation #18 Necrotizing enterocolitis treatments: BW < 1500g 36 Presentation #19a Oxygen use at 36 weeks or at discharge: GA < 33weeks 37 Presentation #19b Any respiratory support at 36 weeks or at discharge: GA <33 weeks 38 Presentation #20a Oxygen use at 36 weeks or at discharge: BW < 1500g 39 Presentation #20b Any respiratory support at 36 weeks or at discharge: BW < 1500g 40 Presentation #21 Retinopathy of prematurity staging: GA < 33 weeks 41 Presentation #22 Retinopathy of prematurity staging: BW < 1500g 42 Presentation #23 Retinopathy of prematurity treatments: GA < 33 weeks 43 Presentation #24 Retinopathy of prematurity treatments: BW < 1500g 44 Presentation #25a Mortality or significant morbidities: GA < 33 weeks 45 Presentation #25b Mortality or significant morbidities: GA < 33 weeks 46 E. Site Comparisons E.1. Site Comparisons – Survival / Mortality Presentation #26 Survival rates by site: All GA 49

v
Presentation #27 Survival rates by site: All BW 50 Presentation #28a Mortality: GA < 33 weeks: Adjusted standardized ratios by site 51 Presentation #28b Mortality: GA < 33 weeks: Adjusted standardized ratios by site: Funnel plot 52 Presentation #28c Mortality: GA < 29 weeks: Adjusted standardized ratios by site 53 Presentation #28d Mortality: GA < 29 weeks: Adjusted standardized ratios by site: Funnel plot 54 E.2. Site Comparisons – Mortality / Morbidities
Presentation #29 Mortality / morbidities: GA < 33 weeks: Site specific crude rates 56 Presentation #30 Mortality / morbidities: GA<29 weeks: Site specific crude rates 57 E.2.1. Site Comparisons – Late Onset Sepsis Presentation #31 Late onset sepsis: GA < 33 weeks: Site specific crude rates 59 Presentation #32a Late onset sepsis: GA < 33 weeks: Adjusted standardized ratios by site 60 Presentation #32b Late onset sepsis: GA < 33 weeks: Adjusted standardized ratios by site: Funnel plot 61 Presentation #32c Late onset sepsis: GA < 29 weeks: Adjusted standardized ratios by site 62 Presentation #32d Late onset sepsis: GA < 29 weeks: Adjusted standardized ratios by site: Funnel plot 63 Presentation #33 Late onset sepsis per 1000 patient days: GA < 33 weeks: Site specific crude rates 64 Presentation #34a CLABSI per 1000 central line days: GA < 33 weeks: Site specific crude rates 65 Presentation #34b CLABSI per 1000 central line days: All neonates: Site specific crude rates 66 E.2.2. Site Comparisons – Patent Ductus Arteriosus Presentation #35 Rate of treatment for PDA: GA < 33 weeks who had PDA: Site specific crude rates 67 Presentation #36 Surgical PDA ligation rates: GA < 33 weeks who had PDA: Site specific crude rates 68 E.2.3. Site Comparisons – Neuroimaging Abnormalities Presentation #37 Neuroimaging abnormalities rates: GA < 33 weeks: Site specific crude rates 69 Presentation #38a IVH grade 3 or 4 or PVL: GA < 33 weeks: Adjusted standardized ratios by site 71 Presentation #38b IVH grade 3 or 4 or PVL: GA < 33 weeks: Adjusted standardized ratios by site: Funnel plot 72 Presentation #38c IVH grade 3 or 4 or PVL: GA < 29 weeks: Adjusted standardized ratios by site 73 Presentation #38d IVH grade 3 or 4 or PVL: GA < 29 weeks: Adjusted standardized ratios by site: Funnel plot 74 E.2.4. Site Comparisons – Necrotizing Enterocolitis Presentation #39 NEC treatment rates: GA < 33 weeks: Site specific crude rates 75 Presentation #40a NEC: GA < 33 weeks: Adjusted standardized ratios by site 77 Presentation #40b NEC: GA < 33 weeks: Adjusted standardized ratios by site: Funnel plot 78 Presentation #40c NEC: GA < 29 weeks: Adjusted standardized ratios by site 79 Presentation #40d NEC: GA < 29 weeks: Adjusted standardized ratios by site: Funnel plot 80 E.2.5. Site Comparisons – Oxygen Use at 36 weeks Presentation #41 Oxygen use at 36 weeks / at discharge / death: GA < 33 weeks: Site specific crude rates 81 Presentation #42 Oxygen use at 36 weeks / at discharge: GA < 33 weeks: Site specific crude rates 82
Presentation #43a Oxygen use at 36 weeks / at discharge: GA < 33 weeks: Adjusted standardized ratios by site 83
Presentation #43b Oxygen use at 36 weeks / at discharge: GA < 33 weeks: Adjusted standardized ratios by site: Funnel plot 84
Presentation #43c Oxygen use at 36 weeks / at discharge: GA < 29 weeks: Adjusted standardized ratios by site 85
Presentation #43d Oxygen use at 36 weeks / at discharge: GA < 29 weeks: Adjusted standardized ratios by site: Funnel plot 86
E.2.6. Site Comparisons – Postnatal Use of Steroids

vi
Presentation #44a Postnatal use of steroids for treatment of BPD: GA < 33 weeks: Site specific crude rates 87 Presentation #44b Systemic steroids for hypotension: GA < 33 weeks: Site specific crude rates 88 E.2.7. Site Comparisons – Retinopathy of Prematurity Presentation #45a ROP ≥ stage 3: GA < 33 weeks: Adjusted standardized ratios by site 89 Presentation #45b ROP ≥ stage 3: GA < 33 weeks: Adjusted standardized ratios by site: Funnel plot 90 Presentation #45c ROP ≥ stage 3: GA < 29 weeks: Adjusted standardized ratios by site 91 Presentation #45d ROP ≥ stage 3: GA < 29 weeks: Adjusted standardized ratios by site: Funnel plot 92 E.2.8. Site Comparisons – Mortality or Major Morbidity Presentation #46a Mortality or major morbidity: GA < 33 weeks: Adjusted standardized ratios by site 93
Presentation #46b Mortality or major morbidity: GA < 33 weeks: Adjusted standardized ratios by site: Funnel plot 94
Presentation #46c Mortality or major morbidity: GA < 29 weeks: Adjusted standardized ratios by site 95
Presentation #46d Mortality or major morbidity: GA < 29 weeks: Adjusted standardized ratios by site: Funnel plot 96
E.2.9. Benchmarking Presentation #47a Benchmarking among all neonates 97-98 Presentation #47a Benchmarking among neonates with BW < 1500 g 97-98 Presentation #47b Benchmarking for sites which contributed all eligible admissions with GA < 33 weeks 99-100 Presentation #47b Benchmarking for sites which contributed all eligible admissions with GA < 29 weeks 99-100 Benchmarking by adjusted Standardized Ratios (SR) Presentation #48a Mortality and morbidities: Sites with < 60 neonates: Petal chart from adjusted SR 102 Presentation #48b Mortality and morbidities: Sites with 60 – 109 neonates: Petal chart from adjusted SR 103 Presentation #48c Mortality and morbidities: Sites with 110 – 200 neonates: Petal chart from adjusted SR 104 Presentation #48d Mortality and morbidities: Sites with > 200 neonates: Petal chart from adjusted SR 105 F. Discharge Disposition & Status Presentation #49 Discharge destination: All GA: Crude rates 107 Presentation #50 Support at discharge: Infants who were discharged home: Crude rates 108 G. Hypoxic Ischemic Encephalopathy Presentation #51 Hypoxic Ischemic Encephalopathy 110 H. Trend Analyses over last 6 years 113 I. Conclusions 128 J. 2015 CNN publications 129 K. Appendices Outcomes Definitions 133 CNN Definitions and Major Anomalies 133 Abbreviations 134

A. Executive Summary
1
A. Executive Summary
This report from the Canadian Neonatal NetworkTM (CNN) is based on data from 30 tertiary sites, which contributed data in the year 2015.
Summary of Results/Methodology
Canadian Neonatal Network™ Database: Admissions between January 1, 2015 and December 31, 2015 who were discharged by March 31, 2016 were included. Total number of eligible admissions to participating Canadian sites 16 076 (See section D.1 for analyses) Total number of eligible individual neonates 14 815 (See section D.2. for analyses) Total number of eligible very preterm (<33 weeks GA) neonates 4 030 Total number of eligible extremely preterm (<29 weeks GA) neonates 1 569 (See section D.3. for analyses) Total number of eligible very low birth weight (VLBW) neonates 2 782 (See section D.3. for analyses) Data on patient demographics, components of care and outcome until discharge from the participating site were entered into a computer and transferred electronically to the Coordinating Centre, at the Maternal-Infant Care Research Centre (MiCare), where the data were verified and analyzed.
Important notes regarding data interpretations
1. Neonates who were transferred to a “normal newborn care area” (level I nursery) or discharged home within 24 hours of their admission to the site were excluded.
2. In 2015, five (5) sites had resource limitations and were only able to contribute data from a subset of eligible neonates admitted to their NICUs.
3. Characteristics of participating CNN sites are highlighted at the outset of the presentations.
4. ‘Missing’ data on outcome variables vary for each presentation. Caution should be used in interpreting the information.
5. The denominator for all percentages in this report includes neonates whose data for that particular item are available.
6. Data only include neonates admitted to the NICUs, except for Presentations #4, #6 and #6b.
7. Presentations #4, #6 and #6b include delivery room deaths. 8. Data should be used with caution and understanding that neonates who were not
admitted to participating NICUs were not included in this report.

A. Executive Summary
2
Outcomes Definitions
Mortality: Death prior to discharge from NICU. Intraventricular hemorrhage (IVH), ventricular enlargement or parenchymal echogenicity or periventricular leukomalacia (PVL): Defined as grade 3 IVH (intraventricular hemorrhage with ventricular enlargement) or grade 4 IVH (intraventricular hemorrhage and persistent parenchymal echogenicity) or persistent parenchymal echogenicity. Retinopathy of prematurity (ROP): Stage 3, 4 or 5 ROP or those requiring surgery as defined by the International Classification of Retinopathy of Prematurity1. ROP was scored as the highest stage in either eye identified during the admission. Necrotizing enterocolitis (NEC): Stage 2 or 3 NEC according to Bell’s classification2. Nosocomial infection (NI): Isolation of bacterial, fungal or viral organism from blood or cerebrospinal fluid in a symptomatic infant after 2 days of age. Bronchopulmonary dysplasia (BPD): Defined as the need for oxygen at 36 weeks post-menstrual age or at discharge to level 2 centers with the need for respiratory support or oxygen. Survival without major morbidities: Defined as survival at discharge from NICU without having any of BPD, NEC stage 2 or 3, IVH grade 3 or 4 or PVL, NI or ROP stage 3, 4 or 5 during the stay in NICU.
1 An International Committee for the Classification of Retinopathy of Prematurity. The International Classificaiton of Retinopathy of Prematurity Revisited. Arch Ophthalmol 2005;123:991-999 2 Bell MJ, Ternberg JL, Feigin RD, et al. Neonatal necrotizing enterocolitis. Therapeutic decisions based upon clinical staging. Ann Surg 1978;187:1–7

B. Site Characteristics
3
B. CNN Site Characteristics
SITE CNN data collection criteria
Level II / Step-down
nursery?
Level II / Step-down data
included in CNN?
Delivery room
deaths included in CNN 2015 data
ROP surgical / laser
service?
PDA surgical service?
Victoria General Hospital All eligible admissions y y y y y
BC Women’s Hospital All eligible admissions y n n y y
Royal Columbian Hospital All eligible admissions y y y y n
Surrey Memorial Hospital All eligible admissions y y y n n
Foothills Medical Centre All eligible admissions n n/a n y y
Alberta Children’s Hospital All eligible admissions n n/a n/a y y
Royal Alexandra Hospital (Edmonton)* < 33 weeks GA & all HIE y y y y n
University of Alberta Hospital - Stollery (Edmonton)* All eligible admissions n n/a n/a n y
Regina General Hospital All eligible admissions y y y n n
Royal University Hospital All eligible admissions n n/a n n y
Health Sciences Centre Winnipeg All eligible admissions y y y y y
St. Boniface General Hospital All eligible admissions n n/a y y y
Hamilton Health Sciences All eligible admissions y n y y y
London Health Sciences Centre All eligible admissions y y y y y
Windsor Regional Hospital < 33 weeks GA and/or < 1500g n n/a n y n
Hospital for Sick Children All eligible admissions n n/a n/a y y
Mount Sinai Hospital All eligible admissions y y y n n
Sunnybrook Health Sciences Centre All eligible admissions n n/a y n n
Children's Hospital of Eastern Ontario < 33 weeks GA y y y y y
Kingston General Hospital All eligible admissions y y y y y
Jewish General Hospital All eligible admissions y y y y n
Hôpital Sainte-Justine All eligible admissions y n y y y
Centre Hospitalier Universitaire de Quebec < 29 weeks GA y n y y y
McGill University Health Centre All eligible admissions n n/a y y n Centre Hospitalier Universitaire de Sherbrooke < 33 weeks GA y n y n n
The Moncton Hospital All eligible admissions n n/a y n n
Dr. Everett Chalmers Hospital All eligible admissions n n/a y n n
Saint John Regional Hospital All eligible admissions n n y n n Janeway Children's Health and Rehabilitation Centre All eligible admissions y y y y y
IWK Health Centre All eligible admissions y y y y y
Cape Breton Regional Hospital All eligible admissions n n/a y n n
* Royal Alexandra Hospital & University of Alberta Hospital transmit data as one site

C. Information Systems
4
C. Information Systems
Neonates included in this report are those who were admitted to a CNN participating site between January 1, 2015 and December 31, 2015, and were discharged by March 31, 2016. The neonates must have had a length of stay in the site of one of the CNN participating sites for greater than or equal to 24 hours, or died or were transferred to another level 2 or 3 facility within 24 hours. A total of 14 815 patients accounted for 16 076 admissions as some neonates were admitted on more than one occasions. Patient information was retrospectively abstracted from patient charts by trained personnel using standard definitions and protocols contained in a standard manual of operations. Data were usually entered into a laptop computer using a customized data entry program with built-in error checking and subsequently sent electronically to the Canadian Neonatal Network™ Coordinating Centre, located at the Maternal-Infant Care Research Centre (MiCare) in Toronto, Ontario. Patient data at each participating site are available to the respective site investigator and data abstractor only. Patient identifiers were stripped prior to data transfer to the Coordinating Centre. Patient confidentiality was strictly observed. A unique identifier was generated for each entry of neonate in the system and that identifier was followed throughout the stay at one or more hospitals. Individual-level data are used for analyses, but only aggregate data are reported. The results presented in this report will not identify participating sites by name; each site is anonymous using a randomly assigned number. Wherever a small cell size (≤5) was observed in the data output, the data were grouped to maintain anonymity. At each participating site, data are stored in a secured database in the site or in an alternate secured site used by the site to store patient information (e.g. health records department, computer services department). At the Coordinating Centre, the central database is stored in a secured computer database located on a server and off site back up that is maintained and secured by the Mount Sinai Hospital Information Technology Department. At the Coordinating Centre, information was verified for completeness and was reviewed for accuracy by looking for “unusual” and missing values on individual data items and by comparison with other information that might be related (e.g. GA and birth weight [BW]). However, the principal accuracy rests upon the diligence and capabilities of the individual sites. Each site had one or occasionally two dedicated person(s) responsible for data acquisition and transmission. At the Coordinating Centre, analyses were conducted using univariate, bivariate, and multivariate analyses for the total cohort, and for individual sites. Multivariable regression analysis was used to identify risk factors associated with mortality and major morbidities. Grouped data enabled development of outcome graphs by GA and BW for mortality and selected major morbidities. Similar systems have been used to assist in quality assurance, and predict resource utilization.

D. Descriptive Analyses
5
D. Descriptive Analyses
This section is divided into three sub-sections.
Section D.1. Analyses based on number of eligible admissions to participating sites
These include data from 16 076 eligible admissions (including readmissions) to 30 sites. 25 of these sites submitted complete data (n=14 810) on all admissions and 5 sites submitted data on a selected admission cohort (n=1 266).
Section D.2. Analyses based on number of eligible neonates admitted to participating sites
These include data from 14 815 eligible neonates admitted to 30 sites. 25 of these sites submitted complete data (n=13 784) on all eligible admitted neonates and 5 sites submitted data on selected eligible admitted neonates (n=1 031).
Section D.3. Analyses based on number of eligible very preterm (< 33 weeks GA) or very low BW (<1500g BW) neonates
These include data from 4 030 eligible very preterm neonates and 2 782 eligible VLBW neonates.

D. Descriptive Analyses
6
Canadian Neonatal Network™ Database: Admissions between January 1, 2015 and December 31, 2015 who were discharged by March 31, 2016. Readmissions from 2014, moribund, and delivery room deaths were excluded.
Discharge destination Home 7 369 Non-CNN site 3 584 Intra-site 3 138 Tertiary site 313 Death 376 Palliative Care 13 Out of country 12 Missing 10
GA or BW missing 8
GA > 33 week and
Birth-weight > 1500g
10 613
GA > 33 week and
Birth-weight < 1500g
167
GA < 33 week and
Birth-weight > 1500g
1 413
GA < 33 week and
Birth-weight < 1500g
2 614
Section D.3 Very-preterm
Total number of eligible very preterm (<33 weeks
GA) neonates 4 030
Section D.3 VLBW
Total number of very low birth weight (VLBW)
neonates 2 782*
Section D.2
Total number of eligible admissions to participating Canadian NICUs (30 sites)
16 076
14 810 from 25 sites with complete data 1 266 from 5 sites with limited data
Section D.1
Total number of eligible individual neonates admitted to participating NICUs (30 sites)
14 815
13 784 from 25 sites with complete data 1 031 from 5 sites with limited data
Readmissions 541 Intra-CNN Transfers 720
* including 1 neonate whose GA was missing but BW < 1500g

D. Descriptive Analyses
7
Section D.1
Analyses based on number of eligible admissions to participating sites
These include data from 16 076 eligible admissions (including readmissions) to 30 sites. 25 of these sites submitted complete data (n=14 810) on all admissions and 5 sites submitted data on a selected admission cohort (n=1 266).

D. Descriptive Analyses
8
Presentation #1 All admissions: Type of admissions: All Sites
ᶲ Data collected on selected cohort of eligible admissions only.
0
100
200
300
400
500
600
700
800
900
1000
1100
1200
a b cᶲ d eᶲ f g h iᶲ j k l m n o p q r s t u vᶲ w x y zᶲ aa ab ac ad
Num
ber o
f adm
issi
ons
CNN Hospitals
Inborn Outborn Readmission

D. Descriptive Analyses
9
Presentation #1 (continued) All admissions: Type of admissions: All Sites
Sites Admission Status
Total
Sites Admission status
Total Inborn Outborn Readmission Inborn Outborn Readmission
a Count 378 131 7 516 p Count 552 89 21 662
% 73.3 25.4 1.4 (100.0) % 83.4 13.4 3.2 (100.0)
b Count 412 86 11 509 q Count 354 279 16 649
% 80.9 16.9 2.2 (100.0) % 54.6 43.0 2.5 (100.0)
cᶲ Count 139 26 1 166 r Count 273 53 3 329
% 83.7 15.7 0.6 (100.0) % 83.0 16.1 0.9 (100.0)
d Count 1019 87 4 1110 s Count 427 459 70 956
% 91.8 7.8 0.4 (100.0) % 44.7 48.0 7.3 (100.0)
eᶲ Count 78 5 4 87 t Count 295 2 9 306
% 89.7 5.8 4.6 (100.0) % 96.4 0.7 2.9 (100.0)
f Count 598 257 14 869 u Count 716 248 47 1011
% 68.8 29.6 1.6 (100.0) % 70.8 24.5 4.7 (100.0)
g Count 113 10 8 131 vᶲ Count 69 15 7 91
% 86.3 7.6 6.1 (100.0) % 75.8 16.5 7.7 (100.0)
h Count 136 18 3 157 w Count 413 127 13 553
% 86.6 11.5 1.9 (100.0) % 74.7 23.0 2.4 (100.0)
iᶲ Count 57 8 9 74 x Count 698 123 18 839
% 77.0 10.8 12.2 (100.0) % 83.2 14.7 2.2 (100.0)
j Count 373 63 15 451 y Count 0 237 13 250
% 82.7 14.0 3.3 (100.0) % 0.0 94.8 5.2 (100.0)
k Count 703 101 7 811 zᶲ Count 322 404 122 848
% 86.7 12.5 0.9 (100.0) % 38.0 47.6 14.4 (100.0)
l Count 302 64 3 369 aa Count 0 763 47 810
% 81.8 17.3 0.8 (100.0) % 0.0 94.2 5.8 (100.0)
m Count 234 16 6 256 ab Count 589 42 17 648
% 91.4 6.3 2.3 (100.0) % 90.9 6.5 2.6 (100.0)
n Count 331 53 2 386 ac Count 1101 20 27 1148
% 85.8 13.7 0.5 (100.0) % 95.9 1.7 2.4 (100.0)
o Count 299 47 4 350 ad Count 603 116 13 732
% 85.4 13.4 1.1 (100.0) % 82.4 15.9 1.8 (100.0)
Total number of admissions: 16 076 Inborn: 11 584 (72.1%) Outborn: 3 949 (24.6%) Readmission: 541 (3.4%) Missing data on admission status: 2 (0.01%)
COMMENTS: These analyses include 16 076 admissions to participating sites across Canada during the period of January 1, 2015 to December 31, 2015. Adjusting for readmission, these represent 14 815 Neonates. Twenty-five sites collected data on all eligible admissions whereas five sites (marked by ᶲ) collected data on selected cohort of eligible admissions only.

D. Descriptive Analyses
10
Presentation #2 All admissions: Admission illness severity scores (SNAP-II and SNAP-IIPE):
Sites with complete data (n=25 sites, 14 810 admissions, 486 missing data on SNAP scores)
Note: Median scores for SNAPII and SNAPIIPE for sites with complete data is 0 (zero).
0
1
2
3
4
5
6
7
8
9
10
11
12
13
14
15
16
17
A B C E F G H I J K L N O P Q R S U W X Y AA AB AC AD
Mea
n Sc
ores
Site
SNAPPEII Score SNAPII Score SNAPPEII Mean SNAPII Mean

D. Descriptive Analyses
11
Presentation #2 (continued) All admissions: Admission illness severity scores (SNAP-II and SNAP-IIPE): All
sites Site SNAP-IIPE SNAP-II Site SNAP-IIPE SNAP-II
A Mean 11.5 5.6
P Mean 9.5 6.1
SEM 0.6 0.4 SEM 0.5 0.3
B Mean 4.8 1.9
Q Mean 7.7 3.2
SEM 1.0 0.6 SEM 0.5 0.3
C Mean 7.6 2.9
R Mean 6.6 3.4
SEM 0.7 0.4 SEM 0.5 0.4
Dᶲ Mean 11.4 5.7
S Mean 5.8 2.9
SEM 2.2 1.4 SEM 0.6 0.3
E Mean 10.9 4.5
Tᶲ Mean 15.8 8.4
SEM 1.0 0.6 SEM 1.8 1.0
F Mean 14.7 9.4
U Mean 10.4 4.9
SEM 0.5 0.4 SEM 0.8 0.4
G Mean 9.1 4.3
Vᶲ Mean 33.0 16.4
SEM 0.7 0.4 SEM 2.4 1.6
H Mean 12.7 6.1
W Mean 16.6 9.3
SEM 0.6 0.4 SEM 0.7 0.5
I Mean 10.5 4.7
X Mean 7.1 3.3
SEM 1.2 0.6 SEM 0.6 0.3
J Mean 6.8 2.9
Y Mean 7.2 3.6
SEM 0.6 0.4 SEM 0.5 0.3
K Mean 8.1 4.3
Zᶲ Mean 18.8 9.9
SEM 0.6 0.4 SEM 1.6 0.8
L Mean 7.0 4.3
AA Mean 12.7 6.0
SEM 0.6 0.4 SEM 0.6 0.4
Mᶲ Mean 15.5 7.2
AB Mean 10.8 6.7
SEM 0.6 0.4 SEM 0.5 0.3
N Mean 6.3 1.7
AC Mean 5.2 0.6
SEM 0.4 0.2 SEM 3.2 0.4
O Mean 11.4 5.3
AD Mean 6.5 2.3
SEM 0.5 0.4 SEM 0.7 0.4 All eligible admissions overall (25 sites) – Mean (SEM): SNAP-IIPE 9.7 (0.1), SNAP-II 5.0 (0.1) Selected admissions overall (5 sites) – Mean (SEM): SNAP-IIPE 16.7 (0.5), SNAP-II 8.2 (0.3)
COMMENTS: These analyses include 16 076 admissions (515 missing data on SNAP scores) to participating sites across Canada during the year 2015. Adjusting for readmission, these analyses represent 14 815 Neonates. Twenty-five sites collected data on all eligible admissions whereas five sites (marked by ᶲ) collected data on a selected cohort of eligible admissions only. These five sites have not been included in the previous bar graph but have been included in the above Table. ᶲ Please note that the criteria for entering neonates in the CNN dataset are not the same for these five sites and thus, the scores are not comparable with each other or with centers contributing complete data. These five sites may have included neonates at lower GAs and/or lower BWs; thus, their severity of illness scores may be different.

D. Descriptive Analyses
12
Section D.2
Analyses based on number of eligible neonates admitted to participating sites
These include data from 14 815 eligible neonates admitted to 30 sites. 25 of these sites submitted complete data (n=13 784) on all eligible admitted neonates and 5 sites submitted data on a selected cohort of eligible admitted neonates (n=1 031).

D. Descriptive Analyses
13
Presentation #3 Gestational age distribution: All sites and all admitted neonates
0
100
200
300
400
500
600
700
800
900
1000
1100
1200
1300
1400
1500
1600
<23 23 24 25 26 27 28 29 30 31 32 33 34 35 36 37 38 39 40 41 ≥42
Num
ber o
f inf
ants
Gestational age (completed weeks)

D. Descriptive Analyses
14
Presentation #3 (continued) Gestational age distribution: All sites and all admitted neonates
GA in completed weeks at birth Frequency Percent Cumulative
percent <23 14 0.1 0.1 23 99 0.7 0.8 24 177 1.2 2.0 25 248 1.7 3.6 26 289 2.0 5.6 27 317 2.1 7.7 28 425 2.9 10.6 29 470 3.2 13.8 30 536 3.6 17.4 31 662 4.5 21.9 32 793 5.4 27.2 33 850 5.7 33.0 34 1 185 8.0 41.0 35 1 284 8.7 49.6 36 1 173 7.9 57.6 37 1 171 7.9 65.5 38 1 480 10.0 75.5 39 1 530 10.3 85.8 40 1 331 9.0 94.8 41 722 4.9 99.7 ≥42 51 0.3 100.0 Total included 14 807 100.0 Total # of missing (GA) 8 Total # of infants 14 815
COMMENTS: The GA distribution of neonates is shown here. Term babies (≥37 weeks) represent approximately 42.4% of the total number of neonates. Twenty-five sites collected data on all eligible admissions whereas five sites collected data on a selected cohort of eligible admissions.

D. Descriptive Analyses
15
Presentation #4 Survival to discharge by GA: All admissions including delivery room deaths
CNN admissions excluding delivery room deaths Delivery room deaths* Total CNN admissions including delivery room deaths*
GA (completed weeks)
Number of infants
Number of survivors
Percent survival among admission to NICU, excluding DR deaths
Number of infants who received palliative care
Palliative care
Active care Total
Number of infants who received palliative care
Number of infants who received active care
Percent survival among those who received active care
Percent survival among all neonates (CNN admission + DR deaths)
a b b/a c d e a+d+e c+d (a-c) +e b/ (a-c)+e b/(a+d+e) <23 14 5 36 0 46 8 68 46 22 23 7 23 99 56 57 0 36 7 142 36 106 53 39 24 177 134 76 0 12 1 190 12 178 75 71 25 248 201 81 0 5 3 256 5 251 80 79 26 289 256 89 0 3 3 295 3 292 88 87 27 317 303 96 0 1 3 321 1 320 95 94 28 425 409 96 0 2 2 429 2 427 96 95 29 470 464 99 0 2 3 475 2 473 98 98 ≥30 12 768 12 604 99 1 13 7 12 788 14 12 774 99 99 Total included 14 807 14 432 97 1 120 37 14 964 121 14 843 97 96
Total # of missing (GA)
8 2 0 10 2 8
Total # of infants 14 815 122 37 14 974 123 14 851
*Please note that delivery room deaths are included only in Presentations #4 and #6 in this report.
Note: The results should be used cautiously for antenatal counseling. The survival rates are based upon the final discharge from the participating neonatal site. Note that these rates include only neonates admitted to the sites or died in delivery room of participating sites and thus, are not reflective of the entire Canadian population. Capturing data for delivery room deaths is an ongoing process and not all sites contributed delivery room death data.
0102030405060708090
100
<23 23 24 25 26 27 28 29 ≥30
Perc
enta
ge o
f Sur
viva
l
Gestational age (completed weeks)
Amongadmissions toNICU excludingDR deaths
Among all whoreceived activecare
Among allneonates (CNNadmission + DRdeaths)

D. Descriptive Analyses
16
Presentation #5 Birth weight distribution: All sites and all admitted neonates
BW (grams) Frequency
Percent from total number of neonates
Cumulative percent
<500 40 0.3 0.3 500-749 406 2.7 3.0
750-999 680 4.6 7.6
1000-1249 792 5.4 13.0
1250-1499 864 5.8 18.8
1500-2499 4 672 31.5 50.3
2500-4499 7 111 48.0 98.3
>4499 248 1.7 100.0
Total included 14 813 100.0
Missing (BW) 2
Total # of neonates 14 815
COMMENTS: The BW distribution of neonates admitted to the sites. Eighty-one percent weighed more than 1 500g at birth and 50% weighed more than 2 500g. Twenty-five sites collected data on all admissions whereas five sites collected data on a selected cohort of eligible admissions only.
0500
10001500200025003000350040004500500055006000650070007500
Num
ber o
f inf
ants
Birth weight (grams)

D. Descriptive Analyses
17
Presentation #6 Survival to discharge by BW: All admissions including delivery room deaths
CNN Admissions not including DR deaths Delivery room deaths*
Total CNN admissions + Delivery room deaths*
BW (grams)
Number of infants
Number of survivors
Percent survival among admission to NICU, excluding DR deaths
Number of infants who received palliative care
Palliative care
Active care Total
Number of infants who received palliative care
Number of infants who received active care
Percent survival among those who received active care
Percent survival among all neonates (CNN admission + DR deaths)
a b b/a c d e a+d+e c+d (a-c) +e b/ (a-c)+e b/(a+d+e) <500 40 17 43 0 41 4 85 41 44 39 20 500-749 406 312 77 0 48 17 471 48 423 74 66 750-999 680 617 91 0 8 3 691 8 683 90 89 1000-1249 792 762 96 0 2 4 798 2 796 96 95 1250-1499 864 852 99 0 1 2 867 1 866 98 98 1500-2499 4 672 4 604 99 0 11 1 4 684 11 4 673 99 98 2500-4499 7 111 7 026 99 1 3 5 7 119 4 7 115 99 99 >4499 248 247 100 0 0 0 248 0 248 100 100 Total included 14 813 14 437 97 1 114 36 14 963 115 14 848 97 96
Missing (BW) 2 8 1 11 8 3
Total # of neonates 14 815 122 37 14 974 123 14 851
*Please note that delivery room deaths are included only in Presentations #4, #6 and #6b in this report. Note: The results should be used cautiously for antenatal counseling. The survival rates are based upon the final discharge from the participating neonatal site. Note that these rates include only neonates admitted to the sites or died in delivery room of participating sites and thus, are not reflective of the entire Canadian population. Capturing data for delivery room deaths is an ongoing process and not all sites contributed delivery room death data.
0102030405060708090
100Pe
rcen
tage
of s
urvi
val
Birth weight (grams)
Amongadmissions toNICU excludingDR deaths
Among all whoreceived activecare
Among allneonates (CNNadmission + DRdeaths)

D. Descriptive Analyses
18
Presentation #6b Survival to discharge by BW: BW <1000g including delivery room deaths
CNN Admissions not including DR deaths Delivery room deaths*
Total CNN admissions + Delivery room deaths*
BW (grams)
Number of infants
Number of survivors
Percent survival among admission to NICU, excluding DR deaths
Number of infants who received palliative care
Palliative care
Active care Total
Number of infants who received palliative care
Number of infants who received active care
Percent survival among those who received active care
Percent survival among all neonates (CNN admission + DR deaths)
a b b/a c d e a+d+e c+d (a-c) +e b/ (a-c)+e b/(a+d+e) <400 6 1 17 0 11 2 19 11 8 13 5 400-499 34 16 47 0 30 2 66 30 36 44 24 500-599 97 67 69 0 32 12 141 32 109 61 48 600-699 188 143 76 0 13 2 203 13 190 75 70 700-799 247 206 83 0 6 3 256 6 250 82 80 800-899 282 255 90 0 4 2 288 4 284 90 89 900-999 272 258 95 0 1 1 274 1 273 95 94 Total included 1126 946 84 0 97 24 1247 97 1150 82 76
*Please note that delivery room deaths are included only in Presentations #4, #6 and #6b in this report. Note: The results should be used cautiously for antenatal counseling. The survival rates are based upon the final discharge from the participating neonatal site. Note that these rates include only neonates admitted to the sites or died in delivery room of participating sites and thus, are not reflective of the entire Canadian population. Capturing data for delivery room deaths is an ongoing process and not all sites contributed delivery room death data.
0
10
20
30
40
50
60
70
80
90
100
<400 400-499 500-599 600-699 700-799 800-899 900-999
Perc
enta
ge o
f sur
viva
l
Birth weight (grams)
Amongadmissions toNICU excludingDR deaths
Among all whoreceived activecare
Among allneonates (CNNadmission + DRdeaths)
D. Descriptive Analyses
19
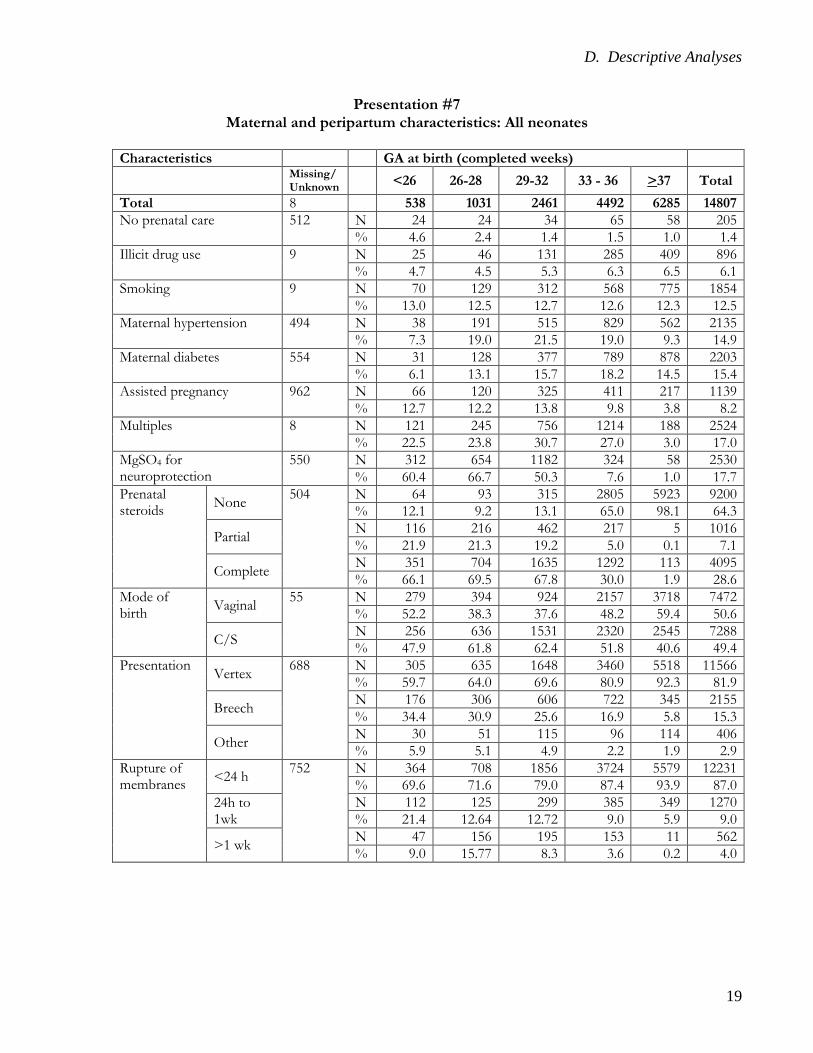
Presentation #7 Maternal and peripartum characteristics: All neonates
Characteristics GA at birth (completed weeks) Missing/
Unknown <26 26-28 29-32 33 - 36 >37 Total
Total 8 538 1031 2461 4492 6285 14807 No prenatal care 512 N 24 24 34 65 58 205
% 4.6 2.4 1.4 1.5 1.0 1.4 Illicit drug use 9 N 25 46 131 285 409 896
% 4.7 4.5 5.3 6.3 6.5 6.1 Smoking 9 N 70 129 312 568 775 1854
% 13.0 12.5 12.7 12.6 12.3 12.5 Maternal hypertension 494 N 38 191 515 829 562 2135
% 7.3 19.0 21.5 19.0 9.3 14.9 Maternal diabetes 554 N 31 128 377 789 878 2203
% 6.1 13.1 15.7 18.2 14.5 15.4 Assisted pregnancy 962 N 66 120 325 411 217 1139
% 12.7 12.2 13.8 9.8 3.8 8.2 Multiples 8 N 121 245 756 1214 188 2524
% 22.5 23.8 30.7 27.0 3.0 17.0 MgSO4 for neuroprotection
550 N 312 654 1182 324 58 2530 % 60.4 66.7 50.3 7.6 1.0 17.7
Prenatal steroids None 504 N 64 93 315 2805 5923 9200
% 12.1 9.2 13.1 65.0 98.1 64.3
Partial N 116 216 462 217 5 1016 % 21.9 21.3 19.2 5.0 0.1 7.1
Complete N 351 704 1635 1292 113 4095 % 66.1 69.5 67.8 30.0 1.9 28.6
Mode of birth Vaginal 55 N 279 394 924 2157 3718 7472
% 52.2 38.3 37.6 48.2 59.4 50.6
C/S N 256 636 1531 2320 2545 7288 % 47.9 61.8 62.4 51.8 40.6 49.4
Presentation Vertex 688 N 305 635 1648 3460 5518 11566 % 59.7 64.0 69.6 80.9 92.3 81.9
Breech N 176 306 606 722 345 2155 % 34.4 30.9 25.6 16.9 5.8 15.3
Other N 30 51 115 96 114 406 % 5.9 5.1 4.9 2.2 1.9 2.9
Rupture of membranes <24 h 752 N 364 708 1856 3724 5579 12231
% 69.6 71.6 79.0 87.4 93.9 87.0 24h to 1wk
N 112 125 299 385 349 1270 % 21.4 12.64 12.72 9.0 5.9 9.0
>1 wk N 47 156 195 153 11 562 % 9.0 15.77 8.3 3.6 0.2 4.0

D. Descriptive Analyses
20
Presentation #7 (continued) Maternal and peripartum characteristics: All neonates
Characteristics GA at birth (completed weeks) Missing/
Unknown <26 26-28 29-32 33 - 36 >37 Total
Total 8 538 1031 2461 4492 6285 14807 Chorioamnionitis* 5547 N 168 226 264 188 398 1244
% 41.7 29.5 15.5 6.6 11.3 13.4 Delayed cord clamping
< 29 sec 7159 N 10 14 8 11 8 51 % 3.2 2.8 0.7 0.5 0.2 0.7
30-44 sec N 9 17 21 19 2 68 % 2.9 3.4 1.9 0.8 0.1 0.9
>45 sec N 15 37 85 54 3 194 % 4.8 7.3 7.7 2.4 0.1 2.5
Yes, but timing unknown
N 0 2 3 7 2 14 % 0.0 0.4 0.3 0.3 0.1 0.2
No N 280 437 994 2166 3452 7329 % 89.2 86.2 89.5 96.0 99.6 95.7
*Chorioamnionitis is defined as documented “suspected or confirmed clinical chorioamnionitis” in chart or presence of maternal fever and either leukocytosis or uterine tenderness

D. Descriptive Analyses
21
Presentation #8a Resuscitation details: GA < 31 weeks
Action taken GA at birth (completed weeks) <23 24 25 26 27 28 29 30 Total Total 113 177 248 289 317 425 470 536 2575 No resuscitation needed/provided
N 1 0 2 0 2 2 16 40 63 % 0.9 0.0 0.8 0.0 0.6 0.5 3.4 7.5 2.4
CPAP N 23 62 95 151 190 285 330 365 1501 % 20.4 35.0 38.6 52.3 59.9 67.1 70.2 68.1 58.3
PPV via mask N 82 130 185 218 220 258 260 273 1626 % 72.6 73.5 75.2 75.4 69.4 60.7 55.3 50.9 63.2
PPV via ETT N 96 122 138 142 120 124 93 75 910 % 85.0 68.9 56.1 49.1 37.9 29.2 19.8 14.0 35.4
Chest compression N 9 16 25 18 19 17 10 11 125 % 8.0 9.0 10.2 6.2 6.0 4.0 2.1 2.1 4.9
Epinephrine N 5 7 12 8 6 6 4 6 54 % 4.4 4.0 4.9 2.8 1.9 1.4 0.9 1.1 2.1
Unknown N 0 1 1 2 2 3 4 2 15 % 0.0 0.6 0.4 0.7 0.6 0.7 0.9 0.4 0.6
Any resuscitation provided*
N 112 176 240 286 308 403 434 455 2414 % 99.1 99.4 97.6 99.0 97.2 94.8 92.3 84.9 93.8
Initial gas Air N 19 32 41 67 82 122 149 195 707 % 16.8 18.1 16.5 23.2 25.9 28.7 31.7 36.4 27.5
22-40% O2 N 32 72 100 99 112 146 139 128 828 % 28.3 40.7 40.3 34.3 35.3 34.4 29.6 23.9 32.2
41-70% O2 N 7 11 12 20 20 28 20 24 142 % 6.2 6.2 4.8 6.9 6.3 6.6 4.3 4.5 1.0
71-99% O2 N 1 3 4 8 2 4 0 3 25 % 0.9 1.7 1.6 2.8 0.6 0.9 0.0 0.6 1.0
100% O2 N 32 22 32 35 22 20 20 20 203 % 28.3 12.4 12.9 12.1 6.9 4.7 4.3 3.7 7.9
Unknown/Missing
N 22 37 59 60 79 105 142 166 670 % 19.5 20.9 23.8 20.8 24.9 24.7 30.2 31.0 26.0
Maximum O2 conc. during resus.
21% N 0 0 4 3 0 8 20 31 66 % 0.0 0.0 1.6 1.0 0.0 1.9 4.3 5.8 2.6
22-40% N 6 21 31 41 63 101 146 145 554 % 5.3 11.9 12.5 14.2 19.9 23.8 31.1 27.1 21.5
41-70% N 8 21 42 51 67 89 75 97 450 % 7.1 11.9 16.9 17.7 21.1 20.9 16.0 18.1 17.5
>70% N 85 110 133 151 134 148 114 102 977 % 75.2 62.2 53.6 52.3 42.3 34.8 24.3 19.0 37.9
Missing N 14 25 38 43 53 79 115 161 528 % 12.4 14.1 15.3 14.9 16.7 18.6 24.5 30.0 20.5
* Number of neonates who received any resuscitation includes those who received CPAP, PPV, chest compression or epinephrine NOTE: Please note that some of the definitions for items on this table were evolving during this first year of this data collection. Please use caution while interpreting these data. Resuscitation time was defined as first 30 minutes after birth.

D. Descriptive Analyses
22
Presentation #8b Resuscitation details: GA > 31 weeks
Action taken GA at birth (completed weeks) 31 32 33 34 35 36 >37 Total Total 662 793 850 1185 1284 1173 6285 12232 No resuscitation needed / provided
N 85 138 238 424 441 408 2139 3873 % 12.8 17.4 28.0 35.8 34.4 34.8 34.0 31.7
CPAP N 397 430 350 317 331 261 1297 3383 % 60.0 54.3 41.2 26.8 25.8 22.3 20.6 27.7
PPV via mask N 316 305 247 249 288 283 1724 3412 % 47.7 38.5 29.1 21.0 22.4 24.1 27.4 27.9
PPV via ETT N 69 56 47 33 45 46 472 768 % 10.4 7.1 5.5 2.8 3.5 3.9 7.5 6.3
Chest compression N 11 13 14 10 19 15 182 264 % 1.7 1.6 1.7 0.8 1.5 1.3 2.9 2.2
Epinephrine N 5 8 4 4 5 6 67 99 % 0.8 1.0 0.5 0.3 0.4 0.5 1.1 0.8
Unknown N 4 10 9 18 13 27 165 246 % 0.6 1.3 1.1 1.5 1.0 2.3 2.6 2.0
Any resuscitation provided*
N 514 542 446 438 485 426 2479 5330 % 77.6 68.4 52.5 37.0 37.8 36.3 39.5 43.6
Initial gas Air N 229 300 219 251 298 270 1462 3029 % 34.6 37.8 25.8 21.2 23.2 23.0 23.3 24.8
22-40% O2 N 132 101 103 106 98 75 378 993 % 19.9 12.7 12.1 9.0 7.6 6.4 6.0 8.1
41-70% O2 N 23 25 12 9 26 12 110 217 % 3.5 3.2 1.4 0.8 2.0 1.0 1.8 1.8
71-99% O2 N 2 2 10 1 4 4 22 45 % 0.3 0.3 1.2 0.1 0.3 0.3 0.4 0.4
100% O2 N 22 29 28 32 27 39 281 458 % 3.3 3.7 3.3 2.7 2.1 3.3 4.5 3.7
Unknown/Missing
N 254 336 478 786 831 773 4032 7490 % 38.4 42.4 56.2 66.3 64.7 65.9 64.2 61.2
Maximum O2 conc. during resus
21% N 36 53 65 93 125 103 604 1079 % 5.4 6.7 7.7 7.9 9.7 8.8 9.6 8.8
22-40% N 145 199 129 154 150 108 533 1418 % 21.9 25.1 15.2 13.0 11.7 9.2 8.5 11.6
41-70% N 94 91 71 56 65 54 256 687 % 14.2 11.5 8.4 4.7 5.1 4.6 4.1 5.6
>70% N 134 114 107 90 105 118 779 1447 % 20.2 14.4 12.6 7.6 8.2 10.1 12.4 11.8
Missing N 253 336 478 792 839 790 4113 7601 % 38.2 42.4 56.2 66.8 65.3 67.4 65.4 62.1
* Number of neonates who received any resuscitation includes those who received CPAP, PPV, Chest compression or epinephrine NOTE: Please use caution while interpreting these data. Resuscitation time was defined as first 30 minutes after birth.

D. Descriptive Analyses
23
Presentation #9 Early onset sepsis rates: All GA
GA at birth (completed weeks)
Total number
of neonates
No. of neonates
with infection
% of neonates
with infection
Total number of organisms
Organism
E. Coli GBS Others
<25 290 13 4.5 14 5 2 7 25-26 537 17 3.2 17 11 1 5 27-28 740 15 2.0 15 10 4 1 29-30 1006 4 0.4 4 0 1 3 31-32 1455 9 0.6 9 1 2 6 33-34 2035 5 0.3 5 1 1 3 35-36 2457 3 0.1 3 1 0 2 ≥37 6285 19 0.3 19 5 6 8 Total included 14 805 85 0.6 86 34 17 35 Missing 10
Total # of neonates 14 815
COMMENTS: Early onset sepsis is indicated by positive bacterial, viral or fungal culture in blood and/or cerebrospinal fluid, in the first two days after birth. One neonate had two organisms isolated. In other category, top five organisms were: Streptococci (n=8), Haemophilus influenza (n=6), Staphylococci (n=6), Cytomegalovirus (n=3), Enterococci (n=2). In contrast to previous CNN reports, CONS were not included as an organism causing early onset sepsis in this report based on consultation with microbiologists.
0.0
1.0
2.0
3.0
4.0
5.0
<25 25-26 27-28 29-30 31-32 33-34 35-36 ≥37
Perc
enta
ge o
f inf
ants
Gestational age (completed weeks)

D. Descriptive Analyses
24
Presentation #10 Late onset sepsis rates: All GA
COMMENTS: Late onset sepsis is defined as any positive blood and/or cerebrospinal fluid culture for bacteria, viral or fungi after 2 days of age (analysis is neonate-based). The numbers are adjusted for readmission. Among other category, top 5 organisms were: GBS (n=43), Staphylococci (n=38), Enterococci (n=36), Klebsiella (n=34), Enterobacter (n=12).
0
5
10
15
20
25
30
35
40
45
<25 25-26 27-28 29-30 31-32 33-34 35-36 ≥37
Perc
enta
ge o
f inf
ants
Gestational age (completed weeks)
GA at birth (completed
weeks)
Total number
Number of deaths in the first 2 days after birth
Number of neonates survived
beyond day 2 after birth
Number of neonates
with at least one
infection
Number of infants with more than
one infection
Among infants who survived
day 2, percentage with
at least one infection
Total number of organisms
Organisms
CONS E. Coli Coag + Staph Fungal Other
<25 290 23 267 107 29 40 153 68 16 8 11 50 25-26 537 14 523 141 25 27 177 72 27 15 4 59 27-28 742 6 736 87 13 12 103 57 7 13 0 26 29-30 1 006 4 1 002 69 2 7 74 45 7 7 0 15 31-32 1 455 4 1 451 25 2 2 28 11 5 6 1 5 33-34 2 035 5 2 030 24 2 1 28 8 5 2 0 13 35-36 2 457 7 2 450 34 1 1 37 11 4 3 0 19 ≥37 6 285 17 6 268 58 5 1 68 24 12 6 1 25
Total included 14 807 80 14 727 545 79 4 668 296 83 60 17 212
Missing 8 Total # of neonates 14 815

D. Descriptive Analyses
25
Presentation #11 Late onset sepsis rates: All BW
BW (grams)
Total number
Number of deaths
in the first 2
days after birth
Number of neonates survived
beyond day 2 after birth
Number of
neonates with at
least one infection
Number of infants with more than one infection
Among infants who survived day 2, percentage with at least one infection
Total number
of organism
s
Organisms
CONS
E. Coli
Coag + Staph
Fungal Other
<500 40 7 33 15 1 42 18 9 1 3 1 4 500-749 406 16 390 117 27 30 159 67 17 11 7 57 750-999 680 13 667 136 27 20 178 87 23 17 6 45 1000-1499 1 656 8 1 648 137 15 8 154 78 15 15 1 45 1500-1999 2 123 8 2 115 37 2 2 40 15 6 5 1 13 2000-2499 2 549 6 2 543 27 2 1 34 11 6 2 0 15 >2500 7 359 22 7 337 76 5 1 86 30 15 7 1 33 Total included 14 813 80 14 733 545 79 4 669 297 83 60 17 212
Missing (BW) 2
Total # of neonates 14 815
COMMENTS: Late onset sepsis is defined as any positive blood and/or cerebrospinal fluid culture for bacteria, viral or fungi after 2 days of age (analysis is neonate-based). The numbers are adjusted for readmission and transfer. Among other category, top 5 organisms were: GBS (n=43), Staphylococci (n=38), Enterococci (n=36), Klebsiella (n=34), Enterobacter (n=12).
0
5
10
15
20
25
30
35
40
45
<500 500-749 750-999 1000-1499 1500-1999 2000-2499 ≥2500
Perc
enta
ge o
f inf
ants
Birth weight (grams)

D. Descriptive Analyses
26
Presentation #12 Other diagnoses / interventions / procedures: All GA
Characteristics Missing GA at birth (completed weeks) <25 26 -
28 29 - 30
31 - 32
33 - 36 >37 Total
Total 538 1031 1006 1455 4492 6285 14807 Prophylactic Indomethacin 2 N 182 99 16 6 2 1 306
% 33.9 9.6 1.6 0.4 0.0 0.0 2.1 Probiotics 2 N 164 328 275 305 134 21 1227
% 30.5 31.8 27.3 21.0 3.0 0.3 8.3 RDS Unknown 4 N 1 0 0 1 1 3 6
% 0.2 0.0 0.0 0.1 0.0 0.1 0.0 Uncertain N 8 5 19 30 33 21 116
% 1.5 0.5 1.9 2.1 0.7 0.3 0.8 None N 46 184 354 859 3902 6063 11408
% 8.6 17.9 35.2 59.1 86.9 96.5 77.1 Definite N 481 841 633 564 556 198 3273
% 89.7 81.7 62.9 38.8 12.4 3.2 22.1 Surfactant in first 30 min
N 106 94 34 15 7 0 256 % 19.7 9.1 3.4 1.0 0.2 0.0 1.7
Surfactant in first 60 min
N 204 202 64 36 20 3 529 % 37.9 19.6 6.4 2.5 0.5 0.1 3.6
Surfactant in first 120 min
N 303 330 123 90 37 13 896 % 56.3 32.0 12.2 6.2 0.8 0.2 6.1
Surfactant at any time
N 458 639 355 293 297 145 2187 % 85.1 62.0 35.3 20.1 6.6 2.3 14.8
Pneumothorax diagnosis
2 N 48 43 28 40 144 439 742 % 8.9 4.2 2.8 2.8 3.2 7.0 5.0
Pneumothorax treatment**
Observation 2 N 15 13 8 10 62 312 420 % 2.8 1.3 0.8 0.7 1.4 5.0 2.8
Needle drainage 2 N 13 13 6 14 39 58 143 % 2.4 1.3 0.6 1.0 0.9 0.9 1.0
Chest tube 2 N 31 30 21 23 64 91 260 % 5.8 2.9 2.1 1.6 1.4 1.5 1.8
Seizures Definite /suspected
5 N 39 33 10 20 70 394 566 % 7.3 3.2 1.0 1.4 1.6 6.3 3.8
** One infant can have multiple treatments

D. Descriptive Analyses
27
Presentation #12 (continued) Other diagnoses / interventions / procedures: All GA
Characteristics Missing GA at birth (completed weeks) <25 26 -
28 29 - 30
31 - 32
33 - 36 >37 Total
Total 538 1031 1006 1455 4492 6285 14807 Operations Laparotomy 2 N 57 43 19 18 149 189 475
% 10.6 4.2 1.9 1.2 3.3 3.0 3.2 Thoracotomy 2 N 6 7 5 2 29 95 144
% 1.1 0.7 0.5 0.1 0.7 1.5 1.0 VP shunt 2 N 9 14 4 3 6 18 54
% 1.7 1.4 0.4 0.2 0.1 0.3 0.4 Gastro-intestinal perforation
Spontaneous 114 N 22 10 4 2 15 16 69 % 4.1 1.0 0.4 0.1 0.3 0.3 0.5
NEC related N 29 17 2 4 14 4 70 % 5.4 1.7 0.2 0.3 0.3 0.1 0.5
Acquired stricture
2 N 5 6 1 3 6 3 24 % 0.9 0.6 0.1 0.2 0.1 0.1 0.2
Acute bilirubin encephalopathy
2 N 0 1 0 1 1 3 6 % 0.0 0.1 0.0 0.1 0.0 0.1 0.0
Exchange transfusion
2 N 2 0 1 1 15 21 40 % 0.4 0.0 0.1 0.1 0.3 0.3 0.3
Congenital anomaly*
None N 393 773 833 1257 3689 4696 11641 % 73.1 75.0 82.8 86.4 82.1 74.7 78.6
Minor N 127 213 140 167 494 887 2028 % 23.6 20.7 13.9 11.5 11.0 14.1 13.7
Major N 18 45 33 31 309 702 1138 % 3.4 4.4 3.3 2.1 6.9 11.2 7.7
*A list of major anomalies can be found in the 2013 annual report, pages 124-127. It is available via the following link: http://www.canadianneonatalnetwork.org/Portal/LinkClick.aspx?fileticket=lreR0871sjA%3d&tabid=39

D. Descriptive Analyses
28
Section D.3
Analyses based on number of eligible very preterm (< 33 weeks GA) or very low BW neonates (<1 500g BW) neonates These include data from 4 030 eligible very preterm neonates and 2 782 eligible VLBW neonates.

D. Descriptive Analyses
29
Presentation #13 Patent ductus arteriosus treatments: GA <33 weeks
†The percentages of treatment of patent ductus arteriosus are calculated out of number of neonates diagnosed with PDA. *>1 medical = 2 or 3 of (Indomethacin or Ibuprofen or Acetaminophen) #Medical and ligation = Ligation + at least one of (Indomethacin or Ibuprofen or Acetaminophen) COMMENTS: Specific reasons for treatment with indomethacin and frequency of repeat course of indomethacin were not recorded. Excludes indomethacin prophylaxis started on the first day of age. Neonates were identified as without PDA if there was no clinical suspicion of PDA.
0
10
20
30
40
50
60
70
80
90
100
<25 25-26 27-28 29-30 31-32
Perc
enta
ge o
f inf
ants
with
PDA
Gestational age at birth (completed weeks)
Conservative
Indomethacin only
Ibuprofen only
Acetaminophen only
> 1 medical
Medical and ligation
Ligation alone
Birth GA (completed weeks)
Total
Missing data on PDA
PDA unknown
No PDA
Neonates with PDA
Treatment†
Conservative
Indo Ibu Acetaminophen
> 1 medical*
Medical and ligation#
Ligation alone
<25 N 290 1 11 81 197 46 42 47 6 19 34 3 % 23% 21% 24% 3% 10% 17% 2% 25-26 N 537 2 7 178 350 117 77 81 3 31 35 6 % 33% 22% 23% 1% 9% 10% 2% 27-28 N 742 0 0 432 310 151 60 57 8 15 16 3 % 49% 19% 18% 3% 5% 5% 1% 29-30 N 1006 0 1 826 179 128 15 24 1 5 4 2 % 72% 8% 13% 1% 3% 2% 1%
31-32 N 1455 1 1 1363 90 69 9 6 1 1 1 3 % 77% 10% 7% 1% 1% 1% 3%
Total included
N 4030 4 20 2880 1126 511 203 215 19 71 90 17 % 45% 18% 19% 2% 6% 8% 2%

D. Descriptive Analyses
30
Presentation #14 Patent ductus arteriosus treatments: BW <1500g
†The percentages of treatment of patent ductus arteriosus are calculated out of number of neonates diagnosed with PDA. *>1 medical = 2 or 3 of (Indomethacin or Ibuprofen or Acetaminophen) #Medical and ligation = Ligation + at least one of (Indomethacin or Ibuprofen or Acetaminophen)
COMMENTS: Specific reasons for treatment with indomethacin and frequency of a repeat course of indomethacin were not recorded. Excludes indomethacin prophylaxis started on the first day of age. Neonates were identified as without PDA if there was no clinical suspicion of PDA.
0
10
20
30
40
50
60
70
80
90
100
<500 500-749 750-999 1000-1249 1250-1499
Perc
enta
ge o
f inf
ants
with
PDA
Birth weight (grams)
Conservative
Indomethacin only
Ibuprofen only
Acetaminophen only
> 1 medical
Medical and ligation
Ligation alone
BW (grams)
Total
Missing data on PDA
PDA information unknown
No PDA
Neonates with PDA
Treatment†
Conservative
Indo Ibu Acetaminophen
> 1 medical*
Medical and ligation#
Ligation alone
<500 N 40 0 2 20 18 4 4 1 1 5 2 1 % 22% 22% 6% 6% 28% 11% 6% 500-749 N 406 0 13 143 250 66 55 58 5 22 39 5 % 26% 22% 23% 2% 9% 16% 2% 750-999 N 680 2 3 305 370 138 69 88 6 29 36 4 % 37% 19% 24% 2% 8% 10% 1% 1000-1249 N 792 1 1 537 253 134 52 39 7 9 10 2 % 53% 21% 15% 3% 4% 4% 1%
1250-1499
N 864 1 1 714 148 101 13 22 0 5 4 3 % 68% 9% 15% 0% 3% 3% 2%
Total included
N 2782 4 20 1719 1039 443 193 208 19 70 91 15 % 43% 19% 20% 2% 7% 9% 1%

D. Descriptive Analyses
31
Presentation #15 Neuroimaging findings: GA <33 weeks
Ventricular enlargement
0
10
20
30
40
50
60
70
80
90
100<2
525
-26
27-2
829
-30
31-3
2<2
525
-26
27-2
829
-30
31-3
2<2
525
-26
27-2
829
-30
31-3
2<2
525
-26
27-2
829
-30
31-3
2
GM hemorrhage Intraventricularhemorrhage
Intraparenchymallesion
Periventricularleukomalacia
Perc
enta
ge
Unknown
None
Present/suspected
0
10
20
30
40
50
60
70
80
90
100
<25 25-26 27-28 29-30 31-32
Perc
enta
ge w
ith v
entr
icul
ar e
nlar
gem
ent
Gestational age at birth (completed weeks)
Unknown
None
Unmeasured
Mild
Moderate
Severe

D. Descriptive Analyses
32
Presentation #15 (continued) Neuroimaging findings: GA <33 weeks
GA at birth (completed
weeks) Total
Neuro-imaging available
Neuroimaging findings
GM hemorrhage Intraventricular hemorrhage Ventricular enlargement Intraparenchymal
lesion Periventricular leukomalacia
Present/suspected
None
Unknow
n
Present/suspected
None
Unknow
n
Mild
Moderate
Severe
Unm
easured
None
Unknow
n
Present/suspected
None
Unknow
n
Present/suspected
None
Unknow
n
<25
N 290 267 148 118 1 135 131 1 40 23 18 13 170 3 67 199 1 15 249 2 % 55 44 0 51 49 0 15 9 7 5 64 1 25 75 0 6 94 1
25-26
N 537 515 216 296 3 172 343 0 67 30 22 11 380 5 62 449 4 39 472 4 % 42 57 1 33 67 0 13 6 4 2 74 1 12 87 1 8 92 1
27-28
N 742 721 196 522 3 116 604 1 62 20 21 4 607 7 26 690 5 31 686 4 % 27 72 0 16 84 0 9 3 3 1 84 1 4 96 1 4 95 1
29-30
N 1006 889 184 704 1 76 813 0 74 26 11 2 774 2 17 871 1 29 859 1 % 21 79 0 9 91 0 8 3 1 0 87 0 2 98 0 3 97 0
31-32
N 1455 920 141 777 2 48 872 0 47 29 6 3 833 2 13 907 0 8 911 1 % 15 84 0 5 95 0 5 3 1 0 91 0 1 99 0 1 99 0
Total N 4030 3312 885 2417 10 547 2763 2 290 128 78 33 2764 19 185 3116 11 122 3177 12
% 27 73 0 17 83 0 9 4 2 1 83 1 6 94 0 4 96 0
Note: The neuroimaging findings are not mutually exclusive, i.e. one infant may have more than one finding.

D. Descriptive Analyses
33
Presentation #16 Neuroimaging findings: BW <1500g
Ventricular enlargement
0
10
20
30
40
50
60
70
80
90
100<5
0050
0-74
975
0-99
910
00-1
249
1250
-149
9<5
0050
0-74
975
0-99
910
00-1
249
1250
-149
9<5
0050
0-74
975
0-99
910
00-1
249
1250
-149
9<5
0050
0-74
975
0-99
910
00-1
249
1250
-149
9
GM hemorrhage Intraventricularhemorrhage
Intraparenchymallesion
Periventricularleukomalacia
Perc
enta
ge
Unknown
None
Present/suspected
0
10
20
30
40
50
60
70
80
90
100
<500 500-749 750-999 1000-1249 1250-1499
Perc
enta
ge w
ith v
entr
icul
ar e
nlar
gem
ent
Gestational age at birth (completed weeks)
Unknown
None
Unmeasrued
Mild
Moderate
Severe

D. Descriptive Analyses
34
Presentation #16 (continued) Neuroimaging findings: BW <1500g
BW (grams)
Total
Neuro-im
aging available
Neuroimaging findings
GM hemorrhage Intraventricular hemorrhage Ventricular enlargement Intraparenchyma
l lesion Periventricular leukomalacia
Present/suspected
None
Unknow
n
Present/suspected
None
Unknow
n
Mild
Moderate
Severe
Unm
easured
None
Unknow
n
Present/suspected
None
Unknow
n
Present/suspected
None
Unknow
n
<500 N 40 33 8 25 0 8 25 0 4 1 0 0 28 0 4 29 0 3 30 0 % 24 76 0 24 76 0 12 3 0 0 85 0 12 88 0 9 91 0
500-749
N 406 381 163 216 2 131 249 1 52 28 21 10 265 5 60 319 2 12 365 3 % 43 57 1 34 65 0 14 7 6 3 70 1 16 84 1 3 96 1
750-999
N 680 660 239 419 2 170 490 0 72 26 21 11 525 5 60 598 2 41 618 1 % 36 63 0 26 74 0 11 4 3 2 80 1 9 91 0 6 94 0
1000-1249
N 792 747 187 558 2 120 626 1 66 29 13 9 626 4 33 709 5 34 707 6 % 25 75 0 16 84 0 9 4 2 1 84 1 4 95 1 5 95 1
1250-1499
N 864 731 136 594 1 57 673 1 45 14 14 1 653 4 11 718 2 19 710 2 % 19 81 0 8 92 0 6 2 2 0 89 1 2 98 0 3 97 0
Total N 2782 2552 733 1812 7 486 2063 3 239 98 69 31 2097 18 168 2373 11 109 2430 12
% 29 71 0 19 81 0 9 4 3 1 82 1 7 93 0 4 95 0
Note: The neuroimaging findings are not mutually exclusive, i.e. one infant may have more than one findings.

D. Descriptive Analyses
35
Presentation #17
Necrotizing enterocolitis treatments: GA <33weeks
GA at birth (completed weeks)
Total number of neonates
Missing data on NEC
No NEC NEC*
Neonates with necrotizing enterocolitis** Medical treatment only
Medical + peritoneal drainage
Laparotomy Laparotomy + peritoneal drainage
<25 N 290 1 256 33 10 1 20 2 % 89% 11% 30% 3% 61% 6% 25-26 N 537 2 490 45 22 3 17 3 % 92% 8% 49% 7% 38% 7% 27-28 N 742 0 711 31 18 3 9 1 % 96% 4% 58% 10% 29% 3% 29-30 N 1006 0 983 23 18 0 5 0 % 98% 2% 78% 0% 22% 0% 31-32 N 1455 1 1443 11 7 0 4 0 % 99% 1% 64% 0% 36% 0%
Total N 4030 4 3883 143 75 7 55 6 % 96% 4% 52% 5% 38% 4%
*The percentages of necrotizing enterocolitis are calculated out of number of neonates with data available on NEC. **Percentages for various forms of treatment are calculated out of those with NEC COMMENTS: Necrotizing enterocolitis is scored according to the following criteria: a) definite pneumatosis (air within the bowel wall) or portal/hepatic gas as diagnosed by x-ray or USG, or b) if there is a surgical or autopsy diagnosis of NEC. Diagnoses of ‘suspected NEC’ or x-rays showing pneumoperitoneum without pneumatosis are not classified as NEC.
Number (%) of infants with NEC for GA > 33: GA 33-36: 47 (1.1%), GA > 37: 10 (0.2%)
0
10
20
30
40
50
60
70
80
90
100
<25 25-26 27-28 29-30 31-32
Perc
enta
ge o
f inf
ants
Gestational age at birth (completed weeks)
Laparotomy +peritoneal drainageLaparotomy
Medical treatment +peritoneal drainageMedical treatment

D. Descriptive Analyses
36
Presentation #18 Necrotizing enterocolitis treatments: BW <1500g
Birth weight (grams)
Total number of neonates
Missing data on NEC
NEC*
Neonates with necrotizing enterocolitis** No NEC
Medical treatment only
Medical + peritoneal drainage
Laparotomy laparotomy + peritoneal drainage
<500 N 40 0 34 6 5 0 1 0 % 85 15% 83% 0% 17% 0% 500-749 N 406 0 372 34 12 3 17 2 % 92 8% 35% 9% 50% 6% 750-999 N 680 2 622 56 26 2 25 3 % 92 8% 46% 4% 45% 5% 1000-1249 N 792 1 765 26 18 1 6 1 % 97 3% 69% 4% 23% 4% 1250-1499 N 864 1 852 11 7 2 2 0 % 99 1% 64% 18% 18% 0%
Total N 2782 4 2645 133 68 8 51 6 % 95 5% 51% 6% 38% 5%
*The percentages of necrotizing enterocolitis are calculated out of number of neonates with data available on NEC. **Percentages for various forms of treatment are calculated out of those with NEC COMMENTS: Necrotizing enterocolitis is identified according to the following criteria: a) definite pneumatosis (air within the bowel wall) or portal/hepatic gas as diagnosed by x-ray or USG, or b) if there is a surgical or autopsy diagnosis of NEC. Diagnoses of ‘suspected NEC’ or x-rays showing pneumoperitoneum without pneumatosis are not classified as NEC. Number (%) of infants with NEC and with BW > 1500 is as follows: BW 1500-2499g - 47 neonates (1.0%) BW > 2500g - 20 neonates (0.3%)
0
10
20
30
40
50
60
70
80
90
100
<500 500-749 750-999 1000-1249 1250-1499
Perc
enta
ge o
f inf
ants
Birth weight (grams)
Laparotomy +peritoneal drainage
Laparotomy
Medical treatment +peritoneal drainage
Medical treatment

D. Descriptive Analyses
37
Presentation #19a Oxygen use at 36 weeks or at discharge: GA <33 weeks
GA Total number of neonates
Number of neonates whose oxygen use is unknown*
Number of neonates with known results
Number (%) of neonates with oxygen use at 36 weeks
Number (%) of neonates with oxygen use at discharge
Number (%) of neonates with oxygen use at 36 weeks or discharge
<25 290 96 194 10 (5) 114 (59) 124 (64)
25-26 537 81 456 35 (8) 156 (34) 191 (42) 27-28 742 37 705 33 (5) 122 (17) 155 (22) 29-30 1 006 37 969 18 (2) 47 (5) 65 (7) 31-32 1 455 55 1 400 15 (1) 41 (3) 56 (4)
Total 4 030 306 3 724 111 (3) 480 (13) 591 (16)
COMMENTS: This presentation includes neonates who received supplemental oxygen at week 36 postmenstrual age (PMA), and neonates who were discharged prior to week 36 PMA and receiving supplemental oxygen at discharge from a CNN hospital. There were no requirements for chest radiographs at the time of diagnosis. *unknown = death before week 36 or first admission after week 36 Note: all percentages of oxygen use were calculated out of the neonates with known results.
0
10
20
30
40
50
60
70
80
90
100
<25 25-26 27-28 29-30 31-32Perc
enta
ge o
f inf
ants
with
oxy
gen
use
Gestational age (completed weeks)
oxygen at 36 weeks oxygen at discharge

D. Descriptive Analyses
38
Presentation #19b Any respiratory support at 36 weeks or at discharge: GA <33 weeks
GA Total number of neonates
Number of neonates whose oxygen use or respiratory support is unknown*
Number of neonates with known results
Number (%) of neonates with respiratory support at 36 weeks
Number (%) of neonates with respiratory support at discharge
Number (%) of neonates with respiratory support at 36 weeks or discharge
<25 290 96 194 12 (6) 141 (73) 153 (79)
25-26 537 81 456 52 (11) 218 (48) 270 (59) 27-28 742 37 705 82 (12) 180 (26) 262 (37) 29-30 1 006 37 969 67 (7) 90 (9) 157 (16) 31-32 1 455 55 1 400 45 (3) 65 (5) 110 (8)
Total 4 030 306 3 724 258 (7) 694 (19) 952 (26) COMMENTS: This presentation includes neonates who received supplemental oxygen or any respiratory support at week 36 postmenstrual age (PMA), and neonates who were discharged prior to week 36 PMA and receiving supplemental oxygen or any respiratory support at discharge from CNN centre. There were no requirements for chest radiographs at the time of diagnosis.
*unknown = death before week 36 or first admission after week 36 Note: all percentages of oxygen use were calculated out of the neonates with known results.
0
10
20
30
40
50
60
70
80
90
100
<25 25-26 27-28 29-30 31-32
Perc
enta
ge o
f inf
ants
with
any
re
spir
ator
y su
ppor
t
Gestational age (completed weeks)
resp. support at 36 weeks resp. support at discharge

D. Descriptive Analyses
39
Presentation #20a Oxygen use at 36 weeks or at discharge: BW < 1500g
BW (grams)
Total number of neonates
Number of neonates whose oxygen use is unknown*
Number of neonates with known results
Number (%) of neonates with oxygen use at 36 weeks
Number (%) of neonates with oxygen use at discharge
Number (%) of neonates with oxygen use at 36 weeks or discharge
<500 40 19 21 1 (5) 16 (76) 17 (81)
500-749 406 101 305 21 (7) 154 (50) 175 (57) 750-999 680 67 613 25 (4) 174 (28) 199 (32) 1000-1249 792 41 751 28 (4) 68 (9) 96 (13) 1250-1499 864 25 839 19 (2) 29 (3) 48 (6)
Total 2 782 253 2 529 94 (4) 441 (17) 535 (21)
COMMENTS: This presentation includes neonates who received supplemental oxygen at week 36 postmenstrual age (PMA), and neonates who were discharged prior to week 36 PMA and receiving supplemental oxygen at discharge from CNN centre. There were no requirements for chest radiographs at the time of diagnosis. *unknown = death before week 36 or first admission after week 36 Note: all percentages of oxygen use were calculated out of the neonates with known results.
0
10
20
30
40
50
60
70
80
90
100
<500 500-749 750-999 1000-1249 1250-1499Perc
enta
ge o
f inf
ants
with
oxy
gen
use
Birth weight (grams)
oxygen at 36 weeks oxygen at discharge

D. Descriptive Analyses
40
Presentation #20b Any respiratory support at 36 weeks or at discharge: BW < 1500g
BW (grams)
Total number of neonates
Number of neonates whose oxygen use or respiratory support is unknown*
Number of neonates with known results
Number (%) of neonates with respiratory support at 36 weeks
Number (%) of neonates with respiratory support at discharge
Number (%) of neonates with respiratory support at 36 weeks or discharge
<500 40 19 21 1 (5) 18 (86) 19 (90)
500-749 406 101 305 30 (10) 198 (65) 228 (75) 750-999 680 67 613 53 (9) 255 (42) 308 (50) 1000-1249 792 41 751 58 (8) 109 (15) 167 (22) 1250-1499 864 25 839 60 (7) 52 (6) 112 (13)
Total 2 782 253 2 529 202 (8) 632 (25) 834 (33)
COMMENTS: This presentation includes neonates who received supplemental oxygen or any respiratory support at week 36 postmenstrual age (PMA), and neonates who were discharged prior to week 36 PMA and receiving supplemental oxygen or any respiratory support at discharge from CNN centre. There were no requirements for chest radiographs at the time of diagnosis.
*unknown = death before week 36 or first admission after week 36 Note: all percentages of oxygen use were calculated out of the neonates with known results.
0
10
20
30
40
50
60
70
80
90
100
<500 500-749 750-999 1000-1249 1250-1499
Perc
enta
ge o
f inf
ants
with
any
re
spir
ator
y su
ppor
t
Birth weight (grams)
resp. support at 36 weeks resp. support at discharge

D. Descriptive Analyses
41
Presentation #21
Retinopathy of prematurity staging: GA <33 weeks
GA (completed weeks)
Total number of neonates
Number of neonates alive at 6 weeks
Number of neonates with known eye examination results
Retinopathy of prematurity*
Immature None Stages
1 & 2 Stage 3 Stage 4 & 5
<25
N 290 207 199 6 21 106 63 3 % 3% 11% 53% 32% 1.5%
25-26
N 537 470 441 51 122 211 56 1 % 12% 28% 48% 13% 0.2%
27-28
N 742 722 587 87 315 172 12 1 % 15% 54% 29% 2% 0.2%
29-30
N 1 006 995 500 70 356 71 3 0 % 14% 71% 14% 1% 0.0%
31-32
N 1 455 1 437 210 18 174 17 1 0 % 9% 83% 8% 0% 0.0%
Total included
N 4 030 3 831 1 937 232 988 577 135 5 % 12% 51% 30% 7% 0.3%
*The percentages of various stages of retinopathy of prematurity are calculated out of number of neonates with known eye examination results. COMMENTS: Retinopathy of prematurity is defined according to the International Classification of Retinopathy of Prematurity (ICROP) and includes the highest level of ROP in either eye. More advanced stages may have been detected in neonates transferred from network sites to level II sites or units. Caution should be used in interpreting these data.
0
10
20
30
40
50
60
70
80
90
100
<25 25-26 27-28 29-30 31-32
Perc
enta
ge o
f inf
ants
Gestational age at birth (completed weeks)
immature none stage 1&2 stage 3 stage 4&5

D. Descriptive Analyses
42
Presentation #22 Retinopathy of prematurity staging: BW< 1500g
BW (grams)
Total number of neonates
Number of neonates alive at 6 weeks
Number of neonates with known eye examination results
Retinopathy of prematurity*
Immature None Stages
1 & 2 Stage 3 Stage 4 & 5
<500
N 40 22 21 0 4 9 8 0 % 0% 19% 43% 38% 0. 0%
500-749
N 406 329 306 27 52 158 66 3 % 9% 17% 52% 22% 1.0%
750-999
N 680 626 550 56 208 238 46 2 % 10% 38% 43% 8% 0.4%
1000-1249
N 792 768 521 86 316 107 12 0 % 17% 61% 21% 2% 0.0%
1250-1499 N 864 855 354 41 262 49 2 0 % 12% 74% 14% 1% 0.0%
Total included
N 2 782 2 600 1 752 210 842 561 134 5 % 12% 48% 32% 8% 0.3%
*The percentages of various stages of retinopathy of prematurity are calculated out of number of neonates with known eye examination results. COMMENTS: Retinopathy of prematurity is defined according to the International Classification of Retinopathy of Prematurity (ICROP) and includes the highest level of ROP in either eye. More advanced stages may have been detected in neonates transferred from network sites to level II sites or units. Caution should be used in interpreting these data.
0102030405060708090
100
<500 500-749 750-999 1000-1249 1250-1499
Perc
ent o
f inf
ants
Birth weight (grams)
immature none Stage 1&2 Stage 3 Stage 4&5

D. Descriptive Analyses
43
Presentation #23
Retinopathy of prematurity treatments: GA <33 weeks
Birth GA (completed weeks)
Total number of neonates
Number of neonates with known eye examination results
Therapy for retinopathy of prematurity *
Therapy for retinopathy of prematurity
Laser Anti-VEGF
Both Laser and Anti-
VEGF
Other surgery
<25
N 290 199 62 23 36 2 1 % 31%
25-26
N 537 441 37 23 14 0 1 % 8%
27-28
N 742 587 7 2 5 0 0 % 1%
29-30
N 1 006 500 2 0 2 0 0 % 0%
31-32 N 1 455 210 0 0 0 0 0 % 0%
Total included
N 4 030 1 937 108 48 57 0 2 % 6%
*The percentages of patient who received therapy are calculated out of number of neonates with known eye examination results. COMMENTS: Retinopathy of prematurity is defined according to the International Classification of Retinopathy of Prematurity (ICROP) and includes the highest level of ROP in either eye. More advanced stages may have been detected in neonates transferred from network sites to level II sites or units. Caution should be used in interpreting these data as some neonates did not have eye examination data.

D. Descriptive Analyses
44
Presentation #24 Retinopathy of prematurity treatments: BW <1500g
BW (grams) Total number of neonates
Number of neonates with known eye examination results
Therapy for retinopathy of prematurity *
Therapy for retinopathy of prematurity
Laser Anti-VEGF
Both Laser and Anti-
VEGF
Other surgery
<500 N 40 21 6 1 4 1 0
% 29%
500-749 N 406 306 57 25 30 1 1
% 19%
750-999 N 680 550 36 18 18 0 1
% 7%
1000-1249 N 792 521 6 2 4 0 0
% 1%
1250-1499 N 864 354 2 1 1 0 0
% 1%
Total included
N 2 782 1 752 107 47 57 2 2
% 6%
*The percentages of patient who received therapy are calculated out of number of neonates with known eye examination results. COMMENTS: Retinopathy of prematurity is defined according to the International Classification of Retinopathy of Prematurity (ICROP) and includes the highest level of ROP in either eye. More advanced stages may have been detected in neonates transferred from network sites to level II sites or units. Caution should be used in interpreting these data as some neonates did not have eye examination data.

D. Descriptive Analyses
45
Presentation #25a Mortality or significant morbidities: GA <33 weeks
GA Number of neonates
Number survived till discharge (%)
Number of neonates discharged home directly from network sites
Number (%) without any of the six morbidities
Number (%) with any one morbidity prior to discharge
Number (%) with any two morbidities prior to discharge
Number (%) with any three morbidities prior to discharge
Number (%) with any four morbidities prior to discharge
Number (%) with any five morbidities prior to discharge
Number (%) with all six morbidities prior to discharge
<24 113 61 (54) 36 2 (6) 14 (39) 8 (22) 9 (25) 3 (8) 0 0 24 177 134 (76) 73 13 (18) 21 (29) 19 (26) 15 (21) 5 (7) 0 0 25 248 201 (81) 99 19 (19) 38 (38) 24 (24) 16 (16) 2 (2) 0 0 26 289 256 (89) 123 42 (34) 46 (37) 24 (20) 9 (7) 0 2 (2) 0 27 317 303 (96) 133 67 (50) 45 (34) 14 (11) 7 (5) 0 0 0 28 425 409 (96) 167 106 (63) 44 (26) 14 (8) 2 (1) 1 (1) 0 0 29 470 464 (99) 173 115 (66) 48 (28) 10 (6) 0 0 0 0 30 536 526 (98) 200 165 (83) 30 (15) 5 (3) 0 0 0 0 31 662 651 (98) 265 241 (91) 20 (8) 4 (2) 0 0 0 0 32 793 782 (99) 339 312 (92) 23 (7) 4 (1) 0 0 0 0 Total 4030 3787 (94) 1608 1082 (67) 329 (20) 126 (8) 58 (4) 11 (1) 2 (0) 0
Inclusion criteria for these analyses:
1. Neonate born at <33 weeks GA 2. Neonate discharged home from participating network sites
COMMENTS: Morbidities were counted as score of one for each of the following
i. Ventricular enlargement or PEC ii. Stage 3 or higher ROP iii. Oxygen use at 36 weeks or at discharge if earlier iv. Culture proven early onset or late onset sepsis v. Stage 2 or 3 NEC vi. PDA requiring surgical ligation

D. Descriptive Analyses
46
Presentation #25b Mortality or significant morbidities: GA <33 weeks
GA Number of neonates
Number survived till discharge (%)
Number of neonates discharged home directly from network sites
Number (%) without any of the three morbidities
Number (%) with any one morbidity prior to discharge
Number (%) with any two morbidities prior to discharge
Number (%) with all three morbidities prior to discharge
<24 113 61 (54) 36 5 (14) 19 (53) 7 (19) 5 (14) 24 177 134 (76) 73 17 (23) 33 (45) 19 (26) 4 (5) 25 248 201 (81) 99 33 (33) 49 (49) 16 (16) 1 (1) 26 289 256 (89) 123 57 (46) 45 (37) 19 (15) 2 (2) 27 317 303 (96) 133 79 (59) 46 (35) 7 (5) 1 (1) 28 425 409 (96) 167 121 (72) 40 (24) 5 (3) 1 (1) 29 470 464 (99) 173 133 (77) 39 (23) 1 (1) 0 30 536 526 (98) 200 186 (93) 13 (7) 1 (1) 0 31 662 651 (98) 265 253 (95) 10 (4) 2 (1) 0 32 793 782 (99) 339 320 (94) 19 (6) 0 0 Total 4030 3787 (94) 1608 1204 (75) 313 (19) 77 (5) 14 (1)
Inclusion criteria for these analyses:
1. Neonate born at <33 weeks GA 2. Neonate discharged home from participating network sites
COMMENTS: Morbidities were counted as score of one for each of the following
i. Ventricular enlargement or PEC ii. Stage 3 or higher ROP iii. Oxygen use at 36 weeks or at discharge if earlier

E. Site Comparisons
47
E. Site Comparisons

E. Site Comparisons
48
E.1. Site Comparisons –
Survival / Mortality

E. Site Comparisons
49
Presentation #26 Survival rates by site: All GA
Site Percentage survival for each GA (completed weeks)
<25 25-26 27-28 29-30 31-32 33-34 35-36 ≥37 Overall survival rate for sites*
A 66.7 90.5 100.0 98.9 100.0 99.2 100.0 99.0 97.1
B 0.0 100.0 100.0 100.0 100.0 100.0 100.0 98.5 98.3
C 66.7 100.0 100.0 100.0 96.6 100.0 100.0 96.5 97.8
Dᶲ 50.0 50.0 100.0 100.0 96.2 100.0 NA NA 95.0
E 100.0 100.0 100.0 100.0 100.0 100.0 94.1 98.6 98.4 F 65.7 84.1 98.7 95.8 99.1 97.6 97.8 98.0 96.3 G 52.9 91.3 86.7 100.0 98.1 98.8 100.0 99.2 96.1 H 100.0 100.0 88.9 100.0 86.7 95.7 94.2 98.0 96.6 I 100.0 75.0 66.7 100.0 100.0 97.4 100.0 100.0 97.4 J 66.7 80.0 100.0 100.0 100.0 97.9 98.7 99.0 97.8 K 85.7 69.2 100.0 100.0 97.6 100.0 100.0 100.0 98.8 L 33.3 88.9 100.0 100.0 100.0 98.2 98.2 100.0 98.5
Mᶲ 87.1 84.0 96.9 96.6 95.9 94.1 95.9 98.2 95.5 N 100.0 76.9 100.0 95.8 100.0 100.0 99.4 99.5 99.1 O 53.3 85.0 95.0 100.0 100.0 97.4 98.5 97.9 96.9 P 83.3 76.2 93.9 100.0 99.0 98.4 98.7 98.9 97.9 Q 60.0 88.2 96.3 96.0 96.9 100.0 98.6 99.2 98.2 R 100.0 85.7 93.8 100.0 100.0 100.0 99.2 98.2 98.7 S 0.0 100.0 75.0 100.0 100.0 100.0 100.0 99.0 98.6
Tᶲ 100.0 78.6 90.0 100.0 100.0 NA NA NA 95.2 U 100.0 84.6 90.0 100.0 100.0 100.0 100.0 99.3 98.9
Vᶲ 50.0 68.6 94.1 NA NA NA NA NA 77.2 W 61.5 100.0 97.1 100.0 98.8 100.0 98.7 95.5 96.8 X 100.0 100.0 100.0 100.0 100.0 98.9 98.6 100.0 99.6 Y 75.0 100.0 100.0 97.1 100.0 100.0 100.0 99.7 99.4
Zᶲ 53.3 88.0 95.7 95.0 98.4 NA NA NA 91.5 AA 35.0 67.7 94.4 98.4 97.3 95.7 96.8 98.9 95.1 AB 86.4 95.2 96.9 97.9 98.9 100.0 99.0 99.3 98.6 AC NA 100.0 100.0 100.0 100.0 100.0 100.0 100.0 100.0 AD 40.0 77.8 71.4 100.0 100.0 98.9 100.0 98.2 96.9 Overall survival rate for GA**
67.2 85.1 96.0 98.4 98.5 98.8 98.8 98.8 97.5
These analyses include 14 807 neonates from 30 sites (8 neonates had missing GA data). Twenty-five sites collected data on all eligible admissions whereas six sites (marked byᶲ) collected data on selected eligible admissions only. ᶲ Please note that the criteria for entering neonates in the CNN dataset are not the same for these five sites and thus, the rates may not be comparable with other sites. Overall* = (number of neonates survived by site / total number of neonates for that site)*100 Overall** = (number of neonates survived for GA category / total number of neonates in GA category)*100 NA = no data available, 0 = no neonates survived Delivery room deaths are not included

E. Site Comparisons
50
Presentation #27 Survival rates by site: All BW
Site Percentage survival for each BW (g) category
<500 500-749 750-999 1000-1249 1250-1499 1500-2499 ≥2500 Overall survival rate for sites*
A 100.0 74.4 93.3 100.0 100.0 99.1 100.0 97.1 B NA 0.0 100.0 100.0 100.0 100.0 98.8 98.3 C NA 60.0 100.0 100.0 100.0 99.2 97.6 97.8
Dᶲ NA 75.0 80.0 100.0 100.0 96.4 NA 95.0 E NA 100.0 100.0 100.0 100.0 91.3 100.0 98.4 F 0.0 73.9 93.7 97.5 98.8 97.1 98.1 96.3 G 20.0 80.0 91.7 85.3 100.0 99.4 98.6 96.1 H 0.0 100.0 100.0 94.1 92.6 93.8 98.1 96.6 I 0.0 NA 83.3 90.9 100.0 98.6 100.0 97.4 J 100.0 60.0 94.7 95.2 100.0 98.7 98.9 97.8 K 50.0 80.0 93.3 95.7 100.0 99.4 100.0 98.8 L 0.0 80.0 100.0 100.0 100.0 98.3 100.0 98.5
Mᶲ 100.0 87.2 88.7 90.5 98.5 97.7 97.5 95.5 N NA 100.0 83.3 100.0 96.0 99.6 99.6 99.1 O NA 72.2 80.0 95.2 95.8 98.1 98.1 96.9 P 0.0 76.9 88.1 97.6 100.0 98.6 98.8 97.9 Q 100.0 81.8 79.2 100.0 100.0 98.6 99.1 98.2 R 100.0 100.0 90.0 100.0 96.4 99.5 98.6 98.7 S 0.0 NA 83.3 100.0 100.0 100.0 99.0 98.6
Tᶲ NA 88.9 87.5 90.0 100.0 100.0 NA 95.2 U NA 66.7 91.7 100.0 100.0 100.0 99.5 98.9
Vᶲ 0.0 69.2 77.1 84.2 100.0 100.0 50.0 77.4 W 100.0 79.2 100.0 98.0 100.0 99.5 95.6 96.8 X NA 100.0 100.0 100.0 100.0 99.4 99.6 99.6 Y 100.0 75.0 100.0 100.0 100.0 99.5 99.7 99.4
Zᶲ 50.0 61.1 96.0 92.1 95.5 98.2 100.0 91.5 AA 20.0 44.0 87.8 95.8 96.4 96.2 98.8 95.1 AB 66.7 92.5 98.2 98.5 98.8 98.8 99.4 98.6 AC NA 100.0 100.0 100.0 100.0 100.0 100.0 100.0 AD NA 40.0 66.7 100.0 94.4 99.3 99.3 96.9 Overall survival rate for BW**
42.5 76.8 90.7 96.2 98.6 98.5 98.8 97.5
These analyses include 14 813 neonates from 30 sites (2 neonates had missing BW data). Twenty-five sites collected data on all eligible admissions whereas six sites (marked by ᶲ) collected data on selected eligible admissions only. ᶲ Please note that the criteria for entering neonates in the CNN dataset are not the same for these five sites and thus, the rates may not be comparable with other sites. Overall* = (number of neonates survived by site / total number of neonates for site)*100 Overall** = (number of neonates survived for BW category / total number of neonates in BW category)*100. NA = no data available, 0 = no neonates survived Delivery room deaths are not included

E. Site Comparisons
51
Presentation # 28a Mortality: GA<33 weeks: Adjusted standardized ratios by site
Site Number
of infants
Number of
deaths
Adjusted# Expected number
of deaths
Adjusted# Standardized
ratio
95% confidence interval for adjusted standardized ratio
1 113 6 7.1 0.8 0.3 1.8 2 215 27 14.7 1.8 1.2 2.7 3 127 11 8.4 1.3 0.7 2.3 4 124 3 5.8 0.5 0.1 1.5 5 356 23 24.5 0.9 0.6 1.4 6 20 2 0.8 2.4 0.3 8.7 7 19 0 1.4 0.0 . 2.6 8 114 4 5.3 0.8 0.2 1.9 9 15 0 0.5 0.0 . 8.1 10 230 11 11.7 0.9 0.5 1.7 11 164 14 10.8 1.3 0.7 2.2 12 85 4 3.0 1.3 0.4 3.4 13 152 13 10.3 1.3 0.7 2.1 14 213 7 12.1 0.6 0.2 1.2 15 140 9 6.8 1.3 0.6 2.5 16 334 15 19.8 0.8 0.4 1.2 17 57 7 3.0 2.3 0.9 4.7 18* 78 17 10.3 1.7 1.0 2.7 19 81 4 4.6 0.9 0.2 2.2 20 299 8 17.9 0.4 0.2 0.9 21 54 2 2.3 0.9 0.1 3.1 22 56 3 1.7 1.7 0.3 5.0 23 64 3 3.2 0.9 0.2 2.7 24 102 0 4.2 0.0 . 0.9 25 109 1 3.3 0.3 0.0 1.7 26 16 1 0.9 1.2 0.0 6.4 27 52 3 1.2 2.6 0.5 7.6 28 99 3 2.9 1.0 0.2 3.0 29 79 2 3.0 0.7 0.1 2.4 30 336 18 19.4 0.9 0.6 1.5
Please note that site codes for Presentations 28a and 28b are different from other presentations in this report. Neonates with major congenital anomalies are excluded. # The prediction model was adjusted for GA, SGA, Sex, SNAPII > 20. * Site 18 has different criteria for entering neonates in the CNN dataset, and may not be comparable with other sites. (See next page for full explanation)

E. Site Comparisons
52
Presentations # 28b Mortality: GA<33 weeks: Adjusted standardized ratios by site
Explanation for Presentation 28a Column 1: Different site code than other presentations in the report Column 2: Number of eligible neonates at each site (<33 weeks and no major anomaly) Column 3: Number of neonates with outcome of interest among those eligible neonates Column 4: Expected number of neonates with outcome of interest after adjustment for GA, SGA, Sex, SNAPII > 20 Column 5: Adjusted standardized ratio calculated based on observed deaths/expected deaths Columns 6 and 7: 95% CI around the adjusted standardized ratio for the outcome Explanation for Presentation 28b X-axis: Expected number of neonates with outcome (value from Column 4 of previous presentation) Y-axis: Adjusted standardized ratio (value from Column 5 of previous presentation) Dark points with numerical notation: Site and its location matching x and y axis values Red funnel shaped lines: 95% confidence limits based on entire network information. Sites outside of red lines represent higher or lower (depending upon position in graph) adjusted standardized ratio. However, for determining whether site is statistically different from others, one should also assess 95% CI and check whether both upper and lower boundaries are also outside of the funnel area or not.
Y

E. Site Comparisons
53
Presentation # 28c Mortality: GA<29 weeks: Adjusted standardized ratios by site
Site Number
of infants
Number of
deaths
Adjusted# Expected number
of deaths
Adjusted# Standardized
ratio
95% confidence interval for adjusted standardized ratio
1 41 6 6.6 0.9 0.3 2.0 2 85 24 13.2 1.8 1.2 2.7 3 54 11 7.6 1.4 0.7 2.6 4 41 2 4.7 0.4 0.0 1.5 5 153 20 20.4 1.0 0.6 1.5 6 10 2 0.7 2.9 0.3 10.3 7 9 0 1.4 0.0 . 2.7 8 38 3 4.2 0.7 0.1 2.1 9 6 0 0.3 0.0 . 12.1 10 82 10 9.7 1.0 0.5 1.9 11 63 11 9.5 1.2 0.6 2.1 12 27 1 2.3 0.4 0.0 2.4 13 69 13 10.1 1.3 0.7 2.2 14 76 6 10.4 0.6 0.2 1.3 15 51 7 6.1 1.1 0.5 2.4 16 159 14 17.3 0.8 0.4 1.4 17 21 7 2.7 2.6 1.0 5.4 18 78 17 10.4 1.6 1.0 2.6 19 28 4 4.1 1.0 0.3 2.5 20 120 6 15.1 0.4 0.1 0.9 21 13 2 2.0 1.0 0.1 3.6 22 10 2 1.4 1.5 0.2 5.2 23 25 3 2.6 1.2 0.2 3.4 24 26 0 3.2 0.0 . 1.2 25 25 1 2.5 0.4 0.0 2.2 26 4 1 0.8 1.3 0.0 7.3 27 11 3 0.8 4.0 0.8 11.7 28 30 3 2.1 1.4 0.3 4.1 29 21 2 2.7 0.7 0.1 2.7 30 130 11 17.3 0.6 0.3 1.1
Please note that site codes for Presentations 28a, 28b, 28c and 28d are different from other presentations in this report. Neonates with major congenital anomalies are excluded. # The prediction model was adjusted for GA, SGA, Sex, SNAPII > 20.

E. Site Comparisons
54
Presentations # 28d Mortality: GA<29 weeks: Adjusted standardized ratios by site
Explanation for Presentation 28c Column 1: Different site code than other presentations in the report Column 2: Number of eligible neonates at each site (<29 weeks and no major anomaly) Column 3: Number of neonates with outcome of interest among those eligible neonates Column 4: Expected number of neonates with outcome of interest after adjustment for GA, SGA, Sex, SNAPII > 20 Column 5: Adjusted standardized ratio calculated based on observed deaths/expected deaths Columns 6 and 7: 95% CI around the adjusted standardized ratio for the outcome Explanation for Presentation 28d X-axis: Expected number of neonates with outcome (value from Column 4 of previous presentation) Y-axis: Adjusted standardized ratio (value from Column 5 of previous presentation) Dark points with numerical notation: Site and its location matching x and y axis values Red funnel shaped lines: 95% confidence limits based on entire network information. Sites outside of red lines represent higher or lower (depending upon position in graph) adjusted standardized ratio. However, for determining whether site is statistically different from others, one should also assess 95% CI and check whether both upper and lower boundaries are also outside of the funnel area or not.
Y
E. Site Comparisons
55
E2. Site Comparisons –
Mortality / Morbidities

E. Site Comparisons
56
Presentation #29 Mortality/morbidities: GA<33 weeks: Site specific crude rates
Site Number
range Mortality Severe
neurological injury
Severe ROP
Oxygen use at 36 weeks or discharge
NEC stage 2 or 3
Late onset sepsis
Mortality or severe morbidity
N % % % % % % % AC
< 60
0.0 6.7 9.1 6.7 0.0 6.7 20.0 AD 12.3 9.8 13.8 4.0 0.0 8.8 33.3 B 6.3 33.3 0.0 13.3 0.0 18.8 37.5 E 0.0 6.7 20.0 25.0 4.6 0.0 27.3 I 5.8 4.7 25.0 4.0 3.9 5.8 13.5 D 5.3 14.0 1.9 1.9 3.5 23.2 29.8 S 9.5 20.0 22.2 25.0 4.8 9.5 47.6 C 5.2 8.9 3.0 9.3 1.7 7.0 20.7 U
61 – 110
4.6 4.7 2.4 24.2 4.6 9.2 32.3 L 3.6 7.8 0.0 13.4 2.4 8.4 22.9 T 4.8 7.8 0.0 14.9 2.4 15.7 31.3 V* 22.8 25.7 20.0 38.1 2.5 12.7 67.1 H 6.8 3.8 4.6 16.9 8.0 10.2 30.7 N 4.0 12.3 2.3 3.2 2.0 6.9 16.8 X 0.0 4.8 10.6 6.8 1.9 7.8 16.5 J
111 – 200
5.2 13.3 11.1 8.3 2.6 12.2 29.6 Q 6.9 12.5 10.6 24.4 2.8 7.6 38.2 K 5.0 8.3 6.7 10.5 0.8 8.3 23.1 Y 2.4 14.6 13.3 28.8 0.8 7.1 37.3 O 8.3 13.9 2.8 17.5 2.3 20.3 39.1 R 1.8 8.8 7.1 7.5 4.5 7.1 16.8 G 9.5 9.0 2.0 12.3 4.5 17.7 35.4 Z 8.5 12.2 6.9 28.5 3.7 14.6 40.9 W
> 200
3.2 9.2 9.1 10.7 1.8 12.8 24.8 AA 12.6 11.4 7.0 24.0 5.9 17.1 41.9 AB 3.2 7.6 4.7 18.2 3.2 7.3 28.4 A 4.7 12.2 6.0 12.5 3.8 8.5 26.0 P 4.7 8.1 8.9 11.3 4.3 7.7 25.8 M 6.2 22.6 30.3 17.9 5.9 9.3 35.5 F 6.8 9.9 10.5 17.9 4.1 10.3 31.8 Total CNN 6.0 11.4 8.2 15.9 3.6 10.7 30.9
Mortality or severe morbidity = Mortality prior to discharge or any of the five morbidities *Site V does not have complete data for infants with GA < 33 and may not be comparable with other sites. These are unadjusted rates.

E. Site Comparisons
57
Presentation #30 Mortality/morbidities: GA<29 weeks: Site specific crude rates
Site Number
range Mortality Severe
neurological injury
Severe ROP
Oxygen use at 36 weeks or discharge
NEC stage 2 or 3
Late onset sepsis
Mortality or severe morbidity
N % % % % % % % AC
< 20
0.0 16.7 0.0 16.7 0.0 0.0 33.3 B 25.0 50.0 0.0 33.3 0.0 50.0 100.0 E 0.0 12.5 33.3 50.0 10.0 0.0 50.0 S 20.0 30.0 44.4 55.6 10.0 10.0 80.0 D 20.0 50.0 12.5 0.0 20.0 44.4 60.0 I 27.3 18.2 50.0 11.1 18.2 18.2 45.5 C 13.3 14.3 7.7 33.3 6.7 28.6 60.0 AD
20-40
33.3 21.1 23.1 14.3 0.0 19.1 76.2 U 12.0 12.5 4.6 54.6 8.0 24.0 72.0 X 0.0 16.0 29.4 26.9 3.9 15.4 46.2 N 10.0 25.9 3.9 11.1 3.3 16.7 46.7 R 7.4 22.2 19.2 23.1 7.4 22.2 48.2 L 12.5 17.4 0.0 47.8 8.3 20.8 62.5 H 7.1 3.6 6.3 38.5 7.1 17.9 50.0 T 14.3 18.5 0.0 37.5 7.1 35.7 71.4 K
41-80
11.9 20.0 9.4 29.7 2.4 16.7 52.4 Y 4.7 11.6 21.1 62.8 2.3 16.3 65.1 W 7.6 12.2 12.5 26.8 3.9 30.4 54.4 Q 13.0 14.8 14.9 54.4 7.4 13.0 70.4 J 14.0 21.4 16.7 21.6 4.7 25.6 58.1 O 20.0 20.4 4.6 34.1 5.5 38.2 69.1 Z 17.5 25.4 10.9 60.4 8.1 31.8 77.8 G 20.0 11.9 3.5 27.6 7.3 24.3 57.1 V 22.8 25.7 20.0 38.1 2.5 12.7 67.1 A
> 80
9.1 18.1 6.9 21.6 6.7 15.8 45.5 P 12.2 14.8 10.3 26.0 11.0 18.3 53.7 AB 5.4 11.1 6.3 33.6 6.2 14.7 50.4 AA 28.7 18.8 14.5 54.8 12.6 36.8 78.2 M 9.7 40.6 32.8 38.5 9.0 18.6 66.2 F 12.7 14.9 14.2 33.3 7.6 21.5 57.0 Total CNN 13.1 19.2 12.6 34.7 7.0 21.4 59.6
Mortality or severe morbidity = Mortality prior to discharge or any of the five morbidities These are unadjusted rates.
E. Site Comparisons
58
E.2.1. Site Comparisons –
Late Onset Sepsis
Presentations #31 to #34
In presentations #31 and #32, late onset sepsis was attributed to the hospital where the first episode of sepsis was acquired. Each neonate was counted only once even if there were
multiple episodes of infections.
In presentations #33 and #34, assignment of infection was based on location where the infection happened, and not assigned to the hospital where the first episode of sepsis was
acquired. Each episode of infection was counted (the total number of episodes exceeds the total number of neonates).
In all other presentations of this report, all morbidities including late onset sepsis were attributed to the hospital where the infant was first admitted.

59
Presentation #31
Late onset sepsis: GA<33 weeks: Site specific crude rates Sites that contributed data on all eligible admissions for neonates with GA < 33
(n=29 sites, 3 905 neonates, 46 excluded due to death before 3 days of age)
COMMENTS: Late onset sepsis is defined as any positive blood and/or cerebrospinal fluid culture after 2 days of age (analysis is neonate-based and deaths before 3 days of age are excluded). In presentations #31 and #32, late onset sepsis was attributed to the hospital where the first episode of sepsis was acquired. Each neonate was counted only once even if there were multiple episodes of infections.
Site A B C D E F G H I J K % 7.1 13.3 7.0 21.1 13.6 9.1 14.3 23.0 5.8 10.4 6.7
Site L M N O P Q R S T U W % 8.5 9.7 6.9 27.0 7.8 7.7 8.9 9.5 13.4 9.4 13.0
Site X Y Z AA AB AC AD Whole network % 9.7 8.0 14.6 17.8 6.0 6.7 9.3 10.7

E. Site Comparisons
60
Presentation #32a Late onset sepsis: GA<33 weeks: Adjusted standardized ratios by site
Site Number of infants
Number of NI
Adjusted# Expected
number of NI
Adjusted# Standardized
ratio
95% confidence interval for adjusted standardized ratio
1 113 12 12.6 1.0 0.5 1.7 2 220 39 26.6 1.5 1.0 2.0 3 133 34 14.9 2.3 1.6 3.2 4 126 10 11.7 0.9 0.4 1.6 5 358 33 42.5 0.8 0.5 1.1 6 21 2 2.1 0.9 0.1 3.4 7 25 3 4.0 0.8 0.2 2.2 8 118 8 11.1 0.7 0.3 1.4 9 15 1 1.2 0.8 0.0 4.5 10 232 18 21.9 0.8 0.5 1.3 11 164 24 19.3 1.2 0.8 1.8 12 98 20 10.3 1.9 1.2 3.0 13 148 22 17.5 1.3 0.8 1.9 14 215 28 23.4 1.2 0.8 1.7 15 142 11 14.8 0.7 0.4 1.3 16 334 24 39.5 0.6 0.4 0.9 17 54 5 5.4 0.9 0.3 2.2 18* 74 10 15.9 0.6 0.3 1.2 19 80 11 8.5 1.3 0.6 2.3 20 312 19 35.5 0.5 0.3 0.8 21 56 4 4.7 0.8 0.2 2.2 22 55 12 3.7 3.3 1.7 5.7 23 64 6 6.3 0.9 0.3 2.1 24 105 10 8.7 1.2 0.6 2.1 25 114 10 7.8 1.3 0.6 2.4 26 14 2 0.7 3.0 0.3 11.0 27 52 3 3.2 0.9 0.2 2.7 28 101 7 8.1 0.9 0.3 1.8 29 82 7 6.7 1.0 0.4 2.1 30 352 34 40.7 0.8 0.6 1.2
Please note that site codes for Presentations 32a, 32b, 32c and 32d are different from other presentations in this report. *Late onset sepsis was attributed to the hospital where the first episode of sepsis was acquired. *Neonates who died before 3 days of age are excluded. # # The prediction model was adjusted for GA, SGA, Sex, SNAPII > 20. * Site 18 has different criteria for entering neonates in the CNN dataset, and may not be comparable with other sites. (See next page for full explanation)

E. Site Comparisons
61
Presentation # 32b Late onset sepsis: GA<33 weeks: Adjusted standardized ratios by site
Explanation for Presentation 32a Column 1: Different site code than other presentations in the report Column 2: Number of eligible neonates at your sites (<33 weeks) Column 3: Number of neonates with outcome of interest among those eligible neonates Column 4: Expected number of neonates with outcome of interest after adjustment for GA, SGA, Sex, SNAPII > 20 Column 5: Adjusted standardized ratio calculated based on observed LOS/expected LOS Columns 6 and 7: 95% CI around the adjusted standardized ratio for the outcome Explanation for Presentation 32b X-axis: Expected number of neonates with outcome (value from Column 4 of previous presentation) Y-axis: Adjusted standardized ratio (value from Column 5 of previous presentation) Dark points with numerical notation: Site and its location matching x and y axis values Red funnel shaped lines: 95% confidence limits based on entire network information. Sites outside of red lines represent higher or lower (depending upon position in graph) adjusted standardized ratio. However, for determining whether site is statistically different from others, one should also assess 95% CI and check whether both upper and lower boundaries are also outside of the funnel area or not.
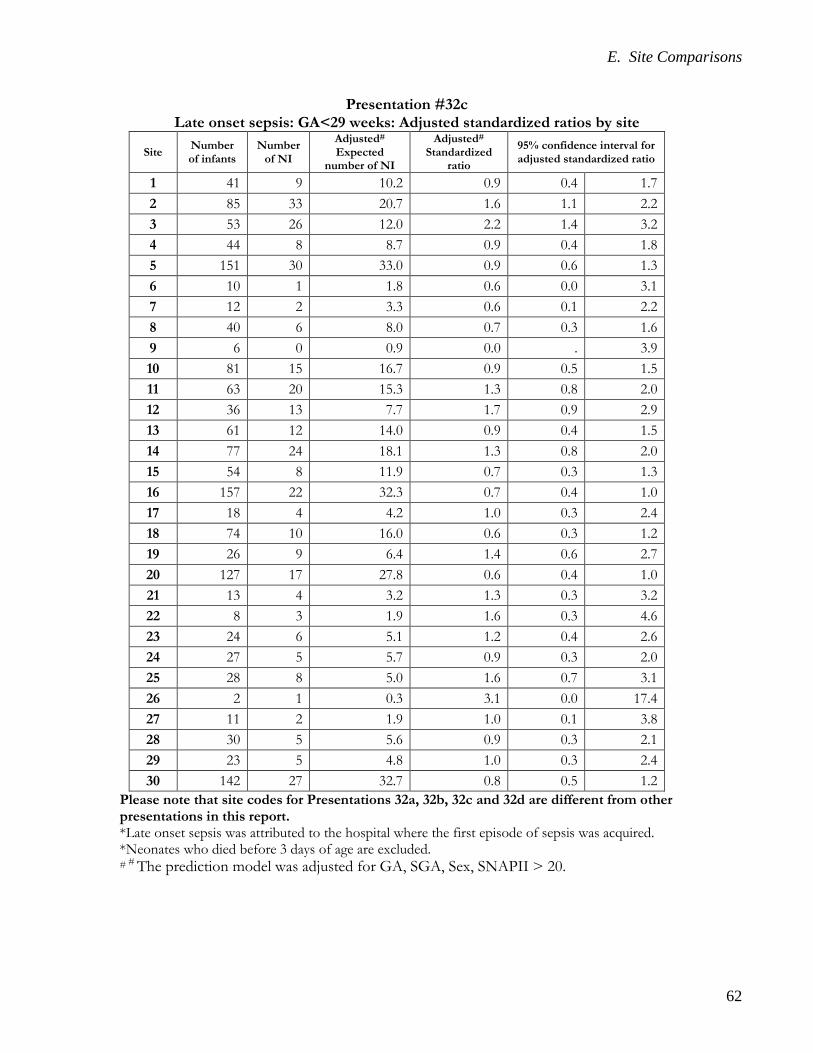
E. Site Comparisons
62
Presentation #32c Late onset sepsis: GA<29 weeks: Adjusted standardized ratios by site
Site Number of infants
Number of NI
Adjusted# Expected
number of NI
Adjusted# Standardized
ratio
95% confidence interval for adjusted standardized ratio
1 41 9 10.2 0.9 0.4 1.7 2 85 33 20.7 1.6 1.1 2.2 3 53 26 12.0 2.2 1.4 3.2 4 44 8 8.7 0.9 0.4 1.8 5 151 30 33.0 0.9 0.6 1.3 6 10 1 1.8 0.6 0.0 3.1 7 12 2 3.3 0.6 0.1 2.2 8 40 6 8.0 0.7 0.3 1.6 9 6 0 0.9 0.0 . 3.9 10 81 15 16.7 0.9 0.5 1.5 11 63 20 15.3 1.3 0.8 2.0 12 36 13 7.7 1.7 0.9 2.9 13 61 12 14.0 0.9 0.4 1.5 14 77 24 18.1 1.3 0.8 2.0 15 54 8 11.9 0.7 0.3 1.3 16 157 22 32.3 0.7 0.4 1.0 17 18 4 4.2 1.0 0.3 2.4 18 74 10 16.0 0.6 0.3 1.2 19 26 9 6.4 1.4 0.6 2.7 20 127 17 27.8 0.6 0.4 1.0 21 13 4 3.2 1.3 0.3 3.2 22 8 3 1.9 1.6 0.3 4.6 23 24 6 5.1 1.2 0.4 2.6 24 27 5 5.7 0.9 0.3 2.0 25 28 8 5.0 1.6 0.7 3.1 26 2 1 0.3 3.1 0.0 17.4 27 11 2 1.9 1.0 0.1 3.8 28 30 5 5.6 0.9 0.3 2.1 29 23 5 4.8 1.0 0.3 2.4 30 142 27 32.7 0.8 0.5 1.2
Please note that site codes for Presentations 32a, 32b, 32c and 32d are different from other presentations in this report. *Late onset sepsis was attributed to the hospital where the first episode of sepsis was acquired. *Neonates who died before 3 days of age are excluded. # # The prediction model was adjusted for GA, SGA, Sex, SNAPII > 20.

E. Site Comparisons
63
Presentation # 32d Late onset sepsis: GA<29 weeks: Adjusted standardized ratios by site
Explanation for Presentation 32c Column 1: Different site code than other presentations in the report Column 2: Number of eligible neonates at your sites (<29 weeks) Column 3: Number of neonates with outcome of interest among those eligible neonates Column 4: Expected number of neonates with outcome of interest after adjustment for GA, SGA, Sex, SNAPII > 20 Column 5: Adjusted standardized ratio calculated based on observed LOS/expected LOS Columns 6 and 7: 95% CI around the adjusted standardized ratio for the outcome Explanation for Presentation 32d X-axis: Expected number of neonates with outcome (value from Column 4 of previous presentation) Y-axis: Adjusted standardized ratio (value from Column 5 of previous presentation) Dark points with numerical notation: Site and its location matching x and y axis values Red funnel shaped lines: 95% confidence limits based on entire network information. Sites outside of red lines represent higher or lower (depending upon position in graph) adjusted standardized ratio. However, for determining whether site is statistically different from others, one should also assess 95% CI and check whether both upper and lower boundaries are also outside of the funnel area or not.

E. Site Comparisons
64
Presentation #33 Late onset sepsis per 1000 patient days: GA<33 weeks: Site specific crude rates
Site
Infections per 1000 patient days
Site Infections per 1000 patient days
Site Infections per 1000 patient days
A 2.9 L 2.4 W 3.9 B 2.7 M 2.7 X 1.9 C 1.8 N 1.9 Y 2.3 D 5.5 O 7.0 Z 5.3 E 1.9 P 3.3 AA 4.2 F 3.1 Q 2.8 AB 2.8 G 3.4 R 1.8 AC 1.2 H 5.4 S 2.6 AD 2.2 I 1.7 T 4.2
J 3.0 U 2.0 Whole network 3.2
K 2.7 Vᶲ 2.0 Total number of neonates = 4 030
*Note that the criteria for entering neonates with GA <33 in the CNN dataset are not the same for site V, thus, the rates may not be comparable with other sites. COMMENTS: Late onset sepsis is defined as positive blood and/or cerebrospinal fluid culture after 2 days of age (includes all admissions). Considerable variation exists when late onset sepsis is analyzed as infections per 1000 patient days. Note that it is possible that certain sites with high retro transfer rates may report a high incidence per 1000 patient days since neonates who are transferred out are those with lower acuity. If a neonate had >1 distinct episodes of infections, they will be counted as separate episodes of infections in the numerator. In presentations #33 and #34, assignment of infection was based on location where the infection happened, and not assigned to the hospital where the first episode of sepsis was acquired.
0
1
2
3
4
5
6
7
A B C D E F G H I J K L M N O P Q R S T U Vᶲ W X Y Z AA AB AC AD
Nos
ocom
ial i
nfec
tion
per 1
000
patie
nt
days
Site

E. Site Comparisons
65
Presentation #34a Central Line-Associated Bloodstream Infections per 1000 central line* days: GA < 33 weeks:
Site specific crude rates
Site CLABSI** Central
line days
CLABSI per 1000 central line days
Site CLABSI** Central
line days
CLABSI per 1000 central line days
CONS Non-CONS
CONS Non-CONS
CONS Non-CONS
CONS Non-CONS
A 5 12 2919 4.1 1.7 P 7 7 2151 3.3 3.3 B 0 1 98 10.2 0.0 Q 8 3 1427 2.1 5.6 C 2 3 319 9.4 6.3 R 5 3 945 3.2 5.3 D 3 5 472 10.6 6.4 S 1 1 141 7.1 7.1 E 1 2 702 2.8 1.4 T 6 3 1006 3.0 6.0 F 9 15 3533 4.2 2.5 U 2 1 761 1.3 2.6 G 5 8 1933 4.1 2.6 V 2 4 1586 2.5 1.3 H 12 14 3960 3.5 3.0 W 14 18 3612 5.0 3.9 I 2 1 152 6.6 13.2 X 1 3 797 3.8 1.3 J 3 2 481 4.2 6.2 Y 9 4 2374 1.7 3.8 K 1 2 300 6.7 3.3 Z 10 13 1865 7.0 5.4 L 2 3 893 3.4 2.2 AA 22 17 2271 7.5 9.7 M 15 12 4910 2.4 3.1 AB 5 11 3260 3.4 1.5 N 2 1 911 1.1 2.2 AC 0 0 26 0.0 0.0 O 32 15 3425 4.4 9.3 AD 1 2 532 3.8 1.9
Total 187 186 46521 3.9 3.9 *Central line = Any of UV, surgical CVL, or PICC ** CLABSI was defined as a primary bloodstream infection in a patient who developed infection while a central line was in situ or within 2 days of removal of the central line.
0
2
4
6
8
10
12
14
16
18
20
A B C D E F G H I J K L M N O P Q R S T U V W X Y Z AA AB AC ADLate
ons
et se
psis
per
100
0 ca
thet
er d
ays
Site
CONS Non-CONS
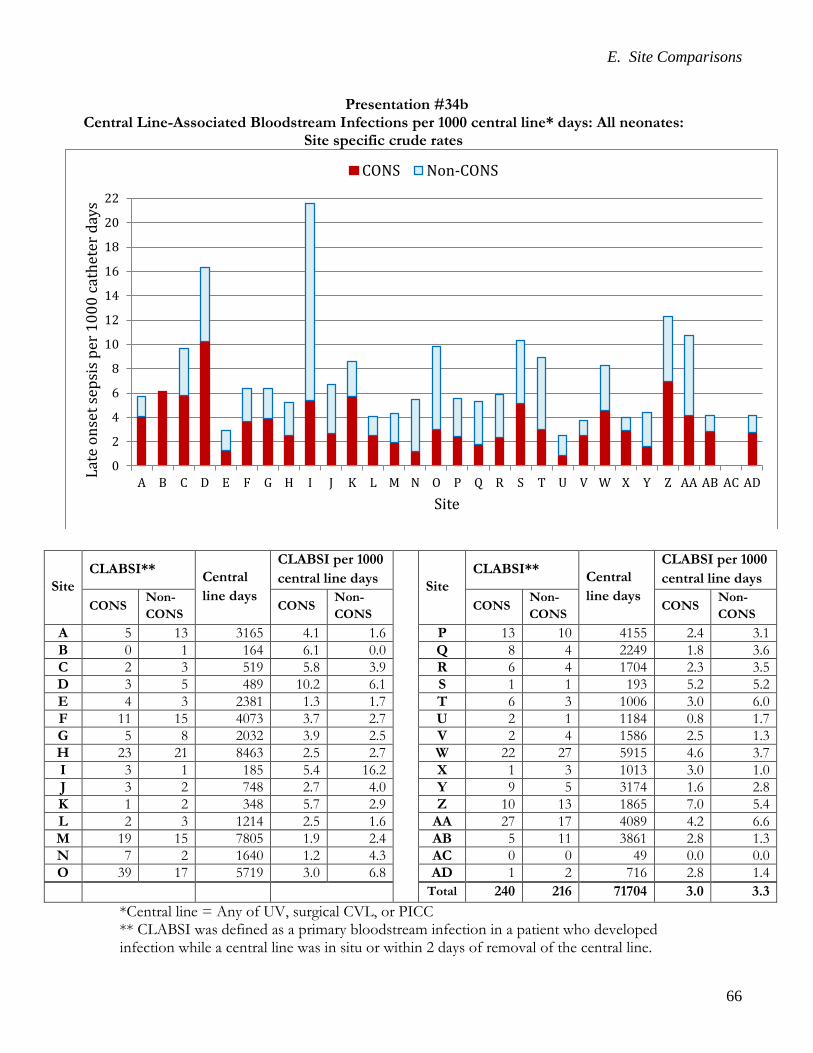
E. Site Comparisons
66
Presentation #34b Central Line-Associated Bloodstream Infections per 1000 central line* days: All neonates:
Site specific crude rates
Site CLABSI** Central
line days
CLABSI per 1000 central line days
Site CLABSI** Central
line days
CLABSI per 1000 central line days
CONS Non-CONS CONS
Non-CONS
CONS Non-CONS CONS
Non-CONS
A 5 13 3165 4.1 1.6 P 13 10 4155 2.4 3.1 B 0 1 164 6.1 0.0 Q 8 4 2249 1.8 3.6 C 2 3 519 5.8 3.9 R 6 4 1704 2.3 3.5 D 3 5 489 10.2 6.1 S 1 1 193 5.2 5.2 E 4 3 2381 1.3 1.7 T 6 3 1006 3.0 6.0 F 11 15 4073 3.7 2.7 U 2 1 1184 0.8 1.7 G 5 8 2032 3.9 2.5 V 2 4 1586 2.5 1.3 H 23 21 8463 2.5 2.7 W 22 27 5915 4.6 3.7 I 3 1 185 5.4 16.2 X 1 3 1013 3.0 1.0 J 3 2 748 2.7 4.0 Y 9 5 3174 1.6 2.8 K 1 2 348 5.7 2.9 Z 10 13 1865 7.0 5.4 L 2 3 1214 2.5 1.6 AA 27 17 4089 4.2 6.6 M 19 15 7805 1.9 2.4 AB 5 11 3861 2.8 1.3 N 7 2 1640 1.2 4.3 AC 0 0 49 0.0 0.0 O 39 17 5719 3.0 6.8 AD 1 2 716 2.8 1.4
Total 240 216 71704 3.0 3.3 *Central line = Any of UV, surgical CVL, or PICC ** CLABSI was defined as a primary bloodstream infection in a patient who developed infection while a central line was in situ or within 2 days of removal of the central line.
0
2
4
6
8
10
12
14
16
18
20
22
A B C D E F G H I J K L M N O P Q R S T U V W X Y Z AA AB AC AD
Late
ons
et se
psis
per
100
0 ca
thet
er d
ays
Site
CONS Non-CONS

E. Site Comparisons
67
Presentation #35 Rate of treatment# for PDA: GA<33 weeks who had PDA: Site specific crude rates
Site Treatment# for PDA among neonates who had PDA (%)
Site Treatment# for PDA among neonates who had PDA (%)
A 52.4 P 56.7 B 50.0 Q 61.0 C 53.3 R 52.2 D 10.0 S 0.0 E NA T 45.5 F 58.4 U 50.0 G 24.5 Vᶲ 80.7 H 68.0 W 75.0 I 33.3 X 34.8 J 66.7 Y 63.2 K 41.2 Z 50.9 L 25.0 AA 60.4 M 62.1 AB 61.5 N 58.8 AC 16.7 O 13.6 AD 29.4 Total 54.6
Total number of neonates who had PDA = 1126 #Treatment of PDA includes any of indomethacin, ibuprofen, acetaminophen, or ligation † Percentage of neonates to each network site and results are attributed to the site of first admission. ᶲNote that the criteria for entering neonates with GA <33 in the CNN dataset are not the same for site V and thus, the rates may not be comparable with other sites. *No PDA among neonates with GA<33 in site E.
0
10
20
30
40
50
60
70
80
90
100
A B C D E F G H I J K L M N O P Q R S T U Vᶲ W X Y Z AA AB AC AD
Perc
enta
ge
Site

E. Site Comparisons
68
Presentation #36 Surgical PDA ligation rate: GA<33 weeks and who had PDA: Site specific crude rates
Site
Surgical ligation for PDA among neonates who had PDA (%)
Site
Surgical ligation for PDA among neonates who had PDA (%)
A 12.2 P 6.0 B 0.0 Q 4.9 C 13.3 R 13.0 D 10.0 S 0.0 E NA T 4.6 F 12.9 U 0.0 G 2.0 Vᶲ 9.7 H 12.0 W 28.6 I 16.7 X 0.0 J 3.7 Y 26.3 K 0.0 Z 5.3 L 0.0 AA 7.3 M 9.2 AB 13.5 N 5.9 AC 0.0 O 0.0 AD 0.0 Total 9.5
Total number of neonates who had PDA = 1126 † Percentage of neonates to each network site and results are attributed to the site of first admission. ᶲNote that the criteria for entering neonates with GA <33 in the CNN dataset are not the same for site V and thus, the rates may not be comparable with other sites. *No PDA among neonates with GA<33 in site E.
02468
1012141618202224262830
A B C D E F G H I J K L M N O P Q R S T U Vᶲ W X Y Z AA AB AC AD
Perc
enta
ge
site

E. Site Comparisons
69
Presentation #37 Neuroimaging abnormalities rates: GA<33 weeks: Site specific crude rates
IVH grade 1 or 2 = Germinal matrix hemorrhage or intraventricular hemorrhage without ventricular enlargement IVH grade 3 or 4 = Intraventricular hemorrhage with ventricular enlargement or persistent parenchymal echogenicity or periventricular leukomalacia
0
5
10
15
20
25
30
35
40
A B C D E F G H I J K L M N O P Q R S T U Vᶲ W X Y Z AA AB AC AD
Per
cent
age
of in
fant
s w
ith C
rani
al U
ltras
ound
Abn
orm
aliti
es
Site
IVH grade 3 or higher IVH grade 1 or 2

E. Site Comparisons
70
Presentation #37 (continued) Neuroimaging abnormalities rate: GA<33 weeks: Site specific crude rates
Total number of neonates = 4 030
VE=ventricular enlargement, PEC=parenchymal echogenicity ᶲ Note that the criteria for entering neonates with GA <33 in the CNN dataset are not same for site V and thus, the rates may not be comparable with other sites. Note that proportion of neonates with neuroimaging data available varies by GA. *Overall % = (number of neonates with cranial ultrasound abnormalities for site / total number of neonates for site)*100 **Overall % = (number of neonates with cranial ultrasound abnormalities for GA category / total number of neonates in gestational category)*100 NA = no data available
Site <25 25-26 27-28 29-30 31-32 Overall rate* per sites %
A 51.9 19.1 2.7 2.1 0.0 8.8 B 0.0 100.0 50.0 0.0 9.1 18.8 C 33.3 0.0 0.0 7.1 3.5 6.9 D 100.0 50.0 33.3 9.5 3.9 14.0 E 0.0 0.0 25.0 0.0 0.0 4.6 F 17.1 27.3 6.3 6.3 2.6 8.7 G 11.8 8.7 13.3 11.1 0.0 7.6 H 0.0 0.0 5.6 6.7 0.0 3.4 I 100.0 25.0 0.0 0.0 0.0 3.9 J 22.2 33.3 10.5 5.0 3.9 10.4 K 42.9 23.1 9.1 2.7 0.0 7.4 L 33.3 22.2 8.3 15.4 0.0 7.2 M 58.1 44.0 21.9 8.1 0.8 17.5 N 0.0 30.8 20.0 0.0 0.0 6.9 O 20.0 20.0 15.0 15.2 2.2 12.0 P 8.3 23.8 12.2 7.7 1.0 7.3 Q 50.0 0.0 11.1 16.0 4.6 10.4 R 25.0 42.9 12.5 3.3 1.8 7.1 S 100.0 20.0 25.0 0.0 14.3 19.1 T 0.0 7.1 40.0 4.4 0.0 7.2 U 0.0 15.4 10.0 0.0 0.0 4.6 Vᶲ 40.0 31.4 11.8 NA NA 24.1 W 15.4 16.1 5.7 8.9 0.0 6.4 X 33.3 12.5 13.3 0.0 0.0 3.9 Y 25.0 16.7 6.9 14.3 8.3 11.1 Z 60.0 12.0 17.4 0.0 3.3 11.0 AA 35.0 16.1 11.1 4.9 5.4 10.4 AB 13.6 19.1 4.6 3.1 1.1 5.7 AC NA 50.0 0.0 0.0 0.0 6.7 AD 0.0 33.3 14.3 6.7 0.0 8.8 Overall rate** per GA group % 31.0 22.2 10.8 6.0 1.9 9.3

E. Site Comparisons
71
Presentation# 38a IVH grade 3 or 4 or PVL: GA<33 weeks: Adjusted standardized ratios by site
Site Number of infants
Number with IVH G3/4 or
PVL
Adjusted# Expected number with IVH
G3/4 or PVL
Adjusted# Standardized
ratio
95% confidence interval for adjusted
standardized ratio 1 88 12 11.0 1.1 0.6 1.9 2 195 22 21.6 1.0 0.6 1.5 3 109 15 14.4 1.0 0.6 1.7 4 94 14 10.9 1.3 0.7 2.2 5 313 29 39.7 0.7 0.5 1.0 6 19 4 1.6 2.5 0.7 6.3 7 12 0 2.1 0.0 . 1.8 8 103 5 9.9 0.5 0.2 1.2 9 15 1 1.2 0.8 0.0 4.7 10 207 17 21.9 0.8 0.5 1.2 11 147 18 17.3 1.0 0.6 1.6 12 77 3 6.4 0.5 0.1 1.4 13 127 10 16.0 0.6 0.3 1.1 14 148 14 20.8 0.7 0.4 1.1 15 116 15 12.3 1.2 0.7 2.0 16 236 28 35.1 0.8 0.5 1.2 17 51 5 5.5 0.9 0.3 2.1 18* 73 18 14.5 1.2 0.7 2.0 19 75 5 7.6 0.7 0.2 1.5 20 219 12 30.5 0.4 0.2 0.7 21 41 4 4.3 0.9 0.2 2.4 22 56 8 3.6 2.2 1.0 4.4 23 63 3 6.4 0.5 0.1 1.4 24 83 4 7.9 0.5 0.1 1.3 25 87 7 6.9 1.0 0.4 2.1 26 9 3 1.4 2.1 0.4 6.2 27 43 2 3.0 0.7 0.1 2.4 28 55 7 6.7 1.0 0.4 2.1 29 73 4 5.2 0.8 0.2 2.0 30 256 53 32.7 1.6 1.2 2.1
Please note that site codes for Presentations 38a and 38b are different from other presentations in this report. Neonates with major congenital anomalies are excluded. # # The prediction model was adjusted for GA, SGA, Sex, SNAPII > 20. * Site 18 has different criteria for entering neonates in the CNN dataset, and may not be comparable with other sites. (See next page for full explanation)

E. Site Comparisons
72
Presentation #38b IVH grade 3 or 4 or PVL: GA<33 weeks: Adjusted standardized ratios by site
Explanation for Presentation 38a Column 1: Different site code than other presentations in the report Column 2: Number of eligible neonates at your sites (<33 weeks and no major anomaly) Column 3: Number of neonates with outcome of interest among those eligible neonates Column 4: Expected number of neonates with outcome of interest after adjustment for GA, SGA, Sex, SNAPII > 20 Column 5: Adjusted standardized ratio calculated based on observed IVH or PVL/expected IVH or PVL Columns 6 and 7: 95% CI around the adjusted standardized ratio for the outcome Explanation for Presentation 38b X-axis: Expected number of neonates with outcome (value from Column 4 of previous presentation) Y-axis: Adjusted standardized ratio (value from Column 5 of previous presentation) Dark points with numerical notation: Site and its location matching x and y axis values Red funnel shaped lines: 95% confidence limits based on entire network information. Sites outside of red lines represent higher or lower (depending upon position in graph) adjusted standardized ratio. However, for determining whether site is statistically different from others, one should also assess 95% CI and check whether both upper and lower boundaries are also outside of the funnel area or not.

E. Site Comparisons
73
Presentation# 38c IVH grade 3 or 4 or PVL: GA<29 weeks: Adjusted standardized ratios by site
Site Number of infants
Number with IVH G3/4 or
PVL
Adjusted# Expected number with IVH
G3/4 or PVL
Adjusted# Standardized
ratio
95% confidence interval for adjusted
standardized ratio 1 40 9 8.4 1.1 0.5 2.0 2 84 16 16.4 1.0 0.6 1.6 3 48 10 11.1 0.9 0.4 1.7 4 41 5 7.3 0.7 0.2 1.6 5 149 22 29.6 0.7 0.5 1.1 6 10 3 1.4 2.1 0.4 6.3 7 7 0 1.7 0.0 . 2.1 8 36 4 6.6 0.6 0.2 1.6 9 6 1 0.9 1.2 0.0 6.5 10 81 12 15.4 0.8 0.4 1.4 11 63 16 12.9 1.2 0.7 2.0 12 27 1 3.9 0.3 0.0 1.4 13 66 8 13.2 0.6 0.3 1.2 14 71 9 14.8 0.6 0.3 1.2 15 51 8 9.1 0.9 0.4 1.7 16 149 26 27.7 0.9 0.6 1.4 17 19 4 4.1 1.0 0.3 2.5 18 73 18 15.0 1.2 0.7 1.9 19 27 5 5.6 0.9 0.3 2.1 20 117 10 22.5 0.4 0.2 0.8 21 12 2 2.7 0.7 0.1 2.6 22 10 5 1.9 2.7 0.9 6.2 23 24 3 4.7 0.6 0.1 1.9 24 25 4 4.8 0.8 0.2 2.2 25 25 6 4.0 1.5 0.6 3.3 26 4 2 0.9 2.2 0.2 7.9 27 11 2 1.5 1.4 0.2 5.0 28 27 7 4.4 1.6 0.6 3.2 29 20 2 3.3 0.6 0.1 2.2 30 118 45 24.5 1.8 1.3 2.5
Please note that site codes for Presentations 38a, 38b, 38c and 38d are different from other presentations in this report. Neonates with major congenital anomalies are excluded. # # The prediction model was adjusted for GA, SGA, Sex, SNAPII > 20.

E. Site Comparisons
74
Presentation #38d IVH grade 3 or 4 or PVL: GA<29 weeks: Adjusted standardized ratios by site
Explanation for Presentation 38c Column 1: Different site code than other presentations in the report Column 2: Number of eligible neonates at your sites (<33 weeks and no major anomaly) Column 3: Number of neonates with outcome of interest among those eligible neonates Column 4: Expected number of neonates with outcome of interest after adjustment for GA, SGA, Sex, SNAPII > 20 Column 5: Adjusted standardized ratio calculated based on observed IVH or PVL/expected IVH or PVL Columns 6 and 7: 95% CI around the adjusted standardized ratio for the outcome Explanation for Presentation 38d X-axis: Expected number of neonates with outcome (value from Column 4 of previous presentation) Y-axis: Adjusted standardized ratio (value from Column 5 of previous presentation) Dark points with numerical notation: Site and its location matching x and y axis values Red funnel shaped lines: 95% confidence limits based on entire network information. Sites outside of red lines represent higher or lower (depending upon position in graph) adjusted standardized ratio. However, for determining whether site is statistically different from others, one should also assess 95% CI and check whether both upper and lower boundaries are also outside of the funnel area or not.

E. Site Comparisons
75
Presentation #39 NEC treatment rates: GA<33 weeks: Site specific crude rates
0
1
2
3
4
5
6
7
8
A B C D E F G H I J K L M N O P Q R S T U Vᶲ W X Y Z AA AB AC AD
Perc
enta
ges
Site
Medical treatment only Medical + peritoneal drainage Surgical treatment only Surgical + peritoneal drainage

E. Site Comparisons
76
Presentation #39 (continued) NEC treatment rates: GA<33 weeks: Site specific crude rates
Site Treatment (%) Medical treatment only
Medical + peritoneal drainage
Surgical treatment only
Surgical + peritoneal drainage
Any
A 2.0 0.3 1.5 0.0 3.8 B 0.0 0.0 0.0 0.0 0.0 C 0.0 1.7 0.0 0.0 1.7 D 3.5 0.0 0.0 0.0 3.5 E 0.0 0.0 4.6 0.0 4.6 F 1.6 0.0 2.2 0.3 4.1 G 2.6 0.0 1.9 0.0 4.5 H 5.7 0.0 2.3 0.0 8.0 I 3.9 0.0 0.0 0.0 3.9 J 0.9 0.9 0.0 0.9 2.6 K 0.8 0.0 0.0 0.0 0.8 L 0.0 1.2 0.0 1.2 2.4 M 3.9 0.0 2.0 0.0 5.9 N 1.0 0.0 1.0 0.0 2.0 O 0.0 0.0 2.3 0.0 2.3 P 1.3 0.4 2.6 0.0 4.3 Q 0.7 0.0 2.1 0.0 2.8 R 1.8 0.9 0.9 0.9 4.5 S 4.8 0.0 0.0 0.0 4.8 T 1.2 0.0 1.2 0.0 2.4 U 1.5 0.0 1.5 1.5 4.6 Vᶲ 1.3 0.0 1.3 0.0 2.5 W 0.5 0.0 1.4 0.0 1.8 X 1.0 0.0 0.0 1.0 1.9 Y 0.0 0.0 0.8 0.0 0.8 Z 3.1 0.0 0.6 0.0 3.7 AA 3.6 0.0 2.3 0.0 5.9 AB 2.2 0.3 0.6 0.0 3.2 AC 0.0 0.0 0.0 0.0 0.0 AD 0.0 0.0 0.0 0.0 0.0 Total 1.9 0.2 1.4 0.1 3.6
COMMENTS: These analyses include 4 026 neonates from 30 sites. Twenty-nine sites collected data on all eligible admissions for neonates with GA < 33 weeks whereas one site (marked by ᶲ) collected data on selected eligible admissions only. ᶲNote that the criteria for entering neonates with GA <33 weeks in the CNN dataset are not same for site V and thus, the rates may not be comparable with other sites.

E. Site Comparisons
77
Presentation #40a NEC: GA<33 weeks: Adjusted standardized ratios by site
Site Number of infants
Number of NEC
Adjusted# Expected
number of NEC
Adjusted# Standardized
ratio
95% confidence interval for adjusted standardized ratio
1 113 3 3.9 0.8 0.2 2.2 2 215 13 8.1 1.6 0.9 2.7 3 127 3 4.8 0.6 0.1 1.8 4 124 1 3.6 0.3 0.0 1.6 5 356 15 13.1 1.1 0.6 1.9 6 20 1 0.7 1.4 0.0 8.1 7 19 1 0.9 1.1 0.0 6.1 8 114 1 3.2 0.3 0.0 1.7 9 15 0 0.4 0.0 . 9.3 10 230 10 6.8 1.5 0.7 2.7 11 163 6 5.9 1.0 0.4 2.2 12 85 7 2.4 2.9 1.2 6.0 13 151 6 6.4 0.9 0.3 2.0 14 212 4 7.0 0.6 0.2 1.5 15 140 3 4.5 0.7 0.1 1.9 16 334 12 12.7 0.9 0.5 1.7 17 57 0 2.0 0.0 . 1.9 18* 78 2 5.1 0.4 0.0 1.4 19 81 2 2.7 0.7 0.1 2.6 20 299 8 10.1 0.8 0.3 1.6 21 54 0 1.6 0.0 . 2.3 22 56 2 1.3 1.6 0.2 5.7 23 64 2 2.0 1.0 0.1 3.7 24 102 2 2.6 0.8 0.1 2.8 25 108 4 2.5 1.6 0.4 4.1 26 16 0 0.4 0.0 . 8.4 27 52 2 1.1 1.8 0.2 6.6 28 99 1 2.6 0.4 0.0 2.1 29 79 2 2.1 0.9 0.1 3.4 30 336 19 11.8 1.6 1.0 2.5
Please note that site codes for Presentations 40a and 40b are different from other presentations in this report. Neonates with major congenital anomalies are excluded. # Variables adjusted for in the prediction model: GA, SGA, Sex, SNAPII > 20 * Site 18 has different criteria for entering neonates in the CNN dataset, and may not be comparable with other sites. (See next page for full explanation)

E. Site Comparisons
78
Presentation #40b NEC: GA<33 weeks: Adjusted standardized ratios by site
Explanation for Presentation 40a Column 1: Different site code than other presentations in the report Column 2: Number of eligible neonates at your sites (<33 weeks and no major anomaly) Column 3: Number of neonates with outcome of interest among those eligible neonates Column 4: Expected number of neonates with outcome of interest after adjustment for GA, SGA, Sex, SNAPII > 20 Column 5: Adjusted standardized ratio calculated based on observed NEC/expected NEC Columns 6 and 7: 95% CI around the adjusted standardized ratio for the outcome Explanation for Presentation 40b X-axis: Expected number of neonates with outcome (value from Column 4 of previous presentation) Y-axis: Adjusted standardized ratio (value from Column 5 of previous presentation) Dark points with numerical notation: Site and its location matching x and y axis values Red funnel shaped lines: 95% confidence limits based on entire network information. Sites outside of red lines represent higher or lower (depending upon position in graph) adjusted standardized ratio. However, for determining whether site is statistically different from others, one should also assess 95% CI and check whether both upper and lower boundaries are also outside of the funnel area or not.

E. Site Comparisons
79
Presentation #40c NEC: GA<29 weeks: Adjusted standardized ratios by site
Site Number of infants
Number of NEC
Adjusted# Expected
number of NEC
Adjusted# Standardized
ratio
95% confidence interval for adjusted standardized ratio
1 41 2 3.1 0.7 0.1 2.3 2 85 11 6.3 1.8 0.9 3.1 3 54 3 3.9 0.8 0.2 2.2 4 41 1 2.5 0.4 0.0 2.2 5 153 12 10.4 1.2 0.6 2.0 6 10 1 0.6 1.6 0.0 9.1 7 9 1 0.7 1.3 0.0 7.5 8 38 1 2.3 0.4 0.0 2.4 9 6 0 0.3 0.0 . 11.8 10 82 9 5.2 1.7 0.8 3.3 11 62 5 4.6 1.1 0.4 2.6 12 27 2 1.7 1.2 0.1 4.3 13 68 5 5.2 1.0 0.3 2.3 14 75 3 5.4 0.6 0.1 1.6 15 51 3 3.6 0.8 0.2 2.5 16 159 10 10.5 0.9 0.5 1.7 17 21 0 1.5 0.0 . 2.4 18 78 2 5.3 0.4 0.0 1.4 19 28 2 2.1 1.0 0.1 3.5 20 120 7 8.0 0.9 0.4 1.8 21 13 0 1.0 0.0 . 3.6 22 10 2 0.7 3.0 0.3 10.9 23 25 2 1.6 1.3 0.1 4.5 24 26 1 1.7 0.6 0.0 3.4 25 25 1 1.6 0.6 0.0 3.6 26 4 0 0.3 0.0 . 12.9 27 11 2 0.7 3.0 0.3 10.9 28 30 1 1.8 0.5 0.0 3.1 29 21 2 1.5 1.3 0.2 4.8 30 130 12 9.2 1.3 0.7 2.3
Please note that site codes for Presentations 40a, 40b, 40c and 40b are different from other presentations in this report. Neonates with major congenital anomalies are excluded. # # The prediction model was adjusted for GA, SGA, Sex, SNAPII > 20.

E. Site Comparisons
80
Presentation #40d NEC: GA<33 weeks: Adjusted standardized ratios by site
Explanation for Presentation 40c Column 1: Different site code than other presentations in the report Column 2: Number of eligible neonates at your sites (<29 weeks and no major anomaly) Column 3: Number of neonates with outcome of interest among those eligible neonates Column 4: Expected number of neonates with outcome of interest after adjustment for GA, SGA, Sex, SNAPII > 20 Column 5: Adjusted standardized ratio calculated based on observed NEC/expected NEC Columns 6 and 7: 95% CI around the adjusted standardized ratio for the outcome Explanation for Presentation 40d X-axis: Expected number of neonates with outcome (value from Column 4 of previous presentation) Y-axis: Adjusted standardized ratio (value from Column 5 of previous presentation) Dark points with numerical notation: Site and its location matching x and y axis values Red funnel shaped lines: 95% confidence limits based on entire network information. Sites outside of red lines represent higher or lower (depending upon position in graph) adjusted standardized ratio. However, for determining whether site is statistically different from others, one should also assess 95% CI and check whether both upper and lower boundaries are also outside of the funnel area or not.

E. Site Comparisons
81
Presentation #41 Oxygen use at 36 weeks/at discharge/death: GA <33 weeks: site specific crude rates
GA at birth Site <25 25-26 27-28 29-30 31-32 Overall rate for sites A 73.1 32.3 9.5 7.5 2.5 16.4 B 100.0 0.0 50.0 0.0 9.1 18.8 C 83.3 33.3 0.0 0.0 3.5 12.5 D 100.0 50.0 0.0 4.8 3.9 7.3 E 100.0 NA 0.0 0.0 33.3 25.0 F 71.4 52.3 19.2 11.6 6.1 22.1 G 88.2 26.1 23.3 2.8 1.9 19.0 H 100.0 71.4 22.2 3.5 23.1 22.9 I 0.0 25.0 33.3 0.0 3.3 7.7 J 55.6 46.7 10.5 5.0 0.0 13.0 K 57.1 38.5 31.8 0.0 4.9 15.0 L 66.7 66.7 33.3 0.0 0.0 14.5 M 70.4 58.3 21.7 8.6 6.7 22.3 N 0.0 46.2 0.0 4.2 0.0 7.2 O 86.7 50.0 15.0 9.4 6.8 24.4 P 66.7 47.6 20.4 5.8 4.1 15.1 Q 80.0 70.6 46.2 12.0 9.2 28.7 R 25.0 28.6 25.0 0.0 2.2 8.4 S 100.0 80.0 25.0 0.0 0.0 28.6 T 100.0 50.0 20.0 9.1 0.0 19.2 U 50.0 69.2 50.0 10.0 6.7 27.7 Vᶲ 80.0 67.7 23.5 NA NA 50.0 W 61.5 35.5 18.2 3.8 2.4 13.7 X 33.3 25.0 26.7 0.0 0.0 6.8 Y 87.5 100.0 48.3 17.1 8.3 29.4 Z 93.3 56.0 60.9 17.5 11.5 34.2 AA 90.0 80.7 44.4 13.1 8.5 33.3 AB 77.3 40.5 21.5 11.3 7.7 20.8 AC NA 0.0 25.0 0.0 0.0 6.7 AD 80.0 33.3 28.6 0.0 0.0 15.8 Overall rate for GA group 75.3 49.9 24.5 7.8 5.2 20.4
Total number of neonates = 3 937. 93 neonates were excluded due to first admission after week 36. NA = no data available. ᶲNote that the criteria for entering neonates with GA <33 weeks in the CNN dataset are not the same for site V and thus, the rates may not be comparable with other sites. Outcomes are attributed to the site of first admission. Comments: Neonates were classified as having oxygen use at 36 weeks as follows: a) receiving supplemental oxygen at week 36 postmenstrual age (PMA) or b) discharged prior to week 36 PMA and receiving supplemental oxygen at discharge. Neonates were excluded from analysis if the first admission was after week 36. There were no requirements for chest radiographs at the time of diagnosis. Deaths prior to week 36 PMA are included.

E. Site Comparisons
82
Presentation #42 Oxygen use at 36 weeks/at discharge: GA<33 weeks: Site specific crude rates
GA at birth Site <25 25-26 27-28 29-30 31-32 Overall rate for sites A 58.8 26.3 9.5 6.5 2.5 12.5 B NA 0.0 50.0 0.0 9.1 13.3 C 75.0 33.3 0.0 0.0 3.5 9.3 D NA 0.0 0.0 4.8 0.0 1.9 E 100.0 NA 0.0 0.0 33.3 25.0 F 60.0 46.2 18.2 9.7 5.3 17.9 G 77.8 19.1 17.9 2.8 1.9 12.3 H 100.0 71.4 12.5 3.5 9.1 16.9 I 0.0 0.0 20.0 0.0 3.3 4.0 J 33.3 33.3 10.5 5.0 0.0 8.3 K 50.0 11.1 31.8 0.0 2.5 10.5 L 50.0 66.7 33.3 0.0 0.0 13.4 M 65.2 50.0 20.3 7.5 3.5 17.9 N 0.0 30.0 0.0 0.0 0.0 3.2 O 75.0 41.2 10.5 9.4 6.8 17.5 P 60.0 35.3 15.2 5.8 3.1 11.3 Q 66.7 66.7 44.0 12.0 7.8 24.4 R 25.0 16.7 25.0 0.0 2.2 7.5 S NA 80.0 25.0 0.0 0.0 25.0 T 100.0 36.4 11.1 9.1 0.0 14.9 U 50.0 63.6 44.4 10.0 6.7 24.2 Vᶲ 66.7 54.2 21.2 NA NA 38.1 W 37.5 35.5 15.6 3.8 1.2 10.7 X 33.3 25.0 26.7 0.0 0.0 6.8 Y 87.5 100.0 48.3 14.7 8.3 28.8 Z 87.5 52.2 59.1 13.2 10.0 28.5 AA 71.4 71.4 41.2 11.7 7.1 24.0 AB 73.7 37.5 19.1 9.5 6.7 18.2 AC NA 0.0 25.0 0.0 0.0 6.7 AD 50.0 14.3 0.0 0.0 0.0 4.0 Overall rate for GA group 63.9 41.9 22.0 6.7 4.0 15.9
Total number of neonates = 3 724. 306 neonates were excluded due to death prior to week 36 or first admission after week 36. NA = no data available. ᶲNote that the criteria for entering neonates with GA <33 weeks in the CNN dataset are not the same for site V and thus, the rates may not be comparable with other sites. Outcomes are attributed to the site of first admission. Comments: Neonates were classified as having oxygen use at 36 weeks as follows: a) receiving supplemental oxygen at week 36 postmenstrual age (PMA) or b) discharged prior to week 36 PMA and receiving supplemental oxygen at discharge. Neonates were excluded from analysis if they died prior to week 36 or the first admission was after week 36. There were no requirements for chest radiographs at the time of diagnosis.

E. Site Comparisons
83
Presentation #43a Oxygen use at 36 weeks/at discharge: GA <33 weeks: Adjusted standardized ratios by
site
Site Number of infants
Number with oxygen use at
36w or discharge
Adjusted# Expected number of oxygen use at
36w or discharge
Adjusted# Standardized
ratio
95% confidence interval for adjusted
standardized ratio
1 107 8 18.6 0.4 0.2 0.8 2 186 44 40.0 1.1 0.8 1.5 3 114 20 24.6 0.8 0.5 1.3 4 123 34 17.1 2.0 1.4 2.8 5 337 58 73.0 0.8 0.6 1.0 6 19 5 3.0 1.7 0.5 3.9 7 6 2 4.6 0.4 0.0 1.6 8 109 10 16.4 0.6 0.3 1.1 9 15 1 1.8 0.5 0.0 3.0 10 219 24 35.7 0.7 0.4 1.0 11 151 43 30.0 1.4 1.0 1.9 12 77 13 10.6 1.2 0.7 2.1 13 141 16 29.3 0.5 0.3 0.9 14 200 20 36.8 0.5 0.3 0.8 15 132 31 21.5 1.4 1.0 2.0 16 313 39 62.0 0.6 0.4 0.9 17 50 2 9.8 0.2 0.0 0.7 18* 62 23 29.6 0.8 0.5 1.2 19 72 11 14.0 0.8 0.4 1.4 20 291 50 53.5 0.9 0.7 1.2 21 51 4 6.9 0.6 0.2 1.5 22 51 1 6.0 0.2 0.0 0.9 23 61 14 10.8 1.3 0.7 2.2 24 102 7 13.1 0.5 0.2 1.1 25 91 4 11.0 0.4 0.1 0.9 26 15 2 1.9 1.0 0.1 3.7 27 50 2 4.5 0.4 0.1 1.6 28 92 3 11.2 0.3 0.1 0.8 29 78 9 9.3 1.0 0.4 1.8 30 301 47 57.8 0.8 0.6 1.1
Please note that site codes for Presentations 43a and 43b are different from other presentations in this report. Neonates with major congenital anomalies and death before 36 weeks were excluded. # # The prediction model was adjusted for GA, SGA, Sex, SNAPII > 20. * Site 18 has different criteria for entering neonates in the CNN dataset, and may not be comparable with other sites. (See next page for full explanation)

E. Site Comparisons
84
Presentation #43b Oxygen use at 36 weeks/at discharge: GA <33 weeks: Adjusted standardized ratios
by site
Explanation for Presentation 43a Column 1: Different site code than other presentations in the report Column 2: Number of eligible neonates at your sites (<33 weeks and no major anomaly) Column 3: Number of neonates with outcome of interest among those eligible neonates Column 4: Expected number of neonates with outcome of interest after adjustment for GA, SGA, Sex, SNAPII > 20 Column 5: Adjusted standardized ratio calculated based on observed oxygen use/expected oxygen use Columns 6 and 7: 95% CI around the adjusted standardized ratio for the outcome Explanation for Presentation 43b X-axis: Expected number of neonates with outcome (value from Column 4 of previous presentation) Y-axis: Adjusted standardized ratio (value from Column 5 of previous presentation) Dark points with numerical notation: Site and its location matching x and y axis values Red funnel shaped lines: 95% confidence limits based on entire network information. Sites outside of red lines represent higher or lower (depending upon position in graph) adjusted standardized ratio. However, for determining whether site is statistically different from others, one should also assess 95% CI and check whether both upper and lower boundaries are also outside of the funnel area or not. Note: Deaths before 36 weeks were not included in the denominator.

E. Site Comparisons
85
Presentation #43c Oxygen use at 36 weeks / at discharge: GA <29 weeks: Adjusted standardized ratios
by site
Site Number of infants
Number with oxygen use at
36w or discharge
Adjusted# Expected number of oxygen use at
36w or discharge
Adjusted# Standardized
ratio
95% confidence interval for adjusted
standardized ratio
1 35 7 16.1 0.4 0.2 0.9 2 61 33 33.3 1.0 0.7 1.4 3 43 15 21.4 0.7 0.4 1.2 4 41 25 13.2 1.9 1.2 2.8 5 136 47 57.9 0.8 0.6 1.1 6 9 5 2.8 1.8 0.6 4.2 7 1 1 4.0 0.2 0.0 1.4 8 35 9 12.7 0.7 0.3 1.3 9 6 1 1.5 0.7 0.0 3.7 10 73 19 28.7 0.7 0.4 1.0 11 53 32 24.8 1.3 0.9 1.8 12 26 10 8.0 1.3 0.6 2.3 13 58 16 26.3 0.6 0.3 1.0 14 68 17 30.0 0.6 0.3 0.9 15 43 23 18.4 1.2 0.8 1.9 16 143 31 54.8 0.6 0.4 0.8 17 14 2 8.5 0.2 0.0 0.9 18 62 23 30.2 0.8 0.5 1.1 19 24 9 11.5 0.8 0.4 1.5 20 114 38 44.0 0.9 0.6 1.2 21 11 4 5.3 0.8 0.2 1.9 22 6 0 3.9 0.0 . 0.9 23 22 12 9.1 1.3 0.7 2.3 24 26 7 9.4 0.7 0.3 1.5 25 24 4 7.9 0.5 0.1 1.3 26 3 1 1.5 0.7 0.0 3.6 27 9 1 3.1 0.3 0.0 1.8 28 27 3 8.6 0.3 0.1 1.0 29 20 9 7.5 1.2 0.5 2.3 30 109 38 49.1 0.8 0.5 1.1
Please note that site codes for Presentations 43a, 43b, 43c and 43b are different from other presentations in this report. Neonates with major congenital anomalies and death before 36 weeks were excluded. # # The prediction model was adjusted for GA, SGA, Sex, SNAPII > 20.

E. Site Comparisons
86
Presentation #43d Oxygen use at 36 weeks / at discharge: GA <29 weeks: Adjusted standardized ratios
by site
Explanation for Presentation 43c Column 1: Different site code than other presentations in the report Column 2: Number of eligible neonates at your sites (<29 weeks and no major anomaly) Column 3: Number of neonates with outcome of interest among those eligible neonates Column 4: Expected number of neonates with outcome of interest after adjustment for GA, SGA, Sex, SNAPII > 20 Column 5: Adjusted standardized ratio calculated based on observed oxygen use/expected oxygen use Columns 6 and 7: 95% CI around the adjusted standardized ratio for the outcome Explanation for Presentation 43d X-axis: Expected number of neonates with outcome (value from Column 4 of previous presentation) Y-axis: Adjusted standardized ratio (value from Column 5 of previous presentation) Dark points with numerical notation: Site and its location matching x and y axis values Red funnel shaped lines: 95% confidence limits based on entire network information. Sites outside of red lines represent higher or lower (depending upon position in graph) adjusted standardized ratio. However, for determining whether site is statistically different from others, one should also assess 95% CI and check whether both upper and lower boundaries are also outside of the funnel area or not. Note: Deaths before 36 weeks were not included in the denominator.

E. Site Comparisons
87
Presentation #44a Postnatal use of steroids for treatment of BPD: GA<33 weeks: Site specific crude rates†
Postnatal steroid use (%) Postnatal steroid use (%)
Site Systemic Steroids only
Both Inhaled Steroids only
Site Systemic Steroids only
Both Inhaled Steroids only
A 0.3 3.2 21.3 P 1.7 0.9 1.7 B 0.0 0.0 0.0 Q 9.7 0.7 0.0 C 1.7 0.0 0.0 R 3.5 0.0 0.0 D 1.8 0.0 0.0 S 0.0 0.0 0.0 E 4.6 4.6 0.0 T 6.0 0.0 0.0 F 0.8 2.7 2.7 U 1.5 0.0 0.0 G 10.1 5.1 1.9 Vᶲ 16.5 0.0 0.0 H 3.4 0.0 0.0 W 7.3 0.0 0.0 I 1.9 1.9 0.0 X 3.9 0.0 0.0 J 7.0 0.0 0.0 Y 2.4 0.8 3.2 K 1.7 0.8 0.0 Z 6.1 0.6 0.0 L 1.2 0.0 0.0 AA 9.5 0.0 0.5 M 3.4 0.9 0.3 AB 1.3 1.3 2.5 N 5.9 0.0 0.0 AC 0.0 0.0 0.0 O 13.5 0.0 0.0 AD 0.0 1.8 10.5 Total 4.3 1.1 2.7
Total number of neonates = 4 030 † Percentage of neonates to each network site and results are attributed to the site of first admission. ᶲNote that the criteria for entering neonates with GA <33 in the CNN dataset are not the same for site V and thus, the rates may not be comparable with other sites. COMMENTS: Specific criteria for these treatments in each site are not documented here.
02468
101214161820222426
A B C D E F G H I J K L M N O P Q R S T U Vᶲ W X Y Z AA AB AC AD
Perc
enta
ge
Site
Systemic Steroids only Both Inhaled Steroids only

E. Site Comparisons
88
Presentation #44b Systemic steroids for hypotension: GA<33 weeks: Site specific crude rates†
Site Postnatal systemic steroids use for hypotension (%)
Site Postnatal systemic steroids use for hypotension (%)
A 4.4 P 3.9 B 0.0 Q 4.9 C 6.9 R 7.1 D 3.5 S 4.8 E 0.0 T 2.4 F 3.0 U 4.6 G 7.6 Vᶲ 0.0 H 6.8 W 6.4 I 1.9 X 1.9 J 6.1 Y 1.6 K 2.5 Z 0.6 L 0.0 AA 7.7 M 8.7 AB 0.6 N 0.0 AC 0.0 O 4.5 AD 0.0 Total 4.1
Total number of neonates = 4 030 † Percentage of neonates to each network site and results are attributed to the site of first admission. ᶲNote that the criteria for entering neonates with GA <33 in the CNN dataset are not the same for site V and thus, the rates may not be comparable with other sites. COMMENTS: Specific criteria for these treatments in each site are not documented here.
0
1
2
3
4
5
6
7
8
9
A B C D E F G H I J K L M N O P Q R S T U Vᶲ W X Y Z AA AB AC AD
Perc
enta
ge
Site

E. Site Comparisons
89
Presentation #45a ROP >stage 3: GA<33weeks: Adjusted standardized ratios by site
Site Number of infants
Number with ROP >Stage 3
Adjusted# Expected number with ROP >
Stage 3
Adjusted# Standardized
ratio
95% confidence interval for adjusted standardized ratio
1 61 7 6.6 1.1 0.4 2.2 2 124 8 14.1 0.6 0.2 1.1 3 69 2 8.1 0.2 0.0 0.9 4 58 8 4.8 1.7 0.7 3.3 5 164 18 21.5 0.8 0.5 1.3 6 17 4 0.9 4.4 1.2 11.2 7 7 2 1.6 1.2 0.1 4.5 8 43 2 4.4 0.5 0.1 1.7 9 11 1 0.3 3.0 0.0 16.8 10 88 8 9.7 0.8 0.4 1.6 11 72 5 10.0 0.5 0.2 1.2 12 22 1 2.9 0.3 0.0 1.9 13 94 2 11.5 0.2 0.0 0.6 14 31 2 10.6 0.2 0.0 0.7 15 63 7 6.8 1.0 0.4 2.1 16 126 7 19.2 0.4 0.1 0.8 17 29 4 2.9 1.4 0.4 3.5 18* 34 7 9.8 0.7 0.3 1.5 19 34 0 4.3 0.0 . 0.9 20 93 4 15.8 0.3 0.1 0.6 21 31 1 2.6 0.4 0.0 2.2 22 53 1 1.5 0.7 0.0 3.8 23 40 1 2.6 0.4 0.0 2.1 24 47 5 3.2 1.6 0.5 3.6 25 66 5 3.1 1.6 0.5 3.8 26 5 0 0.8 0.0 . 4.6 27 8 2 1.1 1.9 0.2 6.8 28 43 1 3.0 0.3 0.0 1.9 29 34 0 3.0 0.0 . 1.2 30 58 18 18.9 1.0 0.6 1.5
Please note that site codes for Presentations 45a, 45b, 45c and 45d are different from other presentations in this report. Neonates with major congenital anomalies are excluded. # # The prediction model was adjusted for GA, SGA, Sex, SNAPII > 20. * Site 18 has different criteria for entering neonates in the CNN dataset, and may not be comparable with other sites. (See next page for full explanation)

E. Site Comparisons
90
Presentation #45b ROP >stage 3: GA<33weeks: Adjusted standardized ratios by site
Explanation for Presentation 45a Column 1: Different site code than other presentations in the report Column 2: Number of eligible neonates at your sites (<33 weeks and no major anomaly) Column 3: Number of neonates with outcome of interest among those eligible neonates Column 4: Expected number of neonates with outcome of interest after adjustment for GA, SGA, Sex, SNAPII > 20 Column 5: Adjusted standardized ratio calculated based on observed ROP/expected ROP Columns 6 and 7: 95% CI around the adjusted standardized ratio for the outcome Explanation for Presentation 45b X-axis: Expected number of neonates with outcome (value from Column 4 of previous presentation) Y-axis: Adjusted standardized ratio (value from Column 5 of previous presentation) Dark points with numerical notation: Site and its location matching x and y axis values Red funnel shaped lines: 95% confidence limits based on entire network information. Sites outside of red lines represent higher or lower (depending upon position in graph) adjusted standardized ratio. However, for determining whether site is statistically different from others, one should also assess 95% CI and check whether both upper and lower boundaries are also outside of the funnel area or not.

E. Site Comparisons
91
Presentation #45c ROP > stage 3: GA < 29 weeks: Adjusted standardized ratios by site
Site Number of infants
Number with ROP >Stage 3
Adjusted# Expected number with ROP >
Stage 3
Adjusted# Standardized
ratio
95% confidence interval for adjusted standardized ratio
1 34 6 6.4 0.9 0.3 2.0 2 61 8 13.2 0.6 0.3 1.2 3 43 2 7.8 0.3 0.0 0.9 4 36 8 4.5 1.8 0.8 3.5 5 122 18 20.2 0.9 0.5 1.4 6 9 4 0.9 4.5 1.2 11.6 7 5 2 1.5 1.3 0.1 4.7 8 30 2 4.0 0.5 0.1 1.8 9 6 0 0.3 0.0 . 12.2 10 68 7 9.2 0.8 0.3 1.6 11 46 5 9.5 0.5 0.2 1.2 12 16 1 2.6 0.4 0.0 2.2 13 57 2 11.1 0.2 0.0 0.7 14 22 2 10.1 0.2 0.0 0.7 15 44 7 6.5 1.1 0.4 2.2 16 110 7 18.4 0.4 0.2 0.8 17 13 3 2.8 1.1 0.2 3.1 18 34 7 10.1 0.7 0.3 1.4 19 18 0 4.0 0.0 . 0.9 20 72 4 14.9 0.3 0.1 0.7 21 11 1 2.4 0.4 0.0 2.3 22 8 1 1.3 0.8 0.0 4.4 23 22 1 2.5 0.4 0.0 2.2 24 17 5 2.9 1.7 0.6 4.0 25 24 5 2.7 1.8 0.6 4.3 26 3 0 0.8 0.0 . 4.9 27 4 2 0.9 2.2 0.2 7.8 28 26 1 2.6 0.4 0.0 2.1 29 20 0 2.9 0.0 . 1.3 30 53 18 18.0 1.0 0.6 1.6
Please note that site codes for Presentations 45a, 45b, 45c and 45d are different from other presentations in this report. Neonates with major congenital anomalies are excluded. # # The prediction model was adjusted for GA, SGA, Sex, SNAPII > 20.
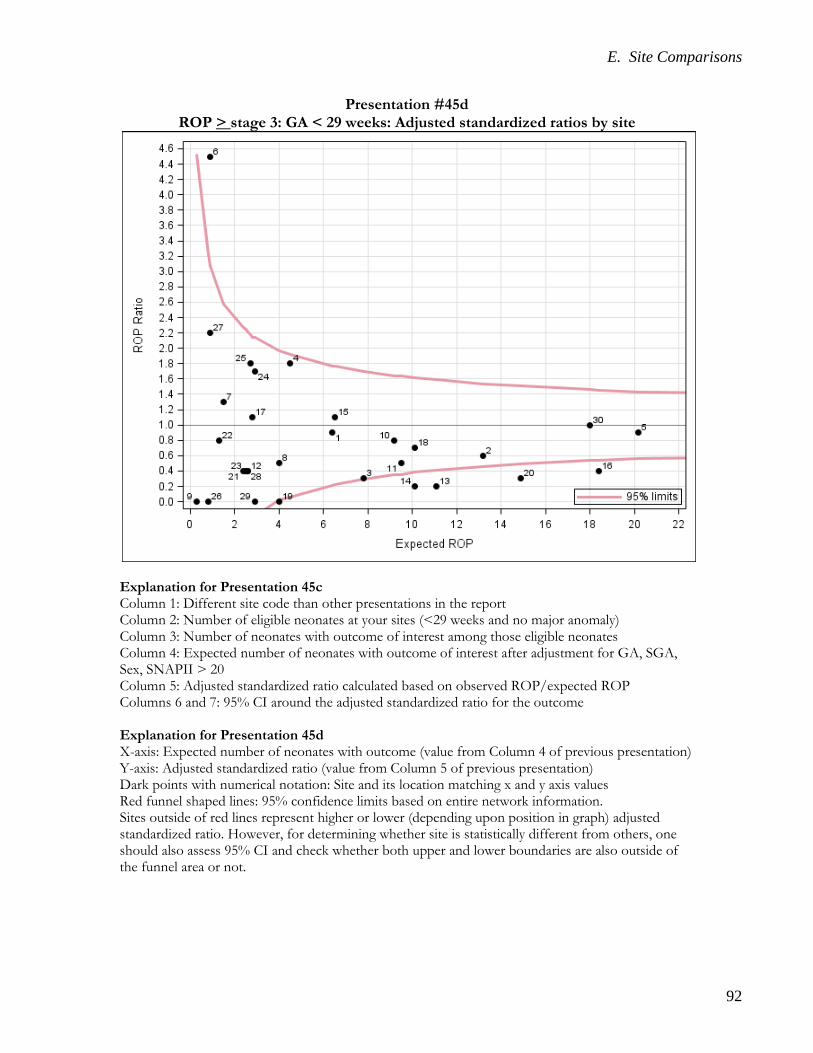
E. Site Comparisons
92
Presentation #45d ROP > stage 3: GA < 29 weeks: Adjusted standardized ratios by site
Explanation for Presentation 45c Column 1: Different site code than other presentations in the report Column 2: Number of eligible neonates at your sites (<29 weeks and no major anomaly) Column 3: Number of neonates with outcome of interest among those eligible neonates Column 4: Expected number of neonates with outcome of interest after adjustment for GA, SGA, Sex, SNAPII > 20 Column 5: Adjusted standardized ratio calculated based on observed ROP/expected ROP Columns 6 and 7: 95% CI around the adjusted standardized ratio for the outcome Explanation for Presentation 45d X-axis: Expected number of neonates with outcome (value from Column 4 of previous presentation) Y-axis: Adjusted standardized ratio (value from Column 5 of previous presentation) Dark points with numerical notation: Site and its location matching x and y axis values Red funnel shaped lines: 95% confidence limits based on entire network information. Sites outside of red lines represent higher or lower (depending upon position in graph) adjusted standardized ratio. However, for determining whether site is statistically different from others, one should also assess 95% CI and check whether both upper and lower boundaries are also outside of the funnel area or not.

E. Site Comparisons
93
Presentation #46a Mortality or major morbidity: GA < 33 weeks: Adjusted standardized ratios by site
Site Number of infants
Number with mortality or major
morbidities
Adjusted# Expected number of mortality or major morbidities
Adjusted# Standardized
ratio
95% confidence interval for adjusted
standardized ratio 1 113 33 30.9 1.1 0.7 1.5 2 215 89 67.4 1.3 1.1 1.6 3 127 50 42.0 1.2 0.9 1.6 4 124 45 30.8 1.5 1.1 2.0 5 356 108 125.5 0.9 0.7 1.0 6 20 9 6.0 1.5 0.7 2.9 7 19 5 7.4 0.7 0.2 1.6 8 114 24 30.0 0.8 0.5 1.2 9 15 3 3.8 0.8 0.2 2.3 10 230 58 62.9 0.9 0.7 1.2 11 164 67 50.6 1.3 1.0 1.7 12 85 25 20.8 1.2 0.8 1.8 13 152 51 49.7 1.0 0.8 1.3 14 213 52 62.6 0.8 0.6 1.1 15 140 52 37.7 1.4 1.0 1.8 16 334 85 111.0 0.8 0.6 0.9 17 57 19 17.1 1.1 0.7 1.7 18* 78 52 48.2 1.1 0.8 1.4 19 81 24 23.8 1.0 0.6 1.5 20 299 75 93.6 0.8 0.6 1.0 21 54 10 12.0 0.8 0.4 1.5 22 56 16 11.0 1.5 0.8 2.4 23 64 20 19.6 1.0 0.6 1.6 24 102 17 23.5 0.7 0.4 1.2 25 109 16 20.9 0.8 0.4 1.2 26 16 6 3.2 1.9 0.7 4.1 27 52 7 9.2 0.8 0.3 1.6 28 99 16 22.0 0.7 0.4 1.2 29 79 16 16.3 1.0 0.6 1.6 30 336 109 99.3 1.1 0.9 1.3
Major morbidity = IVH 3 or 4 or PVL or BPD or ROP >stage 2 or NEC or Nosocomial sepsis Please note that site codes for Presentations 46a, 46b, 46c and 46d are different from other presentations in this report. Neonates with major congenital anomalies are excluded. # # The prediction model was adjusted for GA, SGA, Sex, SNAPII > 20. * Site 18 has different criteria for entering neonates in the CNN dataset, and may not be comparable with other sites. (See next page for full explanation)

E. Site Comparisons
94
Presentation #46b Mortality or major morbidity: GA < 33 weeks: Adjusted standardized ratios by site
Explanation for Presentation 46a Column 1: Different site code than other presentations in the report Column 2: Number of eligible neonates at your sites (<33 weeks and no major anomaly) Column 3: Number of neonates with outcome of interest among those eligible neonates Column 4: Expected number of neonates with outcome of interest after adjustment for GA, SGA, Sex, SNAPII > 20 Column 5: Adjusted standardized ratio calculated based on observed death or morbidities/expected deaths or morbidities Columns 6 and 7: 95% CI around the adjusted standardized ratio for the outcome Explanation for Presentation 46b X-axis: Expected number of neonates with outcome (value from Column 4 of previous presentation) Y-axis: Adjusted standardized ratio (value from Column 5 of previous presentation) Dark points with numerical notation: Site and its location matching x and y axis values Red funnel shaped lines: 95% confidence limits based on entire network information. Sites outside of red lines represent higher or lower (depending upon position in graph) adjusted standardized ratio. However, for determining whether site is statistically different from others, one should also assess 95% CI and check whether both upper and lower boundaries are also outside of the funnel area or not.

E. Site Comparisons
95
Presentation #46c Mortality or major morbidity: GA < 29 weeks: Adjusted standardized ratios by site
Site Number of infants
Number with mortality or major
morbidities
Adjusted# Expected number of mortality or major morbidities
Adjusted# Standardized
ratio
95% confidence interval for adjusted
standardized ratio 1 41 24 24.6 1.0 0.6 1.4 2 85 66 51.3 1.3 1.0 1.6 3 54 38 33.9 1.1 0.8 1.5 4 41 26 21.0 1.2 0.8 1.8 5 153 88 91.8 1.0 0.8 1.2 6 10 8 5.1 1.6 0.7 3.1 7 9 4 6.2 0.6 0.2 1.7 8 38 18 20.7 0.9 0.5 1.4 9 6 2 2.8 0.7 0.1 2.6 10 82 44 45.9 1.0 0.7 1.3 11 63 49 38.8 1.3 0.9 1.7 12 27 13 13.3 1.0 0.5 1.7 13 69 39 41.3 0.9 0.7 1.3 14 76 41 47.0 0.9 0.6 1.2 15 51 36 29.6 1.2 0.9 1.7 16 159 71 90.0 0.8 0.6 1.0 17 21 16 13.8 1.2 0.7 1.9 18 78 52 48.1 1.1 0.8 1.4 19 28 20 18.3 1.1 0.7 1.7 20 120 57 70.5 0.8 0.6 1.0 21 13 8 8.3 1.0 0.4 1.9 22 10 6 6.0 1.0 0.4 2.2 23 25 18 15.6 1.2 0.7 1.8 24 26 12 15.0 0.8 0.4 1.4 25 25 11 13.2 0.8 0.4 1.5 26 4 4 2.2 1.8 0.5 4.6 27 11 5 5.5 0.9 0.3 2.1 28 30 14 15.2 0.9 0.5 1.5 29 21 12 11.7 1.0 0.5 1.8 30 130 82 77.5 1.1 0.8 1.3
Major morbidity = IVH 3 or 4 or PVL or BPD or ROP >stage 2 or NEC or Nosocomial sepsis Please note that site codes for Presentations 46a, 46b, 46c & 46b are different from other presentations in this report. Neonates with major congenital anomalies are excluded. # # The prediction model was adjusted for GA, SGA, Sex, SNAPII > 20.

E. Site Comparisons
96
Presentation #46d Mortality or major morbidity: GA < 29 weeks: Adjusted standardized ratios by site
Explanation for Presentation 46c Column 1: Different site code than other presentations in the report Column 2: Number of eligible neonates at your sites (<29 weeks and no major anomaly) Column 3: Number of neonates with outcome of interest among those eligible neonates Column 4: Expected number of neonates with outcome of interest after adjustment for GA, SGA, Sex, SNAPII > 20 Column 5: Adjusted standardized ratio calculated based on observed death or morbidities/expected deaths or morbidities Columns 6 and 7: 95% CI around the adjusted standardized ratio for the outcome Explanation for Presentation 46d X-axis: Expected number of neonates with outcome (value from Column 4 of previous presentation) Y-axis: Adjusted standardized ratio (value from Column 5 of previous presentation) Dark points with numerical notation: Site and its location matching x and y axis values Red funnel shaped lines: 95% confidence limits based on entire network information. Sites outside of red lines represent higher or lower (depending upon position in graph) adjusted standardized ratio. However, for determining whether site is statistically different from others, one should also assess 95% CI and check whether both upper and lower boundaries are also outside of the funnel area or not.

E. Site Comparisons
97
This page is left blank intentionally

E. Site Comparisons
98
Presentation #47a Benchmarking
Benchmarking among all neonates for sites which contributed all eligible admissions with GA<33 weeks
Among all neonates
Grouping according to number of neonates < 200 neonates 200 – 500 neonates Parameter ↓ / Site rank → Top Bottom Top Bottom Mortality (adjusted standardized ratio)* 19 7 22 11 26 27 9 8 23 29 1 13 21 17 6
Early onset sepsis rate (%) 26 22 27 7 11 19 6 9 21 17 13 23 8 29 1
Late onset sepsis rate (SNAP-II-PE adjusted) (%) 27 7 26 11 19 22 9 6 21 8 23 17 29 1 13
Late onset sepsis /1000 patient days 27 26 7 19 11 22 9 6 17 21 23 29 1 8 13 Death or at least one of major morbidities (adjusted standardized ratio)* 27 19 7 22 11 26 8 9 21 23 29 17 13 1 6
Benchmarking among neonates with BW < 1500 g for sites which contributed all eligible admissions with GA<33 weeks
Among neonates < 1500g
Grouping according to number of neonates < 40 neonates 40 – 70 neonates Parameter ↓ / Site rank → Top Bottom Top Bottom Non-receipt of antenatal steroid (%) 26 22 6 9 21 27 7 12 24 17 25 28 29 23 19
Surgical ligation of PDA (%) 26 6 9 7 22 21 27 24 17 29 23 19 28 25 12
Stage 2 or 3 NEC (adjusted standardized ratio)* 26 9 21 7 6 22 27 17 28 24 19 25 23 29 12
Stage 3-5 ROP (adjusted standardized ratio)* 26 21 22 7 27 9 6 19 29 28 12 23 17 24 25 Oxygen use at 36 wks (adjusted standardized ratio)* 22 7 27 9 26 21 6 17 28 25 24 19 29 12 23
Grade 3 or 4 IVH (adjusted standardized ratio)* 7 21 27 9 26 6 22 23 24 12 19 17 29 25 28
Use of systemic steroids (%) 9 26 6 22 7 27 21 17 24 23 19 29 12 28 25
Mortality (adjusted standardized ratio)* 9 7 21 26 22 6 27 24 25 29 12 19 23 28 17 Death or at least one of major morbidities (adjusted standardized ratio) 7 21 27 9 22 6 26 25 24 28 19 23 17 12 29
*Standardized ratio calculated based on observed events/expected events adjusted for GA, SGA, Sex, SNAPII > 20

E. Site Comparisons
99
Presentation #47a (continued) Benchmarking
Benchmarking among all neonates for sites which contributed all eligible admissions with GA<33 weeks
Among all neonates
501 – 700 neonates > 700 neonates Grouping according to number of neonates
Top Bottom Top Bottom ← Site rank / ↓ Parameter 24 4 25 16 14 30 12 20 28 5 10 15 3 2 Mortality (adjusted standardized ratio)* 4 12 24 25 16 14 30 2 28 3 20 15 10 5 Early onset sepsis rate (%) 4 24 25 12 16 30 14 28 20 15 10 5 3 2 Late onset sepsis rate (SNAP-II-PE adjusted) (%)
24 25 4 16 30 14 12 28 15 20 5 10 2 3 Late onset sepsis /1000 patient days
25 24 16 14 4 30 12 28 20 5 10 15 2 3 Death or at least one of major morbidities (adjusted standardized ratio)*
Benchmarking among neonates with BW < 1500g for sites which contributed all eligible admissions with GA<33 weeks
Among neonates < 1500g
71 – 120 neonates > 120 neonates Grouping according to number of neonates
Top Bottom Top Bottom ← Site rank / ↓ Parameter 1 3 15 8 4 11 13 2 16 5 14 20 10 30 Non-receipt of antenatal steroid (%) 3 8 13 15 1 11 4 2 10 30 16 5 20 14 Surgical ligation of PDA (%) 4 8 1 3 15 11 13 14 20 16 5 10 30 2 Stage 2 or 3 NEC (adjusted standardized ratio)*
13 3 8 11 15 1 4 14 20 16 2 10 5 30 Stage 3-5 ROP (adjusted standardized ratio)*
1 13 8 3 11 15 4 16 14 10 5 30 20 2 Oxygen use at 36 wks (adjusted standardized ratio)*
8 13 15 1 11 4 3 20 5 14 16 10 2 30 VE or PEC (adjusted standardized ratio)* 8 11 4 1 15 13 3 5 10 20 16 2 30 14 Use of systemic steroids (%) 4 8 1 15 13 11 3 20 14 30 16 10 5 2 Mortality (adjusted standardized ratio)*
8 13 1 3 15 11 4 16 20 14 5 10 30 2 Death or at least one of major morbidities (adjusted standardized ratio)
*Standardized ratio calculated based on observed events/expected events adjusted for GA, SGA, Sex, SNAPII > 20

E. Site Comparisons
100
Presentation #47b Benchmarking
Benchmarking for sites which contributed all eligible admissions with GA<33 weeks
Among neonates <33 weeks
Grouping according to number of neonates < 60 neonates 60 – 110 neonates Parameter ↓ / Site rank → Top Bottom Top Bottom Non-receipt of antenatal steroid (%) 26 22 6 17 9 21 7 27 12 24 23 28 29 19
Surgical ligation of PDA (%) 26 6 17 9 22 21 27 7 24 23 29 19 28 12
Late onset sepsis (adjusted standardized ratio)* 7 9 21 17 27 6 26 22 28 23 29 24 19 12
Stage 2 or 3 NEC (adjusted standardized ratio)* 9 21 17 26 7 6 22 27 28 19 24 29 23 12
Stage 3-5 ROP (adjusted standardized ratio)* 26 21 22 7 17 27 9 6 19 29 28 12 23 24 Oxygen use at 36 wks (adjusted standardized ratio)* 22 17 7 27 9 21 26 6 28 24 19 29 12 23
VE or PEC (adjusted standardized ratio)* 7 27 9 17 21 26 22 6 12 23 24 19 29 28 Use of systemic steroids (%) 26 9 17 22 6 27 21 7 24 29 23 19 28 12
Mortality (adjusted standardized ratio)* 7 9 21 26 22 17 6 27 24 29 19 23 28 12 Death or at least one of major morbidities (adjusted standardized ratio) 7 27 9 21 17 22 6 26 24 28 29 19 23 12
Benchmarking for sites which contributed all eligible admissions with GA<29 weeks
Among neonates <29 weeks Grouping according to number of neonates < 20 neonates 20 – 40 neonates
Parameter ↓ / Site rank → Top Bottom Top Bottom Non-receipt of antenatal steroid (%) 26 22 9 21 6 7 27 12 17 24 25 29 19 28 23
Surgical ligation of PDA (%) 26 9 6 21 22 27 7 17 24 29 23 19 28 12 25 Stage 2 or 3 NEC (adjusted standardized ratio)* 26 9 21 7 6 22 27 17 28 24 25 19 12 23 29
Stage 3-5 ROP (adjusted standardized ratio)* 26 9 21 22 7 27 6 19 29 28 12 23 17 24 25 Oxygen use at 36 wks (adjusted standardized ratio)* 22 7 27 26 9 21 6 17 28 25 24 19 29 12 23
VE or PEC (adjusted standardized ratio)* 7 21 9 27 6 26 22 12 29 23 24 19 17 25 28
Use of systemic steroids (%) 9 26 7 6 22 21 27 17 23 24 29 19 12 28 25
Mortality (adjusted standardized ratio)* 9 7 21 26 22 6 27 24 25 12 29 19 23 28 17 Death or at least one of major morbidities (adjusted standardized ratio) 7 9 27 21 22 6 26 24 25 28 12 29 19 23 17
*Standardized ratio calculated based on observed events/expected events adjusted for GA, SGA, Sex, SNAPII > 20

E. Site Comparisons
101
Presentation #47b (continued) Benchmarking
Benchmarking for sites which contributed all eligible admissions with GA<33 weeks
Among neonates <33 weeks 111 – 200 neonates > 200 neonates Grouping according to number of neonates
Top Bottom Top Bottom ← Site rank / ↓ Parameter 1 25 3 11 8 15 13 4 16 2 5 14 10 20 30 Non-receipt of antenatal steroid (%) 3 8 13 1 15 11 25 4 10 2 30 16 5 20 14 Surgical ligation of PDA (%) 8 15 4 1 11 13 25 3 20 16 5 10 30 14 2 Late onset sepsis (adjusted standardized ratio)* 4 8 3 15 1 13 11 25 14 20 16 5 10 2 30 Stage 2 or 3 NEC (adjusted standardized ratio)*
13 3 8 11 15 1 25 4 14 20 16 2 10 5 30 Stage 3-5 ROP (adjusted standardized ratio)*
25 1 13 8 3 11 15 4 14 16 10 5 30 20 2 Oxygen use at 36 wks (adjusted standardized ratio)*
8 13 25 11 3 1 15 4 20 14 5 10 16 2 30 VE or PEC (adjusted standardized ratio)* 8 4 25 11 1 15 13 3 10 5 16 20 30 14 2 Use of systemic steroids (%)
25 4 8 1 13 11 3 15 20 14 16 30 10 5 2 Mortality (adjusted standardized ratio)*
25 8 13 1 3 11 15 4 16 20 14 5 10 30 2 Death or at least one of major morbidities (adjusted standardized ratio)
Benchmarking for sites which contributed all eligible admissions with GA<29 weeks
Among neonates <29 weeks 41 – 70 neonates > 70 neonates Grouping according to number of neonates
Top Bottom Top Bottom ← Site rank / ↓ Parameter 1 3 11 15 8 13 4 2 16 14 20 18 5 10 30 Non-receipt of antenatal steroid (%) 3 8 13 15 1 11 4 10 2 18 5 30 16 20 14 Surgical ligation of PDA (%) 4 8 1 3 15 13 11 18 14 20 16 5 30 10 2 Stage 2 or 3 NEC (adjusted standardized ratio)*
13 3 8 11 1 15 4 14 20 16 2 18 10 5 30 Stage 3-5 ROP (adjusted standardized ratio)*
1 13 3 8 15 11 4 16 14 10 18 30 5 20 2 Oxygen use at 36 wks (adjusted standardized ratio)*
13 8 4 15 3 1 11 20 14 5 10 16 2 18 30 VE or PEC (adjusted standardized ratio)* 8 11 4 15 1 13 3 5 10 16 18 20 30 14 2 Use of systemic steroids (%) 4 8 1 15 11 13 3 20 14 30 16 5 10 18 2 Mortality (adjusted standardized ratio)*
8 13 1 3 15 4 11 16 20 14 5 10 30 18 2 Death or at least one of major morbidities (adjusted standardized ratio)
*Standardized ratio calculated based on observed events/expected events adjusted for GA, SGA, Sex, SNAPII > 20

E. Site Comparisons
102
Presentation 48 (a to d) Benchmarking sites by adjusted standardized ratios (SR)
for mortality and different morbidities Explanations for the charts in presentation 48 (a to d)
1. These charts are called Petal charts which portray the picture of all units in the group in one presentation.
2. There are four charts based on the size of the unit and they are divided according to the number of neonates <33 weeks gestation during the year.
3. The scale is in standardized ratios starting from 0 at center. 4. Units are separated by broken lines. 5. Numeric site code is shown in each segment – please refer to the appropriate code
sent to your CNN site investigator. 6. Mortality and five morbidities are reported for each unit. 7. SR of 1 is highlighted with darker circle which should be used as a reference point
for each morbidity. Anything less than 1 indicates that the adjusted SR is lower than average (observed lower than expected) and more than 1 means the adjusted SR is higher than average (observed higher than expected) for that particular morbidity.
8. SRs for each outcome are reported below the charts in a table. 9. The unit which has higher area of petal colored indicates that the SR in that
particular unit is higher.

E. Site Comparisons
103
Presentation #48a Mortality and morbidities: Sites with < 60 neonates: Petal chart from adjusted SR
Adjusted standardized ratios for mortality and morbidities
Site Adjusted standardized ratio Death NI IVH ROP BPD NEC
6 2.4 0.9 2.5 4.4 1.7 1.4 7 0.0 0.8 0.0 1.2 0.4 1.1 9 0.0 0.8 0.8 3.0 0.5 0.0 17 2.3 0.9 0.9 1.4 0.2 0.0 21 0.9 0.8 0.9 0.4 0.6 0.0 22 1.7 3.3 2.2 0.7 0.2 1.6 26 1.2 3.0 2.1 0.0 1.0 0.0 27 2.6 0.9 0.7 1.9 0.4 1.8
0.0
0.5
1.0
1.5
2.0Death
NI IVHROP
BPDNEC
Death
NI
IVH
ROP
BPD
NEC
Death
NI
IVH
ROP
BPD
NEC
DeathNI
IVHROP
BPDNECDeath
NIIVHROP
BPDNEC
Death
NI
IVH
ROP
BPD
NEC
Death
NI
IVH
ROP
BPD
NEC
DeathNI
IVHROP
BPD NEC
Petal chart for sites with < 60 neonates (GA < 33)
6
7
9
17
21
22
26
27
6
7
9
17 21
22
27

E. Site Comparisons
104
Presentation #48b Mortality and morbidities: Sites with 60-109 neonates: Petal chart from adjusted SR
Adjusted standardized ratios for mortality and morbidities
Site Adjusted standardized ratio Death NI IVH ROP BPD NEC
12 1.3 1.9 0.5 0.3 1.2 2.9 19 0.9 1.3 0.7 0.0 0.8 0.7 23 0.9 0.9 0.5 0.4 1.3 1.0 24 0.0 1.2 0.5 1.6 0.5 0.8 28 1.0 0.9 1.0 0.3 0.3 0.4 29 0.7 1.0 0.8 0.0 1.0 0.9
0.0
0.5
1.0
1.5
2.0Death
NIIVH
ROPBPD
NEC
Death
NI
IVH
ROP
BPD
NEC
Death
NI
IVHROP
BPDNEC
DeathNI
IVHROP
BPD
NEC
Death
NI
IVH
ROP
BPD
NEC
Death
NI
IVHROP
BPDNEC
Petal chart for sites with 60 - 109 neonates (GA < 33)
12
19
23
24
28
29
12
19
23
24
28
29

E. Site Comparisons
105
Presentation #48c Mortality and morbidities: Sites with 110-200 neonates: Petal chart from adjusted SR
Adjusted standardized ratios for mortality and morbidities
Site Adjusted standardized ratio Death NI IVH ROP BPD NEC
1 0.8 1.0 1.1 1.1 0.4 0.8 3 1.3 2.3 1.0 0.2 0.8 0.6 4 0.5 0.9 1.3 1.7 2.0 0.3 8 0.8 0.7 0.5 0.5 0.6 0.3 11 1.3 1.2 1.0 0.5 1.4 1.0 13 1.3 1.3 0.6 0.2 0.5 0.9 15 1.3 0.7 1.2 1.0 1.4 0.7 25 0.3 1.3 1.0 1.6 0.4 1.6
0.0
0.5
1.0
1.5Death
NI IVHROP
BPDNEC
Death
NI
IVH
ROP
BPD
NEC
Death
NI
IVH
ROP
BPD
NEC
DeathNI
IVHROP
BPDNECDeath
NIIVHROP
BPDNEC
Death
NI
IVH
ROP
BPD
NEC
Death
NI
IVH
ROP
BPD
NEC
DeathNI
IVHROP
BPD NEC
Petal chart for sites with 110 - 200 neonates (GA < 33)
1
3
4
8
11
13
15
25
1
3
4
8 11
13
15
25

E. Site Comparisons
106
Presentation #48d Mortality and morbidities: Sites with >200 neonates: Petal chart from adjusted SR
Adjusted standardized ratios for mortality and morbidities
Site Adjusted standardized ratio Death NI IVH ROP BPD NEC
2 1.8 1.5 1.0 0.6 1.1 1.6 5 0.9 0.8 0.7 0.8 0.8 1.1 10 0.9 0.8 0.8 0.8 0.7 1.5 14 0.6 1.2 0.7 0.2 0.5 0.6 16 0.8 0.6 0.8 0.4 0.6 0.9 20 0.4 0.5 0.4 0.3 0.9 0.8 30 0.9 0.8 1.6 1.0 0.8 1.6
0.0
0.5
1.0
1.5Death
NI IVHROP
BPDNEC
Death
NI
IVH
ROP
BPD
NEC
Death
NI
IVH
ROP
BPDNEC
DeathNIIVH
ROPBPDNEC
DeathNI
IVH
ROP
BPD
NEC
Death
NI
IVH
ROP
BPD
NEC
Death
NIIVH
ROPBPD NEC
Petal chart for sites with > 200 neonates (GA < 33)
2
5
10
14
16
20
30
2
5
10
14
16
20
30

F. Discharge Disposition and Status
107
F. Discharge Disposition and Status

F. Discharge Disposition and Status
108
Presentation #49
Discharge destination: All GA: Crude rates
GA (completed weeks) < 25 25-26 27-28 29-30 31-32 33-34 35-36 >37 Total
Home N 109 222 300 373 604 1045 1332 3383 7368 % 37.7 41.4 40.4 37.2 41.5 51.4 54.2 53.8 49.8
Community hospital N 43 166 339 560 755 743 449 529 3584 % 14.9 31.0 45.7 55.8 51.9 36.5 18.3 8.4 24.2
Tertiary hospital N 12 19 15 5 7 25 35 193 311 % 4.2 3.5 2.0 0.5 0.5 1.2 1.4 3.1 2.1
Died N 95 80 30 16 22 24 30 78 375 % 32.9 14.9 4.0 1.6 1.5 1.2 1.2 1.2 2.5
Palliative care (home/other institute)
N 0 0 0 0 1 1 1 10 13 % 0.0 0.0 0.0 0.0 0.1 0.1 0.0 0.2 0.1
Another inpatient area in site
N 28 46 56 49 66 195 608 2090 3138 % 9.7 8.6 7.6 4.9 4.5 9.6 24.8 33.3 21.2
Out of country discharge N 2 3 2 1 0 2 1 1 12 % 0.7 0.6 0.3 0.1 0.0 0.1 0.0 0.0 0.1
Total included N 289 536 742 1004 1455 2035 2456 6284 14801 % 100.0 100.0 100.0 100.0 100.0 100.0 100.0 100.0 100.0
Discharge destination missing
N
6
GA missing N 0 Total N 14807

F. Discharge Disposition and Status
109
Presentation #50
Support at discharge: Infants who were discharged home: Crude rates
GA (completed weeks) < 25 25-26 27-28 29-30 31-32 33-34 35-36 >37 Total
Total available N 290 537 742 1006 1455 2035 2457 6285 14807 Number of infants who survived and were discharged home
N 109 222 300 373 604 1045 1332 3383 7368
Oxygen N 33 39 16 5 4 4 1 14 116 % 30.3 17.6 5.3 1.3 0.7 0.4 0.1 0.4 1.6
Monitor N 9 16 12 1 1 5 12 33 89 % 8.3 7.2 4.0 0.3 0.2 0.5 0.9 1.0 1.2
Enterostomy N 2 2 0 1 2 2 7 12 28 % 1.8 0.9 0.0 0.3 0.3 0.2 0.5 0.4 0.4
Gavage N 6 7 14 8 9 7 8 52 111 % 5.5 3.2 4.7 2.1 1.5 0.7 0.6 1.5 1.5
Tracheostomy N 0 1 1 0 0 1 2 2 7 % 0.0 0.5 0.3 0.0 0.0 0.1 0.2 0.1 0.1
Gastrostomy N 2 0 3 1 2 2 5 17 32 % 1.8 0.0 1.0 0.3 0.3 0.2 0.4 0.5 0.4
Ventilation N 1 1 0 0 0 0 0 0 2 % 0.9 0.5 0.0 0.0 0.0 0.0 0.0 0.0 0.0
CPAP N 0 0 3 0 0 0 1 2 6 % 0.0 0.0 1.0 0.0 0.0 0.0 0.1 0.1 0.1
Feeding status at discharge
Breast milk only N 33 62 106 117 210 405 437 1207 2577 % 30.3 27.9 35.3 31.4 34.8 38.8 32.8 35.7 35.0
Formula only N 35 82 87 110 169 246 339 698 1766 % 32.1 36.9 29.0 29.5 28.0 23.5 25.5 20.6 24.0
Both breast milk and formula
N 39 74 104 143 220 391 548 1459 2978 % 35.8 33.3 34.7 38.3 36.4 37.4 41.1 43.1 40.4
Note: All the percentages in this presentation are calculated out of the number of infants who survived and were discharged home. They may represent the more complex cases.

G. Hypoxic Ischemic Encephalopathy
110
G. Hypoxic Ischemic Encephalopathy

G. Hypoxic Ischemic Encephalopathy
111
Presentation #51
Hypoxic Ischemic Encephalopathy
A. Sarnat staging at the time of admission and receipt of hypothermia Sarnat’s staging of HIE on
admission
Stage 1
Stage 2
Stage 3
Unknown stage
Total
Hypothermia treatment
Yes 60 190 58 20 328 No 100 37 18 37 192 Unknown 0 0 0 2 2
Total 160 227 76 59 522
B. Reason for not receiving hypothermia treatment*
Reason Number Chromosomal anomalies 1 Major congenital anomalies 5 Weight < 2000g or GA < 35 weeks 28 Extreme condition 16 Head trauma or intracranial hemorrhage 6 Mild HIE 117 Unit policy 18 Health care team preference 5 Delayed transfer 30 Parental request 1 Unknown 7 *One neonate can have more than one reason.
C. Time of admission
Time Number <6 hours from birth 312 6 – 12 hours from birth 139 >12 hours from birth 65 Total** 516 **6 infants are missing either time of birth or time of admission.

G. Hypoxic Ischemic Encephalopathy
112
Presentation #51 (continued)
Hypoxic Ischemic Encephalopathy D. Characteristics of neonates who received hypothermia (N=328)
Characteristics N Results Method 328 Selective head 4 (1%)
Whole body cooling 324 (99%) Target temperature 328 < 330C 12 (4%)
33-340C 257 (78%) 33.5-34.50C 45 (14%) 34-350C 10 (3%) 34.5-35.50C 1 (0%) Unknown 3 (1%)
Seizures at initiation 328 103 (31%) Seizures at completion 328 46 (14%) GA < 33 weeks 328 5 (2%) Birthweight < 2000g 328 4 (1%) During hypothermia 305 Hypotension 134 (44%)
300 Thrombocytopenia 57 (19%) 307 Coagulopathy 89 (29%) 293 Persistent metabolic acidosis 49 (17%)
Death 328 31 (9%)
E. Encephalopathy stage in relation to hypothermia treatment Encephalopathy stage*
At the end of hypothermia Stage 1 Stage 2 Stage 3 Unknown Normal Total
At the start of hypothermia
Stage 1 26 5 0 4 23 58 Stage 2 47 68 10 23 59 207 Stage 3 2 12 28 4 3 50 Unknown 0 0 1 7 5 13
Total 75 85 39 39 90 328 *The numbers may be different from table A because this table represents staging at the start and end of hypothermia whereas table A presents staging at the time of first assessment

G. Hypoxic Ischemic Encephalopathy
113
Presentation #51 (continued) Hypoxic Ischemic Encephalopathy
For neonates* who received hypothermia (N=328)
Characteristics N Mean (h)
SD (h)
Min (h)
1st Q (h)
Median (h)
3rd Q (h)
Max (h)
Outside of recommendation
Time taken to achieve target
Timing** of hypothermia (in hours)
Initiation 323 4.0 4.5 0.0 1.3 3.0 5.3 42.4 After 6 hours 56 (17%)
Target temp achieved 317 6.9 11.2 0.8 3.3 5.2 7.1 175.0 After 10 hours
38 (12%)
After 4 hours of initiation 43 (14%)
Age at re-warming 325 70.2 19.3 2.7 73.5 76.0 77.7 116.9 After 78 hours
67 (21%)
Re-warming started >72 hours after
initiation 67 (21%)
Age at return of temp to normal
303 85.0 21.2 12.2 81.8 85.3 91.9 169.5 After 86 hours 138 (46%)
Took >8 hours to return temperature to
normal after starting re-warming
167 (55%)
Temperature during hypothermia
Lowest temp during hypothermia
328 32.7 0.8 27.4 32.5 32.9 33.1 36.3 Lowest temp < 32.5C 69 (21%)
Highest temp during hypothermia
328 34.2 0.7 31.6 33.8 33.9 34.4 36.8 Highest temp > 35.5C 21 (6%)
*Infants with time at initiation > 72 hours were excluded. **All timing calculated from time of birth in hours of age.

H. Trend Analyses
114
H. Trend Analyses over last 6 years This section includes trend analyses in the last 6 years (2010-15) for specific outcomes for neonates <33 weeks GA in network sites. The number of neonates included in these analyses is described in the following table for reference. This excludes delivery room deaths. Number of neonates by admission year and GA
GA Total
Year <23 23 24 25 26 27 28 29 30 31 32 <33 w
2010 9 73 172 270 333 388 371 480 611 678 788 4173
2011 15 86 166 242 318 332 391 467 553 643 828 4041
2012 28 85 184 285 294 348 416 510 610 738 872 4370
2013 16 76 197 247 267 357 434 479 620 733 836 4262
2014 8 81 226 250 332 362 412 517 585 743 871 4387
2015 14 99 177 248 289 317 425 470 536 662 793 4030
Number of neonates by admission year and birth weight
Birth weight Total
Year < 500 500 - 749 750 - 999 1000 - 1249 1250 – 1499 <1500g
2010 32 436 792 819 879 2958
2011 31 383 660 680 794 2548
2012 48 441 696 815 922 2922
2013 36 428 651 842 919 2876
2014 36 458 760 804 922 2980
2015 40 406 680 792 864 2782

H. Trend Analyses
115
1. Neonates in the participating sites: Admission status:
All infants Infants with GA<33 weeks
Year Number of Sites
Total Number of Neonates*
Inborn (%)
Outborn (%)
Number of Neonates*
with GA<33
Inborn (%)
Outborn (%)
2010 27 13 147 10 662 (81.1%)
2 485 (18.9%) 3 383 2 824
(83.5%) 559
(16.5%)
2011 30 13 548 10 972 (81.0%)
2 576 (19.0%) 4 040 3 460
(85.6%) 580
(14.4%)
2012 30 14 222 11 475 (80.7%)
2 747 (19.3%) 4 370 3 663
(83.8%) 707
(16.2%)
2013 29 14 489 11 487 (79.2%)
3 002 (20.7%) 4 262 3 624
(85.0%) 638
(15.0%)
2014 31 14 038 11 473 (76.3%)
3 565 (23.7%) 4 383 3658
(83.5%) 725
(16.5%)
2015 30 14 814 11 583 (78.2%)
3 231 (21.8%) 4 030 3 459
(85.8%) 571
(14.2%) *total number of neonates excluding those who are missing admission status
131415161718192021222324
2010 2011 2012 2013 2014 2015
Outb
orn
(%)
Year
All infants Infants < 33 weeks

H. Trend Analyses
116
2. Multiple births
2011 2012 2013 2014 2015 GA < 29 wk
Total 1550 1639 1594 1671 1569 Multiple 416 (27%) 437 (27%) 460 (29%) 441 (26%) 366 (23%) Twin 368 397 398 415 321 Higher-Order
48 40 62 26 45
GA < 33 wk
Total 4040 4369 4262 4387 4030 Multiple 1248 (31%) 1352 (31%) 1380 (32%) 1356 (31%) 1122 (28%) Twin 1099 1175 1193 1229 996 Higher-Order
149 177 187 127 126
BW < 1000g
Total 1145 1184 1115 1254 1126 Multiple 299 (26%) 305 (26%) 306 (27%) 329 (26%) 264 (23%) Twin 261 273 259 306 236 Higher-Order
38 32 47 23 28
BW < 1500g
Total 2747 2921 2876 2980 2782 Multiple 816 (30%) 851 (29%) 905 (31%) 900 (30%) 731 (26%) Twin 713 736 769 802 634 Higher-Order
103 115 136 98 97
22
23
24
25
26
27
28
29
30
31
32
33
2011 2012 2013 2014 2015
Mul
tiple
bir
th (%
)
Year
GA < 33 wk
BW < 1500g
GA < 29 wk
BW < 1000g

H. Trend Analyses
117
3. Proportion of neonates who received active care out of all (including DR deaths)
2012 2013 2014 2015 <23 weeks Number who received
active care (a-c) +e 25 23 14 22
Total including DR deaths a+d+e 79 63 58 68
Percentage 32% 37% 24% 32% 23 weeks Number who received
active care (a-c) +e 83 85 92 106
Total including DR deaths a+d+e 137 113 131 142
Percentage 61% 75% 70% 75% 24 weeks Number who received
active care (a-c) +e 185 200 233 178
Total including DR deaths a+d+e 202 207 245 190
Percentage 92% 97% 95% 94% Note: Refer to presentation #4 for detailed breakdown by GA in 2015. The alphabet notations used in the table above are carried from presentation #4.
0
10
20
30
40
50
60
70
80
90
100
2012 2013 2014 2015
Perc
enta
ge o
f neo
nate
s who
rece
ived
ac
tive
care
Year
24 weeks
23 weeks
< 23 weeks

H. Trend Analyses
118
4. Survival rate: a. 22-26 weeks:
b. 27-32 weeks:
0
10
20
30
40
50
60
70
80
90
100
2010 2011 2012 2013 2014 2015
Surv
ival
rate
Year
26 week
25 week
24 week
23 week
<23 week
90
91
92
93
94
95
96
97
98
99
100
2010 2011 2012 2013 2014 2015
Surv
ival
rate
Year
32 week
31 week
30 week
29 week
28 week
27 week

H. Trend Analyses
119
5. Late onset sepsis (with at least one infection) among neonates who survived beyond 2 days after birth a. 23-26 weeks:
b. 27-32 weeks:
182022242628303234363840424446
2010 2011 2012 2013 2014 2015
Late
ons
et se
psis
(%)
Year
<=23 week
24 week
25 week
26 week
0
5
10
15
20
25
2010 2011 2012 2013 2014 2015
Late
ons
et se
psis
(%)
Year
27 week
28 week
29 week
30 week
31 week
32 week

H. Trend Analyses
120
6. Surgical ligation of PDA a. 23-26 weeks:
b. 27-32 weeks:
0
5
10
15
20
25
30
2010 2011 2012 2013 2014 2015
Surg
ical
liga
tion
of P
DA (%
)
Year
<=23 week
24 week
25 week
26 week
0
1
2
3
4
5
6
7
8
2010 2011 2012 2013 2014 2015
Surg
ical
liga
tion
of P
DA (%
)
Year
27 week
28 week
29 week
30 week
31 week
32 week

H. Trend Analyses
121
7. Ventricular enlargement: (moderate and severe VE only; among neonates who received ultrasound exams) a. 23-26 weeks:
b. 27-32 weeks:
5
10
15
20
25
30
35
40
2010 2011 2012 2013 2014 2015
Vent
ricu
lar e
nlar
gem
ent (
%)
Year
<=23 week
24 week
25 week
26 week
0
1
2
3
4
5
6
7
8
9
2010 2011 2012 2013 2014 2015
Vent
ricu
lar e
nlar
gem
ent (
%)
27 week
28 week
29 week
30 week
31 week
32 week

H. Trend Analyses
122
8. Parenchymal echogenicity: (among neonates who received ultrasound exams) a. 23-26 weeks:
b. 27-32 weeks:
0
5
10
15
20
25
30
35
40
45
2010 2011 2012 2013 2014 2015
Pare
nchy
mal
ech
ogen
icity
(%)
<=23 week
24 week
25 week
26 week
0
2
4
6
8
10
12
14
2010 2011 2012 2013 2014 2015
Pare
nchy
mal
ech
ogen
icity
(%)
27 week
28 week
29 week
30 week
31 week
32 week

H. Trend Analyses
123
9. NEC:
a. 23-26 weeks:
b. 27-32 weeks:
6789
10111213141516171819
2010 2011 2012 2013 2014 2015
NEC
(%)
Year
<=23 week
24 week
25 week
26 week
0
1
2
3
4
5
6
7
8
9
10
2010 2011 2012 2013 2014 2015
NEC
(%)
Year
27 week
28 week
29 week
30 week
31 week
32 week

H. Trend Analyses
124
10. Stage 3, 4 and 5 ROP: (among neonates who received eye exams) a. 23-26 weeks:
b. 27-32 weeks:
0
10
20
30
40
50
60
70
2010 2011 2012 2013 2014 2015
ROP
stag
e 3
or h
ighe
r (%
)
Year
<=23 week
24 week
25 week
26 week
0
1
2
3
4
5
6
7
8
9
2010 2011 2012 2013 2014 2015
ROP
stag
e 3
or h
ighe
r (%
)
Year
27 week
28 week
29 week
30 week
31 week
32 week

125
11. Therapy for ROP (among neonates who received eye exams) a. 23-26 weeks:
b. 27-32 weeks:
0
5
10
15
20
25
30
35
40
45
50
55
60
65
2010 2011 2012 2013 2014 2015
Ther
apy
for R
OP
Year
<=23 week
24 week
25 week
26 week
0.0
0.5
1.0
1.5
2.0
2.5
3.0
3.5
2010 2011 2012 2013 2014 2015
Ther
apy
for R
OP
Year
27 week
28 week
29 week
30 week
31 week
32 week

H. Trend Analyses
126
12a. Oxygen use at 36 weeks or at discharge: a. 23-26 weeks:
b. 27-32 weeks:
35404550556065707580859095
100
2010 2011 2012 2013 2014 2015
Oxyg
en u
se (%
)
Year
<=23 week
24 week
25 week
26 week
0
5
10
15
20
25
30
35
40
45
2010 2011 2012 2013 2014 2015
Oxyg
en u
se (%
)
Year
27 week
28 week
29 week
30 week
31 week
32 week

H. Trend Analyses
127
12b. Any respiratory support at 36 weeks or at discharge: a. 23-26 weeks:
b. 27-32 weeks:
45
50
55
60
65
70
75
80
85
90
95
100
2010 2011 2012 2013 2014 2015
Any
resp
irat
ory
supp
ort (
%)
Year
<=23 week
24 week
25 week
26 week
0
5
10
15
20
25
30
35
40
45
50
2010 2011 2012 2013 2014 2015
Any
resp
irat
ory
supp
ort (
%)
Year
27 week
28 week
29 week
30 week
31 week
32 week

H. Trend Analyses
128
13. Postnatal systemic steroids use for BPD a. 23-26 weeks:
b. 27-32 weeks:
10
15
20
25
30
35
40
45
2010 2011 2012 2013 2014 2015
Post
nata
l sys
tem
ic st
eroi
ds u
se fo
r BP
D (%
)
Year
<=23 week
24 week
25 week
26 week
0
2
4
6
8
10
12
14
2010 2011 2012 2013 2014 2015
Post
nata
l sys
tem
ic st
eroi
ds u
se
forB
PD(%
)
Year
27 week
28 week
29 week
30 week
31 week
32 week

I. Conclusions
129
I. Conclusions
The Canadian Neonatal Network™ was established in 1995. 30 Canadian NICUs participated in data collection in 2015. The data demonstrate continuing variations in risk-adjusted outcomes and practices, and provide benchmarking information for Canadian hospitals. Individual hospitals have the opportunity to review their outcomes and launch strategies to make improvements to the care provided. CNN researchers continue to utilize the database and produce many publications that will have significant impact on neonatal care and policy in Canada and internationally. CNN will continue to produce NICU population-based data on outcomes and practices, and apply quality improvement strategies.

J. CNN Publications
130
J. 2015 CNN publications
Peer reviewed publications
1) Hei M, Shah PS, Lee SK, Jain A and the Canadian Neonatal Network. Outcomes for Symmetrical and Asymmetrical Small for Gestational Age Preterm Infants In Canadian Tertiary NICUs. American Journal of Perinatology. 2015 Jul; 32(8):725-32.
2) Weisz DE, Shivananda S, Asztalos E, Yee W, Synnes A, Lee SK, Lee SK, Shah PS and the Canadian Neonatal Network. Intrapartum Magnesium Sulfate and Need for Intensive Delivery Room Resuscitation. Arch Dis Child Fetal Neonatal Ed. 2015 Jan; 100(1):F59-65.
3) Chiarelli L, Mirea L, Yang J, Lee SK, Shah PS, and the Canadian Neonatal Network. Neonatal Outcomes in Very Preterm Singleton Infants Conceived Using Assisted Reproductive Technologies. Am J Perinatol. 2015 May: 32(6):515-22.
4) Shah J, Jefferies A, Yoon EW, Shah PS, Lee SK. Risk Factors and Outcomes of Late-Onset Bacterial Sepsis in Preterm Neonates Born at <32 Weeks’ Gestation. American Journal of Perinatology 2015 Jun; 32(7):675-82.
5) Kirtsman M, Yoon EW, Ojah C, Cieslak Z, Lee SK, Shah PS. Nil-Per-Os Days and Necrotizing Enterocolitis in Extremely Preterm Infants. Am J Perinatol. 2015 Jul; 32(8):785-94.
6) Shah PS, Mirea L, Ng E, Solimano A, Lee SK. Association of Unit Size, Resource Utilization, and Occupancy with Outcomes of Preterm Infants. Journal of Perinatology. 2015 Jul; 35(7):522-9.
7) Melamed N, Shah J, Soraisham A, Yoon E, Lee SK, Shah PS, Murphy K. Association Between Antenatal Corticosteroid Administration-to-Birth Interval and Outcomes of Preterm Neonates. Obstetrics & Gynecology. 2015 Jun; 125(6):1377-84.
8) Wong J, Shah PS, Yoon EW, Yee W, Lee S, Dow K. Inotrope Use among Extremely Preterm Infants in Canadian Neonatal Intensive Care Units: Variation and Outcomes. Am J Perinatol. 2015 Jan; 32(1):9-14.
9) Lodha A, Seshia M, McMillan DD, Barrington K, Lee SK, Shah PS and the Canadian Neonatal Network. Association of Early Caffeine Administration and Neonatal Outcomes in Very Preterm Neonates. JAMA Pediatrics. 2015 Jan; 169(1):33-8.
10) Keir A, Yang J, Harrison A, Pelausa E, Shah PS and the Canadian Neonatal Network. Temporal changes in blood product usage in preterm neonates born at <30 weeks’ gestation in Canada. Transfusion. 2015 Jun; 55(6):1340-6.
11) Keir A, Aziz K, McMillan D, Monterrosa L, Ojah C, Lee SK, Shah PS, Canadian Neonatal Network. Red Blood Cell Transfusions at 21 Days of Age or Older in Previously Transfusion-Naive Very Preterm Infants: Association with Neonatal Outcomes. Am J Perinatol. 2015 Oct; 32(12):1139-44.
12) Hossain S, Shah PS, Ye XY, Darlow BA, Lee SK, Lui K, Canadian Neonatal Network, Australian and New Zealand Neonatal Network. Outcome comparison of very preterm infants cared for in the neonatal intensive care units in Australia and New Zealand and in Canada. Journal of Paediatrics and Child Health. 2015 Sep;51(9):881-8.
13) Shah J, Singhal N, da Silva O, Rouvinez-Bouali N, Seshia M, Lee SK, Shah PS. Intestinal perforation in very preterm neonates: risk factors and outcomes. J Perinatol. 2015 Aug; 35(8):595-600.
14) Isayama T, Mirea L, Mori R, Kusuda S, Fujimura M, Lee SK, Shah PS, Neonatal Research Network of Japan and the Canadian Neonatal Network. Patent Ductus Arteriosus

J. CNN Publications
131
Management and Outcomes in Japan and Canada: Comparison of Proactive and Selective Approaches. Am J Perinatol. 2015 Sep; 32(11):1087-94.
15) Isayama T, Shah PS, Ye XY, Dunn M, Da Silva O, Alvaro R, Lee SK. Adverse Impact of Maternal Cigarette Smoking on Preterm Infants: A Population-Based Cohort Study. Am J Perinatol 2015 Oct; 32(12):1105-11.
16) Thomas KE, Shah PS, Canning R, Harrison A, Lee SK, Dow KE. Retinopathy of prematurity: Risk factors and variability between Canadian NICUs. Journal of Neonatal-Perinatal Medicine 2015; 8(3):207-14.
17) Rolnitsky A, Lee SK, Piedbouf, Harrison A, Shah PS, Canadian Neonatal Network. Prophylactic Interventions in Neonatology: How Do They Fare in Real Life? Am J Perinatol. 2015 Oct; 32(12):1098-104.
18) Rabi Y, Shah PS, Lodha A, Soraisham A, Barrington K, Lee SK. Outcomes of preterm infants following the introduction of room air resuscitation. Resuscitation 2015 Nov; 96:252-9.
19) Ahmed M, Mohamed A, Yoon E, Aziz K, Lee SK, Shah PS. Risk of Infection Using Peripherally Inserted Central and Umbilical Catheters in Preterm Neonates. Pediatrics 2015 Dec; 136(6):1073-9.
20) Lyu Y, Shah PS, Ye XY, Warre R, Piedboeuf B, Deshpandey A, Dunn M, Lee SK; Canadian Neonatal Network. Association Between Admission Temperature and Mortality and Major Morbidity in Preterm Infants Born at Fewer Than 33 Weeks’ Gestation. JAMA Pediatrics. 2015 Apr; 169(4):e150277.
Abstracts
1) Ahmed Shalabi M, Mohamed A, Yoon E, Aziz K, Lee SK, Shah PS, Aziz K. Peripherally inserted central catheter (PICC) versus umbilical venous catheter as primary access in very preterm neonates. E-PAS 2015:1575.554.
2) Borenstein-Levi L, Miller SP, Grunau RE, Synnes A, Shah PS, Yoon E. Narcotics and Sedatives in the NICU. E-PAS 2015:1569.510.
3) El-Naggar W, Afifi J, McMillan D, Toye J, Kajetanowicz A, Yoon E, Shah PS. Epidemiology of meningitis in Canadian Neonatal Intensive Care Units. E-PAS 2015:4148.374.
4) Esmaeilizand R, Shah V, Ye XY, Dow K. Utilization of Central Lines in Canadian Neonatal Intensive Care Units. E-PAS 2015.
5) Esmaeilizand, Shah PS, Seshia M, Yee W, Yoon EW, Dow K. Antibiotic Exposure and Development of Necrotizing Enterocolitis in Very Preterm Neonates in Canada. E-PAS 2015:3853.101.
6) Harabor A, Soraisham AS, Shivananda S, Shah PS, Alvaro R, Lee SK. Trends and variations in inhaled nitric oxide use in preterm infants in Canadian Neonatal Intensive Care Units: A retrospective cohort study. E-PAS 2015:1587.639.
7) Soraisham AS, Harabor A, Lodha A, Shah PS, Barrington K, Lee SK. Neonatal Outcomes Following Use Of Inhaled Nitric Oxide In Preterm Infants In Canada: A Cohort Study. E-PAS 2015.
8) Jiang S, Lyu Y, Ye XY, Monterrosa L, Shah PS, Lee SK. Intensity of delivery room resuscitation and neonatal outcomes for infants of 33-36 weeks gestation. E-PAS 2015:1593.691.

J. CNN Publications
132
9) Jiang S, Shah PS, Lee KS, Ye XY, Rouvinez-Bouali N, Cieslak Z, Lee SK. Regional variations in outcomes and practices for outborn infants born at <33 weeks gestational age in Canada. E-PAS 2015.
10) Shah J, Melamed N, Murphy K, Lee SK, Yoon EW, Soraisham A, Shah PS. Antenatal Corticosteroids and Outcomes of Preterm Neonates <34 weeks GA: Effect of timing of administration. E-PAS 2015:3840.6.
11) Lodha A, Rabi Y, Soraisham AS, Shah PS, Yang J, Singhal N. Delayed Cord Clamping (DCC) And Need Of Neonatal Resuscitation Among Preterm Infants Born ≤28 Weeks Of Gestational Age. E-PAS 2015:4570.4.
12) Lyu Y, Jiang S, DaSilva O, Shah PS, Lee SK. Association of Intensity of Delivery Room Resuscitation with Neonatal Outcomes in Infants Born at <33 Weeks’ Gestation. E-PAS 2015:1593.690.
13) Lyu Y, Xiang XY, Isayama T, Alvaro R, Nwaesei C, Shah PS, Lee SK. Systolic Blood Pressure at Admission and Neonatal Outcomes in Preterm Infants of ≤26 Weeks Gestational Age. E-PAS 2015:384107.
14) Olivier F, Bertelle V, Shah PS, Drolet C, Piedboeuf B. Impact of birth route on late onset sepsis (LOS) incidence in preterm neonates <33 weeks GA. E-PAS 2015:4148.371.
15) Purna J, Ojah C, Deshpandey A, Harrison A, Pelausa E, Shah PS. Seasonal Variation in Necrotizing Enterocolitis in preterm neonates <30 weeks gestation. E-PAS 2015:3851.92.
16) Woodward M, Williams C, Lodha A, Shah PS, Shivananda S. Mortality, morbidity and resource use among infants with Trisomy 21(TR21) admitted to Level III (L3) NICUs. E-PAS 2015:310.
17) Ting J, Roberts A, Synnes A, Canning R, Kalapesi Z, Sankaran K, Shah PS. Fungaemia in Infants admitted into Neonatal Intensive Care Units in Canada: 2003-2013. E-PAS 2015:4152.402.
18) Shah V, Mukerji A, Young J, Yee W, Seshia M, Dow K, Yoon EW. Utilization of surfactant in the era of non-invasive ventilation (NIV) in Canadian NICUs. E-PAS 2015:1599.736.
19) Elboraee MS, Kumaran K, Toye JM, Ye XY, Shah PS, Aziz K. Umbilical Lines Are an Independent Risk Factor for Adverse Outcomes in Very Preterm Babies. E-PAS 2015:1570.514.
20) Shah V, Seshia M, Dunn M, Schmolzer G. Golden Hour Management Practices for Infants <32 Wks Gestational Age in Canada. E-PAS 2015:1593.688.
21) Asztalos E, Church P, Faucher D, Riley P, Fajardo C, Shah PS. Neonatal Factors Associated With a Positive Neurodevelopmental Outcome in the Very Preterm Infant. E-PAS 2015:2185.2.
22) Isayama T, Mirea L, Reichman B, Sjors G, Modi N, Adams M, San Feliciano L, Kusuda S, Hakansson S, Lee SK, Shah PS. Variations in Patent Ductus Arteriosus Treatment of Very Preterm Neonates from 7 Countries: The International Network for Evaluating Outcomes (iNeo) Experience. E-PAS 2015:2888.316.
23) Darlow B, Lui K, Sjors G, Hakansson S, Modi N, Reichman B, Adams M, San Feliciano L, Santhakumaran S, Mirea L, Yang J, Lodha A, Shah PS. Variation in the Rate of Very Preterm Neonate Treated for Retinopathy of Prematurity (ROP) in 8 National Neonatal Databases: The International Network for Evaluation of Outcomes of (iNeo) Experience. E-PAS 2015:2926.590.
24) Lui K, Modi N, Sjors G, Reichman B, Darlow B, San Feliciano L, Mori R, Kusuda S, Adams M, Lee SK, Shah PS. Variability in Rates of Major Intraventricular Hemorrhage (IVH) and Its Impact on Mortality in Very Preterm Between 8 National Neonatal Databases: The

J. CNN Publications
133
International Network for Evaluation of Outcomes (iNeo) Experience. E-PAS 2015:2926.592.
25) Martin L, Mirea L, Modi N, Lui K, Adams M, Reichman B, Mori R, San Feliciano L, Sjors G, Hakansson S, Shah PS. Birth Weight for Gestational Age: Impact of Using Different Growth References on the Comparison of Neonatal Outcomes Between Countries Participating in the International Network for Evaluation of Outcomes (iNeo). E-PAS 2015:2926.593.
26) Shafey A, Bashir RA, Shah PS, Synne A, Kelly E. Neurodevelopmental Outcomes of Infants Born at the Limit of Viability. E-PAS 2015:2896.384.

K. Appendices
134
K. Appendices
Outcomes Definitions Mortality: Death prior to discharge from NICU. Intraventricular hemorrhage (IVH), ventricular enlargement or parenchymal echogenicity or periventricular leukomalacia (PVL): Defined as grade 3 IVH (intraventricular hemorrhage with ventricular enlargement) or grade 4 IVH (intraventricular hemorrhage and persistent parenchymal echogenicity) or persistent parenchymal echogenicity. Retinopathy of prematurity (ROP): Stage 3, 4 or 5 ROP or those requiring surgery as defined by the International Classification of Retinopathy of Prematurity3. ROP was scored as the highest stage in either eye identified during the admission. Necrotizing enterocolitis (NEC): Stage 2 or 3 NEC according to Bell’s classification4. Nosocomial infection (NI): Isolation of bacterial, fungal or viral organism from blood or cerebrospinal fluid in a symptomatic infant after 2 days of age. Bronchopulmonary dysplasia (BPD): Defined as the need for oxygen at 36 weeks post-menstrual age or at discharge to level 2 centers with the need for respiratory support or oxygen. Survival without major morbidities: Defined as survival at discharge from NICU without having any of BPD, NEC stage 2 or 3, IVH grade 3 or 4 or PVL, NI or ROP stage 3, 4 or 5 during the stay in NICU.
Variables Definitions
Definitions of CNN variables can be found in the CNN abstractors’ manual. The manual can be accessed on the CNN website (www.canadianneonatalnetwork.org/portal) via the following link: http://www.canadianneonatalnetwork.org/Portal/LinkClick.aspx?fileticket=krvGeUTtLck%3d&t
abid=69
Major Anomalies A list of major anomalies can be found in the 2013 annual report, pages 124-127.
It is available via the following link: http://www.canadianneonatalnetwork.org/Portal/LinkClick.aspx?fileticket=lreR0871sjA%3d&tabid=39
3 An International Committee for the Classification of Retinopathy of Prematurity. The International Classificaiton of Retinopathy of Prematurity Revisited. Arch Ophthalmol 2005;123:991-999 4 Bell MJ, Ternberg JL, Feigin RD, et al. Neonatal necrotizing enterocolitis. Therapeutic decisions based upon clinical staging. Ann Surg 1978;187:1–7

L. Appendix
135
Abbreviations
BW Birth Weight
BPD Bronchopulmonary dysplasia
CONS Coagulase-Negative Staphylococcus
CPAP Continuous Positive Airway Pressure
CLABSI Central Line-Associated Bloodstream Infection
CLD Chronic Lung Disease
CVL Central Venous Line
DR Delivery Room
EPIQ Evidence-based Practice for Improving Quality
ETT Endotracheal Tube
GA Gestational Age
GBS Group B Streptococcus
GM Germinal Matrix
HFV High Frequency Ventilation
HIE Hypoxic Ischemic Encephalopathy
ICROP International Classification of Retinopathy of Prematurity
IPPV Intermittent Positive Pressure Ventilation
IVH Intra-Ventricular Hemorrhage
NEC Necrotizing Enterocolitis
NI Non-Invasive
NICE Neonatal-Perinatal Interdisciplinary Capacity Enhancement
NICU Neonatal Intensive Care Units
NTISS Neonatal Therapeutic Intervention Scoring System
PDA Patent Ductus Arteriosus
PEC Parenchymal Echodensities
PICC Peripherally Inserted Central Catheters
PIV Peripheral Intravenous
PMA Postmenstrual Age
PPV Positive Pressure Ventilation
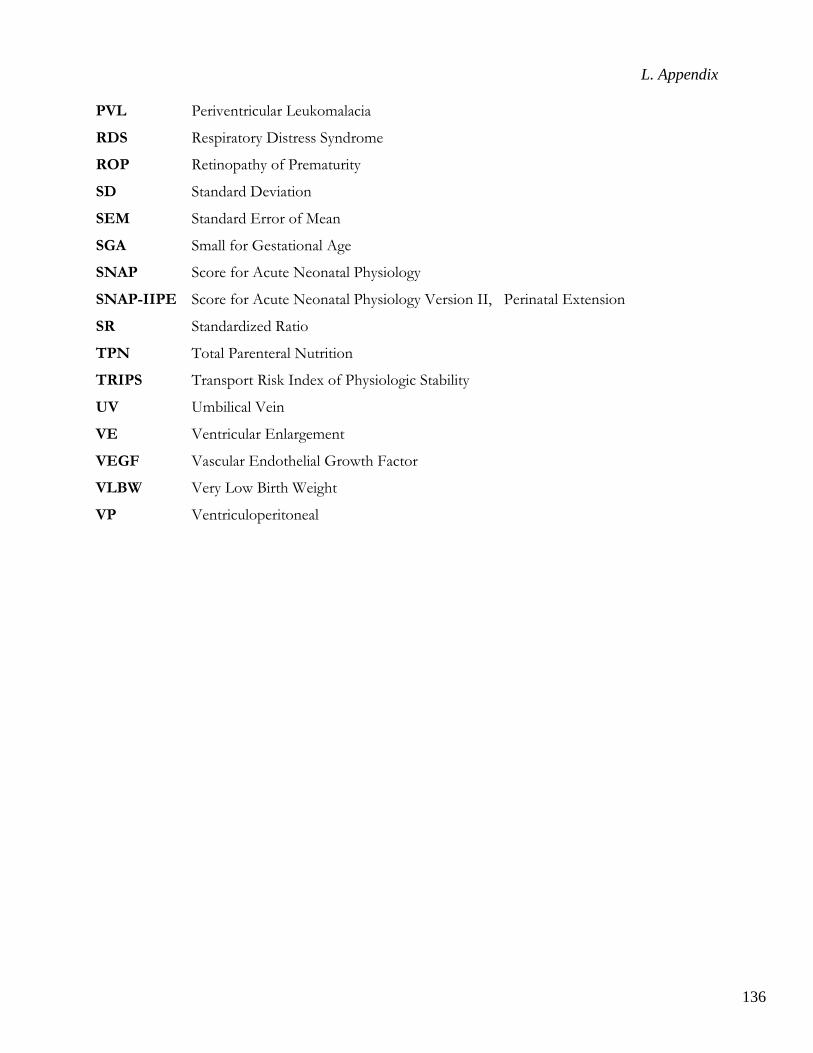
L. Appendix
136
PVL Periventricular Leukomalacia
RDS Respiratory Distress Syndrome
ROP Retinopathy of Prematurity
SD Standard Deviation
SEM Standard Error of Mean
SGA Small for Gestational Age
SNAP Score for Acute Neonatal Physiology
SNAP-IIPE Score for Acute Neonatal Physiology Version II, Perinatal Extension
SR Standardized Ratio
TPN Total Parenteral Nutrition
TRIPS Transport Risk Index of Physiologic Stability
UV Umbilical Vein
VE Ventricular Enlargement
VEGF Vascular Endothelial Growth Factor
VLBW Very Low Birth Weight
VP Ventriculoperitoneal

137
© Canadian Neonatal Network™ 2016
All rights reserved. No part of this publication may be reused, republished, stored in a retrieval system or transmitted in any form or by any means-electronic, mechanical, photocopying,
recordings or otherwise-without prior consent of the publisher.
Canadian Neonatal Network™, Maternal-Infant Care Research Centre 700 University Avenue, Suite 8-500, Toronto ON M5G 1X6