the capital intensity of photovoltaics manufacturing: barrier to scale
TRANSCRIPT

This journal is©The Royal Society of Chemistry 2015 Energy Environ. Sci., 2015, 8, 3395--3408 | 3395
Cite this: Energy Environ. Sci.,
2015, 8, 3395
The capital intensity of photovoltaics manufacturing:barrier to scale and opportunity for innovation†
Douglas M. Powell,a Ran Fu,b Kelsey Horowitz,b Paul A. Basore,b
Michael Woodhouseb and Tonio Buonassisi*a
Using a bottom-up cost model, we assess the impact of initial factory capital expenditure (capex) on
photovoltaic (PV) module minimum sustainable price (MSP) and industry-wide trends. We find capex to have
two important impacts on PV manufacturing. First, capex strongly influences the per-unit MSP of a c-Si
module: we calculate that the capex-related elements sum to 22% of MSP for an integrated wafer, cell, and
module manufacturer. This fraction provides a significant opportunity to reduce MSP toward the U.S. DOE
SunShot module price target through capex innovation. Second, a combination of high capex and low
margins leads to a poor financial rate of return, which limits the growth rate of PV module manufacturing
capacity. We quantify the capex of Czochralski-based crystalline silicon (c-Si) PV manufacturing, summing to
0.68 $/WaCap ($ per annual production capacity in watts, $year/W) from wafer to module and 1.01 $/WaCap
from polysilicon to module. At a sustainable operating margin determined by the MSP methodology for our
bottom-up scenario, we calculate the sustainable growth rate of PV manufacturing capacity to be B19%
annually – below the historical trend of B50% annually. We conclude with a discussion of innovation
opportunities to reduce the capex of PV manufacturing through both incremental and disruptive process
innovation with c-Si, platform innovations, and financial approaches.
Broader contextFor solar photovoltaic (PV) technologies, ‘‘cost per watt’’ and ‘‘minimum sustainable price’’ (MSP, in units of $/W) are ubiquitous techno-economic evaluationmetrics. Herein, an MIT-NREL collaboration team highlights the importance of an additional techno-economic metric: ‘‘capex,’’ an abbreviation of ‘‘capitalexpenditure,’’ or the upfront factory cost. The team quantifies end-to-end capex for single-crystalline silicon (c-Si) technology, from polycrystalline feedstockmanufacturing to module assembly. The combination of high capex and low margins in the c-Si PV industry is found to contribute to many industry trends thatcannot be explained by $/W alone, notably: (i) high capex and low margins limit the maximum sustainable growth rate for manufacturing capacity to o20%,limiting how fast the industry can scale up without external support. (ii) Large capital investments for new manufacturing facilities present a barrier toinnovation and promotes ‘‘technology lock.’’ (iii) High capex increases the margins required to satisfy investors (minimum sustainable price), reducingmanufacturers’ profitability. Regarding solutions, the authors quantify the benefits of capex reduction to MSP and maximum sustainable growth rate ofmanufacturing capacity, highlight a range of potential technology and business solutions to promote capex reduction, and highlight successful examples ofcapex reduction in other industries.
1. Introduction and motivation forcapex
The traditional metric of ‘‘dollars per rated watt’’ (henceforthabbreviated $/W) is often used to evaluate photovoltaic (PV)
technologies and economics: the difference between per-watt‘‘cost’’ and ‘‘price’’ dictates a PV manufacturer’s profitability,and the per-watt system price affects a consumer’s levelizedcost of electricity. Competing PV technologies are compared onthe basis of their per-watt manufacturing costs.1,2 Consequently,the $/W metric features prominently in experience learningcurves,3,4 technology roadmaps,2,5,6 and cost analyses.1,2,7,8
Herein, we describe the crystalline silicon (c-Si) PV industrythrough the optic of a variable that influences both sustainablemodule prices and sustainable manufacturing capacity growthrates: ‘‘capital expenditure’’ (abbreviated ‘‘capex’’), which is theupfront cost to build a factory and fill it with equipment. First,we examine how capex affects per-unit module prices ($/W),
a Massachusetts Institute of Technology, 77 Massachusetts Ave, Cambridge, MA,
02139, USA. E-mail: [email protected], [email protected];
Tel: +1 617-324-5130b Strategic Energy Analysis Center, National Renewable Energy Laboratory,
15013 Denver West Parkway, Golden, CO, 80401, USA.
E-mail: [email protected]; Tel: +1 303-275-4347
† Electronic supplementary information (ESI) available. See DOI: 10.1039/c5ee01509j
Received 15th May 2015,Accepted 10th August 2015
DOI: 10.1039/c5ee01509j
www.rsc.org/ees
Energy &EnvironmentalScience
ANALYSIS
Ope
n A
cces
s A
rtic
le. P
ublis
hed
on 0
7 Se
ptem
ber
2015
. Dow
nloa
ded
on 1
8/02
/201
6 18
:46:
50.
Thi
s ar
ticle
is li
cens
ed u
nder
a C
reat
ive
Com
mon
s A
ttrib
utio
n 3.
0 U
npor
ted
Lic
ence
.
View Article OnlineView Journal | View Issue

3396 | Energy Environ. Sci., 2015, 8, 3395--3408 This journal is©The Royal Society of Chemistry 2015
linking with our previous analyses in ref. 2 and 8. Calculationsindicate that halving capex could reduce module minimumsustainable prices by 0.13 $/W (15% relative), providing signi-ficant progress toward achieving the U.S. DOE SunShot moduleprice target.9 Second, we examine how capex helps to explaincertain industry-wide trends related to scale and innovationincluding: a company’s sustainable growth rate, the inter-dependence of rate of return on margin and capex, and barriersfaced by companies seeking to scale up innovative technologiesinto commercial production. Third, we highlight innovationopportunities to reduce capex including: incremental processinnovation, disruptive process innovation, platform innovations,and financial approaches.
2. Capex definition and calculationmethodology
In the first part of this section, we provide PV-relevant defini-tions of capex and other financial terms for readers with atechnical background. In the second part, we summarize thebottom-up cost modeling methodology employed in this study.Scientists and technologists with little prior accounting orfinancial experience are encouraged to peruse the ‘‘capextutorial’’ in the ESI.†
2.1 PV-relevant definitions of financial terms used in thisstudy
The upfront financial investment normalized by annual man-ufacturing capacity in watts ($/WaCap, with units of $/(W/year)which simplifies to $year/W) is defined in eqn (1) as the initialinvestment. This is a sum of capex and the money that a
manufacturer must set aside to run its operations (workingcapital).8,10,11
Initial investment$
WaCap
� �¼ capital expenditure capex;
$
WaCap
� �
þ working capital$
WaCap
� �
(1)
For consistency with best accounting practices,10 we definecapital expenditure (capex) as the sum of physical property,plant, and equipment, as well as the engineering, procurement,and construction expenses of the manufacturing facility itself.Capex does not change with utilization rate (i.e., the ratio ofactual production to nameplate capacity). Thus, capex is a fixedcost. Working capital (WC) also contributes to the initialinvestment by the manufacturer, and is money that must beset aside to fund ongoing operations, such as buying materialsand paying workers, when revenues are delayed relative tocosts. Capex is the dominant contribution to the initial invest-ment in the plant, accounting for approximately 80% of thetotal when a three-month duration of working capital isassumed. We note however that we have taken a conservativeapproach in our working capital calculation, and that a delay inrevenues relative to costs does not always occur.
As an example, we examine the cost structure of a c-Si PVmodule, shown in Fig. 1. We define variable cost as theincremental costs to manufacture a PV module in $/W, and isshown in blue in Fig. 1(a). Variable cost includes: materials,labor, electricity, and maintenance. Unlike capex, variable costscales with production volume. Note that we approximatemaintenance costs as a fixed percentage per year of the value
Fig. 1 (a) Breakdown of U.S. standard monocrystalline silicon cost components and minimum sustainable price that factor into gross profit andoperating income (earnings before interest and taxes, EBIT). (b) Breakdown of gross profit, equal to the MSP minus variable costs. Capex-related itemsare bolded. The profit required to generate the required return for capex in (b) is approximately double the straight-line depreciation expense in (a) dueto the required rate of return on the initial capital investment. If the WACC is increased (from 14% in this example), the disparity between these factorsincreases.
Analysis Energy & Environmental Science
Ope
n A
cces
s A
rtic
le. P
ublis
hed
on 0
7 Se
ptem
ber
2015
. Dow
nloa
ded
on 1
8/02
/201
6 18
:46:
50.
Thi
s ar
ticle
is li
cens
ed u
nder
a C
reat
ive
Com
mon
s A
ttrib
utio
n 3.
0 U
npor
ted
Lic
ence
.View Article Online

This journal is©The Royal Society of Chemistry 2015 Energy Environ. Sci., 2015, 8, 3395--3408 | 3397
of the initial capex under the assumption that more expensivetools are more expensive to maintain. Therefore, in our model,maintenance cost does scale with the initial capex even thoughit is a variable cost.
The operating margin of a company is used to compare theprofitability of companies and is equal to operating incomedivided by revenue. Operating income (earnings before interestand taxes (EBIT), highlighted in Fig. 1(a)), is the differencebetween selling price and the summation of: variable costs,sales general and administrative expenses (SG&A, overheadexpenses of running a business), research & development expenses(R&D), and depreciation expenses. Depreciation expenses aredefined as the capex allocated over time to account for the recoveryof the funds used on the initial investment in capex. Somecountries permit accelerated depreciation cycles in order to reducetax burdens and encourage fixed-asset investment,12 but forsimplification straight-line depreciation is used to calculate thedepreciation expense in Fig. 1(a), However, accelerated deprecia-tion is considered in the detailed calculation of MSP. We will lateruse operating margin to benchmark PV manufacturers againstother industries.
As with any financial investment, a manufacturer mustgenerate sufficient income for their initial investment for it tobe beneficial. The company’s weighted average cost of capital(WACC) defines the cost of money (in percentage terms) for acompany. The internal rate of return (IRR) is the rate of returngenerated by a series of cash flows, such as an initial cashoutflow (eqn (1)) required to construct a manufacturing facility,followed by subsequent cash inflows generated by modulessales. IRR is expressed in percentage terms, like interest on asavings account. The company’s goal is to complete projectsthat have an IRR that is greater than their cost of money(WACC). In this work, we apply a WACC of 14%, representativeof a PV company.13 The minimum sustainable price (MSP) of aPV module, detailed in ref. 2 and 8, is defined as the minimumselling price ($/W) at which the rate of return for the manu-facturer equals their weighted average cost of capital. The MSPof a c-Si PV module is indicated in Fig. 1(a) by the black square.The required gross profit of a manufacturer is dependent onthe MSP calculation, and is expanded in Fig. 1(b). Operatingexpenses, including SG&A and R&D, taxes, and the profitrequired to generate the required return on the initial capexand working capital investment consume a portion of the grossprofit.
2.2 Model description: calculation of capex and minimumsustainable price
Using the general financial parameters introduced above,we calculate capex and MSP with the bottom-up cost modeldescribed in ref. 8 with updated inputs reflecting second half of2014 (2H-2014) market conditions and technology. A version ofthis cost model is found in the ESI† and can be downloadedfrom.14 We model a U.S.-based greenfield c-Si PV factory that isvertically integrated from ingots to modules, as detailed in aprevious study.8 For capex, we extend the model to include
polysilicon production.13 ‘‘Standard’’ c-Si technology is consid-ered, whereby solar-grade polysilicon chunk is purchased at acost of 23 $/kg.13 Czochralski-grown monocrystalline siliconwafers are then fabricated into diffused-junction cells withfull-area aluminum back-surface fields, and then assembledinto modules. The module efficiency is 16%, resulting in a260 W, 60-cell module. We believe our calculation of ingot-to-module manufacturing represents a reasonable scope forcalculation that includes critical supply-chain components thatare specific to PV. However, we do detail the capex of poly-silicon production below and note that some input materials toPV manufacturing could provide scalability challenges in thefuture if PV demands begin to rapidly eclipse incumbent usesin other sectors. Silver metallization pastes may face thisimpeding challenge.15 For wafer, cell, and module assemblyequipment, we assume 7 years useful life for equipment andlonger for the manufacturing facility. These assumptions are inaccordance with the general recommendations provided byindustry collaborators and the U.S. tax code, although it isworth noting that equipment may also be rendered obsolete byinnovation during their lifetimes.5
To estimate capex of the PV industry, we rely on market datafrom tool vendors and manufacturers. The total capex can bedescribed as the sum of all process steps as in eqn (2),
Total capex ¼X
i
capex of process step i: (2)
The capex of a process step includes the cost of the equipmentitself and the facility needed to house it.
Capex constitutes a significant fraction of the module MSP($/W).‡ As shown in Fig. 1, we calculate a MSP of 0.85 $/W for aU.S.-based monocrystalline silicon PV factory, including vari-able costs totaling 0.54 $/W. The resulting sustainable grossmargin is 37% and operating margin is 15%. Fig. 1(a) shows thecapex-related contribution of maintenance to the variable costof the module. Fig. 1(b) shows the gross profit required for anadequate return on the capex investment. The dominant shareof the gross profit is required to create an adequate IRR on theinitial investment defined in eqn (1). The profit required forcapex sums to 0.16 $/W, while the profit required for workingcapital is 0.03 $/W.§ We underscore that the profit required forcapex is approximately double the simplified straight-linedepreciation expense at the assumed WACC of 14%. Thisdisparity increases with increasing WACC, and vice versa.Because of the time value of money in the IRR calculation forthe manufacturer, a ‘‘full cost’’ methodology that includes
‡ The bottom-line impact of capex on MSP is expected to flow through to levelizedcost of electricity (LCOE) calculations. While LCOE is more relevant to endcustomers with production incentives, its calculation involves many local tech-noeconomic assumptions including abundance and spectral quality of solarresource, module operating temperature, system discount rate, and local incen-tive structures. We do not extend our analysis from MSP to LCOE in this study,because no direct secondary LCOE benefits are expected from capex reductionother than MSP reductions.§ Less margin is required by working capital because (a) it has a lower initialvalue than capex, and (b) at the end of a project, the working capital can bereinvested back into the company.
Energy & Environmental Science Analysis
Ope
n A
cces
s A
rtic
le. P
ublis
hed
on 0
7 Se
ptem
ber
2015
. Dow
nloa
ded
on 1
8/02
/201
6 18
:46:
50.
Thi
s ar
ticle
is li
cens
ed u
nder
a C
reat
ive
Com
mon
s A
ttrib
utio
n 3.
0 U
npor
ted
Lic
ence
.View Article Online

3398 | Energy Environ. Sci., 2015, 8, 3395--3408 This journal is©The Royal Society of Chemistry 2015
adding depreciation to variable cost is not sufficient to capturethe impact of capex.¶ In sum, the capex-related factors com-prise approximately 22% of the module MSP, or 0.19 $/W. Thisincludes the margin required for capex (0.16 $/W) and main-tenance costs (0.03 $/W) in the variable cost category.
In practice, a government agency could subsidize initialcapex, or a portion of a capex-related loan. Both of thesemechanisms, which reduce the realized capex to the manu-facturer,16–18 have been observed in recent years. For such afactory, the module MSP ($/W) will be lower than our calcula-tions, which include the full contribution of capex. However,this ‘‘subsidized’’ scenario does not represent a self-financedgrowth model for the industry, thus we account for the fullvalue of capex in our calculations.
While our detailed model is available in ESI,† a schematic ispresented in Fig. 2. This figure summarizes the linkagesbetween the key model elements, including capex, workingcapital, variable costs, operating income (EBIT) and margin,depreciation, WACC, IRR, and MSP. This figure also showslinkages between terminology used in the following sections,
including PP&E ratio, operating margin, debt-to-equity ratio,and sustainable growth rate.
3. Snapshot of c-Si PV capex3.1 Quantifying c-Si PV capex
Based on market data from tool vendors and manufacturers,the capex breakdown of each process step for c-Si PV manu-facturing in the 2H-2014 is shown in Fig. 3 for a hypotheticalfacility based in the United States. The capex for equipment isshown with a bright bar, while the capex for the facility isshown with a dark bar and the two are stacked for each processstep. For ingot, wafer, cell and module, facility capex is allo-cated via the floor space required for each process step. Forpolysilicon, facility capex comprises a much higher proportionof the total capex and includes engineering and constructionexpenses of the plant itself. For wafer, cell, and module manu-facturing, an existing facility could be more easily re-purposedthan a polysilicon factory.
In this paragraph, we describe sources of uncertainty andvariation in our capex calculations. First, given uncertainty inour market assessment, we can expect at most a �15% varia-tion in each capex category. Consistent with our expectations,updated capex data obtained in 1H-2015, presented in the ESI,†do not represent a significant change from the 2H-2014 values
Fig. 2 Schematic representation of inputs and outputs of our model, which is also available in spreadsheet format in ESI.†
¶ Depreciation is only considered in the MSP calculation because it has the effectof reducing taxable income, and thus has a cash flow impact. Depreciation itselfis a non-cash expense (i.e., no cash is consumed by depreciation).
Analysis Energy & Environmental Science
Ope
n A
cces
s A
rtic
le. P
ublis
hed
on 0
7 Se
ptem
ber
2015
. Dow
nloa
ded
on 1
8/02
/201
6 18
:46:
50.
Thi
s ar
ticle
is li
cens
ed u
nder
a C
reat
ive
Com
mon
s A
ttrib
utio
n 3.
0 U
npor
ted
Lic
ence
.View Article Online

This journal is©The Royal Society of Chemistry 2015 Energy Environ. Sci., 2015, 8, 3395--3408 | 3399
shown in Fig. 3, despite significant downward pricing pressureon equipment suppliers because of the recent manufacturingoversupply condition. Second, we note that polysilicon is one ofthe capex categories most significantly affected by downstreaminnovation and regional manufacturing. Improvements in bothconversion efficiency and silicon usage directly affect the gramsof silicon per watt, proportionately reducing the contribution ofpolysilicon capex when calculated using units of $/WaCap.Additionally, because the physical plant represents a largepercentage of polysilicon capex, regional variations in labor,materials, and construction permitting will affect polysiliconcapex; in China, polysilicon capex is estimated to be a quarterless than in the United States and Europe. Third, technologyvariations significantly affect capex, as described in Section 7.For instance, changing from Czochralski single-crystalline siliconto directionally solidified multicrystalline silicon reduces capex byapproximately $0.1/WaCap, a B10% relative reduction, because ofthe latter’s higher throughput.
For a 2 GWaCap factory of competitive scale7 using thebaseline technology scenario, capex totals approximately US$2 billion for a complete polysilicon-to-module factory. Alter-natively, a total capex of approximately US $1.4 billion isestimated for a factory that purchases polysilicon, as is modeledin Fig. 1. Fig. 3 shows that equipment for three manufacturingsteps in polysilicon and wafering contributes around 45% ofthe total capex investment: Siemens chemical vapor depositionreactors for forming silicon rods, Czochralski crystal pullers, andtrichlorosilane refining. Although no single step of cell manu-facturing dominates to a similar degree, several moderately capex-intensive steps contribute 30% of the polysilicon-to-modulecapex. For the hypothetical manufacturer modeled in Fig. 1,the sum of capex for wafer, cell, and module manufacturing is0.68 $/WaCap and 1.01 $/WaCap including polysilicon.
3.2 Comparing capital intensity of industries
We define capital intensity as the total capex required toproduce a product divided by its sales price. Financial state-ments of publicly traded companies in the U.S. report the value
of certain capex components. This includes property, plant, andequipment (denoted ‘‘PP&E’’) over specified reporting periods.It is instructive to compare the book value of PP&E in a previousyear to the revenue in a current year; we employ this ‘‘PP&Eratio’’ as a proxy for capital intensity. The one-year delayincluded in the comparison of PP&E to subsequent revenuesassumes that PP&E additions are installed one year ahead ofproduction to be ready for operation. A higher PP&E ratioimplies higher capital intensity. This metric is impacted bythe entire portfolio of company products, so a diversifiedcompany comprising divisions with a low PP&E ratio will lowerthe company’s overall PP&E ratio. For example, a manufacturingcompany that diversifies downstream into ‘‘energy services’’ willlower its PP&E ratio.
To compare to our bottom-up model, we also define amodified ratio, PP&E0, which compares the year-zero initialinvestment required for a manufacturing facility over the first-year sales. Using the MSP of 0.85 $/W, we calculate a PP&E0
ratio of 0.79 for the modeled manufacturer in Fig. 1 using acapex of 0.68 $/WaCap. The related PP&E0 ratio would be 1.19(or higher capital intensity), assuming the same module price,if the company produced its own polysilicon with a total capexof 1.01 $/WaCap.
4. Capex limits the PV industry’ssustainable self-financed growth rate
In this section, we quantify the sustainable growth rate (SGR) ofa manufacturer. The SGR is of interest for several reasons. Forexample, one can compare the SGR with aspirational PV growthtargets, including those determined by science and policyconsiderations (e.g., target emission reduction rates for stabi-lizing atmospheric CO2 concentrations by increased renewable-energy deployment19–21). One can also compare SGR with thehistorical cumulative annual growth rates (CAGR) of PV manu-facturing capacity equal to approximately 51% over 2003–2013(from 1.0 GWaCap to 60.5 GWaCap),22 in order to estimate therole of debt and equity in financing recent expansions of PV
Fig. 3 Initial capex for 2H-2014 c-Si PV manufacturing, normalized by annual production capacity. Each step includes the cost of equipment (light bar)and the facility that houses it (dark bar). Polysilicon and cell production comprise the majority of capex, with the three process steps of Siemens CVD,Czochralski growth, and TCS production comprising 45% of total capex.
Energy & Environmental Science Analysis
Ope
n A
cces
s A
rtic
le. P
ublis
hed
on 0
7 Se
ptem
ber
2015
. Dow
nloa
ded
on 1
8/02
/201
6 18
:46:
50.
Thi
s ar
ticle
is li
cens
ed u
nder
a C
reat
ive
Com
mon
s A
ttrib
utio
n 3.
0 U
npor
ted
Lic
ence
.View Article Online

3400 | Energy Environ. Sci., 2015, 8, 3395--3408 This journal is©The Royal Society of Chemistry 2015
manufacturing capacity. We note however, that manufacturingcapacity growth does not have to maintain this rapid-growthtrajectory to make meaningful contributions to global energygeneration.23 SGR can also be used to estimate the potential foran innovative technology that is able to scale faster than theincumbent.
We use the SGR model of Higgins24,25 as formulated byAshta.26 The SGR is defined as the growth rate achievablewithout modifying the existing financial policy of the company.This model fixes the amount of returns that are reinvested intocompany growth (versus dividends) and the debt-to-equity ratio.The SGR is dependent on capital intensity (PP&E0 ratio, definedin Section 2.1) and operating margin (EBIT, defined in Fig. 1).Our model assumes all profits are reinvested into the company(i.e., additional equity value is created from retained earningswithout disbursements of dividends), an initial debt-to-equityratio of 1 : 1, a nominal cost of debt of 4.6%,7 seven year straightline depreciation, three months of working capital, and a taxrate of 28%.27 In Fig. 4, we calculate SGR as a function of thesevariables with (a) a constant debt-to-equity ratio, and (b) noadditional debt. A company can grow more quickly with addi-tional debt financing (done sustainably with a constant debt-to-equity ratio) instead of only relying on retained earnings,as may be required in a situation of frozen debt markets. Ifavailable, a company can obtain additional debt financing andmaintain a constant debt-to-equity ratio when the value of equityin a company increases from earnings that are reinvested intothe company.
For the example PP&E0 ratio of 0.79 and operating margin of15% for the hypothetical manufacturer in Fig. 1 selling at theirMSP, a SGR of 19% results if new debt is available to maintainthe debt-to-equity ratio. A SGR of 9% results if no new debtis available. These points are highlighted in Fig. 4 with openboxes. However, due to supply-demand dynamics, the actualpricing of PV modules may differ from the calculated MSP. Wenote that prices lower than the MSP will simultaneouslyincrease the PP&E0 ratio and decrease the operating margin,
leading to a further suppressed SGR relative to our calculation.Increasing prices will increase SGR. Because of these dynamics,our analysis is a snapshot, though our calculations of PP&E0
and operating margin at prices equal to MSP attempt toapproximate long-term trends.
This framework can be applied to set a target capitalintensity for sustainable growth. To reach a SGR of 51% at aconstant operating margin of 15%, a PP&E0 ratio of 0.19 isneeded, which is approximately a 75% decrease. This may beachieved via technical or financial innovation (or a combi-nation of the two). We explore the prospect of these innovationsin Section 7.
It is apparent from the model that the manufacturingcapacity growth spurt in the late 2000’s (B60% annual growthfrom 2009 to 201122) required significant capital influx fromdebt sources for manufacturers to keep up. As in Fig. 4(a), evenwith high operating margin assumptions (25%) for the modeledmanufacturer (PP&E0 ratio of 0.79 after price is increased to0.98 $/W to support a 25% operating margin) and a constantdebt-to-equity ratio, SGR is limited to 39% due to high capex.This is lower than the actual CAGR for manufacturing capacity.This situation is not indefinitely sustainable at a target debt-to-equity ratio of 1 : 1, but companies have good reason to attemptto grow quickly. Significant economies of scale are present in PVmanufacturing,7 and companies are motivated to maintainmarket share in the growth phase of an industry to preventfacing other barriers to entry in the future. For our modeledmanufacturer, this would necessitate a higher debt-to-equityratio of 5.1 : 1 than the 1 : 1 assumed herein.
Excessive debt-to-equity ratios may prove problematic forcompanies. The Tradeoff Theory assumes that it is beneficial toleverage debt financing in a firm’s capital structure until theoptimal capital structure is reached.28,29 This is because ifa firm has too much debt (namely, too high a debt-to-equityratio), the cost of equity could increase because equity investors(i.e., stock holders) are risk-averse and are concerned about thelong-term solvency of the company. The cost of debt could also
Fig. 4 The sustainable growth rate of a company with (a) a constant debt-to-equity ratio and (b) no additional debt are strong functions of capitalintensity and operating margin. At the modeled capital intensities of ingot-to-module PP&E0 = 0.79 and poly-to-module PP&E0 = 1.19 manufacturing,the ability of PV manufacturers to scale in concert with historical trends at a 1 : 1 debt-to-equity ratio is poor. Reduced capital intensity, and increasedoperating margins, increase the PV industry’s ability to scale.
Analysis Energy & Environmental Science
Ope
n A
cces
s A
rtic
le. P
ublis
hed
on 0
7 Se
ptem
ber
2015
. Dow
nloa
ded
on 1
8/02
/201
6 18
:46:
50.
Thi
s ar
ticle
is li
cens
ed u
nder
a C
reat
ive
Com
mon
s A
ttrib
utio
n 3.
0 U
npor
ted
Lic
ence
.View Article Online

This journal is©The Royal Society of Chemistry 2015 Energy Environ. Sci., 2015, 8, 3395--3408 | 3401
increase in the higher leverage scenario due to an increasedrisk of the company not being able to make interest paymentsduring periods of decreased profits. Therefore, a high debt levelcould eventually increase WACC when the optimal capital struc-ture is passed, thereby causing financial distress and increasingthe MSP. As noted above however, a company may have goodreason to acquire more debt to grow quickly.
Increased interest payments from high debt leverage canalso reduce the cash available for self-financed growth of agiven company. In the PV industry, with volatile returns, thiscould prove especially problematic. For instance, Suntech usedto be the largest module manufacturer in the world, with rapidcapacity growth each year. Although Suntech successfullyscaled up their capacity, their debt level also increased rapidlyin their capital structure and subsequently aggravated thecompany operation. Financial distress gradually became aburden on Suntech and eventually bankrupted the company.30
Therefore, although scaling up is an important factor to meettargets, the sustainable capital structure and growth rate formanufacturing companies may need additional attention.
5. Capex limits the internal rate ofreturn of PV manufacturing
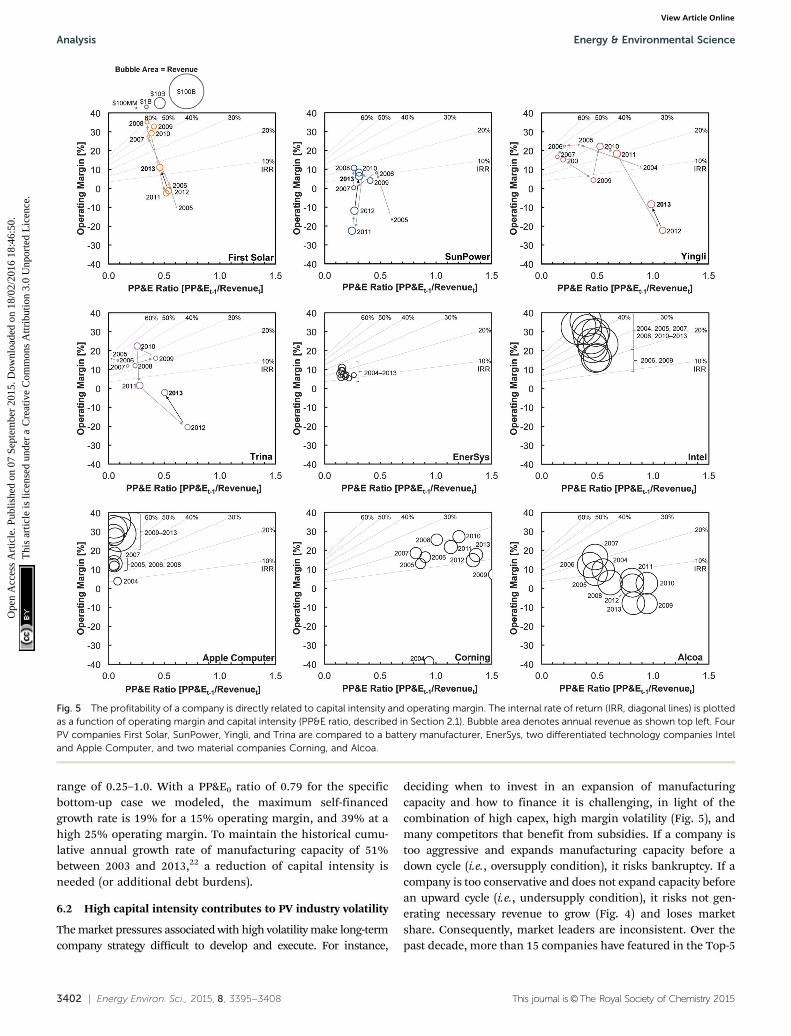
In this section, we present a framework to relate a manu-facturer’s profitability to its capital intensity and operatingmargin (i.e., EBIT). In Fig. 5, we plot the yearly performanceof operating margin and capital intensity (PP&E ratio defined inSection 2.1) of companies based on annual stockholder filings.The bubble area denotes yearly revenue as indicated on Fig. 5(a).The operating margin is calculated for the current year with thePP&E ratio given by PP&Et�1/Revenuet. Internal rates of return(IRR) are also calculated as a function of operating margins andPP&E ratio. This framework allows for a direct comparison of theimpacts of both operating margin (highly sensitive to module$/W) and capex. A company enjoys the highest returns (IRR) inthe upper left of the plot. We define success for the companywhen it operates above the line representing their WACC, asdefined by the center of the revenue bubble. The IRR calculationassumes seven years of remaining life of the total book value ofPP&E, along with no additional capex and constant operatingmargins. Additionally, three months of working capital is againassumed. IRR contours do not intersect the origin of the plotbecause of the requirements of working capital. A tax rate of 28%is also applied.27 This framework, as well as the IRR calculation,assumes a traditional model in which products are sold aftermanufacturing. If a different model is applied, in which pay-ments to the manufacturer may be delayed, the PP&E ratio maybe inappropriate, as the yearly revenue is the denominator in thePP&E ratio.31,32
A company’s near-term strategy to improve their IRR isinfluenced by their current operating margin and capital inten-sity as reflected in Fig. 5. Thus, a manufacturer with high capexand low margins in the right of the plot faces a steeper gradientof IRR by increasing operating margin and may direct resources
to reduce $/W-cost or increase $/W-price. Over the long term,however, ignoring capex reduction opportunities may limitsustainable growth potential (see Fig. 4).
Different companies also have different WACCs, whichdictate minimum IRRs using the MSP methodology. For astart-up company, a higher WACC (reflecting higher risk offailure) of approximately 45% is appropriate,33 while a WACC of14% was used for a representative incumbent PV manufac-turer.13 For companies with a high WACC, Fig. 5 illustrates anarrow window for success. While a company with a low WACCmay have an adequate IRR when its marker is in the upper-halfof Fig. 5, a high WACC company may have an adequate IRRonly in the upper-left, which places more significant con-straints on capital intensity. Both types of company benefitfrom higher selling prices, as this moves the bubble toward theupper-left (affects both x- and y-axes).
In Fig. 5, nine firms are compared using this frameworkduring the period of 2004 and 2013 based on data availablein annual reports:34–43 First Solar, SunPower, Yingli, Trina,EnerSys (a battery manufacturing company; data for Marchend of fiscal year attributed to entire previous year), Intel, AppleComputers (data for September end of fiscal year attributed toentire year), Corning (glass and ceramics), and Alcoa (aluminum).We note that the ratio compares the book value of each compa-ny’s property, plant, and equipment to revenue. Therefore thePP&E ratio is sensitive to whether a PV company owns installedcapacity, as it may be recorded as PP&E, while revenues from thefactory will be spread over time.
We observe several trends. First, PV firms do not haveexceptionally high capital intensity relative to benchmarkindustries. However, they experienced higher volatility in opera-ting margins than comparison industries from 2004 to 2013,implying that tomorrow’s margins are less predictable. The PVcompanies also have an unfortunate combination of moderateto high capex and low margins. This is rare in steady-statecomparison industries, where companies with high capextypically have high operating margins to sustain growth (Inteland Corning). The most attractive recipe for high IRR combinesboth high margins and low capex (e.g., Apple Computer).Contract manufacturing, where factories are not owned, canhelp support this trend, and is discussed in Section 7.4. Alcoaprovides an example of a comparison industry that was stronglyaffected by the recent global economic down-turn.44
6. Discussion: influence of capex onPV industry trends
In this section, we discuss five higher-level implications ofcapex on PV industry trends.
6.1 High capital intensity impedes industry growth
First, as shown in Fig. 4, a high capex relative to revenue andcost of capital limits the sustainable growth rate of manufac-turing capacity. As seen from Fig. 5, the capital intensity (PP&Eto sales ratio) of pure-play PV companies is typically in the
Energy & Environmental Science Analysis
Ope
n A
cces
s A
rtic
le. P
ublis
hed
on 0
7 Se
ptem
ber
2015
. Dow
nloa
ded
on 1
8/02
/201
6 18
:46:
50.
Thi
s ar
ticle
is li
cens
ed u
nder
a C
reat
ive
Com
mon
s A
ttrib
utio
n 3.
0 U
npor
ted
Lic
ence
.View Article Online
3402 | Energy Environ. Sci., 2015, 8, 3395--3408 This journal is©The Royal Society of Chemistry 2015
range of 0.25–1.0. With a PP&E0 ratio of 0.79 for the specificbottom-up case we modeled, the maximum self-financedgrowth rate is 19% for a 15% operating margin, and 39% at ahigh 25% operating margin. To maintain the historical cumu-lative annual growth rate of manufacturing capacity of 51%between 2003 and 2013,22 a reduction of capital intensity isneeded (or additional debt burdens).
6.2 High capital intensity contributes to PV industry volatility
The market pressures associated with high volatility make long-termcompany strategy difficult to develop and execute. For instance,
deciding when to invest in an expansion of manufacturingcapacity and how to finance it is challenging, in light of thecombination of high capex, high margin volatility (Fig. 5), andmany competitors that benefit from subsidies. If a company istoo aggressive and expands manufacturing capacity before adown cycle (i.e., oversupply condition), it risks bankruptcy. If acompany is too conservative and does not expand capacity beforean upward cycle (i.e., undersupply condition), it risks not gen-erating necessary revenue to grow (Fig. 4) and loses marketshare. Consequently, market leaders are inconsistent. Over thepast decade, more than 15 companies have featured in the Top-5
Fig. 5 The profitability of a company is directly related to capital intensity and operating margin. The internal rate of return (IRR, diagonal lines) is plottedas a function of operating margin and capital intensity (PP&E ratio, described in Section 2.1). Bubble area denotes annual revenue as shown top left. FourPV companies First Solar, SunPower, Yingli, and Trina are compared to a battery manufacturer, EnerSys, two differentiated technology companies Inteland Apple Computer, and two material companies Corning, and Alcoa.
Analysis Energy & Environmental Science
Ope
n A
cces
s A
rtic
le. P
ublis
hed
on 0
7 Se
ptem
ber
2015
. Dow
nloa
ded
on 1
8/02
/201
6 18
:46:
50.
Thi
s ar
ticle
is li
cens
ed u
nder
a C
reat
ive
Com
mon
s A
ttrib
utio
n 3.
0 U
npor
ted
Lic
ence
.View Article Online
This journal is©The Royal Society of Chemistry 2015 Energy Environ. Sci., 2015, 8, 3395--3408 | 3403
PV module manufacturers list, including 6 that are no longeroperating independently because they went bankrupt or wereacquired.45
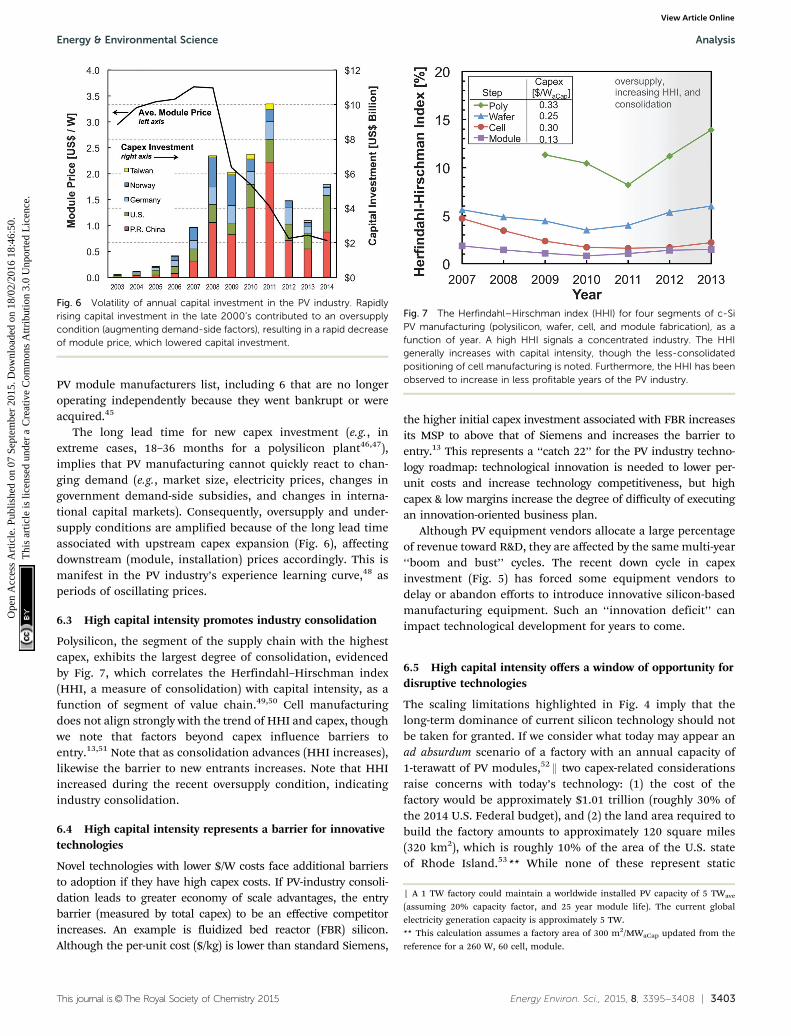
The long lead time for new capex investment (e.g., inextreme cases, 18–36 months for a polysilicon plant46,47),implies that PV manufacturing cannot quickly react to chan-ging demand (e.g., market size, electricity prices, changes ingovernment demand-side subsidies, and changes in interna-tional capital markets). Consequently, oversupply and under-supply conditions are amplified because of the long lead timeassociated with upstream capex expansion (Fig. 6), affectingdownstream (module, installation) prices accordingly. This ismanifest in the PV industry’s experience learning curve,48 asperiods of oscillating prices.
6.3 High capital intensity promotes industry consolidation
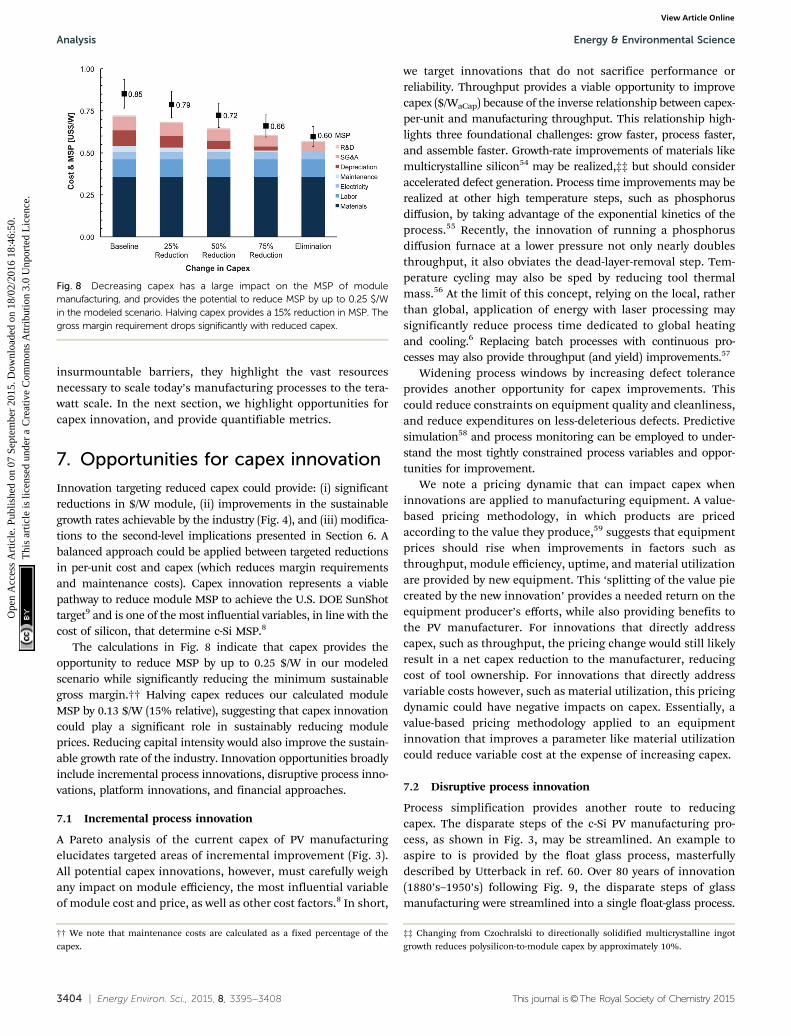
Polysilicon, the segment of the supply chain with the highestcapex, exhibits the largest degree of consolidation, evidencedby Fig. 7, which correlates the Herfindahl–Hirschman index(HHI, a measure of consolidation) with capital intensity, as afunction of segment of value chain.49,50 Cell manufacturingdoes not align strongly with the trend of HHI and capex, thoughwe note that factors beyond capex influence barriers toentry.13,51 Note that as consolidation advances (HHI increases),likewise the barrier to new entrants increases. Note that HHIincreased during the recent oversupply condition, indicatingindustry consolidation.
6.4 High capital intensity represents a barrier for innovativetechnologies
Novel technologies with lower $/W costs face additional barriersto adoption if they have high capex costs. If PV-industry consoli-dation leads to greater economy of scale advantages, the entrybarrier (measured by total capex) to be an effective competitorincreases. An example is fluidized bed reactor (FBR) silicon.Although the per-unit cost ($/kg) is lower than standard Siemens,
the higher initial capex investment associated with FBR increasesits MSP to above that of Siemens and increases the barrier toentry.13 This represents a ‘‘catch 22’’ for the PV industry techno-logy roadmap: technological innovation is needed to lower per-unit costs and increase technology competitiveness, but highcapex & low margins increase the degree of difficulty of executingan innovation-oriented business plan.
Although PV equipment vendors allocate a large percentageof revenue toward R&D, they are affected by the same multi-year‘‘boom and bust’’ cycles. The recent down cycle in capexinvestment (Fig. 5) has forced some equipment vendors todelay or abandon efforts to introduce innovative silicon-basedmanufacturing equipment. Such an ‘‘innovation deficit’’ canimpact technological development for years to come.
6.5 High capital intensity offers a window of opportunity fordisruptive technologies
The scaling limitations highlighted in Fig. 4 imply that thelong-term dominance of current silicon technology should notbe taken for granted. If we consider what today may appear anad absurdum scenario of a factory with an annual capacity of1-terawatt of PV modules,528 two capex-related considerationsraise concerns with today’s technology: (1) the cost of thefactory would be approximately $1.01 trillion (roughly 30% ofthe 2014 U.S. Federal budget), and (2) the land area required tobuild the factory amounts to approximately 120 square miles(320 km2), which is roughly 10% of the area of the U.S. stateof Rhode Island.53 ** While none of these represent static
Fig. 6 Volatility of annual capital investment in the PV industry. Rapidlyrising capital investment in the late 2000’s contributed to an oversupplycondition (augmenting demand-side factors), resulting in a rapid decreaseof module price, which lowered capital investment.
Fig. 7 The Herfindahl–Hirschman index (HHI) for four segments of c-SiPV manufacturing (polysilicon, wafer, cell, and module fabrication), as afunction of year. A high HHI signals a concentrated industry. The HHIgenerally increases with capital intensity, though the less-consolidatedpositioning of cell manufacturing is noted. Furthermore, the HHI has beenobserved to increase in less profitable years of the PV industry.
8 A 1 TW factory could maintain a worldwide installed PV capacity of 5 TWave
(assuming 20% capacity factor, and 25 year module life). The current globalelectricity generation capacity is approximately 5 TW.** This calculation assumes a factory area of 300 m2/MWaCap updated from thereference for a 260 W, 60 cell, module.
Energy & Environmental Science Analysis
Ope
n A
cces
s A
rtic
le. P
ublis
hed
on 0
7 Se
ptem
ber
2015
. Dow
nloa
ded
on 1
8/02
/201
6 18
:46:
50.
Thi
s ar
ticle
is li
cens
ed u
nder
a C
reat
ive
Com
mon
s A
ttrib
utio
n 3.
0 U
npor
ted
Lic
ence
.View Article Online
3404 | Energy Environ. Sci., 2015, 8, 3395--3408 This journal is©The Royal Society of Chemistry 2015
insurmountable barriers, they highlight the vast resourcesnecessary to scale today’s manufacturing processes to the tera-watt scale. In the next section, we highlight opportunities forcapex innovation, and provide quantifiable metrics.
7. Opportunities for capex innovation
Innovation targeting reduced capex could provide: (i) significantreductions in $/W module, (ii) improvements in the sustainablegrowth rates achievable by the industry (Fig. 4), and (iii) modifica-tions to the second-level implications presented in Section 6. Abalanced approach could be applied between targeted reductionsin per-unit cost and capex (which reduces margin requirementsand maintenance costs). Capex innovation represents a viablepathway to reduce module MSP to achieve the U.S. DOE SunShottarget9 and is one of the most influential variables, in line with thecost of silicon, that determine c-Si MSP.8
The calculations in Fig. 8 indicate that capex provides theopportunity to reduce MSP by up to 0.25 $/W in our modeledscenario while significantly reducing the minimum sustainablegross margin.†† Halving capex reduces our calculated moduleMSP by 0.13 $/W (15% relative), suggesting that capex innovationcould play a significant role in sustainably reducing moduleprices. Reducing capital intensity would also improve the sustain-able growth rate of the industry. Innovation opportunities broadlyinclude incremental process innovations, disruptive process inno-vations, platform innovations, and financial approaches.
7.1 Incremental process innovation
A Pareto analysis of the current capex of PV manufacturingelucidates targeted areas of incremental improvement (Fig. 3).All potential capex innovations, however, must carefully weighany impact on module efficiency, the most influential variableof module cost and price, as well as other cost factors.8 In short,
we target innovations that do not sacrifice performance orreliability. Throughput provides a viable opportunity to improvecapex ($/WaCap) because of the inverse relationship between capex-per-unit and manufacturing throughput. This relationship high-lights three foundational challenges: grow faster, process faster,and assemble faster. Growth-rate improvements of materials likemulticrystalline silicon54 may be realized,‡‡ but should consideraccelerated defect generation. Process time improvements may berealized at other high temperature steps, such as phosphorusdiffusion, by taking advantage of the exponential kinetics of theprocess.55 Recently, the innovation of running a phosphorusdiffusion furnace at a lower pressure not only nearly doublesthroughput, it also obviates the dead-layer-removal step. Tem-perature cycling may also be sped by reducing tool thermalmass.56 At the limit of this concept, relying on the local, ratherthan global, application of energy with laser processing maysignificantly reduce process time dedicated to global heatingand cooling.6 Replacing batch processes with continuous pro-cesses may also provide throughput (and yield) improvements.57
Widening process windows by increasing defect toleranceprovides another opportunity for capex improvements. Thiscould reduce constraints on equipment quality and cleanliness,and reduce expenditures on less-deleterious defects. Predictivesimulation58 and process monitoring can be employed to under-stand the most tightly constrained process variables and oppor-tunities for improvement.
We note a pricing dynamic that can impact capex wheninnovations are applied to manufacturing equipment. A value-based pricing methodology, in which products are pricedaccording to the value they produce,59 suggests that equipmentprices should rise when improvements in factors such asthroughput, module efficiency, uptime, and material utilizationare provided by new equipment. This ‘splitting of the value piecreated by the new innovation’ provides a needed return on theequipment producer’s efforts, while also providing benefits tothe PV manufacturer. For innovations that directly addresscapex, such as throughput, the pricing change would still likelyresult in a net capex reduction to the manufacturer, reducingcost of tool ownership. For innovations that directly addressvariable costs however, such as material utilization, this pricingdynamic could have negative impacts on capex. Essentially, avalue-based pricing methodology applied to an equipmentinnovation that improves a parameter like material utilizationcould reduce variable cost at the expense of increasing capex.
7.2 Disruptive process innovation
Process simplification provides another route to reducingcapex. The disparate steps of the c-Si PV manufacturing pro-cess, as shown in Fig. 3, may be streamlined. An example toaspire to is provided by the float glass process, masterfullydescribed by Utterback in ref. 60. Over 80 years of innovation(1880’s–1950’s) following Fig. 9, the disparate steps of glassmanufacturing were streamlined into a single float-glass process.
Fig. 8 Decreasing capex has a large impact on the MSP of modulemanufacturing, and provides the potential to reduce MSP by up to 0.25 $/Win the modeled scenario. Halving capex provides a 15% reduction in MSP. Thegross margin requirement drops significantly with reduced capex.
†† We note that maintenance costs are calculated as a fixed percentage of thecapex.
‡‡ Changing from Czochralski to directionally solidified multicrystalline ingotgrowth reduces polysilicon-to-module capex by approximately 10%.
Analysis Energy & Environmental Science
Ope
n A
cces
s A
rtic
le. P
ublis
hed
on 0
7 Se
ptem
ber
2015
. Dow
nloa
ded
on 1
8/02
/201
6 18
:46:
50.
Thi
s ar
ticle
is li
cens
ed u
nder
a C
reat
ive
Com
mon
s A
ttrib
utio
n 3.
0 U
npor
ted
Lic
ence
.View Article Online

This journal is©The Royal Society of Chemistry 2015 Energy Environ. Sci., 2015, 8, 3395--3408 | 3405
Kerfless wafer growth techniques, including both vapor61 andmelt62 approaches, take aim at the strong parallels betweencurrent silicon wafer manufacturing and 1880’s glassmanufacturing.
This general trend of disruptive process innovations that weobserved for glass, seems to carry over for modern precisionindustries as well. Gillette razor blades in the 1990’s provideanother example. In the case of Gillette, the manufacturingthroughput of Mach3 razors increased by 3� relative to pre-vious technology by replacing intermittent-motion withcontinuous-motion machines.63,64 This reduced factory foot-print for manufacturing in one of the United States’ mostexpensive cities – Boston.65
A streamlined approach for c-Si could include epitaxial wafergrowth61 direct from the gaseous silicon phase (avoiding poly-silicon production and wire sawing) with an in situ emitter andback surface field (BSF).66 For further downstream simplifica-tion, the wafer could also be grown pre-textured.67 The imple-mentation of a high-lifetime68 wafer that is pre-diffused andpre-textured eliminates the majority of individual process stepsof polysilicon and wafer manufacturing. Similarly, melt-basedapproaches for drop-in wafers provide significant simplifica-tion as well.62 These approaches might leverage streamlinedsilicon refining (e.g., upgraded metallurgical-grade silicon,UMG-Si), where substantial R&D has been focused on closingthe quality gap with Siemens-grade silicon. Taking the conceptfurther, additional simplification could further streamline celland module manufacturing by blurring the lines between thetwo currently disparate steps by attaching cells to partiallylaminated modules as a carrier.69–71 Modules could then becompleted with pre-printed back-sheets to avoid tabbing andstringing that interconnect during the thermal process oflamination.72,73 In such a streamlined fabrication process, thepartially assembled module could foreseeably progress down aconveyor through in-line processing equipment at the center of
various materials streams, as opposed to robot arms movinginertia-rich modules from one batch process to another.
7.3 Platform innovation
Platform innovation on material systems that could replace c-Siprovide significant opportunities for capex reduction andprocess simplification by reducing the thermal budget, purityrequirements, and process complexity of manufacturing.Module-based glass substrates provide the additional benefitof a uniform form-factor throughout the manufacturing pro-cess, avoiding the inherently disparate steps of the c-Si supplychain shown in Fig. 3. We estimate that the capex for CdTemodule manufacturing is 0.80 to 0.85 $/WaCap at a moduleefficiency of 12.8% to 14.2%, a 20% reduction from current c-Si.However, at 15% module efficiency, roll-to-roll approaches withprinted ink absorbers provide a disruptively low estimatedcapex of 0.06 $/WaCap for the cell process equipment. We notethat this calculation is limited in scope, and that the capexconstraints of other steps of the supply chain (i.e., glass) couldlimit growth in this disruptive scenario. With these techno-logies, though, their ultimate MSP and field reliability areparamount to ultimate cost effectiveness.8
Shifting fixed costs to variable costs may also be achievedthrough optical concentration. For the same power rating, aconcentrator reduces the capex-intensive solar-cell area whileincreasing commodity materials (optics, mechanics, racking,heat management) – thus potentially reducing the WaCap requiredof traditional solar cell production per Wmodule. However, con-centrator optics and mechanics still require assembly, whichcould reduce the capex advantage of concentrators. There arealso non-capex considerations, including additional maintenancecosts and location-dependent energy yield.
7.4 Financial approaches
Lastly, financial approaches such as equipment leases andcontract manufacturing can reduce capital intensity and over-come barriers to entry for manufacturing. The one making theequipment available for lease must earn a suitable return, likelyincreasing the ultimate cost for the lessee, but a streamlinedprocess and reduced upfront barriers could benefit somemanufacturers, especially small innovators. Flexible productiontools with common components may aid in the effectiveness ofleasing by improving the capability to be repurposed. Addition-ally, manufacturing technologies that can repurpose existinginfrastructure, such as leasing generic buildings rather thanconstructing custom facilities with cleanroom space, may benefitfrom a capex advantage. In Fig. 3, facility costs are allocated toprocess steps by the area of floor space required in a customfacility that is purchased. The facility capex accounts for approxi-mately 16% of the total capex for a wafer, cell, and modulemanufacturer.
Contract manufacturing, or outsourcing, is another viableapproach to reducing capital intensity. The semiconductorindustry has implemented this approach were many ‘‘fabless’’firms design and sell components that are manufactured bya third party. These firms, like Apple Computer, can enjoy
Fig. 9 The glass manufacturing industry consolidated disparate steps ofmanufacturing into the streamlined float glass process over the course of80 years. The PV industry aspires to this example, yet, aims to accomplishsimilar streamlining over a much shorter time horizon. Figure adaptedfrom Utterback.60
Energy & Environmental Science Analysis
Ope
n A
cces
s A
rtic
le. P
ublis
hed
on 0
7 Se
ptem
ber
2015
. Dow
nloa
ded
on 1
8/02
/201
6 18
:46:
50.
Thi
s ar
ticle
is li
cens
ed u
nder
a C
reat
ive
Com
mon
s A
ttrib
utio
n 3.
0 U
npor
ted
Lic
ence
.View Article Online

3406 | Energy Environ. Sci., 2015, 8, 3395--3408 This journal is©The Royal Society of Chemistry 2015
reduced capital intensity (Fig. 5). The equipment must beowned by someone however, though further consolidationmay reduce investment risk by reducing the number of compe-titors that can potentially make bad investment decisions whilealso increasing barriers to entry through economies of scale.The relatively standardized process of c-Si PV production is ripefor this approach, and indeed many PV companies exist in alimited scope of the supply chain.
This approach opposes a vertically integrated company inwhich a manufacturer may own separate facilities for poly-silicon, wafer, cell, and module manufacturing. Reasons tovertically integrate include if adjacent companies in the supplychain have more market power and if integration would raisebarriers for other competitors.74,75 There has been a recenttrend of PV manufacturers integrating downstream to comeinto closure contact with customers. We note however, that thestage of the supply chain with the most customer contact doesnot always have the largest economic surplus.74 Integrationwill not necessarily hurt capital intensity if revenues increaseproportionally to the additional capex required to expand. Forexample, downstream diversification into services (system inte-gration, operation & maintenance) may provide an additionalavenue for PV companies to reduce their capital intensity.
Lastly, steps to reduce the WACC for a PV manufacturerthrough technology and business-model innovations wouldalso reduce the impact of capex on MSP. A focus on reliabilityis a technical goal that could support reduced WACC.
8. Conclusions
The current high capex of c-Si manufacturing has significantimplications on both the per-unit profitability and scalabilityof the PV industry. Capex related components compriseapproximately 22% of module MSP (0.19 $/W); and halvingcapex provides a significant opportunity to reduce MSP by 15%(0.13 $/W). We model a total capex for monocrystalline c-Simanufacturing of 1.01 $/WaCap from poly to module, with threeprocess steps contributing to 45% of the total capex: TCS,Siemens polysilicon CVD, and Czochralski growth.
Capex is high relative to the selling price of modules, whichwe define as the PP&E0 ratio. With our simulated manufacturer,the sustainable growth rate of PV manufacturing is limited toless than 19% per year at 15% operating margins, and 39% peryear at 25% operating margins. This is insufficient to keep pacewith current industry trends, leading to increased debt burdensof manufacturers. The capital intensity of the PV industry is notunprecedented however. The integrated circuit and other speci-alty manufacturers maintain high capital intensities, but withlower volatility than the PV industry, and often higher margins.
Opportunities are available to reduce the capital intensity ofc-Si manufacturing through both incremental process innovation,such as improving throughput (e.g., changing from Czochralski todirectionally solidified multicrystalline silicon reduces capex byB10%), and disruptive process innovation, such as epitaxiallygrown kerfless wafers directly from the gaseous phase with in situ
texturing and emitter formation, and monolithic module integra-tion. Platform innovations, such as ink-based approaches havethe potential to disruptively reduce capex for the PV manufacturer,but may expose capex constraints at other stages of the supplychain. With these approaches, material quality, module efficiency,and reliability are critical factors as well. Lastly, financialapproaches such as equipment leasing and contract manu-facturing can meaningfully reduce capital intensity.
Acknowledgements
In alphabetical order, we thank Austin Akey, Harry Atwater,Donald Chung, Karlynn Cory, Al Goodrich, Craig Hunter,Shaffiq Jaffer, Sriram Krishnan, Craig Lund, I. Marius Peters,Doug Rose, Jason Rugolo, Hans Peter Schaefer, Lidija Sekaric,BJ Stanberry, Dick Swanson, Libby Wayman, Greg Wilson, andEli Yablonovitch for insightful discussions. This work was self-funded, and funded in part by the National Science Foundation(NSF) and the Department of Energy (DOE) under NSF CA No.EEC-1041895 (MIT).
References
1 P. A. Basore, Understanding manufacturing cost influenceon future trends in silicon photovoltaics, IEEE J. Photovolt,2014, 4, 1477–1482.
2 A. Goodrich, et al., A wafer-based monocrystalline siliconphotovoltaics road map: utilizing known technologyimprovement opportunities for further reductions in manu-facturing costs, Sol. Energy Mater. Sol. Cells, 2013, 114,110–135.
3 G. F. Nemet, Beyond the learning curve: factors influencingcost reductions in photovoltaics, Energy Policy, 2006, 34,3218–3232.
4 R. M. Swanson, A vision for crystalline silicon photovoltaics,Prog. Photovoltaics, 2006, 14, 443–453.
5 H. Forstner, et al., International technology roadmap forphotovoltaic (ITRPV) 2013 results – revision 1, SemiconductorEquipment and Materials International, 2014.
6 D. M. Powell, et al., Crystalline silicon photovoltaics: a costanalysis framework for determining technology pathways toreach baseload electricity costs, Energy Environ. Sci., 2012, 5,5874–5883.
7 A. C. Goodrich, D. M. Powell, T. L. James, M. Woodhouseand T. Buonassisi, Assessing the drivers of regional trendsin solar photovoltaic manufacturing, Energy Environ. Sci.,2013, 6, 2811–2821.
8 D. M. Powell, M. T. Winkler, A. Goodrich and T. Buonassisi,Modeling the cost and minimum sustainable price ofcrystalline silicon photovoltaic manufacturing in the unitedstates, IEEE J. Photovolt, 2013, 3, 662–668.
9 U.S. Department of Energy, Sunshot vision study, 2012.10 C. T. Horngren, G. L. Sundem and F. H. Selto, Introduction to
management accounting, Prentice Hall, 1993.
Analysis Energy & Environmental Science
Ope
n A
cces
s A
rtic
le. P
ublis
hed
on 0
7 Se
ptem
ber
2015
. Dow
nloa
ded
on 1
8/02
/201
6 18
:46:
50.
Thi
s ar
ticle
is li
cens
ed u
nder
a C
reat
ive
Com
mon
s A
ttrib
utio
n 3.
0 U
npor
ted
Lic
ence
.View Article Online

This journal is©The Royal Society of Chemistry 2015 Energy Environ. Sci., 2015, 8, 3395--3408 | 3407
11 Capital budgeting cash flows, 2012, ch. 7, www.rdboehme.com/MBA_CF/Chapter07_emba.ppt.
12 C. T. Horngren, G. L. Sundem, W. O. Stratton, D. Burgstahlerand J. Schatzberg, Introduction to management accounting,Pearson Prentice Hall, 2008, pp. 332–342.
13 R. Fu, T. James and M. Woodhouse, Economic Measure-ments of Polysilicon for the Photovoltaic Industry: MarketCompetition and Manufacturing Competitivenss, IEEEJ. Photovolt, 2015, 5, 515–524.
14 Available at http://pv.mit.edu/TMA/.15 M. A. Green, Ag requirements for silicon wafer-based solar
cells, Prog. Photovoltaics, 2011, 19, 911–916.16 S. Lacey, How china dominates solar power, 2014, http://
www.theguardian.com/environment/2011/sep/12/how-china-dominates-solar-power.
17 Y. S. Zhang and S. Barnett, Fiscal vulnerabilities and risksfrom local government finance in china, IMF Working Paper,WP/14/4, 2014.
18 Y. Lu and T. Sun, Local government financing platforms inchina: a fortune or misfortune?, IMF Working Paper, WP/13/243, 2013.
19 S. J. Hassol, Questions and answers: emissions reductionsneeded to stabilize climate, The Presidential Climate ActionProject.
20 L. Bird, C. Chapman, J. Logan, J. Sumner and W. Short,Evaluating renewable portfolio standards and carbon capscenarios in the U.S. Electric sector, NREL Report No. TP-6A2-48258, 2010.
21 K. S. Cory and B. G. Swezey, Renewable portfolio standards inthe states: balancing goals and implementation strategies,NREL Report No. TP-670-41409, 2007.
22 International Energy Agency, Trends 2014 in photovoltaicapplications – survey report of selected IEA countriesbetween 1992 and 2013, Photovoltaic Power Systems Programme(PVPS), 2014.
23 P. A. Basore, D. Chung and T. Buonasissi, Economics offuture growth in photovoltaics manufacturing, Proceedings ofthe 42nd IEEE PVSC, New Orleans, LA, 2015.
24 R. C. Higgins, How much growth can a firm afford?, Fin.Manag., 1977, 6, 7–16.
25 M. M. Fonseka, C. G. Ramos and G.-l. Tian, The mostappropriate sustainable growth rate model for managersand researchers, J. Appl. Bus. Res., 2012, 28, 481–500.
26 A. Ashta, Sustainable growth rates: refining a measure,Strategic Change, 2008, 17, 207–214.
27 P. Dittmer, U.S. Corporations suffer high effective tax rates byinternational standards, Tax Foundation, 2011.
28 M. Z. Frank and V. K. Goyal, Trade-off and pecking ordertheories of debt, Social Science Research Network, 2007,available at SSRN: http://ssrn.com/abstract=670543.
29 H. Baker and G. Martin, Capital structure and corporatefinancing decisions – theory, evidence, and practice, JohnWiley & Sons, Inc., 2011, ch. 10.
30 K. Bradsher, Suntech unit declares bankruptcy, 2014, http://www.nytimes.com/2013/03/21/business/energy-environment/suntech-declares-bankruptcy-china-says.html.
31 M. Urdanick, A deeper look into yieldco, 2015, https://financere.nrel.gov/finance/content/deeper-look-yieldco-structuring.
32 SunEdison, Capital markets day, 2014.33 G. Festel, M. Wuermseher and G. Cattaneo, Valuation of early
stage high-tech start-up companies, Int. J. Bus., 2013, 18, 216.34 First Solar Inc., Form 10-k, 2006–2013.35 First Solar Inc., Financial statements, 2014, http://investor.
firstsolar.com/financials-statements.cfm.36 SunPower Corporation, Form 10-k, 2005–2013.37 Yingli Green Energy Holdings Company Limited, Form 20-f,
2007–2013.38 Trina Solar Limited, annual report, 2006–2013.39 ENERSYS, Form 10-k, 2005–2014.40 Intel Corporation, Form 10-k, 2007–2013.41 Apple Inc., Form 10-k, 2004–2014.42 Corning Inc., Form 10-k, 2004–2013.43 Alcoa Inc., Form 10-k, 2004–2013.44 Alcoa Inc., 2011 annual report.45 P. Mints, Top ten pv manufacturers from 2000 to present: a
pictorial retrospective, 2014, http://www.renewableenergyworld.com/rea/news/article/2014/01/top-ten-pv-manufacturers-from-2000-to-present-a-pictorial-retrospective.
46 C. Annis, More polysilicon plants still under constructiondespite enormous pv overcapacity – why?, 2014, http://www.solarbuzz.com/resources/blog/2013/03/more-polysilicon-plants-still-under-construction-despite-enormous-pv-overcapacity-why.
47 M. Osborne, Rec silicon expanding polysilicon production andmulling 20 000 mt jv in saudi arabia, 2014, http://www.pv-tech.org/news/rec_silicon_expanding_polysilicon_production_and_mulling_20000mt_jv_in_saud.
48 D. Feldman, et al., Photovoltaic system pricing trends:Historical, recent, and near-term projections 2014 edition,NREL Report No. PR-6A20-62558, 2014.
49 M. A. Adelman, Comment on the ‘‘h’’ concentration measureas a numbers-equivalent, Rev. Econ. Stat., 1969, 51, 99–101.
50 R. A. Arnold, Microeconomics, Cengage Learning, 2013.51 M. Porter, The five competitive forces that shape strategy,
Harvard Business Review, 2008.52 U.S. Energy Information Administration, International
energy statistics, 2014, http://www.eia.gov/cfapps/ipdbproject/IEDIndex3.cfm?tid=2&pid=2&aid=7.
53 A. Kreutzmann and M. Schmela, Emancipation from sub-sidy programs: centrotherm builds first grid-parity factory -while simultaneously underscoring the necessity of continuedsubsidies, Photon Int., 2008, 12, 84–92.
54 D. Franke, T. Rettelbach, C. Haßler, W. Koch and A. Muller,Silicon ingot casting: process development by numericalsimulations, Sol. Energy Mater. Sol. Cells, 2002, 72, 83–92.
55 D. P. Fenning, et al., Improved iron gettering of contami-nated multicrystalline silicon by high-temperature phos-phorus diffusion, J. Appl. Phys., 2013, 113, 214504.
56 P. A. Basore, Personal communication, 2014.57 D. W. Jimenez, Cost of ownership and overall equipment
efficiency: a photovoltaics perspective, Photovoltaics Int.,2009, 6, 16–22.
Energy & Environmental Science Analysis
Ope
n A
cces
s A
rtic
le. P
ublis
hed
on 0
7 Se
ptem
ber
2015
. Dow
nloa
ded
on 1
8/02
/201
6 18
:46:
50.
Thi
s ar
ticle
is li
cens
ed u
nder
a C
reat
ive
Com
mon
s A
ttrib
utio
n 3.
0 U
npor
ted
Lic
ence
.View Article Online

3408 | Energy Environ. Sci., 2015, 8, 3395--3408 This journal is©The Royal Society of Chemistry 2015
58 D. P. Fenning, et al., Darwin at high temperature: advancingsolar cell material design using defect kinetics simulationsand evolutionary optimization, Adv. Energy Mater., 2014,4, 1400459.
59 T. T. Nagle and J. E. Hogan, The strategy and tactics of pricing: aguide to growing more profitably, Pearson Prentice Hall, 2006.
60 J. M. Utterback, Mastering the dynamics of innovation, HarvardBusiness School Press, 1996.
61 T. S. Ravi, Technology development for high-efficiency solarcells and modules using thin (o80 mm) single-crystal siliconwafers produced by epitaxy, NREL Subcontract Report: NREL/SR-5200-58593, 2013.
62 E. M. Sachs, et al., Methods for efficiently making thinsemiconductor bodies from molten material for solar cellsand the like, U.S. Pat., 8,293,009 B2, 2012.
63 J. Surowiecki, Uk: The billion dollar blade, 2015, http://www.managementtoday.co.uk/news/411367/UK-billion-dollar-blade.
64 H. P. Schaefer, High-speed, high-precision manufacturing, MITLaboratory for Manufacturing and Productivity SeminarSeries, 2012.
65 S. Malone, Manufacturing can thrive but struggles for respect,2015, http://www.reuters.com/article/2011/12/14/us-usa-manufacturing-respect-idUSTRE7BD1WR20111214.
66 K. Van Nieuwenhuysen, et al., High-quality epitaxial foils,obtained by a layer transfer process, for integration in back-contacted solar cells processed on glass, PhotovoltaicSpecialists Conference (PVSC), 38th IEEE, Austin, TX,2012, pp. 001833–001836.
67 R. Brendel, R. Auer and H. Artmann, Textured monocrystal-line thin-film si cells from the porous silicon (psi) process,Prog. Photovoltaics, 2001, 9, 217–221.
68 D. M. Powell, et al., Effective lifetimes exceeding 300 ms ingettered p-type epitaxial kerfless silicon for photovoltaics,Appl. Phys. Lett., 2013, 103, 263902.
69 R. Brendel, Thin-film crystalline silicon mini-modules usingporous si for layer transfer, Sol. Energy, 2004, 77, 969–982.
70 J. H. Petermann, H. Schulte-Huxel, V. Steckenreiter,S. Kajari-Schroder and R. Brendel, Principle of module-level processing demonstrated at single a-si:H/c-si hetero-junction solar cells, IEEE J. Photovoltaics, 2014, 4,1018–1024.
71 V. Steckenreiter, R. Horbelt, D. N. Wright, M. Nese andR. Brendel, Qualification of encapsulation materials formodule-level-processing, Sol. Energy Mater. Sol. Cells,2014, 120(part A), 396–401.
72 M. Spath, P. C. d. Jong, I. J. Bennett, T. P. Visser andJ. Bakker, A novel module assembly line using back contactsolar cells, presented at the 33rd IEEE PVSC, San Diego, CA,2008.
73 S. A. Mann, M. J. de Wild-Scholten, V. M. Fthenakis,W. G. J. H. M. van Sark and W. C. Sinke, The energy pay-back time of advanced crystalline silicon pv modules in2020: a prospective study, Prog. Photovoltaics, 2014, 22,1180–1194.
74 J. Stuckey and D. White, When and when not to verticallyintegrate, 2015, http://www.mckinsey.com/insights/strategy/when_and_when_not_to_vertically_integrate.
75 S. Boyson and C. Han, Eras of enterprise globalisation: fromvertical intergration to virtualisation and beyond, in Multi-national corporations and the mergining network economyin asia and the pacific, ed. J. J. Palacios, Routledge, 2008,pp. 26–57.
Analysis Energy & Environmental Science
Ope
n A
cces
s A
rtic
le. P
ublis
hed
on 0
7 Se
ptem
ber
2015
. Dow
nloa
ded
on 1
8/02
/201
6 18
:46:
50.
Thi
s ar
ticle
is li
cens
ed u
nder
a C
reat
ive
Com
mon
s A
ttrib
utio
n 3.
0 U
npor
ted
Lic
ence
.View Article Online