the compelling facts about plastics 2009 · the supermarket loosely-packed fruits and vegetables...
TRANSCRIPT
1
The Compelling Facts About Plastics 2009An analysis of European plastics production, demand and recovery for 2008
2
2008 – At a glance
2
Global production fell back in 2008 to 245 million
tonnes from 260 in 2007 on the back of the
financial crisis. The plastics industry experienced
a dramatic 3rd and 4th quarter triggered by the
economic crisis – more for those serving capital
markets and less in daily consumables.
Europe produced 60 million tonnes and remained
a major region contributing about 25% of the
global total.
The plastics industry – plastic producers, converters
and machine manufacturers – employed 1.6 million
people and many times more in industries depending
on plastics for their business. The plastics producers
and converters also contributed together around
13 billion € in trade surplus to EU27 which helped to
reduce the 242 billion € trade deficit for the whole
industry in 2008.
Demand by European converters fell back 7.5%
to 48.5 million tonnes in 2008.
Waste generation increased by just under 1%.
Both recycling and energy recovery increased
to drive total recovery rate for plastics to 51.3%
and disposal at landfill down to 48.7% thereby
opening up a gap of 2.6%. Recycling increased
by 4.3% over 2007, a lower year-on-year increase
than in recent years, reflecting the severe impact
of the economic crisis on this sector. Energy
recovery increased 3.6% over 2007.
Seven of the EU Member States plus Norway and
Switzerland recover more than 80% of their used
plastics. These countries adopt an integrated
resource management strategy using a range of
complementary options to address each different
waste stream with the best environmental and
economic option.

3
Table of contents •Plasticsprotecttheclimate,boostresource
efficiency and give us a safer life
•Plastics’significantcontributionto
the sustainable use of resources
•Plasticsproductionandconverterdemand
in a global context
•ProductionanddemandinEurope
•Plasticsdemandbyconvertersperpolymer
and application
•Plasticstrade–astrongcontributor
to European wealth
•Plasticssupplychainfromcradletocradle
•Plasticscontinuetodecouplegrowthindemand
from material to landfill
•Slowbutsteadyprogresstowardsdiverting
plastics waste from landfill
•Voluntaryinitiativestostimulate
themechanicalrecyclingofPETbottles
•Newtrendsinrecoveryofpackaging
•MechanicalrecyclingoffoodgradeHDPEintheUK
•Mechanicalrecyclingofagriculturalfilm
– a Norwegian success story
• Feedstockrecycling
•EnergyfromWaste
•TheGreaterManchesterwastemanagement
solution – a model for diverting waste from landfill?
•Plasticproducts,applicationsandgoods–
enablers of innovation in society
•Recoverytrendsbyapplication
•Methodology
•Whoarewe?
•Snapshots2009
Page 4
Page 5
Page 6
Page 6
Page 7
Page 8
Page 10
Page 11
Page 12
Page 13
Page 13
Page 14
Page 15
Page 15
Page 16
Page 17
Page 18
Page 20
Page 21
Page 22
Page 23

4
Plastics protect the climate, boost resource effi ciency and give us a safer life
Plasticsplayasignificantroleintheenvironmental,
societal and economic dimensions of sustainable
development. Our modern lifestyle would not be
possiblewithoutplastics.Plasticsmeettheneedsof
society by enabling the eco-efficient manufacture of
many valuable products. E.g. protective packaging, light
and safe materials in cars , mobile phones, insulation
materials in buildings, medical devices, and important
parts for applications as different as renewable energy
production and protection in extreme conditions.
Climate protection
In cars, around 40% of plastics used contribute
to weight reduction, saving fuel and reducing CO2
emissions. A further 60% of the weight of the plastics
used enhance comfort and safety. The weight reduction
from plastic in a modern car saves over 500l of fuel over
150.000km. In an Airbus A380, high performance plastic
composites reduce passenger costs per seat as the
lighter weight results in lower fuel consumption.
Homesandbuildingsstaywarm(orcool!)withplastic
insulation. Nearly 40% of all primary energy consumed
globally is used in buildings. Efficient insulation is a
keypriorityinreachingtheKyototargets.
Lightweight plastic packaging reduces both the weight of
transporting goods and the amount of packaged goods
that go to waste – both of which reduce CO2 emissions.
Plasticsenabletherotorsinwindturbinestobelonger
and more effective; and components in solar panels to
increase their efficiency.
Resource efficiency
Without plastic packaging, it is estimated that the
tonnage of alternative packaging materials would
increase by a factor of 4, greenhouse gas emissions
byafactorof2,costsbyafactorof1.9,energyuseby
afactorof1.5andwastebyafactorof1.9involume.
As the use of plastics continues to grow, this effect
would increase each year.
Plasticspackagingalsosavesresources.Itprotects
food as it travels from farm to supermarket and into
ourkitchens.Forexample,inthedevelopingworld
50% of food is wasted between farm and kitchen; at
the supermarket loosely-packed fruits and vegetables
create 26% more waste than pre-packed produce; 1.5g
of plastics film extends the shelf life of a cucumber
from3to14days.Some10gofmultilayerfilminaMAP
(modifiedatmosphericpackaging)formeatextends
shelf life from a few days to over a week. The amount
of CO2 used to produce a single portion of meat is
almost 100 times more than that used to produce the
multilayer film.
Innovative design uses plastics for the outer drum of
washing machines, reducing both water and energy
consumption.Plasticpipesensuretheefficient,safe
and leak-free transportation of drinking water and
sewage without any waste or contamination.
Plastics make life safer
Plasticsprotectusfrominjury–inthecar,working
as a fire fighter or when skiing. Car airbags and
motorcyclists’helmetsaremadeofplastics;asis
the protective clothing for most motorcyclists.
Anastronaut’ssuitmustsustaintemperaturesfrom
-150degreesCelsiusto+120degrees.Firefightersrely
upon flexible plastics clothing which protects against
high temperatures and ventilates.
Plasticsprotectourfoodanddrinkfromcontamination.
Plasticsflooringandfurnitureareeasytoclean.This
prevents the spread of bacteria and reduces the cost of
maintenance, e.g. in hospitals. In medicine, plastics are
used for blood pouches and tubing, artificial limbs and
joints, contact lenses and artificial cornea, dissolving
stitches, splints and screws that heal fractures. Soon
nanopolymers will carry medicines directly to damaged
cells and micro-spirals will be used to combat coronary
disease. Artificial, plastic based blood is also being
developed to complement natural blood.

5
Reduce
The use of plastics saves energy and reduces CO2
emissions.Fromalifecycleperspective,ifallplastics
in all applications were substituted with a mix of
alternative materials, 22.4 million additional tonnes
of crude oil would be needed each year.
This means additional greenhouse gas emissions that
are30%oftheEU27Kyototargetfor2000-2012.
Plasticsreducewastebyprovidingmanyresource-
effective solutions. This includes lowering energy
consumption during production and reducing the
plastics material needed for a particular job. There is
also less waste of packaged goods, be it food, water
oracomputer(e.g.lighterbottlesforwater,soft
drinksordetergentsandthinnerpackagingfilm).
Reuse
Plasticsarereusedinmanyways.Plasticssoftdrink
bottles are reused in many Member States. Carrier bags
are reused in a variety of ways and plastic supermarket
trays provide a clean, robust and cost-effective way of
transporting fresh food from producer to customer.
Recycle
Plasticrecyclingisincreasingeveryyear.Apartfrom
familiar applications like recycling bottles and industrial
packaging film, there are also new developments e.g.
theRecovinylinitiativefromtheVinyl2010programme
ofthePVCindustry(coveringpipes,windowframes,
roofingmembranesandflooring).
Another example being tested in some Member States
is “mixed packaging plastics”.
This important development must continue. The
full potential of existing recycling streams must be
realised and new eco-efficient streams developed.
Recover
With existing and emerging applications there will
always be items which cannot be recycled in an eco-
efficient way:
Fortheseend-of-lifestreamsplasticsofferanadditional
advantage–energyrecovery.Plasticsenablemany
vital primary fossil fuel substitution from oil well to
final energy uses such as heat cooling and electricity.
As long as fossil fuels continue to be used for energy
production, plastics will provide more value to society
when end-of-life plastics are not landfilled.
Landfill and disposal must be minimised. This is a waste
of valuable resources and adds to greenhouse gases.
Plastics’ significant contribution to the sustainable use of resources
The vision of the 4 partners for a forward-looking resource management approach:
• Minimise disposal of plastics waste to landfill
• Use a mix of recovery options for the best environmental and economic result in every situation
• Treatment and recovery of waste should meet defined environmental standards
• Overall lifecycle impact taken into consideration

6
Rest of Asia16.5%
NAFTA23.0%
Germany7.5%
Spain1.5%
UK 1.5%
Italy 2.0%
France 3.0%
Benelux 4.5%
Other EU 27+N, CH5.0%China
15.0%
Latin America4.0%
Japan5.5%
CIS 3.0%
Middle East, Africa8.0%
245 Mtonne
Europe 25.0%, 60 Mio t
Includes Thermoplastics, Polyurethanes, Thermosets, Elastomers, Adhesives, Coatings and Sealants and PP-Fibers. Not included PET-, PA- and Polyacryl-Fibers
0
1950 1960 1970 1980 1990 2000
50
100
150
200
250
300
Mtonne
1950: 1.5
2008: 601976: 50
1989: 100
2002: 2002008: 245
World
Europe
Figure1.Worldplasticsproduction1950-2008 Source:PlasticsEuropeMarketResearchGroup(PEMRG)
139
105
46
NAFTA 2.8 % Western Europe
136
99
40
3.2 % Central Europe + CIS
48
24
9
7.3 % Latin America
32
7
21
4.3 % Middle East / Africa
1610
3
4.1 % Asia w/o Japan
3620
2
6.0 %Japan
10889
50
1.9 %
1980 2005
CAGR* in % 2005 - 2015e
*) Compound annual growth rate
2015 estimates
45
11
30
Total World 4.1 %
Figure2.Plasticsdemandbyconvertersinkgpercapitaperregion Source:PlasticsEuropeMarketResearchGroup(PEMRG)
Figure3.Worldplasticsproduction2008bycountryandregion Source:PlasticsEuropeMarketResearchGroup(PEMRG)
Since1950,globallytherehasbeenanaverageannualincreaseinthe
productionandconsumptionofplasticsof9%.Thishasbeendrivenby
atrackrecordofcontinuousinnovation.From1.5milliontonnesin1950,
totalglobalproductionreached245milliontonnesin2008(seeFigure1).
This continued growth was reversed in 2008 as a direct consequence of
the global financial crisis which has affected virtually all sectors.
An analysis of plastic materials consumption on a per capita basis shows
thatthishasnowgrowntoapproximately100kgperyearinNAFTAand
Western Europe. These regions have the potential to grow to approximately
140kg per capita by 2015. The biggest potential growth area is the rapidly
developingAsiancountries(excludingJapan),wherecurrentpercapita
consumption is only around 20kg.
In Europe, new Member States are expected to see the biggest percentage
increase, as their economies develop.
Europe produces approximately 60 million tonnes
of plastics, representing 25% of the global plastics
production.ThisisslightlymorethanNAFTA(23%).
Plasticproductionfacilitiesarewellplacedacross
Europe. Germany is the major producer, accounting for
7.5%ofglobalproductionfollowedbyBenelux(4.5%),
France(3%),Italy(2%)andtheUKandSpain(1.5%)
(Figure3).
Plastics production and converter demand in a global context
Production and demand in Europe
139
105
46
NAFTA 2.8 % Western Europe
136
99
40
3.2 % Central Europe + CIS
48
24
9
7.3 % Latin America
32
7
21
4.3 % Middle East / Africa
1610
3
4.1 % Asia w/o Japan
3620
2
6.0 %Japan
10889
50
1.9 %
1980 2005
CAGR* in % 2005 - 2015e
*) Compound annual growth rate
2015 estimates
45
11
30
Total World 4.1 %
Europe 25.0%, 60 Mtonne
245 Mtonne

7
Others20.0%
PVC12.0%
LDPE, LLDPE17.0%
HDPE11.0%PUR
7.0%
PS, EPS8.0%
PET7.0%
PP18.0%
48.5 Mtonne* EU27+N, CH incl. Other Plastics (~6 Mio t)
Others28%
Building & Construction 21%
Packaging38%
E & E 6%
Automotive7%
48.5 Mtonne* EU27+N, CH incl. Other Plastics (~6 Mio t)
Austria
Belgium & Lux.
Bulgaria
Cyprus
Czech Republic
Denmark
Estonia
Finland
France
Germany
Greece
Hungary
Ireland
Italy
Latvia
Lithuania
Malta
Netherlands
Poland
Portugal
Romania
Slovakia
Slovenia
Spain
Sweden
UK
Norway
Switzerland10 2 3 4 5 6 7 8 9 10 11 12 13
Figure4.Plasticsdemandbyconverters:breakdownbycountry
inEurope(Mtonne)2008 Source:PlasticsEuropeMarketResearchGroup(PEMRG)
Figure5.Plasticsdemandbyconverters2008:
breakdown by types in Europe Source:PlasticsEuropeMarketResearchGroup(PEMRG)
Figure6.Plasticsdemandbyconverters2008:
breakdown by end use segments in Europe Source:PlasticsEuropeMarketResearchGroup(PEMRG)
PlasticsdemandbyconvertersinEuropewas48.5
million tonnes in 2008. The demand is, expressed
as tonnage of virgin resin processed by European
convertersbycountry(SeeFigure4).Themajor
countries are Germany and Italy, together accounting
for around 40% of the European conversion to plastic
products.OfthenewMemberStates,Polandhasthe
highest plastic conversion rate 2.55 million tonnes of
theEuropeantotal).FollowedbytheCzechRepublicat
1.05milliontonnesandHungaryat0.84milliontonnes.
The converting industries in many of the new Member
States are expected to grow above the average of the
old Member States in the coming years.
demand. During 2008 all these groups saw a drop
in demand – ranging from 1 to 11% – with an average
around7.5%(Figure5).
Packagingremainsthebiggestend-useforplastics
(38%)followedbyBuildingandConstruction(21%).
Automotive(7%),Electrical&Electronic(6%).Other
applications, which include medical and leisure,
use28%.(SeeFigure6).
Plastics demand by converters per polymer and application
There are around 20 distinct groups of plastics, each
with numerous grades available to help make the best
choice for each specific application. There are five
high-volumeplasticsfamilies;polyethylene(including
lowdensity(LDPE),linearlowdensity(LLDPE)andhigh
density(HDPE)),polypropylene(PP),polyvinylchloride
(PVC),polystyrene(solidPSandexpandableEPS)and
polyethyleneterephthalate(PET).Togetherthebig
five account for around 75% of all European plastics
48.5 Mtonne* EU27+N, CH incl. Other Plastics (~6 Mtonne)
48.5 Mtonne* EU27+N, CH incl. Other Plastics (~6 Mtonne)

8
Plasticscontributetosustainabledevelopmentand
bring quality of life to citizens. As an example plastics
make many goods in our daily life more affordable and
reduce the wastage of many valuable resources.
Theplasticsindustry(polymerproducers–represented
byPlasticsEurope,converters–representedbyEuPC
andmachinemanufacturers–representedbyEUROMAP)
within the EU27 provide employment to 1.6 million
people – two thirds of the number of employees in the
automotive sector – and indirectly to many times more
in industries which are enabled or depend on plastics
for their products.
Leisure shoes, sports garment and equipment,
electronic goods like the mobile phone – to give a
few examples – would not be so convenient or so
affordable was it not for the plastics used in their
design and manu facturing.
In addition the plastics industry(1) add wealth to the
EU27 by exporting more in value and volume terms
than what is being imported from outside the EU27.
The EU27 is therefore a net exporter of both primary
plasticsandconvertedplasticsproducts(plasticsin
non-primaryforms).
Plastics trade – a strong contributor to European wealth
1.4
1.2
1
0.8
0.6
0.4
0.2
0
0.30
0.25
0.20
0.15
0.10
0.05
0
EU27 Export Primary Plastics
EU27 Import Primary Plastics
EU27 Net Export Primary Plastics
Mtonne
EU27 Export Plastics Products
EU27 Import Plastics Products
EU27 Net Export Plastics Products
Mtonne
2002 2003 2004 2005 2006 2007 May 20092008 2002 2003 2004 2005 2006 2007 May 20092008
Figure7.EU27-TradewithPrimaryPlastics(SITC57)
withnon-EUCountries(ExtraEU),trendcycle
Figure8.EU27-TradewithPlasticsProducts(SITC58)
withnon-EUCountries(ExtraEU),trendcycle

9
This attractive position has been achieved by a constant
focus on cost effectiveness, quality management and by
embracing new technologies combined with innovation
and customer focus.
Figure7(onpage8),showstheEU27export,import
andnetexportofprimaryplastics(SITC57)from2002
uptoMay2009withnon-EUcountries.In2008thenet
export amounted to 6.8 million tonnes with a value of
about 8.7 billion €.
The corresponding development for converted
plasticproducts(SITC58)isshowninfigure8and
demonstrates a net export of 1.2 million tonnes with
an value of 4.4 billion €.
The trend for both primary plastics and the converted
plastics products was down during the fourth quarter
2008 reflecting the beginning of the severe recession in
plastics which hit the EU27 plastics industry very heavily.
Thedeteriorationhashoweverbeenreversedin2009.
In 2008 the plastics industry(1) created an EU27 trade
surplus with non-EU countries worth around 13 billion €.
Since 2002 the surplus has increased steadily
as shown by the graph below whilst the total EU
industry(2) net trade has shown a growing deficit.
The strong net export position of the EU27 plastics
industry is constantly challenged by international
competition. Many of the progressive legislative
initiatives in EU27, which are often in advance of other
parts of the world, mean that the plastics industry is
often under pressure to be able to remain globally
competitive. It is therefore important that new initiatives
are carefully framed to try to maintain a level playing
field and balance environmental, economic and social
considerations.
If EU27 moves too fast, without consideration of the
market impact, in introducing new initiatives, then
there is a risk that the strong contribution by the EU27
plastics industry – and indirectly by the many dependent
industries mentioned above – will deteriorate over time
with job losses and adverse social consequences.
1SITC(StandardInternationalTradeClassificationoftheUnitedNations)57+58
2TotalindustrySITC0-9
+20
0
-20
-40
-60
-80
-100
-120
-140
-160
-180
-200
-220
-240
-260
7.2 7.2 9.6 11.4 12.6 12.8
2002 2003 2004 2005 2006 2007 2008
13.2
-192.5
-242.9
-45.1-66.0
-74.6
-126.8
-192.4
Total Industry (SITC 0-9) Plastics Industry (SITC 57 & 58)
Surplus: + Deficit: -
Figure9.EU27-TradeBalancewithnon-EUCountries(ExtraEU)
TotalIndustry(SITC0-9)comparedtothePlastics
Industry(SITC57&58)inbillion€
10
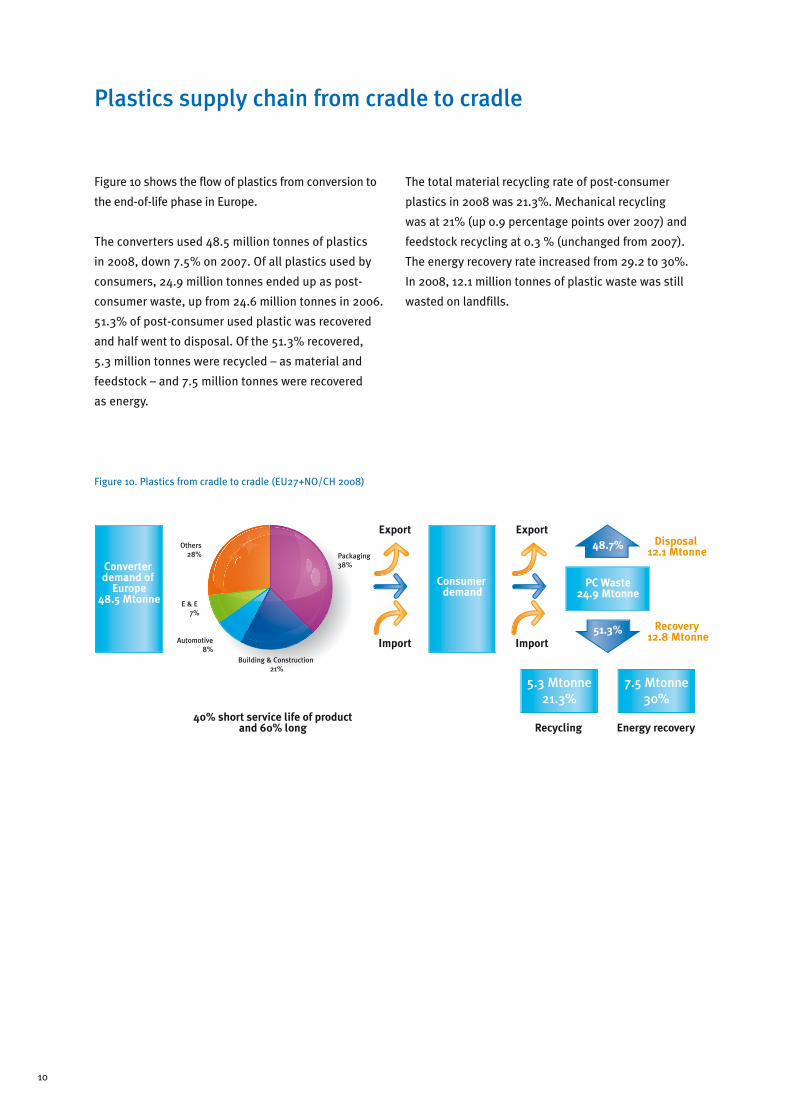
Figure10showstheflowofplasticsfromconversionto
the end-of-life phase in Europe.
The converters used 48.5 million tonnes of plastics
in 2008, down 7.5% on 2007. Of all plastics used by
consumers,24.9milliontonnesendedupaspost-
consumer waste, up from 24.6 million tonnes in 2006.
51.3% of post-consumer used plastic was recovered
and half went to disposal. Of the 51.3% recovered,
5.3 million tonnes were recycled – as material and
feedstock – and 7.5 million tonnes were recovered
as energy.
The total material recycling rate of post-consumer
plastics in 2008 was 21.3%. Mechanical recycling
wasat21%(up0.9percentagepointsover2007)and
feedstockrecyclingat0.3%(unchangedfrom2007).
Theenergyrecoveryrateincreasedfrom29.2to30%.
In 2008, 12.1 million tonnes of plastic waste was still
wasted on landfills.
Plastics supply chain from cradle to cradle
Figure10.Plasticsfromcradletocradle(EU27+NO/CH2008)
Converter demand of
Europe48.5 Mtonne
Consumer demand
PC Waste24.9 Mtonne
Recycling Energy recovery
5.3 Mtonne21.3%
7.5 Mtonne30%
Recovery 12.8 Mtonne
Others28%
Building & Construction 21%
Packaging38%
E & E 7%
Automotive8%
40% short service life of productand 60% long
Disposal 12.1 Mtonne
Export48.7%
51.3%
Export
Import Import

11
Despite 3% annual growth in the past decade for
post-consumer waste, landfill amounts have remained
stable.Figure11showsthehistoryforEU15+NO/CH
untilto2004andforEU27+NO/CHfrom2005.There
are many reasons for the growth of post-consumer
plastic waste; plastics continue to replace alternative
materials, economic growth drives greater consumption,
smaller households require more packaging per person
and proportionally more ready-made single-portion
meals are consumed.
Figure12showsthegrowthofbothmechanical
recycling and energy recovery. Over the last decade
the average annual growth rate has been about 10%.
Mechanical recycling increased by 4.3% which is down
compared to 2007 due to the impact of the financial
crisis. Growth in energy recovery increased 3.6% up
slightly on 2007. More investment in energy recovery
facilities is needed to divert streams which cannot be
eco-efficiently recycled from landfill.
Plastics continue to decouple growth in demand from material to landfill
Figure11.Continueddecouplingofplasticswasteandlandfill
1996 1997 1998 1999 2000 2001 2002 2003 2004 2005 2006 2007 2008
30,000
25,000
20,000
15,000
10,000
5,000
0
Total post-user plastics waste Disposal
1995 1996 1997 1998 1999 2000 2001 2002 2003 2004 2005 2006 2007 2008
8,000
7,000
6,000
5,000
4,000
3,000
2,000
1,000
0
Energy Recovery Mechanical Recycling Feedstock Recycling
Figure12.Strongcontinuedgrowthofrecyclingandenergyrecovery
Mto
nne
Mto
nne
Growth rate 1996-2008
~3.0%/year
ThefigureshowsthehistoryforEU15+NO/CHuntil2004andforEU27+NO/CHfrom2005onwards.
ThefigureshowsthehistoryforEU15+NO/CHuntil2004andforEU27+NO/CHfrom2005onwards.
~9.6%/year
-1.1%/year
~11.0%/year
- 5.6%/year
Growth rate 1996-2008: ~9.9%/year

0% 20% 40% 60% 80% 100%
Recycling rate 2008 Energy Recovery rate 2008
SwitzerlandDenmarkGermanySwedenBelgium
AustriaNetherlands
NorwayLuxemburg
FranceItaly
SlovakiaHungary
FinlandCzechia
SpainPortugal
EstoniaUK
SloveniaIreland
LatviaRomania
PolandBulgaria
MaltaCyprus
LithuaniaGreece
Figure13.Recyclingandenergyrecoveryratepercountry
12
Material recycling and energy recovery of post-
consumer plastics waste are very different by country.
In Switzerland, Germany, Sweden and Denmark there
is very little landfill. These countries have almost
completed their diversion-from-landfill strategy.
ArecentstudybytheSwissconsultancyPrognos(1)
showedthat7%oftheEUKyototargetforgreenhouse
gas(GHG)emissionscouldbesavedifallwaste
currently going to landfill was moved to a combination
of recycling and energy recovery. The best results were
achieved without specific targets but with full flexibility
to explore recycling and energy recovery for each waste
stream.InadditiontosavingGHGemissions,diversion
from landfill helps increase resource efficiency and
energy security, while reducing litter.
Figure13showsthatcountrieswithhighrecovery
rates score highly on both recycling and energy
recovery. This means that a strategy which includes
energy recovery is not contradictory to achieving good
recycling results. A complete resource management
strategy, therefore, needs to address both areas.
No country can recycle all post-consumer waste.
Figure13alsoshowsthatwhilstrecyclingperformance
is similar across most European countries there are
big differences in the utilisation of energy recovery.
Countries which depend on landfills must not only
maximise their full recycling potential but also quickly
expand their energy-from- waste network.
Diversion from landfill progress is, on average, slow.
Recycling(mechanical+feedstock)acrossEurope
increased from 20.4% in 2007 to 21.3% in 2008.
Energyrecoveryincreasedfrom29.2%in2007to
30% in 2008. Significant efforts are necessary in
many Member States if they are to maximise the full
potentialofadiversionfromlandfillstrategy(e.g.
GHGemissionsavings,enhancedresourceefficiency
andenergysecurityandavoidinglandfillpenalties).
Slow but steady progress towards diverting plastics waste from landfill
0% 20% 40% 60% 80% 100%
Recycling rate 2008 Energy Recovery rate 2008
SwitzerlandDenmarkGermanySwedenBelgium
AustriaNetherlands
NorwayLuxemburg
FranceItaly
SlovakiaHungary
FinlandCzechia
SpainPortugal
EstoniaUK
SloveniaIreland
LatviaRomania
PolandBulgaria
MaltaCyprus
LithuaniaGreece
1http://www.prognos.com/Singleview.306+M5c828d79ff6.0.html
Total Recovery Ratio by Country 2008 (referredtoPost-ConsumerPlasticWaste)

13
PETbottlecollectioninEuropeissteadilyincreasing;
about40%ofallPETbottlesarenowcollectedfor
recycling. This recycling rate must continue to increase
especially in high value applications like food packaging.
AgoodbalancebetweennewPETbottletechnologies
and recyclability is needed. Consequently, several
EuropeanorganisationsinvolvedinthePETrecyclechain
haveformedtheEuropeanPETBottlePlatform(EPBP).
This voluntary initiative, aimed at the packaging
industry,willassesstheimpactofnewPETbottle
designsonrecyclability.This‘front-end’evaluation
willhelptomaintainthesustainabilityofPET
recycling industry in Europe.
EPBPmembersincludetherecyclingstakeholders
suchasPETproducers,bottlemakers,beverage
producers, recovery organisations and recyclers.
EPBP’sfocusistoevaluatetechnologies/productsand
encouragenewPETbottleinnovationstoensurethat
thesuccessofPETrecyclingisnotcompromised.
PETbottlerecyclabilitywillbepromotedby:
• CreatingharmonisedEuropeanguidelinesforPET
bottle recyclability via protocol development;
• EncouragingtheindustrytotestnewPETbottle
concepts/materialsbeforemarketlaunch;
• Providingstakeholderguidanceandrecommendations;
• Sharingknowledgeacrossthevaluechain.
To enable an independent evaluation of new techno-
logiesandtheirimpactonrecycling,thePlatform
includestechnicalexpertsfromPETproduction,design
andrecycling.EPBPhasestablishedtestprocedures
to assess the recycling profile of new packaging
technologies. e.g. barriers, additives, closures,
labels,etc.Productspassingthesetestswillbegiven
approvalthusensuringthatPETrecyclingcontinuesto
build on its successful track record.
Formoreinformationvisitwww.petbottleplatform.eu.
Voluntary initiatives to stimulate the mechanical recycling of PET bottles
Many plastics pots, tubs and trays are made from
Polypropylene(PP),Polystyrene(PS)andPolyvinyl-
chloride(PVC).Thosepackagesareusedforpacking
fruits, dairies, ice-cream and many others type of food.
When looking into what could be done beyond bottle
recycling(e.g.HDPEandPETbottles),severalEPRO
members have found out that the remaining rigids
plastics present in the selective collections are mainly
composedoftworesins;PPandPS.
InFrance,forexample,marketevaluationsandsorting
centre analysis have demonstrated that about 40% of
therigidplasticsarecomposedofPPand20%ofPS,
therestbeingsplitbetweenPET,HDPEandPVC.
The next question is then if, and how, these packages
could be sorted, reclaimed and then recycled in new
applications.
SomecountriessuchasGermany,ItalyandtheUK
have already automatic sorting facilities capable of
sorting out these packages. Once sorted, they can be
sent to reclaimers, which have similar washing lines
like bottle recyclers, equipped with grinding, washing,
drying and in some cases extruding equipment. The
reprocessed flakes or pellets can then be used to
replace virgin material in new applications, such as
hangers, flower pots, pallets, crates and car parts.
EPROiscurrentlyundertakingtestswithPlasticsEurope
to define which further applications could be reached
with these recyclates, and what kind of extra equipment
(ifany)itwouldtakeforthereclaimer/recyclertoreach
those new markets.
New trends in recovery of packaging

14
TheUKhasconductedmuchresearchanddevelopment
inrecentyearsonrecyclingHDPEmilkcontainers
into recompounded pellets suitable for use in food
gradeapplications.ResearchcommissionedbyWRAP
(theWaste&ResourcesActionProgramme)suggests
thatproducingfoodgradeHDPEisbothtechnically
achievable and commercially viable.
This research, along with interest from the plastics
recycling industry, has been driven by demand for food
grade polymer from plastic bottle converters. These
includeNampakwhomanufacturemostoftheUK’s
plastic milk containers, and retailers, including Marks
and Spencer.
The first two plants capable of producing food grade
HDPEpelletscameonstreamduring2008.Asmore
UKreprocessorsbegintoinstallequipmentproduction
will increase further. To date, Nampak has signed
supply contracts for 24,000 tonnes per annum of food
gradeHDPEfromUKreprocessors.Thisshouldenable
the company to meet its target of using 30% recycled
HDPEinallitsplasticmilkcontainersby2010.
Unlike other European countries, the production
offoodgradeHDPEintheUKishelpedbythehigh
percentageofnaturalHDPEmilkbottlesintheplastic
wastestream.(Around80%oftheHDPEwaste
bottlefraction).NaturalHDPEmilkbottlesmustbe
sortedtoapolymerandcolourpurityof99%prior
toreprocessing.IntheUK,automaticNIRsorting
equipment is used, followed by a final manual
inspection and sort stage.
The bottles are flaked and washed, before passing
through automatic flake sorting equipment. This
removesanyremainingcontamination(e.g.particlesof
metals,wood,glass,etc)andanycolouredHDPEwhich
may have entered the recycling process. The final step
is extrusion of the flake – at a high temperature and
under vacuum – to produce a recompounded pellet.
DemandforrecycledHDPEforuseinfoodcontact
applications is still strong, despite current economic
conditions(especiallycomparedtodemandfromthe
constructionandautomotivesectors).Thetimingof
thisadditionalHDPEreprocessingcapacityisideal
becauseofrecentincreasesintheUK’splasticbottle
recovery rates.
Similar developments are happening with the production
offoodgradePET.WRAPrecentlycommissioned
researchtoinvestigateiffoodgradePPcanbeproduced
usingasimilarprocesstothatusedforHDPE.
Mechanical recycling of food grade HDPE in the UK

15
The collection of agricultural film in Norway began in the
mid-90s,beforetheintroductionofthenationalplastic
recycling scheme. Norwegian farmers took environmental
responsibilityforsortingtheirusedplastics(although
participationwaslegallyenforceable).FarmsinNorway
are widespread and face two main challenges for
collection and recycling: maintaining a good quality of
film collected from farms and greenhouses and providing
efficient transport to cover long distances.
Collection system
Most farmers collect their agricultural films and other
recyclables and drive to the local recycling station. Larger
The use of plastic waste in iron ore production is a
valuable and familiar feedstock recycling application.
Traditionally, iron production used coal and coke as
a reduction agent in the blast furnace.
Later, heavy liquid petroleum fractions replaced coal
because it was easy to handle and saved money.
Plasticwastefirstsubstitutedheavyfueloilsin
the1990s.SeveralGermancompanieshaveused
approximately 300k tonnes per year of ground plastic
waste in their blast furnaces.
farms are often visited by waste collectors. Green Dot
Norway cooperates with about 100 waste collectors
nationwide. They collect and ensure bales are of the right
quality and weight. Green Dot makes agreements with
recyclers on behalf of the local recycling businesses.
Lower CO2-emissions
There are challenges. Agricultural film needs cleaning
beforeitcanberecycled(causedbysoil,smallstones,
wateretc).In2008,alicencefeewaspaidfor8.666
tonnes of agricultural films. Of this 7232 tonnes – or
83% – were recycled saving up to 2kg of CO2 per kg
plastics compared to using virgin material.
Voest-AlpineinAustriahasnowdevelopedin-house
expertise to use mixed plastics waste in their blast
furnace operation. They substitute almost 25% of the
oil with mixed plastics waste(1).
Current iron production can use a maximum of approxi-
mately 220k tonnes per year of mixed plastics waste.
The operation has proved reliable and performs well
environmentally. Using mixed plastics instead of oil in iron
production is more eco-efficient than when it is used just
as a fuel e.g. in cement production. It is also classified as
recyclingintherevisedWasteFrameworkDirective.
1Identiplast2009Conference,April20-21,ThomasBuergl
Mechanical recycling of agricultural fi lm – a Norwegian success story
Feedstock recycling

16
The recovery of energy from waste in Europe dates
back 100 years. Today about 420 plants treat 64 million
tonnes of municipal, commercial and industrial waste
every year to produce electricity for 7 million households
and heat for 13.4 million household. This also reduces
CO2 emissions per year by 23 million tonnes; equivalent
to taking 11 million cars off our roads.
The EU member states demonstrate very different
“energy from waste” footprint and can be divided into
three groups.
Strong position for EfW
Austria, Belgium, Denmark, Germany, the Netherlands,
Sweden and Switzerland have demand and supply in
balance and use EfW extensively.
EfW can be expanded
Ireland,Italy,France,PortugalandSpainoffermarket
opportunities for growth but also market barriers.
Major growth potential
TheCzechRepublic,Greece,PolandandtheUKall
offer major growth opportunities which require very
large investments.
The EfW route is technically, environmentally and
economically fully proven. If Europe used the full
potential of its residual waste stream, using the EfW
technology, it could bring electricity to 17 million
households and heat 24 million households.
Example Denmark
Denmark has the highest per capita production of
both power and heat from EfW plants in Europe.
The 30 EfW plants use 3.5 million tonnes of waste
per year to produce 5% of the national need for
electricity and 20% of the heat need. The district
heating system today covers 53% of the heating
market and this is planned to increase to 70% by
2030 by increasing the amount of waste treated in
EfW plants to between 4.5-5 million tonnes per year.
Energy from Waste

17
GreaterManchesteriscomprisedof9boroughsinthe
North West of England and has about 1 million house-
holds. They generate 1.3 million tonnes of municipal
solidwaste,whichisabout5%oftheUK’stotal.
Greater Manchester has outsourced the management
of their waste in a 25-year contract estimated to cost
£3.8billion through which they expect to save their
taxpayers around £1 per household per week.
The planned solution will achieve recycling and
composting of at least 50% of the municipal waste,
whichmeetsboththeUKwastestrategyandthe
recentlyrevisedWasteFrameworkDirectivefor2020.
Forthenon-recyclablefraction,treatmentina
mechanicalbiologicaltreatment(MBT)plantwith
anaerobic digestion is planned. This treatment will
take out the compostable content and produce
methaneforenergyuse.Fromthe570.000tonnes
per year of non-recyclables, the output stream will
beabout275.000tonnes/yearofafuelcalledSolid
RecoveredFuel–SRF,whichhasahighercalorific
content than un-treated municipal waste.
TheSRFproducedfrommunicipalsolidwastethat
cannot be recycled will be transported to a new
EnergyfromWasteCHP(combinedheatandpower)
plant at Runcorn, which is being built by a consortium
ofINEOSChlor,ViridorandJohnLaing.Thisplant
will produce heat and power for the neighbouring
INEOS chemical manufacturing operation. The
plant, which received planning permission from the
UKGovernmentinSeptember2008,willhavethe
capacitytotake750.000tonnes/yearofSRF,and
could produce 100MW electricity and 360MW heat at
full capacity representing 20% of the INEOS energy
needs at Runcorn.
In addition to the saving for taxpayers, Greater
Manchester will reduce their dependence on landfill
fromtoday’s65%tobelow25%therebyminimising
landfill penalties and the need to open new landfill
sites.
ForINEOStheinvestmentwillsecurepartoftheirenergy
need with a fuel which is disconnected from the volatility
of fossil fuels and which is locally sourced thus reducing
theneedtoimportenergyfromoutsidetheUK.
In addition to the waste taken from Greater Manchester,
the INEOS facility will have the potential to take waste
from other neighbouring waste disposal authorities in
the North West region.
The Greater Manchester model provides an integrated
resource management solution where complementary
technologies are combined to utilise the full potential
of the value of the waste to the benefit of taxpayers,
the country and the environment.
The Greater Manchester waste management solution – a model for diverting waste from landfill?

18
Plastic products, applications and goods – enablers of innovation in society
Health
With plastics, a major technological breakthrough
has been reached in the field of bionics. Thanks
to a revolutionary wearable, partially concealable,
motorised, plastic suit called ReWalk™, people who
have lost the use of their legs can walk again.
ReWalk™ uses advanced motion sensors, sophisticated
robotic control algorithms, on-board computers, real-
time software, actuation motors, tailored rechargeable
batteries and, of course, composite plastic materials.
ReWalk is the perfect illustration of how plastics
combined with advanced technology brings tangible
health and emotional benefits in addition to relieving
suffering.
Safety
Another life saving achievement thanks to plastics is
the protective road barrier reflectors created by Wital,
aPolishcompany.ThisapplicationusesLuran®, the
styrene-based speciality plastic, to make protective
road barrier reflectors. The reflectors which are already
inuseinPolandareproducedinaone-processstepby
injection moulding.
Replacing steel, the use of this acrylate-styrene-
acrylonitrile polymer makes the reflector less expensive.
It also makes it impact resistant, strong, lightweight
and weather resistant – even in the worst weather
conditions the surface retains its high quality finish.
Plastics have been around for over 100 years but are considered ‘modern’ when compared to other materials
and, through their ubiquitous use, have become something of a ‘symbol’ for modern society. Over the last
few decades, plastics have been behind numerous technological advancements and play an important part
‘behind-the-scenes’ – they have enabled innovative designs, cost savings and the breaking down of barriers
towards achieving a myriad of shapes, forms and applications. Thanks to plastics, the only limitation to
creativity nowadays is that of the mind and no longer of the material.
Source:PhotoArgoMedicalTechnologiesLtd.,ReWalk™ Source:PhotoBASF,2008

19
Mobility
Plastics’prominentroleintheautomotivetechnology
is now an established fact. Thanks to their light weight
and potential for modularity, plastics help make cars
less pollutant, safer and more comfortable.
Thanks to plastics, development in the automotive
technology have been taken a step further with racing
solar cars such as Nuna. The Nuna car ran, and won, a
3000kmracetravellingatanaveragespeedof91km/h,
right across Australia, powered by solar energy alone.
To run such a long distance, under such harsh climatic
conditions,thecarhadtobelightandstrong.That’s
why the entire bodywork was built in carbon fibre,
reinforcedontheoutsidewithkevlar.Kevlarisyet
another extremely strong plastics material and, as
such, used in bullet-proof vests; and spacesuits for
protection against micrometeorites. The kevlar layer
in the Nuna protects the car against the impact of
flying gravel during a race.
Nuna is currently in its 5th edition and is being built
bytheNuonSolarTeamreadytocompeteinthe2009
WorldSolarChallengewhichbeginson05October2009.
Intelligent roofing
Thanks to plastics, architects can nowadays combine
both aesthetics and energy efficiency. With recycled
plastics, another breakthrough has been achieved in
harnessing solar energy. An American company has
now taken solar panel design to a whole new level by
integrating them into roof tiles. The unique designs are
integrated right into roof tiles which then serve a dual
purpose: offering traditional roofing protection and
solar panels at the same time.
The tiles are made from lightweight recycled plastic,
moulded together with a flexible solar cell. In addition,
the polymers employed in the tile can be recycled once
the product reaches its end of life.
These are just few examples of how plastics contribute to
enhancing our lives and well-being, whilst contributing
significantly to the sustainable development of society.
Source:PhotoSRSEnergy,SoléPowerTile™

20
Packaging
The packaging application has the longest history
of recovery and contributes about 63% of end-of-
life quantity. Not surprisingly the major part of what
is today recycled therefore comes from packaging.
40% of bottles and industrial film are now being
mechanicallyrecycledacrossEurope.Wellover90%
of crates and boxes are recycled. Recycling rates for
the remaining mixed plastics are still low – below 10%
across Europe. In total the collection for recycling of
post-consumer packaging grew in 2008 to an average
of29%,upfrom28%in2007.
Figure14showstheEuropeancountriesperforming
above and below the packaging directive target of
22.5% for 2008.
Agricultural films
Agricultural plastics waste such as silage film is a
good source for mechanical recycling as it is made
from a limited range of plastics, mostly polyolefins.
Howeveroftenhighlevelsofcontaminationby
soil pose a technical and financial challenge to
eco-efficientrecyclingorrecovery.EuPCandEuPR
are engaged in the LabelAgriWaste project – an
EU cofunded project – aiming at developing an
integrated approach towards the collection, sampling
andlabellingofagriculturalplasticwaste.Project
wascompletedinJuly2009.
Automotive
The recycling rate for automotive plastics waste
continued to increase to just under 10% in 2008.
Volkswagenwonanenvironmentalawardfortheir
SiCon process – a mechanical process to extract
usable secondary raw materials from the residues
of vehicles shredded at the end of their useful lives.
Plantsusingthistypeoftechnologyarebeingbuilt
and starting up in the Netherlands and in Austria.
Electrical & electronic
Recycling in the electrical and electronic sector
is limited by complex products with materials
intermingled in a way which makes sorting an
intensive and expensive activity.
AnexampleofgrowingrecyclingintheE&Esector
istheinnerlinerofarefrigerator.Forthemajority
of waste streams, thermal treatment via feedstock
recycling or energy recovery is the most appropriate
procedure. There is also some uncertainty about the
actualvolumesofdiscardedE&Eequipment.Itcanbe
assumed that some is exported outside Europe.
Construction
Plasticsusedinconstructionareforlong-termuseand
hence much material still remains in its use phase and
is not yet waste. Nevertheless increased recycling is
being achieved in e.g. pipes, leading to a recycling rate
of 16% for 2008 – up 3 % – points on 2007.
Recovery trends by application
Figure14.Totalrecyclingofplasticspackagingwastebycountry
<15%
15-<22.5%
>=22.5%
not included

21
This brochure on 2008 production, demand and
recovery is the nineteenth annual publication by the
European plastics manufacturers and their partners.
The aim of this brochure is to illustrate the life-cycle
of plastics from development and production, through
their many uses, to the advances made in recovering
plastics at their end-of-life phase.
PlasticsEurope’sMarketResearchandStatisticsGroup
(PEMRG)providedinputontheproductionof,and
demand for, plastics raw materials.
The end-of-life phase data was collected by a
partnershipinvolvingPlasticsEurope,EuPC
(theEuropeanPlasticsConverters),EuPR
(theEuropeanPlasticsRecyclers)andEPRO
(theEuropeanAssociationofPlasticsRecycling
andRecoveryOrganisations).
Figures and graphs in this report are showing data
for EU27+ Norway and Switzerland – called Europe.
Any other group of countries is specifically mentioned.
ConsulticMarketing&IndustrieberatungGmbH
helped assess waste generation and recovery data.
Official statistics have been used for recovery data, where
available, from European or National authorities and
waste management organisations. Research or expertise
from consultants was used to complete any gaps.
The figures cannot always be directly compared to
previous ones due to changes in the estimates of both
marketdemandandthewastegenerated.However,
overall differences are small. Earlier estimates have
been revised to enable past progress to be tracked for
both the use and recovery of plastics across Europe
during the last decade.
Methodology

22
The European plastics industry contributes significantly
tothewelfareofEurope.Plasticsencourageinnovation,
improve quality of life, and facilitate resource efficiency
and climate protection. More than 1.6 million people
work in 50.000 companies – many in SMEs for the
conversion sector – generating a turnover of € 300 billion
per year.
PlasticsEuropeisaleadingEuropeantradeassociation,
withofficesinBrussels,Frankfurt,London,Madrid,
MilanandParis.WenetworkwithEuropeanand
national plastics associations; and our 100 member
companiesproduceover90%ofallpolymersintheEU
27 Member States plus Norway, Switzerland, Croatia
and Turkey.
EuPC–theEuropeanPlasticsConverters–isthe
professional representative body of plastics converters
in Europe. Their activities cover all sectors of the
plastics converting industry, including recycling. Their
main objective is to defend and promote the European
plasticsconvertingindustry’sinterestsby:
• VoicingindustryopiniontoEuropeanand
international institutions and NGOs;
• Maintainingrelationshipswithcorresponding
European and global organisations;
• Conductingsurveys,studiesandresearchprojects
covering all areas of the plastics processing
industry.
EuPR–theEuropeanPlasticsRecyclers–isthe
professional representative body of plastics recyclers in
Europe.EuPRpromotesplasticsmechanicalrecycling
and an environment that encourages profitable and
sustainable business. They provide a platform for
members,whorepresent85%ofEurope’srecycling
capacity, processing over 5 million tonnes of collected
plastics per year.
EPRO–theEuropeanAssociationofPlasticsRecycling
and Recovery Organisations – is the association of
the national organisations responsible for organising
and promoting recycling and recovery in Europe.
EPROprovidesauniqueforumforleadingEuropean
specialists in plastics waste management to exchange
learnings, develop integrated plastics packaging waste
strategies and support technological development.
Who are we?

23
The plastics business developed positively until mid
2008. What happened thereafter is unprecedented in
plastics. Never in the relatively short history of plastics
has such a market deterioration happened in so
shortaperiodoftime.FromJanuarytoJune2009,the
production of plastics in the EU27 has dropped by 26%
compared to the same period in 2008. Compared to the
level that the market had reached before the start of the
fall, in autumn 2008, plastics demand has fallen by more
than30%.Sincespring2009thesituationhasstabilised
– at a very low level – and only started to show signs of
recoveryinthe2ndquarterof2009forplastics.
Converted plastics products have been slightly less
affected–havinglost18%inproductionduringJanuary
toJunecomparedto2008.Plastics–servingmany
different markets – have met a varying response from
different industries. Whilst demand from packaging
has only fallen a very little, the demand from the
automotive industry has dropped by 40%. The drop in
demand for the construction industry has also been
significant. As in earlier turbulent times, we have seen
restructuring, temporary shutdowns and plant closures
in all parts of the plastics industry.
AsthisbrochurewenttopressinSeptember2009,we
have begun to see signs of a turnaround in demand
for plastics and converted products. Demand has been
slowly returning but is far from pre-recessionary levels
and a full recovery is likely to take several years.
Due to the global economic crisis – for the first time
in many years – the total quantity of plastic waste
generated will decrease year-on-year. Recycling
volumes in Europe are expected to decrease between
5-10%forthefirst6monthsof2009,andforthefull
year are expected to be at a lower level than in 2008.
Due to the drastic reduction in demand for recyclates,
prices fell by more than 50 % in latter part of 2008,
but have since gradually recovered. Especially for
higher quality recyclates the market shows a positive
trend. This indicates the need for strong national
recovery schemes, with sufficient financial reserves
and programmes to improve the quality of the collected
plastics.
Snapshots 2009
130
120
110
100
90
80
70
60
50
1990 1991 1992 1993 1994 1995 1996 1997 1998 1999 2000 2001 2002 2003 2004 2005 2006 2007 2008 2009
Plastics in Primary Forms Manufacture of Plastics Products
Index (2005= 100 Trend cycle)
Figure15.PlasticsindustryproductioninEU27 Source:Eurostat/PlasticsEuropeMarketResearchGroup(PEMRG)

2009
-12
AvenueE.vanNieuwenhuyse4/3B-1160 Brussels - Belgium
Phone+32(0)26753297Fax+32(0)26753935
Avenue de Cortenbergh 66P.OBox4B-1000 Brussels - Belgium
Phone+32(0)27429682Fax+32(0)27326312
www.plasticsrecyclers.eu
Rue du Commerce 31B-1000 Brussels - Belgium
Phone+32(0)24568449Fax+32(0)24568339
www.epro-plasticsrecycling.org
Avenue de Cortenbergh 66P.OBox4B-1000 Brussels - Belgium
Phone+32(0)27324124Fax+32(0)27324218
www.plasticsconverters.eu