the decisive role of free water in determining homogenous...
TRANSCRIPT

1Scientific RepoRts | 6:26831 | DOI: 10.1038/srep26831
www.nature.com/scientificreports
The decisive role of free water in determining homogenous ice nucleation behavior of aqueous solutionsQiang Wang1, Lishan Zhao1,2, Chenxi Li1 & Zexian Cao1
It is a challenging issue to quantitatively characterize how the solute and pressure affect the homogeneous ice nucleation in a supercooled solution. By measuring the glass transition behavior of solutions, a universal feature of water-content dependence of glass transition temperature is recognized, which can be used to quantify hydration water in solutions. The amount of free water can then be determined for water-rich solutions, whose mass fraction, Xf, is found to serve as a universal relevant parameter for characterizing the homogeneous ice nucleation temperature, the meting temperature of primary ice, and even the water activity of solutions of electrolytes and smaller organic molecules. Moreover, the effects of hydrated solute and pressure on ice nucleation is comparable, and the pressure, when properly scaled, can be incorporated into the universal parameter Xf. These results help establish the decisive role of free water in determining ice nucleation and other relevant properties of aqueous solutions.
The microscopic mechanism of homogenous ice nucleation in pure water and aqueous solutions has been intensively studied over the past few decades. Although no consensus has been reached yet, the development of solute-free water domains of tetrahedrally coordinated structure is still regarded as the decisive stage of ice nucle-ation in solution1–5. Within such nanosized pure-water domains, a metastable intermediate phase, also called pre-cursor of nucleus, emerges initially with local tetragonal symmetry6,7 and then grows into ice nucleus composed of randomly stacked layers of cubic and hexagonal sequences7,8. The presence of this precursory phase effectively reduces the nucleus/liquid interfacial tension, thus facilitates the occurrence of ice nucleation. A decrease in the probability of forming such precursory phase can explain the suppressing effect of solutes on ice nucleation in solutions5.
On the other hand, the relationship between the macroscopic features of solutions and the homogeneous ice nucleation temperature, TH, has also been investigated without considering the microscopic structural details of both the solution and ice nucleus therein. A prominent example is the semi-empirical water activity (aw) approach9–12. This thermodynamic approach stresses that TH is uniquely related to aw, irrespective of the chemical nature of the solutes. This liquid-only criterion for the onset of freezing and the classical nucleation theory were suggested to be reconciled if the activation energy for water molecules to cross the nucleus/liquid interface is taken as a function of aw
9. Later, a physical basis for this approach was proposed: for pure water under pressure p ≤ 1 kbar, TH is nearly coincident with the temperature at which the compressibility of water reaches its maxi-mum value, denoted herein as T(κmax)10. Different solutions of the same aw have the same osmotic pressure, there-fore, the same T(κmax) and TH. When cooled down to T(κmax), density or hydrogen boning network fluctuations becomes enough for forming critical-sized low density and tetrahedrally coordinated water domains needed by the formation of ice nucleus.
However, up to now, it still lacks a microscopic understanding of the effect of solute on homogeneous ice nucleation, for instance, how to estimate the effect of solute hydration on ice nucleation. Solute hydration plays an important role in determining many basic thermodynamic and kinetic properties of both solute and solvent
1Beijing National Laboratory for Condensed Matter Physics, Institute of Physics, Chinese Academy of Sciences, Beijing 100190, China. 2Department of Physics, University of Science and Technology Beijing, Beijing 100083, China. Correspondence and requests for materials should be addressed to Q.W. (email: [email protected]) or Z.C. (email: [email protected])
received: 17 February 2016
Accepted: 09 May 2016
Published: 26 May 2016
OPEN

www.nature.com/scientificreports/
2Scientific RepoRts | 6:26831 | DOI: 10.1038/srep26831
in aqueous solutions. For describing aw, hydration water was suggested to be removed from solvent in calculating the effective concentration of solute13–16. But unsatisfactorily, in so doing the hydration number, nh, has only been simply adopted as an adjustable parameter without rigorous definition or justification13,17. To date, this problem still keeps unresolved because hydration water has been defined differently according to different properties of water involved, and nh has been measured by various experimental techniques, including X-ray and neutron diffraction17,18, X-ray adsorption19, differential scanning calorimetric (DSC) measurement20, as well as Raman21, nuclear magnetic relaxation22, terahertz dielectric relaxation23, and infrared spectroscopies23,24. A strict definition of hydration water from the point of view of suppressing ice nucleation and an accurate quantification of nh will open a possibility of discussing the effect of solute hydration on TH and even aw, respectively, which will also help us microscopically understand the relation between aw and TH.
When cooled solutions at moderate rates, water molecules in concentrated solutions can totally vitrify25–28, and those in water-rich solutions partially crystallize into primary ice and partially vitrify together with the sol-utes. These vitrified water molecules in low temperature phase of water-rich solutions are herein defined as hydra-tion water. The value of nh was quantified through comparing the glass transition temperature, Tg, of hydration water with those at which concentrated solutions vitrify totally. Very interestingly, we observed that the mass fraction of free water, Xf, can serve as a universal parameter for describing TH, Tm, and even aw of solutions of electrolytes and small organic molecules. This observation verified that the hydration water defined herein is rarely involved in the formation of ice nucleus, and contributes negligibly to aw, at the same time, stressed the key effect of amount of free water on the formability of ice nucleus and on the thermodynamic property of solutions. Moreover, we observed that, in depressing TH and Tm, pressure is equivalent to the mass fraction of hydrated sol-ute, and also established the quantitative relationship between them.
ResultsQuantification of hydration water. We find that the water content dependence of Tg for aqueous solu-tions displays a quite universal feature, which in turn can provide a simple and reliable method for quantifying hydration number of solutes. Figure 1a,b show the DSC thermograms for the aqueous H2SO4 + HNO3 solutions with a mass fraction of water of Xaqu = 0.39 and 0.85, respectively. The mass fraction of HNO3 is fixed at XHNo3 = 0.07. The concentrated H2SO4 + HNO3 solutions such as the one with Xaqu = 0.39 can totally vitrify. This behavior was observed in solutions with increasing water content up to a critical value of Xaqu
c = 0.69 (Fig. 1c). For
Figure 1. DSC thermograms of aqueous H2SO4 + HNO3 solutions with a mass fraction of water of (a) Xaqu = 0.39 and (b) Xaqu = 0.85. = .X 0 07HNO3
in both cases. (c) State diagram of H2SO4 + HNO3 solution. For solutions with >X Xaqu aqu
c (zone III), primary ice precipitates first and then the residual freeze-concentrated solution vitrifies, obviously, at an almost constant temperature, termed ′Tg. Tm and Tf refer to the melting and freezing points of primary ice precipitated within zone III. As shown in (b) and (c), during cooling solution with Xaqu = 0.85 from temperature point A, precipitation of primary ice begins at temperature point B and terminates at temperature point C. Below C, water content in freeze-concentrated solutions keeps nearly constant, which is equal to ′Xaqu.

www.nature.com/scientificreports/
3Scientific RepoRts | 6:26831 | DOI: 10.1038/srep26831
water-rich solutions with Xaqu > Xaquc , as illustrated by the sample with Xaqu = 0.85 in Fig. 1b, crystallization of
primary ice occurs firstly, followed by the vitrification of freeze-concentrated solutions.Those water molecules in vitrified freeze-concentrated solutions are defined as hydration water herein. The
corresponding nh can be deduced from the concentration of the freeze-concentrated solution. Traditionally, this concentration is determined by the point of intersection of Tg curve of concentrated solutions and the extrap-olated Tm curve of ice in water-rich solutions. This method is valid mainly for solutions of larger organic mole-cules which have narrow temperature and/or concentration gaps between Tg and non-extrapolated Tm curves20,26. However, the error from extrapolating Tm curve cannot be neglected for solutions of electrolytes and small organic molecules, which have lager temperature and concentration gaps between Tg and non-extrapolated Tm curves. Moreover, it may be unreasonable to extrapolating Tm curve down to Tg curve. As can be seen from Fig. 1b,c, when cooled H2SO4 + HNO3 solution of Xaqu = 0.85 from temperature A, crystallization of primary ice begins at temperature B and finishes at C. Therefore, the concentration of freeze-concentrated solutions keeps constant when further decreasing temperature below C. This problem has already been noticed28, however, cannot be resolved mainly due to the difficulty in determining C point.
A comparison between Tg of freeze-concentrated solutions and those at which concentrated solutions totally vitrify can accurately determine the concentration of freeze-concentrated solutions. As shown in Fig. 1c, freeze-concentrated solutions vitrify at a nearly constant temperature, denoted as ′Tg. Therefore, the concentration of the freeze-concentrated phases corresponds to that of the solution that totally vitrifies at Tg = ′Tg determined on the monotonous part of the Tg versus Xaqu curve. The determined concentration is denoted as ′Xaqu, at which solu-tion can also be written as M·nh H2O, here M stands for the solute. With the known ′Xaqu and Xaqu
c , the solutions for a given solute can be categorized into three distinct zones with regard to different vitrification and crystalliza-tion behaviors of water (Fig. 1c). For solutions in zone I there is less water to complete the hydration; while solu-tions in zone III are water-rich, wherein ice precipitation occurs spontaneously in the cooling process. For solutions falling in zone II with > > ′X X Xaqu
caqu aqu, water can totally vitrify when cooled at moderate rates,
however, crystallization of water can still be observed on the reheating process or after performing long-time holding treatment at temperatures above Tg
29. These recrystallized water molecules are normally named the freez-able bound water.
The water-content dependence of Tg depicted in Fig. 1c was also measured in solutions of electrolytes such as LiCl, CaCl2, Ca(NO3)2, MnCl2, Mn(NO3)2, MgCl2, Mg(NO3)2, Mg(CH3COO)2, ZnCl2, FeCl3, Fe(NO3)3, CrCl3, Cr(NO3)3, AlCl3, HNO3-H2SO4, and of simple organic molecules such as glycerol, ethylene glycol (EG), polyeth-ylene glycol (PEG) 300, dimethyl sulfoxide (DMSO), and 1,2,4-butanetriol; and some mixtures such as those of MgCl2 + ZnCl2, ZnCl2 + glycerol (see Supplementary Figs. 1–10). Experimental results show that the feature of Xaqu-dependent Tg illustrated in Fig. 1c is quite universal at least to the systems investigated and cited in this work. The obtained ′Xaqu and nh for the measured solutes are listed in Supplementary Table I.
Mass fraction of free water as pertinent parameter. For dilute solutions in zones II & III with a Xaqu > ′Xaqu, which containing more water than hydration, the mass fraction of free water, Xf, can be calculated without any assumption. Briefly, for ⋅ nM H O2 , Xf is defined by
= − × × +X n n n M( ) 18/( 18 ), (1)f h s
where Ms is the molar weight of the solute. For any aqueous solutions specified by a > ′X Xaqu aqu, Xf can be directly calculated from
= − ′ −
′ .X X X X/ 1 (2)f aqu aqu aqu
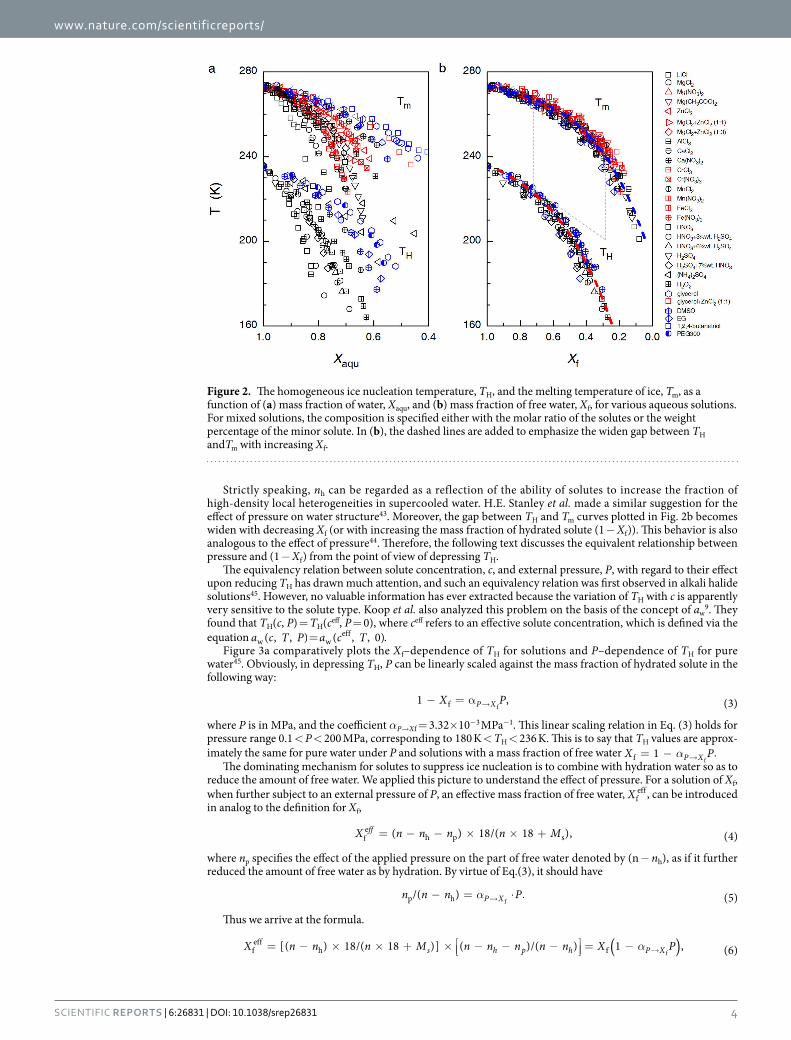
Remarkably, the original scattering TH and Tm data when plotted against Xaqu (Fig. 2a) merge into two quite compact curves when plotted as a function of Xf (Fig. 2b), which can be well fitted by the functions = . − . − .T X247 66 162 12 exp( 2 581 )H f and = . − . − .T X277 21 87 87 exp( 3 044 )m f , respectively. In Fig. 2, all the
TH data are cited from literatures published between 1980 and 2011, which were obtained by measuring emulsi-fied samples with a diameter of 1~10 μ m11,26,30–39. The Tm data were either extracted from the liquidus lines in the reported phase diagrams25,26,28,34,39–42 or read from the position of the endothermal peaks on DSC curves meas-ured in the current work. We measured Tm data for solutions of Mg(CH3COO)2, EG, 1,2,4-butanetriol, glyc-erol + ZnCl2(1:1), MgCl2 + ZnCl2(1:1), MgCl2 + ZnCl2(1:3), and HNO3 + H2SO4. Additionally, the observed roughly universal X f -dependence of TH and Tm is also valid for electrolytic solutions wherein the freeze-concentrated phase preferably crystallizes instead of undergoing vitrification, such as aqueous solutions of H2O2, (NH4)2SO4, H2SO4, and HNO3 (see Supplementary Table 1 and the note therein). In this case, free water was still defined as the part of water that crystallizes into primary ice.
Figure 2b indicates that TH depends solely on Xf and is insensitive to the specific solute-water interaction. This insensitiveness can be attributed to the screening effect of hydration water to the solutes. In other words, the influence of solutes on ice nucleation can be evaluated via the hydration capability of the solute, i.e., nh, which increases roughly linearly with the Gibbs energies of hydration of cations and molecules (see Supplementary Fig. 11), and increases from 6 for LiCl to about 19 for AlCl3 (Supplementary Table I). As we know, the number of water in the first and second hydration shells of ions is about 6 and 9~20 (depending on the type of cations), respectively17,18. Therefore, regarding influence upon ice nucleation occurring in dilute solutions, the solute− water interaction cannot extend beyond the first hydration shell for monovalent electrolytes and simple organic molecules, and cannot extend beyond the second hydration shell for multivalent electrolytes.
www.nature.com/scientificreports/
4Scientific RepoRts | 6:26831 | DOI: 10.1038/srep26831
Strictly speaking, nh can be regarded as a reflection of the ability of solutes to increase the fraction of high-density local heterogeneities in supercooled water. H.E. Stanley et al. made a similar suggestion for the effect of pressure on water structure43. Moreover, the gap between TH and Tm curves plotted in Fig. 2b becomes widen with decreasing Xf (or with increasing the mass fraction of hydrated solute (1 − Xf)). This behavior is also analogous to the effect of pressure44. Therefore, the following text discusses the equivalent relationship between pressure and (1 − Xf) from the point of view of depressing TH.
The equivalency relation between solute concentration, c, and external pressure, P, with regard to their effect upon reducing TH has drawn much attention, and such an equivalency relation was first observed in alkali halide solutions45. However, no valuable information has ever extracted because the variation of TH with c is apparently very sensitive to the solute type. Koop et al. also analyzed this problem on the basis of the concept of aw
9. They found that TH(c, P) = TH(ceff, P = 0), where ceff refers to an effective solute concentration, which is defined via the equation a c T P( , , )w = a c T( , , 0)w
eff .Figure 3a comparatively plots the Xf–dependence of TH for solutions and P–dependence of TH for pure
water45. Obviously, in depressing TH, P can be linearly scaled against the mass fraction of hydrated solute in the following way:
− = α →X P1 , (3)P Xf f
where P is in MPa, and the coefficient αP→Xf = 3.32× 10⁻³ MPa−1. This linear scaling relation in Eq. (3) holds for pressure range 0.1 < P < 200 MPa, corresponding to 180 K < TH < 236 K. This is to say that TH values are approx-imately the same for pure water under P and solutions with a mass fraction of free water α= − →X P1 P Xf f
.The dominating mechanism for solutes to suppress ice nucleation is to combine with hydration water so as to
reduce the amount of free water. We applied this picture to understand the effect of pressure. For a solution of Xf, when further subject to an external pressure of P, an effective mass fraction of free water, Xf
eff , can be introduced in analog to the definition for Xf,
= − − × × +X n n n n M( ) 18/( 18 ), (4)ff
fe
h p s
where np specifies the effect of the applied pressure on the part of free water denoted by (n − nh), as if it further reduced the amount of free water as by hydration. By virtue of Eq.(3), it should have
α− = ⋅ .→n n n P/( ) (5)P Xp h f
Thus we arrive at the formula.
α= − × × + × − − − = − →( )X n n n M n n n n n X P[( ) 18/( 18 )] ( )/( ) 1 , (6)s h p h P Xf
effh f f
Figure 2. The homogeneous ice nucleation temperature, TH, and the melting temperature of ice, Tm, as a function of (a) mass fraction of water, Xaqu, and (b) mass fraction of free water, Xf, for various aqueous solutions. For mixed solutions, the composition is specified either with the molar ratio of the solutes or the weight percentage of the minor solute. In (b), the dashed lines are added to emphasize the widen gap between TH andTm with increasing Xf.

www.nature.com/scientificreports/
5Scientific RepoRts | 6:26831 | DOI: 10.1038/srep26831
where Xf and − α ⋅→ P(1 )P Xf represent the contributions from solutes and pressure, respectively. Eq.(6) implies
that in reducing the amount of free water in a solution, the pressure and the solute work in close collaboration. The hydrated solutes exert influence on the local hydrogen bonding network in water, while, pressure promotes the high-density non-tetrahedral local structure in free water, both lead to the suppression of ice nucleation probability.
Figure 3b shows the Xfeff dependence of TH for solutions of 1.0 mol. kg−1 LiCl45 and 5.56 mol. kg−1 glycerol46
under pressures up to 200 MPa (for NaCl, see Supplementary Fig. 12). As expected, all the TH data points fall exclusively onto the same curve referring to that in Fig. 2b. The regular dependence of TH obtained under various concentrations or pressures on the parameter Xf
eff also suggests that the pressure in the given range has almost no bearing on the hydration water of LiCl and glycerol.
DiscussionInterestingly, the TH data referred to Fig. 2a also merge into a very compact distribution when plotted as a func-tion of aw
9, which is a good thermodynamic parameter for comprehensively describing the effect of solutes on ice nucleation. aw and the related osmotic pressure have been widely used to characterize the formability of nano-sized water domains in supercooled solutions4,10, or the change in entropy and the activation energy required for water molecules to cross the nucleus/liquid interface9,12. The application of aw undoubtedly provides a simplified treatment of the complex interactions among the different components in a solution. However, this simplified treatment also hinders understanding the detailed role of solute in determining ice nucleation, in part because of a lack of general relations between aw and other features of the solution concerning the solute-water interaction15.
Figure 4 plots aw measured at 298 K for various aqueous solutions against Xf. For comparison, Fig. 4 also plots Xf dependence of aw at Tm for solutions calculated according to the following equation:
∆ =G T RT a T( ) ln ( ), (7)exc m m w m
where ∆Gexc is the excess Gibbs free energy of supercooled water, which is defined as the excess heat capacity of supercooled bulk water with respect to bulk ice47, and R is the gas constant. The data points are no more randomly scattered as plotted versus molar fraction of water or even versus molar fraction of free water (Supplementary Figs 13 and 14), rather they fall onto two seemingly distinct branches (Fig. 4). The lower branch includes electrolytic solutions and the solutions of small organic molecules such as 1,2,4-butanetrio, glycerol, and DMSO, all measured at 298 K13,47–59. Consequently, the relationship between aw(Tm) ~ Xf can be deduced by relationship between aw(Tm) and Tm established according to Eq. (7) and that between Tm and Xf plotted in Fig. 2b. Noticeably, the deduced
Figure 3. (a) The homogeneous ice nucleation temperature, TH, as a function of pressure, P, for pure water (black square), and of the mass fraction of free water, Xf, fitted for solutions referring to Fig. 2b (red dashed line). For comparison, melting temperature ice, Tm, as a function of pressure for pure water (black circle), and of Xf for solutions (blue dashed line) were also plotted. (b) TH as a function of the effective mass fraction of free water, Xf
eff , for pure water under variable pressures and solutions under atmospheric pressure (red dashed line), and for 5.56 mol. kg−1 glycerol solutions under pressure up to about 120 MPa (triangle) and for 1.0 mol. kg−1 LiCl solution under pressure up to about 190 MPa (circle).

www.nature.com/scientificreports/
6Scientific RepoRts | 6:26831 | DOI: 10.1038/srep26831
aw(Tm) as a function of Xf (blue line) fits well aw data measured at 298 K for the electrolytic solutions and those of small organic molecules. The aw data measured at 298 K differ from those measured at the corresponding Tm only negligibly, thus we suggest that nh is insensitive to temperature.
The quite universal dependences of TH and aw(Tm) on Xf, at least for electrolytic solutions, explains the success-ful application of aw in describing the effect of solutes on ice nucleation, as aw indirectly reflects the availability of free water in supercooled solutions.
The above-mentioned fitted TH versus Xf and Tm versus Xf relations are not valid for solutions of large organic molecules illustrated in Fig. 4, including solutions of xylose, sorbitol, glucose, maltose, sucrose, and trehalose. Obviously these aw data fall apart from those for electrolytes and small organic molecules, and yet, interestingly, they also roughly merge into one single curve. This difference in awversus Xf between electrolytic solutions and those of large organic molecule may lie in the structural heterogeneity in the latter ones. Of the similarXf levels, the region of free water may be larger due to the aggregation of (unevenly) hydrated large organic molecules, thus manifesting a higher value for aw and TH. PEG 300 is an exception, that its data at Tm and at 298 K fall on two branches respectively, i.e., its hydration water number is sensitive to temperature60.
The Xf ~ aw relation displaying two distinct branches reminds us that, for the same nominal Xf, it refers to a larger aw thus a higher TH for solutions of large organic molecules (data not shown). As TH depends on the local amount of free water in solution, this clearly results from the structural inhomogeneity in those solutions arising from aggregation of the large organic molecules. Thus one must be cautious in understanding TH, Tm and other water-related properties for such solutions, since the locally available amount of free water is not necessarily con-sistent with the nominal concentration of the solution. This case can partially explain the invalidity of colligative property for describing the effect of solutes on TH and aw even when hydration is also taken into consideration.
The universal dependence of TH on Xf, or TH(c, P) on Xfeff , and even the deviation of aw(Tm) ~ Xf for electrolytic
solutions and solutions of larger organic molecules, lead to recognition of the pivotal role of free water, or the hydration water, in determining the ice nucleation behavior. The solute ions or molecules differ, with regard to suppressing the ice nucleation temperature, in their hydration capability. Ice nucleation in different solutions can thus be understood on the same footing with the concept of hydrated solute or mass fraction of free water. We suggest that hydration of solutes reflect their abilities to increase the fraction of high-density heterogeneities in supercooled water. Different solutions at the same mass fraction of free water have the same temperature depend-ence of probability of forming critical-sized low-density domain in supercooled free water. However, it still is difficult to estimate the size of the free water domains in solutions from the nominal water content of the solution, as the free water regions are interconnected, and at least in solutions of large organic molecules the distribution of free water may show a severe inhomogeneity. Moreover, a fact remains quite puzzling that why it is mass fraction of free water that universally describe the ice nucleation in solutions.
In summary, by measuring the water-content dependence of glass transition temperature for many different aqueous solutions we recognized that the nearly constant glass transition temperature for the freeze-concentrated phases from the super-cooled water-rich solutions provides a method to quantify the number of hydration water for a given solute. A relevant parameter, the mass fraction of free water, can be well defined and determined. A universal dependence on this parameter was established for the homogeneous ice nucleation temperature, TH, the melting temperature of primary ice, Tm, and even aw(Tm). This observation is also valid for water-rich solu-tions in which the freeze-concentrated phase preferably crystallizes instead of undergoing vitrification. When properly scaled, for suppressing ice nucleation, the effect of pressure can be incorporated into an effective mass
Figure 4. Water activity, aw, measured at 298 K for various aqueous solutions plotted against Xf (open symbol). Also aw at Tm for solutions of PEG 300, glucose, sucrose, and trehalose molecules (solid symbol) are included for comparison. The blue solid line results from the calculated aw(Tm) according to Eq. (7) in conjunction with the Tm ~ Xf relation referred to Fig. 2b.

www.nature.com/scientificreports/
7Scientific RepoRts | 6:26831 | DOI: 10.1038/srep26831
fraction of free water. The one-to-one correspondence between water activity and mass fraction of free water (for electrolytic solutions to the least) explains the validity of water activity in describing the homogeneous ice nucle-ation behavior in supercooled solutions. It reveals the fact that water activity is essentially a measure of free water.
MethodsSamples. High-purity water was prepared by using a Millipore Milli-Q system. The solutes LiCl (anhy-drous, 99.99%), CaCl2 (anhydrous, 99.99%), Ca(NO3)2·4H2O (ACS reagent, 99%), MgCl2 (anhydrous, 99.99%), MnCl2·4H2O (99.99%), ZnCl2 (anhydrous, 99.99%), CrCl3·6H2O (98.0%), AlCl3·6H2O (99%), FeCl3·6H2O (99%), HNO3 (70%, purified by re-distillation to 99.999%), glycerol (99.5%), ethylene glycol (anhydrous, 99.8%), dime-thyl sulfoxide(anhydrous, 99.9%), polyethylene glycol 300 (BioUltra) were purchased from Sigma-Aldrich. Other solutes include H2O2 (50 wt.% in H2O, 85 wt.% in H2O, Beijing Chem. Tech. Co.) and H2SO4 (98%, Sinopharm Chemical Reagent).
Thermal measurement. Differential scanning calorimetric measurement on droplets (∼ 5.0 μ L) of aqueous solutions was performed on a calorimeter (PE DSC8000) operating at a cooling/heating rate of 20 K min.− 1 unless otherwise specified. When cooled down to 110 K, the sample was held at this temperature for 1 min. before the heating procedure began. All of the DSC curves were normalized against sample weight.
References1. Matsumoto, M., Saito, S. & Ohmine, I. Molecular dynamics simulation of the ice nucleation and growth process leading to water
freezing. Nature 416, 409–413 (2002).2. Moore, E. B. & Molinero, V. Structural transformation in supercooled water controls the crystallization rate of ice. Nature 479,
506–509 (2011).3. Sellberg, J. A. et al. Ultrafast X-ray probing of water structure below the homogeneous ice nucleation temperature. Nature 510,
381–384 (2014).4. Bullock, G. & Molinero, V. Low-density liquid water is the mother of ice: on the relation between mesostructure, thermodynamics
and ice crystallization in solutions. Faraday Discuss. 167, 371–388 (2013).5. Warkentin, M., Sethna, J. P. & Thorne, R. E. Critical droplet theory explains the glass formability of aqueous solutions. Phys. Rev.
Lett. 110, 015703 (2013).6. Singh, R. S. & Bagchi, B. Correlation between thermodynamic anomalies and pathways of ice nucleation in supercooled water.
J. Chem. Phys. 140, 164503 (2014).7. Russo, J., Romano, F. & Tanaka, H. New metastable form of ice and its role in the homogeneous crystallization of water. Nat. Mater.
13, 733–739 (2014).8. Malkin, T. L., Murray, B. J., Brukhno, A. V., Anwar, J. & Salzmann, C. G. Structure of ice crystallized from supercooled water. Proc.
Natl. Acad. Sci. USA 109, 1041–1045 (2012).9. Koop, T., Luo, B., Tsias, A. & Peter, T. Water activity as the determinant for homogeneous ice nucleation in aqueous solutions. Nature
406, 611–614 (2000).10. Baker, M. B. & Baker, M. A new look at homogeneous freezing of water. Geophys. Res. Lett. 31, L19102 (2004).11. Zobrist, B., Marcolli, C., Peter, T. & Koop, T. Heterogeneous ice nucleation in aqueous solutions: the role of water activity. J. Phys.
Chem. A 112, 3965–3975 (2008).12. Barahona, D. Analysis of the effect of water activity on ice formation using a new thermodynamic framework. Atmos. Chem. Phys.
14, 7665–7680 (2014).13. Stokes, R. H. & Robinson, R. A. Ionic hydration and activity in electrolyte solutions. J. Am. Chem. Soc. 70, 1870–1878 (1948).14. Zavitsas, A. A. Properties of water solutions of electrolytes and nonelectrolytes. J. Phys. Chem. B 105, 7805–7817 (2001).15. Blandamer, M. J., Engberts, J. B., Gleeson, P. T. & Reis, J. C. Activity of water in aqueous systems; a frequently neglected property.
Chem. Soc. Rev. 34, 440–458 (2005).16. Zavitsas, A. A. The Nature of aqueous solutions: Insights into multiple facets of chemistry and biochemistry from freezing-point
depressions. Chem. Eur. J. 16, 5942–5960 (2010).17. Marcus, Y. Ionic-radii in aqueous-solutions. Chem. Rev. 88, 1475–1498 (1988).18. Ohtaki, H. & Radnai, T. Structure and dynamics of hydrated ions. Chem. Rev. 93, 1157–1204 (1993).19. Waluyo, I. et al. The structure of water in the hydration shell of cations from x-ray Raman and small angle x-ray scattering
measurements. J. Chem. Phys. 134, 064513 (2011).20. Slade, L. & Levine, H. Beyond Water Activity - Recent advances based on an alternative approach to the assessment of food quality
and safety. Crit. Rev. Food Sci. 30, 115–360 (1991).21. Sum, A. K., Burruss, R. C. & Sloan, E. D. Measurement of clathrate hydrates via Raman spectroscopy. J. Phys. Chem. B 101,
7371–7377 (1997).22. Tait, M. D., Suggett, A., Franks, F., Ablett, S. & Quickenden, P. A. Hydration of monosaccharides: A study by dielectric and nuclear
magnetic relaxation. J. Solution Chem. 1, 131–151 (1972).23. Tielrooij, K. J., Garcia-Araez, N., Bonn, M. & Bakker, H. J. Cooperativity in ion hydration. Science 328, 1006–1009 (2010).24. Fayer, M. D. et al. Water Dynamics in salt solutions studied with ultrafast two-dimensional infrared (2D IR) vibrational echo
spectroscopy. Acc. Chem. Res. 42, 1210–1219 (2009).25. Angell, C. A. Glass-Forming Composition Regions and Glass Transition Temperatures for Aqueous Electrolyte Solutions. J. Chem.
Phys. 52, 1058 (1970).26. Zobrist, B., Marcolli, C., Pedernera, D. A. & Koop, T. Do atmospheric aerosols form glasses? Atmos. Chem. Phys. 8, 5221–5244
(2008).27. Koop, T., Bookhold, J., Shiraiwa, M. & Poschl, U. Glass transition and phase state of organic compounds: dependency on molecular
properties and implications for secondary organic aerosols in the atmosphere. Phys. Chem. Chem. Phys. 13, 19238–19255 (2011).28. Kobayashi, M. & Tanaka, H. Relationship between the phase diagram, the glass-forming ability, and the fragility of a water/salt
mixture. J. Phys. Chem. B 115, 14077–14090 (2011).29. Zhao, L. S., Cao, Z. X. & Wang, Q. Glass transition of aqueous solutions involving annealing-induced ice recrystallization resolves
liquid-liquid transition puzzle of water. Sci. Rep. 5, 15714, doi: 10.1038/srep15714 (2015).30. Miyata, K., Kanno, H., Tomizawa, K. & Yoshimura, Y. Supercooling of aqueous solutions of alkali chlorides and acetates. Bull. Chem.
Soc. Jpn. 74, 1629–1633 (2001).31. Kumar, A. Homogeneous nucleation temperatures in aqueous mixed salt solutions. J. Phys. Chem. B 111, 10985–10991 (2007).32. Angell, C. A., Sare, E. J., Donnella, J. & Macfarlane, D. R. Homogeneous nucleation and glass-transition temperatures in solutions of
Li salts in D2O and H2O - Doubly unstable glass regions. J. Phys. Chem. 85, 1461–1464 (1981).33. Bogdan, A., Molina, M. J., Tenhu, H., Mayer, E. & Loerting, T. Formation of mixed-phase particles during the freezing of polar
stratospheric ice clouds. Nat. Chem. 2, 197–201 (2010).

www.nature.com/scientificreports/
8Scientific RepoRts | 6:26831 | DOI: 10.1038/srep26831
34. Bogdan, A. & Molina, M. J. Why does large relative humidity with respect to ice persist in cirrus ice clouds? J. Phys. Chem. A 113, 14123–14130 (2009).
35. Bogdan, A. & Loerting, T. Impact of substrate, aging, and size on the two freezing events of (NH4)2SO4/H2O droplets. J. Phys. Chem. C 115, 10682–10693 (2011).
36. Bertram, A. K., Koop, T., Molina, L. T. & Molina, M. J. Ice formation in (NH4)2SO4-H2O particles. J. Phys. Chem. A 104, 584–588 (2000).
37. Oguni, M. & Angell, C. A. Heat-capacities of H2O + H2O2, and H2O + N2H4, binary-solutions - isolation of a singular component for Cp of supercooled water. J. Chem. Phys. 73, 1948–1954 (1980).
38. Miyata, K. & Kanno, H. Supercooling behavior of aqueous solutions of alcohols and saccharides. J. Mol. Liq. 119, 189–193 (2005).39. Zobrist, B., Weers, U. & Koop, T. Ice nucleation in aqueous solutions of poly[ethylene glycol] with different molar mass. J. Chem.
Phys. 118, 10254 (2003).40. Angell, C. A. Liquid fragility and the glass transition in water and aqueous solutions. Chem. Rev. 102, 2627–2649 (2002).41. Murata, K. I. & Tanaka, H. Liquid-liquid transition without macroscopic phase separation in a water-glycerol mixture. Nat. Mater.
11, 436–443 (2012).42. Horsak, I. & Slama, I. Calculation of the phase-diagram for the system water dimethylsulfoxide. Collect. Czech. Chem. Commun. 48,
1936–1943 (1983).43. Canpolat, M. et al. Local structural heterogeneities in liquid water under pressure. Chem. Phys. Lett. 294, 9–12 (1998).44. Kanno, H., Speedy, R. J. & Angell, C. A. Supercooling of water to − 92 °C under pressure. Science 189, 880–881 (1975).45. Kanno, H. & Angell, C. A. Homogeneous nucleation and glass formation in aqueous alkali-halide solutions at high-pressures.
J. Phys. Chem. 81, 2639–2643 (1977).46. Miyata, K., Hayakawa, S., Kajiwara, K. & Kanno, H. Supercooling and vitrification of aqueous glycerol solutions at normal and high
pressures. Cryobiology 65, 113–116 (2012).47. Johari, G. P., Fleissner, G., Hallbrucker, A. & Mayer, E. Thermodynamic continuity between glassy and normal water. J. Phys. Chem.
98, 4719–4725 (1994).48. Cohen, M. D., Flagan, R. C. & Seinfeld, J. H. Studies of concentrated electrolyte-solutions using the electrodynamic balance .1. Water
activities for single-electrolyte solutions. J. Phys. Chem. 91, 4563–4574 (1987).49. Robinson, R. A. & Stokes, R. H. Tables of osmotic and activity coefficients of electrolytes in aqueous solution at 25 °C. Trans. Faraday
Society 45, 612–624 (1949).50. Stokes, R. H. & Robinson, R. A. Interactions in aqueous nonelectrolyte solutions .I. Solute-solvent equilibria. J. Phys. Chem. 70,
2126–2130 (1966).51. Ha, Z. Y. & Chan, C. K. The water activities of MgCl2, Mg(NO3)2, MgSO4, and their mixtures. Aerosol Sci. Technol. 31, 154–169
(1999).52. Sadowska, T. & Libus, W. Thermodynamic properties and solution equilibria of aqueous bivalent transition-metal nitrates and
magnesium-nitrate. J. Solution Chem. 11, 457–468 (1982).53. Robinson, R. A. & Stokes, R. H. Electrolyte Solutions. (DOVER PUBLICATIONS, INC., 2002).54. Anstiss, R. G. & Pitzer, K. S. Thermodynamics of very concentrated aqueous-electrolytes-LiCl, ZnCl2, and ZnCl2-NaCl at 25 °C.
J. Solution Chem. 20, 849–858 (1991).55. Zeleznik, F. J. Thermodynamic properties of the aqueous sulfuric-acid system to 350 K. J. Phys. Chem. Ref. Data 20, 1157–1200
(1991).56. Ninni, L., Camargo, M. S. & Meirelles, A. J. A. Water activity in polyol systems. J. Chem. Eng. Data 45, 654–660 (2000).57. Lam, S. Y. & Benoit, R. L. Some thermodynamic properties of dimethylsulfoxide-water and propylene carbonate-water systems at
25 °C. Can. J. Chem.-Rev. Can. Chim. 52, 718–722 (1974).58. Ben Gaida, L., Dussap, C. G. & Gros, J. B. Variable hydration of small carbohydrates for predicting equilibrium properties in diluted
and concentrated solutions. Food Chem. 96, 387–401 (2006).59. Miyajima, K., Sawada, M. & Nakagaki, M. Studies on aqueous-solutions of saccharides .2. Viscosity b-coefficients, apparent molar
volumes, and activity-coefficients of d-glucose, maltose, and maltotriose in aqueous-solutions. Bull. Chem. Soc. Jpn. 56, 1954–1957 (1983).
60. Koop, T. Homogeneous ice nucleation in water and aqueous solutions. Z. Phys. Chem. 218, 1231–1258 (2004).
AcknowledgementsThis work was supported by NSFC grant nos 11474325, 11474335 and 11290161, and by the Chinese Academy of Sciences grant no. 1731300500030. We thank prof. Thomas Koop and prof. Haiping Fang for the valuable discussions.
Author ContributionsQ.W. initiated the research, L.Z., C. L. and Q.W. performed the measurement, Q.W. and Z.C. interpreted the result, Q.W. and Z.C. compiled the manuscript. All authors have given approval to the final version of the manuscript.
Additional InformationSupplementary information accompanies this paper at http://www.nature.com/srepCompeting financial interests: The authors declare no competing financial interests.How to cite this article: Wang, Q. et al. The decisive role of free water in determining homogenous ice nucleation behavior of aqueous solutions. Sci. Rep. 6, 26831; doi: 10.1038/srep26831 (2016).
This work is licensed under a Creative Commons Attribution 4.0 International License. The images or other third party material in this article are included in the article’s Creative Commons license,
unless indicated otherwise in the credit line; if the material is not included under the Creative Commons license, users will need to obtain permission from the license holder to reproduce the material. To view a copy of this license, visit http://creativecommons.org/licenses/by/4.0/

1
Supplementary Information
The decisive role of free water in determining homogeneous ice nucleation behavior of
aqueous solutions
Qiang Wang,† Lishan Zhao,
‡† Chenxi Li,
† and Zexian Cao
†
†Beijing National Laboratory for Condensed Matter Physics, Institute of Physics, Chinese Academy of
Sciences, Beijing 100190, China
‡Department of Physics, University of Science and Technology Beijing, Beijing 100083, China
This supplementary information includes:
a) Figures. S1-S13
b) Table S1 with explanatory notes
c) References

2
Figure S1. Extraction of the onset temperature of glass transition, , and the heat flow change at ,
denoted as , from DSC heating curve. (a) Normalized DSC thermogram of HNO3+H2SO4 solution
with 𝑋HNO3+ 𝑋H2SO4
= 0.65 wherein 𝑋HNO3= 0.07; (b) Local magnification of the heat flow step
corresponding to the glass transition.
3
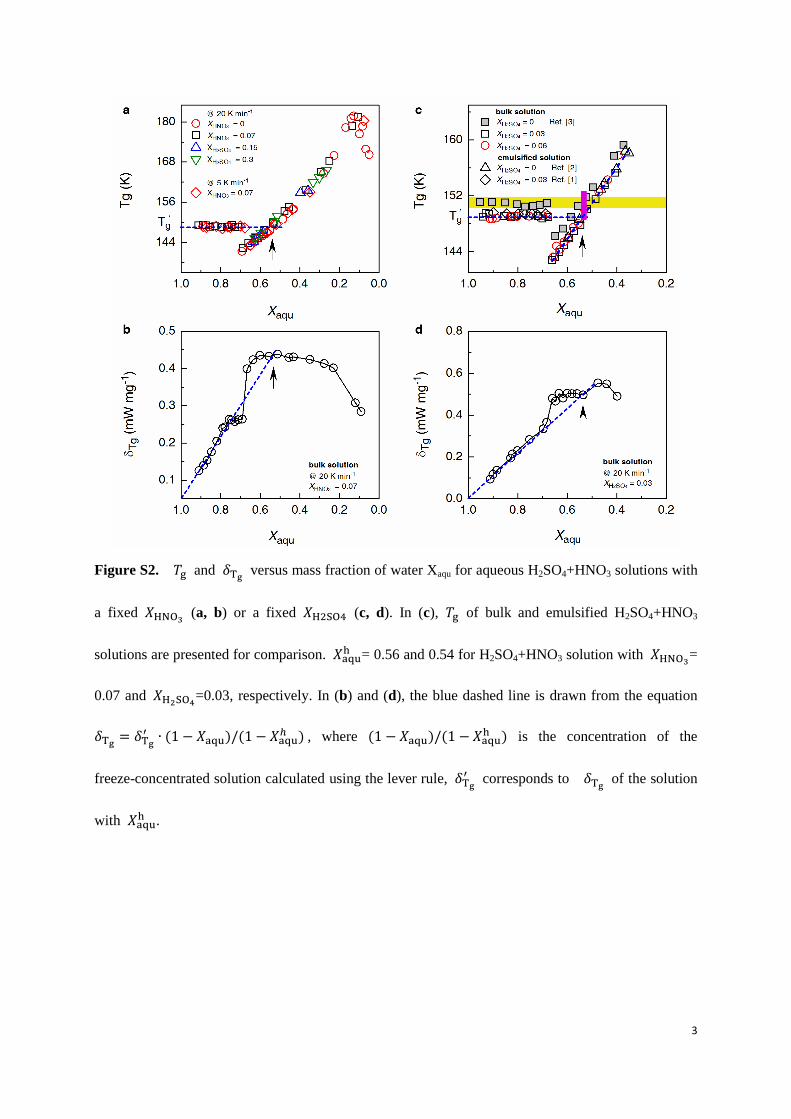
Figure S2. and versus mass fraction of water Xaqu for aqueous H2SO4+HNO3 solutions with
a fixed 𝑋HNO3 (a, b) or a fixed 𝑋H2SO4 (c, d). In (c), of bulk and emulsified H2SO4+HNO3
solutions are presented for comparison. 𝑋 = 0.56 and 0.54 for H2SO4+HNO3 solution with 𝑋HNO3
=
0.07 and 𝑋H2SO4=0.03, respectively. In (b) and (d), the blue dashed line is drawn from the equation
𝑋 𝑋 , where 𝑋 𝑋
is the concentration of the
freeze-concentrated solution calculated using the lever rule,
corresponds to of the solution
with 𝑋 .

4
Figure S3. and versus Xaqu for aqueous solutions of LiCl (a, b) and ethylene glycol (c, d).
data extracted from Ref.[4] are also illustrated in (a) for comparison. 𝑋 = 0.72 and 0.24 for LiCl
and ethylene glycol solutions, respectively.

5
Figure S4. and versus Xaqu for aqueous solutions of CaCl2 (a,b) and Ca(NO3)2 (c,d). data
extracted from Ref.[4] are also shown in (a) and (c) for comparison. 𝑋 = 0.62 and 0.43 for CaCl2
and Ca(NO3)2 solutions, which correspond to the values of CaCl2:10H2O and Ca(NO3)2:7H2O,
respectively. The same type of cation but different anions is shared by these two solutes. Although
cations have a stronger interaction with water than anion, an obvious difference in hydration number
can still be observed. This difference suggests that anions have a non-negligible effect on 𝑋 ,
probably due to a cooperativity in ion hydration5. At present, it is still difficult to understand how
hydration water molecules are shared by cation and anion, as already stressed by Stoke and Robinson6.
6
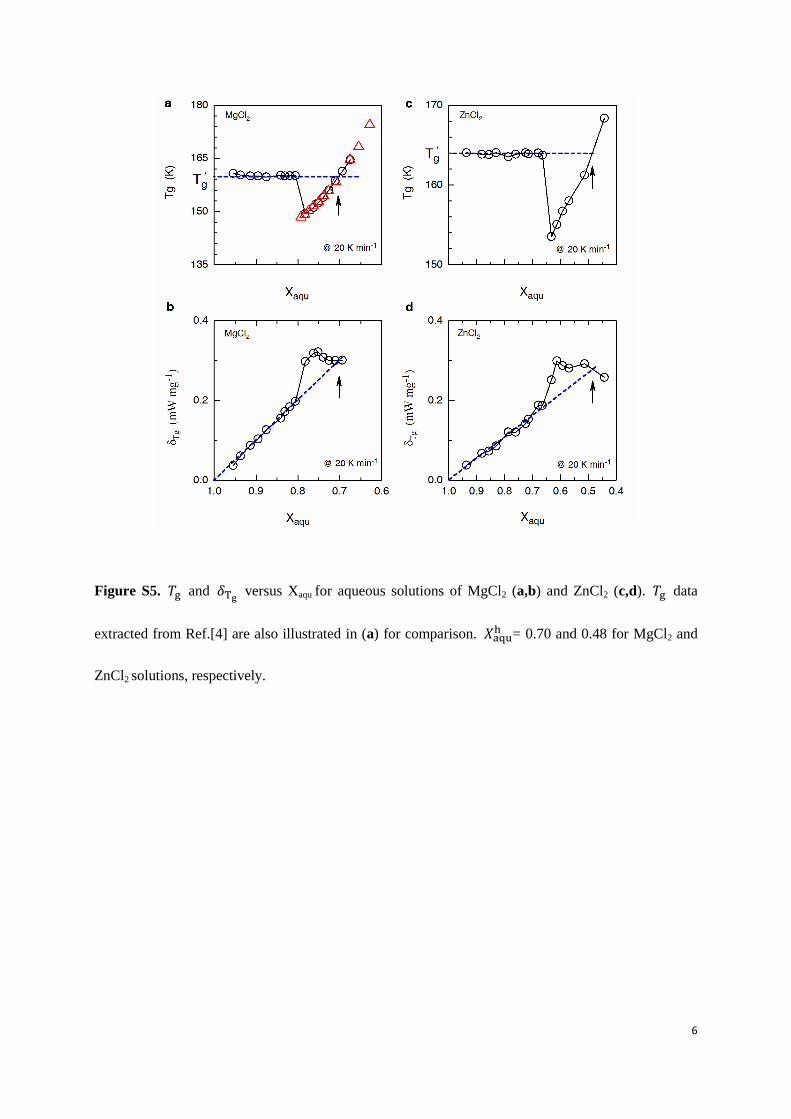
Figure S5. and versus Xaqu for aqueous solutions of MgCl2 (a,b) and ZnCl2 (c,d). data
extracted from Ref.[4] are also illustrated in (a) for comparison. 𝑋 = 0.70 and 0.48 for MgCl2 and
ZnCl2 solutions, respectively.

7
Figure S6. and versus Xaqu for aqueous solutions of MnCl2 (a,b), FeCl3 (c,d), and AlCl3
(e,f). data from Ref.[4] (red diamond) are also shown in (a) for comparison. 𝑋 = 0.56, 0.62, and
0.72 for solutions of MnCl2, FeCl3, and AlCl3, respectively.

8
Figure S7: versus Xaqu for aqueous solutions of Cr(NO3)3 (a), Mn(NO3)2 (b), and Fe(NO3)3 (c).
data from Ref.[4] (red diamond) are also shown in (a) and (b) for comparison. 𝑋 = 0.54, 0.51, and
0.54 for solutions of Cr(NO3)3, Mn(NO3)2, and Fe(NO3)3, respectively.

9
Figure S8. and versus Xaqu for solutions of dimethyl sulfoxide (DMSO) (a, b) and PEG 300
(c, d). 𝑋 = 0.41 and 0.29 for DMSO and PEG 300 solutions, respectively. Red circles in (c) denote
the fitting results according to the Gordon-Taylor equation, i.e., 𝑋 + 𝑋2 2
𝑋 + 𝑋2 ,
where 𝑋 and 𝑋2 are the mass fractions of PEG300:6.8H2O and free water; = 181.8 K and 2
=
136 K; k is the Gordon-Taylor coefficient, here k = 1.

10
Figure S9. and versus Xaqu for (a) MgCl2+ZnCl2 with a molar ratio of 1:1, (b) MgCl2+ZnCl2
with a molar ratio of 1:3, and (c) ZnCl2+glycerol with a molar ratio of 1:1.
Figure S10: versus Xaqu for solutions of 1,2,4-butanetriol. 𝑋 = 0.24.
11
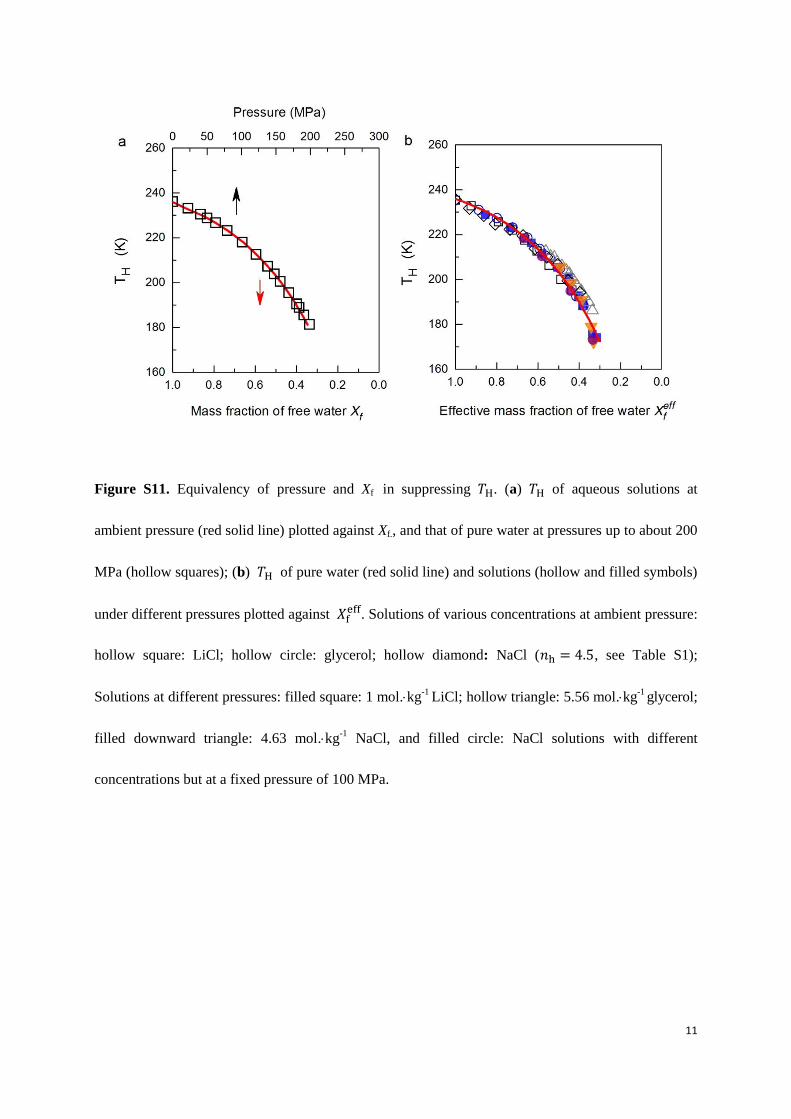
Figure S11. Equivalency of pressure and Xf in suppressing H. (a) H of aqueous solutions at
ambient pressure (red solid line) plotted against Xf., and that of pure water at pressures up to about 200
MPa (hollow squares); (b) H of pure water (red solid line) and solutions (hollow and filled symbols)
under different pressures plotted against 𝑋 . Solutions of various concentrations at ambient pressure:
hollow square: LiCl; hollow circle: glycerol; hollow diamond: NaCl ( , see Table S1);
Solutions at different pressures: filled square: 1 mol.kg-1
LiCl; hollow triangle: 5.56 mol.kg-1
glycerol;
filled downward triangle: 4.63 mol.kg-1
NaCl, and filled circle: NaCl solutions with different
concentrations but at a fixed pressure of 100 MPa.

12
Figure S12. Water activity (a) and homogeneous ice nucleation temperature H (b) versus
molar fraction of free water in solution. The molar fraction of free water is given by
+ 𝑣 , where n is the molar ratio of water to solute, is the molar ratio of hydration water to
solute, v is the van’t Hoff index of the solute. In ideal case, v = 2 for LiCl, 3 for Ca(NO3)2, and 4 for
AlCl3. Here, the cation or anion bound by hydration water is modeled as a single particle, and the
hydration water is excluded when calculating the molar fraction of free water.

13
Figure S13. Water activity (a) and homogeneous ice nucleation temperature H (b) versus
molar fraction of free water in solution. The molar fraction of free water is given by +
𝑣 , where n is the molar ratio of water to solute, is the molar ratio of hydration water to solute, v
is the van’t Hoff index of the solute. In ideal case, v = 2 for LiCl, 3 for Ca(NO3)2, and 4 for AlCl3, etc.
14
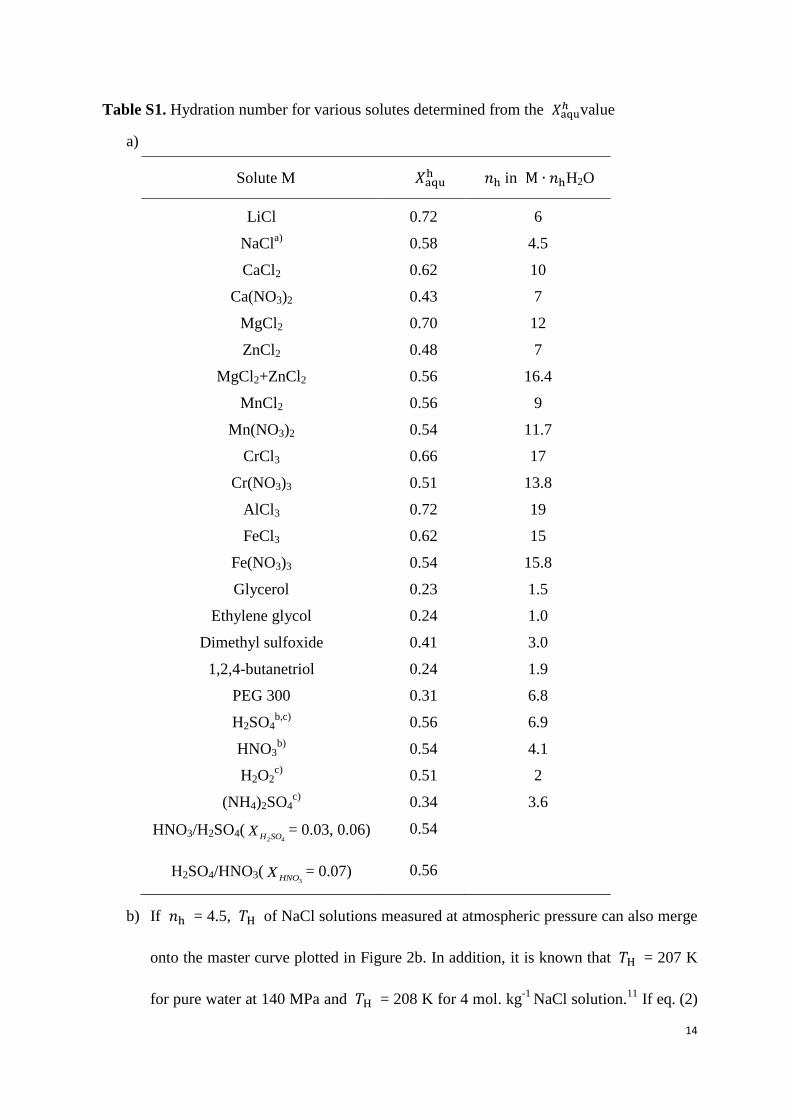
Table S1. Hydration number for various solutes determined from the 𝑋 value
a)
Solute M 𝑋 in H2O
LiCl 0.72 6
NaCla)
0.58 4.5
CaCl2 0.62 10
Ca(NO3)2 0.43 7
MgCl2 0.70 12
ZnCl2 0.48 7
MgCl2+ZnCl2 0.56 16.4
MnCl2 0.56 9
Mn(NO3)2 0.54 11.7
CrCl3 0.66 17
Cr(NO3)3 0.51 13.8
AlCl3 0.72 19
FeCl3 0.62 15
Fe(NO3)3 0.54 15.8
Glycerol 0.23 1.5
Ethylene glycol 0.24 1.0
Dimethyl sulfoxide 0.41 3.0
1,2,4-butanetriol 0.24 1.9
PEG 300 0.31 6.8
H2SO4b,c)
0.56 6.9
HNO3b)
0.54 4.1
H2O2c)
0.51 2
(NH4)2SO4c)
0.34 3.6
HNO3/H2SO4(2 4H SOX = 0.03, 0.06) 0.54
H2SO4/HNO3(3HNOX = 0.07) 0.56
b) If = 4.5, H of NaCl solutions measured at atmospheric pressure can also merge
onto the master curve plotted in Figure 2b. In addition, it is known that H = 207 K
for pure water at 140 MPa and H = 208 K for 4 mol. kg-1
NaCl solution.11
If eq. (2)

15
in the text describing the relationship between P and is also valid for NaCl
solutions, can be deduced and is also found to be about 4.5 (see Figure S11).
This proposition is being verified by measuring emulsified NaCl solutions.
c) See Figure S2.
d) The concentration of freeze-concentrated phase for the H2O2, H2SO4, and (NH4)2SO4
solutions in this table was estimated in the following ways:
1) H2O2 solution. Bulk H2O2 solution crystallizes easily. Oguni et al. found that emulsified
H2O2 solution can vitrify completely once its concentration is higher than that of
H2O2·3H2O (Figure3 from Ref.[7]), which corresponds to 𝑋 . The method developed in
this study cannot be applied to determine the hydration number of H2O2 because of the
independence of on solute concentration in the whole concentration range investigated.
Dielectric study reveals that H2O2·2H2O is stable enough against crystallization7.
Accordingly, 𝑋 = 0.51 for the H2O2 solution.
2) H2SO4 solution. For H2SO4 solution with a minor amount of HNO3, the
freeze-concentrated phase can completely vitrify, and its concentration remains constant,
i.e. corresponds to 𝑋 = 0.56 (see Figure S2). Importantly, this value is insensitive to the
amount of added HNO3. Therefore, this value can be obtained by extrapolation for the
pure H2SO4 solutions.
3) (NH4)2SO4 solution. Homogeneous ice freezing in the aqueous solutions of (NH4)2SO4
has been widely investigated by using different methods, e.g., Fourier-transform IR
extinction spectroscopy, continuous flow diffusion, optical microscopy, and DSC
measurement. Figure5 in Ref.[8] and Figure4 in Ref.[9] present a summation and

16
comparison among the published data.
The concentration of freeze-concentrated solution for the (NH4)2SO4 solutions has
recently been carefully analyzed by Bogdan and Loerting based on the measurement of
freezing temperature of primary ice.10
They proposed that the concentration of the
freeze-concentrated solution, which freezes in the temperature range of 210~225 K, would
center between ~0.61 and 0.66. Assuming that the solute concentration equals to 0.66 and
consequently 𝑋 = 0.34, then H for the (NH4)2SO4 solutions can be well scaled onto a
unique curve as a function of 𝑋 , see Figure 3b in the text.
References
1. Bogdan, A., Molina, M. J., Tenhu, H., Mayer, E. & Loerting, T. Formation of
mixed-phase particles during the freezing of polar stratospheric ice clouds. Nat. Chem. 2,
197-201 (2010)
2. Chang, H. Y. A., Koop, T., Molina, L. T & Molina, M. J. Phase transitions in emulsified
HNO3/H2O and HNO3/H2SO4/H2O solutions. J. Phys. Chem. A 103, 2673-2679 (1999).
3. Satoh, K. & Kanno, H. Anomalous crystallization behavior in the glass forming
compositionregion of the H2O-HNO3 system. Bull. Chem. Soc. Jpn. 55, 1645-1646
(1982).
4. Angell, C. A. Glass-forming composition regions and glass transition temperatures for

17
aqueous electrolyte solutions. J. Chem. Phys. 52, 1058 (1970).
5. Tielrooij, K. J., Garcia-Araez, N., Bonn, M. & Bakker, H. J. Cooperativity in ion
hydration. Science 328, 1006-1009 (2010).
6. Stokes, R. H. & Robinson, R. A. Ionic hydration and activity in electrolyte solutions. J.
Am. Chem. Soc. 70, 1870-1878 (1948).
7. Minoguchi, A., Richert, R. & Angell, C. Dielectric studies deny existence of ultraviscous
fragile water. Phys. Rev. Lett. 93, 215703 (2004).
8. Larson, B. H. & Swanson, B. D. Experimental investigation of the homogeneous
freezing of aqueous ammonium sulfate droplets. J. Phys. Chem. A 110, 1907-1916
(2006).
9. Knopf, D. A. & Lopez, M. D. Homogeneous ice freezing temperatures and ice
nucleation rates of aqueous ammonium sulfate and aqueous levoglucosan particles for
relevant atmospheric conditions. PCCP 11, 8056-8068 (2009).
10. Bogdan, A. & Loerting, T. Impact of substrate, aging, and size on the two freezing
events of (NH4)2SO4/H2O droplets. J. Phys. Chem. C 115, 10682-10693 (2011).
11. Kanno, H. & Angell, C. A. Homogeneous nucleation and glass formation in aqueous
alkali-halide solutions at high-pressures. J. Phys. Chem. 81, 2639-2643 (1977).
12. Zobrist, B., Weers, U. & Koop, T. Ice nucleation in aqueous solutions of poly[ethylene
glycol] with different molar mass. J. Chem. Phys. 118, 10254 (2003).
13. Kanno, H., Soga, M. & Kajiwara, K. Linear relation between TH (homogeneous ice
nucleation temperature) and Tm (melting temperature) for aqueous solutions of sucrose,
trehalose, and maltose. Chem. Phys. Lett. 443, 280-283 (2007).
18
14. Mathlouthi, M., Luu, C., Meffroy-Biget, A. M. & Luu, D. V. Laser- Raman study of the
solute-solvent interactions in aqueous solutions of D-fructose, D-glucose, and sucrose.
Carbohyd. Res. 81, 213-223 (1980).
15. Mathlouthi, M., Cholli, A. L. & Koenig, J. L. Spectroscopic study of the structure of
sucrose in the amorphous state and in aqueous solution. Carbohyd. Res. 147, 1-9 (1986).
16. Mathlouthi, M. X-ray diffraction study of the molecular association in aquous solutions
of D-fructose, D-glucose and sucrose. Carbohyd. Res. 91, 113-123 (1981).