the development of design guidance for bridges in new ... · the development of design guidance for...
TRANSCRIPT

The development of design guidance for bridges in New Zealand for liquefaction and lateral spreading effects
July 2014 A Murashev, D Kirkcaldie and C Keepa, Opus International Consultants, Wellington M Cubrinovski, University of Canterbury, Christchurch R Orense, University of Auckland, Auckland NZ Transport Agency research report 553 Contracted research organisation – Opus International Consultants

ISBN 978-0-478-41961-0 (electronic)
ISSN 1173-3764 (electronic)
NZ Transport Agency
Private Bag 6995, Wellington 6141, New Zealand
Telephone 64 4 894 5400; facsimile 64 4 894 6100
www.nzta.govt.nz
Murashev, A, D Kirkcaldie, C Keepa, M Cubrinovski and R Orense (2014) The development of design
guidance for bridges in New Zealand for liquefaction and lateral spreading effects. NZ Transport Agency
research report 553. 142pp.
Opus International Consultants was contracted by the NZ Transport Agency in 2013 to carry out this
research.
This publication is copyright © NZ Transport Agency 2014. Material in it may be reproduced for personal
or in-house use without formal permission or charge, provided suitable acknowledgement is made to this
publication and the NZ Transport Agency as the source. Requests and enquiries about the reproduction of
material in this publication for any other purpose should be made to the Manager National Programmes,
Investment Team, NZ Transport Agency, at [email protected].
Keywords: bridge design, geotechnical, liquefaction analysis, liquefaction mitigation, seismic design,
transport

An important note for the reader
The NZ Transport Agency is a Crown entity established under the Land Transport Management Act 2003.
The objective of the Agency is to undertake its functions in a way that contributes to an efficient, effective
and safe land transport system in the public interest. Each year, the NZ Transport Agency funds innovative
and relevant research that contributes to this objective.
The views expressed in research reports are the outcomes of the independent research, and should not be
regarded as being the opinion or responsibility of the NZ Transport Agency. The material contained in the
reports should not be construed in any way as policy adopted by the NZ Transport Agency or indeed any
agency of the NZ Government. The reports may, however, be used by NZ Government agencies as a
reference in the development of policy.
While research reports are believed to be correct at the time of their preparation, the NZ Transport Agency
and agents involved in their preparation and publication do not accept any liability for use of the research.
People using the research, whether directly or indirectly, should apply and rely on their own skill and
judgement. They should not rely on the contents of the research reports in isolation from other sources of
advice and information. If necessary, they should seek appropriate legal or other expert advice.

Acknowledgements
The funding for the project was provided by the New Zealand Transport Agency. John Wood of John Wood
Consulting and C Y Chin of URS are thanked for their detailed review of the original manuscript. Nigel
Lloyd, John Reynolds and Barry Wright of the New Zealand Transport Agency are gratefully acknowledged
for the valuable comments, advice and support they provided to the research team through the course of
the project. Members of the Project Steering Group, Rob Jury of Beca and Lloyd Greenfield of the
Christchurch City Council are thanked for their valuable input.

5
Contents
Executive summary ................................................................................................................................................................. 7 Abstract ....................................................................................................................................................................................... 10 1 Introduction ................................................................................................................................................................ 11 2 Preliminary considerations ............................................................................................................................... 13
2.1 Liquefaction-related design issues .............................................................................. 13 2.2 Structure performance requirements .......................................................................... 14 2.3 Liquefaction effects on structures ............................................................................... 15
2.3.1 Ground settlement .......................................................................................... 15 2.3.2 Ground lateral spreading................................................................................ 16 2.3.3 Effects of liquefaction on the vertical response of piles ............................... 17
3 Geotechnical investigations ............................................................................................................................. 19 3.1 Preliminary geotechnical appraisal .............................................................................. 19 3.2 Geotechnical site investigations .................................................................................. 21
4 Evaluation of liquefaction and lateral spreading ................................................................................ 24 4.1 Introduction .................................................................................................................. 24 4.2 Determination of seismic demand .............................................................................. 24 4.3 Evaluation of liquefaction ............................................................................................ 24
4.3.1 Liquefaction susceptibility .............................................................................. 25 4.3.2 Liquefaction triggering ................................................................................... 26
4.4 Liquefaction-induced ground deformations ............................................................... 28 4.4.1 Ground settlements ........................................................................................ 28 4.4.2 Cyclic ground displacements ......................................................................... 29 4.4.3 Permanent ground displacement due to spreading ...................................... 29
5 Methods of ground improvement ................................................................................................................. 31 5.1 Introduction .................................................................................................................. 31 5.2 Types of ground improvement .................................................................................... 31
5.2.1 Densification methods .................................................................................... 31 5.2.2 Solidification method ...................................................................................... 33 5.2.3 Drainage .......................................................................................................... 34 5.2.4 Reinforcement ................................................................................................. 34 5.2.5 Soil replacement ............................................................................................. 34 5.2.6 Increasing in situ stress.................................................................................. 34 5.2.7 Applications of ground improvement in New Zealand ................................. 34
5.3 Costs of ground improvement .................................................................................... 35 5.4 Reliability and resilience .............................................................................................. 36 5.5 Generic design recommendations ............................................................................... 37
5.5.1 Design guidelines ........................................................................................... 37 5.5.2 Design issues .................................................................................................. 37
6 Methods of analysis .............................................................................................................................................. 39 6.1 Introduction .................................................................................................................. 39
6.1.1 Characteristics of liquefaction and lateral spreading ................................... 39 6.1.2 Design cases to consider ................................................................................ 40
6
6.1.3 Local and global effects (models and analysis) ............................................. 42 6.1.4 Methods of analysis ........................................................................................ 43
6.2 Pseudo-static analysis (PSA) ......................................................................................... 45 6.2.1 Cubrinovski et al method ............................................................................... 47 6.2.2 PEER method .................................................................................................... 62 6.2.3 AIJ method ....................................................................................................... 66 6.2.4 Japan Road Association (JRA) method ............................................................ 68 6.2.5 Consideration of PSA methods ....................................................................... 71
6.3 Time history (dynamic) analysis ................................................................................... 71 6.3.1 Effective stress analysis (ESA) ......................................................................... 71 6.3.2 Total stress analysis (TSA) .............................................................................. 72
6.4 Substructure approach ................................................................................................. 72 7 Structural mitigation approaches to liquefaction induced lateral spreading ................... 76 8 Conclusions and recommendations ............................................................................................................ 80 9 Bibliography ............................................................................................................................................................... 82
Appendix A: Mechanism and effects of liquefaction and lateral spreading ........................................ 93 Appendix B: Example calculation ............................................................................................................................. 133 Appendix C: Glossary ...................................................................................................................................................... 141
7
Executive summary
Introduction
This report is a result of a NZ Transport Agency (Transport Agency) research project towards the
development of guidelines for the design of bridges on sites prone to liquefaction and lateral spreading in
New Zealand. The purpose of the report is to identify a clear set of available procedures for analysis and
design that are based on observed seismic behaviour of bridges (reviewed case studies) and on the most
recent research findings.
Liquefaction-related design issues
Design of bridges for liquefaction and lateral spreading effects is a complex technical problem and a large
number of issues associated with the design process should be considered. Key considerations include
geotechnical investigations, evaluation of liquefaction and lateral spreading, ground improvement,
analysis of the effects of liquefaction and lateral spreading on the bridge structure, structural design
issues and post-construction monitoring issues.
Preliminary considerations
The preliminary considerations for the design of bridges on sites which are susceptible to liquefaction and
lateral spreading include compliance with the structure performance requirements and standards,
liquefaction effects on structures, lateral spreading effects on structures and geotechnical pile capacity
following liquefaction.
Geotechnical investigations
In order to understand the full extent of the liquefiable deposits and the level of liquefaction susceptibility,
site-specific geotechnical investigations need to be undertaken. A preliminary geotechnical appraisal is
carried out initially to establish the site topography, stratigraphy and location of groundwater table.
If the preliminary geotechnical appraisal indicates the presence of liquefiable materials, site-specific
geotechnical investigations may be required. A programme of geotechnical investigation should be
developed to obtain sufficient information for the assessment of liquefaction potential of the site soils and
for seismic analysis.
All of the information collected during the preliminary geotechnical appraisal and the geotechnical
investigations should be interpreted and reported. The geotechnical investigation report should outline
the methodology used in the interpretation of the collected information.
Evaluation of liquefaction and lateral spreading
The seismic demand of the bridge site should be evaluated using the NZ Transport Agency’s Bridge
manual (3rd edition) where the peak ground acceleration to be applied is unweighted and derived for the
relevant return period.
Alternatively, the Geotechnical earthquake engineering practice: module 1 – guideline for the
identification, assessment and mitigation of liquefaction hazards prepared by the New Zealand
Geotechnical Society can be used for this purpose.

Design guidance for bridges in New Zealand for liquefaction and lateral spreading effects
8
Methods of ground improvement
Ground improvement methods can be categorised into densification, solidification, drainage,
reinforcement and replacement of liquefiable soils as well as increase of in-situ stresses by either
surcharging the soils or lowering the groundwater table. The report summarises the most common
liquefaction countermeasures and gives brief descriptions of the principles behind the improvement
mechanism associated with each category of the ground improvement methods along with some
references detailing the design of ground treatment schemes and methods to evaluate the effectiveness of
soil improvement.
Methods of analysis
Phases of response
When evaluating the effects of liquefaction and lateral spreading on the performance of the bridge pile
foundations using equivalent static analyses, it is necessary to conduct separate analyses for different
phases of the response. The following analyses corresponding to different phases of the response should
be carried out:
• Cyclic analysis without liquefaction, in which inertial loads that would occur in the absence of
liquefaction are considered.
• Cyclic liquefaction analysis, estimating the potential and consequences of liquefaction, and
considering simultaneous kinematic loads (due to cyclic ground displacements) and structural inertial
loads while accounting for stiffness and strength degradation due to excess pore water pressures.
• Lateral spreading analysis, estimating the potential for liquefaction and consequences of lateral
spreading including large stiffness and strength degradation and kinematic loads due to large
displacements associated with lateral spreading. Inertial loads may be considered in this analysis, but
such loads are of secondary importance in the spreading phase, and can be ignored in many cases.
Classification of design methods
Methods of analysis for bridges and piles in liquefied soils range from simplified methods using an
equivalent static analysis approach to a rigorous time history analysis based on the effective stress
principle. These analysis methods can be classified into three different categories:
1 Pseudo-static analysis (PSA) or equivalent static analysis.
2 Direct dynamic time history analysis: a) effective stress analysis (ESA) considering effects of excess
pore pressures and liquefaction through detailed constitutive modelling, and b) total stress analysis
(TSA), dynamic analysis using total stresses or equivalent stresses (either ignoring excess pore
pressures or considering them in a simplified manner). In the direct method of analysis (ESA and TSA),
the response of the soil-pile-pier-abutment-deck system can be considered over the entire period of
time from the initiation of shaking to the final stage of post-earthquake equilibrium and residual
deformation of the bridge in a single analysis.
3 Substructure analysis methods which use some features of PSA, ESA or TSA but are essentially hybrid
approaches tailored to address specific aspects in the performance assessment. For example, the well-
known Newmark-type analysis (which is a simplified, user-defined time history analysis) would be a
typical representative of this group of methods. The substructure method uses a set of separate but
related analyses to assess the performance of a bridge subsystem.

Executive summary
9
The effect of liquefaction and lateral spreading can be evaluated by considering a single member (eg a
single pile), a subsystem of the bridge (pile group, pier piles or piled abutment), or the whole bridge. Each
of these models is acceptable in the evaluation of the bridge performance provided that proper boundary
conditions and modelling assumptions are used, and that there is a clear understanding of the analysis
objectives and limitations. The cyclic response should be considered both in the transverse and
longitudinal directions, whereas the lateral spreading response is commonly considered in the longitudinal
direction of the bridge.
Pseudo-static analysis
Based on our review of available PSA methods, the following design methods would be appropriate for
New Zealand conditions and are described in the report:
• Cubrinovski method
• Pacific Earthquake Engineering Research Center (PEER) method
Time history analysis
A non-linear time history analysis allows investigation of the dynamic response of the bridge while
accounting for the complex soil-pile-pier-abutment-deck interaction or response of the bridge system in
liquefying and laterally spreading soils. A sound numerical analysis that is well calibrated and executed
provides the most realistic simulation of the actual bridge behaviour.
Substructure analysis
A design procedure proposed in a 2003 report by the Multidisciplinary Center for Earthquake Engineering
Research is considered to be appropriate for the substructure analysis and is described in the research
report.
Structural mitigation approaches
Two main approaches for mitigation of liquefaction induced lateral spreading are described:
1 Minimising the effect of lateral spreading on the most vulnerable part of the structure and utilisation
of the superstructure to support the abutments and piers
2 Resisting lateral spread loads at the abutments.
Soil structure interaction should be considered in the design of foundations under the effect of lateral
spreading loads.
Conclusions and recommendations
Available design procedures based on observed seismic behaviour of bridges and on the most recent
research findings have been summarised and design methods appropriate for New Zealand conditions
have been identified. Additional work will be required to summarise the findings in a form of a technical
memorandum which can be later incorporated into NZ Transport Agency’s Bridge manual and
disseminated to the wider New Zealand engineering community.
Design guidance for bridges in New Zealand for liquefaction and lateral spreading effects
10
Abstract
This report presents a summary of the outcomes from a research project commissioned by the NZ
Transport Agency to develop design guidance for bridges in New Zealand for liquefaction and lateral
spreading effects. The study involved review of relevant case studies and available design methods. The
report summarises available design procedures that are based on observed seismic behaviour of bridges
and on the most recent research findings, and identifies design methods appropriate for New Zealand
conditions. The report also considers issues associated with liquefaction and lateral spreading and their
effect on bridge structures and summarises requirements for geotechnical investigations, evaluation
techniques for liquefaction and lateral spreading, methods of ground improvements, methods of
liquefaction analysis, structural mitigation solutions, construction and monitoring issues. The report also
identifies areas where supporting information is not available and further research work is required.
Additional work is recommended to summarise the findings in a form of a technical memorandum which
can be later incorporated into the NZ Transport Agency’s Bridge manual and disseminated to the wider
New Zealand engineering community. This report is intended for engineers who are familiar with
geotechnical and structural design practice for static and seismic loading of bridges.

1 Introduction
11
1 Introduction
New Zealand’s state highway network has a vital role as the strategic road network for the country,
enabling people to get to and from work quickly and efficiently, providing a convenient and robust route
for freight and connecting communities. Also, New Zealand state highways serve as primary lifelines
following natural disasters. The seismic performance of bridges has a substantial effect on post-
earthquake response and recovery efforts and on the quality of life of affected communities.
Bridges and highway structures located at sites with shallow groundwater tables or close to bodies of
water can be susceptible to earthquake damage. Liquefaction of saturated sand-like materials (sands,
sandy gravels, non-plastic silts) and cyclic softening or cyclic failure of clay-like materials (plastic silts and
clays) and lateral spreading can result in significant damage to bridges and highway structures.
Earthquake damage to bridge abutment slopes on sites prone to liquefaction and lateral spreading may
include ground failures, excessive lateral displacements and settlements. A large number of recorded
cases of damage to bridge foundations due to the lateral displacements and settlements associated with
liquefaction have been reported worldwide. There are also recent examples of earthquake damage to
bridge structures caused by liquefaction and lateral spreading in Christchurch as a result of the 2010
Darfield and 2011 Christchurch earthquakes.
Soil deformation caused by liquefaction and lateral spreading can result in damage to bridge abutments,
pier foundations and structural elements of bridges. Damage to bridges associated with liquefaction and
lateral spreading has been well documented. Information on causes and effects of liquefaction and lateral
spreading as well as some case studies are included in appendix A. A detailed report on the performance
of highway structures during the Darfield and Christchurch earthquakes of 4 September 2010 and 22
February 2011 has been prepared by Wood et al (2012.
A conservative design approach quite often results in the need for costly ground improvement to fully
mitigate against liquefaction, cyclic softening and lateral spreading at bridge sites. Regular review and
improvement of design methods for bridges located on sites prone to liquefaction and lateral spreading is
critical for the development of cost-effective bridge designs.
This report is a result of a NZ Transport Agency (Transport Agency) research project towards the
development of design guidelines for the design of bridges on sites prone to liquefaction and lateral
spreading in New Zealand. The research project included a review of seismic behaviour of bridges on sites
prone to liquefaction and lateral spreading in New Zealand and overseas, review of available design
methods for bridges against liquefaction and lateral spreading effects as well as detailed consideration of
the bridge design framework in New Zealand.
The purpose of this report is to identify a clear set of available procedures for analysis and design based
on observed seismic behaviour of bridges (reviewed case studies) as well as on the most recent research
findings. The report summarises these methods and provides references to supporting materials (where
such references are available) and identifies design methods appropriate for New Zealand conditions. A
clear set of design guidelines and design examples will be developed as part of a proposed extension of
the project. The guidelines will then be incorporated into the Bridge manual (NZ Transport Agency 2013a).
The report also considers a large number of issues associated with liquefaction and lateral spreading and
their effect on bridge structures, and summarises requirements for geotechnical investigations, evaluation
techniques for liquefaction and lateral spreading, methods of ground improvements, methods of
liquefaction analysis, structural mitigation solutions, construction and monitoring issues. It was not
possible to address all design issues in detail within the scope of this research project, therefore the

Design guidance for bridges in New Zealand for liquefaction and lateral spreading effects
12
report also identifies areas where supporting information is not available and further research work is
required. Design of bridges for liquefaction and lateral spreading effects is a complex technical problem
and a large number of issues associated with the design process require further research and refinement.
Additional work will be required to summarise the findings in a form of a technical memorandum which
can be later incorporated into the Transport Agency’s (2013a) Bridge manual and disseminated to the
wider New Zealand engineering community.
This report promotes close interaction between structural and geotechnical engineers through the design
process and is intended for engineers who are familiar with geotechnical and structural design practice for
static and seismic loading of bridges.

2 Preliminary considerations
13
2 Preliminary considerations
2.1 Liquefaction-related design issues
The key considerations and issues that are important for the design of bridges on sites prone to
liquefaction and lateral spreading include those relating to:
• geotechnical investigations:
– scoping and staging of geotechnical investigations to obtain necessary information for analysis of
liquefaction and lateral spreading
– geotechnical investigation techniques for field and laboratory testing
– determination of site subsoil class
– development of a reliable ground model
• the evaluation of liquefaction and lateral spreading:
– determination of seismic demand (global seismic hazard analysis or site-specific seismic studies)
– liquefaction triggering (seismic demand and liquefaction resistance)
– liquefaction-induced ground displacements (transient and settlement)
– permanent ground displacements due to spreading
– evolution of liquefaction and associated loads with time
– influence of embankments on liquefaction and stability of embankments on liquefied soil
– characteristics, uncertainties and outstanding issues in the state-of-the-practice methods for
evaluation of triggering of liquefaction, settlement and lateral spreading
– some issues of practical concern (liquefaction of low plasticity silts, probabilistic vs deterministic
liquefaction evaluation, effect of groundwater conditions and artesian water heads, liquefaction at
depth and maximum depth of liquefaction, cyclic mobility, partial liquefaction and limited shear
strain)
– additional geotechnical investigations to refine analysis of liquefaction and lateral spreading (if the
need for such refinement can be justified)
– assessment of reduced bearing/pull out capacity of the foundation piles and of the effect of
negative skin friction
• ground improvement:
– available methods of ground improvement
– cost of ground improvement work
– reliability and resilience of adopted ground improvement methods (including factors affecting
choice of ground improvement techniques)
– effectiveness of ground improvement in mitigating liquefaction and/or its effects
– level of design and construction documentation and quality assurance (QA) required for ground
improvement

Design guidance for bridges in New Zealand for liquefaction and lateral spreading effects
14
• detailed analysis of the effect of liquefaction and lateral spreading on the bridge structure:
– methods of analysis (framework and selection of appropriate method)
– determination of model parameters (range of values)
– boundary conditions and pile-group effects
– key uncertainties (sensitivity analysis)
– soil-foundation-abutment-structure interaction
– performance criteria (displacements, plastic deformation in piles and piers, need for post-
earthquake repair or replacement of the bridge)
– design, modelling, analysis and interpretation of effects of ground improvement
• structural design:
– interaction between structural and geotechnical designers
– definition of acceptable damage states and design for adopted damage states
– structural detailing of bridges to reduce damage and increase reparability
• construction:
– confirmation of ground conditions and design assumptions
– control of ground improvement quality
• post-construction monitoring:
– equipment to monitor post-earthquake performance of bridges (eg inclinometers in piles and/or
ShapeAccelArrayTM which consists of a chain of sensor elements (segments) joined together in
such a manner that they can move in relation to each other in all directions except for twisting,
each segment contains a multi-axial MEMSchip accelerometer which makes the segment act as an
extremely accurate inclinometer)
– post-earthquake inspections and assessment
The quality of the developed design solution, the seismic behaviour of bridges and the ability of the
bridge and geotechnical engineers to assess the post-earthquake condition of the bridge are highly
dependent on whether all of these issues have been adequately addressed.
2.2 Structure performance requirements
The NZ Transport Agency (2013a) Bridge manual 3rd edition sets out the structure performance
requirements in section 5.1.2 as follows:
The primary objective of seismic design shall be to ensure that the structure can safely
perform its function of maintaining communications after a seismic event. The extent to
which this is possible will depend on the severity of the event, and thus by implication on its
return period.
For design purposes, the structures shall be categorised according to their importance, and
assigned a risk factor related to the seismic return period. This will then result in an
equivalent design earthquake hazard and consequent loading as defined in 5.2.

2 Preliminary considerations
15
If the behaviour at this design intensity meets the criteria of (a), it is expected that with
appropriate detailing, behaviour at other intensities as in (b) and (c) will also be satisfactory,
and no further specific analytical check is required except where there is the possibility of
loss of ground strength or failure that could bring about structure collapse. However,
performance expectations outlined below warrant philosophic consideration in design and
detailing, and discussion in the structure options report and structure design statement.
The seismic performance criteria requirements are as follows [reproduced below as table 2.1]:
(a) After exposure to a seismic event of design severity, the structure shall be useable by
emergency traffic, although damage may have occurred, and some temporary repairs
may be required to enable use. Permanent repair to cater for at least one subsequent
seismic event of design severity should be feasible.
(b) After an event with a return period significantly less than the design value, damage
should be minor, and there should be no disruption to traffic.
(c) After an event with a return period significantly greater than the design value, the
structure should not collapse, although damage may be extensive. It should be usable
by emergency traffic after temporary repairs and should be capable of permanent
repair, although a lower level of loading may be acceptable.
Table 2.1 Seismic performance requirements (from the NZ Transport Agency Bridge manual 3rd edition)
Earthquake severity Minor earthquake as (b)
Return period factor =
Ru/4
Design level earthquake
as (a) return period factor
= Ru (ULS event)
Major earthquake as (c )
Return period factor = 1.5
Ru
Post-earthquake function –
immediate
No disruption to traffic Useable by emergency
traffic
Useable by emergency
traffic after temporary
repair
Post-earthquake function –
reinstatement
Minimal reinstatement
necessary to cater for all
design-level actions
Feasible to reinstate to
cater for all design-level
actions, including repeat
design-level earthquake
Capable of permanent
repair, but possibly with
reduced load capacity
Acceptable damage Damage minor Damage possible;
temporary repair may be
required
Damage may be extensive;
collapse prevented
The design of any structure located in an area which is susceptible to earthquake induced
liquefaction, or which is over an active fault with a recurrence interval of 2000 years or less,
shall recognise the large movements which may result from settlement, rotation or
translation of substructures. To the extent practical and economic, and taking into
consideration possible social consequences, measures shall be incorporated to mitigate
against these effects.
2.3 Liquefaction effects on structures
2.3.1 Ground settlement
Effects on the structure include the following:

Design guidance for bridges in New Zealand for liquefaction and lateral spreading effects
16
• overall settlement, and differential settlement between supports and across the width of the structure,
racking the structure
• down-drag loading induced on the foundation piles
• effect on services carried on the bridge.
Loss of stiffness and strength of soil have the following consequences:
• reduction in bearing and pull out capacity of deep foundations (piles)
• reduction in stiffness and strength of soil resisting lateral movement of deep foundations (piles)
• effect on overall stiffness of the bridge structure.
2.3.2 Ground lateral spreading
The behaviour of laterally spreading ground can be described as follows:
• Lateral spreading arises as a result of loss of strength in the ground giving rise to failure through
higher ground and down into underlying liquefied material as the higher ground seeks to reduce its
potential energy by settling and spreading. The ground surface seeks to level itself and flow will be
towards areas of lower ground surface level or open face of the channel (waterway). Spreading
displacements can be driven either by inertial loads during the strong ground shaking or by post-
liquefaction gravity-imposed loads.
• The depth of lateral soil spreading is to be determined by the depth of the river channel and location
of critical layers governing the spreading.
• Stronger material as usually exists in bridge approach embankments can ‘raft’ on top of liquefied
underlying material.
The following effects on the structure should be considered:
• The effect of lateral spreading on the foundations (and the other way around) depends on whether soil
moves past the foundation (typically the case when there is no (significant) raft/crust on top of the
liquefied layer) or a significant movement of the foundation occurs (typically when a raft/crust of non-
liquefiable material exists on top of the liquefiable layer). The assessment requires a comparison
between the passive soil forces imposed by the soil on the foundation system versus ultimate
structural resistance.
• Lateral loading will be applied to structure elements that the spreading soil comes in contact with.
This lateral loading on a single pile can be as high as 4.5x the rankine passive pressure. For
individually widely spaced piles, where soil arching between piles comes into play, the effective width
is the width of the pile group.
• Lateral spreading loads should be assessed using the material properties appropriate to the state of
the soil materials. Reduced properties should be adopted for laterally spreading liquefied material.
Note that pile group effect in the liquefied layers may not be as significant as in the non-liquefied
soils.
• Damage to piles has occurred particularly at the boundaries in soil layers at which significant changes
in stiffness occur.
• The pinning effect (resistance to lateral movement) of the foundation system should be taken into account.
2 Preliminary considerations
17
2.3.3 Effects of liquefaction on the vertical response of piles
Pile response to lateral spreading and inertia often dominate the design of bridge piles in areas
susceptible to liquefaction. However, vertical aspects of the pile response must also be considered in
design. These aspects include:
• temporary reduction in pile geotechnical capacity
• reduced structural capacity of the pile
• settlement of the pile head.
2.3.3.1 Geotechnical pile capacity following liquefaction
The generation of excess pore water pressure in liquefied layers and the associated reduction in soil
strength will reduce the geotechnical capacity of piles. As excess pore pressures dissipate in the hours to
weeks following the initiation of liquefaction, the near pre-earthquake pile capacity of piles will return.
Piles and pile groups should be designed so they have sufficient geotechnical capacity to satisfy the post-
earthquake performance requirements given in the Bridge manual.
When calculating post-liquefaction pile capacity, no capacity from shaft friction should be assumed for
sections of the shaft in liquefiable soils. Piles can form preferential pathways for dissipation of excess
pore pressures from liquefied layers. Shaft friction may also be reduced in non-liquefied layers following a
strong earthquake due to gapping between the soil and piles from plastic deformation of the crust with
back and forward movement during shaking. Therefore consideration should be given to reducing shaft
friction for sections of pile in non-liquefiable layers for design.
Liquefaction of layers near the tip of piles and pile groups (both above and below) can severely reduce
their end bearing capacity. The migration and redistribution of pore pressures throughout the soil profile
(as excess porewater pressures dissipate from liquefied layers) can also reduce the strength of a dense
bearing stratum. Furthermore, research has shown that excess porewater pressures can be generated in
non-liquefiable dense bearing layers during strong earthquake shaking, reducing their capacity to support
piles (Madabhushi et al 2010).
The ultimate geotechnical end bearing capacity of individual piles following initiation of liquefaction can
be calculated using conventional methods with reduced strengths for liquefied soils near the tip and,
where relevant, reduced strength of the bearing layer itself. Madabhushi et al (2010) provide guidelines for
accounting for pore pressure increases in dense bearing strata and designing piles against bearing failure
at sites with liquefiable soils.
2.3.3.2 Pile settlement
Three mechanisms that can cause post-liquefaction vertical subsidence of pile heads are:
1 Transfer of axial load from the pile shaft to its base when soil surrounding the shaft liquefies
2 Down-drag with reconsolidation of liquefied layers as excess pore pressures dissipate and the
downward friction of non-liquefied layers excavated above the liquefied layers. Subsidence results
from compression of the pile and shear deformation of soil around the lower part of the pile as the
load on the base increases
3 Post-liquefaction reconsolidation of liquefied layers below the pile bearing layer.
Settlements due to load transfer during reconsolidation of liquefied sand can be estimated using the
method by Boulanger et al (2003) which is essentially a modification of the neutral plane solution
originally developed by Fellenius (1972).

Design guidance for bridges in New Zealand for liquefaction and lateral spreading effects
18
2.3.3.3 Structural pile capacity following liquefaction
Piles in liquefiable soil can be susceptible to buckling from reduced lateral support of the pile and lateral
displacement of the pile head (p-delta effects). Madabhushi et al (2010) and Bhattacharya (2006) provide
guidelines for calculating the potential for buckling of piles in liquefiable ground.
This report mostly deals with lateral response of piles affected by liquefaction and lateral spreading. While
the vertical response of piles affected by liquefaction is important and should be considered in the design
process, detailed consideration of this issue and development of detailed recommendations on this design
aspect was beyond the scope of this research.

3 Geotechnical investigations
19
3 Geotechnical investigations
Geotechnical investigations for the assessment of liquefaction potential of soils and their seismic
behaviour are generally carried out in several stages:
1 Preliminary geotechnical appraisal of the site ground conditions
2 Geotechnical investigations
3 Evaluation of liquefaction potential and potential consequences of liquefaction.
3.1 Preliminary geotechnical appraisal
A preliminary geotechnical appraisal involves establishing the topography, stratigraphy and location of the
ground water table at the project site. This preliminary geotechnical work should address the following
questions (California Geological Survey 2008):
• Are potentially liquefiable soils present?
• What is the grain size and grading of soils?
• Are they saturated and/or likely to become saturated at some future date?
• Are they of sufficient thickness and/or lateral extent to pose potential risk of damaging ground
deformations (including lateral spreading)? (Liquefaction hazards are commonly considered in the top
20m, but on a slope near a free face or where deep foundations go beyond that depth, liquefaction
potential should be considered at greater depths.)
• Does the geometry of liquefiable soil zones within the foundation soils pose significant risks that
require further investigation? (Thick deposits of liquefiable soils generally require further
investigation. Additionally, relatively thin seams of liquefiable soils, if laterally continuous over
sufficient area, can represent potentially hazardous planes of weakness and sliding, and may thus
pose a hazard with respect to lateral spreading and related ground displacements.)
Important considerations for the stage of the preliminary geotechnical appraisal include the following
(Dickenson et al 2002):
• soil nature, soil fabric and structure (the nature of soil and the method of deposition and compaction
have a significant influence on liquefaction resistance)
• depth to ground water table and saturation of soils
• density of soils (it is the most important factor governing the liquefaction resistance of a cohesionless
soil)
• geologic age (or time under a sustained overburden) can significantly increase the liquefaction
resistance of soils overtime
• prior cyclic load history (prior seismic excitation may or may not increase liquefaction resistance;
more recent seismic excitation causing full or nearly full liquefaction does not increase and may
actually reduce liquefaction resistance of soils)
• over consolidation (this can increase liquefaction resistance)

Design guidance for bridges in New Zealand for liquefaction and lateral spreading effects
20
• drainage characteristics (the ability to rapidly dissipate excess pore pressures, which is a function of
the permeability of the soil and the drainage boundary conditions imposed by the surrounding soils,
affects the liquefaction resistance)
• effective confining stress (resistance to cyclic pore pressure generation and/or liquefaction increases
with increased effective confining stress).
• presence of non-liquefied crust (the crust reduces liquefaction manifestation and ground distortion
near the surface
• grain size and particle grading.
Sands and sandy soils that are loose to medium dense or even dense can be potentially liquefiable. Sandy
soils with fines content greater than 50% and a plasticity index (PI) of greater than 12% are generally
considered to be non-liquefiable. The influence of fine-grained soil on the liquefaction resistance of
predominantly sandy soils is a topic that has received considerable attention over the past decade.
Examination of fine-grained soil behaviour during strong earthquakes and the results of laboratory tests
reveal that uniformly graded loose sandy soils and even silty soils that contain over 30% non-plastic to low
plasticity fines may be highly liquefiable (Dickenson et al 2002).
Gravelly soils and rock fills can also have a potential for liquefaction. A large number of case studies
confirm that gravelly soils can liquefy. Most coarse, gravelly soils are relatively free draining. However, if
the voids are filled with finer particles, or the surrounded soils have low permeability, then drainage may
be insufficient and liquefaction may occur. When gravel layers are of considerable thickness and lateral
extent, pore pressures may not be able to dissipate and this may also result in liquefaction. Case studies
have shown that most liquefied gravelly soils are mixtures of sands, gravels and fines.
A more detailed discussion on liquefaction potential of soils is included in chapter 4 of this report.
In assessing the potential presence of liquefiable soil types, investigations should extend to a depth below
which liquefiable soils cannot be reasonably expected to occur. Field evidence, as observed in Kobe and
Loma Prieta earthquakes, has shown that liquefaction may occur to depths of up to 20m. In Japan
liquefaction below 20m depth is not considered. It is important to consider the maximum possible depth of
liquefaction, and effect of liquefaction at depth while deciding the required depth of geotechnical testing.
Liquefaction resistance can be roughly correlated with geologic age, depositional environment and prior
seismic history. Generally, geologically young natural sandy formations are most susceptible to
liquefaction. Such deposits can be found in offshore, coastal or floodplain areas when deposits are formed
by the soil particles settling through water and coming to rest in a very loose state (Dickenson et al 2002).
This means that the latest Holocene deposits, typically related to the natural drainage network, are most
susceptible to liquefaction. Deposits older than late Pleistocene are assumed to be not susceptible to
liquefaction, based on their performance during earthquakes. In various regions of New Zealand
liquefaction hazard maps have been developed by local authorities based on local general geology data
complemented by recent borehole and cone penetration test (CPT) information and can be used for
preliminary geotechnical appraisal purposes.
Soils exhibiting high liquefaction susceptibility can be produced by hydraulic filling methods, where a
cohesionless material is placed by dumping through water or as part of a pumped slurry (this is a very
common method for construction of reclamation fills and embankments).
In order to be susceptible to liquefaction, soil should be saturated. If it can be demonstrated that soils
present at a site are currently unsaturated, have not recently been saturated, and/or cannot reasonably be
expected to become saturated for a significant length of time during the design life of a structure founded

3 Geotechnical investigations
21
on these materials, then such soils may be considered to pose no liquefaction hazard (Dickenson et al
2002). Preliminary site evaluations should identify the possibility of high groundwater tables.
Layers of liquefiable soils that are very loose over sufficient area can represent hazardous planes of
weakness and sliding. Where lateral containment is provided to eliminate potential for sliding on liquefied
layers, the thin liquefiable zones at depth may be considered to pose no significant risk.
If a preliminary geotechnical appraisal evaluation can clearly demonstrate the absence of a liquefaction
hazard at a project site, then no geotechnical investigations to identify potential for liquefaction may be
required.
If the preliminary geotechnical appraisal indicates the presence of potentially liquefiable soils, then the
potential of these soils for liquefaction (or significant loss of strength due to cyclic loading) should be evaluated
and geotechnical investigations should be carried out. If the preliminary geotechnical appraisal does not
eliminate the possibility of liquefaction at a project site, then geotechnical investigations are required.
It should be noted that investigations to assess liquefaction potential of soils normally form part of overall
geotechnical investigations for a project. Therefore investigations for liquefaction should be scoped and
carried out as part of the overall geotechnical investigations for a project.
3.2 Geotechnical site investigations
The geotechnical site investigation should identify and characterise the subsurface conditions and all
geological hazards (including liquefaction and lateral spreading hazards) that may affect the seismic
analysis and design of the proposed structures. The goal of the site characterisation for seismic design is
to develop the subsurface profile and obtain soil property information needed for liquefaction assessment
and for seismic analyses. Both the geotechnical designer and the structural designer should be involved in
scoping geotechnical investigations, as seismic design is a combined effort between the geotechnical and
structural disciplines.
While scoping geotechnical investigations, in accordance with Oregon State Department of Transportation
(2012) Geotechnical design manual, volume 1, the geotechnical designer should:
• identify potential geologic hazards, areas of concern (eg deep, soft soils or liquefiable soils) and
potential variability of local geology
• develop good understanding of possible structural forms of the required bridge and approximate level
of structural loads
• carry out preliminary consideration of ground conditions, possible forms of the bridge foundations
and of the required maximum depth of boreholes and CPTs
• identify engineering analyses to be performed (eg ground response analysis, liquefaction
susceptibility, susceptibility to cyclic mobility, lateral spreading/slope stability assessments, seismic-
induced settlement/down drag, dynamic earth pressures)
• identify engineering soil/rock properties required for these analyses
• determine methods to obtain the required design parameters and assess the validity of such methods
for the soil and rock material types
• develop an integrated investigation programme for in-situ testing, soil sampling and laboratory
testing. This should include the number of samples needed and appropriate locations and sampling
techniques to obtain them, as well as appropriate test methods.

Design guidance for bridges in New Zealand for liquefaction and lateral spreading effects
22
The following test techniques should be considered depending on site conditions (Oregon State
Department of Transportation 2012):
• boreholes and cone penetration tests with associated testing, as described below
• standard penetration tests (SPTs) in boreholes – SPT test data is used for the assessment of
liquefaction potential of soils
• SPT hammer energy: this value (usually termed hammer efficiency) should be noted on the boring logs
or in the geotechnical report. The hammer efficiency should be obtained from the hammer
manufacturer, preferably through field testing of the hammer system used to conduct the test. This is
needed to determine the hammer energy correction factor for liquefaction analysis
• grading tests (including wet sieving) on soil samples to determine the liquefaction potential
• laboratory testing including Atterberg limit tests, specific gravity, organic content, water content, unit
weight and shear box tests
• shear wave velocity measurements to determine subsoil class, develop a shear wave velocity profile
for the soil layers and to assess low strain shear modulus values to use in analyses such as dynamic
soil response
• seismic piezocone penetrometer to determining soil site class, develop a shear wave velocity profile
and obtain low strain shear modulus values to use in a ground response analysis
• piezocone penetrometer test for liquefaction analysis. Pore pressure measurements and other
parameters can be obtained for use in foundation design and modelling. This test is also useful in
establishing the pre-construction subsurface soil conditions prior to conducting ground improvement
techniques and the post-construction condition after ground improvement
• depth to bedrock should be established. If a ground response analysis is to be performed the depth to
bedrock must be known
• pressure meter tests can be useful for development of p-y curves. Testing is typically performed in
soft clays, organic soils, very soft or decomposed rock and for unusual soil or rock materials. The
shear modulus, G, for shallow foundation modelling and design can also be obtained
• static or cyclic plate load tests
• static or cyclic screw plate load tests
• in-situ testing of seismic behaviour of soils by subjecting the soils to cyclic loading using a large scale
in-situ cyclic loading test where cyclic loading is generated by a truck-based vibration machine (TRex
or similar)
• dilatometer tests
• field trials using explosives to confirm liquefaction potential of soil
• at a later stage of the design process, the need for ground improvement field trials (to prove
effectiveness of proposed method of ground improvement) should be considered.
Geotechnical reports that address liquefaction and lateral spreading hazards at bridge sites should include
the following information (California Geological Survey 2008):
• if methods other than the SPT and CPT are used, a description of equipment and testing procedures

3 Geotechnical investigations
23
• borehole logs showing detailed soil and rock description in accordance with NZGS (2005) Guideline for
the field classification and description of soil and rock for engineering purposes and SPT N-values if
SPTs are performed (SPTs should be carried out using calibrated hammers so that the hammer energy
ratio or hammer efficiency is known)
• CPT logs showing plots of cone resistance and sleeve friction values if CPTs are performed (CPT
equipment should be in current calibration and electrical cones checked for zeroing error at the end of
each CPT profile)
• explanation of the basis of the methods used to convert raw SPT, CPT or non-standard test data to
corrected values
• tabulation and/or plots of corrected values used for analyses
• explanation of methods used to develop estimates of the cyclic stress ratios used to represent the
anticipated field earthquake excitation
• explanation of the basis for evaluation of the cyclic stress ratio necessary to cause liquefaction at the
number of equivalent uniform loading cycles considered representative of the design earthquake
• factors of safety against liquefaction at various depths and/or within various potentially liquefiable
soil units
• description of assessment methods used and conclusions regarding the potential for liquefaction and
lateral spreading and likely deformation and its likely impact on the proposed project
• preliminary discussion of proposed mitigation measures necessary to reduce potential damage caused
by liquefaction to an acceptable level of risk; detailed recommendations should be developed as a part
of the detailed design process
• criteria for SPT-based, CPT-based, or other types of acceptance testing that will be used to
demonstrate satisfactory quality of ground improvement, if applicable.

Design guidance for bridges in New Zealand for liquefaction and lateral spreading effects
24
4 Evaluation of liquefaction and lateral spreading
4.1 Introduction
Past large-scale earthquakes have demonstrated that bridges and ancillary components (abutments,
approach fills, embankments and pile foundations) located at sites of shallow groundwater and/or
adjacent to bodies of water are highly susceptible to liquefaction-induced damage. In order to prevent
and/or minimise such damage, there is a need to evaluate the liquefaction potential at the site, and to
predict the associated ground deformations in order to evaluate how they affect the bridge structures.
The evaluation of soil liquefaction and its effects involve several steps, from determining the seismic
demand at the site to evaluating liquefaction susceptibility, liquefaction triggering and liquefaction-
induced deformations. These steps may involve either simplified or detailed analysis procedures. This
section provides guidelines on how these steps are conducted.
4.2 Determination of seismic demand
Evaluation of liquefaction potential of sandy deposits is usually performed for a certain specified level of
shaking, typically described by a design ground motion, which can be characterised by design ground
motion parameters. For geotechnical earthquake engineering, the amplitude (the largest value of
acceleration recorded during the earthquake, represented by peak ground acceleration (PGA) and duration
of shaking (which can be related to earthquake magnitude) are the key input parameters to most common
design procedures, with no direct consideration of the frequency (represented by the response spectrum).
These input parameters can be evaluated for a target site using code-based approaches or by site-specific
seismic hazard/response analysis.
It is recommended that determination of the seismic demand at bridge sites follow recommendations of
the Bridge manual, where the PGA to be applied shall be ‘unweighted’ and derived for the relevant return
period. Similarly, the earthquake magnitude is also derived for the relevant return period.
An alternative method is that recommended by the Geotechnical earthquake engineering practice: module
1 – guideline for the identification, assessment and mitigation of liquefaction hazards (NZGS 2010) where
two methods of defining the seismic demand are described These are based on the provisions of design
standards (ie NZS 1170.5: 2004) and on site-specific analyses (seismic hazard analysis and ground
response analysis).
4.3 Evaluation of liquefaction
Evaluation of liquefaction generally involves the following steps:
1 Liquefaction susceptibility:
a Are the soils at the site liquefiable or not?
2 Triggering of liquefaction:
a Is the ground motion of the adopted ‘design earthquake’ strong enough to trigger liquefaction at
the site?

4 Evaluation of liquefaction and lateral spreading
25
3 Consequences of liquefaction:
a If liquefaction does occur, what will be the extent and magnitude of resulting ground
deformation?
4 Effects of liquefaction on structures:
a What will be the effect of liquefaction on the seismic performance of structures?
5 Mitigation of liquefaction and its consequences:
a Determine an acceptable level of performance and if liquefaction-induced ground displacements
are intolerable or the structure’s performance is below an acceptable level, then what
countermeasures should be used against soil liquefaction?
This section focuses on liquefaction susceptibility and methods of analysis for assessment of liquefaction
triggering. Evaluation of magnitude of ground deformation is discussed in section 4.4, while mitigation
measures are addressed in chapters 5 and 7.
4.3.1 Liquefaction susceptibility
It is well known that sites consisting of loose cohesionless sediments (gravels, sands and very low-
plasticity silts) and with sufficiently high water table for these sediments are susceptible to liquefaction.
Thus, knowing the geology of the site in question and the nature and properties of the soils are a key
component in determining whether the soils in that location are liquefiable or not. Several methods are
available to evaluate liquefaction susceptibility of sites and these should be adopted as initial screening
tools when assessing possible extent of liquefaction at specific sites.
4.3.1.1 Historical criteria
Liquefaction case histories are often used to identify specific sites, or more general site conditions, which
may be susceptible to liquefaction in future earthquakes. Youd (1991) pointed out some case histories
where susceptibility maps were developed based on historical evidence of liquefaction occurrence.
Moreover, post-earthquake field investigations have shown that liquefaction occurrence has been confined
within a zone of certain distance from the seismic source. Based on case histories, several investigators
have plotted the maximum extent of liquefied sites as a function of the magnitude of the earthquake (eg
Youd and Perkins 1978; Ambraseys 1988). Hence, if the seismic activity at the target site is known, the
maximum extent of liquefaction susceptible area can be directly estimated.
4.3.1.2 Geological and geomorphological criteria
Correlations between past liquefaction occurrences and geological and geomorphological criteria can also
be used to identify sites susceptible to liquefaction. The depositional environment, hydrological
environment and age of soil deposit all contribute to its liquefaction susceptibility (Youd and Hoose 1977).
Based on the study by Youd and Perkins (1978), sediments most susceptible to liquefaction are fills and
alluvial, fluvial, marine, deltaic and wind-blown deposits. In addition, recently deposited sediments are
most susceptible to liquefaction, becoming more resistant when they become older.
4.3.1.3 Compositional criteria
Compositional characteristics associated with high volume change potential, such as particle size, shape
and gradation, tend to be associated with high liquefaction susceptibility (Kramer 1996). Uniformly graded
soils have higher volume change potential therefore, tend to build up pore pressure more readily than
well-graded soils. Based on this concept and on field evidence, the Japanese Ministry of Transport (MTJ
1999) has proposed a zone expressed in terms of grain size distribution separating potentially liquefiable

Design guidance for bridges in New Zealand for liquefaction and lateral spreading effects
26
soils from fine-grained soils which are not vulnerable to liquefaction. Subsequent studies however suggest
that even finer soils than those proposed possessed a high degree of potential to liquefaction if the fines
are non-plastic. Moreover, well-graded reclaimed fills containing 30%–60% gravels, well beyond the zones
proposed, liquefied following the 1995 Kobe (Japan) earthquake. The NZGS guidelines (NZGS 2010) stated
that based on current knowledge, grading criteria alone are not a reliable indicator of liquefaction
susceptibility.
In the NCEER Workshop recommendations (Youd et al 2001), there is no specific mention of the
liquefaction potential of silts and clay and the so-called Chinese criteria ‘might be applied’ to verify the
soil type and whether the soil is liquefiable or not. However, the use of these criteria has been discouraged
in US practice (Boulanger and Idriss 2004a) and assessment of liquefaction susceptibility of fine-grained
soils have been proposed based on recent studies (eg Bray et al 2004; Boulanger and Idriss 2006;
Anderson et al 2007). The NZGS (2010) guideline for the identification, assessment and mitigation of
liquefaction hazards gives more information on this issue.
4.3.2 Liquefaction triggering
Several approaches and methods have been proposed for assessing the potential for liquefaction
triggering. The most widely used method has been the stress-based approach that compares the
earthquake-induced cyclic stresses with the cyclic resistance of the soil. A simplified procedure based on
the empirical method originally proposed by Seed and Idriss (1971) is recommended for assessing the
potential for liquefaction triggering.
In general, the evaluation of liquefaction potential requires the following:
• estimation of the maximum or equivalent cyclic shear stress likely to be induced in the soil deposit
during an earthquake (seismic demand)
• quantitative assessment of liquefaction resistance, or cyclic resistance ratio (CRR) (seismic capacity).
4.3.2.1 Seismic demand
The simplified procedure developed by Seed and Idriss (1971) provides an easy approach to estimate
earthquake-induced cyclic shear stresses without the need for a site response analysis. The cyclic shear
stress ratio (CSR) is as follows:
(Equation 4.1)
Where
τave = equivalent uniform or average cyclic shear stress
σ 'v0 = effective overburden stress
σv0 = total overburden stress
amax
= peak horizontal ground acceleration generated by the earthquake
g = acceleration due to gravity
rd = stress reduction factor which takes into account the flexibility of the soil column.
This equation has remained largely unchanged from its original form. The stress reduction factor, initially
presented graphically by Seed and Idriss (1971) as a function of depth, has been subsequently refined by
various researchers to incorporate the effects of other parameters such as earthquake magnitude,
acceleration and soil shear wave velocity. Typical forms of rd equations are presented by Liao and Whitman
dv
v
v
ave rg
aCSR0
0max
0 '65.0
' σσ
στ
==
4 Evaluation of liquefaction and lateral spreading
27
(1986), Youd et al (2001), Idriss (1999) and Cetin et al (2004) among others. Regardless of which rd
correlation is ‘most correct’, rd curves cannot be ‘mixed and matched’, ie each correlation should only be
used within its recommended procedure (Idriss and Boulanger 2008; Seed 2010).
4.3.2.2 Resistance to liquefaction
The dynamic stress the soil can withstand before liquefying is defined in terms of the CRR. The
recommended method of characterising the liquefaction resistance is based on in situ tests because of the
disturbance inherent in the sampling and laboratory testing of cohesionless soils. In the simplified
procedure, the CRR of the in-situ soil is primarily based on empirical correlations to the SPT, CPT or shear
wave velocity (Vs) measurements. These empirical correlations have been developed from case history
databases of liquefied and non-liquefied soils documented in previous earthquakes.
SPT-based liquefaction triggering procedures use SPT blow count (N) as the basis of computing CRR.
Typical SPT-based CRR relationships were developed by various researchers, such as Youd et al (2001),
Cetin et al (2004) and Idriss and Boulanger (2008). In recent years, however, the CPT has become more
common as an in situ test for liquefaction evaluation, especially as the database of case histories grows
and its simplicity, repeatability and accuracy, not to mention that it provides a continuous record. CPT-
based CRR correlations have been proposed by Robertson and Wride (1998), Moss et al (2006) and Idriss
and Boulanger (2008). When the economics of a project permit, the combination of SPTs and CPTs may
offer a very reliable way to evaluate the liquefaction susceptibility. Vs can also be used to evaluate the
liquefaction potential of soils. Essentially, the procedure is similar to other penetration-based approaches,
and the boundary curves separating liquefaction and non-liquefaction obtained by various researchers are
presented in Youd et al (2001). Note that although liquefaction potential evaluation is typically conducted
deterministically, there are also probabilistic methods available. For example, the methods by Cetin et al
(2004), Moss et al (2006) and Kayen et al (2013) also assess liquefaction occurrence probabilistically by
considering relevant uncertainties such as: measurement/estimation errors, model imperfection, statistical
uncertainty, and those arising from inherent variables. A probability of liquefaction (PL) of 15% is generally
adopted when using these methods for deterministic liquefaction evaluation.
These empirical charts are expressed in terms of CRR7.5, 1 atm
(ie the cyclic resistance ratio of the soil
adjusted to 1 atmosphere of effective overburden pressure for Mw=7.5 earthquake). Note that the various
relationships use different factors to account for earthquake magnitude and overburden stresses. It is
common for CRR relationships to be normalised for this base case, and then site-specific adjustments are
made via magnitude scaling factors (MSF) and overburden correction factors (Kσ) to account for the
earthquake magnitude under consideration and the overburden stresses at the depth of interest. The site
adjusted CRR is obtained from CRR7.5, 1 atm
according to the following equation:
(Equation 4.2)
The adjustment for magnitude is necessary because of the strong correlation between CRR and the
number of loading cycles the earthquake imparts to the soil. The most commonly used expressions for
MSF as a function of magnitude have been proposed by Youd et al (2001), Cetin et al (2004) and Idriss
and Boulanger (2008).
The overburden correction factor (Kσ) is used to extrapolate liquefaction triggering relationships to high
overburden pressures. Typical expressions of Kσ were proposed by Seed and Harder (1990), Hynes and
Olsen (1999) and Boulanger and Idriss (2004b).
It should be mentioned that the various liquefaction triggering procedures cannot be compared solely on
CRR plots. For example, even if the CRR relationships appear to be very similar, one would not necessarily
obtain the same CRR value for a given raw penetration data (N-value or tip resistance) because the factors
σσ KMSFCRRCRRvM ⋅⋅= atm1,5.7',
Design guidance for bridges in New Zealand for liquefaction and lateral spreading effects
28
used to correct the raw data to the penetration index (eg normalised clean sand N-value, (N1)60,cs
or
normalised clean sand tip resistance, qc1,cs
) can vary significantly between relationships. Thus, in the same
way as the rd-values discussed above, each CRR relationship should only be used within its recommended
procedure.
4.3.2.3 Factor of safety
Liquefaction susceptibility is usually expressed in terms of a factor of safety against its occurrence, ie
𝐹𝐿 =𝐶𝑅𝑅𝐶𝑆𝑅
(Equation 4.3)
If FL <1.0, the shear stress induced by the earthquake exceeds the liquefaction resistance of the soil and
therefore, liquefaction is likely to occur. Otherwise, when FL >1.0, liquefaction will not be likely to occur.
Note that this boundary is well understood to be not a distinct line and that engineering judgement needs
to be applied to evaluate the liquefaction susceptibility of soils with FL near unity.
4.4 Liquefaction-induced ground deformations
The significant reduction in stiffness and strength of liquefied soils may result in the development of large
shear strains in the ground during and following intense ground shaking. The maximum cyclic shear
strains can easily reach several percent in liquefying soils in level ground, resulting in large lateral
displacements or ground oscillations. These large cyclic lateral movements are important to consider
because they may generate significant kinematic loads on buried structures and deep foundations.
Moreover, in the presence of driving stresses or unconstrained boundaries (such as free-face near river
banks), the liquefied soil can undergo permanent lateral ground deformations as large as several metres
in some cases.
Following the liquefaction process, the soil deposit undergoes a very complex process involving
dissipation of excess pore water pressure, sedimentation, solidification and re-consolidation of the
liquefied soil resulting in settlement of the ground. These liquefaction-induced settlements occur during
and after the earthquake shaking and can be significant even for free-field level-ground sites.
4.4.1 Ground settlements
Several methods have been developed for estimating the magnitude of earthquake-induced settlements in
sandy soils. One of the most widely adopted methods is that developed by Ishihara and Yoshimine (1992),
who produced a design chart relating volumetric strain (εv) in sandy soils to soil density (Dr) and the factor
of safety against liquefaction (FL). It should be noted that because this procedure was developed for clean
sands, a correction is required for silty sands and silts. The method has been extended by Zhang et al
(2002) for use with CPT data.
Another procedure for estimation of soil densification and related settlements was developed by
Tokimatsu and Seed (1987), where the volumetric strains εv induced by earthquake shaking are expressed
as function of the corrected SPT N-value (N1)60
and cyclic shear stress ratio caused by the earthquake. The
chart was developed for clean sands and for magnitude 7.5 earthquakes, and therefore correction factors
are required for soils with more than 5% fines content, and for earthquakes of magnitude other than 7.5.

4 Evaluation of liquefaction and lateral spreading
29
4.4.2 Cyclic ground displacements
The empirical procedure proposed by Tokimatsu and Asaka (1998) can be used for a preliminary
assessment of cyclic ground displacements in liquefied soils. Similar to the chart developed by Tokimatsu
and Seed (1987) for estimating volumetric strain, this procedure is based on an empirical chart correlating
the maximum cyclic shear strain γcyc in liquefied soil with the SPT N-value (N1)60
and cyclic shear stress
ratio caused by the earthquake.
4.4.3 Permanent ground displacement due to spreading
Prediction of lateral ground displacements is a difficult geotechnical problem. Even though the prediction
of whether a site will liquefy or not can be done with a reasonable degree of confidence, there is no
generally accepted method for evaluating lateral displacements. Current methods can generally be
classified into four categories.
4.4.3.1 Empirical approaches
The most widely adopted methods for estimating lateral spread displacement are empirically based
procedures developed using extensive databases from case studies where measured displacements are
correlated with site-specific topographic, geotechnical, and ground motion data. These include the
empirical equations formulated by Bartlett and Youd (1995) and Youd et al (2002) using a multiple linear
regression (MLR) analysis to take into account a great number of variables in a predictive equation for
horizontal displacements. Other available procedures include the empirical equations proposed by Bardet
et al (2002) and the EPOLLS model of Rauch and Martin (2000). Note that the predicted response from MLR
models may be strongly nonlinear outside the range of the data used to derive the regression coefficients,
and caution is warranted when extrapolating beyond the intended range of parameters.
4.4.3.2 Semi-empirical approaches
These procedures involve estimating the permanent (or residual) shear strains that are expected within the
liquefied zones and integrating those strains over depth to estimate the potential lateral displacement at
the ground surface. The residual shear strains are estimated using charts developed from laboratory tests
and the computed ground displacement is then sometimes empirically modified to take into account case
history observations (eg Tokimatsu and Asaka 1998; Shamoto et al 1998; Zhang et al 2004).
4.4.3.3 Analytical methods
The empirical and semi-empirical methods are developed to evaluate lateral displacements at free-field
sites and these conditions severely limit their application for bridge sites with embankments and site-
specific configurations. In these cases, these approaches can be used only as approximate indicators of
lateral spread hazard, and supplementary analysis procedures are required. A common method of analysis
is through rigid body mechanics, such as the sliding-block method proposed by Newmark (1965). In this
method, the soil is assumed to behave as a rigid, perfectly plastic material and the yield acceleration is
calculated using simple limit equilibrium stability analysis. The movement of the slope (earth structure) is
then calculated either by integrating a given acceleration time history over the range of accelerations
exceeding the yield level or by using approximate equations developed from analyses based on a suite of
earthquake records. Additional information is given by Jibson (2007) and Olson and Johnson (2008).
4.4.3.4 Advanced numerical modelling
For applications involving preliminary screening of liquefaction hazards at bridge sites, a high degree of
accuracy is not required. Therefore the empirical and semi-empirical methods are adequate and can be
conservatively applied. If lateral spreading hazards are indicated, then more sophisticated analyses may be
warranted. Advanced numerical modelling procedures, which make use of non-linear effective stress

Design guidance for bridges in New Zealand for liquefaction and lateral spreading effects
30
constitutive models and are implemented through finite element or finite difference methods provide useful
tools in estimating lateral spreading displacements. Key advantages of these procedures are: 1) complex
geometries and soil profiles can be evaluated; 2) sensitivity studies can be made to determine the influence
of various parameters on the magnitude of lateral deformation; and 3) dynamic soil behaviour is more
realistically reproduced. On the other hand, disadvantages of these techniques include: 1) the engineering
time required to construct the numerical model can be extensive; 2) substantial geotechnical data is required
which may not be available for many projects; and 3) very few of the available models have been validated
with well documented case studies and the level of uncertainty in the analysis is often unknown.
These methods are discussed further in appendix A.4.3. The choice of the method(s) to be used for a
particular site depends on the information available and the level of details required for the project. For
most projects, however, the semi-empirical approach of estimating permanent strains from SPT/CPT data
and expressing them as lateral displacement index (LDI) has been the preferred approach. A benefit of the
integration of strain method is that an estimate of the soil displacement profile is obtained over the depth
of the foundation, which can in turn be used as an analysis input. However, care must be taken when
implementing this method because it does not account for two- or three-dimensional effects and
therefore, the results for individual borings can be misleading on their own.
Many liquefaction assessment studies have been conducted in Christchurch making use of the Canterbury
Geotechnical Database. For example, Lees et al (2013) used the three CPT-based methods mentioned
above (Robertson and Wride 1998; Idriss and Boulanger 2008; Moss et al 2006) to estimate the
liquefaction potential index (LPI) at 1400 sites and compared them with the observed damage. They
showed that the three CPT-based methods adequately assessed liquefaction triggering in Christchurch and
the LPIs calculated were effective estimates of the damage observed at the ground surface. Based on their
study, the factor of safety obtained from the Moss et al (2006) method showed the best correlation.

5 Methods of ground improvement
31
5 Methods of ground improvement
5.1 Introduction
To reduce the risk of damage to bridges due to soil liquefaction, remediation methods through ground
improvement and/or structural enhancement shall be employed. In this report, only ground improvement
techniques are addressed. Ground improvement, whose goal is to limit soil deformations to acceptable
levels, is being used increasingly for remediating liquefiable soils due to the wide variety of available
methods.
5.2 Types of ground improvement
Ground improvement methods are generally based on one or more of the following principles: 1)
densification; 2) solidification; 3) drainage; 4) reinforcement and containment and 5) soil replacement.
Table 5.1 summarises the most common liquefaction countermeasures. Brief descriptions of the principles
behind the improvement mechanism associated with each category are provided below, along with some
references detailing the design of ground treatment schemes and methods to evaluate the effectiveness of
soil improvement. Further details concerning the specific treatment methods can be found in references
on ground improvement (eg Cooke and Mitchell 1999; Andrus and Chung 1995; Xanthakos et al 1994;
Hausmann 1990; JGS 1998; PHRI 1997; Schaefer 1997).
5.2.1 Densification methods
Densification or compaction methods involve re-arranging the soil particles into tighter configuration,
resulting in increased density. This increases the shear strength and liquefaction resistance of the soil, and
encourages a dilative instead of a contractive dynamic soil response. Densifying sandy soil with vibration
and/or impact has been used extensively, making it the most popular liquefaction countermeasure.
Vibro-compaction methods such as sand compaction piles, have been used to increase the density of
granular soils. Several case studies of Japanese earthquakes have shown the effectiveness of the method
in treating liquefiable soils (eg Yasuda et al1996; Harada et al 2012).
The use of vibro-replacement methods such as stone columns for densification, drainage and
strengthening, are popular in the US. The design of stone column applications for liquefaction mitigation
has been described by Baez and Martin (1992), Baez (1995) and Boulanger et al (1998).
Dynamic compaction (or heavy tamping) involves repetitively dropping a large weight onto the ground
causing the soil grains to form a denser arrangement. The drop height, weight and spacing vary,
depending on ground and groundwater conditions. Lukas (1986; 1995) has provided the most widely
quoted and referenced documents on dynamic compaction.
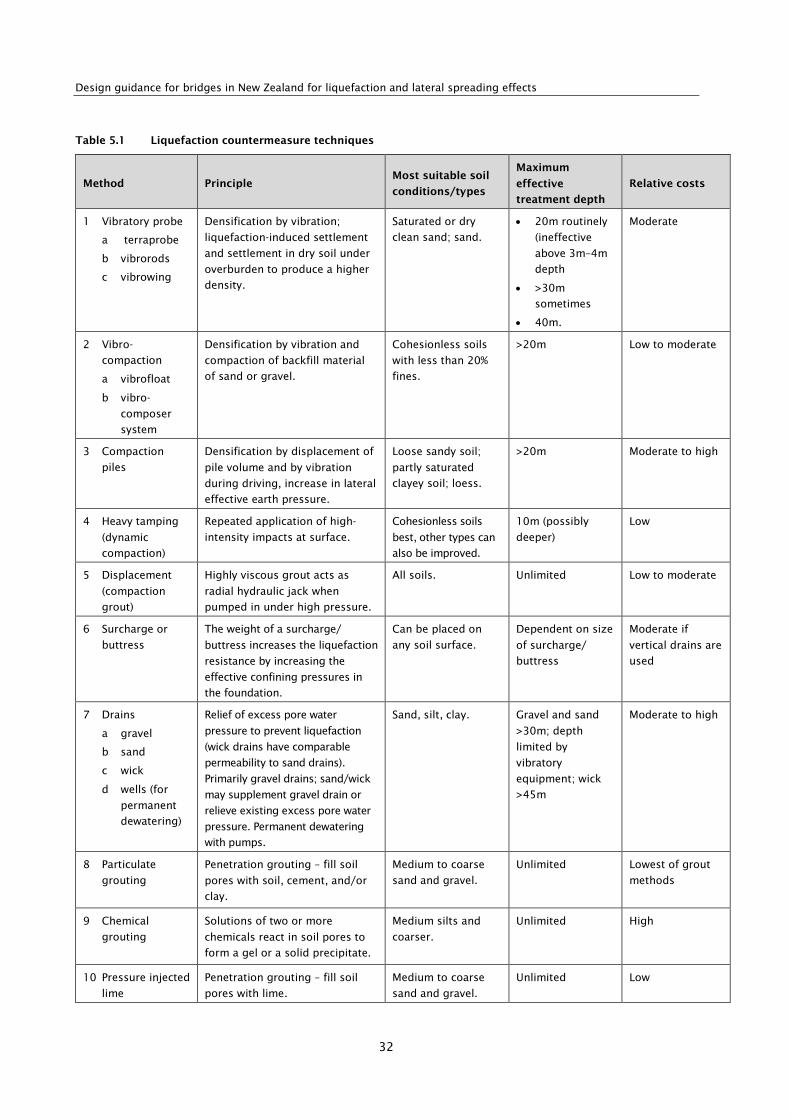
Design guidance for bridges in New Zealand for liquefaction and lateral spreading effects
32
Table 5.1 Liquefaction countermeasure techniques
Method Principle Most suitable soil
conditions/types
Maximum
effective
treatment depth
Relative costs
1 Vibratory probe
a terraprobe
b vibrorods
c vibrowing
Densification by vibration;
liquefaction-induced settlement
and settlement in dry soil under
overburden to produce a higher
density.
Saturated or dry
clean sand; sand.
• 20m routinely
(ineffective
above 3m–4m
depth
• >30m
sometimes
• 40m.
Moderate
2 Vibro-
compaction
a vibrofloat
b vibro-
composer
system
Densification by vibration and
compaction of backfill material
of sand or gravel.
Cohesionless soils
with less than 20%
fines.
>20m Low to moderate
3 Compaction
piles
Densification by displacement of
pile volume and by vibration
during driving, increase in lateral
effective earth pressure.
Loose sandy soil;
partly saturated
clayey soil; loess.
>20m Moderate to high
4 Heavy tamping
(dynamic
compaction)
Repeated application of high-
intensity impacts at surface.
Cohesionless soils
best, other types can
also be improved.
10m (possibly
deeper)
Low
5 Displacement
(compaction
grout)
Highly viscous grout acts as
radial hydraulic jack when
pumped in under high pressure.
All soils. Unlimited Low to moderate
6 Surcharge or
buttress
The weight of a surcharge/
buttress increases the liquefaction
resistance by increasing the
effective confining pressures in
the foundation.
Can be placed on
any soil surface.
Dependent on size
of surcharge/
buttress
Moderate if
vertical drains are
used
7 Drains
a gravel
b sand
c wick
d wells (for
permanent
dewatering)
Relief of excess pore water
pressure to prevent liquefaction
(wick drains have comparable
permeability to sand drains).
Primarily gravel drains; sand/wick
may supplement gravel drain or
relieve existing excess pore water
pressure. Permanent dewatering
with pumps.
Sand, silt, clay. Gravel and sand
>30m; depth
limited by
vibratory
equipment; wick
>45m
Moderate to high
8 Particulate
grouting
Penetration grouting – fill soil
pores with soil, cement, and/or
clay.
Medium to coarse
sand and gravel.
Unlimited Lowest of grout
methods
9 Chemical
grouting
Solutions of two or more
chemicals react in soil pores to
form a gel or a solid precipitate.
Medium silts and
coarser.
Unlimited High
10 Pressure injected
lime
Penetration grouting – fill soil
pores with lime.
Medium to coarse
sand and gravel.
Unlimited Low

5 Methods of ground improvement
33
Method Principle Most suitable soil
conditions/types
Maximum
effective
treatment depth
Relative costs
11 Electrokinetic
injection
Stabilising chemical moved into
and fills soil pores by electro-
osmosis or colloids in to pores
by electrophoresis.
Saturated sands,
silts, silty clays.
Unknown Expensive
12 Jet grouting
High-speed jets at depth
excavate, inject and mix a
stabiliser with soil to form
columns or panels.
Sands, silts, clays. Unknown High
13 Mix-in-place
piles and walls
Lime, cement or asphalt
introduced through rotating
auger or special in-place mixer.
Sands, silts, clays, all
soft or loose
inorganic soils.
>20m (60m
obtained in Japan)
High
14 Vibro-
replacement
stone and sand
columns
a grouted
b not grouted
Hole jetted into fine-grained soil
and backfilled with densely
compacted gravel or sand hole
formed in cohesionless soils by
vibro-techniques and compaction
of backfilled gravel or sand. For
grouted columns, voids filled
with a grout.
Sands, silts, clays. >30m (limited by
vibratory
equipment)
Moderate
15 Root piles, soil
nailing
Small-diameter inclusions used
to carry tension, shear and
compression.
All soils Unknown Moderate to high
16 Blasting
Shock waves and vibrations
cause limited liquefaction,
displacement, remoulding and
settlement to higher density.
Saturated clean
sand; partly
saturated sands and
silts after flooding.
>40m Low
In compaction grouting, cement-sand grout is injected into the soil under high pressure. The grout bulb
displaces the surrounding soil outwards, thereby increasing soil density. Recent case studies on
liquefaction applications of compaction grouting have been described by Orense (2008) and Russell et al.
(2008). Moreover, a consensus guide has been published by ASCE (2010).
5.2.2 Solidification method
Increase in liquefaction resistance can also be obtained through a more stable skeleton of soil particles.
This can be achieved by solidification methods, which involve filling the voids with cementitious materials
resulting in the soil particles being bound together.
Typical methods include deep mixing and pre-mixing. The deep mixing method achieves liquefaction
remediation by mixing a stabilising material such as cement in sandy soil and solidifying the soil. Such a
method is applicable even for foundation ground beneath an existing structure. The pre-mixing method,
on the other hand, involves adding stabilising material to the soil in advance and placing the treated soil
at the site. This is recommended for constructing new reclaimed land. References on the application of
these methods include Francis and Gorski (1998), Bruce (2000) and CDIT (2002).
Chemical grouting is a technique that transforms granular soils into sandstone-like masses, by permeation
with a low viscosity grout. Typically, a sleeve port pipe is first grouted into a predrilled hole. The grout is

Design guidance for bridges in New Zealand for liquefaction and lateral spreading effects
34
injected under pressure through the ports located along the length of the pipe. The grout permeates the
soil and solidifies it into a sandstone-like mass. The grouted soil has increased strength and stiffness, and
reduced permeability.
5.2.3 Drainage
Excess pore water pressure generated by cyclic loading can be reduced and/or dissipated by installing a
permeable drain within the deposit. The gravel drain and plastic drain methods are representative
examples. In the installation of gravel drains, casing with an auger inside is drilled into the ground down
to the specified depth. Crushed stone is then discharged into the casing and the gravel drain is formed by
lifting the casing pipe. A plastic drain, on the other hand, consists of a plastic perforated pipe drainage
skeleton wrapped in geofabric to prevent clogging from soil particles. These can be easily installed;
however, close spacing is usually required due to the limited capacity of each drain.
5.2.4 Reinforcement
When saturated sand deposits are sheared during seismic loading, excess pore water pressure is
generated. To prevent the occurrence of liquefaction, the soil should undergo smaller shear deformation
during earthquake. This can be achieved by underground diaphragm walls. This method simply surrounds
the liquefiable soil with continuous underground wall and thus it can be used for the soil at the bottom of
existing structures where liquefaction remediation is difficult with other methods.
The presence of stone columns, CFA or timber piles and other stiff elements provide additional shear
resistance against earthquake shaking. These reinforcements would take much of the earthquake load,
thereby minimising the shear deformation of the soil.
5.2.5 Soil replacement
The remove and replace method is another liquefaction mitigation technique. This involves the removal of
the in situ liquefiable material, and replacement with a non-liquefiable material such as clay, gravel or
dense sand. However, this method is only feasible when relatively small volumes of liquefiable material are
involved at shallow depths.
5.2.6 Increasing in situ stress
In situ effective stresses within the soil mass can be increased, resulting in an increase in shear resistance.
Pre-loading involves over-consolidating the soil with a surcharge embankment. This method is applicable
to soils with large fines content and can also be applied below existing structures since the soil can be
over-consolidated by lowering the ground water table. Lowering the groundwater table makes the soil
above the water table unsaturated, resulting in increased effective stress for soils below the water table.
For this method, it is always necessary to maintain the lower ground water level, and this may result in a
high operating cost.
5.2.7 Applications of ground improvement in New Zealand
Various liquefaction countermeasure techniques have been implemented in New Zealand. Some of the
methods include:
• partial replacement
• stone columns (vibro-displacement and vibro-replacement)
• vibro-compaction and vibro-roller
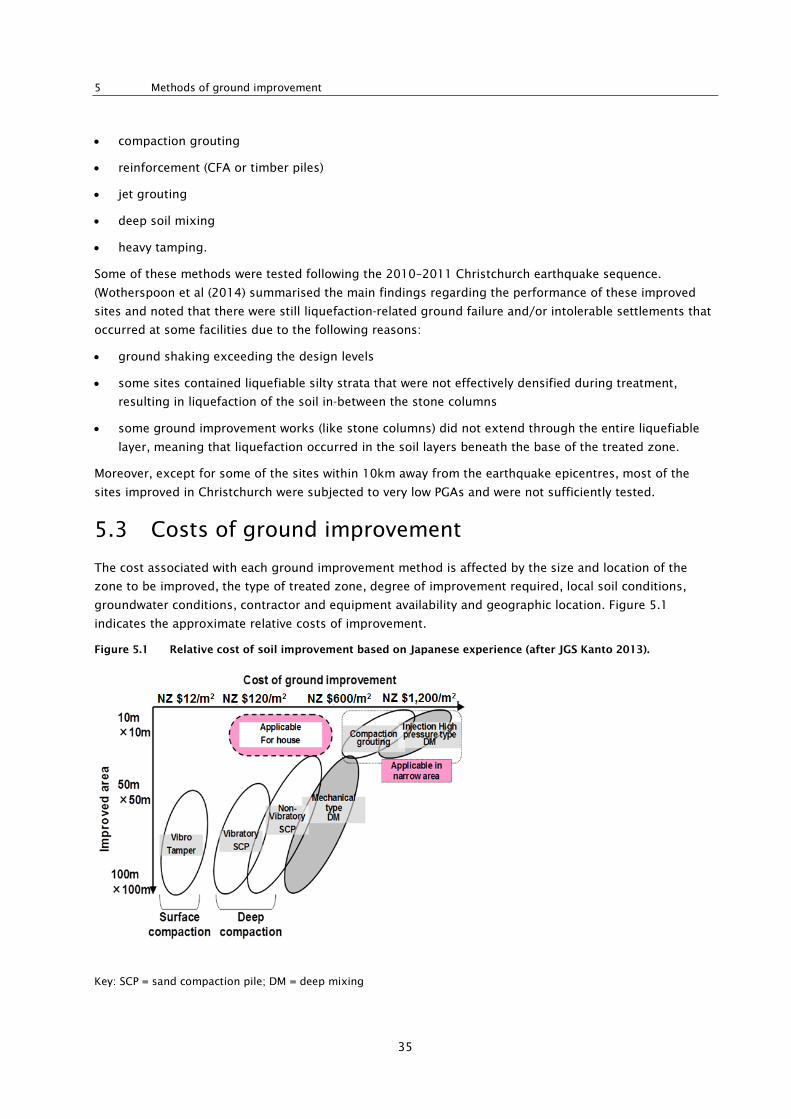
5 Methods of ground improvement
35
• compaction grouting
• reinforcement (CFA or timber piles)
• jet grouting
• deep soil mixing
• heavy tamping.
Some of these methods were tested following the 2010–2011 Christchurch earthquake sequence.
(Wotherspoon et al (2014) summarised the main findings regarding the performance of these improved
sites and noted that there were still liquefaction-related ground failure and/or intolerable settlements that
occurred at some facilities due to the following reasons:
• ground shaking exceeding the design levels
• some sites contained liquefiable silty strata that were not effectively densified during treatment,
resulting in liquefaction of the soil in-between the stone columns
• some ground improvement works (like stone columns) did not extend through the entire liquefiable
layer, meaning that liquefaction occurred in the soil layers beneath the base of the treated zone.
Moreover, except for some of the sites within 10km away from the earthquake epicentres, most of the
sites improved in Christchurch were subjected to very low PGAs and were not sufficiently tested.
5.3 Costs of ground improvement
The cost associated with each ground improvement method is affected by the size and location of the
zone to be improved, the type of treated zone, degree of improvement required, local soil conditions,
groundwater conditions, contractor and equipment availability and geographic location. Figure 5.1
indicates the approximate relative costs of improvement.
Figure 5.1 Relative cost of soil improvement based on Japanese experience (after JGS Kanto 2013).
Key: SCP = sand compaction pile; DM = deep mixing

Design guidance for bridges in New Zealand for liquefaction and lateral spreading effects
36
5.4 Reliability and resilience
Ground improvement methods to mitigate liquefaction-induced ground deformations have been widely
implemented over the past several decades, and case histories have indicated their performance. There is
clear historical evidence from events as far back as the 1964 Niigata earthquake and most recently the
devastating 2011 East Japan earthquake that improved sites suffer less ground deformation and subsidence
than adjacent, unimproved areas (eg Yasuda et al 1996; Hausler and Sitar 2001; Harada et al 2012).
Recent large earthquakes significantly helped in extending the level of information available relative to the
effectiveness of ground improvement. The available case histories clearly indicate that ground improvement
leads to a significant reduction, if not elimination, of large ground displacements during seismic loading.
However, some case histories show a set of circumstances in which ground improvement may not effectively
eliminate ground deformation, such as the use of conventional densification methods in the presence of a
severe lateral spreading hazard, or an inadequate remediation zone depth or lateral extent. For example,
Hausler and Sitar (2001), compiled over 90 case histories on the performance of improved sites from 14
earthquakes in Japan, Taiwan, Turkey, and the US covering a wide range of improvement methods. The
collected data indicated that improved sites generally performed well but about 10% of the surveyed sites
required significant post-earthquake remediation, repair or demolition. Table 5.2 indicates the number of
acceptable and unacceptable sites in their database. Without additional consideration of soil type,
construction procedures and treatment ratio, this statistic must be taken at face value.
Table 5.2 Performance of various ground improvement methods in the database (Hausler and Sitar 2001)
Method Performance
(acceptable/unacceptable)
Average increase in
N1,60
Densification through vibration and compaction
Sand compaction piles 26/5 77
Deep dynamic compaction 15/0 5
Vibro-rod/vibro-floatation 11/6 13
Stone columns 7/1 8
Preloading 5/0 5
Compaction grouting 1/1 n/a
Timber displacement piles 1/0 n/a
Dissipation of excess pore water pressure
Gravel drains 5/0 7
Sand drains 5/0 9
Wick or paper drains 2/0 n/a
Restraining effect through inclusions
Deep soil mixing 4/1 n/a
Diaphragm walls 0/1 n/a
Stiffening through chemical or cement addition
Jet grouting 5/0 n/a
Chemical grouting 1/0 n/a

5 Methods of ground improvement
37
5.5 Generic design recommendations
5.5.1 Design guidelines
The design of soil mitigation strategies involves investigating the cost-benefit ratio, the seismic
performance and the effect of the mitigation technique(s) on adjacent structures.
Some design guidelines for each of these remediation categories are briefly discussed below. More in-
depth discussions on the design of soil mitigation strategies and procedures are available in the literature,
such as PHRI (1997) and JGS (1998).
Densification or compaction methods are more suitable for use in saturated, cohesionless soils with a
limited percentage of fines. They cause noise and vibration during installation, and also increase
horizontal earth pressures against adjacent structures. This increase in pressure is the major disadvantage
of using compaction methods in close proximity to retaining walls and pile foundations. The major
advantage of compaction methods is the relatively low cost-benefit ratio. The necessary degree of
compaction can be evaluated using penetration resistances that have been back-calculated from an
acceptable factor of safety against liquefaction.
Drainage remediation methods are suitable for use in sands, silts or clays. One of the greatest advantages
of drains is that they induce relatively small horizontal earth pressures during installation. Therefore, they
are suitable for use adjacent to sensitive structures. In the design of drains, it is necessary to select a
suitable drain material that has a coefficient of permeability substantially larger than the in situ soils.
Cementation techniques can be used with any type of soil. They are advantageous because the installation
methods are relatively quiet and induce relatively small vibrations compared with compaction methods.
The induced horizontal earth pressures are smaller than with compaction methods, and are larger than
with drainage methods. Their disadvantage is the relatively high cost-benefit ratio compared with
compaction and drainage methods.
The influence of ground treatment on existing structures is a primary design consideration. The
construction methods may lead to increased horizontal earth pressures, which can result in deformations
of embankments, walls and pile foundations. Mitigation methods also may induce excess pore pressures
and vibration, which will affect sloping embankments and retaining structures. Therefore, a mitigation
strategy design may include the combination of two or more improvement techniques in order to take
advantage of robust treatment methods in free-field areas and less disturbing methods close to existing
structures. In general, compaction techniques have the largest impact on adjacent structures, followed by
controlled cementation techniques, and then drainage methods which generally are the least disruptive.
5.5.2 Design issues
Several factors influence the stability and deformation of improved ground zones and supported
structures during and after an earthquake. These factors include size, location and type of treated zone
(Mitchell et al 1998).
Generally, even when the soil undergoes liquefaction over a wide area, the area requiring soil
improvement is limited to the area which controls the stability of the structure. For example, the portion
of the subsoil which contributes to the stability of shallow spread foundations is that directly below and
on the perimeter of the structure; the portion of the subsoil far away from the structure does not
contribute to the stability of the shallow foundation.

Design guidance for bridges in New Zealand for liquefaction and lateral spreading effects
38
The region for soil improvement should be determined in both horizontal and vertical directions. For the
vertical direction, it is usual practice to improve the ground to the deepest part of the liquefiable layer. If
only the shallow portion is improved, the excess pore water pressure generated at the bottom of the
unimproved soil if it liquefies may induce upward seepage towards the surface, resulting in potential
instability in the upper improved zone. As for the lateral extent of treatment necessary, this is dependent
on the type of remediation measure employed and the allowable deformation the structure can undergo.
This can be investigated by performing detailed analysis, and if possible, supplemented by model tests. In
many cases, the lateral extent of treatment beyond the edge of the structure is a distance equal to the
depth of treatment beneath the structure.
6 Pore pressure migration
The difference in stiffness between a densified zone of material and the surrounding loose liquefiable
material could result in seepage between these two materials during and after earthquakes. Larger excess
pore water pressure is developed in the untreated material, resulting in propagation into the improved
soil. Although the influence of pore pressure migration into a dense material is very complex, it may
nevertheless lead to strength loss of the densified soil.
7 Ground motion amplification
Due to the increase in stiffness, improved ground may result in increase in ground motion, and this may
be detrimental to the structure on top of it. Although little information is available regarding the influence
of the size of improved ground and its stiffness on ground motions, engineers should consider a balance
in design so the size and stiffness of the improved ground would result in acceptable deformations and
accelerations of the structure during an earthquake.
8 Dynamic fluid pressure
During earthquake shaking, the movement of the improved ground zone within the liquefied soil may
result in a dynamic component of fluid pressure to act on improved ground, in addition to the static fluid
pressure. These forces must be considered for stability and deformation of structure supported in the
improved zone.
9 Inertia force
Inertia forces acting on the improved soil mass should be included when evaluating the stability of an
improved ground zone supporting a structure. Note however, that the phasing between inertia forces
acting on the improved ground and supported structure may be different and this can have significant
impact on the results of simplified stability and deformation analyses.
10 Influence of structure
The presence of structure built on top of an improved ground will alter the stress-state within the said
zone and can affect the dynamic response and stress-strain behavior of the improved soil.
11 Forces exerted by laterally spreading soil
Liquefaction-induced lateral ground movements have been observed to occur at sites with slopes less than
1%. Therefore, the improved ground should be adequately designed to resist the forces induced by the
laterally moving ground. There are two force components that should be considered: first, the load
exerted by the moving liquefied ground itself; and second, the force exerted by the unliquefied surficial
crust riding on top of the liquefied ground.

6 Methods of analysis
39
6 Methods of analysis
6.1 Introduction
This chapter discusses state-of-the-practice and state-of-the-art methods for the analysis of bridges (and
their subsystems) in liquefying and lateral spreading soils. In particular, it covers the simplified pseudo-
static method of analysis, advanced dynamic analysis, and the substructure method of analysis, with
particular focus on their application to bridges in liquefying and laterally spreading soils.
6.1.1 Characteristics of liquefaction and lateral spreading
The key characteristics of earthquake-induced soil liquefaction and lateral spreading can be summarised
as follows:
• Excess pore water pressures (EPWP) builds up very quickly during strong ground shaking. Hence,
under strong earthquake excitation, the soils may liquefy within a relatively short period of time
(within 5 to 20 seconds of strong shaking). The rate of EPWP build-up depends on the ground motion
characteristics (the amplitude and duration of strong shaking or number of significant cycles),
liquefaction potential of soils, and site characteristics including soil stratification, permeability of soils
and drainage conditions.
• The stiffness and strength of the liquefying soil reduce dramatically over the 5 to 20 seconds of rapid
EPWP build-up and change from their initial high stiffness and strength values to post-liquefaction
residual values of very low stiffness and strength. These rapid and drastic changes in the stress-strain
characteristics of liquefying soil are illustrated in figure 6.1 where the initial stress-strain curve (figure
6.1a), a slightly degraded stress-strain curve (figure 6.1b), and a post-liquefaction stress-strain curve
(figure 6.1c) exhibiting nearly zero stiffness and strength (horizontal segments of the τ−γ curve) are
shown together with the associated EPWP time history (figure 6.1d). Full liquefaction (or zero effective
stress condition) occurs when the excess pore water pressure reaches the initial effective overburden
stress σ′vo.
• The stress-strain curves in figure 6.1 clearly indicate that cyclic (transient) ground displacements
(readily obtained by integrating the shear strains over the depth of the deposit) gradually increase
during the rapid EPWP build-up from stage a to stage c. The maximum cyclic ground displacements
may occur during the pore pressure build up, at the onset of liquefaction or slightly after the
occurrence of liquefaction.
• Lateral spreading of liquefied soils is generally associated with two ground configurations: a) sloping
ground, and b) flat or sloping ground close to a free face (river banks, waterfront and backfills behind
revetment structures). Lateral spreading has been observed even in very gentle slopes of a few
degrees only.
• While lateral ground displacements associated with spreading may initiate during the pore pressure
build-up, most of the large spreading displacements occur after the onset of liquefaction. Hence,
majority of the gravity driven lateral spreading displacements occur post-liquefaction or after a
substantial loss of strength and stiffness in the liquefied soils has occurred. Post-liquefaction stiffness
and strength values could be much lower than the stiffness and strength of the soil corresponding to
the cyclic phase of the response (ie during the shaking and pore water pressure build-up).
• Inertial loads due to strong shaking (vibration of the superstructure) are significant during the cyclic
phase (development of EPWPs); however, these loads could largely diminish post-liquefaction due to
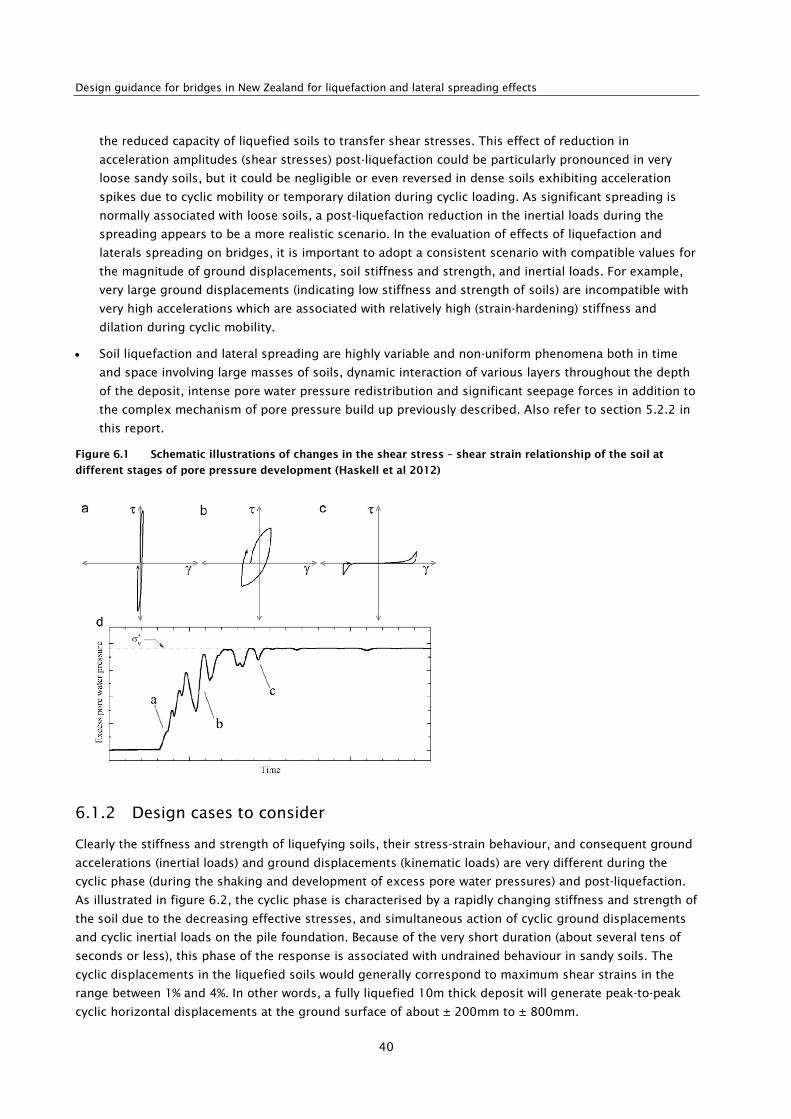
Design guidance for bridges in New Zealand for liquefaction and lateral spreading effects
40
the reduced capacity of liquefied soils to transfer shear stresses. This effect of reduction in
acceleration amplitudes (shear stresses) post-liquefaction could be particularly pronounced in very
loose sandy soils, but it could be negligible or even reversed in dense soils exhibiting acceleration
spikes due to cyclic mobility or temporary dilation during cyclic loading. As significant spreading is
normally associated with loose soils, a post-liquefaction reduction in the inertial loads during the
spreading appears to be a more realistic scenario. In the evaluation of effects of liquefaction and
laterals spreading on bridges, it is important to adopt a consistent scenario with compatible values for
the magnitude of ground displacements, soil stiffness and strength, and inertial loads. For example,
very large ground displacements (indicating low stiffness and strength of soils) are incompatible with
very high accelerations which are associated with relatively high (strain-hardening) stiffness and
dilation during cyclic mobility.
• Soil liquefaction and lateral spreading are highly variable and non-uniform phenomena both in time
and space involving large masses of soils, dynamic interaction of various layers throughout the depth
of the deposit, intense pore water pressure redistribution and significant seepage forces in addition to
the complex mechanism of pore pressure build up previously described. Also refer to section 5.2.2 in
this report.
Figure 6.1 Schematic illustrations of changes in the shear stress – shear strain relationship of the soil at
different stages of pore pressure development (Haskell et al 2012)
6.1.2 Design cases to consider
Clearly the stiffness and strength of liquefying soils, their stress-strain behaviour, and consequent ground
accelerations (inertial loads) and ground displacements (kinematic loads) are very different during the
cyclic phase (during the shaking and development of excess pore water pressures) and post-liquefaction.
As illustrated in figure 6.2, the cyclic phase is characterised by a rapidly changing stiffness and strength of
the soil due to the decreasing effective stresses, and simultaneous action of cyclic ground displacements
and cyclic inertial loads on the pile foundation. Because of the very short duration (about several tens of
seconds or less), this phase of the response is associated with undrained behaviour in sandy soils. The
cyclic displacements in the liquefied soils would generally correspond to maximum shear strains in the
range between 1% and 4%. In other words, a fully liquefied 10m thick deposit will generate peak-to-peak
cyclic horizontal displacements at the ground surface of about ± 200mm to ± 800mm.

6 Methods of analysis
41
The post-liquefaction lateral spreading phase is associated with residual or post-liquefaction stiffness and
strength of the liquefied soils and consequent large ground deformation. Gravity-driven spreading
displacements may continue after the end of shaking or until equilibrium is re-established in the soil
masses across the depth of the deposit and lateral spreading area. This post-liquefaction phase often
results in fissuring and cracking of the ground, significant water flow and seepage action, loss of integrity
of the crust due to sand boils and ejecta, dissipation of excess pore pressures, re-solidification and re-
consolidation of the soil, and large permanent ground displacements. The inertial loads during spreading
are generally much smaller than the corresponding loads during the cyclic phase.
When evaluating the effects of liquefaction and lateral spreading on the performance of the bridge (eg pile
foundations) using equivalent static analyses, it is necessary to conduct separate analyses for different
stages of the response. The following phases in the response need to be considered in the performance
evaluation of pile foundations:
• Cyclic analysis without liquefaction, in which inertial loads that would occur in the absence of
liquefaction are considered.
• Cyclic liquefaction analysis, estimating the potential and consequences of liquefaction, and
considering simultaneous kinematic loads (due to cyclic ground displacements) and structural inertial
loads while accounting for stiffness and strength degradation of the soils due to excess pore water
pressures.
• Lateral spreading analysis, estimating the potential for liquefaction and consequences of lateral
spreading including substantial stiffness and strength degradation, and kinematic loads due to large
spreading displacements. Inertial loads may be considered in this analysis, but as discussed
previously, such loads are of secondary importance in the spreading phase, and could be ignored in
many cases.
For example, the design specifications for highway bridges in Japan (JRA 1996; Tamura 2013), the AIJ code
for piled building foundations in Japan (AIJ 2001; Tokimatsu and Asaka 1998) and the Pacific Earthquake
Engineering Research (PEER) recommended design practice (Ashford et al 2011) for pile foundations of
bridges in laterally spreading soils consider separate equivalent static analyses for different phases of the
response.

Design guidance for bridges in New Zealand for liquefaction and lateral spreading effects
42
Figure 6.2 Illustration of ground response and soil-pile interaction in liquefying soils: a) Excess pore water
pressure; b) Lateral ground displacement; c) Loads on pile during strong ground shaking (cyclic phase); and d)
post-liquefaction lateral spreading (Cubrinovski et al 2012)
6.1.3 Local and global effects (models and analysis)
Effect of liquefaction and lateral spreading could be evaluated by considering a single member (eg a single
pile), a subsystem of the bridge (pile group, pier piles or piled abutment, or the whole bridge (figure 6.3).
Each of these models is acceptable in the evaluation of the bridge performance provided that proper
boundary conditions and modelling assumptions are used, and that there is a clear understanding of the
analysis objectives and limitations. The cyclic response should be considered both in the transverse and
longitudinal directions, whereas the lateral spreading response is commonly considered in the longitudinal
direction of the bridge.

6 Methods of analysis
43
Figure 6.3 Schematic illustration for analysis of subsystems: pile groups in laterally spreading ground and
piled abutment in approach embankment (Ashford et al 2011)
6.1.4 Methods of analysis
Several methods are available for analysis of bridges and piles in liquefied soils, ranging from simplified
methods using an equivalent static approach to a rigorous time history analysis based on the effective
stress principle. These methods can be summarised into three general approaches:
1 Pseudo-static analysis (PSA) or equivalent static analysis.
2 Direct dynamic time history analysis including: a) effective stress analysis (ESA) considering effects of
excess pore pressures and liquefaction through detailed constitutive modelling, and b) total stress
analysis (TSA), dynamic analysis using total stresses or equivalent stresses and either ignoring excess
pore pressures or considering them in a simplified manner. In the direct method of analysis (ESA and
TSA), the response of the whole soil-pile-pier-abutment-deck system can be considered over the entire
period of time from the initiation of shaking to the final stage of post-earthquake equilibrium and
residual deformation of the bridge, in a single analysis. More complex dynamic analyses are typically
used for more important structures and where details of dynamic soil-foundation-structure-interaction
are required. ESA also provides the best currently available tool for evaluation of the effectiveness of
mitigation measures against liquefaction.
3 Substructure analysis methods which use some features of PSA, ESA or TSA but are essentially hybrid
approaches tailored to address specific aspects in the performance assessment. For example, the well-
known Newmark-type analysis, a simplified user-defined time history analysis, would be a typical
representative of this group of methods. The substructure method uses a set of separate but related
analyses to assess the performance of a bridge subsystem.
While all these analysis methods are used to assess the seismic performance of the pile foundation and
the bridge, these different methods focus on different members/subsystems and aspects of the problem
and provide different and distinct contributions to the assessment of seismic performance (Cubrinovski
and Bradley 2009). Table 6.1 summarises key features, advantages, shortcomings and modelling
requirements of the methods.
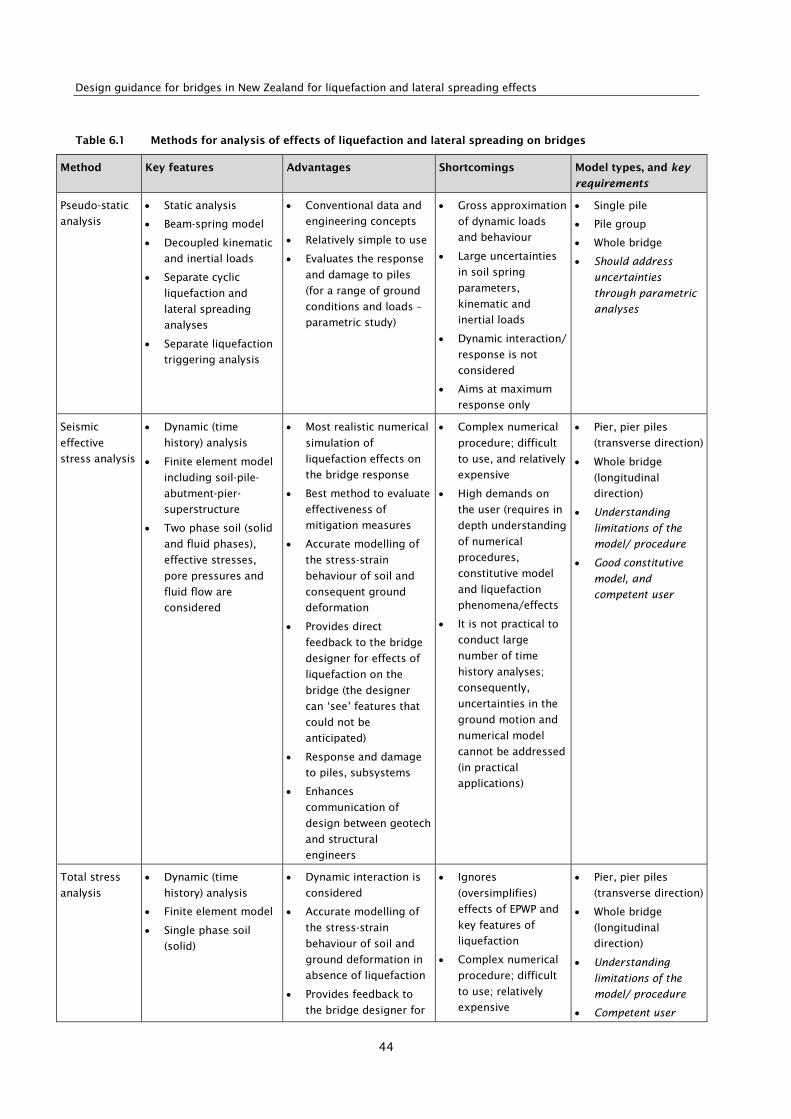
Design guidance for bridges in New Zealand for liquefaction and lateral spreading effects
44
Table 6.1 Methods for analysis of effects of liquefaction and lateral spreading on bridges
Method Key features Advantages Shortcomings Model types, and key
requirements
Pseudo-static
analysis
• Static analysis
• Beam-spring model
• Decoupled kinematic
and inertial loads
• Separate cyclic
liquefaction and
lateral spreading
analyses
• Separate liquefaction
triggering analysis
• Conventional data and
engineering concepts
• Relatively simple to use
• Evaluates the response
and damage to piles
(for a range of ground
conditions and loads –
parametric study)
• Gross approximation
of dynamic loads
and behaviour
• Large uncertainties
in soil spring
parameters,
kinematic and
inertial loads
• Dynamic interaction/
response is not
considered
• Aims at maximum
response only
• Single pile
• Pile group
• Whole bridge
• Should address
uncertainties
through parametric
analyses
Seismic
effective
stress analysis
• Dynamic (time
history) analysis
• Finite element model
including soil-pile-
abutment-pier-
superstructure
• Two phase soil (solid
and fluid phases),
effective stresses,
pore pressures and
fluid flow are
considered
• Most realistic numerical
simulation of
liquefaction effects on
the bridge response
• Best method to evaluate
effectiveness of
mitigation measures
• Accurate modelling of
the stress-strain
behaviour of soil and
consequent ground
deformation
• Provides direct
feedback to the bridge
designer for effects of
liquefaction on the
bridge (the designer
can ‘see’ features that
could not be
anticipated)
• Response and damage
to piles, subsystems
• Enhances
communication of
design between geotech
and structural
engineers
• Complex numerical
procedure; difficult
to use, and relatively
expensive
• High demands on
the user (requires in
depth understanding
of numerical
procedures,
constitutive model
and liquefaction
phenomena/effects
• It is not practical to
conduct large
number of time
history analyses;
consequently,
uncertainties in the
ground motion and
numerical model
cannot be addressed
(in practical
applications)
• Pier, pier piles
(transverse direction)
• Whole bridge
(longitudinal
direction)
• Understanding
limitations of the
model/ procedure
• Good constitutive
model, and
competent user
Total stress
analysis
• Dynamic (time
history) analysis
• Finite element model
• Single phase soil
(solid)
• Dynamic interaction is
considered
• Accurate modelling of
the stress-strain
behaviour of soil and
ground deformation in
absence of liquefaction
• Provides feedback to
the bridge designer for
• Ignores
(oversimplifies)
effects of EPWP and
key features of
liquefaction
• Complex numerical
procedure; difficult
to use; relatively
expensive
• Pier, pier piles
(transverse direction)
• Whole bridge
(longitudinal
direction)
• Understanding
limitations of the
model/ procedure
• Competent user

6 Methods of analysis
45
Method Key features Advantages Shortcomings Model types, and key
requirements
some aspects of
dynamic response
• High demands on
user
• Uncertainties in the
ground motion and
numerical model
ignored
Substructure
approach (eg
Newmark-type
analysis)
• Dynamic (time
history) analysis
• Three separate
analyses: i)
liquefaction
triggering, ii) stability
(critical or yield
acceleration), iii) PSA
• Seismic analyses is
simple
• Evaluates the response
and damage of
abutment piles,
abutments, approach
embankments
• Ignores
(oversimplifies)
effects of EPWP and
liquefaction
• Uncertainties in soil
parameters,
kinematic and
inertial loads
• Largely driven by the
designer/user (little
feedback from
analysis)
• Abutment, abutment
piles, embankment
(longitudinal
direction)
• Understanding
limitations of the
models/procedures
• Competent user
6.2 Pseudo-static analysis (PSA)
The PSA approach is carried out based on nonlinear equivalent static analysis of a relatively simple beam-
spring model is used for the soil-pile-bridge system. The approach is also referred to as the ‘beam on
Winkler foundation’ (Boulanger et al 2007; Ashford et al 2011) or ‘static pushover analysis’ (Brandenburg et
al 2007). Several methods for PSA of piles in liquefying soils are available (eg Tokimatsu and Asaka 1998;
Cubrinovski and Ishihara 2004; Cubrinovski et al 2009b; Brandenburg et al 2007; Ashford et al 2011). These
methods are similar in concept but differ in the modelling details and analysis procedures. All PSA methods
are burdened by significant uncertainties arising from the fact that a highly complex dynamic soil-structure
interaction problem involving liquefying soils is represented by a simplified model and an equivalent static
analysis. Nevertheless, the approach has been proven to be very useful, and therefore is the backbone
approach in many of the seismic codes for the design of piled foundations of bridges and buildings.
Two approaches are generally used for PSA of piles subjected to lateral spreading: a force-based approach
and a displacement-based approach. These approaches differ in the way in which the lateral load on pile
due to ground movement is considered in the analysis.
In the force-based approach, an equivalent static load representing the pressure from the laterally
spreading or cyclically moving soil is applied to the pile, as an input load. For a typical three-layer
configuration with a liquefied layer sandwiched between a non-liquefied surface crust and a non-liquefied
base layer, the lateral earth pressures from the crust and liquefied layer are first estimated and then
applied as lateral loads to the pile, pushing the pile in the direction of spreading (figure 6.4a).
One serious deficiency of the force-based approach is that it ignores the fact that the lateral load on the
pile (magnitude of the mobilised lateral soil pressure on the pile) depends on the relative displacement
between the soil and the pile; hence, the lateral load depends on the pile displacements. In other words,
one cannot estimate the lateral load on the pile due to ground movement, if pile displacements along the
length of the pile are not known.

Design guidance for bridges in New Zealand for liquefaction and lateral spreading effects
46
Figure 6.4 Pseudo-static analysis of piles: a) force-based approach; b) displacement-based approach
(Cubrinovski et al 2009a)
Figure 6.5 Range of possible pile responses resulting in different relative displacements between the pile and
free-field soil: from very stiff (pile resists ground movement, and does not displace much) to very flexible pile
behaviour (pile moves together with ground)
The displacement-based approach offers a more rigorous modelling compatible with the mechanism of
soil-pile interaction. As shown in figure 6.4b, in the displacement-based approach lateral ground
displacements representing the free-field ground movement are applied at the free end of soil springs
attached to the pile. In this case, the forces that develop in the soil springs are compatible with the
relative displacement between the soil and the pile, and hence, the mobilised lateral soil pressure is fully
compatible with the induced pile response. For this reason, the displacement-based approach is the
preferred method for PSA. Figure 6.5 illustrates possible pile responses resulting in different relative
displacements between the pile and free-field ground movements, ranging from stiff pile response in
which the pile resists the ground movement to very flexible pile response in which the pile practically
moves together with the ground.
The key requirements for the simplified PSA can be summarised as follows:
1 The adopted model and analysis method must capture the relevant deformation mechanism for piles
in liquefying/spreading soils.
2 The analysis should permit estimating the inelastic response and damage to piles.
3 The method should allow for uncertainties associated with liquefaction and lateral spreading. It is
important to conduct parametric study, identify the key parameters affecting the pile response and

6 Methods of analysis
47
assess the effects of the uncertainties on the pile response. Cubrinovski et al (2009b) and Ashford et
al (2011) methods make this parametric evaluation a key requirement for PSA, whereas many other
codes remain mute on this issue, or stipulate fixed factors, loads and resistances for practical reasons
and easier application.
4 Separate analyses should be conducted for the cyclic phase and post liquefaction phase of the soil-pile
interaction. This has been adopted in many of the codes (AIJ, JRA, PEER) and proposed PSA procedures
(Tokimatsu and Asaka 1998); Cubrinovski et al 2009b; Ashford et al 2011; Tamura 2013).
5 In addition to the single-pile analysis, effects of pile groups, boundary conditions, and deck-pinning
effects should be considered with appropriate models and analyses. The use of global bridge PSA can
be very effective in the analysis of the soil-pile-abutment-superstructure system (Ashford et al 2011;
Cubrinovski et al 2014).
Based on our review of available PSA methods, the following PSA methods would be appropriate for
New Zealand conditions:
• Cubrinovski et al method (Cubrinovski et al 2009b)
• PEER method (Ashford et al 2011)
These two methods are described below. In addition we provide a brief description of two more PSA
methods:
• AIJ method (Tokimatsu and Asaka 1998)
• JRA method (JRA 1996)
The Cubrinovski et al method is first presented in detail, and then the other methods are presented and
discussed with reference to this method, pointing out their distinctive characteristics in the modelling and
analysis procedures.
6.2.1 Cubrinovski et al method
This PSA method can be applied either to a single-pile, pile group or the whole bridge. For clarity, the
single pile model is first used in the detailed description of the method and then additional requirements
for pile group and whole bridge analyses are given.
6.2.1.1 Analysis procedure
The key steps in the simplified pseudo-static analysis procedure are listed below.
Step 1: Site and soil characterisation
Step 2: Determine earthquake load at the bridge site
Step 3: Liquefaction triggering analysis
Step 4: Formulate beam-spring model
Step 5: Estimate soil spring parameters
Step 6: Estimate pile M-φ parameters
Step 7: Estimate free-field ground displacements
Step 8: Estimate inertia loads
Step 9: Conduct PSA with best-estimate parameters

Design guidance for bridges in New Zealand for liquefaction and lateral spreading effects
48
Step 10: Conduct parametric (sensitivity) study
Step 11: Estimate pile group effects
Step 12: Consider geometric non-linearity, soil-foundation-structure interaction (SFSI) and 3-D effects
A more detailed summary of the key steps is given at the end of this section.
6.2.1.2 Computational model
The typical beam-spring model representing the soil-pile system in the analysis is shown in figure 6.6. The
model can easily incorporate a multi-layered deposit with liquefied layers of different thickness and
location in the deposit, a crust of non-liquefiable soil at the ground surface, and deeper non-liquefiable
layers including base layers at the tip of the pile. Parameters of the model are summarised in figure 6.6
for a typical configuration in which liquefied layers are sandwiched between a surface layer and a non-
liquefiable base layer of non-liquefiable soils.
Soil properties
• Multi-layered deposit is considered including both liquefied and non-liquefied layers.
• A non-liquefiable layer at the ground surface (crust) is defined by the depth to the water table,
presence of non-liquefiable soils (eg clayey soils with Ic >2.6 or stiff gravels) or a combination of both.
• Soil properties are determined using conventional field parameters such as SPT blow count or CPT
resistance; effects of fines and plasticity of fines could be considered in the same way as in the
simplified liquefaction triggering analysis.
Given that a key requirement of the analysis is to estimate the inelastic deformation and damage to the
pile, the proposed model incorporates simple but non-linear load-deformation relationships for the soil
and the pile. The soil is represented by bilinear (elastic-plastic) springs, the stiffness and strength of which
can be degraded to account for effects of nonlinear behaviour and liquefaction.
Soil springs
• Bi-linear soil springs are used.
• Two parameters define the spring: stiffness and strength which is related to the ultimate pressure
from the soil on the pile.
• Both stiffness and strength can be degraded due to effects of liquefaction or/and soil nonlinear load-
deformation characteristics.
• Spring spacing should be preferably 0.1m and not larger than 0.2m.
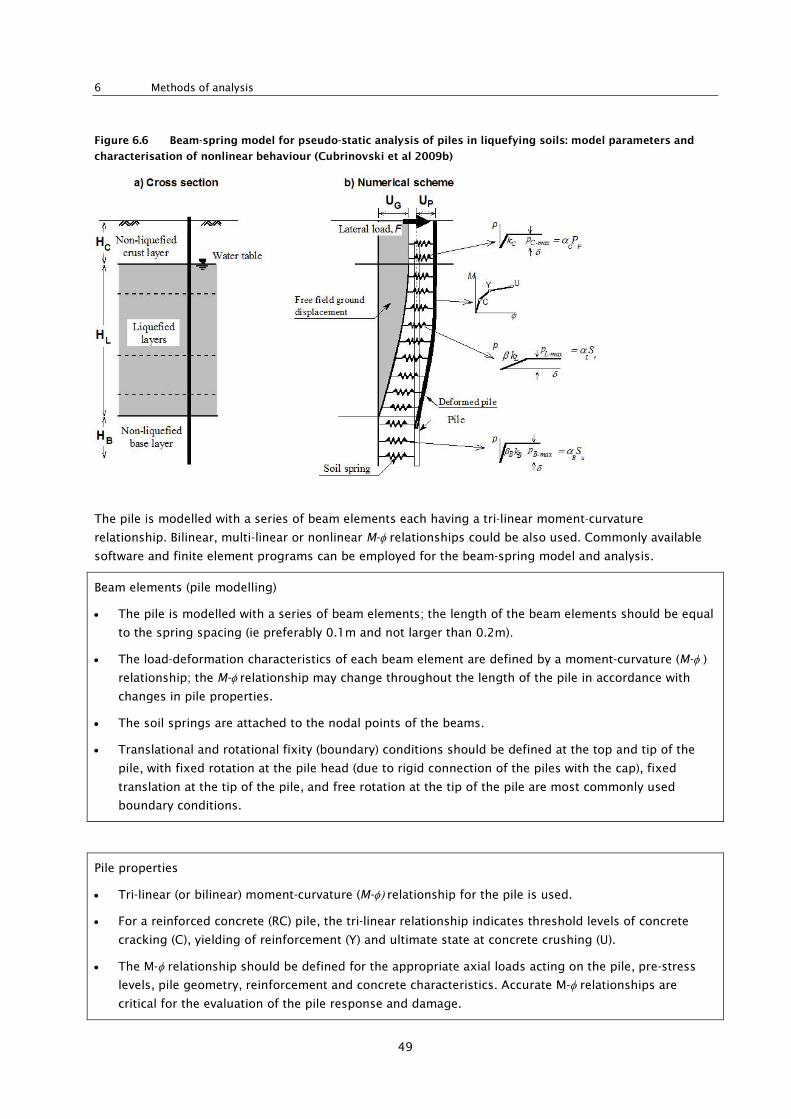
6 Methods of analysis
49
Figure 6.6 Beam-spring model for pseudo-static analysis of piles in liquefying soils: model parameters and
characterisation of nonlinear behaviour (Cubrinovski et al 2009b)
The pile is modelled with a series of beam elements each having a tri-linear moment-curvature
relationship. Bilinear, multi-linear or nonlinear M-φ relationships could be also used. Commonly available
software and finite element programs can be employed for the beam-spring model and analysis.
Beam elements (pile modelling)
• The pile is modelled with a series of beam elements; the length of the beam elements should be equal
to the spring spacing (ie preferably 0.1m and not larger than 0.2m).
• The load-deformation characteristics of each beam element are defined by a moment-curvature (M-φ )
relationship; the M-φ relationship may change throughout the length of the pile in accordance with
changes in pile properties.
• The soil springs are attached to the nodal points of the beams.
• Translational and rotational fixity (boundary) conditions should be defined at the top and tip of the
pile, with fixed rotation at the pile head (due to rigid connection of the piles with the cap), fixed
translation at the tip of the pile, and free rotation at the tip of the pile are most commonly used
boundary conditions.
Pile properties
• Tri-linear (or bilinear) moment-curvature (M-φ) relationship for the pile is used.
• For a reinforced concrete (RC) pile, the tri-linear relationship indicates threshold levels of concrete
cracking (C), yielding of reinforcement (Y) and ultimate state at concrete crushing (U).
• The M-φ relationship should be defined for the appropriate axial loads acting on the pile, pre-stress
levels, pile geometry, reinforcement and concrete characteristics. Accurate M-φ relationships are
critical for the evaluation of the pile response and damage.

Design guidance for bridges in New Zealand for liquefaction and lateral spreading effects
50
In the model, two equivalent static loads can be applied to the pile: a lateral force at the pile head (F)
representing the inertial load on the pile due to vibration of the superstructure, and a horizontal ground
displacement (UG) applied at the free end of the soil springs representing the kinematic load on the pile
due to lateral ground movement (cyclic or spreading) in the free field. As indicated in figure 6.6, it is
assumed that all of the ground surface displacement is accommodated within the liquefied layer, that the
non-liquefied crust at the ground surface moves as a rigid body and undergoes the same ground
displacement as the top of the liquefied layer, UG, and that the non-liquefying base layers are not moving.
Ground displacement (kinematic loads)
• Liquefaction triggering analysis is carried out first to identify the layers that will liquefy for a given
earthquake load, ie a certain level of PGA and Mw (refer to section 4.3.2).
• Free field displacements at the ground surface should be estimated separately for the transient (cyclic)
phase and lateral spreading phase (refer to section 4.3.1).
• Once liquefied layers have been identified, liquefaction-induced lateral displacements can be
estimated throughout the depth of the profile using simplified liquefaction or lateral spreading
analysis; for example, free-field liquefaction-induced transient (cyclic) ground displacements in level
ground free field can be estimated using the method of Tokimatsu and Asaka (1998). The methods of
Zhang et al (2004) and Youd et al (2002) can be used to estimate free-field lateral spreading
displacements. It should be noted that estimates of liquefaction and spreading-induced displacements
are burdened by significant uncertainties, and these uncertainties should be accounted for by
conducting parametric analyses of bridge structures using a range of different magnitudes of applied
ground displacements (section 4.4).
• Ground displacement profile is then estimated based on the above calculations.
• The adopted ground displacements are applied at the free end of the soil springs to calculate the
deformation of the pile due to ground displacements (kinematic loads)
• The crust moves as a rigid body on top of the underlying liquefied layer; the base non-liquefied layer
does not move.
• The designers should also consider negative skin friction on the piles resulting from settlement of
liquefied soil and non-liquefied crust, appropriate down-drag loads should be considered in the design
if required.
Vibration of the superstructure (inertial loads)
• An estimate for the dynamic response of the bridge is needed, in particular, what would be the peak
horizontal acceleration response or spectral acceleration.
• A portion of this acceleration can be used to calculate the equivalent horizontal static force. This force
can be applied at the top of the pile considering the total number of piles, and distribution of the total
inertial load on the piers, abutments and their piles.
• A combined ground displacement (kinematic load) and inertial load should be applied for the transient
(cyclic) phase of the response. Inertial loads may or may not be considered in the lateral spreading
analysis, at the discretion of the engineer.

6 Methods of analysis
51
Analysis results
• Lateral displacement of the pile throughout its length at every nodal point.
• Bending moment (curvature) along the length of the pile at every nodal point.
• Distributed lateral load on pile along the length of the pile, at every nodal point.
• Damage to the pile is estimated from comparison between computed curvature and threshold
M-φ levels (C, Y, U) along the pile length.
6.2.1.3 Model parameters
The key issue in the implementation of any PSA is how to select appropriate values for the soil stiffness,
strength and lateral loads applied to the pile in the equivalent static analysis. In other words, what are the
appropriate values for βL, p
L-max, U
G and F in the model shown in figure 6.6. This section provides
recommendations on determination of the beam-spring model parameters.
The first important distinction of the Cubrinovski et al method is the use of bilinear soil springs instead of
nonlinear p-y curves, typical for US practice. Bilinear rather than non-linear springs are used because the
uncertainties associated with the stiffness and strength of liquefied soils are so large that they completely
override the benefits of nonlinear spring modelling. To illustrate this point, we can consider the pressure–
displacement (p-δ) relationship for a soil spring of laterally spreading soil shown in figure 6.7. Here, p is
the pressure applied from the soil on the pile, and δ is the relative displacement between the soil and the
pile (δ = Ug – U
p), at a given depth z, where U
g is the free-field ground displacement. The shaded area in the
figure indicates the range of possible variation in the stiffness (degradation factor of 1/50 to 1/1000) and
the strength (factor of 1/3 to 2) of the spring. The very large possible variation in the stiffness and
strength of the spring clearly shows that the focus in the assessment should be on covering the
uncertainty in stiffness and strength rather than on the shape of the curve between the initial slope and
ultimate pressure level of the p-δ relationship. It is important to note that the use of non-linear p-y curves
in liquefaction PSA in the US is actually a by-product of the historical development of p-y curves, which
were first developed for non-liquefiable soils, and were then adopted for simplified liquefaction analyses.
In fact, the shape of the conventional p-y curves is not always compatible with the shape of the stress-
strain curve of liquefying soils, such as those shown in figure 6.1 (Ashford et al 2011).
Bi-linear vs nonlinear soil spring
• There are significant uncertainties in the stiffness and strength of liquefied soils and, hence, soil
spring properties.
• Rather than modelling the nonlinearity in detail, it is important to consider the large uncertainties in
the stiffness and strength of liquefied soils and their effects on the pile response, thorough a
systematic parametric study.
• The bi-linear model satisfies the requirements for parametric PSA.
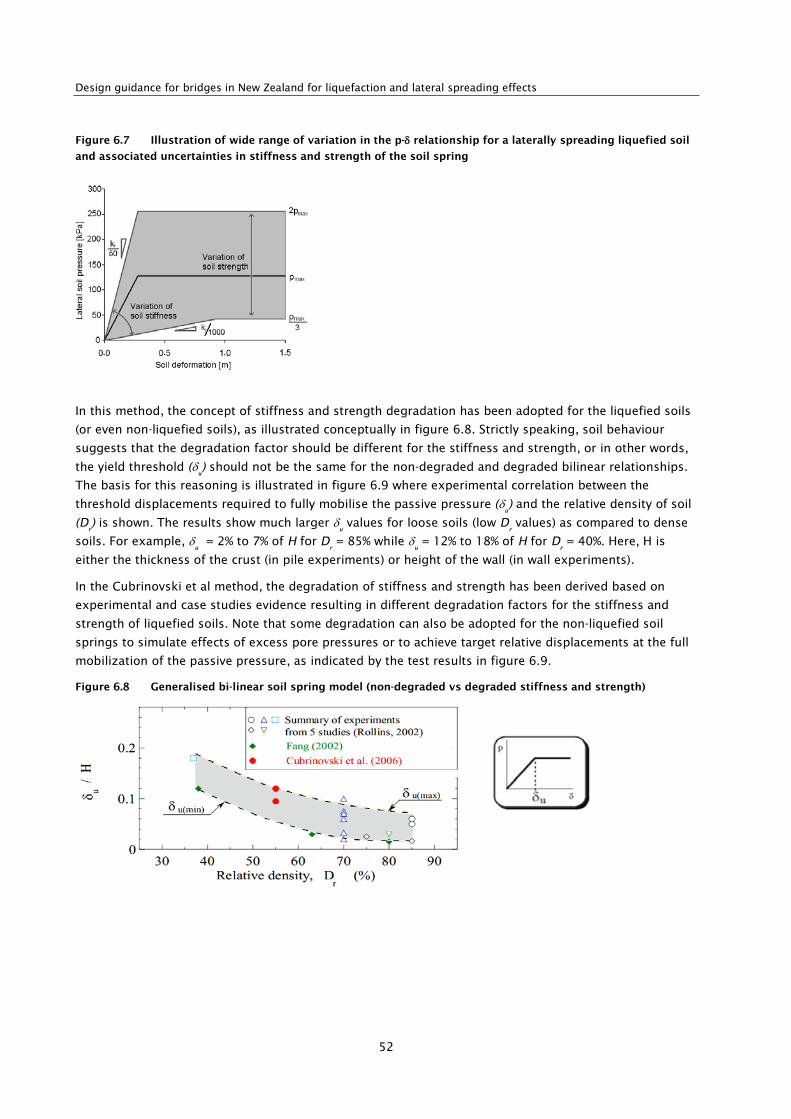
Design guidance for bridges in New Zealand for liquefaction and lateral spreading effects
52
Figure 6.7 Illustration of wide range of variation in the p-δ relationship for a laterally spreading liquefied soil
and associated uncertainties in stiffness and strength of the soil spring
In this method, the concept of stiffness and strength degradation has been adopted for the liquefied soils
(or even non-liquefied soils), as illustrated conceptually in figure 6.8. Strictly speaking, soil behaviour
suggests that the degradation factor should be different for the stiffness and strength, or in other words,
the yield threshold (δu) should not be the same for the non-degraded and degraded bilinear relationships.
The basis for this reasoning is illustrated in figure 6.9 where experimental correlation between the
threshold displacements required to fully mobilise the passive pressure (δu) and the relative density of soil
(Dr) is shown. The results show much larger δ
u values for loose soils (low D
r values) as compared to dense
soils. For example, δu = 2% to 7% of H for D
r = 85% while δ
u = 12% to 18% of H for D
r = 40%. Here, H is
either the thickness of the crust (in pile experiments) or height of the wall (in wall experiments).
In the Cubrinovski et al method, the degradation of stiffness and strength has been derived based on
experimental and case studies evidence resulting in different degradation factors for the stiffness and
strength of liquefied soils. Note that some degradation can also be adopted for the non-liquefied soil
springs to simulate effects of excess pore pressures or to achieve target relative displacements at the full
mobilization of the passive pressure, as indicated by the test results in figure 6.9.
Figure 6.8 Generalised bi-linear soil spring model (non-degraded vs degraded stiffness and strength)

6 Methods of analysis
53
Figure 6.9 Relative displacement between the soil and pile (δu ) required to fully mobilise passive pressure as
a function of relative density of sand: summary of data from experimental studies (Cubrinovski et al 2009b); H is
either wall height or thickness of crust
6.2.1.4 Soil spring parameters
The bilinear elastic-plastic soil spring parameters are estimated as follows:
1 Non-liquefied crust
The soil spring stiffness is given by:
𝐾𝐶 = 𝑘𝐶 · 𝑠 ·𝐷0 (Equation 6.1)
where KC = spring stiffness, s = spring spacing, D
o = pile diameter (width)
in metres, and kc = subgrade reaction coefficient given by:
𝐾𝐶 = 56 · 𝑁 · (100𝐷0)−3/4 (MN/m3) (Equation 6.2)
where N = SPT blow count. (uncorrected, as measured in the field,
assumed to correspond to 60% energy efficiency, N60
).
Other expressions for kc, based on soil moduli, can be also used. The spring stiffness can be degraded for
the effects of nonlinearity (by a degradation factor of 0.3, 0.5 or similar) or based on a target δu value from
the correlation shown in figure 6.9.
The yield force of the soil spring corresponding to the ultimate pressure from the soil on the pile is given
by:
𝑃𝐶−𝑚𝑎𝑥 = 𝑝𝑐−𝑚𝑎𝑥 · 𝑠 ·𝐷0 = 𝛼𝑐 · 𝑃𝑝 · 𝑠 ·𝐷0 (for non-cohesive soils) (Equation 6.3)
𝑃𝐶−𝑚𝑎𝑥 = 𝑝𝑐−𝑚𝑎𝑥 · 𝑠 ·𝐷0 = 9 · 𝑆𝑢 · 𝑠 ·𝐷0 (for cohesive soils) (Equation 6.4)
where pC-max
- yield strength of soil spring, Pp - Rankine passive pressure, s - spring spacing, D
o - pile
diameter (width), Su - undrained strength, and α
C = scaling factor accounting for the increased pressure on
a single pile (due to ‘wedge effect’), as compared to the Rankine pressure for an equivalent continuous
wall (Pp).
Cubrinovski et al (2009b) recommend use of:
αc = 4.5 as a reference value and (α
C = 3 lower-bound, and α
C = 5 upper-bound values) (Equation 6.5)
Note that αc = 1.0 is used for the springs connected to a pier or abutment (wall).
The upper and lower bound values are based on the early work of Broms (1964); the reference value is
based on benchmark experiments on piles in liquefying soils (Cubrinovski et al 2006).

Design guidance for bridges in New Zealand for liquefaction and lateral spreading effects
54
2 Non-liquefied deeper soils
The soil spring parameters for deeper non-liquefied soils are determined using identical procedure as for
the non-liquefied soils but with the following modifications:
𝑃𝐵−𝑚𝑎𝑥 = 𝑝𝐵−𝑚𝑎𝑥 · 𝑠 ·𝐷0 = 𝛼𝑐 · 𝑃𝑝 · 𝑠 ·𝐷0 = 3 · 𝑃𝑝 · 𝑠 · 𝐷0 (for non-cohesive soils) (Equation 6.6)
Note: αc = 1.0 (instead of 3) could be also used, and is the preferred choice at larger depths; in some
cases, this choice may affect both the displacement of the pile at the pile head and the peak bending
moment at the soil interface at the base of the liquefied layer.
3 Liquefied soils
The soil spring parameters for liquefied soils are determined using similar procedure as for the non-
liquefied soils but with the following modifications:
The spring stiffness is reduced by a degradation factor βL and is
given by:
𝐾𝐿 = 𝛽𝐿 · 𝑘𝐿 · 𝑠 · 𝐷0 (Equation 6.7)
in which KL = spring stiffness, s = spring spacing, D
o = pile diameter
(width), kl = subgrade reaction coefficient (Eq. 6.2) and β
L is defined
as:
For cyclic loading: for lateral spreading:
βL = 0.05 – reference value β
L = 0.01 – reference value
βL = 0.02 – lower bound value β
L = 0.001 – lower bound value (Equation 6.8)
βL = 0.10 – upper bound value β
L = 0.02 – upper bound value:
The recommended ranges of values for βL are based on back-calculations of case studies from the 1995
Kobe earthquake (Ishihara and Cubrinovski 1998a; Ishihara and Cubrinovski 1998b; Ishihara and
Cubrinovski 2004) and benchmark liquefaction experiments on full-size piles (Cubrinovski et al 1999;
Cubrinovski et al 2006).
The soil spring yield force is given by:
𝑃𝐿−𝑚𝑎𝑥 = 𝑝𝐿−𝑚𝑎𝑥 · 𝑠 ·𝐷0 = 𝛼𝐿 · 𝑆𝑟 · 𝑠 ·𝐷0 (Equation 6.9)
In which pL-max
- yield strength of soil spring, s - spring spacing, Do - pile diameter (width), and S
r - residual
strength of liquefied soil layer. αL = 1.0 is provisionally adopted as a lower bound and reference value; α
L >
1.0 values could be also used in parametric evaluations.
Sr can be estimated using empirical correlations between S
r and SPT blow count N (Idriss and Boulanger
2008; Olson and Stark 2002; Seed and Harder 1990) or Sr and CPT resistance (Idriss and Boulanger 2008;
Olson and Stark 2002), similar to those shown in figure 6.10. It is important to consider the uncertainty in
the residual strength of liquefied soils in the analysis.

6 Methods of analysis
55
Figure 6.10 Empirical correlation for residual strength of liquefied soils: a) residual strength (Seed and Harder
1990; b) normalised residual strength (Idriss and Boulanger 2008)
6.2.1.5 Pile moment-curvature parameters
Moment-curvature relationships should be determined for the particular diameter, cross-section
dimensions and details, yield strength and threshold strains of materials, axial loads and pre-stress levels
of the piles. The M-φ relationship(s) are critical input for the PSA, as they affect the pile response and
consequent damage to the piles.
Pile properties
• Accurate determination of the moment-curvature relationship is critical in the assessment of the
pile response and its damage.
• Use of simplified M-φ relationship such as tri-linear or bi-linear relationship identifying the
threshold curvature levels (kink points in the relationship) is preferred for the PSA; For example,
for a RC pile, concrete cracking (C), yielding of the reinforcement (Y) and concrete crushing or
ultimate level (U) points can be defined to develop the M-φ for PSA (figure 6.11). It should be
noted that the threshold points of the M-φ relationship are estimated based on the calculated
strains in the steel and concrete, in a section analysis.
• The M-φ relationship should be defined for an appropriate range of axial loads acting on the pile,
pre-stress levels, pile geometry, strength and threshold strain characteristics of pile materials.
• The M-φ relationship could be determined using conventional procedures for cross section analysis
with simplified elastic-plastic load-deformation characteristics for concrete and steel. Commercial
software is available for computing M-φ relationships.
Figure 6.11 Typical tri-linear moment-curvature relationship for reinforced concrete piles

Design guidance for bridges in New Zealand for liquefaction and lateral spreading effects
56
6.2.1.6 Input ground displacements
Both magnitude and distribution of ground displacements have to be estimated for the cyclic liquefaction
and lateral spreading analyses. A number of methods can be used to estimate the maximum free-field
cyclic (transient) displacements in liquefied deposits. For example, SPT- and CPT- based liquefaction
analysis methods may provide estimates for the maximum shear strain induced by liquefaction as a
function of the seismic demand (cyclic stress ratio) and penetration resistance of soils. Ishihara and
Yoshimine (1992), Tokimatsu and Asaka (1998) and Idriss and Boulanger (2008) provide such charts for
evaluation of maximum shear strains. By integrating the shear strains throughout the depth of the
deposit, ground displacement profile can be estimated assuming linear variation for the displacement in
any given layer. While cosine distribution might be more appropriate, linear distribution is more practical
and acceptable as the shape of the ground displacement profile has relatively small effect on the
pile/foundation response compared with the absolute magnitude of the ground displacement.
Lateral spreading displacements can be estimated using the lateral displacement index or LDI method
based on CPT (Zhang et al 2004) or empirical correlations based on regression analyses of case studies
(eg Youd et al 2002). All methods currently in use for estimating lateral spreading displacements involve
significant uncertainties, and some of those methods such as those based on regression analysis have
little physical basis. Therefore, a range of ground displacements should be estimated and considered in
the lateral spreading analyses.
Ground displacement
• Estimate maximum shear strains in liquefied soils using simplified methods based on SPT- or CPT-
resistance.
• Determine the displacement profile by integrating shear strains throughout the depth of the deposit
assuming linear distribution of displacements within a given layer.
• The estimated displacements are free-field ground movements unaffected by the presence of piles and
bridge structure. Reduction of soil displacements due to pinning and strutting effects should then be
considered for stiff and strong bridge structures with sufficient capacity to resist large lateral
loads/movements. A number of case histories from the 2010–2011 Canterbury earthquakes suggest
that pinning (strutting)-effects reduced the displacements of the foundation soils to 50% of the
corresponding free-field ground displacements. (Note: ‘pinning’ refers to a resistance to ground
movement provided by the superstructure. Pinning effects could be provided by global effects, eg
from the strutting of the superstructure between the two abutments, or by structural members such
as cantilevering of the piles above non-liquefied soils).
• It is assumed that the non-liquefiable crust layer on top of underlying liquefied layer moves as a rigid
body, and hence displaces for the same amount as the top of the underlying liquefied soil; the base
non-liquefiable layers do not move, though the method allows the designer to apply lateral ground
displacement in any layer.
• For estimate of cyclic ground displacements refer to Idriss and Boulanger (2008), Tokimatsu and
Asaka (1998) and Ishihara and Yoshimine (1992).
• Lateral spreading displacements can be estimated based on Zhang et al (2004) and Youd et al (2002).
Evidence from the 2010–2011 Christchurch earthquakes can also be used to calibrate the estimates.

6 Methods of analysis
57
6.2.1.7 Input inertia load
In the model, two equivalent static loads can be applied to the pile: a lateral force (F) representing the
inertial load on the pile/bridge structure due to vibration of the superstructure, and a horizontal ground
displacement (UG) representing the kinematic load on the pile due to lateral ground movement (cyclic or
spreading) in the free field. The selection of appropriate equivalent static loads is probably the most
difficult task in the PSA, because both input loads are, in effect, estimates of the seismic response of the
ground and superstructure respectively.
One of the key issues in the PSA when evaluating the peak response of the pile during the cyclic phase is
how to combine the kinematic loads due to cyclic ground displacements and the inertial loads due to
vibration of the superstructure. The peak cyclic ground displacement and superstructure inertial force are
transient conditions occurring momentarily during the course of strong shaking. They may or may not
occur at the same instant. Currently there is no clear and simple strategy on how to combine these loads
in the equivalent static analysis (PSA). Based on a series of large-scale shake table experiments, Tokimatsu
et al (2005) suggested that the phasing of the kinematic and inertial demands varies, and depends
primarily on the natural frequency of the superstructure and soil deposit. Based on numerical studies,
Boulanger et al (2007) proposed a simplified expression (discussed in section 6.2.2) allowing for different
combinations of kinematic and inertial loads on the pile while accounting for the period of the ground
motion. As commonly acknowledged, for equivalent static approaches used for analysis of seismic
problems, the kinematic-inertia load combination producing the critical (peak) pile response in liquefying
soils cannot be predicted with any high degree of certainty.
Inertia load
• An estimate for the dynamic response of the bridge (spectral acceleration) is needed to calculate the
maximum inertia force. A portion of this force can be used to determine the equivalent horizontal
static force that will be applied in PSA.
• For the transient (cyclic) phase of the response, estimated cyclic ground displacements and estimated
reduced inertia force are simultaneously applied to the pile (beam-spring model). Parametric variation
in the inertia force should be considered to account for uncertainties in the combined kinematic and
inertia loads.
• Provided that effects of inertia force have been carefully considered and evaluated in a cyclic PSA,
inertia loads could be ignored in the lateral spreading analysis. A reduced inertia loads representative
for post-liquefaction phase of the response can be adopted in the lateral spreading analysis, at
discretion of the engineer.
6.2.1.8 Pile group effects
Pile group effects generally arise due to two independent mechanisms: a) obstruction of ground
deformation/displacements, and consequent reduction in soil pressure on piles due to the presence of
adjacent/surrounding piles in the group (foundation), and b) cross-interaction amongst piles due to the
constraints imposed by a rigid pile cap or abutment that the piles are connected to.
When a large group of piles is subjected to cyclic ground displacements or lateral spreading displacements,
the presence of the surrounding and adjacent piles influences the displacements of the foundation soils and
the pressure (and ultimate load) on any given pile in the group. The well-known shadowing effects
(obstruction of ground movement by the frontline adjacent pile) and overlapping of wedges (reduced
pressure on the pile due to shared wedge-zone with adjacent piles in the row) affect the movement of the
foundations soils and the imposed kinematic loads on any given pile. The shadowing and overlapping effects

Design guidance for bridges in New Zealand for liquefaction and lateral spreading effects
58
depend on the spacing and the number of piles in the group. Figure 6.12 illustrates the reduction in the
ultimate lateral soil pressure on a pile within a group compared with a single pile, as a function of the
number of piles within the group. These data is for pile spacings of 2.5 to 3 pile diameters, and includes
both active loading (pile pushed into the ground) and passive loading (ground pushed into the pile)
(Cubrinovski et al 2006), though the trend is predominantly derived from active piles. These results from
experiments in non-liquefied soils show reduction in the ultimate load on the pile with increasing number of
piles in the group. Note however that pile spacing influences these reductions significantly, and that
generally for spacing of six diameters or greater, pile group effects should be ignored.
Available experimental data on these effects for piles in liquefiable soils is limited and not conclusive.
Because of the significant reduction in stiffness and strength of liquefied soils, the zone of soil affected by
the presence of stiff piles is much smaller compared with non-liquefied soils. One can anticipate ‘flow’ of
the liquefied soil around the pile without any substantial effect on the adjacent piles. Hence, it is prudent
to ignore pile group effects in liquefied soils.
Figure 6.12 Pile-group effects on the ultimate lateral soil pressure displacements (Cubrinovski and Ishihara
2007)
Piles in a group are normally rigidly connected at the pile head and therefore, when subjected to lateral
loads, all piles will share nearly identical horizontal displacements at the pile head. During lateral
spreading of liquefied soils at river banks or waterfront area, each of the piles could be subjected to a
different lateral load from the surrounding soils, depending upon its particular location within the group
and the spatial distribution of the spreading displacements (figure 6.13). Consequently, both the
interaction force at the pile head and the lateral soil pressure along the length of the pile will be different
for each pile, thus leading to a development of distinct patterns of deformation and stresses along the
length of individual piles in the group. These pile-group effects should be considered in the analysis using
pile-group or whole bridge model.
Figure 6.13 Piles in a group subjected to varying lateral spreading displacements (Cubrinovski and Ishihara 2007)

6 Methods of analysis
59
Lateral spreading often exhibits a non-uniform spatial distribution of lateral ground displacements, which
are commonly largest near the river banks (waterfront) and gradually decreasing with distance from the
waterfront, therefore, as shown in the figure, the leading piles are subjected to much larger ground
displacements than the trailing piles.
Pile group effects
1 Soil-pile interaction effects and pile cross-interaction effects should be considered.
2 Soil-pile interaction effects in liquefied soils are ignored.
3 Soil-pile interaction effects in non-liquefied soils depend on the spacing and number of piles in the group.
4 Significant reduction in lateral loads from the crust layer due to the pile-group effect is generally non-
conservative and should be avoided. In other words, such reduction is prudent only when supported
by a compelling case for the existence of pile group effects.
5 Cross-interaction effects should be considered with a pile-group or whole bridge model.
6.2.1.9 Global bridge analysis
A whole global bridge model for the Anzac Bridge is shown in figure 6.14. The model illustrates the
benefits of the global bridge PSA. In principle, the soil and pile modelling for the whole bridge model is
identical to the single-pile model. In the global bridge model, however, the variation in the subsurface
conditions and lateral ground displacements can be considered along the bridge alignment, and their
effects can be evaluated/quantified. The superstructure can be modelled as elastic or elastic-plastic, using
linear or nonlinear (eg bi-linear) beam elements, and respective stiffness and strength of the structural
members. Gaps between the deck and the abutment can be modelled as well as deck-pinning or deck-
strutting effects. Depending on structural characteristics and geometry, abutments can be modelled either
as rigid members or with their actual flexibility.
The global bridge analysis can provide more realistic simulation of the distribution of force and
displacement demands throughout the bridge while considering the interaction between different
components of the bridge, complex spatial distribution of subsurface conditions, foundation
characteristics and ground movements along the bridge alignment. In addition to the details of the pile
response as per single-pile analysis, deformation and stresses in structural members (eg deck, piers,
abutment walls) and global displacement of the bridge (magnitude and direction) can be estimated while
considering the interaction of the soil-pile-abutment-pier-superstructure system.
Global bridge analysis
• In the global bridge analysis it is necessary to consider the response of the bridge and its components
using a global bridge model.
• Liquefaction analysis and estimate of ground displacement profiles are required for each foundation
(pile group). Lateral spreading displacements at the ground surface at the location of piers in the
riverbed can be estimated by interpolating between the estimated spreading displacements at the
river banks and assuming zero displacement at the neutral point in the central area of the riverbed.
• Simple but realistic models can be used for all principal components of the bridge including imposed
displacement constraints by the deck or other structural members.
• Uncertainties in the estimates of ground displacements and soil spring properties should be assessed
through parametric analyses.

Design guidance for bridges in New Zealand for liquefaction and lateral spreading effects
60
In figure 6.14, blue solid lines show the deformed shape of the ANZAC Bridge computed in the analysis (A)
where ground displacements have been applied only to the abutments and abutment piles. Red lines indicate
the deformed shape of the bridge computed in the analysis (AP) where, in addition to the ground
displacements applied to the abutments and abutment piles, ground displacements have been also applied
to the pier piles. In the central part of the figure, bending moments are shown for the piers and pier piles for
analysis A (solid blue lines), for analysis AP (red lines), for analysis 0.2AP (yellow lines) in which the
magnitude of ground displacements applied to the pier piles has been reduced to 20% of those applied in
the AP analysis (to account for uncertainties in the magnitude of ground displacements), and AP,αnl-0.5
analysis
(green lines) where the strength of the non-liquefied layers along the pier piles was reduced to 50% of that
used in the AP analysis (to account for potential increase in the excess pore pressures in these layers). The
dashed vertical lines indicate the threshold cracking, yielding and ultimate bending moments for the pier
and the pier piles respectively. Appendix B shows a worked example of this analysis.
Figure 6.14 Schematic plot of the global ANZAC Bridge model and analysis showing applied ground
displacement at the abutment piles (applied in all analyses), ground displacements applied to the pier piles (AP
analyses), deformed shape of the bridge, damage locations where M > My, and bending moments along the piers
and pier piles (Cubrinovski et al 2014)
6.2.1.10 Uncertainties in the analysis
Significant uncertainties associated with the model parameters in the PSA should be considered. An
important question that needs to be answered is not ‘what is the most appropriate value for a given model
parameter?’, but rather ‘how big is the effect of variation (uncertainty) in a given model parameter on the
predicted pile response?’ This consideration will enable the user to focus on critical uncertainties in the
analysis and develop a suitable strategy for robust implementation of the simplified PSA.
In the case of large ground displacements of a thick unliquefiable crust layer, the large ground
displacements and spring properties of the crust layer may completely control the pile response. In such
cases, the properties and uncertainties of the soil springs for the liquefied layers are irrelevant and can be
ignored. In fact, one may find that in many cases only two or three critical parameters control the pile
response in the PSA. Magnitude of ground displacements and properties of the crust layer (load from the
crust) are often identified as critical parameters in PSA.

6 Methods of analysis
61
Uncertainties in the analysis
1 Identify the range of variation for soil spring parameters, ground displacements and equivalent static
inertia load.
2 Conduct parametric study and identify key parameters controlling the pile response.
3 Focus on examining the effect of uncertainties in critical parameters on the pile response.
6.2.1.11 Summary of the analysis procedure
Step 1: Site and soil characterisation
Site characterisation should include interpretation of local geology, review of historical records with
respect to liquefaction, and analysis of an appropriate combination of CPT or SPT investigation and
laboratory test data. Shear wave velocity data can also be used and is especially valuable for gravelly soils.
Detailed cross sections and soil profiles (including depth to the water table and data for simplified
liquefaction triggering analysis) should be developed at each abutment and pier along the bridge
alignment.
The soil characterisation should include liquefaction susceptibility evaluation and identification of non-
liquefied layers based on plasticity criteria based on Idriss and Boulanger (2008) and Bray and Sancio
(2006) and CPT-based Ic-criteria in addition to other generic criteria.
Step 2: Determine earthquake load at bridge site
The earthquake load parameters required for liquefaction triggering analysis (moment magnitude, Mw and
horizontal peak ground acceleration, PGA) and inertia loads from the bridge superstructure (ie spectral
accelerations) should be determined at the bridge site either using regional seismic hazard parameters or
site specific analysis.
Step 3: Liquefaction triggering analysis
Conventional liquefaction triggering analysis is then conducted using CPT: (Idriss and Boulanger 2008;
Youd et al 2001), SPT: (Idriss and Boulanger 2008) or Vs-based (Youd et al 2001) procedures to identify the
layers that will liquefy including their factors of safety against liquefaction triggering. The water table and
presence of non-liquefiable soils should be used to determine the thickness of the crust of non-liquefiable
soils at the ground surface.
Step 4: Formulate beam-spring model
The beam-spring model is defined based on the geometry of the bridge, bridge components and
simplified soil profile derived in steps 1 and 3. The length of the beam elements or spring spacing should
be preferably 0.1m and not larger than 0.2m. Appropriate boundary conditions should be adopted for a
single-pile (at the top and tip of the pile) or a global bridge model including constraints imposed by the
structure.
Step 5: Estimate soil spring parameters
Stiffness and strength of the springs are estimated for the non-liquefiable crust layers, liquefied layers and
non-liquefiable layers throughout the depth of the profile based on detailed procedures described in
section 6.2.1 and expressions given in equations 6.1 to 6.9. Best-estimate (reference), upper-bound and
lower-bound values should be estimated for stiffness and strength (ultimate capacity) of soil springs.
Separate set of spring values should be defined for the cyclic phase and lateral spreading phase (analysis)
of the bridge.

Design guidance for bridges in New Zealand for liquefaction and lateral spreading effects
62
Step 6: Estimate pile M-φ parameters
The bending stiffness and moment curvature relationships for the piles, abutments, piers and deck should
be defined. Bi-linear or tri-linear relationships are preferred. M-φ relationships should be defined for an
appropriate range of axial loads, pre-stress levels, pile geometry, strength and threshold strain
characteristics of the pile.
Step 7: Estimate free-field ground displacements
Magnitude and distribution of ground displacements throughout the soil profile are estimated for free-
field conditions (excluding any interaction with the piles or bridge structure), using the methods listed in
section 6.2.1. Cyclic liquefaction and lateral spreading displacements should be considered and estimated
separately. Given the uncertainties in the assessment of lateral spreading displacements and due to
sensitivity of cyclic displacements in liquefied soils to site response and earthquake motion
characteristics, a range of ground displacements (ie best-estimate, upper bound and lower-bound values)
should be considered in the analyses.
Step 8: Estimate inertia loads
Inertia loads should be estimated for the cyclic phase of the response, from both the superstructure and
the pile cap. Inertia forces can be calculated using spectral accelerations, and applied as static forces at
the top of the pile (from pile cap) or at the deck (from the superstructure). For the cyclic phase of the
response maximum ground displacement and a portion of the maximum inertia force should be applied
simultaneously to the pile or bridge model. In the lateral spreading analysis none or a small portion of the
inertia load should be applied.
The designers should also consider negative skin friction on the piles resulting from settlement of
liquefied soil and non-liquefied crust. Appropriate down-drag loads should be considered in the design if
required.
Step 9: Conduct PSA with best-estimate parameters
PSA is conducted using best-fit values for the parameters of the beam-spring model and loads.
Step 10: Conduct parametric (sensitivity) analyses
In order to consider uncertainties in the assessment of liquefaction and lateral spreading and in the
analysis procedures, PSA should be conducted using upper-bound and lower-bound values for the
parameters of the beam-spring model and loads.
Step 11: Estimate pile group effects
Pile group effects due to overlapping zones, shadowing and cross-interaction should be evaluated
separately in the case of single-pile analysis. It is recommended to employ a global bridge analysis in
order to capture the interaction of the soil-pile-pier-abutment-deck system.
Step 12: Consider SFSI and 3-D effects
P-delta effects and potential buckling (O’Rourke et al 1994; Bhattacharya et al 2004) as well as effects of
soil-foundation-structure interaction (SFSI) and 3-D effects should be considered by separate checks and
analyses, if potentially significant.
6.2.2 PEER method
The Recommended design practice for pile foundations in laterally spreading soil ground by PEER (Ashford
et al 2011) provides a summary of recommended procedures and practices for analysis and design in the
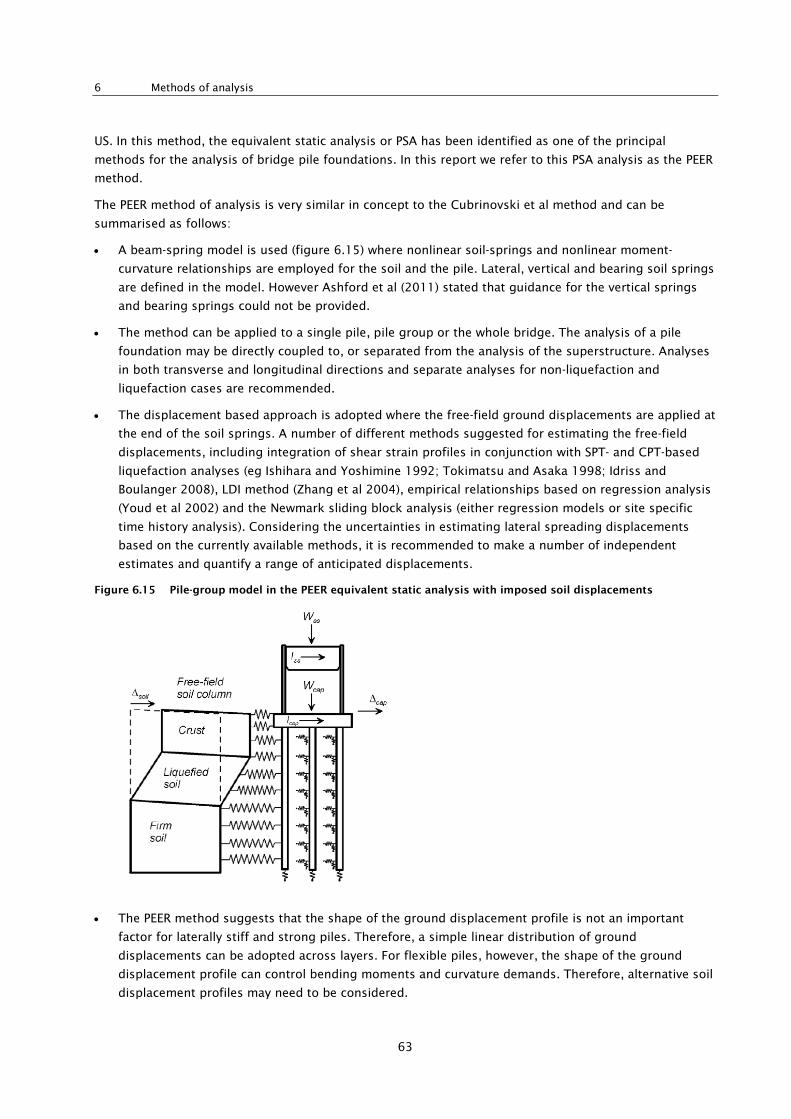
6 Methods of analysis
63
US. In this method, the equivalent static analysis or PSA has been identified as one of the principal
methods for the analysis of bridge pile foundations. In this report we refer to this PSA analysis as the PEER
method.
The PEER method of analysis is very similar in concept to the Cubrinovski et al method and can be
summarised as follows:
• A beam-spring model is used (figure 6.15) where nonlinear soil-springs and nonlinear moment-
curvature relationships are employed for the soil and the pile. Lateral, vertical and bearing soil springs
are defined in the model. However Ashford et al (2011) stated that guidance for the vertical springs
and bearing springs could not be provided.
• The method can be applied to a single pile, pile group or the whole bridge. The analysis of a pile
foundation may be directly coupled to, or separated from the analysis of the superstructure. Analyses
in both transverse and longitudinal directions and separate analyses for non-liquefaction and
liquefaction cases are recommended.
• The displacement based approach is adopted where the free-field ground displacements are applied at
the end of the soil springs. A number of different methods suggested for estimating the free-field
displacements, including integration of shear strain profiles in conjunction with SPT- and CPT-based
liquefaction analyses (eg Ishihara and Yoshimine 1992; Tokimatsu and Asaka 1998; Idriss and
Boulanger 2008), LDI method (Zhang et al 2004), empirical relationships based on regression analysis
(Youd et al 2002) and the Newmark sliding block analysis (either regression models or site specific
time history analysis). Considering the uncertainties in estimating lateral spreading displacements
based on the currently available methods, it is recommended to make a number of independent
estimates and quantify a range of anticipated displacements.
Figure 6.15 Pile-group model in the PEER equivalent static analysis with imposed soil displacements
• The PEER method suggests that the shape of the ground displacement profile is not an important
factor for laterally stiff and strong piles. Therefore, a simple linear distribution of ground
displacements can be adopted across layers. For flexible piles, however, the shape of the ground
displacement profile can control bending moments and curvature demands. Therefore, alternative soil
displacement profiles may need to be considered.

Design guidance for bridges in New Zealand for liquefaction and lateral spreading effects
64
• The restraining or pinning effect of the pile foundation can significantly reduce the lateral spreading
displacements of the soil near the pile foundations.
• Effects of liquefaction on the soil springs are accounted for by two separate methods. In the first
method, scaling factors, or so-called p-multipliers (mp) are applied to the spring (p-y) resistance. Figure
6.16 summarises the p-multipliers accounting for liquefaction effects as a function of the clean-sand
normalised SPT blow count. Figure 6.17 summarises some other published recommendations for p-
multipliers.
• It is recommended to use the middle of the range of p-multipliers recommended by Brandenburg
(2005) and check the sensitivity of the foundation response to a factor of two increase or decrease in
p-multipliers. Pile performance can be insensitive to the p-multipliers when a strong non-liquefiable
crust is present.
• While the PEER method uses nonlinear p-y curves (concave downward), the shape of these curves can
be very different from those of liquefying soils observed in experiments (the actual curves are concave
upward due to cyclic mobility).
Figure 6.16 P-multipliers for different clean sand equivalent corrected blow count recommended by PEER
(Ashford et al 2011)
Figure 6.17 p-multipliers versus clean sand equivalent corrected blow count from variety of studies (Ashford et
al 2011)
• The second recommended method to account for the effects of liquefaction on the soil springs is the
use of the residual post-liquefaction soil strength (Sr).
• Residual soil strength can be estimated from empirical correlations to SPT or CPT data and both Sr
based or normalised relationships (Sr/σ'vc) can be applied.

6 Methods of analysis
65
• The Rankine pressure theory is the most appropriate for calculating the passive pressure in non-
liquefiable crust layers. When free-field ground displacements (not accounting for pinning-effects) are
specified as an input, the amount of displacement required to mobilise the ultimate crust load can be
approximated as being 25% (for stiff crust soils) to 70% (for soft or loose crust soil) of the wall (or pile
cap) height.
• For design purposes it is prudent to assume that enough lateral spreading displacement occurs during
strong ground shaking to consider the lateral spreading displacements and a fraction of the inertia
demands as additive. In other words, lateral spreading displacements and inertial loads should be
applied simultaneously (figure 6.18).
• The inertia force is given by:
(Equation 6.10)
in which Iliq – inertia force accounting for effects of liquefaction, C
cc – the fraction of the maximum
displacement demand with liquefaction that occurs at the critical cycle, Cliq - ratio of maximum
displacement demand with liquefaction to that without liquefaction, and Inonliq
– peak inertia force for a
linear-elastic bridge superstructure in the absence of liquefaction (Inonliq
= m•Sa where m is mass and S
a
is spectral acceleration). The variation of the coefficients in equation 6.10 with the frequency
characteristics of the motion for the pile cap and superstructure inertia forces is given in figure 6.19.
Figure 6.18 Combined displacement demands from lateral spreading and inertial loading in the longitudinal
direction for an individual single-column bent (Ashford et al 2011)
nonliqliqccliq ICCI ⋅⋅=

Design guidance for bridges in New Zealand for liquefaction and lateral spreading effects
66
Figure 6.19 Inertia coefficients for use in equation 6.10 (Ashford et al 2011)
• The stiffness and capacity of soil springs are often reduced to account for pile group interaction
effects by applying group p-multipliers. Group effects should not be applied in liquefied soils because
available case studies and research data indicate they do not exist in liquefied soils. Also, group
effects should not be applied in laterally spreading non-liquefiable crust layers, because this would
constitute non-conservative reduction in lateral spreading forces.
• Global bridge analyses are recommended particularly when the subsurface conditions and expected
ground displacements vary substantially along the bridge alignment (figure 6.20). Global analyses can
provide additional insights into the pinning effects at abutments, where axial loads in the
superstructure can pin back the spreading abutment. A number of possible loading combinations
should be examined in the global bridge analyses.
• Parametric and sensitivity analyses are recommended to assess the uncertainties and check the design
for a range of soil spring parameters, ground displacements and loading conditions using best
estimates, upper and lower bound design values.
Figure 6.20 Deformed bridge configuration in global bridge analysis (Ashford et al 2011)
6.2.3 AIJ method
The AIJ method (AIJ 2001) specifically addresses piles for building foundations. It is one of the well-
developed and widely used methods for analysis of pile foundations in Japan. It is therefore useful for
geotechnical designers to understand its basics. The AIJ method of analysis is similar in concept to the
Cubrinovski et al method. Key features of the AIJ method of analyses are as follows:
• It adopts the displacement-based approach using a beam-spring model and uses Bi-linear soil springs
and tri-linear (or similar) moment-curvature relationships for the pile. Free field ground displacements

6 Methods of analysis
67
are applied at the end of the springs to simulate effects of transient ground displacement and
spreading displacements.
• The stiffness of soil springs is defined using the subgrade reaction approach. Equation 6.2 is used for
sandy soils.
Figure 6.21 Stiffness reduction factor for liquefied soils adopted in AIJ method (AIJ 2001)
• Effects of liquefaction on the soil springs are accounted for through a degradation factor β which is a
function of the SPT blow count N and depth, as shown in figure 6.21. In the figure, Na is equivalent to
a normalised SPT blow count.
• The ultimate soil pressure or spring strength in non-liquefied soils is defined using the Rankine
passive pressure and an expression identical to that given in equation 6.3 with αc = 3.0 based on the
well-known early study of Broms (1964).
• Uchida and Tokimatsu (2005) recommended the use of β as defined in figure 6.21 also for the
degradation of soil pressure in liquefied soils.
• Three separate analyses are recommended for the pile foundations: non-liquefaction analysis (Case I),
liquefaction analysis (Case II) and lateral spreading analysis (Case III), as illustrated in figure 6.22
(Tokimatsu and Asaka 1998; Tokimatsu et al 2005).
Figure 6.22 Separate analyses and loading conditions (inertia and kinematic loads) for three different stages of
the response: no-liquefaction (Case I), liquefaction (Case II) and lateral spreading (Case III) (Tokimatsu and Asaka
1998; Tokimatsu et al 2005)
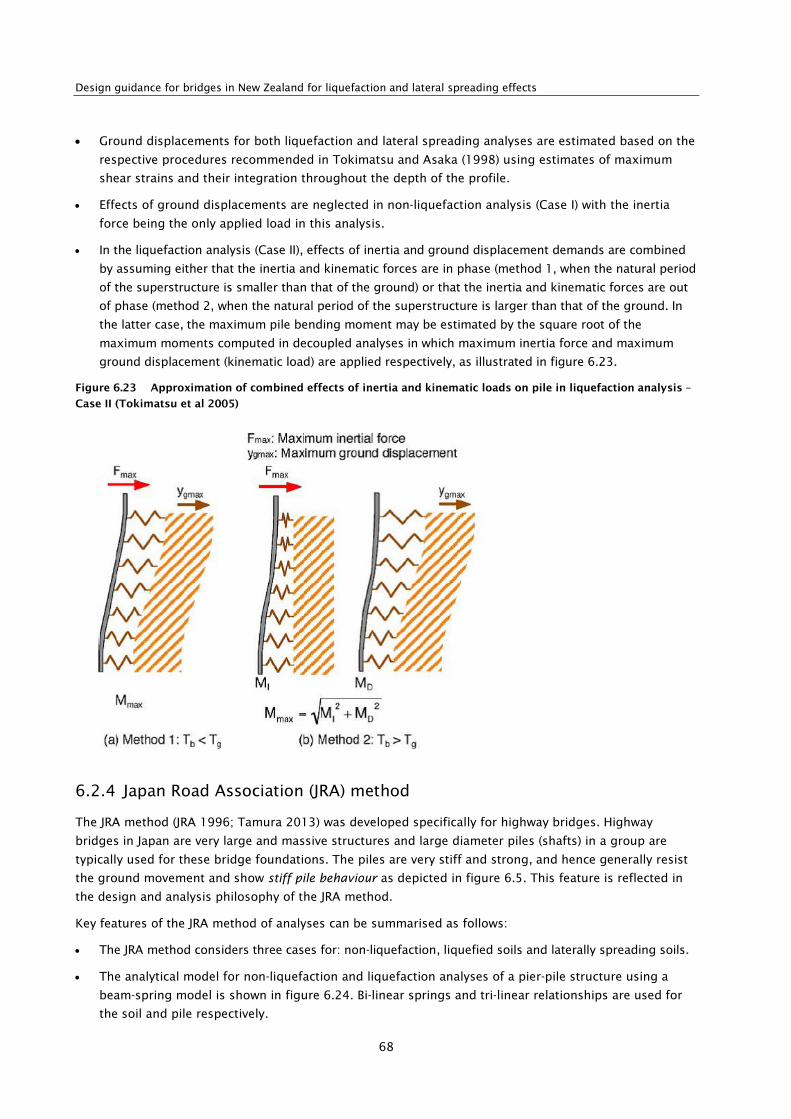
Design guidance for bridges in New Zealand for liquefaction and lateral spreading effects
68
• Ground displacements for both liquefaction and lateral spreading analyses are estimated based on the
respective procedures recommended in Tokimatsu and Asaka (1998) using estimates of maximum
shear strains and their integration throughout the depth of the profile.
• Effects of ground displacements are neglected in non-liquefaction analysis (Case I) with the inertia
force being the only applied load in this analysis.
• In the liquefaction analysis (Case II), effects of inertia and ground displacement demands are combined
by assuming either that the inertia and kinematic forces are in phase (method 1, when the natural period
of the superstructure is smaller than that of the ground) or that the inertia and kinematic forces are out
of phase (method 2, when the natural period of the superstructure is larger than that of the ground. In
the latter case, the maximum pile bending moment may be estimated by the square root of the
maximum moments computed in decoupled analyses in which maximum inertia force and maximum
ground displacement (kinematic load) are applied respectively, as illustrated in figure 6.23.
Figure 6.23 Approximation of combined effects of inertia and kinematic loads on pile in liquefaction analysis –
Case II (Tokimatsu et al 2005)
6.2.4 Japan Road Association (JRA) method
The JRA method (JRA 1996; Tamura 2013) was developed specifically for highway bridges. Highway
bridges in Japan are very large and massive structures and large diameter piles (shafts) in a group are
typically used for these bridge foundations. The piles are very stiff and strong, and hence generally resist
the ground movement and show stiff pile behaviour as depicted in figure 6.5. This feature is reflected in
the design and analysis philosophy of the JRA method.
Key features of the JRA method of analyses can be summarised as follows:
• The JRA method considers three cases for: non-liquefaction, liquefied soils and laterally spreading soils.
• The analytical model for non-liquefaction and liquefaction analyses of a pier-pile structure using a
beam-spring model is shown in figure 6.24. Bi-linear springs and tri-linear relationships are used for
the soil and pile respectively.

6 Methods of analysis
69
• Effects of liquefaction are accounted for by multiplying the stiffness (subgrade reaction coefficient),
ultimate soil reaction (strength of soil spring) and skin friction capacity by a degradation coefficient
DE. The coefficient D
E is defined as a function of the factor of safety against liquefaction triggering (F
L
= FS) and depth from the ground surface (figure 6.25).
Figure 6.24 Analytical model and load deformation relationships for liquefaction analysis of a pier pile
foundation (Tamura 2013)
Figure 6.25 Degradation coefficient DE accounting for effects of liquefaction on stiffness and strength of soil
springs: note, FL = FS = factor of safety against liquefaction triggering; R = CRR
20 = cyclic resistance ratio at 20
cycles (reference Nc used in Japanese practice)
• Force-based approach, with prescribed lateral loads on the pile corresponding to the ultimate loads
from the soil on the pile, is used for lateral spreading analysis.

Design guidance for bridges in New Zealand for liquefaction and lateral spreading effects
70
• Rankine passive pressure is specified for the non-liquefied layer, while 30% of the overburden effective
stress is applied to the underlying liquefied layer, resulting in linear distribution of these pressures with
depth, as illustrated in figure 6.26. Details in the calculation of the lateral pressures are given below:
(Equation 6.11)
(Equation 6.12)
In which Kp - coefficient of passive earth pressure, x - depth measured from the ground surface, γNL and γL - unit weights of non-liquefied and liquefied layers respectively, and the constants are given
below. CS is the correction factor for distance, S, from the waterfront, ie
(Equation 6.13)
CL is the correction factor in the liquefied layer:
(Equation 6.14)
CNL
is the correction factor in the non-liquefied layer:
(Equation 6.15)
In equation 6.15, PL represents the index of liquefaction potential (Iwasaki et al 1982), which is used
to express the severity of liquefaction.
Figure 6.26 Definition of lateral loads in the force-based approach for analysis of lateral spreading (‘ground
flow’) adopted in the JRA method
≤<≤
=100m50mfor0.5
50mfor1.0S
SCS
3.0=LC
( )
>≤<−
≤=
20for0.1205for3/12.0
5for0.0
L
LL
L
NL
PPP
PC
( )NLNLPNLSNL HxxKCCq ≤≤= 0γ
( ){ } )( LNLNLNLLNLNLLSL HHxHHxHCCq +≤<−+= γγ
non-liquefied layer
liquefied layer
non-liquefied layer
HNL
HL
qNL
qL

6 Methods of analysis
71
6.2.5 Consideration of PSA methods
The Cubrinovski et al method focuses on a simplified, but sufficiently accurate, modelling of the soil-pile-
bridge system where uncertainties in the applied loads and characteristics of liquefying soils are
addressed through modelling considerations and parametric studies. Special attention and guidance is
given to the determination of model parameters and also to the identification of the key parameters
controlling the pile/bridge response in order to focus on critical performance parameters.
The non-linear p-y curves of the PEER method do not provide any advantage in the modelling of the soil-
pile interaction in liquefied soils, but potentially introduce difficulties in the determination of soil springs.
The AIJ method on the other hand, does not provide guidance on how to treat the uncertainties associated
with liquefaction and lateral spreading, and how to perform parametric evaluations.
The PEER and AIJ methods provide a relatively simple guidance for the evaluation of inertial loads from the
superstructure (and pile cap) and on how to combine the inertial and kinematic loads in PSA addressing
the cyclic phase of liquefaction analysis. It is important to recognise that the estimate of inertial loads as
well as the combination of inertial and kinematic loads in an equivalent static analysis will always be
burdened by substantial uncertainties. Therefore emergence of well-established criteria for the
combination of these loads is highly unlikely. For this reason, it is essential to perform parametric
evaluation within reasonable range of assumed inertial loads and inertial-kinematic load combinations.
The JRA method suffers from the key anomaly of the forced-based approach where compatibility between
the pile displacement and the soil pressure cannot be ensured. The method is clearly inappropriate for any
pile behaviour except for very stiff pile behaviour (figure 6.5), and therefore is very limited in its
application.
6.3 Time history (dynamic) analysis
The dynamic response of the bridge is highly nonlinear and changes dramatically as it goes through the
different stages from the initiation of strong shaking, through rapid build-up of excess pore pressures and
consequent reduction in stiffness and strength of soils, development of liquefaction and post-liquefaction
large ground deformation associated with earthquake-induced but gravity driven spreading. A nonlinear
time history analysis enables the designers to investigate the dynamic response of the bridge taking into
account complex soil-pile-pier-abutment-deck interaction of the bridge system in liquefying and laterally
spreading soils (figure 6.27). There is no doubt that a capable numerical (effective stress) analysis that is
well-calibrated and executed provides the most realistic simulation of the actual bridge behaviour. While
the use of nonlinear time history analysis is beyond the scope of this report, it is important to emphasise
the unique capability and value that such analysis provides, and hence it is recommended for use
whenever viable and justifiable. The dynamic effective stress analyses are becoming more common for
significant engineering projects, and it is anticipated that their use will further increase in the near future.
Key features, advantages, shortcomings and requirements of the time history analysis are summarised in
table 6.1. A more detailed consideration of modelling issues and applications of the effective stress
analysis is given in Cubrinovski (2011).
6.3.1 Effective stress analysis (ESA)
A rigorous ESA permits evaluation of seismic soil-pile interaction while considering the effects of excess
pore pressure and eventual soil liquefaction on the pile response. The predictive capacity of such analysis
has been verified in many studies. However its application in engineering practice is constrained by two
requirements:
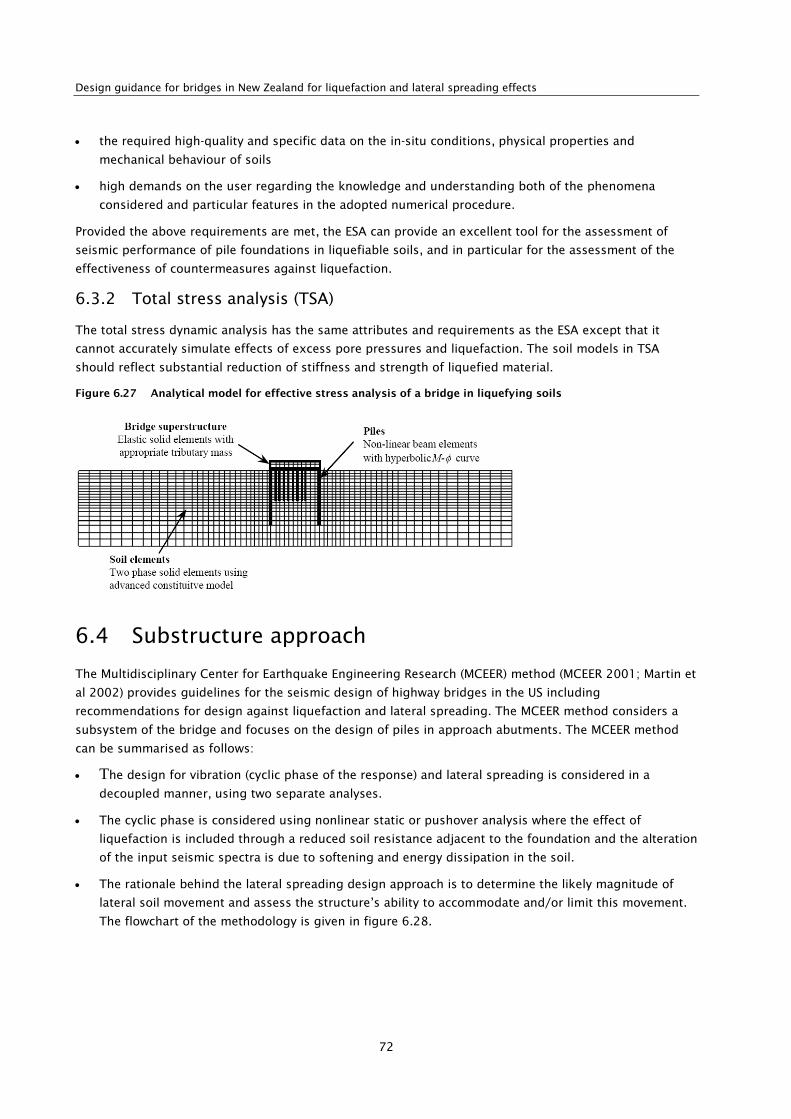
Design guidance for bridges in New Zealand for liquefaction and lateral spreading effects
72
• the required high-quality and specific data on the in-situ conditions, physical properties and
mechanical behaviour of soils
• high demands on the user regarding the knowledge and understanding both of the phenomena
considered and particular features in the adopted numerical procedure.
Provided the above requirements are met, the ESA can provide an excellent tool for the assessment of
seismic performance of pile foundations in liquefiable soils, and in particular for the assessment of the
effectiveness of countermeasures against liquefaction.
6.3.2 Total stress analysis (TSA)
The total stress dynamic analysis has the same attributes and requirements as the ESA except that it
cannot accurately simulate effects of excess pore pressures and liquefaction. The soil models in TSA
should reflect substantial reduction of stiffness and strength of liquefied material.
Figure 6.27 Analytical model for effective stress analysis of a bridge in liquefying soils
6.4 Substructure approach
The Multidisciplinary Center for Earthquake Engineering Research (MCEER) method (MCEER 2001; Martin et
al 2002) provides guidelines for the seismic design of highway bridges in the US including
recommendations for design against liquefaction and lateral spreading. The MCEER method considers a
subsystem of the bridge and focuses on the design of piles in approach abutments. The MCEER method
can be summarised as follows:
• The design for vibration (cyclic phase of the response) and lateral spreading is considered in a
decoupled manner, using two separate analyses.
• The cyclic phase is considered using nonlinear static or pushover analysis where the effect of
liquefaction is included through a reduced soil resistance adjacent to the foundation and the alteration
of the input seismic spectra is due to softening and energy dissipation in the soil.
• The rationale behind the lateral spreading design approach is to determine the likely magnitude of
lateral soil movement and assess the structure’s ability to accommodate and/or limit this movement.
The flowchart of the methodology is given in figure 6.28.

6 Methods of analysis
73
Figure 6.28 Lateral spread design flow chart (MCEER 2001)
The method can be summarised as follows:
• The soil layers likely to liquefy are identified.
• Pseudo-static stability analyses are conducted to back-calculate the yield acceleration or acceleration
triggering instability. In the stability analyses, residual strength is used for the liquefied layers.
• Newmark sliding block analysis is used to estimate the ground displacements due to lateral spreading.
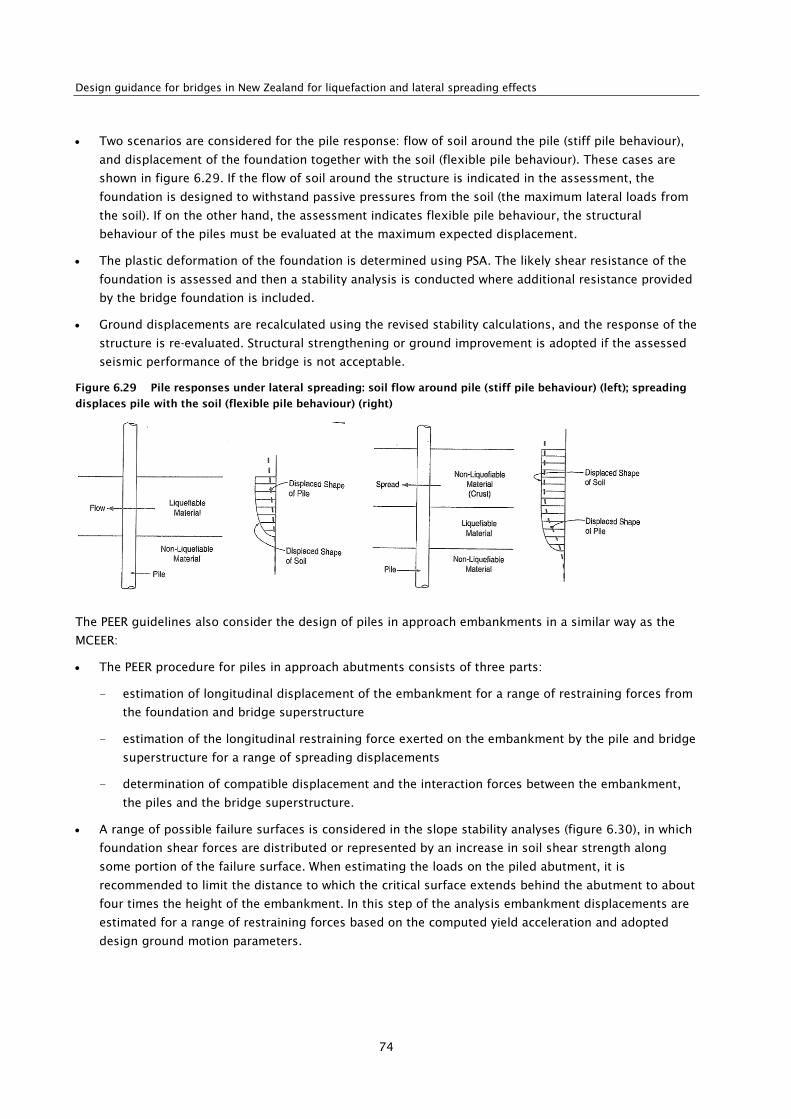
Design guidance for bridges in New Zealand for liquefaction and lateral spreading effects
74
• Two scenarios are considered for the pile response: flow of soil around the pile (stiff pile behaviour),
and displacement of the foundation together with the soil (flexible pile behaviour). These cases are
shown in figure 6.29. If the flow of soil around the structure is indicated in the assessment, the
foundation is designed to withstand passive pressures from the soil (the maximum lateral loads from
the soil). If on the other hand, the assessment indicates flexible pile behaviour, the structural
behaviour of the piles must be evaluated at the maximum expected displacement.
• The plastic deformation of the foundation is determined using PSA. The likely shear resistance of the
foundation is assessed and then a stability analysis is conducted where additional resistance provided
by the bridge foundation is included.
• Ground displacements are recalculated using the revised stability calculations, and the response of the
structure is re-evaluated. Structural strengthening or ground improvement is adopted if the assessed
seismic performance of the bridge is not acceptable.
Figure 6.29 Pile responses under lateral spreading: soil flow around pile (stiff pile behaviour) (left); spreading
displaces pile with the soil (flexible pile behaviour) (right)
The PEER guidelines also consider the design of piles in approach embankments in a similar way as the
MCEER:
• The PEER procedure for piles in approach abutments consists of three parts:
– estimation of longitudinal displacement of the embankment for a range of restraining forces from
the foundation and bridge superstructure
– estimation of the longitudinal restraining force exerted on the embankment by the pile and bridge
superstructure for a range of spreading displacements
– determination of compatible displacement and the interaction forces between the embankment,
the piles and the bridge superstructure.
• A range of possible failure surfaces is considered in the slope stability analyses (figure 6.30), in which
foundation shear forces are distributed or represented by an increase in soil shear strength along
some portion of the failure surface. When estimating the loads on the piled abutment, it is
recommended to limit the distance to which the critical surface extends behind the abutment to about
four times the height of the embankment. In this step of the analysis embankment displacements are
estimated for a range of restraining forces based on the computed yield acceleration and adopted
design ground motion parameters.

6 Methods of analysis
75
Figure 6.30 Critical slope stability failure surfaces for different values of pile restraining force (Ashford et al
2011)
• The restraining force from the pile foundation is determined using an equivalent static pushover
analysis. Global bridge analysis can be used to estimate the development of resisting forces from the
bridge superstructure and load transfer to either the intermediate bends or to the opposite abutment.
In this analysis, the restraining forces from the pile foundation and bridge superstructure are
estimated for a range of possible embankment displacements.
• The interaction diagram is eventually constructed (figure 6.31) to estimate the compatible
displacement and interaction force between the embankment sliding mass and the pile foundation-
bridge superstructure. The intersection of the curves in the force-displacement relationship
determines the compatible displacements and forces.
Figure 6.31 Compatibility between computed embankment slide mass displacements and equivalent constant
restraining force from the pile foundation (Ashford et al 2011)

Design guidance for bridges in New Zealand for liquefaction and lateral spreading effects
76
7 Structural mitigation approaches to liquefaction induced lateral spreading
Mitigation measures/design philosophy depends on the size and type of the structure and the extent of
liquefaction and liquefaction induced movements (settlements and lateral displacement), as well as the
interaction between the soil and the proposed structure. At least three approaches can be followed.
Approach 1 (structural): minimise effect of lateral spreading on vulnerable parts of the structure.
The focus of this approach is to minimise the effect of lateral spreading load on the most vulnerable parts
of the structure (the abutments) and utilise the superstructure and substructural elements less exposed to
lateral spread loading to support these parts as follows:
At the abutments:
• Minimise the size and number of piles to minimise the lateral spread loading being attracted to the
structure. This arrangement, however, minimises the pile pinning effect on the moving soil which can
be conservatively ignored in the design. The piles should be designed to resist lateral spread load
elastically.
• Create a void below the abutment, bridged by a simply supported ‘landspan’ supported on a shallow
spread footing on the embankment, to minimise the depth of the abutment structure directly loaded
by spreading or rafting of the embankment material. This void can also be used as a zone in which
services carried on the bridge can be provided with flexibility to accommodate relative movement
between the bridge and the approaches.
• Consider using ground improvement techniques to further minimise the effects of liquefaction, if
necessary or desirable.
At the piers:
• Position piers as far out and away from lateral spreading embankments as practical to minimise lateral
spread loading from acting directly on pier piles and for loading from embankment spreading from
one end of the bridge to be counterbalanced by that from the other end of the bridge. This allows the
number and size of the piles to be increased and the bridge superstructure to be used to prop lateral
spread loading acting on the abutments and their piles across to the larger, stronger and more
numerous pier piles. This applies particularly to a two-span arrangement at a generally liquefiable site
where the loading on the central pier can be counter-balanced. Piles at the pier(s) need to be designed
to be able to resist any out-of-balance lateral spreading induced forces, combined with the seismic
inertial loads if required.
• Use of permanent steel casing for the piles to provide additional stiffness and/or strength and
confinement can be beneficial. Use of steel encased piles offers the benefit of providing a high level of
confinement to the concrete core enhancing the ductility of the pile. The steel casing, with an
appropriate allowance made for section loss due to corrosion, can also be utilised to provide some of
the pile flexural capacity, though it will generally be necessary to keep the inner surface of the casing
free of protrusions (eg shear connectors) to facilitate pile driving and construction. Design of the steel
casing should consider constructability and resistance to buckling.
Approach 1 was the approach used in the design of the Ferrymead Bridge (Kirkcaldie 2013).

7 Structural mitigation approaches to liquefaction induced lateral spreading
77
Approach 2 (structural): resist lateral spread loads at the abutments, as follows:
At abutments:
• Provide strong and stiff foundations (piles). These can be either anchored (cantilevering) from the non-
liquefiable underlying layers or racking, supported by the non-liquefiable layers.
• Include in the design any pinning effect of the piles on the lateral spreading induced movements in
the design (use soil structure interaction).
• Large movement (rotations) of the piles is likely to occur. Check that the piles (and the rest of the
structure) are capable of accommodating these.
• If deflections are excessive either accept or resist them. Consider using ‘passive’ piles (piles not
connected to the superstructure) to increase the pinning effect and ‘shield’ active abutment piles.
• Consider using permanent steel casing for the piles to provide additional stiffness and/or strength
and confinement. Use of steel encased piles offers the benefit of providing a high level of confinement
to the concrete core enhancing the ductility of the pile. The steel casing, with an appropriate
allowance made for section loss due to corrosion, can also be utilised to provide some of the pile
flexural capacity, though it will generally be necessary to keep the inner surface of the casing free of
protrusions (eg shear connectors) to facilitate pile driving and construction. Design of the steel casing
should consider constructability and resistance to buckling.
• Consider using soil improvement techniques to improve performance of the bridge structure if
necessary.
At piers:
• Position these as far out and away from the lateral spreading embankments as practical to minimise
lateral spread loading from acting directly on pier piles. The piles should be considered as part of the
overall lateral load resisting system in the bridge longitudinal direction, as well as in the bridge
transverse direction.
Superstructure:
• Superstructure should be designed and detailed to be able to resist imposed loads elastically.
Connection with the abutments and pier should be designed and detailed to be able to accommodate
expected movements and does not restrain and cause damage to either the superstructure or the
supports.
In the design of foundations under the effect of lateral spreading loads in approaches 1 or 2, soil structure
interaction (eg soil lateral spread loads on the structure due to both unliquefied and liquefied soils, pile
pinning effects) should be considered. This may involve iterative analysis.
Approach 3 (geotechnical): ground improvement
The focus of this approach is to strengthen and stabilise the ground that is prone to lateral spreading
under the onset of liquefaction, to limit the ground displacement and loading imposed on the bridge to
tolerable levels. With lateral spreading generally arising from approach embankments settling, ground
improvement mitigation efforts are generally focused around the abutments and the zone of the
embankment immediately behind the abutments. Approaches that have been applied include:
• Installation of stone columns through the layers of liquefiable material to provide a drainage path for
water, relieving the buildup of pore water pressure that causes soil liquefaction, and increasing the
shear strength of the block of soil supporting the embankment in the vicinity of the abutment. A

Design guidance for bridges in New Zealand for liquefaction and lateral spreading effects
78
drainage blanket should also be installed across the top of the stone columns, beneath the
embankment, to drain the ejected water out to the sides of the embankment.
• As a retrofit solution at existing bridge abutments, arrangement of stone columns in a triangle behind
the abutment has been used to strengthen the ground immediately behind the abutment and to
deflect any lateral spreading from further back along the embankment out to the sides and away from
the bridge.
• Where liquefiable materials are in close proximity to the ground surface (eg <3m deep), ground
replacement of foundation materials beneath embankments and in the zone immediately in front of
abutments may be a practical option. This approach may be particularly appropriate as a retrofit
option when headroom constraints make it impractical to install stone columns in front of the
abutments of an existing bridge.
• Reinforcement of embankments at bridge abutments with geogrid to reinforce the embankments
against slip circle failure and against being able to spread laterally.
• Construction of embankments using geofoam materials (eg polystyrene) to reduce the weight of the
embankment and therefore the weight of material driving slip circle failures penetrating down into the
foundation material underlying the embankment.
• Jet grouting of the ground in the vicinity of the abutment to form a block of competent founding
material beneath the abutment and adjacent approach that will not liquefy.
• Utilisation of piles to restrain the uppermost soil materials that would otherwise slide on a slip circle
surface by pinning them to stronger underlying material. These may be either the piles used to
support the bridge abutments or additional piles that are not part of the bridge structure.
Ground improvement may limit ground displacement due to lateral spreading, but not totally eliminate it.
Confirmation that the bridge structure and its supporting piles can sustain the residual displacements will
commonly be necessary. Again, as for approach 1, the use of permanent steel casing to provide both
additional flexural capacity and enhance the ductility of piles loaded by the lateral spreading can be
beneficial.
The seismic strengthening of the SH3 Cobham Bridge at Wanganui (Brabhaharan and Kirkcaldie 2009) is
an example of application of this second approach, in which:
• stone columns and wick drains were installed in a triangular shaped arrangement behind and to the
sides of the abutment to strengthen the embankment, relieve the build up of pore water pressure
inducing liquefaction, and to deflect laterally spreading embankment from further behind the
abutment around the abutment and away from the bridge
• constrained by low headroom in front of the abutment making the installation of stone columns
impractical, ground replacement of shallow liquefiable soils in front of the abutment was also
undertaken, providing buttressing to the embankment.
Single span bridges supported on spread footings on MSE wall retained embankments have been designed
employing:
• strengthening and drainage of the foundation soils using stone columns overlain with a drainage
blanket at the base of the supporting embankments
• transverse reinforcement of the embankments with geogrid to provide restraint against lateral
spreading of the embankment.

7 Structural mitigation approaches to liquefaction induced lateral spreading
79
At the Cobham Bridge in Wanganui, approach 3 was applied through strengthening the plastic hinge
regions of the piers for shear and installing ground improvements at the abutments (Brabhaharan and
Kirkcaldie 2009).
Situations in which one of the three approaches may be more appropriate to adopt are as follows:
Approach 1 or 2: Structural mitigation is more likely to be favourable when:
• the structure is a new bridge to be designed for which a structural arrangement applying the
principles outlined above can be adopted
• the depth of potentially liquefiable material materials is very deep, making the effectiveness of a
ground improvement approach questionable and costly
• numerous services are present at the site and are to be carried on the bridge, resulting in the
protection or relocation of the services being costly should a ground improvement approach be
adopted.
Approach 2 can be used for either a new bridge or for retrofitting an existing bridge. Retrofitting can be
carried out by installing large diameter piles with a new capping beam behind the existing abutment. A
particular advantage is that it does not eliminate passive resistance at the abutments which can be very
effective at providing damping and reserve strength under strong shaking that may precede the lateral
spreading phase.
Approach 3: Ground improvement is more likely to be favourable when:
• retrofit of an existing bridge for seismic resistance is required, the structural form of which will not
generally be amenable to radical alteration
• the depth of liquefiable ground required to be improved is not excessive
• there is an absence of buried services at the site, although a construction technique has been
developed for stone column installation that minimises the potential for damage to services as
described in the Cobham Bridge seismic retrofit paper (Brabhaharan and Kirkcaldie 2009).
A paper presented by Poulos (2013) gave three categories of liquefaction mitigation measures. These can
be divided into treatment of liquefiable soil to strengthen it, treatment of soil to accelerate the dissipation
of seismically induced excess pore pressures and measures to reduce liquefaction induced damage to the
structure or facility.
Design guidance for bridges in New Zealand for liquefaction and lateral spreading effects
80
8 Conclusions and recommendations
The design methods described in this report to address liquefaction and lateral spreading effects are
based on observed seismic behaviour of bridges and on the most recent research findings.
The report has discussed a large number of issues associated with liquefaction and lateral spreading and
their effect on bridge structures and requirements for geotechnical investigations, evaluation techniques
for liquefaction and lateral spreading, methods of ground improvements, methods of liquefaction analysis,
structural mitigation solutions, and construction and monitoring issues.
Design of bridges for liquefaction and lateral spreading effects is a complex technical problem and a large
number of issues associated with the design process require further research and refinement. Additional
work will be required to summarise the findings in a form of a technical memorandum which can be later
incorporated into NZ Transport Agency’s Bridge manual and disseminated to the wider New Zealand
engineering community.
There are several areas where further development and refinement of investigation, assessment and
design processes will be of value:
• Update the Bridge manual by implementing the key investigation, assessment and design guidelines
presented in this report.
• Standardise field and laboratory testing procedures, sampling and reporting. Recent work in
Christchurch has highlighted the need for consistency in CPT testing procedures and SPT hammer
calibration. Other methods such as shear wave velocity and cyclic triaxial testing are becoming more
commonly used in practice but the quality of testing can be variable. Standardisation of sampling and
testing methods would provide greater confidence in the results and comparison between results from
different sources. Standardisation should also improve efficiency with investigation scoping, briefing
of investigation contractors and assessment of results.
• Undertake detailed investigation of the liquefaction susceptibility and post liquefaction behaviour of
local New Zealand soils. The geology of New Zealand is diverse, comprising areas of young alluvial,
marine, aeolian and tephra sand and non-plastic silt deposits with a variety of chemical compositions
and mechanical properties. Recent research on pumice soils indicates conventional liquefaction
triggering analysis methods may under-predict their resistance to liquefaction and this may be the
case for other New Zealand soils. Post-liquefaction strength, strain magnitude and how strain develops
during shaking is important for estimating lateral spread displacements and consequences of
liquefaction for bridges. The results of these detailed investigations should be used to complement
conventional techniques to estimate triggering using CPT or shear wave velocity test data for example.
• Undertake research to improve prediction of lateral spread displacements and pile pinning effects.
Lateral spread displacement is an uncertain but often a sensitive input to pseudo-static displacement
based analysis of bridge piles. Limitations with current methods to calculate lateral spread
displacements are described in this report. Improved estimation of lateral spread displacement and
the pining effects of piles will reduce uncertainty in bridge performance and therefore reduce the need
for expensive mitigation measures.
• Develop a (GIS) database of investigation results, laboratory testing and construction data. This
database will be useful in a number of ways and as the database grows, may reduce the amount of
investigation required on successive projects. For example, comparison of ground improvement trials

7 Structural mitigation approaches to liquefaction induced lateral spreading
81
will be useful for comparing the effectiveness and relative cost of different improvement techniques.
Cyclic triaxial testing can be used to continually update liquefaction resistance charts.
• Develop standard specifications for the construction of ground improvement methods. These should
detail minimum quality control and assurance methods for ground improvement techniques including
requirements for field trials to confirm the design.
• Perform a detailed analysis of soil structure interaction for typical New Zealand bridge forms. Time
history effective stress analysis of typical structures will help understand which forms and pile types
perform better and what existing bridge forms are more susceptible to liquefaction.
• Undertake research to assess the relative performance and optimise the design of ground
improvement.
• Undertake instrumentation of bridges in liquefiable areas. Instrumentation may include inclinometer
tubes in piles, accelerometers on the superstructure and ground-based instruments to record the
ground motions. Pore-water pressures monitoring would also provide valuable information.
Instrumentation installed on the ANZAC Bridge (or a SH bridge located at some other liquefaction
prone site in a high seismic zone) as part of a research project would provide a better understanding
of the performance of bridges on sites prone to liquefaction. Further possible instrumentation may
include inclinometer tubes in piles for example or rapid assessment of damage to piles following an
earthquake and to gain better understanding of the behaviour of bridges on liquefiable sites. Select
bridges may include accelerometers or electronic inclinometers for detailed post-disaster assessment
of bridge response.
• Consider further design issues associated with liquefaction at large depths (more than 20m below the
ground surface level), the settlement of spread footings (shear deformations within liquefiable layers)
and the effect of negative skin friction on pile foundations.

Design guidance for bridges in New Zealand for liquefaction and lateral spreading effects
82
9 Bibliography
Ambrasey, N (1988) Engineering seismology. Earthquake Engineering and Structural Dynamics 17: 1–105.
Ambraseys, N and M Srbulov (1995) Earthquake-induced displacements of slopes. Soil Dynamics and
Earthquake Engineering 14, no.1: 59-71.
American Association of State Highway and Transportation Officials (2011a) AASHTO guide specifications
for LRFD seismic bridge design – section 3.2 Performance criteria. Washington DC: AASHTO.
American Association of State Highway and Transportation Officials (2011b) AASHTO guide specifications
for LRFD seismic bridge design – section 3.4.3 Performance criteria. Washington DC: AASHTO.
American Association of State Highway and Transportation Officials (2011c) AASHTO guide specifications
for LRFD seismic bridge design – section 3.5 Selection of seismic design category. Washington DC:
AASHTO.
American Association of State Highway and Transportation Officials (2011d) AASHTO LFRD bridge design
specifications – section 10.5.4 Extreme events limit states. Washington DC: AASHTO.
American Association of State Highway and Transportation Officials (2012) AASHTO LRFD bridge design
specification. Washington DC: AASHTO.
American Society of Civil Engineers (ASCE) (2010) Compaction grouting consensus guide. ASCE/G-I53-10.
Amiri, SK (2008) The earthquake response of bridge pile foundations to liquefaction induced lateral spread
displacement demands. PhD Dissertation, Faculty of the Graduate School University of Southern
California.
Anderson, DL, PM Byrne, RH DeVall, E Naesgaard and D Wijewickreme (Eds) (2007) Task force report on
geotechnical design guidelines for buildings on liquefiable sites in Greater Vancouver in accordance
with NBC2005. Vancouver: University of British Columbia.
Andrus, RD and RM Chung (1995) Ground improvement techniques for liquefaction remediation near
existing lifelines. National Institute of Standards and Technology report NISTIR 5714. Gaithersburg,
MD. 74pp.
Applied Technology Council, Multidisciplinary Center for Earthquake Engineering Research (2001)
Comprehensive specification for the seismic design of bridges – revised LRFD design specifications
(Seismic Provisions). NHCRP report 12–49 (Third draft of specifications and commentary). Washington
DC: American Association of State Highway and Transportation Officials.
Applied Technology Council, Multidisciplinary Center for Earthquake Engineering Research (2002)
Comprehensive specification for the seismic design of bridges. NCHRP report 472. Washington DC:
American Association of State Highway and Transportation Officials.
Applied Technology Council, Multidisciplinary Center for Earthquake Engineering Research (2003a) Design
examples – recommended LRFD guidelines for the seismic design of highway bridges. MCEER/ATC 49-
2. Washington DC: American Association of State Highway and Transportation Officials.
Applied Technology Council, Multidisciplinary Center for Earthquake Engineering Research (2003b)
Liquefaction study report – recommended LRFD guidelines for the seismic design of highway bridges.
MCEER/ATC-49-1. Washington DC: American Association of State Highway and Transportation Officials.
9 Bibliography
83
Applied Technology Council, Multidisciplinary Center for Earthquake Engineering Research (2003c)
Recommended LRFD guidelines for the seismic design of highway bridges – part 1: specifications.
MCEER Research Highway Project, Project 094 Task F3-1. Washington DC: Federal Highway
Administration.
Architectural Institute of Japan (AIJ) (2001) Recommendations for design of building foundations, p.65 (in
Japanese).
Ashford, SA, RW Boulanger and SJ Brandenberg (2011) Recommended design practice for pile foundations
in laterally spreading ground. Berkeley, California: Pacific Earthquake Engineering Center.
Baez, JI and GR Martin (1992) Qualitative evaluation of stone column techniques for earthquake
liquefaction mitigation. Proceedings of the 10th World Conference on Earthquake Engineering, AA
Balkema Publ pp1477–1483.
Baez, JI (1995) A design model for the reduction of soil liquefaction by vibro-stone columns. Doctoral
dissertation in civil engineering, University of Southern California. 207pp.
Bardet, JP, T Tobita, N Mace and J Hu (2002) Regional modelling of liquefaction-induced ground
deformation. Earthquake Spectra, EERI 18, no.1: 19–46.
Bartlett, S and T Youd (1992) Empirical analysis of horizontal ground displacement generated by
liquefaction-induced lateral spread. Technical report NCEER-0021. Utah: Bringham Young University.
Bartlett, S and T Youd (1995) Empirical prediction of liquefaction-induced lateral spread. Journal of
Geotechnical Engineering 121, no.4: 316–329.
Bhattacharya, S, SPG Madabhushi and MD Bolton (2004) An alternative mechanism of pile failure in
liquefiable deposits during earthquakes, Geotechnique 54, no.3: 203–213.
Bhattacharya, S (2006) Safety assessment of existing piled foundations in liquefiable soils against buckling
instability. ISET Journal of Earthquake Technology, Technical Note 43, no.4: 133–47.
Blake, T, R Hollingsworth and J Stewart (2002) Recommended procedures for implementation of DMG.
Special publication 117 Guidelines for analysing and mitigating landslide hazards in California. Los
Angeles, California: Southern California Earthquake Center.
Boulanger, RW, D Chang, SJ Brandenberg, RJ Armstrong and BL Kutter (2007) Seismic design of pile
foundations for liquefaction effects. Proceedings of the 4th International Conference on Earthquake
Geotechnical Engineering – invited lectures. KD Pitilakis (Ed). The Netherlands: Springer. pp277–302.
Boulanger, RW and IM Idriss (2004a) Evaluation of potential for liquefaction or cyclic failure of silts and
clays. Report no. UCD/CMG–04/01. University of California at Davis: Dept. of Civil & Environmental
Engineering.
Boulanger, RW and IM Idriss (2004b) State normalization of penetration resistance and the effect of
overburden stress on liquefaction resistance. Proceedings of the 11th International Conference on Soil
Dynamics and Earthquake Engineering, and 3rd International Conf. on Earthquake Geotechnical
Engineering 2: 484–491. Berkeley CA.
Boulanger, RW and IM Idriss (2006) Liquefaction susceptibility criteria for silts and clays. Journal of
Geotechnical and Geoenvironmental Engineering 132, no.11: 1413–1426.
Boulanger, RW, IM Idriss, DP Stewart, Y Hashash and B Schmidt (1998) Drainage capacity of stone columns
or gravel drains for mitigating liquefaction. Proceedings of the Geotechnical Earthquake Engineering
and Soil Dynamics III, ASCE Geotechnical Special Publication 75, no.1: 678–690.

Design guidance for bridges in New Zealand for liquefaction and lateral spreading effects
84
Boulanger, R, B Kutter, S Brandenburg, P Singh and D Chang (2003) Pile foundations in liquefied and
laterally spreading ground during earthquakes: centrifuge experiments and analyses. Center for
Geotechnical Modelling report no.UCD/CGM-03/01.
Brabhaharan, P and DK Kirkcaldie (2009) Earthquake strengthening and ground improvement of the
Cobham Bridge, Wanganui. New Zealand Society for Earthquake Engineering Conference, Christchurch,
2009.
Brandenburg, SJ (2005) Behavior of pile foundations in liquefied and laterally spreading ground. PhD
dissertation. University of California, Davis, California: Department of Civil and Environmental
Engineering.
Brandenberg, SJ, RW Boulanger, BL Kutter and D Chang (2007) Static pushover analyses of pile groups in
liquefied and laterally spreading ground in centrifuge tests. Journal of Geotechnical and
Geoenvironmental Engineering 133, no.9: 1055–1066.
Bray, JD, RB Sancio, M Riemer and HT Durgunoglu (2004) Liquefaction susceptibility of fine-grained soils.
In Proceedings of the 11th Int. Conference on SDEE and 3rd International Conference on Earthquake
Geotechnical Engineering 1: 655–662.
Bray, J and R Sancio (2006) Assessment of the liquefaction susceptibility of fine-grained soils. Journal of
Geotechnical and Geoenvironmental Engineering 132, no.9: 1165–1177.
British Standards Institution (2005) BS EN 1998-5:2004 Eurocode 8. Design of structures for earthquake
resistance, part 5 Foundations, retaining structures and geotechnical aspects.
Broms, B (1964) Lateral resistance of piles in cohesionless soils. ASCE Journal of Soil Mechanics and
Foundation Engineering 90 (SM3): 123–156.
Bruce, DA (2000) An introduction to the deep soil mixing methods as used in geotechnical applications.
FHWA-RD-99-138. 143pp.
California Department of Transportation (2011) Guidelines on foundation loading and deformation due to
liquefaction induced lateral spreading. Los Angeles: California Department of Transportation.
California Geological Survey (2008) Guidelines for evaluating and mitigating seismic hazards in California.
California: California Geological Survey.
Cetin, KO, RB Seed, AD Kiureghain, K Tokimatsu, LF Harder, RE Kayen and RES Moss (2004) Standard
penetration test-based probabilistic and deterministic assessment of seismic soil liquefaction potential.
Journal of Geotechnical and Geoenvironmental Engineering 1, no.120: 1314–1340.
Chapman, H, P North and R Park (1980) Seismic design of bridges, section 3: capacity design principles
and practice. Bulletin for the New Zealand National Society for Earthquake Engineering 13, no.3: 242–
247.
Coastal Development Institute of Technology (CDIT) (2002) The deep mixing method: principle, design,
and construction. Rotterdam: Balkema.
Cooke, HG and JK Mitchell (1999) Guide to remedial measures for liquefaction mitigation at existing
highway bridge sites. Technical report MCEER-99-015. 176pp.
Cox, BR and SC Griffiths (2010) Practical recommendations for evaluation and mitigation of soil
liquefaction in Arkansas. Project report MBTC 3017. 175pp.
Cubrinovski, M (2011) Seismic effective stress analysis: modelling and application. 5th International
Conference on Earthquake Geotechnical Engineering. Santiago, Chile, January 2011.

9 Bibliography
85
Cubrinovski, M and B Bradley (2009) Evaluation of seismic performance of geotechnical structures. Pp
121–136 in Proceedings of IS Tokyo2009, performance-based design in earthquake geotechnical
engineering. Kokusho, Tsukamoto and Yoshimine (Eds). Taylor & Francis, pp121–136.
Cubrinovski, M, J Haskell and B Bradley (2009a) The effect of shear strength normalisation on the response
of piles in laterally spreading soils. Earthquake Geotechnical Engineering Satellite Conference. XVIIth
International Conference on Soil Mechanics and Geotechnical Engineering. Alexandria, Egypt, October
2009, pp1–9.
Cubrinovski, M, J Haskell and B Bradley (2012) Analysis of piles in liquefying soils by the pseudo-static
analysis approach. Pp 147–174 in Advances in earthquake geotechnical engineering. MA Sakr and A
Ansal (Eds). London & New York: Springer.
Cubrinovski, M and K Ishihara (2004) Simplified method for analysis of piles undergoing lateral spreading
in liquefied soils. Soils and Foundations 44, no.5: 119–133.
Cubrinovski, M and K Ishihara (2007) Simplified analysis of piles subjected to lateral spreading:
parameters and uncertainties. 4th International Conference on Earthquake Geotechnical Engineering,
paper no. 1385.
Cubrinovski, M, K Ishihara and K Furukawazono (1999) Analysis of full scale tests on piles in deposits
subjected to liquefaction. In Proceedings of 2nd International Conference on Earthquake Geotechnical
Engineering. Lisbon, Portugal. June 1999.
Cubrinovski, M, K Ishihara and H Poulos (2009b) Pseudostatic analysis of piles subjected to lateral
spreading. Special issue, Bulletin of the New Zealand Society for Earthquake Engineering 42, no.1: 28–
38.
Cubrinovski, M, T Kokusho and K Ishihara (2006) Interpretation from large-scale shake table tests on piles
undergoing lateral spreading in liquefied soils. Soil Dynamics and Earthquake Engineering 26, nos. 2–
4: 275–286.
Cubrinovski, M, A Winkley, J Haskell, A Palermo, L Wotherspoon, K Robinson, B Bradley, P Brabhaharan and
M Hughes (2013) Spreading-induced damage to short-span bridges in Christchurch (New Zealand). EERI
Christchurch special issue.
Cubrinovski, M, A Winkley, J Haskell, A Palermo, L Wotherspoon, K Robinson, B Bradley, P Brabhaharan and
M Hughes (2014) Spreading-induced damage to short-span bridges in Christchurch (New Zealand). EQ
Spectra special issue on the 2010-2011 Canterbury earthquakes.
Dash, SR, S Bhattacharya and A Blakeborough (2010) Bending–buckling: investigation of this failure
mechanism of piles in liquefiable soils. Soil Dynamics and Earthquake Engineering 30, no.1: 32–39.
Dickenson, S (2005) Recommended guidelines for liquefaction evaluations using ground motions from
probabilistic seismic hazard analyses. Salem, Oregon: Oregon Department of Transportation.
Dickenson, S, N McCullough, M Barkau and B Wavra (2002) Assessment and mitigation of liquefaction
hazards to bridge approach embankments in Oregon. Salem, Oregon: Oregon Department of
Transportation.
Fellenius, BH (1972) Downdrag on piles in clay due to negative skin friction. Canadian Geotechnical
Journal 9, no.4: 323–337.
Ferritto, J (1997) Seismic design criteria for soil liquefaction. Technical report TR-2077-SHR, US Naval
Facilities Engineering Services Center, Port Hueneme, CA. 58pp.
Design guidance for bridges in New Zealand for liquefaction and lateral spreading effects
86
Finn, W and A Wightman (2007) Logical evaluation of liquefaction potential using NBCC 2005 probabilistic
ground accelerations. Proceedings of the 9th Canadian Conference on Earthquake Engineering,
Ontario, Canada, pp984–1993.
Francis, MA and GA Gorski (1998) In situ soil mixing for the mitigation of seismic lateral spreading: A case
history. In Proceedings of the Deep Foundation Institute Annual Meeting, Seattle, WA.
Gadeikis, S, K Dundulis, G Zarzojus, S Gadeikyte, D Urbaitis, D Gribulis and S Sliaupa (2012) Correlation of
shear-wave velocities and cone resistance of quarternary glacial sandy soils defined by seismic cone
penetration test (SCPT). Journal of Vibroengineering 14: 715–722.
Harada, K, J Ohbayashi, Y Taguchi and S Yasuda (2012) Verification on improvement effectiveness during
the 2011 off the Pacific Coast of Tohoku Earthquake. In Proceedings of the 10th Symposium for Ground
Improvement, pp83–90 (in Japanese).
Haskell, J, M Cubrinovski and B Bradley (2012) Sensitivity analysis and its role in pseudo-static design of
pile foundations. Soil Dynamics and Earthquake Engineering 42: 82–94.
Hausler, EA and N Sitar (2001) Performance of soil improvement techniques in earthquakes. Fourth
International Conference on Recent Advances in Geotechnical Earthquake Engineering and Soil
Dynamics, paper 10.15.
Hausmann, MR (1990) Engineering principles of ground modification. New York: McGraw-Hill. 632pp.
Hayward Baker Inc (2003) Services. Accessed 17 May 2014. www.haywardbaker.com
Holzer, TL, S Toprak and MJ Bennett (2002) Liquefaction potential index and seismic hazard mapping in
the San Francisco Bay Area, California. In Proceedings of Urban Earthquake Risk, National Conference
on Earthquake Engineering v.II, pp1699–1706. Boston.
Horikoshi, K, A Tateishi and H Ohtsu (2000) Detailed investigation of piles damaged by Hyogoken Nambu
earthquake. 12th World Conference on Earthquake Engineering, CD ROM paper no. 2477.
Hynes, ME and RS Olsen (1999) Influence of confining stress on liquefaction resistance. In Proceedings of
the International Workshop on Physics and Mechanics of Soil Liquefaction, Rotterdam, pp145–152.
Idriss, IM (1999) An update of the Seed-Idriss simplified procedure for evaluating liquefaction potential. In
Proceedings of the TRB Workshop on New Approaches to Liquefaction, publication no. FHWA-RD-99-165.
Idriss, IM and RW Boulanger (2008) Soil liquefaction during earthquakes, Monograph series no. MNO-12
Earthquake Engineering Research Institute.
Ishihara, K and M Cubrinovski (1998a) Performance of large-diameter piles subjected to lateral spreading
of liquefied deposits. In Proceedings of the 13th Southeast Asian Geotechnical Conference, Taipei,
December 1998.
Ishihara, K and M Cubrinovski (1998b) Soil-pile interaction in liquefied deposits undergoing lateral
spreading. In Proceedings of the 11th Danube European Conference on Soil Mechanics and Geotechnical
Engineering, Porec, Croatia, May 1998.
Ishihara, K and M Cubrinovski (2004) Case studies of pile foundations undergoing lateral spreading in
liquefied deposits. In Proceedings of the 5th International Conference on Case Histories in Geotechnical
Engineering, New York, April 2004, 9pp.
Ishihara, K and M Yoshimine (1992) Evaluation of settlements in sand deposits following liquefaction
during earthquakes. Soils and Foundations 32, no.1: 173–188.

9 Bibliography
87
Iwasaki, T, K Tokida, F Tatsuoka, S Watanabe, S Yasuda and H Sato (1982) Microzonation for soil
liquefaction potential using simplified methods. In Proceedings of the Third International Conference
on Microzonation 3, Seattle, pp1319–1330.
Japan Road Association (JRA) (1996) Part V, Seismic design. Specifications for highway bridges (in
Japanese).
Japanese Geotechnical Society (JGS) (1998) Remedial measures against soil liquefaction. Rotterdam:
Balkema.
Japanese Geotechnical Society, JGS-Kanto Branch (2013) Guideline to mitigate liquefaction-induced damage
to wooden houses. 209pp (in Japanese).
Jibson, RW (2007) Regression models for estimating coseismic landslide displacement. Engineering
Geology 91, no.2–4: 209–218.
Kawashima, K (2004) An analysis on the seismic performance levels of bridges. In Proceedings of
International Workshop on Performance-Based Seismic Design, Bled, Slovenia, vol. 2004: 77–88.
Kayen, RE, RES Moss, EM Thompson, RB Seed, KO Cetin, A Der Kiureghian, Y Tanaka and K Tokimatsu
(2013) Shear-wave velocity-based probabilistic and deterministic assessment of seismic soil
liquefaction potential. Journal of Geotechnical and Geoenvironmental Engineering 139, no.3: 407–419.
Kirkcaldie, D, P Brabhaharan, M Cowan, C Wang, G Hayes and L Greenfield (2013) Ferrymead Bridge – from
widening and seismic upgrading to replacement, a casualty of the Christchurch earthquake. NZSEE
Annual Conference 2013.
Kramer, SL (1996) Geotechnical earthquake engineering. Upper Saddle River, New Jersey: Prentice Hall.
Kramer, SL, RT Mayfield and YM Huang (2006) Performance-based liquefaction potential: a step toward
more uniform design requirements. In Proceedings of US–Japan Workshop on Seismic Design of
Bridges, Bellevue, WA.
Kramer, SL, RT Mayfield and YM Huang (2008) Performance-based liquefaction potential evaluation. USGS
Project no. 06HQGR0041, US Geological Survey, Reston, Virginia, USA.
Kramer, SL, RT Mayfield and R Mitchell (2003) Ground motions and liquefaction – the loading part of the
equation. In Proceedings of the US-Taiwan Workshop on Soil Liquefaction, Hsinchu, Taiwan, 3–5
November 2003.
Ledezma, C and J Bray (2008) Performance-based earthquake engineering design evaluation procedure for
bridge foundations undergoing liquefaction-induced lateral ground displacement. Berkeley, California:
Pacific Earthquake Engineering Center, University of California.
Ledezma, C and J Bray (2010) Probabilistic performance-based procedure to evaluate pile foundations at
sites with liquefaction-induced lateral displacement. Journal of Geotechnical and Geoenvironmental
Engineering 136, no.3: 464–476.
Lees, J, R Ballagh and RP Orense (2013) Evaluation of liquefaction and re-liquefaction observed in
Christchurch using CPT data. 19th NZGS Geotechnical Symposium, Queenstown, New Zealand.
Liao, SSC and RV Whitman (1986) Catalogue of liquefaction and non-liquefaction occurrences during
earthquakes. Cambridge Mass: Department of Civil Engineering, Massachusetts Institute of
Technology.
Lukas, RG (1986) Dynamic compaction for highway construction, vol. 1 Design and construction
guidelines. Report no. FHWA/RD86/133, Federal Highway Administration.

Design guidance for bridges in New Zealand for liquefaction and lateral spreading effects
88
Lukas, RG (1995) Dynamic compaction. Report no. FHWA-SA-95-037, Federal Highway Administration.
Mackie, KR and B Stojadinović (2006) Post-earthquake functionality of highway overpass
bridges. Earthquake Engineering & Structural Dynamics 35, no.1: 77–93.
Madabhushi, G, J Knappet and S Haigh (2010) Design of piles foundations in liquefiable soils. London:
Imperial College Press.
Marsh, ML, RL Mayes and IM Friedland (2002) Recommended LRFD guidelines for the seismic design of
highway bridges. Accessed 17 may 2014. www.abam.com/sites/default/files/tech-papers/tp-
RecommendedLRFDGuidelines.pdf
Martin, GR (2000) Annual report for research year 1, June 1, 1999 to September 30, 2000. MCEER
highway project 094: seismic vulnerability of the highway system. New York: Multidisciplinary Centre
for Earthquake Engineering Research.
Martin, G, L Marsh, D Anderson, R Mayes and M Power (2002) Recommended design approach for
liquefaction induced lateral spreads. In Proceedings of the Third National Seismic Conference and
Workshop on Bridges and Highways, Portland, Oregon.
Matlock, H (1970) Correlations of design of laterally loaded piles in soft clay. In Proceedings, Offshore
Technical Conference, Houston, Texas, 1, no.1204: 577–594.
Maula, BH, L Zhang, T Liang, G Xia, X Peng-Ju, Z Yong-Qiang, J Kang and S Lei (2011) Comparison of
current Chinese and Japanese design specification for bridge pile in liquefied ground. New Mexico,
USA: World Academy of Science, Engineering and Technology.
Ministry of Transport Japan (MTJ) (1999) Design standard for port and harbour facilities and
commentaries. Japan Port and Harbour Association: 438pp (in Japanese).
Mitchell, JK, HG Cooke and J Schaeffer (1998) Design considerations in ground improvement for seismic
risk mitigation. In Proceedings of the Geotechnical Earthquake Engineering and Soil Dynamics III, ASCE
Geotechnical Publication 1, no.75: 580-613.
Multidisciplinary Center for Earthquake Engineering Research (MCEER) (2001) Liquefaction study report.
Recommended LRFD guidelines for the seismic design of highway bridges. MCEER/ATC 49-1.
Multidisciplinary Center for Earthquake Engineering Research (MCEER) (2003) Liquefaction study report.
Recommended LRFD guidelines for the seismic design of highway bridges, part I: specifications, part II:
commentary and appendices. MCEER/ATC 49-1. Washington DC: Federal Highway Administration
Applied Technology Council.
Murashev, AK, DK Kirkcaldie, C Keepa and JN Lloyd (2013) Proposed amendments to geotechnical
requirements of NZTA Bridge manual. In Proceedings of 19th New Zealand Geotechnical Society
Geotechnical Symposium, Queenstown, New Zealand.
Moss, RES, RB Seed, RE Kayen, JP Stewart, A Der Kiureghian and KO Cetin (2006) CPT-based probabilistic
and deterministic assessment of in situ seismic soil liquefaction potential. Journal of Geotechnical and
Geoenvironmental Engineering 132: 1032–1051.
National Technical Information Service (1986) Example problems and sensitivity studies. Seismic design of
highway bridge foundations, volume 3. Springfield, Virginia: US Department of Transportation.
National Technical Information service (1986) Executive summary. Seismic design of highway bridge
foundations, volume 1. Springfield, Virginia: US Department of Transportation. :
Newmark, NM (1965) Effect of earthquakes on dams and embankments. Geotechnique 15: 139–160.
9 Bibliography
89
New Zealand Geotechnical Society (NZGS) (2005) Field classification and description of soil and rock for
engineering purposes.
New Zealand Geotechnical Society (NZGS) (2010) Geotechnical earthquake engineering practice: module 1
– guideline for the identification, assessment and mitigation of liquefaction hazards.
New Zealand Standards (2004) Structural design actions – part 5: earthquake actions – New Zealand.
(NZS1170.5:2004).
New Zealand Society for Earthquake Engineering (2009) Earthquake strengthing and ground improvement
of the Cobham Bridge, Wanganui. In Proceedings of the 2009 NZSEE Conference. New Zealand.
New Zealand Transport Agency (2013a) Bridge manual. 3rd edition, amendment 0 (effective from May
2013). Wellington: NZ Transport Agency.
New Zealand Transport Agency (2013b) Bridge manual, 3rd edition. Chapter 6 Site stability, foundations,
earthworks and retaining walls. Wellington: NZ Transport Agency.
Olson, SM and CI Johnson (2008) Analyzing liquefaction – induced lateral spreads using strength ratios.
Journal of Geotechnical and Geoenvironmental Engineering 134, no.8: 1035–1049.
Oregon State Department of Transportation (2005) Seismic foundation design practice, bridge engineering
section. Salem, Oregon: Oregon State Department of Transportation.
Oregon State Department of Transportation (2010) Geotechnical design manual. Chapter 6 Seismic design.
Salem, Oregon: Oregon State Department of Transportation.
Oregon State Department of Transportation (2011) Seismic vulnerability of Oregon state highway bridges
– mitigation strategies to reduce major mobility risks. Salem, Oregon: Oregon State Department of
Transportation.
Oregon State Department of Transportation (2012) Geotechnical design manual, volume 1. Salem, Oregon:
Oregon State Department of Transportation.
O'Rourke, TD, WD Meyersohn, Y Shiba and D Chaudhuri (1994) Evaluation of pile response to liquefaction
induced lateral spread. Pp 457–458 in Proceedings of the 5th US-Japan Workshop on Earthquake
Resistant Design of Lifeline Facilities and Countermeasures Against Soil Liquefaction, Technical report
NCEER-94-0026.
Orense, RP (2008) Liquefaction remediation by compaction grouting. In Proceedings of the 2008 NZSEE
Annual Conference. 8pp.
Palermo, A, L Wotherspoon, J Wood, H Chapman, A Scott, L Hogan, A Kivell, E Camniso, M Yashinsky, M
Bruneau and N Chouw (2011) Lessons learnt from 2011 Christchurch earthquakes: analysis and
assessment of bridges. Bulletin of the New Zealand Society for Earthquake Engineering 44, no.4: 319–
333.
Park, R (1996) New Zealand perspectives on seismic design of bridges. Paper no. 2111 presented at the
Eleventh World Conference on Earthquake Engineering. Mexico.
Port and Harbour Research Institute (PHRI) (1997) Handbook on liquefaction remediation of reclaimed
land.: Rotterdam: Balkema.
Poulos, H (2013) Practical approaches to seismic design of deep foundations. In Proceedings of the 19th
NZGS Geotechnical Symposium. Queenstown, New Zealand.

Design guidance for bridges in New Zealand for liquefaction and lateral spreading effects
90
Rauch, AF and JM Martin (2000) EPOLLS model for predicting average displacements on lateral spreads.
Journal of Geotechnical and Geoenvironmental Engineering 126, no.4: 360–371.
Robertson, PK and CE Wride (1998) Evaluating cyclic liquefaction potential using the cone penetration test.
Canadian Geotechnical Journal 35, no.3: 442–459.
Russell, M, J Geraci and D Murray (2008) Compaction grouting to mitigate liquefaction for a new medical
retail building. Geotechnical Earthquake Engineering and Soil Dynamics IV: 1–10.
Schaefer, V (Ed) (1997) Ground improvement, ground reinforcement, ground treatment: developments
1987–1997. Geotechnical Special Publication no. 69. 618pp.
Seed, HB and IM Idriss (1971) Simplified procedure for evaluating soil liquefaction potential. Journal of the
Soil Mechanics and Foundation Division 97, no.9: 1249–1273.
Seed, RB (2010) Technical review and comments: 2008 EERI monograph ‘Soil liquefaction during
earthquakes’ by IM Idriss and RW Boulanger. Geotechnical report no. UCB/GT 2010/01. Berkeley:
University of California.
Seed, RB, KO Cetin, RE Moss, AM Kammerer, J Wu, J Pestana, MF Riemer, RB Sancio, RE Kayen and A Faris
(2003) Recent advances in soil liquefaction engineering: a unified and consistent framework.
In Proceedings of the 26th Annual ASCE Los Angeles Geotechnical Spring Seminar: Long Beach,
California.
Seed, RB and LF Harder (1990) SPT- based analysis of cyclic pore pressure generation and undrained
residual strength. In Proceedings of the HB Seed Memorial Symposium 2: 351–376.
Shamoto, Y, JM Zhang and K Tokimatsu (1998) Methods for evaluating residual post-liquefaction ground
settlement and horizontal displacement. Soils and Foundations, Special Issue vol 2. Japanese
Geotechnical Society: 69–84.
Stirling, M, G McVerry, K Berryman, McGinty, P Villamore, R Van Dissen, D Dowrick, J Cousins and R
Sutherland (2000) Probabilistic seismic hazard assessment of New Zealand: new active fault data,
seismicity data, attenuation relationships and methods. Institute of Geological and Nuclear Sciences
client report 2000/53. Wellington, New Zealand: Earthquake Commission Research Foundation.
Tamura, K (2013) Design requirements of highway bridges for soil liquefaction. In Proceedings of the
International Symposium for Bridge Earthquake Engineering in Honor of Retirement of Professor
Kazuhiko Kawashima, Tokyo, Japan, pp49–61.
Tasiopoulou, P, N Gerolymos, T Tazoh and G Gazetas (2013) Pile-group response to large soil
displacements and liquefaction: centrifuge experiments versus a physically simplified analysis. Journal
of Geotechnical and Geoenvironmental Engineering 139, no.2: 223–233.
Tasiopoulou, P, E Smyrou, I Bal and G Gazetas (2012) Bridge pile – abutment – deck interaction in laterally
spreading ground: lessons from Christchurch. In Proceedings of the 15th World Conference on
Earthquake Engineering, Lisbon, Portugal.
Tokimatsu, K and Y Asaka (1998) Effects of liquefaction-induced ground displacements on pile
performance in the 1995 Hyogoken-Nambu earthquake. Soils and Foundations, Special issue on
Geotechnical Aspects of the January 15, 1995 Hyogoken-Nambu Earthquake, no. 2: 163–177.
Tokimatsu, K and HB Seed (1987) Evaluation of settlements in sands due to earthquake shaking. Journal of
Geotechnical Engineering 113, no.8: 861–878.

9 Bibliography
91
Tokimatsu, K, H Suzuki, M Sato (2005) Effects of inertial and kinematic interaction on seismic behavior of
pile with embedded foundation. Soil Dynamics and Earthquake Engineering 25: 753–762
Uchida, A and K Tokimatsu (2005) Comparison of current Japanese design specifications for pile
foundations in liquefiable and laterally spreading ground. Pp 61–70 in RW Boulanger and K Tokimatsu
(Eds) Seismic performance and simulation of pile foundations in liquefied and laterally spreading
ground. Geotechnical special publication no.145. Proceedings of a workshop, University of California,
Davis, California, 16–18 March 2005.
Unjoh, S and T Terayama (Eds) (1996) Design specifications of highway bridges – part V seismic design.,
Tokyo: Japan Road Association.
Waldin, J, J Jennings and P Routledge (2012) Critically damaged bridges and concepts for earthquake
recovery. Paper no. 104 in the New Zealand Society for Earthquake Engineering Annual Technical
Conference, Christchurch, New Zealand, 2012.
Washington State Department of Transportation (2010) Geotechnical design manual – chapter 6 seismic
design. Washington DC: Washington State Department of Transportation.
Werner, SD, S Cho and RT Eguchi (2008) The shakeout scenario supplemental study: analysis of risks to
Southern California highway system. Oakland, California: United States Geological Survey.
Wood, J (2012) Analyses of state highway bridges damaged in the Darfield and Christchurch earthquakes.
Paper no. 018 in the New Zealand Society for Earthquake Engineering Annual Technical Conference,
Christchurch, New Zealand 2012.
Wood, JH, HE Chapman, P Prabhaharan (2012) Performance of highway structures during the Darfield and
Christchurch earthquakes of 4 September 2010 and 22 February 2011. Report for NZ Transport
Agency.
Wotherspoon, L, R Orense, M Jacka, R Green, B Cox and C Wood (2014) Seismic performance of improved
ground sites during the 2010–2011 Canterbury earthquake sequence. Earthquake spectra.
Xanthakos, PP, LW Abramson and DA Bruce (1994) Ground control and improvement. New York: John Wiley
& Sons. 910pp.
Yasuda, S, K Ishihara, K Harada and N Shinkawa (1996) Effect of soil improvement on ground subsidence
due to liquefaction. Special issue of Soils and Foundations: 99–107.
Youd, TL (1991) Mapping of earthquake-induced liquefaction for seismic zonation. In Proceedings of the
Fourth International Conference on Seismic Zonation I: 111–147.
Youd, TL, CM Hansen and SF Bartlett (2002) Revised multi-linear regression equations for prediction of
lateral spread displacement. Journal of Geotechnical and Environmental Engineering 128, no.12: 1007–
1017.
Youd, TL and SN Hoose (1977) Liquefaction susceptibility and geologic setting. In Proceedings of the 6th
World Conference on Earthquake Engineering, New Delhi 6: 37–42.
Youd, TL and IM Idriss (Eds) (1997) Proceeding of the NCEER Workshop on Evaluation of Liquefaction
Resistance of Soils. Technical report NCEER-97-0022. Utah.
Youd, TL and DM Perkins (1978) Mapping liquefaction-induced ground failure potential. Journal of the
Geotechnical Engineering Division 104, no.4: 443–446.
Youd, TL, IM Idriss, RD Andrus, I Arango, G Castro, JT Christian, R Dobry, WDL Liam Finn, LF Harder Jr, ME
Hynes, K Ishihara, JP Koester, SSC Liao, WF Marcuson III, GR Martin, JK Mitchell, Y Moriwaki, MS Power,

Design guidance for bridges in New Zealand for liquefaction and lateral spreading effects
92
PK Robertson, RB Seed and KH Stokoe II (2001) Liquefaction resistance of soils: summary report from
the 1996 NCEER and 1998 NCEER/NSF Workshops on evaluation of liquefaction resistance of soils.
Journal of Geotechnical and Geoenvironmental Engineering 127, no.10: 817–833.
Zhao, M (2011) Response of bridges to lateral spreading and earthquake shaking. PhD thesis. Los Angeles:
University of California.
Zhang, G, PK Robertson and R Brachman (2002) Estimating liquefaction-induced ground settlements from
the CPT. Canadian Geotechnical Journal 39: 1168–1180.
Zhang, G, PK Robertson and R Brachman (2004) Estimating liquefaction-induced lateral displacements
using the standard penetration test or cone penetration test. Journal of Geotechnical and
Geoenvironmental Engineering 130, no.8: 861–871.
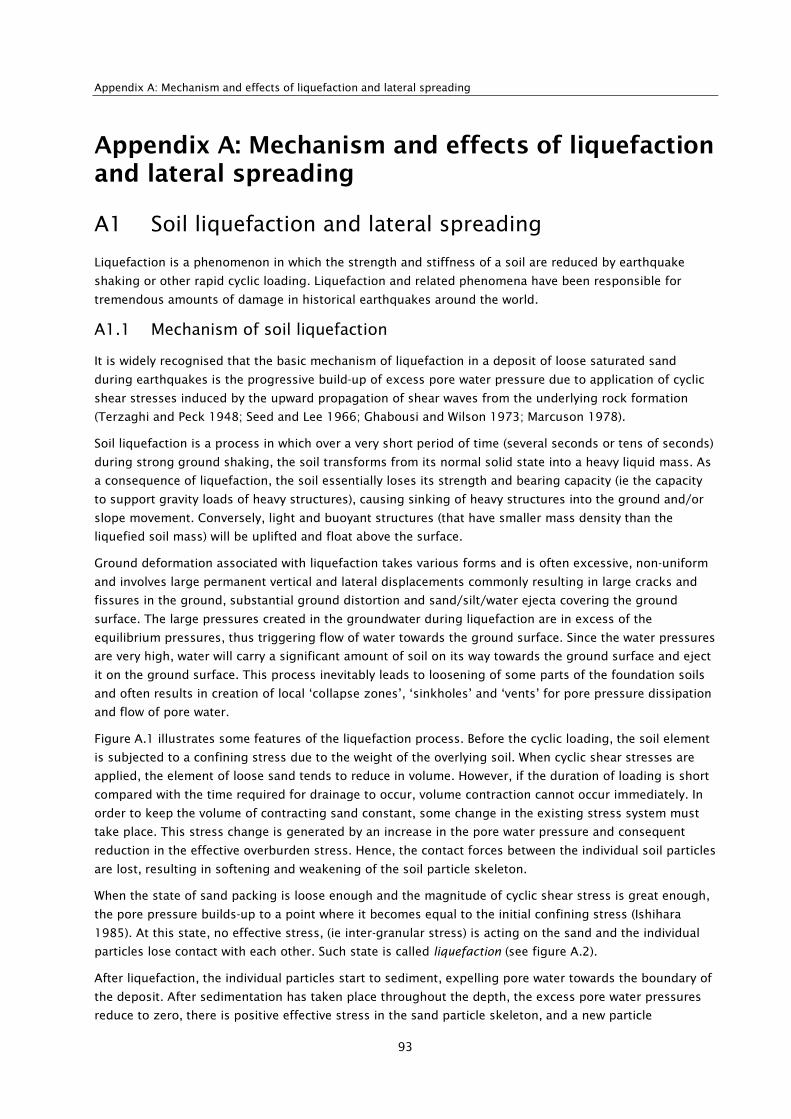
Appendix A: Mechanism and effects of liquefaction and lateral spreading
93
Appendix A: Mechanism and effects of liquefaction and lateral spreading
A1 Soil liquefaction and lateral spreading
Liquefaction is a phenomenon in which the strength and stiffness of a soil are reduced by earthquake
shaking or other rapid cyclic loading. Liquefaction and related phenomena have been responsible for
tremendous amounts of damage in historical earthquakes around the world.
A1.1 Mechanism of soil liquefaction
It is widely recognised that the basic mechanism of liquefaction in a deposit of loose saturated sand
during earthquakes is the progressive build-up of excess pore water pressure due to application of cyclic
shear stresses induced by the upward propagation of shear waves from the underlying rock formation
(Terzaghi and Peck 1948; Seed and Lee 1966; Ghabousi and Wilson 1973; Marcuson 1978).
Soil liquefaction is a process in which over a very short period of time (several seconds or tens of seconds)
during strong ground shaking, the soil transforms from its normal solid state into a heavy liquid mass. As
a consequence of liquefaction, the soil essentially loses its strength and bearing capacity (ie the capacity
to support gravity loads of heavy structures), causing sinking of heavy structures into the ground and/or
slope movement. Conversely, light and buoyant structures (that have smaller mass density than the
liquefied soil mass) will be uplifted and float above the surface.
Ground deformation associated with liquefaction takes various forms and is often excessive, non-uniform
and involves large permanent vertical and lateral displacements commonly resulting in large cracks and
fissures in the ground, substantial ground distortion and sand/silt/water ejecta covering the ground
surface. The large pressures created in the groundwater during liquefaction are in excess of the
equilibrium pressures, thus triggering flow of water towards the ground surface. Since the water pressures
are very high, water will carry a significant amount of soil on its way towards the ground surface and eject
it on the ground surface. This process inevitably leads to loosening of some parts of the foundation soils
and often results in creation of local ‘collapse zones’, ‘sinkholes’ and ‘vents’ for pore pressure dissipation
and flow of pore water.
Figure A.1 illustrates some features of the liquefaction process. Before the cyclic loading, the soil element
is subjected to a confining stress due to the weight of the overlying soil. When cyclic shear stresses are
applied, the element of loose sand tends to reduce in volume. However, if the duration of loading is short
compared with the time required for drainage to occur, volume contraction cannot occur immediately. In
order to keep the volume of contracting sand constant, some change in the existing stress system must
take place. This stress change is generated by an increase in the pore water pressure and consequent
reduction in the effective overburden stress. Hence, the contact forces between the individual soil particles
are lost, resulting in softening and weakening of the soil particle skeleton.
When the state of sand packing is loose enough and the magnitude of cyclic shear stress is great enough,
the pore pressure builds-up to a point where it becomes equal to the initial confining stress (Ishihara
1985). At this state, no effective stress, (ie inter-granular stress) is acting on the sand and the individual
particles lose contact with each other. Such state is called liquefaction (see figure A.2).
After liquefaction, the individual particles start to sediment, expelling pore water towards the boundary of
the deposit. After sedimentation has taken place throughout the depth, the excess pore water pressures
reduce to zero, there is positive effective stress in the sand particle skeleton, and a new particle

Design guidance for bridges in New Zealand for liquefaction and lateral spreading effects
94
arrangement is formed which may be denser, looser or similar to the density state of the soils before the
occurrence of liquefaction. Figure A.1 illustrates one of the possible outcomes where the soils have
densified. In principle, however, the fabric and new structure of the soil skeleton of liquefied soils is very
weak and prone to re-liquefaction. The potential of soils to re-liquefy has been demonstrated by the
widespread re-liquefaction of soils in the eastern suburbs of Christchurch during the 2010–2011
Canterbury earthquakes.
Figure A.1 Mechanism of liquefaction
Figure A.2 Liquefaction process and development of excess pore water pressure
As seen above, the process of soil liquefaction generally involves three phases:
1 Pore pressure build-up
2 State of liquefaction with nearly zero effective stress in the soil mass
3 Dissipation of excess pore water pressures.
The liquefaction process is depicted in figure A.2. The first phase in which the pore water pressure rises to
the level of the effective overburden stress (and triggers liquefaction) is very short. In the 1995 Kobe
earthquake, for example, only two or three seconds of intense ground shaking were required to trigger
liquefaction in 15m to 20m thick reclaimed deposits. The rate of pore pressure build-up is primarily
influenced by the deformational behaviour of the soil and ground motion characteristics (amplitude and
number of intense cycles of ground shaking). The duration of the second phase (during which the effective

Appendix A: Mechanism and effects of liquefaction and lateral spreading
95
stress is nearly zero and the soil is liquefied) is much longer and depends on a number of factors (soil
stratification, permeability of soils, presence and thickness of impermeable layers, duration of shaking
and ground distortion caused by the shaking). During this phase, significant unbalanced excess pore
pressures develop causing the flow of pore water and liquefied soil mass towards the ground surface.
Sand boils are a typical consequence of such non-equilibrium pressures. The final phase is quite long and
again very complex. It involves dissipation of excess pore water pressures, sedimentation of soil particles,
solidification and reconsolidation of the deposit. During liquefaction and dissipation of pore pressures,
phenomena such as secondary and progressive liquefaction may occur due to an upward flow of water and
redistribution of void ratio (loosening of the soil).
Loose soils have more voids in their inherent structure (since they were not well compacted when
deposited). Hence, when shaken, they show a large tendency for densification (contraction) which in turn
leads to rapid pore water pressure build-up and eventual liquefaction in only few cycles of strong shaking.
Since these soils are loosely packed and are highly deformable (compressible), liquefaction will be severely
manifested and will result in very large ground movements and nearly complete loss of load carrying
capacity. This is why loose soils are particularly prone to liquefaction and show very severe consequences
of liquefaction. Conversely, very dense soils show very limited tendency for densification and hence
produce low excess pore water pressures, and therefore they have much higher liquefaction resistance.
Clays, clayey soils and plastic soils in general, derive stiffness and strength from an additional mechanism-
cohesion, and hence are considered to be non-liquefiable. Softening of these soils and large deformation
especially of soft clays and peat can produce severe ground deformation and affect the seismic behaviour
of buildings and infrastructure, but their response mechanism is different from the soil liquefaction
outlined above.
A2 Liquefaction effects during earthquakes
Liquefaction induces very large strains (ie the decrease in the thickness of a soil layer divided by its
original thickness, which defines the relative deformation within the soil), typically in the order of several
percent. Hence, if for example a 10m thick layer liquefies, the horizontal displacement of the top of the
layer (eg at the ground surface) relative to its base (10m depth) could be in the order of 50m to 60cm.
A buried structure, including piled foundations in liquefied soil will be subjected to very large and non-
uniform lateral loads from these ground movements and oscillation of the building. There are two
particular locations where damage to piles in liquefied soils typically occurs near the pile top and at the
interface between the liquefied soil and underlying unliquefied soil. In some cases, this interface is at
large depth, and hence, it imposes serious constraints in identifying if there has been damage caused by
the earthquake, and also in repairing or strengthening of the piles if required. The large ground distortion
and highly non-uniform displacements caused by liquefaction often result in stretching of the ground
imposing large loads and damage to foundations and horizontal infrastructure. Substantial total
settlements, differential settlements and tilt of structures are common consequences of soil liquefaction.
Hence, for engineering purposes, it is not the occurrence of liquefaction that is of prime importance, but
its severity and its capability to cause damage to land, buildings and infrastructure. Adverse effects of
liquefaction can take many forms (eg Kramer 1996; NRC 1985; Towhata 2008).
A2.1 Flow failures
Flow failures are the most catastrophic ground failures caused by liquefaction. These failures commonly
displace large masses of soil tens of metres laterally. In some cases large masses of soil have travelled
tens of kilometres down long slopes at velocities up to tens of kilometres per hour. Flows may consist of

Design guidance for bridges in New Zealand for liquefaction and lateral spreading effects
96
completely liquefied soil or blocks of intact material riding on a layer of liquefied soil. Flows develop in
loose saturated sands or silts on relatively steep slopes, usually with slope angles greater than 3º.
A2.2 Lateral spreads
Lateral spreading is a particular form of land movement associated with liquefaction that produces very
large lateral ground displacements from tens of centimetres to several metres, and hence, is very
damaging for buildings and infrastructure. Lateral spreading typically occurs in sloping ground or level
ground close to waterways (eg river banks, streams, in the backfills behind quay walls). Even a very gentle
slope in the ground (of several degrees) will create a bias in the cyclic loads acting on the soil mass during
earthquakes which will drive the soil to move in the down-slope direction.
If the underlying soils liquefy then the liquefied soil mass (‘heavy liquid’) will naturally move down-slope
and will continue this movement until equilibrium is re-established (or resisting forces reach the level of
driving forces). Hence, displacement occurs in response to the combination of gravitational forces and
inertial forces generated by an earthquake. The displaced ground usually breaks up internally, causing
fissures, scarps, horsts and grabens to form on the failure surface.
Lateral spreads commonly disrupt foundations of buildings built on or across the failure, sever pipelines
and other utilities in the failure mass, and compress or buckle engineering structures, such as bridges,
founded on the toe of the failure (see figure A.3a). The process of spreading in backfills behind retaining
walls is similar, with large ground shaking first displacing the retaining structure outwards (eg towards a
waterway), which is then followed by lateral spreading in the backfills.
A2.3 Ground oscillation
Where the ground is flat or the slope is too gentle to allow lateral displacement, liquefaction at depth may
decouple overlying soil layers from the underlying ground, allowing the upper soil to oscillate back and
forth and up and down in the form of ground waves. These oscillations are usually accompanied by
opening and closing of fissures and fracture of rigid structures such as pavements and pipelines. During
the March 2011 earthquake in Japan videos were taken of ground oscillation movements in the Ciba
region, near Tokyo, which have been described as ‘ground breathing’ (Towhata 2012).
Transient ground displacements of liquefied soils can be quite significant. One can easily calculate a
ballpark figure of such displacements by integrating the shear strains (typically 1% to 5%) throughout the
depth of the liquefied soil. For example, in the liquefied reclaimed deposits of Kobe harbour, the transient
(cyclic) displacements of the liquefied soils during the strong shaking were on the order of ± 0.4m
(Cubrinovski et al 1996; Tokimatsu and Asaka 1998) and these large displacements were sufficient to
cause substantial damage to pile foundations of high-rise buildings even in the absence of lateral
spreading (Horikoshi et al 2000). Hence, when analysing the response of bridges to strong ground
shaking in potentially liquefiable soils, it is important to consider effects of both inertial loads due to
vibration of the superstructure and kinematic loads due to displacements of the liquefying soils.
A2.4 Tilting and settlement of structures
When the soil supporting a building or other structure liquefies and loses strength, large deformations can
occur within the soil which may allow the structure to settle and tip. For example, many buildings settled
and tipped during the 1964 Niigata, Japan earthquake. The most spectacular bearing failures during that
event were in the Kawagishi-cho apartment complex where several four-story buildings tipped as much as
60º. Apparently, liquefaction first developed in a sand layer several metres below ground surface and then

Appendix A: Mechanism and effects of liquefaction and lateral spreading
97
propagated upward through overlying sand layers. The rising wave of liquefaction weakened the soil
supporting the buildings and allowed the structures to slowly settle and tip.
Figure A.3 Manifestations of liquefaction in the field: a) lateral spreading observed near Avon River following
the 2011 Christchurch earthquake; b) sand boil observed during the 2000 Tottori-ken Seibu earthquake
a) b)
A2.5 Ground settlement
In many cases, the weight of a structure will not be great enough to cause the large settlements
associated with soil bearing capacity failures described above. However, smaller settlements may occur as
soil pore-water pressures dissipate and the soil consolidates after the earthquake. These settlements may
be damaging, although they would tend to be much less than the large movements accompanying flow
failures, lateral spreading, and bearing capacity failures. The eruption of sand boils (fountains of water
and sediment emanating from the pressurised, liquefied sand) is a common manifestation of liquefaction
that can also lead to localised differential settlements.
A2.6 Buoyant rise of buried structures
Soil liquefaction can also induce buoyant rise of underground structures such as empty or partially filled
pipelines and manholes. Normally, the uplift of the buried structure is prevented by resistance from the
adjacent soil. However, when soil liquefies, the soil loses its resistance and starts to behave like liquid with
a unit weight almost twice that of water. When the unit weight of the buried structure is less than that of
the liquefied soil, floating of underground structures can occur.
A2.7 Increased lateral pressure on retaining walls
If the soil behind a retaining wall liquefies, the lateral pressures on the wall may greatly increase. As a
result, retaining walls may be laterally displaced, tilt, or structurally fail, as has been observed for
waterfront walls retaining loose saturated sand in a number of earthquakes.
A2.8 Sand boils
Sand boils are diagnostic evidence of elevated pore water pressure at depth and are indications that
liquefaction has occurred. During earthquakes, sand boils are formed by water venting to the ground
surface from zones of high pressure generated at shallow depth during seismic shaking (Housner 1958;
Scott and Zuckerman 1973). The water, which may flow violently, usually transports considerable
suspended sediment that settles and forms a conically shaped sand boil deposit around the vent (see
figure A.3b). Massive sand boils can be very damaging for shallow foundations and buried lifelines since
they often create local ‘collapse zones’, sinkholes and vents for pore water flow that lead to a complete
loss of stiffness and bearing capacity in the foundation soils.

Design guidance for bridges in New Zealand for liquefaction and lateral spreading effects
98
A3 Lateral ground deformations
Cyclic and permanent lateral displacements of liquefied soil are among the most troublesome liquefaction
hazards for foundations, buried structures and lifeline facilities. Because these types of deformation
involve the movement of competent soil, full passive pressure can be mobilised against an underground
structure. Pipelines, bridges, pile foundations and other civil engineering structures on or within the
extensional zone are typically cracked or torn apart. Almost all the alarming photos of widespread
destruction from an earthquake are damage done by large permanent lateral movements of the soil
surface.
A3.1 Field observations
Case histories of liquefaction-induced ground deformations during past earthquakes are important for
understanding ground failure processes and the factors controlling these processes. Noteworthy is the
fact that they provide sufficient data to be used in the verification of predictive models. In addition, the
relation between geological and geotechnical conditions and the resulting deformations can be clearly
evaluated. The two main techniques employed in measuring permanent lateral ground deformations
include ground surveying and processing of aerial photographs and LiDAR.
A3.1.1 1964 Niigata earthquake
On 16 June 1964, an earthquake of M7.5 shook Niigata Prefecture. The earthquake caused extensive
damage to various engineering structures such as buildings, bridges, harbours, river dikes and lifeline
facilities. Measurements of permanent ground displacements were conducted by Hamada et al (1986) by
comparing aerial photographs taken before and after the earthquake. Their studies reveal that large lateral
spreading occurred in Niigata City, with displacements as large as 8.5m in the area of Hakusan Power
Station and 8.8m on the left bank near Bandai Bridge (see figure A.4).
During the earthquake, Showa Bridge collapsed. According to eye witnesses, the bridge collapsed a few
seconds after the earthquake had ended. A similar phenomenon was observed for the revetment at the
bank of Showa Bridge (Yoshida et al 2011). These clearly show that the inertia forces associated with the
earthquake motion were not the direct cause of the collapse of these structures.
A3.1.2 Nihonkai Chubu earthquake
On 16 May 1983 Nihonkai-Chubu earthquake, with a magnitude of 7.7, caused extensive damage to the
coastal area of Tohoku region. One of the most severely damaged areas was Noshiro City, which is built
on the sand dunes along the Japanese sea coast and alluvial plain of Yoneshiro River. Numerous cracks on
gentle slopes indicated the occurrence of lateral spreading due to liquefaction.

Appendix A: Mechanism and effects of liquefaction and lateral spreading
99
Figure A.4 Permanent horizontal ground displacements in Niigata City during the 1964 Niigata earthquake
(after Hamada et al 1986)
Figure A.5 a) Permanent displacements around Maeyama Hill in Noshiro City (after Hamada et al 1986); and (b)
permanent displacements in vertical cross-sections of subsoils (after Towhata et al 1992)
a) b)
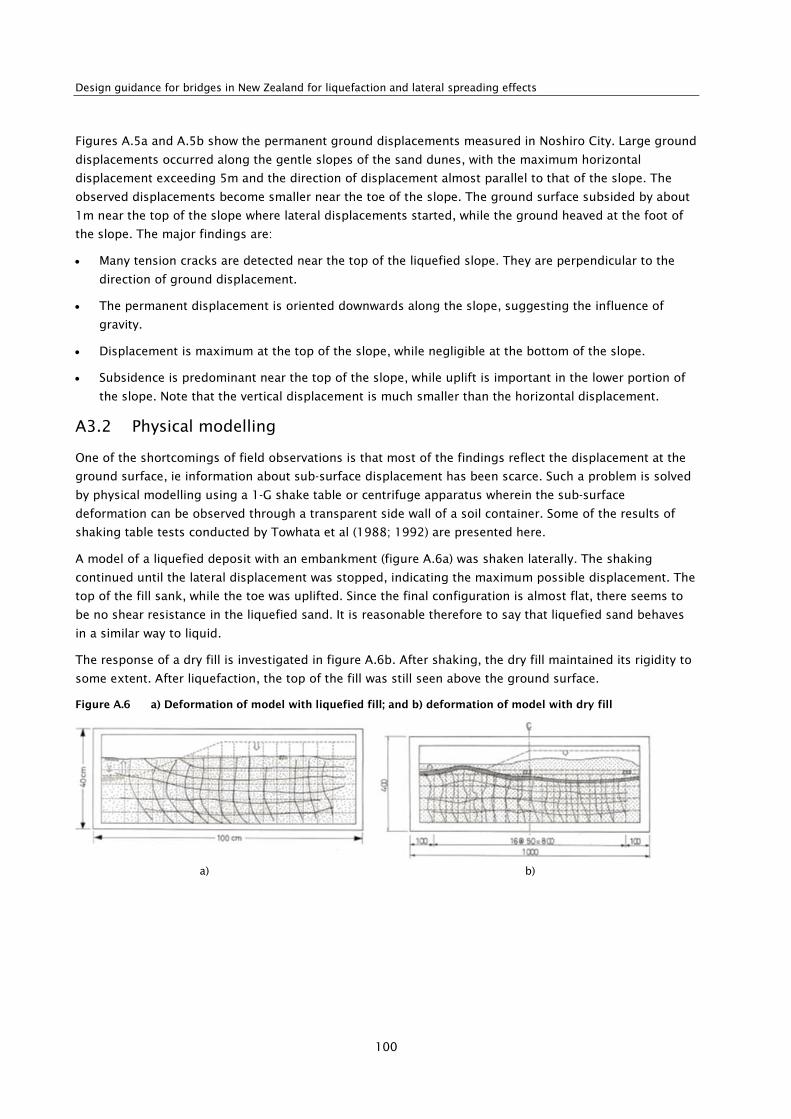
Design guidance for bridges in New Zealand for liquefaction and lateral spreading effects
100
Figures A.5a and A.5b show the permanent ground displacements measured in Noshiro City. Large ground
displacements occurred along the gentle slopes of the sand dunes, with the maximum horizontal
displacement exceeding 5m and the direction of displacement almost parallel to that of the slope. The
observed displacements become smaller near the toe of the slope. The ground surface subsided by about
1m near the top of the slope where lateral displacements started, while the ground heaved at the foot of
the slope. The major findings are:
• Many tension cracks are detected near the top of the liquefied slope. They are perpendicular to the
direction of ground displacement.
• The permanent displacement is oriented downwards along the slope, suggesting the influence of
gravity.
• Displacement is maximum at the top of the slope, while negligible at the bottom of the slope.
• Subsidence is predominant near the top of the slope, while uplift is important in the lower portion of
the slope. Note that the vertical displacement is much smaller than the horizontal displacement.
A3.2 Physical modelling
One of the shortcomings of field observations is that most of the findings reflect the displacement at the
ground surface, ie information about sub-surface displacement has been scarce. Such a problem is solved
by physical modelling using a 1-G shake table or centrifuge apparatus wherein the sub-surface
deformation can be observed through a transparent side wall of a soil container. Some of the results of
shaking table tests conducted by Towhata et al (1988; 1992) are presented here.
A model of a liquefied deposit with an embankment (figure A.6a) was shaken laterally. The shaking
continued until the lateral displacement was stopped, indicating the maximum possible displacement. The
top of the fill sank, while the toe was uplifted. Since the final configuration is almost flat, there seems to
be no shear resistance in the liquefied sand. It is reasonable therefore to say that liquefied sand behaves
in a similar way to liquid.
The response of a dry fill is investigated in figure A.6b. After shaking, the dry fill maintained its rigidity to
some extent. After liquefaction, the top of the fill was still seen above the ground surface.
Figure A.6 a) Deformation of model with liquefied fill; and b) deformation of model with dry fill
a) b)
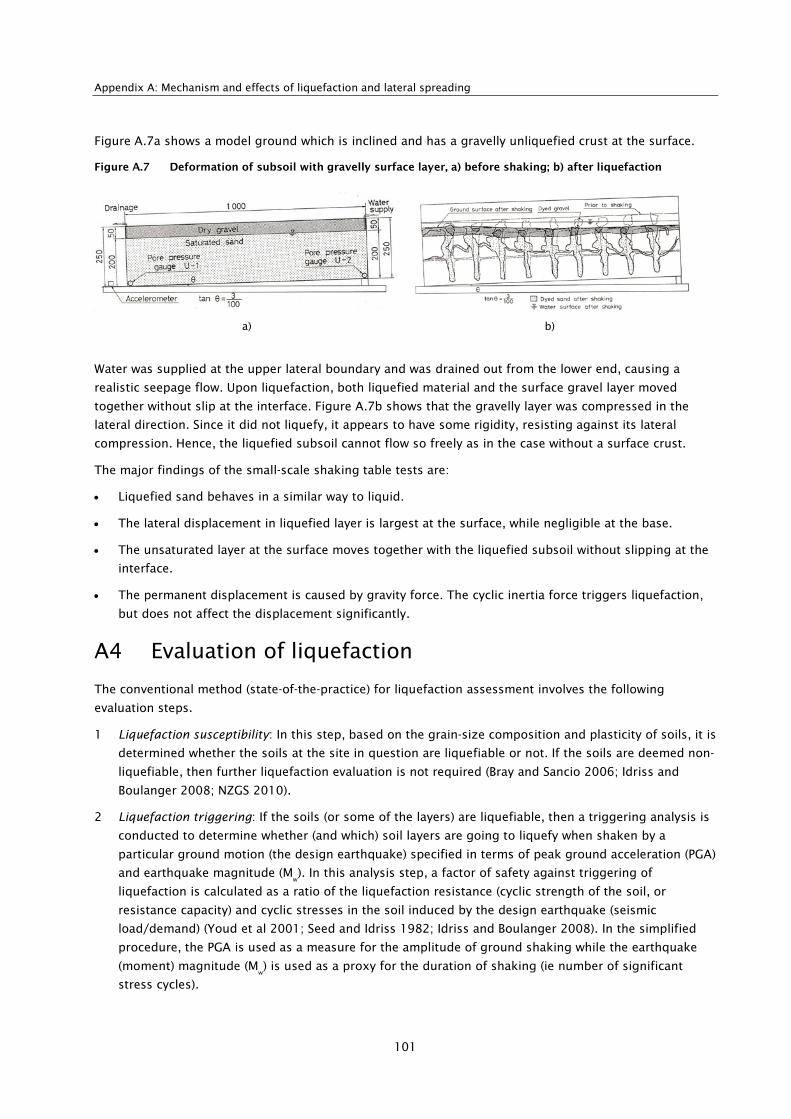
Appendix A: Mechanism and effects of liquefaction and lateral spreading
101
Figure A.7a shows a model ground which is inclined and has a gravelly unliquefied crust at the surface.
Figure A.7 Deformation of subsoil with gravelly surface layer, a) before shaking; b) after liquefaction
a) b)
Water was supplied at the upper lateral boundary and was drained out from the lower end, causing a
realistic seepage flow. Upon liquefaction, both liquefied material and the surface gravel layer moved
together without slip at the interface. Figure A.7b shows that the gravelly layer was compressed in the
lateral direction. Since it did not liquefy, it appears to have some rigidity, resisting against its lateral
compression. Hence, the liquefied subsoil cannot flow so freely as in the case without a surface crust.
The major findings of the small-scale shaking table tests are:
• Liquefied sand behaves in a similar way to liquid.
• The lateral displacement in liquefied layer is largest at the surface, while negligible at the base.
• The unsaturated layer at the surface moves together with the liquefied subsoil without slipping at the
interface.
• The permanent displacement is caused by gravity force. The cyclic inertia force triggers liquefaction,
but does not affect the displacement significantly.
A4 Evaluation of liquefaction
The conventional method (state-of-the-practice) for liquefaction assessment involves the following
evaluation steps.
1 Liquefaction susceptibility: In this step, based on the grain-size composition and plasticity of soils, it is
determined whether the soils at the site in question are liquefiable or not. If the soils are deemed non-
liquefiable, then further liquefaction evaluation is not required (Bray and Sancio 2006; Idriss and
Boulanger 2008; NZGS 2010).
2 Liquefaction triggering: If the soils (or some of the layers) are liquefiable, then a triggering analysis is
conducted to determine whether (and which) soil layers are going to liquefy when shaken by a
particular ground motion (the design earthquake) specified in terms of peak ground acceleration (PGA)
and earthquake magnitude (Mw). In this analysis step, a factor of safety against triggering of
liquefaction is calculated as a ratio of the liquefaction resistance (cyclic strength of the soil, or
resistance capacity) and cyclic stresses in the soil induced by the design earthquake (seismic
load/demand) (Youd et al 2001; Seed and Idriss 1982; Idriss and Boulanger 2008). In the simplified
procedure, the PGA is used as a measure for the amplitude of ground shaking while the earthquake
(moment) magnitude (Mw) is used as a proxy for the duration of shaking (ie number of significant
stress cycles).
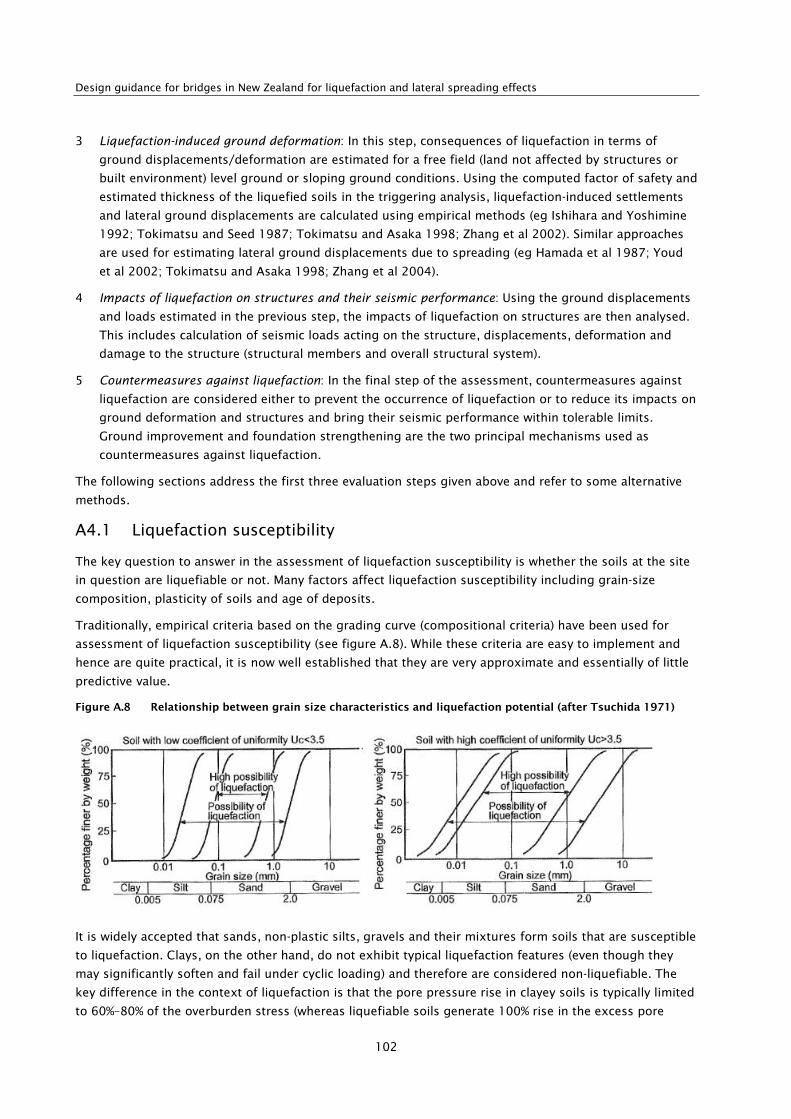
Design guidance for bridges in New Zealand for liquefaction and lateral spreading effects
102
3 Liquefaction-induced ground deformation: In this step, consequences of liquefaction in terms of
ground displacements/deformation are estimated for a free field (land not affected by structures or
built environment) level ground or sloping ground conditions. Using the computed factor of safety and
estimated thickness of the liquefied soils in the triggering analysis, liquefaction-induced settlements
and lateral ground displacements are calculated using empirical methods (eg Ishihara and Yoshimine
1992; Tokimatsu and Seed 1987; Tokimatsu and Asaka 1998; Zhang et al 2002). Similar approaches
are used for estimating lateral ground displacements due to spreading (eg Hamada et al 1987; Youd
et al 2002; Tokimatsu and Asaka 1998; Zhang et al 2004).
4 Impacts of liquefaction on structures and their seismic performance: Using the ground displacements
and loads estimated in the previous step, the impacts of liquefaction on structures are then analysed.
This includes calculation of seismic loads acting on the structure, displacements, deformation and
damage to the structure (structural members and overall structural system).
5 Countermeasures against liquefaction: In the final step of the assessment, countermeasures against
liquefaction are considered either to prevent the occurrence of liquefaction or to reduce its impacts on
ground deformation and structures and bring their seismic performance within tolerable limits.
Ground improvement and foundation strengthening are the two principal mechanisms used as
countermeasures against liquefaction.
The following sections address the first three evaluation steps given above and refer to some alternative
methods.
A4.1 Liquefaction susceptibility
The key question to answer in the assessment of liquefaction susceptibility is whether the soils at the site
in question are liquefiable or not. Many factors affect liquefaction susceptibility including grain-size
composition, plasticity of soils and age of deposits.
Traditionally, empirical criteria based on the grading curve (compositional criteria) have been used for
assessment of liquefaction susceptibility (see figure A.8). While these criteria are easy to implement and
hence are quite practical, it is now well established that they are very approximate and essentially of little
predictive value.
Figure A.8 Relationship between grain size characteristics and liquefaction potential (after Tsuchida 1971)
It is widely accepted that sands, non-plastic silts, gravels and their mixtures form soils that are susceptible
to liquefaction. Clays, on the other hand, do not exhibit typical liquefaction features (even though they
may significantly soften and fail under cyclic loading) and therefore are considered non-liquefiable. The
key difference in the context of liquefaction is that the pore pressure rise in clayey soils is typically limited
to 60%–80% of the overburden stress (whereas liquefiable soils generate 100% rise in the excess pore
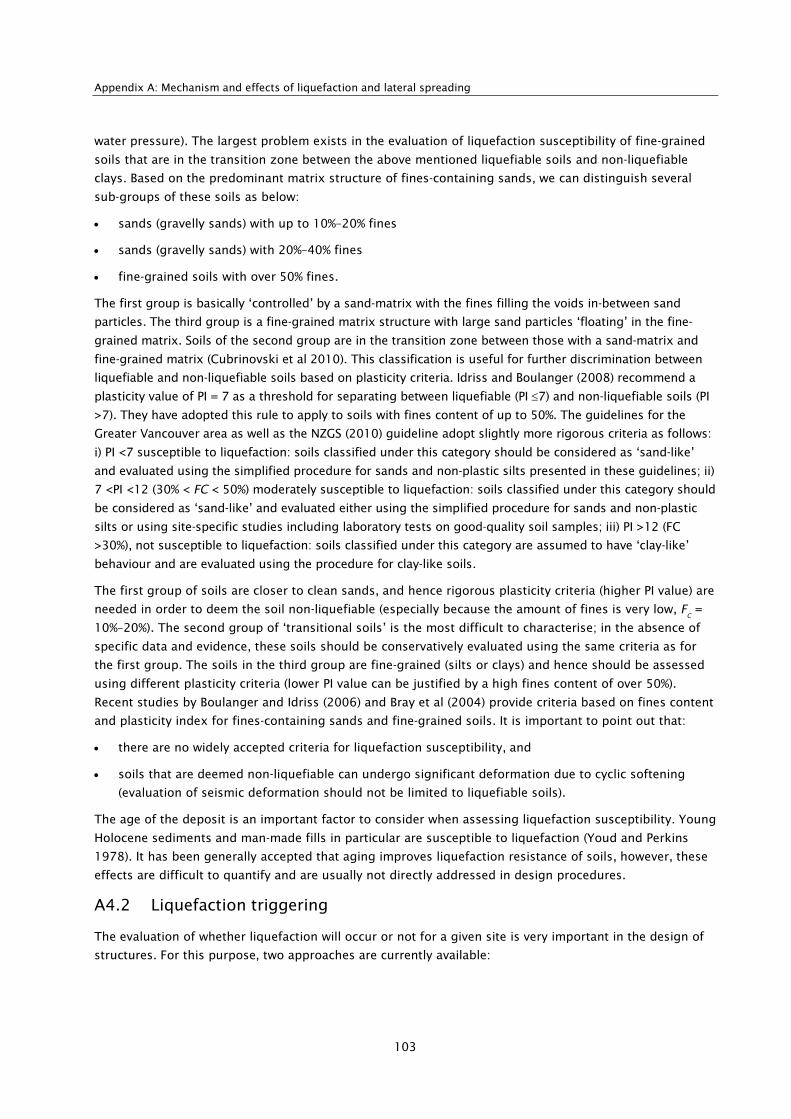
Appendix A: Mechanism and effects of liquefaction and lateral spreading
103
water pressure). The largest problem exists in the evaluation of liquefaction susceptibility of fine-grained
soils that are in the transition zone between the above mentioned liquefiable soils and non-liquefiable
clays. Based on the predominant matrix structure of fines-containing sands, we can distinguish several
sub-groups of these soils as below:
• sands (gravelly sands) with up to 10%–20% fines
• sands (gravelly sands) with 20%–40% fines
• fine-grained soils with over 50% fines.
The first group is basically ‘controlled’ by a sand-matrix with the fines filling the voids in-between sand
particles. The third group is a fine-grained matrix structure with large sand particles ‘floating’ in the fine-
grained matrix. Soils of the second group are in the transition zone between those with a sand-matrix and
fine-grained matrix (Cubrinovski et al 2010). This classification is useful for further discrimination between
liquefiable and non-liquefiable soils based on plasticity criteria. Idriss and Boulanger (2008) recommend a
plasticity value of PI = 7 as a threshold for separating between liquefiable (PI ≤7) and non-liquefiable soils (PI
>7). They have adopted this rule to apply to soils with fines content of up to 50%. The guidelines for the
Greater Vancouver area as well as the NZGS (2010) guideline adopt slightly more rigorous criteria as follows:
i) PI <7 susceptible to liquefaction: soils classified under this category should be considered as ‘sand-like’
and evaluated using the simplified procedure for sands and non-plastic silts presented in these guidelines; ii)
7 <PI <12 (30% < FC < 50%) moderately susceptible to liquefaction: soils classified under this category should
be considered as ‘sand-like’ and evaluated either using the simplified procedure for sands and non-plastic
silts or using site-specific studies including laboratory tests on good-quality soil samples; iii) PI >12 (FC
>30%), not susceptible to liquefaction: soils classified under this category are assumed to have ‘clay-like’
behaviour and are evaluated using the procedure for clay-like soils.
The first group of soils are closer to clean sands, and hence rigorous plasticity criteria (higher PI value) are
needed in order to deem the soil non-liquefiable (especially because the amount of fines is very low, FC =
10%–20%). The second group of ‘transitional soils’ is the most difficult to characterise; in the absence of
specific data and evidence, these soils should be conservatively evaluated using the same criteria as for
the first group. The soils in the third group are fine-grained (silts or clays) and hence should be assessed
using different plasticity criteria (lower PI value can be justified by a high fines content of over 50%).
Recent studies by Boulanger and Idriss (2006) and Bray et al (2004) provide criteria based on fines content
and plasticity index for fines-containing sands and fine-grained soils. It is important to point out that:
• there are no widely accepted criteria for liquefaction susceptibility, and
• soils that are deemed non-liquefiable can undergo significant deformation due to cyclic softening
(evaluation of seismic deformation should not be limited to liquefiable soils).
The age of the deposit is an important factor to consider when assessing liquefaction susceptibility. Young
Holocene sediments and man-made fills in particular are susceptible to liquefaction (Youd and Perkins
1978). It has been generally accepted that aging improves liquefaction resistance of soils, however, these
effects are difficult to quantify and are usually not directly addressed in design procedures.
A4.2 Liquefaction triggering
The evaluation of whether liquefaction will occur or not for a given site is very important in the design of
structures. For this purpose, two approaches are currently available:
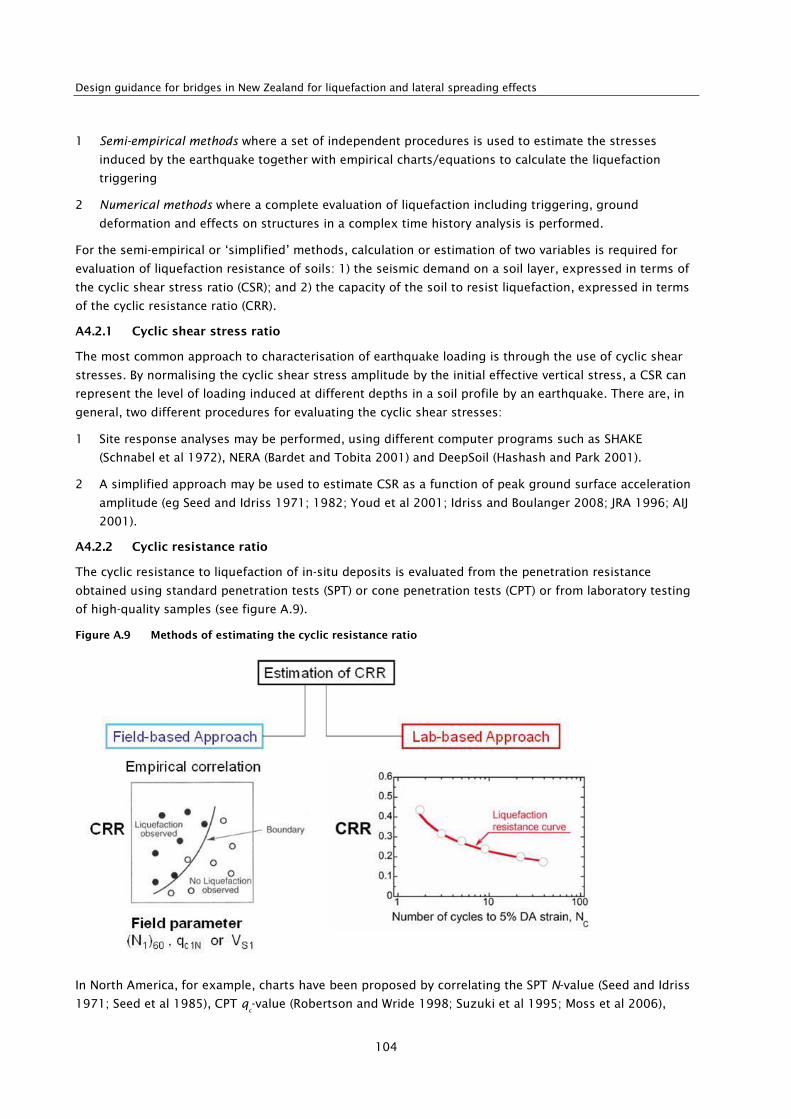
Design guidance for bridges in New Zealand for liquefaction and lateral spreading effects
104
1 Semi-empirical methods where a set of independent procedures is used to estimate the stresses
induced by the earthquake together with empirical charts/equations to calculate the liquefaction
triggering
2 Numerical methods where a complete evaluation of liquefaction including triggering, ground
deformation and effects on structures in a complex time history analysis is performed.
For the semi-empirical or ‘simplified’ methods, calculation or estimation of two variables is required for
evaluation of liquefaction resistance of soils: 1) the seismic demand on a soil layer, expressed in terms of
the cyclic shear stress ratio (CSR); and 2) the capacity of the soil to resist liquefaction, expressed in terms
of the cyclic resistance ratio (CRR).
A4.2.1 Cyclic shear stress ratio
The most common approach to characterisation of earthquake loading is through the use of cyclic shear
stresses. By normalising the cyclic shear stress amplitude by the initial effective vertical stress, a CSR can
represent the level of loading induced at different depths in a soil profile by an earthquake. There are, in
general, two different procedures for evaluating the cyclic shear stresses:
1 Site response analyses may be performed, using different computer programs such as SHAKE
(Schnabel et al 1972), NERA (Bardet and Tobita 2001) and DeepSoil (Hashash and Park 2001).
2 A simplified approach may be used to estimate CSR as a function of peak ground surface acceleration
amplitude (eg Seed and Idriss 1971; 1982; Youd et al 2001; Idriss and Boulanger 2008; JRA 1996; AIJ
2001).
A4.2.2 Cyclic resistance ratio
The cyclic resistance to liquefaction of in-situ deposits is evaluated from the penetration resistance
obtained using standard penetration tests (SPT) or cone penetration tests (CPT) or from laboratory testing
of high-quality samples (see figure A.9).
Figure A.9 Methods of estimating the cyclic resistance ratio
In North America, for example, charts have been proposed by correlating the SPT N-value (Seed and Idriss
1971; Seed et al 1985), CPT qc-value (Robertson and Wride 1998; Suzuki et al 1995; Moss et al 2006),

Appendix A: Mechanism and effects of liquefaction and lateral spreading
105
shear wave velocity (Andrus and Stokoe 1997; 2000) and seismic dilatometer parameters (Monaco et al
2005; Marchetti et al 2008) and the estimates of the CSR of a number sites which had or had not
manifested evidence of liquefaction during major earthquakes in the past (eg Youd et al 2001; Seed et al
2003). By plotting the CSR-(N1)60
(or CSR-qc) pairs for cases in which liquefaction was and was not observed,
a curve that bounds the conditions at which liquefaction has historically been observed can be drawn. This
curve, when interpreted as the maximum CSR for which liquefaction of a soil with a given penetration
resistance can resist liquefaction, can be thought of as a curve of CRR.
In Japan, on the other hand, the results of cyclic shear tests on high-quality undisturbed samples from in-
situ sand deposits are correlated with the penetration resistance obtained at nearby sites to establish the
chart (eg Ishihara 1993; 1996; JRA 1996).
A4.2.3 Factor of safety against liquefaction, FL
The liquefaction potential is usually expressed in terms of factor of safety against liquefaction, FL, and is
given by:
(Equation A.1)
If FL <1.0, the shear stress induced by the earthquake exceeds the liquefaction resistance of the soil and
liquefaction will occur. Otherwise, when FL >1.0, liquefaction will not occur.
A4.2.4 Effective stress analyses
A more detailed investigation of the response of soils to cyclic loading can be performed using effective
stress analyses (ESA). These involve seismic response and liquefaction process modelling using fully
coupled equations for the granular solid and the pore fluid the response of soils (as obtained from
laboratory testing) in terms of generation and dissipation of excess pore water pressure and the
associated development of ground deformation. These are typically implemented through finite element
or finite difference method. Some of the more popular computer programs used are FLAC (Itasca 1998),
PLAXIS (Plaxis bv 2011), DIANA (Diana Analysis 2001).
A4.3 Estimating cyclic ground displacements
As mentioned in section 2.2.2, liquefaction at depth may decouple overlying soil layers from the
underlying ground and allow the upper soil to oscillate back and forth and up and down in the form of
ground waves. This deformation typically occurs in flat ground or gentle slope where lateral permanent
displacement would not occur. These oscillations are usually accompanied by opening and closing of
fissures and fracture of rigid structures such as pavements and pipelines. Such back and forth movement
of the liquefied soil, with the surface crust riding on top, is also a major hazard to pile foundations; hence
estimation of the magnitude of the cyclic component is necessary for efficient design of underground
structures.
However, very few studies have been done to date to estimate the magnitude of cyclic ground
displacements during liquefaction. The only available approach is based on the studies of Tokimatsu and
Asaka (1998) following the 1995 Kobe earthquake. In this method, the peak cyclic displacements are
expressed in terms of simplified charts correlating the maximum cyclic shear strain that develop in the
liquefied layer with the cyclic stress ratio and SPT blow count, as shown in figure A.10. In the figure, Na is
the normalised SPT N-value adjusted for the effect of fines fine content, ie this is the equivalent SPT N-
value for clean sand. That is, Na = (N
1)60,cs
.
CSRCRRFL =

Design guidance for bridges in New Zealand for liquefaction and lateral spreading effects
106
Figure A.10 Relation between maximum cyclic shear strain, cyclic stress ratio and SPT N-value (after Tokimatsu
and Asaka 1998)
In order to determine the peak cyclic deformation, the adjusted SPT N-values, Na, and equivalent CSRs
during earthquake, τav/σ’v0 at various depths are evaluated, from which the cyclic shear strain γcy is
estimated for each depth. Then, the cyclic ground displacement profile fcy(z) is determined by integrating
γcy upwards from the bottom of the liquefied layer, assuming γcy develops in the same direction. A
schematic diagram showing this procedure is shown in figure A.11.
Figure A.11 Schematic diagram illustrating the determination of cyclic ground deformation during earthquake
A4.4 Estimating permanent lateral displacements
Evaluation of permanent lateral ground displacements is a difficult non-linear problem. However, it is
important as the evaluation of the damaging effects of liquefaction at a site requires the ability to predict
the magnitude and spatial distribution of lateral ground displacements. It is worth mentioning that even

Appendix A: Mechanism and effects of liquefaction and lateral spreading
107
though the prediction of whether a site will liquefy can be done with reasonable degree of confidence,
there is no generally accepted method for evaluating lateral displacements. Current methods can be
generally classified as follows:
A4.4.1 Empirical approach
1 The most straightforward approach to estimating horizontal displacements due to liquefaction is to
compile a database of known displacements and to correlate those displacements with measurable
parameters. Note that choosing the parameters which should be considered is a formidable task since
there are many geotechnical, topographical and seismological factors affecting the results. Moreover,
the accurate measurement and compilation of in-situ measurements, and the relevant parameters, is
also difficult.
2 Multiple linear regression analysis was conducted by Bartlett and Youd (1995) to take into account a
great number of variables in the predictive equation. They analysed 43 detailed factors from eight
different earthquakes to account of seismological, geological, topographical and geotechnical effects
on lateral ground displacements due to liquefaction. Youd et al (2002) later corrected and updated the
original analysis, and gave two equations for lateral ground displacement, DH, one for movement down
a gentle slope and another towards a free face, as follows:
For sloping ground relation:
(Equation A.2a)
For free-face relation:
(Equation A.2b)
where M is the earthquake moment magnitude, R is the horizontal distance from the site in question
to the nearest bound of seismic energy source (km), R* is a modified source distance (R* = R + 10(0.89M-
5.64)), W is the ratio of free face height to distance to free face (%), S is ground slope (%), T15
is the
cumulative thickness (m) of saturated sandy layers with normalised SPT N-value (N1)60
<15, F15
is the
average fines content of saturated granular layers within T15
(%) and D5015
is the average mean grain
size (in mm) of layers included in T15
. The above formulas give results comparable to those of
observed displacements within a factor of plus or minus two.
Bardet et al (2002) and Rauch and Martin (2000) also developed empirical models for lateral spreading
displacements based on regression techniques using compiled data from lateral spreading case
histories. Note that these empirical methods of estimating lateral spreading are based on databases
that do not cover the full range of conditions encountered in practice. Their use therefore requires full
awareness of the limits of the supporting case history database. The key shortcoming of these
methods is that they have little physical basis, and for this reason Ashford et al (2011) state that these
methods cannot be extended to approach embankments.
A4.4.2 Semi-empirical approach
Another approach is to estimate the permanent strains that are expected within the liquefied zones and
then integrate those strains over the depth to obtain an estimate of the potential lateral displacement at
)1.050log(795.0)100log(413.3log540.0log592.0012.0*log406.1532.1713.16log
151515 +−−+++−−+−=
DFTWRRMDH
)1.050log(795.0)100log(413.3log540.0log338.0012.0*log406.1532.1213.16log
151515 +−−+++−−+−=
DFTSRRMDH

Design guidance for bridges in New Zealand for liquefaction and lateral spreading effects
108
the ground surface. Then, the lateral displacement is estimated by calibrating the potential displacement
with case history observations.
Thus, the first step in this method is integration of shear strain profiles estimated in conjunction with SPT
and CPT based liquefaction analyses. The maximum potential shear strains may be estimated using
existing relationships, such as the three SPT-based correlations compared in figure A.12. The computed
ground surface displacement is known as the lateral displacement index, or simply LDI. Based on
calibration with case histories, two equations have been proposed for the lateral displacement, LD (Zhang
et al 2004).
For sloping ground:
(Equation A.3a)
For free face:
(Equation A.3b)
In the above equation, H is the free-face height, L is the distance of the target point to free face, and S is
ground slope (%), This method does not account for two- or three-dimensional effects; therefore, the
results for individual borings can be misleading on their own. A benefit of the integration of strain method
is that an estimate of the soil displacement profile is obtained over the depth of the foundation, which can
in turn be used as an analysis input.
Figure A.12 Comparison of the relationship among CSR, SPT, (N1)
60cs and maximum shear strain for three levels
of maximum shear strain (Idriss and Boulanger 2008)
A4.4.3 Direct computation
The direct computation of seismically induced ground displacements has been a topic of interest in the
past few years. Numerous analytical and numerical techniques have been developed, most of which are
based on limit equilibrium, ie if the driving stress is greater than the available strength, the structure
( ) 3.5%` S 0.2%for 2.0 <<⋅+= LDISLD
( ) 40 /4For /6 8.0 <<⋅⋅= − HLLDIHLLD

Appendix A: Mechanism and effects of liquefaction and lateral spreading
109
becomes unstable and some form of displacement will occur until enough resistance is mobilised to
counteract the driving stresses.
One of the earliest and probably the most widely used type of analysis is that proposed by Newmark
(1965). The ground displacement is calculated in this method based on a single degree of freedom system
and rigid plastic soil. The earthquake load is represented by a pseudo-static load. When the earthquake-
induced acceleration is less than a certain critical value, no sliding will occur. However, when the critical
value is exceeded, permanent ground displacement will take place. The displacement is then derived by
doubly integrating the acceleration-time history in excess of the critical value (see figure A.13). Although
the procedure is quite simple, the determination of critical value is complicated and the calculated
displacements depend on the accuracy of this critical acceleration.
Figure A.13 Schematic diagram showing the Newmark sliding block model, with ac=0.2g
Note that the above method is based on rigid body movement of soil. When considering liquefied soil,
however, the absence of rigid soil makes the application of the model difficult. Moreover, in its present
form, the model cannot account for the large strains and displacements that occur within the zone of
liquefaction.
An approach based on the Newmark sliding block model was proposed by Byrne (1990) to incorporate a
more thorough description of post-liquefaction behaviour of sand. In his model, the rigid-plastic spring
was replaced by a non-linear one representing the stiffness of the liquefied layer with its residual strength
incorporated. In this approach, the permanent displacement D is calculated from:

Design guidance for bridges in New Zealand for liquefaction and lateral spreading effects
110
(Equation A.4)
where GL is the shear modulus of the liquefied soil, S
r is the residual strength of the liquefied soil, γlim is
the limiting shear strain, TL is the thickness of liquefied layer, τst is the average shear stress required for
static equilibrium, m is the mass of soil above the failure surface and v0 is the velocity of the mass at the
instant of liquefaction. The first part of equation A.4 is a cubic equation which can be solved using
Newton’s equation.
A4.4.4 Finite element method (FEM) based approach
Recent trends in computing liquefaction-induced ground deformations involve representing the behaviour
of liquefied soil through constitutive models and applying them through finite element-based numerical
techniques. One early technique proposed by Lee (1974) is based on the assumption that the deformation
is due to softening of the soil as a result of seismic shaking so that after the earthquake, the deposit will
deform to a new condition compatible with the new softened stiffness of the soil. The softened
parameters are based on laboratory tests in which the in-situ stress conditions before and during the
earthquake are simulated. Finite element analyses are then performed using the normal and
reduced/softened moduli to calculate the liquefaction-induced ground displacement.
However, many of the present available techniques in evaluating permanent displacements employ non-
linear dynamic stress-strain behaviour of soil in conjunction with plasticity theory. At present, a number of
numerical codes (with appropriate constitutive models for soils) exist to model the post-liquefaction
behavior of soils, eg DIANA, FLIP, TARA, ADINA. An exhaustive compilation of the state-of-the-art work in
this area can be found in the proceedings of the VELACS meeting (Arulanandan and Scott 1993). A typical
FEM-based result is shown in figure A.14.
Figure A.14 Calculating for ground displacements by finite element analysis
( )
( ) Lstr
LrLLL
LstL
LL
TDS
TSTTGmvD
TDmvDT
TGD
limlim
2lim
20
lim20
lim
3
6))(/(23
021
3)/(
γτ
γγ
γτγ
≥−
+−=
<=−−
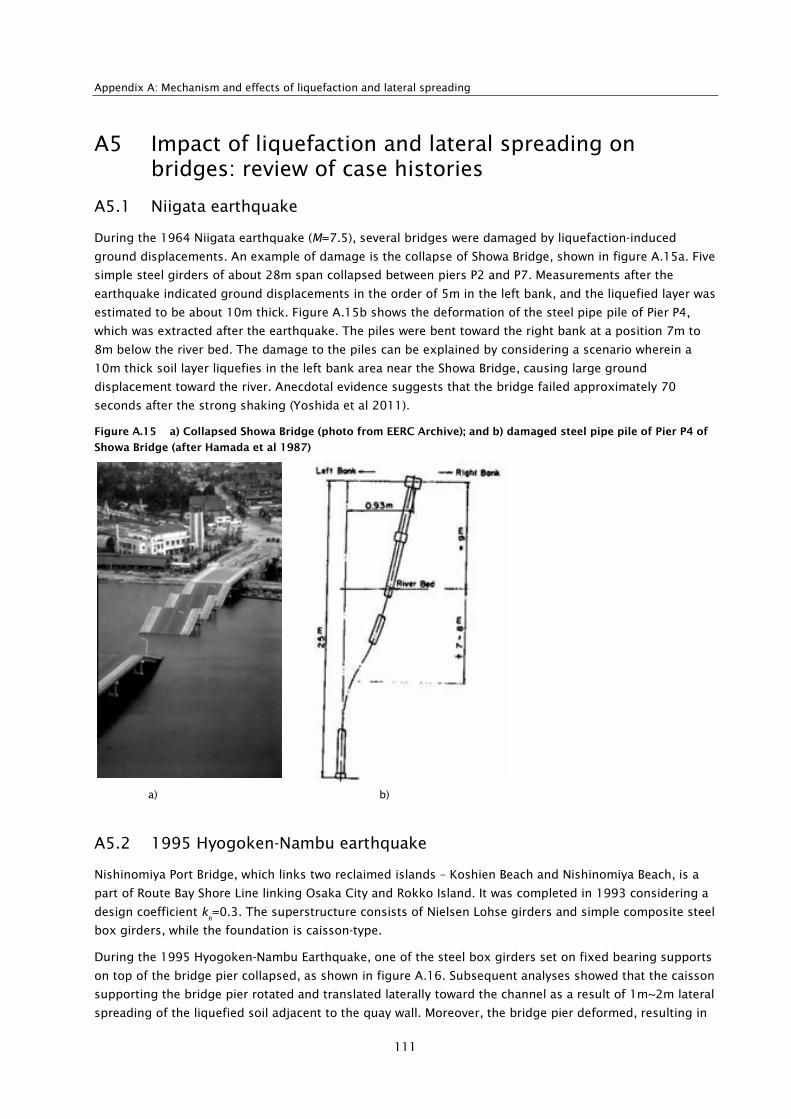
Appendix A: Mechanism and effects of liquefaction and lateral spreading
111
A5 Impact of liquefaction and lateral spreading on bridges: review of case histories
A5.1 Niigata earthquake
During the 1964 Niigata earthquake (M=7.5), several bridges were damaged by liquefaction-induced
ground displacements. An example of damage is the collapse of Showa Bridge, shown in figure A.15a. Five
simple steel girders of about 28m span collapsed between piers P2 and P7. Measurements after the
earthquake indicated ground displacements in the order of 5m in the left bank, and the liquefied layer was
estimated to be about 10m thick. Figure A.15b shows the deformation of the steel pipe pile of Pier P4,
which was extracted after the earthquake. The piles were bent toward the right bank at a position 7m to
8m below the river bed. The damage to the piles can be explained by considering a scenario wherein a
10m thick soil layer liquefies in the left bank area near the Showa Bridge, causing large ground
displacement toward the river. Anecdotal evidence suggests that the bridge failed approximately 70
seconds after the strong shaking (Yoshida et al 2011).
Figure A.15 a) Collapsed Showa Bridge (photo from EERC Archive); and b) damaged steel pipe pile of Pier P4 of
Showa Bridge (after Hamada et al 1987)
a) b)
A5.2 1995 Hyogoken-Nambu earthquake
Nishinomiya Port Bridge, which links two reclaimed islands – Koshien Beach and Nishinomiya Beach, is a
part of Route Bay Shore Line linking Osaka City and Rokko Island. It was completed in 1993 considering a
design coefficient kh=0.3. The superstructure consists of Nielsen Lohse girders and simple composite steel
box girders, while the foundation is caisson-type.
During the 1995 Hyogoken-Nambu Earthquake, one of the steel box girders set on fixed bearing supports
on top of the bridge pier collapsed, as shown in figure A.16. Subsequent analyses showed that the caisson
supporting the bridge pier rotated and translated laterally toward the channel as a result of 1m~2m lateral
spreading of the liquefied soil adjacent to the quay wall. Moreover, the bridge pier deformed, resulting in

Design guidance for bridges in New Zealand for liquefaction and lateral spreading effects
112
a total lateral displacement of the top of pier by 87cm. Such large lateral displacement caused the collapse
of one of the steel box girders.
Figure A.16 Collapsed girder of Nishinomiya Port Bridge
Large-diameter piles supporting massive bridge structures and storage tanks in proximity to the
revetment line also suffered serious damage due to liquefaction and spreading (Ishihara and Cubrinovski
1998). A typical example of such damage was seen in Pier 211 of the Hanshin Bay Route no. 5 which was
located in the southernmost part of Uozakihama Island. Side views of Pier 211 and a plan view of its
foundation are shown in figure A.17a (HHA 1996). The pier was supported on 22 cast-in-place RC piles,
1.5m in diameter and 41.5m long. The damage to the piles summarised from borehole camera recordings
of two inspected piles is shown in figure A.17b. The damage at the pile head was supposedly caused both
by spreading loads and by inertial loads from the superstructure during the intense ground shaking. By
and large, however, the cracks were predominantly found at depths corresponding to the interface
between the liquefied layer and the underlying non-liquefied layer. This type of damage was typically
observed in piles located near the waterfront and it could be attributed solely to the excessive lateral
ground movement due to spreading.
A5.3 1995 Kobe earthquake
The following summary of typical liquefaction (spreading)-induced damage to pile foundations in the 1995
Kobe earthquake is adapted from Cubrinovski (2006).
A large number of pile foundations of buildings, storage tanks and bridge piers located in the waterfront
area of Kobe were damaged in the earthquake (eg Ishihara and Cubrinovski 1998; 2004; JGS 1998;
Tokimatsu and Asaka 1998). In order to inspect the damage to piles, detailed field investigations have
been conducted on selected piles by means of several inspection techniques. For example, features of the
damage were investigated by lowering a borehole video camera down the hole of pre-cast hollow-
cylindrical piles to examine the development of cracks around the pile-wall. In the case of cast-in-place RC
piles, a hole was first drilled into the piles and then a video camera was lowered into the hole to inspect
the distribution of cracks. In addition, a survey of pile deformation was carried out by lowering an
inclinometer down the hole; by integrating the measured data on tilts through the depth, the lateral
displacement and hence deformation of the pile was obtained. In some cases, the top part of the pile
foundation was exposed by excavating the surface soils and visual inspection of the damage to the pile
head was then carried out. Characteristic damage features of piles located within the lateral spreading
zone are briefly described below by using three representative case histories.

Appendix A: Mechanism and effects of liquefaction and lateral spreading
113
A5.3.1 Mikagehama tank TA7
The performance of the pile foundation of an oil-storage tank, with a diameter of approximately 15m and
capacity of 2450kl, was investigated in detail by Ishihara and Cubrinovski (2004). The tank, which was
located about 25m to 40m inland from the quay walls, was supported on 69 pre-stressed high-strength
concrete piles, 23m long and 45cm in outer diameter. A cross-sectional view of the tank and its
foundation is shown in figure A.17a. During the earthquake, extensive liquefaction developed in the
reclaimed soils with a seaward movement of the quay wall of about 1m and consequent lateral spreading
in the backfills. It was estimated that the permanent lateral ground displacement, at a distance
corresponding to the location of the tank, was about 30cm to 60cm. After the earthquake, two of the piles
were investigated using the aforementioned inspection methods. The outcome of the borehole camera
recordings is summarised in figure A.17b where the observed distribution of cracks is shown for the
inspected piles. The piles developed multiple cracks and suffered the worst damage at a depth of
approximately 12m to 14m, which corresponds to the depth at the interface between the liquefied layer
and the underlying non-liquefied layer.
Figure A.17 Mikagehama tank TA72: a) side view of the tank and its foundation; b) observed damage to piles
A5.3.2 Uozakihama Bridge Pier 211
Large-diameter piles supporting massive bridge structures and storage tanks in proximity to the
revetment line also suffered serious damage due to liquefaction and spreading (Ishihara and Cubrinovski
1998). A typical example of such damage was seen in Pier 211 of the Hanshin Bay Route no. 5 which was

Design guidance for bridges in New Zealand for liquefaction and lateral spreading effects
114
located in the southernmost part of Uozakihama Island. Side views of Pier 211 and a plan view of its
foundation are shown in figure A.18a (HHA 1996). The pier was supported on 22 cast-in-place RC piles,
1.5m in diameter and 41.5m long. The damage to the piles summarised from borehole camera recordings
of two inspected piles is shown in figure A.18b. The damage at the pile head was supposedly caused both
by spreading loads and by inertial loads from the superstructure during the intense ground shaking. By
and large, however, the cracks were predominantly found at depths corresponding to the interface
between the liquefied layer and the underlying non-liquefied layer. This type of damage was typically
observed in piles located near the waterfront and it could be attributed solely to the excessive lateral
ground movement due to spreading.
Figure A.18 Uozakihama Bridge Pier 211: a) side view of the pier and plan view of its foundation; b) observed
damage to piles (Hanshin Highway Authority 1996)
A5.3.3 Higashi-Nada building
The last case history to be introduced is that of a pile foundation of a three-story building in Higashi-Nada
(Tokimatsu and Asaka 1998). The building was located 6m from the quay wall and was supported by 38
prestressed concrete piles, 40cm in diameter and about 20m long. A cross-sectional view of the building
and its foundation is shown in figure A.19a while a plan view of the foundation is shown in figure A.19b.
The permanent spreading displacements at the site of the building have been estimated at about 80cm to
100cm while detailed inspections of two of the piles revealed serious damage to the piles at the pile head
and at a depth corresponding to the interface between the liquefied layer and the underlying non-liquefied
layer. The largest damage was found for the pile in proximity to the quay wall, which suffered failure
about 3m to 4m below the pile top, as indicated in figure 6a. Tokimatsu and Asaka (1998) have shown
that this failure pattern could be induced by pile-group effects or cross-interaction of piles subjected to
variable magnitudes of lateral ground displacement.
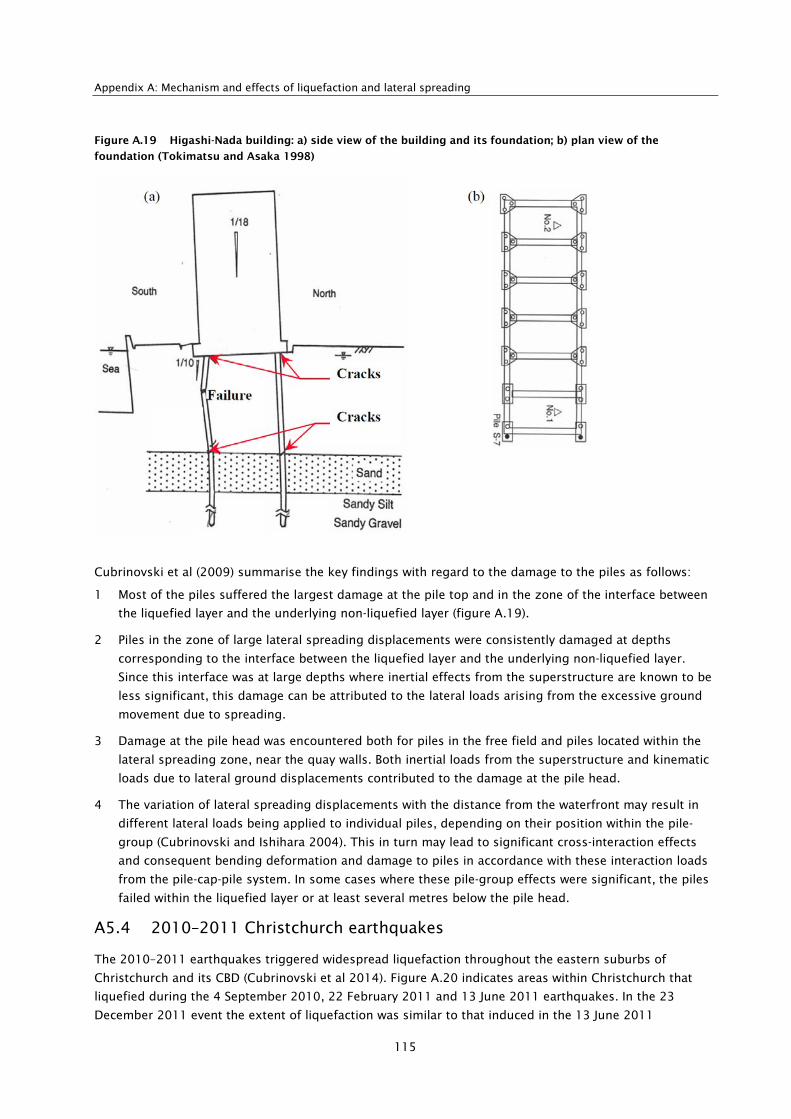
Appendix A: Mechanism and effects of liquefaction and lateral spreading
115
Figure A.19 Higashi-Nada building: a) side view of the building and its foundation; b) plan view of the
foundation (Tokimatsu and Asaka 1998)
Cubrinovski et al (2009) summarise the key findings with regard to the damage to the piles as follows:
1 Most of the piles suffered the largest damage at the pile top and in the zone of the interface between
the liquefied layer and the underlying non-liquefied layer (figure A.19).
2 Piles in the zone of large lateral spreading displacements were consistently damaged at depths
corresponding to the interface between the liquefied layer and the underlying non-liquefied layer.
Since this interface was at large depths where inertial effects from the superstructure are known to be
less significant, this damage can be attributed to the lateral loads arising from the excessive ground
movement due to spreading.
3 Damage at the pile head was encountered both for piles in the free field and piles located within the
lateral spreading zone, near the quay walls. Both inertial loads from the superstructure and kinematic
loads due to lateral ground displacements contributed to the damage at the pile head.
4 The variation of lateral spreading displacements with the distance from the waterfront may result in
different lateral loads being applied to individual piles, depending on their position within the pile-
group (Cubrinovski and Ishihara 2004). This in turn may lead to significant cross-interaction effects
and consequent bending deformation and damage to piles in accordance with these interaction loads
from the pile-cap-pile system. In some cases where these pile-group effects were significant, the piles
failed within the liquefied layer or at least several metres below the pile head.
A5.4 2010–2011 Christchurch earthquakes
The 2010–2011 earthquakes triggered widespread liquefaction throughout the eastern suburbs of
Christchurch and its CBD (Cubrinovski et al 2014). Figure A.20 indicates areas within Christchurch that
liquefied during the 4 September 2010, 22 February 2011 and 13 June 2011 earthquakes. In the 23
December 2011 event the extent of liquefaction was similar to that induced in the 13 June 2011

Design guidance for bridges in New Zealand for liquefaction and lateral spreading effects
116
earthquake. The liquefaction map for the Christchurch earthquake indicates the location and severity of
liquefaction manifestation, though the severity was non-uniform and variable even within one colour zone.
The Christchurch liquefaction was arguably one of the most extensive and severe liquefaction in native
soils on record. Over 400,000 metric tons of silt/sand ejecta was removed in the (partial) clean-up of the
streets and properties after the Christchurch earthquake. In the worst-hit areas widespread liquefaction
occurred in multiple events, with many sites severely liquefying three or four times during the 2010–2011
earthquake sequence (Cubrinovski et al 2011).
Although structural failure of commercial buildings led to the greatest casualties in the 2011 M6.3
Christchurch earthquake, by far the most significant damage to residential buildings, bridges and other
lifelines in the Canterbury earthquakes was the result of liquefaction and associated ground deformations.
Liquefaction occurred in areas which are known to have a high potential to liquefy – former river channels,
abandoned meanders, wetlands and ponds. Immediately following some of the largest aftershocks from
the 2010 M7.1 earthquake, liquefaction re-occurred in some of these areas. During the 2011 M6.3
earthquake, liquefaction was more widespread and vents continued to surge during the aftershocks
immediately after the event. The impact of sand boils and cracks caused by lateral spreading was that
parts of the suburbs were inundated with sand and silt – in places there were layers of ejected soil that
were many tens of centimetres thick.
There are over 800 road, rail and pedestrian bridges in Christchurch and the surrounding region. Road
bridges, which are the subject of this paper, are typically two or three span, short- to moderate-length
bridges (20m to 70m long). Overall, in the 2010–2011 earthquakes, road bridges performed relatively well
compared with other engineering structures (Palermo et al 2011; Wotherspoon et al 2011). They suffered
low to moderate damage and all bridges but one were in service almost immediately after each significant
event. A general overview of the damage to road bridges (longer than 10m) in the urban area of
Christchurch, as judged by visual inspections of Opus engineers for Christchurch City Council (CCC 2011),
is depicted in figure A.20.
A5.4.1 Damage to bridges in non-liquefied areas
The Darfield earthquake did not cause any significant damage to bridges in non-liquefied areas (Palermo
et al 2010) while a small number of bridges suffered damage in such areas in the Christchurch
earthquake. The three-span Horotane Valley Overpass, a twin bridge located ~1.5km from the source of
the Christchurch earthquake, suffered abutment damage due to incipient slope failure of the approach
embankments and fine cracking on the lower half of all piers. Bolts attaching the deck beams to the
abutment seat extension had sheared off, and the ties between spans and at the abutments had elongated
and pulled out. There was only minor damage to this bridge during the Darfield earthquake. The six-span
Port Hills Overpass, a twin bridge less than 200m from the Horotane Overbridge, developed flexural
cracking on the lower half of the majority of its piers due to transverse ground shaking, and the linkages
between the span and the abutments had elongated.

Appendix A: Mechanism and effects of liquefaction and lateral spreading
117
Figure A.20 Overview of bridge damage as determined for the Christchurch City Council after 22 February 2011
by Opus International Consultants (CCC 2011); the liquefaction map and case study bridges are also shown
(Cubrinovski et al 2014)
The most significant bridge damage outside liquefied areas in the Christchurch earthquake was to the
Moorhouse Avenue Overpass, an 11-span reinforced concrete (RC) structure on the southern edge of the
CBD. The structure was constructed in three separate sections, with expansion joints passing down the
centre of two sets of piers. Steel rod linkages were later installed across the western expansion joint, tying
the central and western sections together. The absence of linkages at the eastern expansion joint resulted
in an irregular transverse response during the earthquake and a higher displacement demand, leading to
significant shear cracking and buckling of the piers at the eastern expansion joint, affecting vertical and
lateral load carrying capacity. The columns had widely spaced transverse reinforcement, making the
structure susceptible to a brittle failure mechanism. Deck pounding at the eastern abutment also resulted
in spalling and bar buckling in the deck girders. The overpass was closed for more than five weeks
following the earthquake while temporary strengthening work was carried out (Wotherspoon et al 2011).
A5.4.2 Structural issues
Although the Canterbury earthquakes did not cause the collapse of any bridges, some structural issues
emerged:
• Integral cast-in-place bridges, typically constructed prior to the 1950s performed better than precast
concrete bridges. The sturdy configuration of these bridges minimised the transverse column drift
demand of the Canterbury earthquakes to less than 0.5%.
• Plastic hinges in the bridge columns have been properly detailed and in many cases the damage was
limited to concrete spalling and initiation of yielding of the bars.
• Deck linkages are quite widely adopted in New Zealand as part of the New Zealand Retrofit Program
(Chapman et al 2005); their function is limited to prevent deck unseating. Bridges in Christchurch
retrofitted with linkages and bolts performed well, even though some failures were recorded between
the deck and the abutment due to slope failure or liquefaction-induced displacements.

Design guidance for bridges in New Zealand for liquefaction and lateral spreading effects
118
A5.4.3 Damage to bridges in liquefied areas
Most of the damage to bridges was due to liquefaction of the foundation soils and lateral spreading of the
river banks. On the Avon River, practically all road bridges downstream of the Fitzgerald Bridge (figure
A.21) were substantially affected by lateral spreading.
Figure A.21 shows an aerial view of the four bridges (case studies) presented herein: a) Fitzgerald Bridge,
b) Dallington (Gayhurst) Bridge, c) ANZAC Bridge and d) South Brighton Bridge. The solid lines indicate the
locations of the transects along which lateral spreading measurements were conducted by the ground
surveying method, with the numbers at the tip of the transects indicating the maximum displacements
at/near the river banks measured after the Christchurch earthquake and Darfield earthquake (in brackets).
Also shown in the figure in a summary form are ground displacements estimated on the basis of LiDAR
data (CERA 2012). There are several important observations from the data in figure A.21. First, the data
obtained from the ground surveying and LiDAR are consistent with each other and show similar
displacements for all cases. Second, the Darfield earthquake caused spreading displacements of the order
of 30cm–60cm and 80cm–100cm at the river banks near the Dallington and South Brighton bridges
respectively, but no substantial spreads at Fitzgerald and ANZAC bridges. All four bridges were affected
by substantial spreading in the Christchurch earthquake which is consistent with the extreme liquefaction
and higher seismic demand generated by this event. Finally, it is apparent in figure A.21 that for both
meandering loops at the Fitzgerald Bridge and Dallington Bridge large ground displacements of 50cm–
100cm occurred in the point bar deposits on the north banks while much smaller movements of less than
20cm were observed in the cut-banks on the south side of the river. This feature was clearly reflected in
the level of damage sustained at the north approach/abutment (heavy) and south approach/abutment
(light damage) of these bridges.
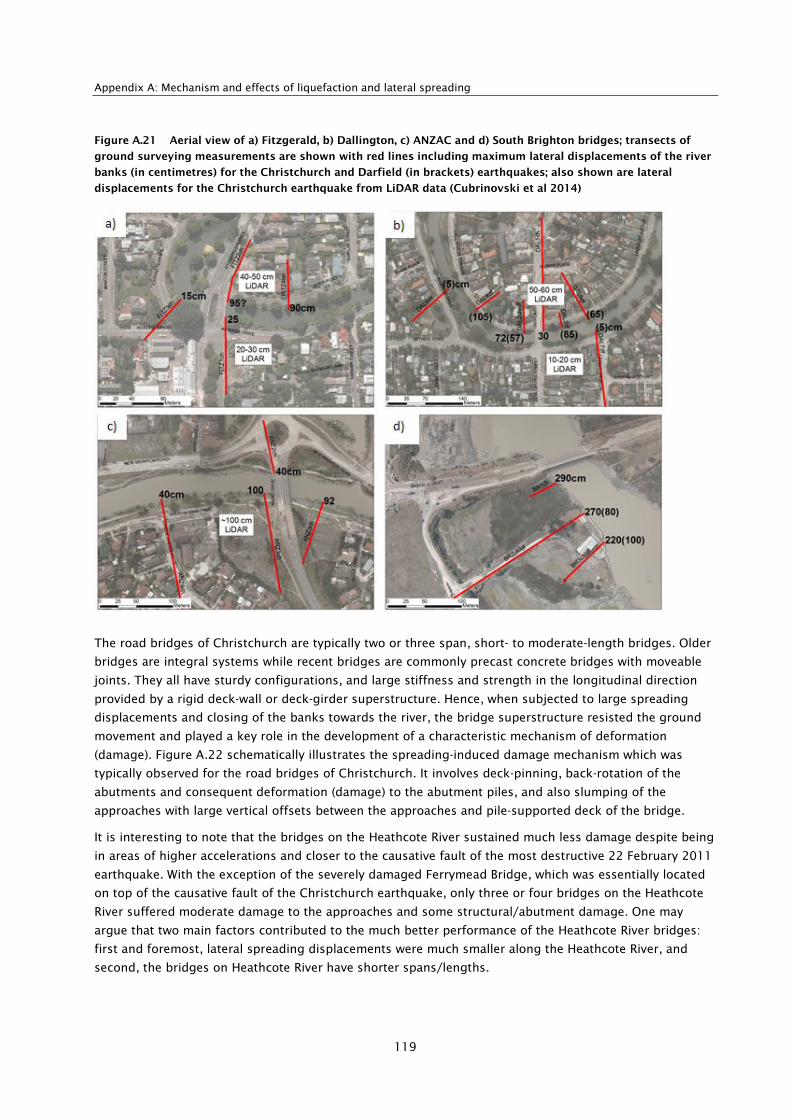
Appendix A: Mechanism and effects of liquefaction and lateral spreading
119
Figure A.21 Aerial view of a) Fitzgerald, b) Dallington, c) ANZAC and d) South Brighton bridges; transects of
ground surveying measurements are shown with red lines including maximum lateral displacements of the river
banks (in centimetres) for the Christchurch and Darfield (in brackets) earthquakes; also shown are lateral
displacements for the Christchurch earthquake from LiDAR data (Cubrinovski et al 2014)
The road bridges of Christchurch are typically two or three span, short- to moderate-length bridges. Older
bridges are integral systems while recent bridges are commonly precast concrete bridges with moveable
joints. They all have sturdy configurations, and large stiffness and strength in the longitudinal direction
provided by a rigid deck-wall or deck-girder superstructure. Hence, when subjected to large spreading
displacements and closing of the banks towards the river, the bridge superstructure resisted the ground
movement and played a key role in the development of a characteristic mechanism of deformation
(damage). Figure A.22 schematically illustrates the spreading-induced damage mechanism which was
typically observed for the road bridges of Christchurch. It involves deck-pinning, back-rotation of the
abutments and consequent deformation (damage) to the abutment piles, and also slumping of the
approaches with large vertical offsets between the approaches and pile-supported deck of the bridge.
It is interesting to note that the bridges on the Heathcote River sustained much less damage despite being
in areas of higher accelerations and closer to the causative fault of the most destructive 22 February 2011
earthquake. With the exception of the severely damaged Ferrymead Bridge, which was essentially located
on top of the causative fault of the Christchurch earthquake, only three or four bridges on the Heathcote
River suffered moderate damage to the approaches and some structural/abutment damage. One may
argue that two main factors contributed to the much better performance of the Heathcote River bridges:
first and foremost, lateral spreading displacements were much smaller along the Heathcote River, and
second, the bridges on Heathcote River have shorter spans/lengths.

Design guidance for bridges in New Zealand for liquefaction and lateral spreading effects
120
Figure A.22 Schematic illustration of the characteristic spreading-induced deformation (damage) mechanism of
short-span bridges involving deck-pinning with consequent back-rotation of abutments, damage to abutment
piles, and slumping of the approaches (Cubrinovski et al 2014)
A5.4.4 Liquefaction-induced damage to bridges: case studies
For clarity of presentation, the damage to the South Brighton Bridge, at the mouth of the Avon River is first
described followed by a description of the spreading-induced damage to Dallington (Gayhurst), Fitzgerald
and ANZAC bridges. Even though only a small group of bridges is considered, they cover a wide age span
(from 1954 to 2000) and varying structural systems (integral bridges and bridges with movable deck
joints). Importantly, they clearly illustrate the typical deformation mechanism and damage associated with
lateral spreading.
South Brighton Bridge
The South Brighton Bridge is located at the entry of the Avon River into the estuary (figure A.23). The three
span (65m long) RC bridge was constructed in 1980. It runs approximately in the east-west direction. The
bridge superstructure consists of cast in-situ RC deck on precast ‘I’ beams, and is supported through
elastomeric bearings on two octagonal ‘hammerhead’ RC piers and seat-type RC abutments. The
foundations of the bridge consist of 44 precast concrete piles, 10 beneath each abutment and 12 beneath
each pier (CCC, private communication 2011). The octagonal piles are 450mm wide, either vertical or
raked (4 on 1), and are rigidly connected to the abutments or the pile caps at the piers. The abutment
piles are 18.7m long while those beneath the piers are 13.3m long.
The bridge site is in a wetland area (figure A.23a), where the thickness of recently deposited soils is
~40m. Approximately 4m high embankments of uncontrolled fill material were constructed at both
approaches. At the east abutment/approach, except for the variable top soil of sandy silt, fill and lenses of
peat up to 2m depth, the soil profile consists of uniform fine and medium sands, which are relatively loose
in the top 5m–6m, and then medium dense at greater depths down to at least 25m depth (Cubrinovski et
al 2013). Preliminary analyses based on SPT and CPT procedures indicate that the top 8m of the deposit
below the water table liquefied in the Christchurch earthquake with some partial liquefaction and limited
shear strains developing at larger depths. As shown in figure A.21, permanent lateral ground
displacements of 2.9m were measured approximately 23m to the south of the west abutment of the
bridge, after the Christchurch earthquake.
Large ground distortion and slumping of the approaches was evident on both sides of the bridge. The
slumping resulted in large settlement of the approaches and vertical offset between the pile-supported
bridge deck and embankment approaches resting on soft native soils. The slumping was accompanied by
spreading of the approaches both towards the river but also down the slope of the embankments (parallel
to the river). Unlike the unconstrained spreading of the river banks, the deformation and movement of the
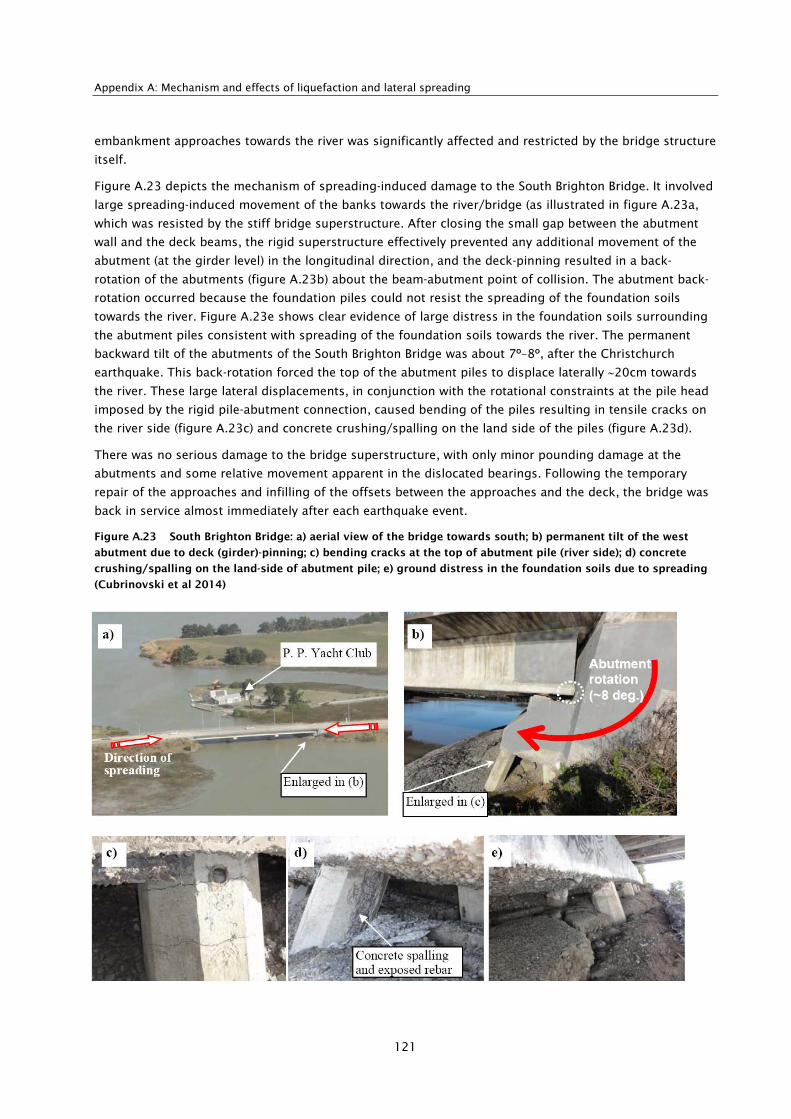
Appendix A: Mechanism and effects of liquefaction and lateral spreading
121
embankment approaches towards the river was significantly affected and restricted by the bridge structure
itself.
Figure A.23 depicts the mechanism of spreading-induced damage to the South Brighton Bridge. It involved
large spreading-induced movement of the banks towards the river/bridge (as illustrated in figure A.23a,
which was resisted by the stiff bridge superstructure. After closing the small gap between the abutment
wall and the deck beams, the rigid superstructure effectively prevented any additional movement of the
abutment (at the girder level) in the longitudinal direction, and the deck-pinning resulted in a back-
rotation of the abutments (figure A.23b) about the beam-abutment point of collision. The abutment back-
rotation occurred because the foundation piles could not resist the spreading of the foundation soils
towards the river. Figure A.23e shows clear evidence of large distress in the foundation soils surrounding
the abutment piles consistent with spreading of the foundation soils towards the river. The permanent
backward tilt of the abutments of the South Brighton Bridge was about 7º–8º, after the Christchurch
earthquake. This back-rotation forced the top of the abutment piles to displace laterally ∼20cm towards
the river. These large lateral displacements, in conjunction with the rotational constraints at the pile head
imposed by the rigid pile-abutment connection, caused bending of the piles resulting in tensile cracks on
the river side (figure A.23c) and concrete crushing/spalling on the land side of the piles (figure A.23d).
There was no serious damage to the bridge superstructure, with only minor pounding damage at the
abutments and some relative movement apparent in the dislocated bearings. Following the temporary
repair of the approaches and infilling of the offsets between the approaches and the deck, the bridge was
back in service almost immediately after each earthquake event.
Figure A.23 South Brighton Bridge: a) aerial view of the bridge towards south; b) permanent tilt of the west
abutment due to deck (girder)-pinning; c) bending cracks at the top of abutment pile (river side); d) concrete
crushing/spalling on the land-side of abutment pile; e) ground distress in the foundation soils due to spreading
(Cubrinovski et al 2014)
Design guidance for bridges in New Zealand for liquefaction and lateral spreading effects
122
Dallington (Gayhurst) Bridge
The Dallington Bridge is located on the Avon River approximately 1km to the east of the CBD (figure A.24).
It is an integral bridge consisting of a continuous RC deck, RC piers and RC abutment walls with wing
walls. The bridge is only 26.8m long and has three spans (8.2m, 10.4m and 8.2m respectively) without
any expansion joints. Both the piers and abutments are supported on square reinforced concrete piles
350mm in width and 10.4m in length. Seven piles at 4D spacing are used beneath the piers, while six piles
at 6D spacing support each abutment. The bridge was constructed in 1954.
The Dallington Bridge runs approximately in the north-south direction. The bridge spans point bar
deposits on the north side and cut-banks on the south side of the bridge. At the north (point bar) side, the
soil profile consists of 2.5m of top soil (brown sandy silt and silt with some peat), overlying a grey fine
sand (with occasional gravelly sands) that reaches up to about 15m depth, sandy silt from 15m–20m
depth and fine sand from 20m–24m depth. The fine sand from 2.5m to approximately 9m depth is loose,
with consistently low CPT resistance (qc ≈ 5 MPa). The bearing stratum of the piles is the underlying dense
sand layer at about 13m–16m depth. The penetration resistance is much higher at the south side of the
bridge, which is consistent with the significant contrast in liquefaction manifestation, lateral spreading
effects and bridge damage that was observed between the north and south approaches of the bridge. On
the north side (in the suburb of Dallington), severe liquefaction occurred repeatedly during all major
2010–2011 earthquakes with spreading displacements of the river banks of 30m–70cm. The spreading
was accompanied by large ground distortion and subsidence of the northern approach of the bridge of
about 1m (figure A.24a). Conversely, there was very little evidence of land damage on the south (cut-bank)
side and approach of the bridge (figure A.24b).
The bridge suffered the same characteristic damage mechanism outlined above involving spreading, deck-
pinning and back-rotation of the abutment walls. The effects of this mechanism are evident in figure A.24c
which shows large differential movements and failure of the north wing wall of the bridge. The inward
rotation of the north abutment wall was about 1.2º or five times less than the permanent tilt observed for
the abutments of the South Brighton Bridge, which reflects the rigidity of the integral bridge structure.
Further detailed inspections confirmed a formation of a wide crack at the connection between the deck
and the abutment, which led to yielding of the top bars of the deck.

Appendix A: Mechanism and effects of liquefaction and lateral spreading
123
Figure A.24 Dallington (Gayhurst) Bridge: a) subsidence of ~1m at the north approach (point-bar deposit); b) no
visible damage or ground distress at the south approach (cut-banks); c) failure of the north wing wall due to
large differential movements between the adjacent river banks and the abutment wall (Cubrinovski et al 2014)
Fitzgerald Bridge
The Fitzgerald Bridge (two span, 28m long, constructed in 1964) was originally of segmental design with
expansion joints between the spans and approaches, but was later retrofitted with steel gusset plates
rigidly connecting the deck beams to the central pier and abutments in an attempt to create an integral
bridge system. As previously discussed, the northern abutment of the bridge is on the inside bank of the
river bend where substantial lateral spreading occurred (figure A.25a). As shown in figure A.25b, a
permanent inward-tilt of ∼7.5º was observed at the northeast abutment. At this abutment, the settlement
and lateral movement of the foundation soils towards the river exposed the top of the abutment piles
(figure A.25c). The easternmost pile (raked at 1:4) had completely sheared through at the connection with
the abutment exposing the reinforcing bars.

Design guidance for bridges in New Zealand for liquefaction and lateral spreading effects
124
Figure A.25 Fitzgerald Bridge: a) sketch of spreading details north of Fitzgerald Bridge, and b) and d)
permanent tilt and damage of the northeast abutment and pile (Haskell et al 2013); c) failure of the northeast
pile (Cubrinovski et al 2014)
Anzac Bridge
The ANZAC Bridge is located in the Burwood-Bexley wetland area on the Woolston-Burwood expressway.
The bridge runs approximately in a north-south direction and has a roundabout at the north approach
(figure A.26a). The 48m long three-span bridge was constructed in 2000. The superstructure consists of a
precast concrete hollow-core (double) deck and precast concrete beams, and is supported on in-situ
concrete piers and abutments. The 1m by 1m rhomboid piers are founded on circular reinforced concrete
piles, 1.5m in diameter with 8mm thick permanent steel casing (NZ Transport Agency 2011). The piles are
20m long and at a spacing of 4.7D. Each abutment is supported on 16 steel ‘H’ piles (310 x 133). The
piles are 22m long (reaching the same depth as the pier piles) and are at 1.5m spacing.
Massive liquefaction occurred in the area of the bridge during the Christchurch earthquake, as illustrated
in figure A.26a where large volumes of sand ejecta are seen on the south side of the bridge. There was a
clear evidence of substantial lateral spreading towards the river, with large cracks and fissures in the
ground running parallel to the river (figure A.26c). Permanent lateral spreading displacements of 0.9m–
1.1mm were measured at the river banks adjacent to the south abutment. On the north side, the
roundabout affected the spreading both with its stiffness and topographic feature, and hence the
magnitude of lateral spreading displacements was inconclusive, but likely to be around 40cm or slightly
greater.
d)

Appendix A: Mechanism and effects of liquefaction and lateral spreading
125
Again the same characteristic damage mechanism depicted in figure A.22 was evident at the ANZAC
Bridge. Figure A.26b illustrates the movements at the south abutment with the red arrow indicating an
inward tilt of the abutment of about 6º. The horizontal arrows and associated displacements indicate
permanent lateral displacements at the bottom of the abutment (top of the H-piles) due to back-rotation of
the abutment, lateral offset of the precast concrete underpass, and lateral offset of the surrounding soil at
the interface between the paved track and the RC underpass. These displacements infer a horizontal
displacement at the top of the piles of about 20cm (ie 16cm due to abutment rotation, and 3cm–4cm
displacement required to close the gap between the abutment and the deck-girder). Note that the
pedestrian underpasses were founded on independent foundations consisting of 1.2m diameter RC piles.
These piles are only 6m long, and they effectively floated in the liquefied soils, moving together with the
surrounding foundation soils. The lateral displacements of the south underpass relative to the abutment
were about 20cm at its edges and 50cm–60cm in its central part (Cubrinovski et al 2013). By
superimposing these displacements, one can infer lateral displacements of the foundation soils
surrounding the abutment piles of 40cm–80cm, which are substantially less than the 1m displacement of
the river banks in the free field.
The spreading-induced damage caused slumping of the approaches which required immediate
repair/infilling due to the large vertical offsets between the deck and the approaches (figure A.26d). The
superstructure sustained some visible damage with pronounced cracking of the interior beam-pier
connection (figure A.26e) and concrete spalling due to excessive compression at exterior beam-pier
connections. Rebar in the bridge deck was also exposed due to deck-abutment pounding; however, this
structural damage was not serious and the bridge remained in service after each earthquake.
Figure A.26 ANZAC Bridge: a) aerial view towards north (massive sand ejecta on the south banks, and the
roundabout at the north approach of the bridge); b) back-rotation of the abutment (red arrow) with permanent
lateral displacements of the abutment base, adjacent pedestrian underpass and surrounding foundation, and
free-field soils; c) evidence of large lateral spreading displacements towards the river; d) temporary repair of the
south approach; (e) cracks of interior beam-pier joint (Cubrinovski et al 2014)
Design guidance for bridges in New Zealand for liquefaction and lateral spreading effects
126
A5.4.5 Conclusions from Cubrinovski et al (2014)
The Canterbury earthquakes triggered widespread liquefaction over approximately one third of the
Christchurch area. Along the Avon River, the liquefaction was accompanied by substantial lateral spreads
which affected practically all bridges downstream from the CBD. The road bridges at river crossings are
two-to-three span, short- to moderate-length bridges with rigid superstructure. Thus, when subjected to
large spreading displacements of the river banks, the bridge superstructure resisted the ground
movement and led to the development of a characteristic damage mechanism involving deck-pinning,
abutment back-rotation and damage of the abutment piles. The key findings from the case studies are:
• Both segmental and integral bridges exhibited the same characteristic deformation/damage
mechanism. Permanent inward tilts of the abutments of ~6º to 8º were observed for segmental
bridges, while the back rotation was smaller for integral bridges. The abutment back-rotation resulted
in permanent lateral displacements (as large as 20cm–30cm) and damage at the top of the abutment
piles.
• The damage involved slumping of the approaches and large vertical offsets between the approaches
and the pile-supported deck. Large spreading displacements and subsidence of the approaches were
observed particularly at point bar deposits on the inside bank of meandering river bends.
• Well-documented case studies indicate that lateral movements of the foundation soils were greater
than the movements of the abutment piles, but substantially smaller than the free-field displacements
of the spreading river banks. Thus, the commonly adopted use of free-field displacements in PSA
might be overly conservative for bridges with a sufficient capacity to resist large spreading
displacements.
The principal findings from the PSAs are:
• Single pile and global PSAs produced consistent results and accurately simulated the observed
deformations and damage of the ANZAC Bridge. The constrained translation at the point of abutment
rotation provided a key boundary condition that enabled the use of the single pile PSA for the
abutment piles.
• The response of the abutment piles was found to be controlled by the magnitude of lateral ground
displacement and lateral load from the crust. Good accuracy in the simulations was obtained using
measured ground displacements and typical values for the model parameters. The abutment pile
response was virtually insensitive to the variation in the properties of the liquefied soil and deeper
non-liquefied layers.
• The global bridge analysis with applied ground displacements at the abutment and pier piles showed
an important influence of the latter on the pier response and clearly demonstrated the need to
consider the response of the bridge and its components using a global interaction model.
A6 References
Andrus, RD and KH Stokoe II (1997) Liquefaction resistance based on shear wave velocity. In Proceedings
of the NCEER Workshop on Evaluation of Liquefaction Resistance of Soils. Buffalo, New York: National
Center for Earthquake Engineering, pp89–128.
Andrus, RD and KH Stokoe II (2000) Liquefaction resistance of soils from shear-wave velocity. Journal of
Geotechnical and Geoenviromental Engineering 126, no.11: 1015–1025.
Appendix A: Mechanism and effects of liquefaction and lateral spreading
127
Architectural Institute of Japan (AIJ) (2001) Recommendations for design of building foundations, p.65 (in
Japanese).
Arulanandan, A and R Scott (Eds) (1993) Proceedings of the International Conference on Verification of
Numerical Procedures for the Analysis of Soil Liquefaction Problems, Davis, CA: Balkema.
Bardet, JP and T Tobita (2001) NERA: a computer program for nonlinear earthquake site response analyses
of layered soil deposits. Los Angeles: University of Southern California.
Bardet, JP, T Tobita, N Mace and J Hu (2002) Regional modelling of liquefaction-induced ground
deformation. Earthquake Spectra, EERI 18, no.1: 19–46.
Bartlett, S and T Youd (1995) Empirical prediction of liquefaction-induced lateral spread. Journal of
Geotechnical Engineering 121, no.4: 316–329.
Boulanger, RW and IM Idriss (2006) Liquefaction susceptibility criteria for silts and clays. Journal of
Geotechnical and Geoenvironmental Engineering 132, no.11: 1413–1426.
Bray, JD, RB Sancio, HT Durgunoglu, A Onalp, TL Youd, JP Stewart, RB Seed, OK Cetin, E Bol, MB Baturay, C
Christensen and T Karadayilar (2004) Subsurface characterization at ground failure sites in Adapazari,
Turkey. Journal of Geotechnical and Geoenvironmental Engineering 130, no.7: 673–685.
Bray, JD and RB Sancio (2006) Assessment of the liquefaction potential of fine-grained soils. Journal of
Geotechnical and Geoenvironmental Engineering 132, no.9: 1165–1177.
Byrne, PM (1990) A model for predicting liquefaction-induced displacements. Soil Mechanics series no.
147. Univ. of British Columbia, Department of Civil Engineering.
Canterbury Earthquake Recovery Authority (CERA) (2012) Geotechnical database for Canterbury
earthquake sequence. Accessed 5 July 2014. https://canterburygeotechnicaldatabase.projectorbit.co
Chapman, HE, MK Lauder and JH Wood (2005) Seismic assessment and retrofitting of New Zealand state
highway bridges. In Proceedings of the NZSEE Conference, Wairakei, 11–13 March 2005.
Christchurch City Council (CCC) (2011) Christchurch city earthquake-damaged bridges. Dataset compiled
by Opus for Christchurch City Council, March 2011.
Cubrinovski, M (2006) Pile response to lateral spreading of liquefied soils. NZGS 2006 Symposium:
Earthquakes and Urban Development. Nelson, February 2006: 127–142.
Cubrinovski, M and B Bradley (2009) Evaluation of seismic performance of geotechnical structures.
International Conference on Performance-Based Design in Earthquake Geotechnical Engineering (IS-
Tokyo 2009), Tsukuba, Japan, 15–17 Jun 2009.
Cubrinovski, M, B Bradley, L Wotherspoon, R Green, J Bray, C Wood, M Pender, J Allen, A Bradshaw, G Rix,
M Taylor, K Robinson, D Henderson, S Giorgini, K Ma, A Winkley, J Zupan, T O'Rourke, G DePascale and
D Wells (2011) Geotechnical Aspects of the 22 February 2011 Christchurch earthquake. Bulletin of NZ
Society for Earthquake Engineering 44, no.4: 205–226.
Cubrinovski, M, JJM Haskell, A Winkley, K Robinson and L Wotherspoon (2013) Performance of bridges in
liquefied deposits during the 2010–2011 Christchurch (New Zealand) earthquakes. Special issue
Journal of Performance of Constructed Facilities.
Cubrinovski, M and K Ishihara (2004) Simplified method for analysis of piles undergoing lateral spreading
in liquefied soils. Soils and Foundations 44, no.5: 119–133.
Design guidance for bridges in New Zealand for liquefaction and lateral spreading effects
128
Cubrinovski, M, K Ishihara and H Poulos (2009) Pseudostatic analysis of piles subjected to lateral
spreading. Special issue, Bulletin of the New Zealand Society for Earthquake Engineering 42, no.1: 28–
38.
Cubrinovski, M, K Ishihara and F Tanizawa (1996) Numerical simulation of the Kobe Port Island
liquefaction. In proceedings 11th World Conference on Earthquake Engineering, Acapulco, Mexico: June
1996.
Cubrinovski, M, T Kokusho and K Ishihara (2006) Interpretation from large-scale shake table tests on piles
undergoing lateral spreading in liquefied soils. Soil Dynamics and Earthquake Engineering 26, nos. 2–
4: 275–286.
Cubrinovski, M, S Rees and E Bowman (2010) Chapter 6: Effects of non-plastic fines on liquefaction
resistance of sandy soils. Pp125–144 in M. Garevski and A. Ansal (Eds), Earthquake Engineering in
Europe. Geotechnical, Geological, and Earthquake Engineering 17: 125–144. London and New York:
Springer.
Cubrinovski, M, A Winkley, J Haskell, A Palermo, L Wotherspoon, K Robinson, B Bradley, P Brabhaharan and
M Hughes (2014) Spreading-induced damage to short-span bridges in Christchurch (New Zealand).
Special Issue on the 2010–2011 Canterbury Earthquakes, EQ Spectra.
Diana Analysis bv (2001) DIANA 2D Version 7.2. The Netherlands.
Earthquake Engineering Online Archive (EERC) (nd) Collapse of Showa Bridge, Niigata. Accessed 5 July
2014. http://nisee.berkeley.edu/elibrary/list?e=4604&start=31
Elgamal, A, M Zeghal and E Parra (1996) Liquefaction of reclaimed island in Kobe, Japan. Journal of
Geotechnical Engineering 122, no.1: 39–49.
Fellenius, BH and H Salem (2003) Prediction of response to static loading of three piles at the ISC’2
Experimental Site. Second International Conference on Site Characterization, Porto, Portugal. 7pp.
Ghabousi, J and EL Wilson (1973) Liquefaction and analysis of saturated granular soils. In Proceedings of
the 5th World Conference on Earthquake Engineering. Rome 1: 380–389.
Hamada, M, S Yasuda, R Isoyama and K Emoto (1986) Study on liquefaction-induced permanent ground
displacements. Japan: Association for the Development of Earthquake Prediction.
Hamada, M, K Kubo and R Isoyama (1987) Earthquake damage caused by liquefaction induced permanent
ground displacement. In Proceedings of the Recent Advances in Lifeline Earthquake Engineering,
Developments in Geotechnical Engineering 49: 3–19.
Hanshin Highway Authority (HHA) (1996). Investigations of seismic damage of bridge foundations in
reclaimed land.
Hashash, YMA and D Park (2001) Non-linear one-dimensional wave propagation in the Mississippi
Embayment. Engineering Geology 62, no.1–3: 185–206.
Haskell, JJM, SPG Madabhushi and M Cubrinovski (2013) Lateral spreading-induced abutment rotation in
the 2011 Christchurch earthquake: observations and analysis. Geotechnique 63, no.15: 1310–1327.
High Pressure Gas Safety Institute of Japan (2000) Design method of foundations for level 2 earthquake
motion (in Japanese).
Horikoshi, K, A Tateishi and H Ohtsu (2000) Detailed Investigation of piles damaged by Hyogoken Nambu
earthquake. 12th World Conference on Earthquake Engineering, CD ROM paper no. 2477.

Appendix A: Mechanism and effects of liquefaction and lateral spreading
129
Housner, GW (1958) The mechanism of sandblows. Bull. Seismological Society of America 48: 155–161.
Idriss, IM and RW Boulanger (2008) Soil liquefaction during earthquakes, Monograph series no. MNO-12
Earthquake Engineering Research Institute.
Ishihara, K (1985) Stability of natural deposits during earthquakes. In Proceedings of the 11th
International Conference on Soil Mechanics and Foundation Engineering 2, San Francisco: 321–376.
Ishihara, K (1993) Liquefaction and flow failure during earthquakes – the 33rd Rankine Lecture.
Geotechnique 43, no.3: 351–415.
Ishihara, K (1996). Soil behaviour in earthquake geotechnics. Oxford Science Publications.
Ishihara, K, S Yasuda and S Iai (1997) A simple method to predict liquefaction-induced ground flow. In
Proceedings of the 24th JSCE Earthquake Engineering Symposium: 541–544 (in Japanese).
Ishihara, K and M Cubrinovski (1998) Performance of large-diameter piles subjected to lateral spreading of
liquefied deposits. Keynote lecture, 13th Southeast Asian Geotechnical Conference, Taipei.
Ishihara, K and M Cubrinovski (2004) Case studies of pile foundations undergoing lateral spreading in
liquefied deposits. State of the art paper, Fifth International Conference on Case Histories in
Geotechnical Engineering. New York, CDROM.
Ishihara, K and M Yoshimine (1992) Evaluation of settlements in sand deposits liquefaction during
earthquakes. Soils and Foundations 32, no.1: 173–188.
Itasca Consulting Group (1998) FLAC – fast Lagrangian analysis of continua. Minneapolis, Minnesota:
Itasca Consulting Group.
Iwasaki, T, K Tokida, F Tatsuoka, S Watanabe, S Yasuda and H Sato (1982) Microzonation for soil
liquefaction potential using simplified methods. In Proceedings of the Third International Conference
on Microzonation 3, Seattle: 1319–1330.
Japan Road Association (JRA) (1996) Part V, Seismic design. Specifications for highway bridges (in
Japanese).
Japanese Geotechnical Society (JGS) (1998) Geotechnical aspects of the January 17 1995 Hyogoken- Nambu
earthquake. Soils and Foundations, Special Issue no.2.
Kramer, SL (1996) Geotechnical earthquake engineering. Englewood Cliffs, NJ: 653pp.
Lee, KL (1974) Seismic permanent deformations in earth dams. Report to National Science Foundation,
project GI38521.
Madabhushi, G, J Knappet and S Haigh (2010) Design of piles foundations in liquefiable soils. London:
Imperial College Press.
Marchetti, S, P Monaco, G Totani and D Marchetti (2008) In situ tests by seismic dilatometer (SDMT). ASCE
geotecnical special publication no.170. 20pp.
Marcuson, WF III (1978) Definition of terms related to liquefaction. Journal of Geotechnical Engineering
104, no.9: 1197–1200.
Monaco, P, S Marchetti, G Totani and M Calabrese (2005) Sand liquefiability assessment by flat dilatometer
test (DMT). In Proceedings of the XVI ICSMGE 4, Osaka: 2693–2697.
Design guidance for bridges in New Zealand for liquefaction and lateral spreading effects
130
Moss, RES, RB Seed, RE Kayen, JP Stewart and A Der Kiureghian (2006) CPT-based probabilistic assessment
of seismic soil liquefaction initiation. PEER report 2005/15. Pacific Earthquake Engineering Research
Center.
National Research Council (NRC) (1985) Liquefaction of soils during earthquakes. Washington DC: National
Academy Press.
Newmark, NM (1965) Effects of earthquakes on dam and embankments. Geotechnique 5, no.2: 137–160.
New Zealand Geotechnical Society (NZGS) (2010) Geotechnical earthquake engineering practice: module 1
– guideline for the identification, assessment and mitigation of liquefaction hazards.
Palermo, A, L Wotherspoon, J Wood, H Chapman, A Scott, L Hogan, A Kivell, E Camniso, M Yashinsky, M
Bruneau and N Chouw (2011) Lessons learnt from 2011 Christchurch earthquakes: analysis and
assessment of bridges. Bulletin of the New Zealand Society for Earthquake Engineering 44, no.4: 319–
333.
Plaxis bv (2011) Plaxis 2D Version 9.0. The Netherlands.
Railway Technical Research Institute (1999) Earthquake resistant design code for railway structures (in
Japanese).
Rauch, AF and JR Martin (2000) EPOLLS model for predicting average displacements on lateral spreads.
Journal of Geotechnical and Geoenvironmental Engineering 126, no.4: 360–371.
Robertson, PK and CE Wride (1998) Evaluating cyclic liquefaction potential using the cone penetration test.
Canadian Geotechnical Journal 35, no.3: 442–459.
Schnabel, PB, J Lysmer and HB Seed (1972) A computer program for earthquake response analysis of
horizontally layered sites. Report no. EERC 72-12. University of California at Berkeley.
Scott, RF and KA Zuckerman (1973) Sand blows and liquefaction. Pp 179–189 in The great Alaskan
earthquake of 1964. Washington: National Academy of Sciences.
Seed, HB and KE Lee (1966) Liquefaction of saturated sands during cyclic loading. Journal of Soil
Mechanics and Foundations Division ASCE 92, no.SM6: 105–134.
Seed, HB and IM Idriss (1971) Simplified procedure for evaluating soil liquefaction potential. Journal of Soil
Mechanics and Foundations Division, ASCE 97, no.9: 1249–1273.
Seed, HB and IM Idriss (1982) Ground motions and soil liquefaction during earthquakes. Oakland,
California. Earthquake Engineering Research Institute Monograph.
Seed, HB, K Tokimatsu, LF Harder and RM Chung (1985) The influence of SPT procedures in soil
liquefaction resistance evaluations. Journal of Geotechnical Engineering, ASCE 111, no.12: 1425–1445.
Seed, RB, KO Cetin, RE Moss, AM Kammerer, J Wu, J Pestana, MF Riemer, RB Sancio, RE Kayen and A Faris
(2003) Recent advances in soil liquefaction engineering: a unified and consistent framework.
In Proceedings of the 26th Annual ASCE Los Angeles Geotechnical Spring Seminar: Long Beach,
California.
Suzuki, Y, K Tokimatsu, K Koyamada, Y Taya and Y Kubota (1995) Field correlation of soil liquefaction
based on CPT data. In Proceedings of the International Symposium on Cone Penetration Testing 2: 583–
588.
Terzaghi, K and RB Peck (1948) Soil mechanics in engineering practice. New York: John Wiley.
Appendix A: Mechanism and effects of liquefaction and lateral spreading
131
Tokimatsu, K and Y Asaka (1998) Effects of liquefaction-induced ground displacements on pile
performance in the 1995 Hyogoken-Nambu earthquake. Special Issue of Soils and Foundations, no.2:
163–177.
Tokimatsu, K and S Nomura (1991) Effects of ground deformation on pile stresses during soil liquefaction.
Journal of Structural and Construction Engineering, AIJ, no.426: 107–113 (in Japanese).
Tokimatsu, K and HB Seed (1987) Evaluation of settlements in sands due to earthquake shaking. Journal of
Geotechnical Engineering, ASCE 113, no.8: 861–878
Towhata, I (2008) Geotechnical earthquake engineering. Springer Series in Geomechanics and
Geoengineering.
Towhata, I (2012) Geotechnical damage caused by the recent gigantic earthquake in Japan. Oral
presentation. University of Auckland.
Towhata, I, Y Sasaki, K Tokida, H Matsumoto, Y Tamari and K Yamada (1992) Prediction of permanent
displacement of liquefied ground by means of minimum energy principle. Soils and Foundations 32,
no.3: 97–116.
Towhata, I, S Yasuda, K Ohtomo and K Yamada (1988) Experimental studies on liquefaction-induced
permanent ground displacement. In Proceedings of the 1st US-Japan Workshop on Liquefaction, Large
Ground Displacement and their Effects on Lifeline Facilities: 22pp.
Tsuchida, H (1971) Estimation of liquefaction potential of sandy soils. In Proceedings of the 3rd Joint
Meeting, US-Japan Panel on Wind and Seismic Effects.
Wotherspoon, L, A Bradshaw, R Green, C Wood, A Palermo, M Cubrinovski and B Bradley (2011)
Performance of bridges during the 2010 Darfield and 2011 Christchurch earthquakes. Seismological
Research Letters 82, no.6: 950–964.
Yasuda, S and JB Berrill (2000) Observations on the earthquake response of foundations in soil profiles
containing saturated sands. In Proceedings of the GeoEng2000: International Conference on
Geotechnical and Geological Engineering 1: 1441–1470.
Yasuda, S, K Ishihara and S Iai (1997) A simple procedure to predict ground flow due to liquefaction.
Abstract Volume for 8th International Conference on Soil Dynamics and Earthquake Engineering: 156–
157.
Yasuda, S, K Ishihara, I Morimoto, R Orense, M Ikeda and S Tamura (2000) Large-scale shaking table tests
on pile foundations in liquefied ground. In Proceedings of the 12th World Conference on Earthquake
Engineering, Auckland, New Zealand, paper no.1474. 8pp.
Yoshida, N, T Tazoh, K Wakamatsu, S Tasuda, I Towhata, H Nakazawa and H Kiku (2007) Causes of Showa
Bridge collapse in the 1964 Niigata earthquake based on eyewitness testimony. Soils and Foundations
47, no.6:1075–1087.
Youd, TL, IM Idriss, RD Andrus, I Arango, G Castro, JT Christian, R Dobry, WDL Liam Finn, LF Harder Jr, ME
Hynes, K Ishihara, JP Koester, SSC Liao, WF Marcuson III, GR Martin, JK Mitchell, Y Moriwaki, MS Power,
PK Robertson, RB Seed and KH Stokoe II (2001) Liquefaction resistance of soils: summary report from
the 1996 NCEER and 1998 NCEER/NSF Workshops on evaluation of liquefaction resistance of soils.
Journal of Geotechnical and Geoenvironmental Engineering 127, no.10: 817–833.
Design guidance for bridges in New Zealand for liquefaction and lateral spreading effects
132
Youd, TL, CM Hansen and SF Bartlett (2002) Revised multi-linear regression equations for prediction of
lateral spread displacement. Journal of Geotechnical and Geoenvironmental Engineering 128, no.12:
1007–1017.
Youd, TL and DM Perkins (1978) Mapping liquefaction-induced ground failure potential. Journal of the
Geotechnical Engineering Division 104, no.4: 443–446.
Zhang, G, PK Robertson and R Brachman (2002) Estimating liquefaction-induced ground settlements from
the CPT. Canadian Geotechnical Journal 39: 1168–1180.
Zhang, G, PK Robertson and R Brachman (2004) Estimating liquefaction-induced lateral displacements
using the standard penetration test or cone penetration test. Journal of Geotechnical and
Geoenvironmental Engineering 130, no.8: 861–871.

Appendix B: Example calculation
133
Appendix B: Example calculation
An example calculation is presented for single-pile and global bridge analyses using the ANZAC Bridge
analysis given in Cubrinovski et al (2014). The lateral spreading case only is presented here, though cyclic
liquefaction analysis was also conducted for the bridge.
Table B.1 summarises the parameter values for the lateral spreading analyses with reference values based
on median values or best estimates for each parameter, and lower bound (LB) and upper bound (UB) values
of the parameters based on previous studies (Cubrinovski et al 2006; 2009).
B1 Single pile analyses
Independent single pile PSAs were conducted for the north abutment and south abutment using the
subsurface conditions shown in figure B.2.
The soil profile generally consists of a 2m thick fill and then variable top sandy soil to about 4m depth,
overlying a uniform fine to medium sand from 4m to 17m depth (with qc <5MPa at shallow depths and q
c =
10–20 MPa at larger depths), and slightly coarser and denser sands below 17m depth (with qc >20 MPa).
B1.1 Liquefaction triggering analysis
The shaded layers in figures B.2 and B.3 indicate liquefied layers with factors of safety of FSl <1.0
according to the Robertson and Wride (1998) method applied for the Christchurch earthquake. These
analyses show larger thicknesses of liquefied layers at shallow depths (up to 10m depth) for the south
abutment profile, where larger lateral spreading displacements were observed. Some details of the
liquefaction triggering analysis and subsequent calculations of the lateral ground displacements using the
Zhang et al (2004) method are given in figure B.3. Here, the ‘adopted profile’ is simplified for the analysis
based on SPT and CPT information, and CSR values are shown for the Darfield and Christchurch
earthquakes for an equivalent magnitude 7.5 earthquake (ie CSR 7.5.)
B1.2 Free-field ground displacements
Using the calculated FSl values, the distribution of lateral spreading displacements throughout the depth
was then estimated based on the method of Zhang et al (2004). The objective of these calculations was to
determine the distribution of ground displacements throughout the depth of the profile, which is shown in
figure B.2 as normalised Ug/U
g(max) displacements, where U
g(max) is the displacement at the top of the
liquefied layer. In the PSAs, this distribution of ground displacement was multiplied by the measured
lateral spreading displacements (figure B.2) and applied at the end of the soil springs. Since ground
displacements generally need to be predicted, the surface ground displacement due to spreading can be
estimated using one of the empirical methods, ie Zhang et al (2004) or Youd et al (2002).
It is important to consider the best-estimate values as well as the LB and UB estimates for the ground
displacements. In this example, the best estimate value for the south abutment is Ug(max)
= 66cm, while the
LB and UB estimates are Ug(max)
= 40cm and Ug(max)
= 100cm respectively. The Zhang et al (2004) method
overestimated the measured lateral spreading displacements at the Anzac Bridge, which clearly points out
the uncertainties in these estimates and the need to consider a range of anticipated ground
displacements.
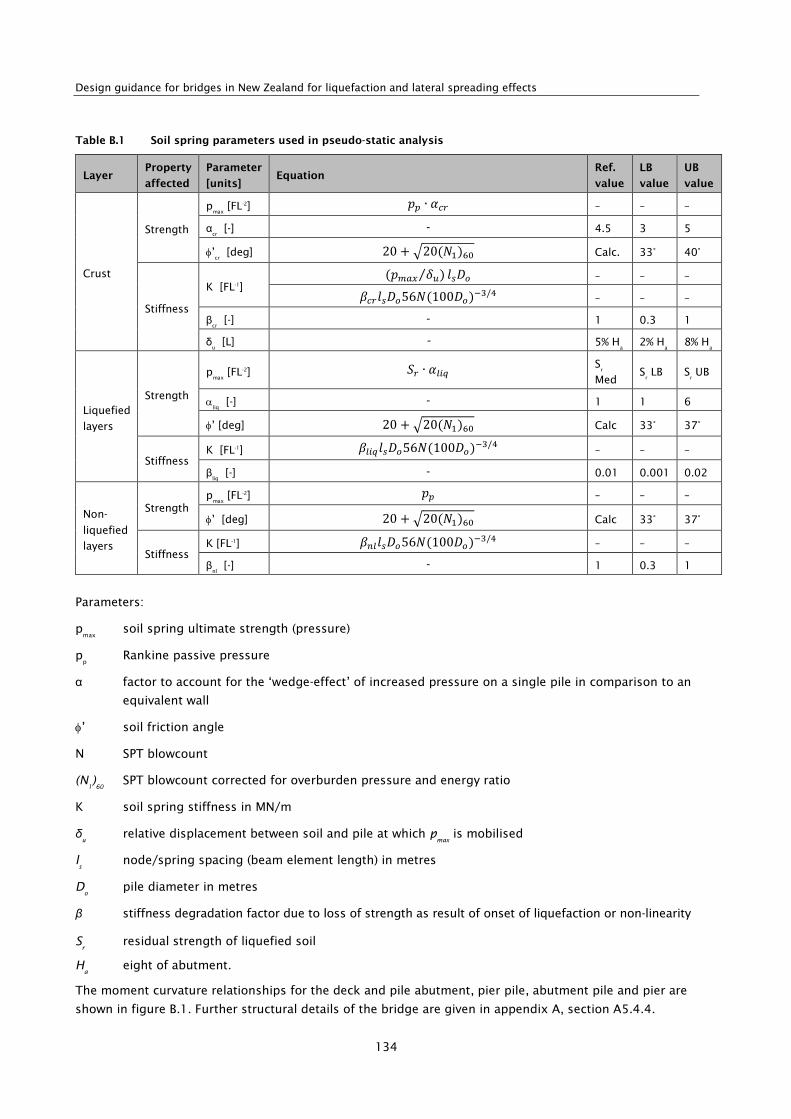
Design guidance for bridges in New Zealand for liquefaction and lateral spreading effects
134
Table B.1 Soil spring parameters used in pseudo-static analysis
Layer Property
affected
Parameter
[units] Equation
Ref.
value
LB
value
UB
value
Crust
Strength
pmax
[FL-2] 𝑝𝑝 ∙ 𝛼𝑐𝑟 – – –
αcr [-] - 4.5 3 5
φ’cr [deg] 20 + �20(𝑁1)60 Calc. 33° 40°
Stiffness
K [FL-1] (𝑝𝑚𝑎𝑥 𝛿𝑢)⁄ 𝑙𝑠𝐷𝑜 – – –
𝛽𝑐𝑟𝑙𝑠𝐷𝑜56𝑁(100𝐷𝑜)−3/4 – – –
βcr [-] - 1 0.3 1
δu [L] - 5% H
a 2% H
a 8% H
a
Liquefied
layers
Strength
pmax
[FL-2] 𝑆𝑟 ∙ 𝛼𝑙𝑖𝑞 Sr
Med S
r LB S
r UB
αliq [-] - 1 1 6
φ’ [deg] 20 + �20(𝑁1)60 Calc 33° 37°
Stiffness K [FL-1] 𝛽𝑙𝑖𝑞𝑙𝑠𝐷𝑜56𝑁(100𝐷𝑜)−3/4 – – –
βliq [-] - 0.01 0.001 0.02
Non-
liquefied
layers
Strength p
max [FL-2] 𝑝𝑝 – – –
φ’ [deg] 20 + �20(𝑁1)60 Calc 33° 37°
Stiffness K [FL-1] 𝛽𝑛𝑙𝑙𝑠𝐷𝑜56𝑁(100𝐷𝑜)−3/4 – – –
βnl [-] - 1 0.3 1
Parameters:
pmax
soil spring ultimate strength (pressure)
pp Rankine passive pressure
α factor to account for the ‘wedge-effect’ of increased pressure on a single pile in comparison to an
equivalent wall
φ’ soil friction angle
N SPT blowcount
(N1)60
SPT blowcount corrected for overburden pressure and energy ratio
K soil spring stiffness in MN/m
δu
relative displacement between soil and pile at which pmax
is mobilised
ls
node/spring spacing (beam element length) in metres
Do
pile diameter in metres
β stiffness degradation factor due to loss of strength as result of onset of liquefaction or non-linearity
Sr
residual strength of liquefied soil
Ha eight of abutment.
The moment curvature relationships for the deck and pile abutment, pier pile, abutment pile and pier are
shown in figure B.1. Further structural details of the bridge are given in appendix A, section A5.4.4.

Appendix B: Example calculation
135
Figure B.1 Moment-curvature relationships for bridge superstructure
Notes:
• Spring stiffness was assessed by back-calculation from the displacement required to mobilise passive
pressures (δu) and by forward-calculation of spring stiffness using subgrade reaction coefficient
method (eg Tokimatsu and Asaka 1998)
• Relative density (Dr) of 70%–80% was assessed for the crust fill (Dr = 14�(N1)60), figure 10 in
Cubrinovski et al (2009)
• Residual shear strength, Sr, was taken as a function of SPT blowcount (eg Seed and Harder 1990)
Figure B.2 Subsurface conditions at the bridge (north and south abutments) showing layers with FS <1.0 for
the ‘design earthquake’ liquefaction triggering analysis (Robertson and Wride 1998); normalised spreading
displacement profile computed based on Zhang et al (2004) method is also shown (Cubrinovski et al 2014)

Design guidance for bridges in New Zealand for liquefaction and lateral spreading effects
136
Figure B.3. Details of the liquefaction triggering analysis (Robertson and Wride 1998) and computed normalised
spreading displacements for the south abutment (Zhang et al 2004) method is also shown (Winkley 2013)
Figure B.4 summarises some of the results of the single pile PSAs in which peak ground displacements of
Ug(max)
= 40cm, 66cm and 100cm were applied at the south abutment. Horizontal displacements and
bending moments along the abutment piles are shown in figure B.4 for six independent analyses. Note
that three different ground displacement profiles were applied (three separate analyses), shown with black
solid lines: then two sets of analyses were conducted (six analyses in total) using two different soil spring
models: reference model (RM) analyses with reference properties, shown with red solid lines, and a model
with RM properties for all parameters except for the crust strength, for which LB values are used (shown
with blue dashed lines). In the single pile analyses, the abutment is modelled by a rigid beam element (ie
as an elastic member with very large stiffness) which is constrained laterally at the point of abutment
rotation. Therefore displacements at the top of the piles are zero.
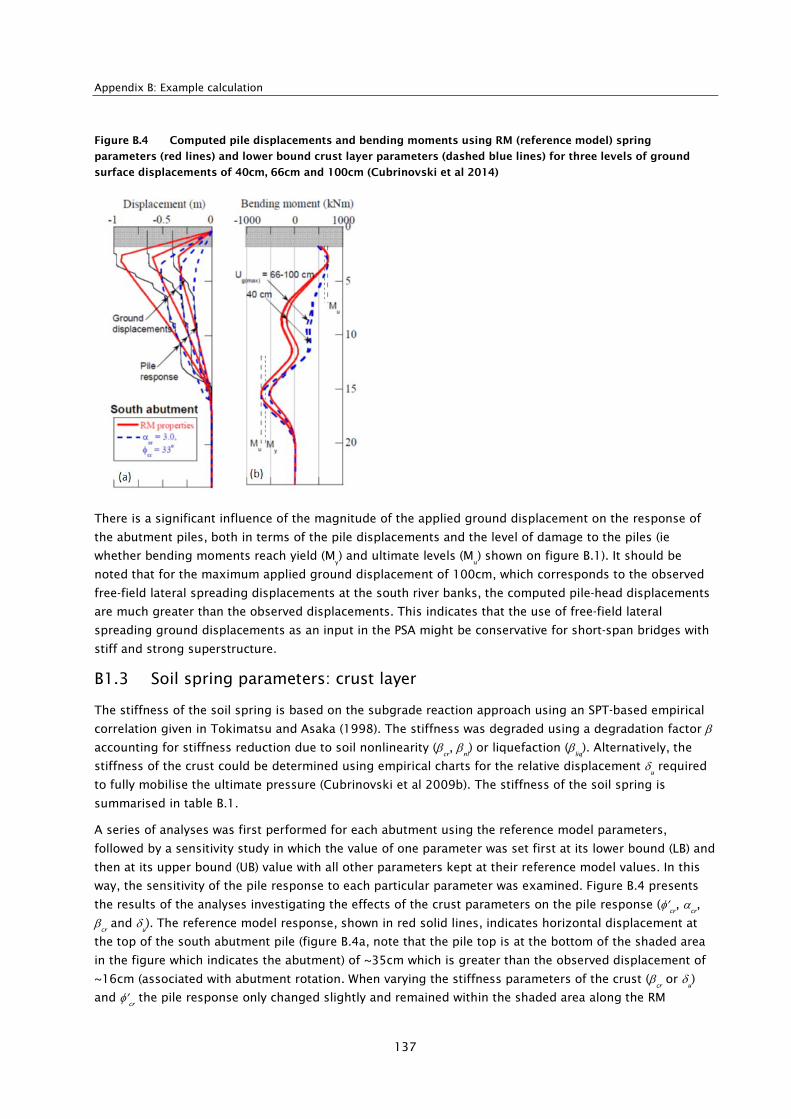
Appendix B: Example calculation
137
Figure B.4 Computed pile displacements and bending moments using RM (reference model) spring
parameters (red lines) and lower bound crust layer parameters (dashed blue lines) for three levels of ground
surface displacements of 40cm, 66cm and 100cm (Cubrinovski et al 2014)
There is a significant influence of the magnitude of the applied ground displacement on the response of
the abutment piles, both in terms of the pile displacements and the level of damage to the piles (ie
whether bending moments reach yield (My) and ultimate levels (M
u) shown on figure B.1). It should be
noted that for the maximum applied ground displacement of 100cm, which corresponds to the observed
free-field lateral spreading displacements at the south river banks, the computed pile-head displacements
are much greater than the observed displacements. This indicates that the use of free-field lateral
spreading ground displacements as an input in the PSA might be conservative for short-span bridges with
stiff and strong superstructure.
B1.3 Soil spring parameters: crust layer
The stiffness of the soil spring is based on the subgrade reaction approach using an SPT-based empirical
correlation given in Tokimatsu and Asaka (1998). The stiffness was degraded using a degradation factor β
accounting for stiffness reduction due to soil nonlinearity (βcr, β
nl) or liquefaction (β
liq). Alternatively, the
stiffness of the crust could be determined using empirical charts for the relative displacement δu required
to fully mobilise the ultimate pressure (Cubrinovski et al 2009b). The stiffness of the soil spring is
summarised in table B.1.
A series of analyses was first performed for each abutment using the reference model parameters,
followed by a sensitivity study in which the value of one parameter was set first at its lower bound (LB) and
then at its upper bound (UB) value with all other parameters kept at their reference model values. In this
way, the sensitivity of the pile response to each particular parameter was examined. Figure B.4 presents
the results of the analyses investigating the effects of the crust parameters on the pile response (φ′cr, α
cr,
βcr and δ
u). The reference model response, shown in red solid lines, indicates horizontal displacement at
the top of the south abutment pile (figure B.4a, note that the pile top is at the bottom of the shaded area
in the figure which indicates the abutment) of ~35cm which is greater than the observed displacement of
~16cm (associated with abutment rotation. When varying the stiffness parameters of the crust (βcr or δ
u)
and φ′cr the pile response only changed slightly and remained within the shaded area along the RM
Design guidance for bridges in New Zealand for liquefaction and lateral spreading effects
138
response, shown in figure B.3a. However, the pile response substantially changed and approached the
measured displacements when αcr-LB
=3 was used with reference model values for all other parameters,
indicating the large sensitivity of the pile response to this crust strength parameter. Recognising this
sensitivity, an additional analysis was conducted using the LB values for of all the crust strength
parameters (ie αcr-LB
=3, φ′′cr-LB
= 33°), which reduced the pile head displacements to the values slightly below
the measured ones. This demonstrates that the modelling of the crust governs the abutment pile
response. The bending moments (figure B.4b) indicate that the south abutment piles exceeded the yield
level and approached the ultimate moment at ∼0.5m to 2m below the pile head, and also at the interface
of the liquefied and non-liquefied layers at ∼15m depth.
B1.4 Soil spring parameters: liquefied layers and deeper non-liquefied layers
Sensitivity analyses were also performed where parameters of the liquefied and non-liquefied layers were
varied between their LB and UB values, given in table B.1. The influence of the liquefied and non-liquefied
layer parameters on the abutment pile response was insignificant. The results of all of these analyses
varied within a few percent from the RM response of the abutment piles shown in figure B.4.
B.2 Global bridge analyses
A series of global bridge analyses was also conducted to account for the substantial variation in the
liquefaction-induced ground displacements acting on the abutment and pier piles, and for the effects of
soil-pile-pier/abutment-superstructure interaction. A schematic view of the global bridge model, including
a summary of the applied ground displacements and computed bridge displacements and bending
moments for the piers and pier piles is shown in figure B.5.
First, analyses were performed in which lateral ground displacements were applied only to the abutments
and abutment piles (A-analysis). The results from the global A-analyses were practically identical to those
of the single pile analyses presented in figure B.4. For reference, figure B.5 shows the displaced shape of
the A-analysis using LB values for crust strength parameters and RM values for all other parameters, and
ground displacements of 36cm and 66cm at the north and south abutments respectively.
Next, ground displacements were also applied to the pier piles (ie in addition to the ground displacements
at the abutments and abutment piles), as indicated schematically in figure B.5 (referred to as AP-analyses).
The ground displacement at the top of the pier piles was assumed to be 50% of that at the respective
elevation for the abutment piles while its distribution with depth was evaluated using the triggering and
normalised displacement calculation, as previously discussed. The results of AP-analyses in figure B.4
show that the inclusion of a lateral ground displacement at the pier piles significantly increased the pier
displacements and created bending moments close to the ultimate moment at the top of the piers.
Given the significant uncertainties associated with the ground displacements at the piers and effects of
liquefaction, two additional AP-analyses were conducted. First, the applied ground displacements at the
pier piles were reduced to 20% of the initial value (0.2AP analysis), and second, the strength of the non-
liquefied layers (springs) was reduced to 50% of its initial value to assess the effects of strength reduction
(due to excess pore pressures) in the non-liquefied layers sandwiched between liquefied layers (AP-αnl−0.5
analysis).
Results from all three AP-type analyses indicated that the pier piles did not suffer substantial damage.
Only in the case of the AP-analysis, yielding of the steel casing occurred in the south pier piles at ~12m
below the pile head. However, all analyses suggest some damage at the top of the piers corresponding to
the yield moments, and a similar but smaller level of damage at the base of the piers. The computed

Appendix B: Example calculation
139
moments at the top of the pier are probably overestimating the actual pier moments because a fully
restrained connection between the deck and the pier-cap was adopted in the analysis. The global analysis
also indicated that the whole bridge displaced ~7cm to the north.
Both single pile and global PSAs produced results consistent with the observed displacements and damage
of the ANZAC Bridge. The analyses accurately simulated the observed spreading-induced mechanism and
provided additional insight into the response of the bridge and its pile foundations.
Figure B.5 Displaced shape of the A-analysis using lower bound values for crust strength parameters and
reference model values for all other parameters
B3 References
Cubrinovski, M and K Ishihara (2004) Simplified method for analysis of piles undergoing lateral spreading
in liquefied soils. Soils and Foundations 44, no.5: 119–133.
Cubrinovski, M, K Ishihara and H Poulos (2009) Pseudostatic analysis of piles subjected to lateral
spreading. Special issue, Bulletin of the New Zealand Society for Earthquake Engineering 42, no.1: 28–
38.
Cubrinovski, M, T Kokusho and K Ishihara (2006) Interpretation from large-scale shake table tests on piles
undergoing lateral spreading in liquefied soils. Soil Dynamics and Earthquake Engineering 26, nos. 2–
4: 275–286.
Cubrinovski, M, A Winkley, J Haskell, A Palermo, L Wotherspoon, K Robinson, B Bradley, P Brabhaharan and
M Hughes (2014) Spreading-induced damage to short-span bridges in Christchurch (New Zealand).
Special Issue on the 2010–2011 Canterbury Earthquakes, EQ Spectra.
Robertson, PK and CE Wride (1998) Evaluating cyclic liquefaction potential using the cone penetration test.
Canadian Geotechnical Journal 35, no.3: 442–459.

Design guidance for bridges in New Zealand for liquefaction and lateral spreading effects
140
Tokimatsu, K and Y Asaka (1998) Effects of liquefaction-induced ground displacements on pile
performance in the 1995 Hyogoken-Nambu earthquake. Soils and Foundations, Special Issue, no. 2:
163–177.
Winkley, A (2013) Impacts of liquefaction and lateral spreading on bridge pile foundations in the February
22nd 2011 earthquake. ME thesis. Christchurch: University of Canterbury.
Youd, TL, KM Hansen and SF Bartlett (2002) Revised multilinear regression equations for prediction of
lateral spread displacement. Journal of Geotechnical and Geoenvironmental Engineering 128, no.12:
1007–1017.
Zhang, G, PK Robertson and R Brachman (2004) Estimating liquefaction-induced lateral displacements
using the standard penetration test or cone penetration test. Journal of Geotechnical and
Geoenvironmental Engineering 130, no.8: 861–871.

Appendix C: Glossary
141
Appendix C: Glossary
AASHTO American Association of State Highway and Transportation Officials
AIJ Architectural Institute of Japan
ASCE American Society of Civil Engineers
Atterberg limit tests laboratory tests to determine the liquid and plastic limits of soil
CCC Christchurch City Council
CDIT Coastal Development Institute of Technology, Tokyo
CPT cone penetration test
CRR cyclic resistance ratio
CSR cyclic stress ratio
EPOLLS empirical prediction of liquefaction-induced lateral spreading
EPWP excess pore water pressures
ESA effective stress analysis
grabens a section of earth lying between two faults and displaced downward relative to the
blocks either side
horst a raised block of earth lying between two faults
JRA Japan Road Association
LB lower bound
LDI lateral replacement index
LiDAR data data collected by an optical remote sensing technique (usually flyover) which
gives points on the surface of the earth
LPI liquefaction displacement index
MSF magnitude linear regression
NZGS New Zealand Geotechnical Society
PEER Pacific Earthquake Engineering Research
PGA peak ground acceleration
PL probability of liquefaction
PSA pseudo-static analysis
QA quality assurance
RC reinforced concrete
revetment a sloping structure placed on river banks or cliffs in such a way as to absorb the
energy of incoming water
SFSI soil-foundation-structure interaction

Design guidance for bridges in New Zealand for liquefaction and lateral spreading effects
142
SPT standard penetration test
TSA total stress analysis
UB upper bound