the economic contribution of queensland’s oil and gas industry
TRANSCRIPT

The economic contribution of Queensland’s oil and gas industry
Australian Petroleum Production & Exploration Association
8 September 2021
Copyright © 2021 Ernst & Young Australia. All Rights Reserved. Liability limited by a scheme approved under Professional Standards Legislation
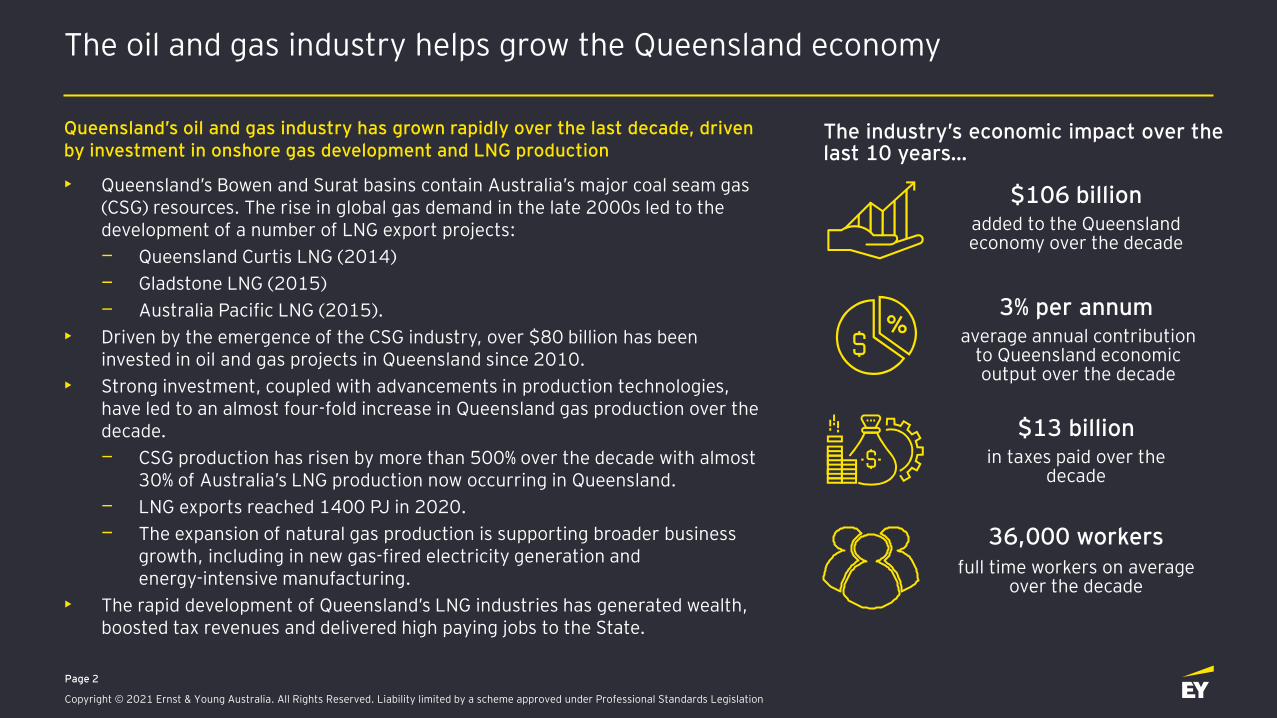
The oil and gas industry helps grow the Queensland economy
Queensland’s oil and gas industry has grown rapidly over the last decade, driven by investment in onshore gas development and LNG production
• Queensland’s Bowen and Surat basins contain Australia’s major coal seam gas (CSG) resources. The rise in global gas demand in the late 2000s led to the development of a number of LNG export projects:
— Queensland Curtis LNG (2014)
— Gladstone LNG (2015)
— Australia Pacific LNG (2015).
• Driven by the emergence of the CSG industry, over $80 billion has been invested in oil and gas projects in Queensland since 2010.
• Strong investment, coupled with advancements in production technologies, have led to an almost four-fold increase in Queensland gas production over the decade.
— CSG production has risen by more than 500% over the decade with almost 30% of Australia’s LNG production now occurring in Queensland.
— LNG exports reached 1400 PJ in 2020.
— The expansion of natural gas production is supporting broader business growth, including in new gas-fired electricity generation and energy-intensive manufacturing.
• The rapid development of Queensland’s LNG industries has generated wealth, boosted tax revenues and delivered high paying jobs to the State.
Page 2
$106 billion
3% per annum
added to the Queensland economy over the decade
average annual contribution to Queensland economic output over the decade
The industry’s economic impact over the last 10 years…
$13 billion
36,000 workers
in taxes paid over the decade
full time workers on average over the decade

Copyright © 2021 Ernst & Young Australia. All Rights Reserved. Liability limited by a scheme approved under Professional Standards Legislation
The investment outlook for Queensland’s oil and gas industry remains strong
The potential economic impact from currently proposed oil and gas investments in Queensland over the next two decades are examined under two growth scenarios
• Low growth — Includes investment and production for Queensland oil and gas projects which are currently under development or have a high level of investor commitment.
• High growth — Building on the low growth pathway, this scenario captures investment and associated production yields for oil and gas projects in Queensland that are prospective but have yet to secure firm commercial commitments.
Investment scenarios reflect known information about new gas projects. The analysis does not consider global or domestic demand for gas or any potential impacts of future climate change policy.
Page 3
Some key oil and gas projects in the pipeline
• Surat Gas Project (Arrow Energy)
• Western Surat Gas Project (Senex)
• Glenaras Gas Project (Galilee Energy Limited)
2020 20252021
3
20272022 20262023
5
2024 20292028
1
2
4
6
7
8
Inv
est
me
nt
($ b
illio
ns)
Low growth High growth
Almost $30 billion in investment could add around 7,000 PJ in production capacity in the Queensland oil and gas industry over 20 years
H
L
L
H
HL Source: EY analysis

Copyright © 2021 Ernst & Young Australia. All Rights Reserved. Liability limited by a scheme approved under Professional Standards Legislation
New oil and gas investment delivers major economic payoffs
Industry investment boosts Queensland’s productive potential and lifts economic outcomes
• Identified projects provide an immediate economic stimulus during their construction and delivery phase, leading to a sustained uplift in output as new projects commence production.
— During the near term capital installation phase, economic output may increase by $51.4 billion under a high-growth scenario and $29.7 billion under a low-growth scenario.
• From 2025, the potential benefits of additional production − under both growth scenarios − can be felt throughout the economy.
• Going forward, there are significant returns under a high-growth scenario reflecting the ambitious nature of the investment which looks to open-up and capitalise on new gas provinces.
— Queensland’s economic output could be $8.7 billion higher in 2026 — this represents almost 2.5% of the current Queensland economy.
— In fact, under this ‘step-change’ growth trajectory, the economic impact is estimated to be 230% higher than the low-growth scenario in 2040.
— Other parts of the economy also benefit from a reduction in gas prices and an increase in productivity.
Page 4
The 20-year economic impact …
H
L Low growth
High growth
$64.0 billion
$129.3 billion
2020 20352025 2030 2040
6
2
4
8
1
3
5
7
9
GD
P im
pa
ct (
$ b
illio
ns)
H
L
Low growth High growth Note: undiscounted total reported
Source: EY analysis
L H

Copyright © 2021 Ernst & Young Australia. All Rights Reserved. Liability limited by a scheme approved under Professional Standards Legislation
Delivering more jobs for Queensland
Increased investment in the oil and gas sector generates significant high-paying jobs in Queensland
• The demand for workers rises during the construction phase as businesses invest in additional capital.
— The benefits of this investment are particularly pronounced in the short-term, with almost 2200 extra full-time jobs estimated to be created in 2026 under a high growth scenario.
— Under a low-growth investment pathway, more than 1700 full-time workers could be employed in 2024.
• As projects transition to production, the employment impacts continue to build and there is a permanent uplift in skilled, high paying jobs in Queensland.
— Throughout Queensland, the broader business sector benefits from lower gas prices — these efficiencies help to create more jobs throughout the economy.
• Capital formation is a strong driver of productivity growth which increases wages.
Page 5
The number of jobs created in 2040 …
H
L Low growth
High growth
900 FTEs
2200 FTEs
1.0
2020 2025 2030
1.5
0.5
2035 2040
2.0
2.5
Em
plo
ym
en
t (t
ho
usa
nd
FT
Es)
H
L
Low growth High growth Source: EY analysisL H

Copyright © 2021 Ernst & Young Australia. All Rights Reserved. Liability limited by a scheme approved under Professional Standards Legislation
Building fiscal resources and supporting consumers
Oil and gas investment and production grows the tax base
• The oil and gas industry makes a valuable fiscal contribution to the Queensland and national economies through a range of tax payments.
— Taxes and charges paid by the industry in Queensland include royalties, excise duties, company tax and indirect taxes.
• Over the next 20 years, new gas projects in Queensland could generate $27.6 billion in taxes under a high-growth scenario and $13.9 billion under a low-growth pathway.
• Industry investment also induces activity in other parts of the economy, boosting tax contributions from other sectors.
Higher employment and wages raises household consumption throughout Queensland
• Over a 20-year period, consumption could increase by $27.6 billion under a low-growth path and about $55.3 billion under a high-growth trajectory.
— The boost to consumption follows a similar pathway to employment, peaking during the construction phase of the new developments.
— There is a potential sustained uplift in consumption over the long term which supports all Queenslanders.
Page 6
2040
1.5
2020 20352025 2030
0.5
1.0
2.0
Ta
x r
ev
en
ue
($
billio
ns)
Low growth High growth
Government tax take over time
Consumption over time
H
L
H
L
204020352020
0.5
2025
1.5
1.0
2030
2.0
2.5
3.0
3.5
Co
nsu
mp
tio
n (
$ b
illio
ns)
L H Note: undiscounted total reported
Source: EY analysis

Copyright © 2021 Ernst & Young Australia. All Rights Reserved. Liability limited by a scheme approved under Professional Standards Legislation
Unleashing the industry’s potential could help drive the economy
Page 7
Potential annual benefits under a high-growth investment pathway …
Note: figures reported as an average over the 20-year period. Employment is a snapshot in 2040. Tax revenue goes to the State and Federal Government.
Source: EY analysis.
Higher economic output
Increased consumption
More jobs
$6.5 billion
1900 FTEs
$2.8 billion
More tax revenue
$1.4 billion
This could help fund
20 primary schoolsand
25 police stations and
30 fire stations and
1000+ teachersand
1000+ nurses

Copyright © 2021 Ernst & Young Australia. All Rights Reserved. Liability limited by a scheme approved under Professional Standards Legislation
Page 8
Section divider over two lines or three lines
Technical appendix
Methodology and approach

Copyright © 2021 Ernst & Young Australia. All Rights Reserved. Liability limited by a scheme approved under Professional Standards Legislation
Our methodology — Estimating the industry’s historical contribution
Page 9
Constructing the economic structure of Queensland oil and gas sector
A structural economic profile was developed using:
• Historical investment profile based on data from the Department of Industry, Science, Energy and Resources’ ‘Resources and Energy Quarterly’ reports
• Historical production profile based on data from APPEA and EnergyQuest
• ABS Australian National Accounts Input-Output table
• Spatial disaggregation of the Queensland economy
Input-output modelling estimated the flow-on effects of the industry to the state economy
• IO modelling estimates how the economic impacts of a market activity affect the broader Queensland economy.
• Input-output (IO) multipliers were used to quantify the oil and gas industry’s total economic contribution in Queensland (i.e. the direct and indirect impacts).
Key limitations of IO modelling
• IO modelling does not consider supply constraints, price changes or structural changes in the economy.
• The method also considers average economic effects rather than marginal effects — this means that IO models do not account for economies of scale, unused capacity or technological change.
Other limitations
• The investment scenarios reflect known, publicly available information about new oil and gas projects in Queensland.
• EY has not separately analysed the global or domestic demand for gas, or considered any potential impacts of future climate change policy.

Copyright © 2021 Ernst & Young Australia. All Rights Reserved. Liability limited by a scheme approved under Professional Standards Legislation
Our whole-of-economy model to examine potential industry impacts
Page 10
EYGEM is EY’s in-house, state of the art Computable General Equilibrium (CGE) model. It is a large scale, dynamic, multi-region, multi-commodity model of the world economy.
The model provides a rich and realistic representation of how changes in one part of the economy flow through to other parts.
• Comprehensive regional analysis — The model contains 141 distinct regions, with the ability to disaggregate these into sub-national regions for highly granular economic analysis.
• Rich sectoral detail — All sectors of the economy are integrated into the model, with 65 discrete sectors. These can be further refined for specific industries.
• Time dynamics — Solving year-on-year over a flexible periods, the model can assess short term policy initiatives and decades-long reforms or investments.
• Market tested and strong academic foundations —A model has a lineage that has been applied globally across the public and private sector.
Industries
Government
Households
Financial markets
Global economy

Copyright © 2021 Ernst & Young Australia. All Rights Reserved. Liability limited by a scheme approved under Professional Standards Legislation
Sources
• APPEA (2021), Statistics and Information
• APPEA (2019), APPEA Oil and Gas Industry Financial Survey: Results from 1987-88 to 2018-19
• Australian Bureau of Statistics (2021), Australian National Accounts Input-Output Tables 2018-19
• Australian Bureau of Statistics (2021), Average Weekly Earnings Australia
• Department of Industry, Science, Energy and Resources (2021), Resources and Energy Quarterly
• EY analysis (2020), Australian oil and gas investment outlook database
• Queensland Government Statistician’s Office (2021), Economic activity – Queensland state accounts
Page 11

Copyright © 2021 Ernst & Young Australia. All Rights Reserved. Liability limited by a scheme approved under Professional Standards Legislation
Release notice
Ernst & Young was engaged on the instructions of the Australian Petroleum Production & Exploration Association (“APPEA”) to examine the economic contribution of the oil and gas industry and the investment pipeline in Western Australia, Queensland and the Northern Territory (“Project”), in accordance with the Engagement Agreement dated 25 May 2021.
The results of Ernst & Young’s work, including the assumptions and qualifications made in preparing the report, are set out in Ernst & Young's report dated 08 September 2021 (“Report”). The Report should be read in its entirety including the transmittal letter, the applicable scope of the work and any limitations. A reference to the Report includes any part of the Report. No further work has been undertaken by Ernst & Young since the date of the Report to update it.
Our work commenced on 25 May 2021 and was completed on 08 September 2021. Therefore, our Report does not take account of events or circumstances arising after 08 September 2021 and we have no responsibility to update the Report for such events or circumstances.
Ernst & Young has prepared the Report for the benefit of APPEA and has considered only the interests of other parties. Ernst & Young has not been engaged to act, and has not acted, as advisor to any other party. Accordingly, Ernst & Young makes no representations as to the appropriateness, accuracy or completeness of the Report for any other party's purposes.
No reliance may be placed upon the Report or any of its contents by any party other than APPEA (“Third Parties”). Any Third Party receiving a copy of the Report must make and rely on their own enquiries in relation to the issues to which the Report relates, the contents of the Report and all matters arising from or relating to or in any way connected with the Report or its contents. We highlight that our analysis and Report do not constitute investment advice or a recommendation to you on a future course of action. We provide no assurance that the scenarios we have modelled will be accepted by any relevant authority or third party.
Ernst & Young disclaims all responsibility to any Third Parties for any loss or liability that the Third Parties may suffer or incur arising from or relating to or in any way connected with the contents of the Report, the provision of the Report to the Third Parties or the reliance upon the Report by the Third Parties. If Third Parties choose to rely upon any of the contents of this Report they do so at their own risk.
No claim or demand or any actions or proceedings may be brought against Ernst & Young arising from or connected with the contents of the Report or the provision of the Report to the Third Parties. Ernst & Young will be released and forever discharged from any such claims, demands, actions or proceedings.
In preparing this Report we have considered and relied upon information from a range of sources believed to be reliable and accurate. We have not been informed that any information supplied to us, or obtained from public sources, was false or that any material information has been withheld from us. We do not imply and it should not be construed that we have verified any of the information provided to us, or that our enquiries could have identified any matter that a more extensive examination might disclose.
Our conclusions are based, in part, on the assumptions stated and on information provided by APPEA and other information sources used during the course of the engagement. The modelled outcomes are contingent on the collection of assumptions as provided by APPEA and no consideration of other market events, announcements or other changing circumstances are reflected in this Report. Neither Ernst & Young nor any member or employee thereof undertakes responsibility in any way whatsoever to any person in respect of errors in this Report arising from incorrect information provided by APPEA or other information sources used.
Ernst & Young have consented to the Report being published electronically on the APPEA website for informational purposes only. Ernst & Young have not consented to distribution or disclosure beyond this. The material contained in the Report, including the Ernst & Young logo, is copyright. The copyright in the material contained in the Report, excluding Ernst & Young Logo, itself vests in APPEA. The Report, including the Ernst & Young logo, cannot be altered without prior written permission from Ernst & Young.
Ernst & Young’s liability is limited by a scheme approved under Professional Standards Legislation.
Page 12

EY | Building a better working world
EY exists to build a better working world, helping to create long-term value for clients, people and society and build trust in the capital markets.
Enabled by data and technology, diverse EY teams in over 150 countries provide trust through assurance and help clients grow, transform and operate.
Working across assurance, consulting, law, strategy, tax and transactions, EY teams ask better questions to find new answers for the complex issues facing our world today.
EY refers to the global organization, and may refer to one or more, of the member firms of Ernst & Young Global Limited, each of which is a separate legal entity. Ernst & Young Global Limited, a UK company limited by guarantee, does not provide services to clients. Information about how EY collects and uses personal data and a description of the rights individuals have under data protection legislation are available via ey.com/privacy. EY member firms do not practice law where prohibited by local laws. For more information about our organization, please visit ey.com.
© 2021 Ernst & Young, Australia. All Rights Reserved.
Liability limited by a scheme approved under Professional Standards Legislation.
In line with EY’s commitment to minimise its impact on the environment, this document has been printed on paper with a high recycled content.
This communication provides general information which is current at the time of production. The information contained in this communication does not constitute advice and should not be relied on as such. Professional advice should be sought prior to any action being taken in reliance on any of the information. Ernst & Young disclaims all responsibility and liability (including, without limitation, for any direct or indirect or consequential costs, loss or damage or loss of profits) arising from anything done or omitted to be done by any party in reliance, whether wholly or partially, on any of the information. Any party that relies on the information does so at its own risk.
ey.com
Steve BrownPartner
Strategy & Transactions EconomicsM +61 437 979 179E [email protected]
Chris NadarajahDirector
Strategy & Transactions EconomicsM +61 402 277 171E [email protected]
Meet our team
Madeline DunkSenior Consultant
Strategy & Transactions EconomicsM +61 488 180 045 E [email protected]