the economic performance of swiss regions def
TRANSCRIPT

Center for Competitiveness University of Fribourg Switzerland
The Economic Performance of Swiss Regions Indicators of Economic Performance, Composition of Cantonal Economies and Clusters of Traded Industries
Philippe Gugler Michael Keller December 2009

The Economic Performance of Swiss Regions – Center for Competitiveness, 2009
1

Table of Contents
The Economic Performance of Swiss Regions – Center for Competitiveness, 2009
2
The Economic Performance of Swiss Regions Indicators of Economic Performance, Composition of Cantonal Economies and Clusters of Traded Industries
Table of Contents TABLE OF CONTENTS 2 LIST OF FIGURES 3 LIST OF TABLES 3 INTRODUCTION 4 INDICATORS OF CANTONAL ECONOMIC PERFORMANCE 5 COMPOSITION OF CANTONAL ECONOMIES 12 CLUSTERS OF TRADED INDUSTRIES 18 CONCLUSION 29 BIBLIOGRAPHY 30 APPENDIX 32
List of Figures / Tables
The Economic Performance of Swiss Regions – Center for Competitiveness, 2009
3
List of Figures FIGURE 1: INDICATORS OF ECONOMIC PERFORMANCE 6 FIGURE 2: CANTONAL REVENUE PER CAPITA 2005, IN 1000 CHF 7 FIGURE 3: CANTONAL REVENUE PER CAPITA CAGR 2000-2005, IN % 7 FIGURE 4: MEDIAN GROSS MONTHLY WAGE 2008, IN CHF 8 FIGURE 5: MEDIAN GROSS MONTHLY WAGE CAGR 1998-2008, IN % 9 FIGURE 6: EMPLOYMENT CAGR 1995-2005, IN % 9 FIGURE 7: PATENTS PER 1000 EMPLOYEES (2005), 1978-2006, CANTONS AND DISTRICTS 10 FIGURE 8: SHARE OF PATENTS SINCE 2000, IN % 11 FIGURE 9: COMPOSITION OF THE SWISS ECONOMY 16 FIGURE 10: TRADED AND RESOURCE DEPENDENT INDUSTRIES: CANTONAL PROFILES 17 FIGURE 11: CLEANTECH CLUSTER FRIBOURG 24 FIGURE 12: MAIN CLUSTERS, TOP LQS 26 FIGURE 13: EMPLOYMENT INTENSIVE CLUSTERS, TOP LQS 27 FIGURE 14: SPECIALIZED CLUSTERS, TOP LQS 28 APPENDIX FIGURE 1: GDP PER EMPLOYEE 2005, IN1000 USD PPP 1997, 2000 PRICES 32 APPENDIX FIGURE 2: GDP PER EMPLOYEE CAGR 1995-2005, IN % 32 APPENDIX FIGURE 3: EXPORT VALUE PER EMPLOYEE 2005, IN CHF 33 APPENDIX FIGURE 4: EXPORT VALUE PER EMPLOYEE CAGR 2001-2005, IN % 33 APPENDIX FIGURE 5: REGIONAL DISPOSABLE INCOME 2008, CH = INDEX 34 APPENDIX FIGURE 6: NEW ESTABLISHMENTS BETWEEN 2003 AND 2005 34
List of Tables TABLE 1: MOST AND LEAST CONCENTRATED SWISS INDUSTRIES 14 TABLE 2: INDUSTRY CLASSIFICATION 15 TABLE 3: SWISS CLUSTER-MAPPING OF THE EUROPEAN CLUSTER OBSERVATORY 20 TABLE 4: POTENTIAL CROSS-BORDER CLUSTER DEFINITIONS 23 TABLE 5: NARROW CROSS-BORDER CLUSTER DEFINITIONS 23 APPENDIX TABLE 1: CANTONAL KEY INDUSTRIES 35

The Economic Performance of Swiss Regions – Center for Competitiveness, 2009
4
Introduction
Switzerland is a federal country consisting of 26 states named cantons.1 Berne is the seat of
the federal authorities. The country is located in Western Europe where it is bordered by
Germany to the north, France to the west, Italy to the south and Austria and Liechtenstein to
the east. Switzerland is a landlocked country of 41’285 km2 and comprises approximately 7.7
million people. Switzerland is one of the richest countries in the world by per capita GDP,
67’384 US$ in 2008 (WEF, 2009). According to the Global Competitiveness Report,
Switzerland is the most competitive nation in the world (WEF, 2009). However, there are
significant differences in economic performance of Swiss cantons.
Indeed, there are substantial differences in economic performance across regions in virtually
every country. This suggests that most of the main determinants of economic performance are
to be found at the regional level. In his paper “The Economic Performance of Regions”,
Michael Porter (2003) proposed a complementary approach to the previous contributions
dedicated to regional performances of regions or cities. His paper examines broad indicators
of economic performance, the composition of regional economies and the role of clusters in
the US economy over the period 1990 to 2000. It offers an interesting framework for the
analysis of economic performance of regions in other countries.
In this paper we adopt Michael Porter’s framework to examine the economies of the Swiss
cantons. First, we present data on the differences in cantonal economic performances
according to several indicators. Secondly, we use data of industry employment across
geography to decompose cantonal economies into traded, local, and resource-dependent
industries. Thirdly we identify clusters of traded industries in Switzerland according to the
approach of the U.S. cluster-mapping project and the European Cluster Observatory. In this
third section, we then propose a complementary cluster-mapping approach for Switzerland
and provide some basic results.
1 Lake Geneva Region: GE: Geneva, VD: Vaud, VS: Valais, Espace Mittelland: BE: Berne, FR: Fribourg, JU: Jura, NE: Neuchâtel, SO: Solothurn. Northwestern Switzerland: AG: Aargau, BL: Basel-Country, BS: Basel-City. Zurich: ZH: Zurich. Eastern Switzerland: AI: Appenzell Inner-Rhodes, AR: Appenzell Outer-Rhodes, GL: Glarus, GR: Graubünden, SG: St. Gallen, SH: Schaffhausen, TG: Thurgau. Central Switzerland: LU: Lucerne, NW: Nidwalden, OW: Obwalden, SZ: Schwyz, UR: Uri, ZG: Zug. Ticino: TI: Ticino.

The Economic Performance of Swiss Regions – Center for Competitiveness, 2009
5
Indicators of Regional Economic Performance
International comparisons of economic performance are commonly drawn with respect to
national gross domestic products (GDP). Data of the Federal Statistical Office (FSO) does not
allow an analogous analysis at the regional level in Switzerland however. The FSO has never
published regionalized GDPs but only cantonal revenues (CR) derived from gross national
product (GNP). The most recent cantonal revenues (2005) are presented to introduce this
section of the paper.
Admittedly, the use of cantonal revenues as an indicator of regional economic performance is
questionable both regarding theoretical and methodological issues. GNP reflects the value of
all goods and services produced by labor and property supplied by the residents of a country
(or region), as in opposition to GDP, which reflects the value of goods and services produced
in a country (or region). To capture the prosperity created in actual fact within the territorial
borders of a given region, GNP is thus an imperfect indicator. Moreover, the regionalization
of the Swiss GNP has frequently been criticized on methodological grounds. As a result the
FSO decided to suspend the publication of cantonal revenues in 2008.
Hence, the presentation of the cantonal revenues is followed by a set of alternative indicators.
In his paper “The Economic Performance of Regions”, Michael Porter (2003) proposed a
complementary approach to measure and to compare the economic performance of regions.
According to Porter, the regional standard of living is determined by the productivity of its
economy (Porter et al., 2004). Productivity determines the wages that can be sustained and the
returns to investment in the region. These two elements are the main components of per capita
income. As indicated by Porter “Productivity, contrary to popular usage, is more than just
efficiency. It depends on the value of the products or services that a region’s firms can
produce, as measured by the price they can command, not just their efficiency of producing
standard items. The central challenge for a region is to create the conditions that enable
companies operating there to achieve high productivity and sustained productivity growth”
(Porter et al., 2004).
Michael Porter’s analysis of the economic performance of US Economic Areas is based on
three core indicators, namely wages, employment growth and patenting intensity. In a follow-
up study on rural U.S. regions (Porter et al., 2004) he proposed some additional indicators.

The Economic Performance of Swiss Regions – Center for Competitiveness, 2009
6
Figure 1 shows the indicators of regional economic performance according to Michael
Porter’s framework. The results of the three core indicators for the Swiss cantons are
presented below. Data for the additional indicators is provided in the Appendix (Appendix
Figure 1-6).
Figure 1: Indicators of Economic Performance Source : Adapted on the basis of Porter, M. E., Ketels, C., Miller, K. & Bryden, R. (2004).
Competitiveness in Rural U.S. Regions : Learning and Research Agenda. Boston. & Porter, M. E. (2003). The Economic Performance of Regions. Regional Studies. No 37, 6&7.
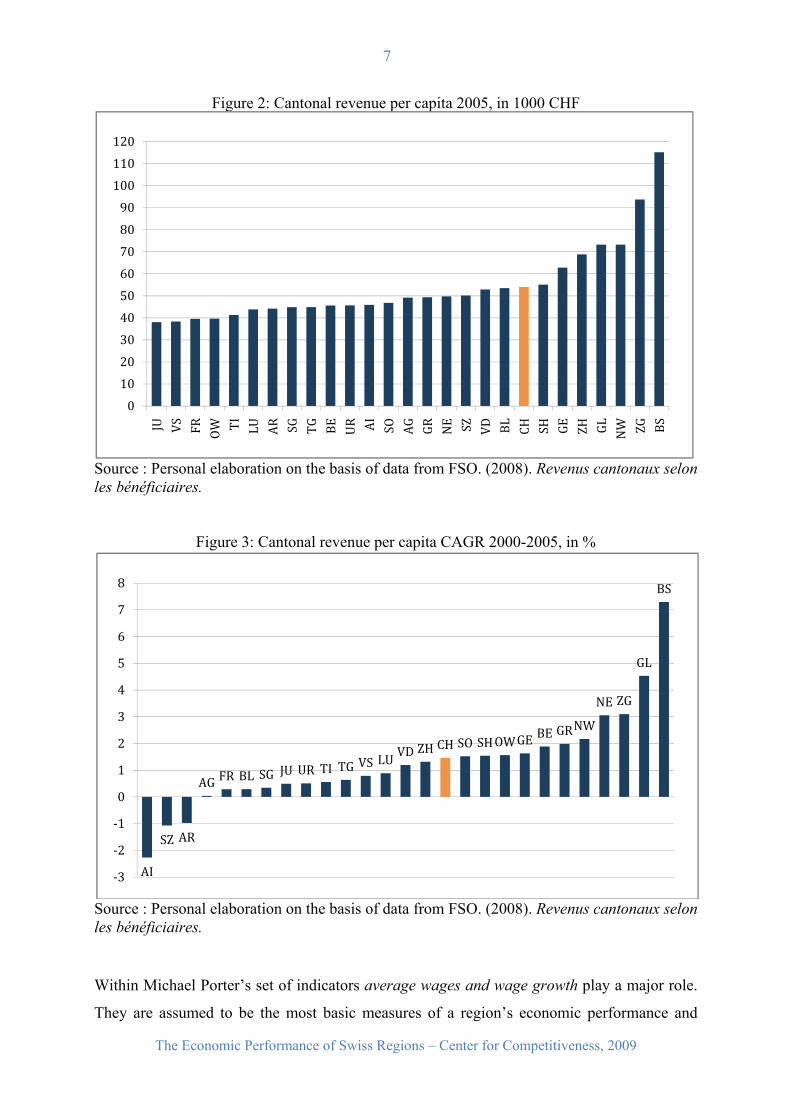
The most recent cantonal revenues per capita (2005) are presented in Figure 2. The average
per capita revenue in Switzerland was 54’000 CHF in 2005. There is a striking variation in
per capita revenues among the 26 cantons, ranging from 115’000 CHF in Basel-City to
38’000 CHF in Jura. Likewise, Basel-City experienced the highest compound annual growth
rate (CAGR)2 in per capita revenue from 2000-2005 (7.29%) whereas the average CAGR was
1.46% and three cantons (AI, SZ, AR) experienced a revenue decrease in the same period (see
Figure 3).
2 The compound annual growth rate (CAGR) is defined as follows:
with = final value, = initial value and = number of years between the vertices.
Current Economic Performance Innovation Performance
• Average wages / growth • Employment growth • Regional GDP per employee • Regional disposable income • Regional export levels per employee
/ growth
• Patents per employee / growth • New establishments
The Economic Performance of Swiss Regions – Center for Competitiveness, 2009
7
Figure 2: Cantonal revenue per capita 2005, in 1000 CHF
Source : Personal elaboration on the basis of data from FSO. (2008). Revenus cantonaux selon les bénéficiaires.
Figure 3: Cantonal revenue per capita CAGR 2000-2005, in %
Source : Personal elaboration on the basis of data from FSO. (2008). Revenus cantonaux selon les bénéficiaires.
Within Michael Porter’s set of indicators average wages and wage growth play a major role.
They are assumed to be the most basic measures of a region’s economic performance and
0102030405060708090100110120
JU VS FR OW TI LU AR SG TG BE UR AI SO AG GR NE SZ VD BL CH SH GE ZH GL NW ZG BS
AI
SZ AR
AG FR BL SG JU UR TI TG VS LUVD ZH CH SO SHOWGE BE
GRNW
NE ZG
GL
BS
‐3
‐2
‐1
0
1
2
3
4
5
6
7
8

The Economic Performance of Swiss Regions – Center for Competitiveness, 2009
8
most associated with its standard of living (Porter, 2003). Due to Switzerland’s small
geographical size, comprehensive regional data on wages is difficult to obtain. In most cases,
data is only available for the seven Swiss NUTS 2 regions.3 Moreover, wage data comes
from sample surveys. Compared to exhaustive census data, the reliability of sample wage data
is frequently disputed in Switzerland.
In 2008, the average median gross monthly wage in Switzerland was 5823 CHF. The highest
median wage was observed in the Zurich region (6250 CHF) and the lowest in the Ticino
region (4983) (see Figure 4). Over the period 1998-2008 the Swiss regions experienced on
average a CAGR of 1.32%. Three regions experienced a below average CAGR: Zurich, wage
leader in 2008, on the one hand, and Ticino and Eastern Switzerland on the other (see Figure
5). Regional wage inequality was stable over the 1998-2008 period, with a wage GINI
coefficient of 0.045 in both 1998 and 2008. However, the GINI coefficient of intermediate
years signalizes an intermittent decrease of regional wage inequality, followed by anew
increase since 2006 (GINI 2002: 0.031; GINI 2006: 0.028).
Figure 4: Median gross monthly wage 2008, in CHF
Source: Personal elaboration on the basis of data from FSO. (2008). Enquête biannuelle sur la structure des salaires 1998, 20000, 2002, 2004, 2006, 2008. 3 The Swiss cantons correspond to NUTS 3 regions. NUTS 2 regions in Switzerland are composed of 1-7 cantons each: Lake Geneva Region (GE, VD, VS), Espace Mittelland (BE, FR, NE, SO, JU), Northwestern Switzerland (BS, BL, AG), Zurich (ZH), Eastern Switzerland (SH, TG, SG, AI, AR, GL, GR), Central Switzerland (LU, ZG, NW, OW, SZ, UR), Ticino (TI).
49835439 5674 5716 5823 5938 6095 6250
01000200030004000500060007000

The Economic Performance of Swiss Regions – Center for Competitiveness, 2009
9
Figure 5: Median gross monthly wage CAGR 1998-2008, in %
Source : Personal elaboration on the basis of data from FSO. (2008). Enquête biannuelle sur la structure des salaires 1998, 20000, 2002, 2004, 2006, 2008.
Figure 6: Employment CAGR 1995-2005, in %
Source : Personal elaboration on the basis of data from FSO. (2008). Recensement fédéral des entreprises 1995, 2001, 2005.
11.13
1.24 1.32 1.37 1.46 1.5 1.56
00.20.40.60.81
1.21.41.61.8
UR GLGR AR
BSSO NE JU
BE VS TI TG SHCH
OWAG SG LU BL ZH FR VD
SZ AI GENW
ZG
‐2
‐1.5
‐1
‐0.5
0
0.5
1
1.5
2

The Economic Performance of Swiss Regions – Center for Competitiveness, 2009
10
Unlike wage data, employment data is available at the cantonal level, stemming from an
exhaustive survey. At the national level, employment growth over the 1995-2005 period was
virtually zero. However, a striking variation across cantons can be observed. Employment
CAGR ranged from -1.38% in Uri to +1.77% in Zug.
Patenting intensity, the third core indicator proposed by Michael Porter, is a more forward-
looking measure of regional performance and considered to be the best available and
comparable measure of innovative activity across regions (Porter, 2003). Since the Federal
Statistical Office (FSO) does not publish patent data, we use the OECD REGPAT Database,
listing all patent applications to the European Patent Office between 1978-2006. We mapped
patents to cantons by assigning each patent to the canton in which the inventor resides.
Moreover, we refined the regional division to the level of the 175 Swiss districts in order to
get a more precise image of innovation activity in Switzerland (see Figure 7).
Figure 7: Patents per 1000 employees (2005), 1978-2006, cantons and districts
Note: The figure only represents districts with both above-swiss-average and above-cantonal-average patenting intensity. Source: Personal elaboration on the basis of data from OECD. (2008). REGPAT Database et de l’FSO. (2008). Recensement fédéral des entreprises 1995, 2001, 2005.
0
25
50
75
100
UR VS JU SZ AI LU TI BE OW GE GR TG SO BL AR SG FR CH ZH GL VD AG NE ZG SH BS NW
Vevey
LausanneAubonne
Hinwil
MeilenLa Sarine
Rorschach
See
Schaffhausen
Neuchâtel
Baden
Winterthur
Uster
Oberrheintal
Unterrheintal
Untertoggenburg
Waldenburg
Lebern
Dorneck
Plessur
Biel
Nidwalden
Basel
Zug
Glarus

The Economic Performance of Swiss Regions – Center for Competitiveness, 2009
11
Patenting intensity is measured by patents per 1000 employees over the 1978-2006 period.
Again, a striking variation across cantons can be observed. Over the 1978-2006 only 6.11
patents per 1000 employees are assigned to the canton of Uri, whereas the figure for the
canton of Nidwalden is 93.31. The same analysis at the level of the 175 Swiss districts reveals
some hot spots of patenting intensity. Districts such as Baden (AG), Vevey (VD) or
Winterthur (ZH) clearly outperformed their canton’s average over the 1978-2006 period.
The 1978-2006 period has finally been fractionned into before and after 2000 in order to
examine, for which cantons a good overall result (1978-2006) is driven by recent innovations
(patents since 2000) (see Figure 8).
Figure 8: Share of patents since 2000, in %
Source: Personal elaboration on the basis of data from OECD. (2008). REGPAT Database et de l’FSO. (2008). Recensement fédéral des entreprises 1995, 2001, 2005.
VS
GL URBS
SO LU GEAG ZH SZ
TG CH SG TI AR AI BEGR JU
VD FRZGNWSH NE
BLOW
0
10
20
30
40
50
60

The Economic Performance of Swiss Regions – Center for Competitiveness, 2009
12
Composition of Cantonal Economies According to Michael Porter, a part of the variety in economic performance of regions can be
explained by the composition of regional economies. He examined the differing types of
industries that constitute a regional economy. The concentration patterns of economic activity
by industry over regions reveals three different broad categories of industries, with very
different patterns of spatial competition and different drivers of locational behaviour (Porter,
2003). These three types of industries are local industries, resource dependent industries and
traded industries. On the one hand, local industries are those present in most if not all
geographical areas, are evenly distributed in space and hence primarily sell locally. Traded or
resource dependent industries, on the other hand, are concentrated in a subset of geographical
areas and sell to other regions and nations. A further distinction has been made between
traded and resource dependent industries. Whereas the latter tend to locate where the needed
natural resources are found, traded industries locate in a particular region based on broad
competitive considerations (Porter, 2003).
Traded industries are fundamental to prosperity. Michael Porter (2003) provided empirical
evidence for the U.S., suggesting that traded industries have higher wages, higher wage
growth, higher productivity and higher patenting rates. Moreover, the average level of local
wages in a region is strongly associated with the average level of traded wages.
Due to the striking lack of comprehensive regionalized wage data in Switzerland, the paper at
hand does not expand in the investigation of such interrelations for the Swiss economy. In the
light of the empirical evidence from the U.S. it seems however interesting to separate Swiss
industries into local industries, resource dependent industries and traded industries. A
particular importance of this decomposition results from the fact that it forms the basis of the
detection of clusters (see section “Clusters of Traded Industries”). In fact, traded industries are
characterized by an uneven distribution of employment in space and thus likely to be
clustered in particular regions.

The Economic Performance of Swiss Regions – Center for Competitiveness, 2009
13
We abide by the computation strategy proposed by Michael Porter (2003) and utilize the
actual distribution of employment by industry to separate Swiss industries into local, traded or
resource dependent, using data from 2005.4 The computation of concentration patterns sets
the starting point of the decomposition. The concentration of Swiss industries has been
computed in a first step by the means of the locational Gini coefficient, simply defined as the
Gini coefficient of the cantonal location quotients (LQ)5. The locational Gini coefficient takes
on values in [0,1], where a value of zero denotes equal distribution of LQs across cantons and
a value of one denotes extreme inequality and thus extreme concentration of the considered
industry in a few cantons.
The choice of the locational Gini coefficient as a measure of industry concentration across
locations is consistent with international standard and allows for comparability with
concentration patterns in other countries (cf. Jayet (1993) in general, Combes et al. (2004)
regarding the European Union, Fujita et al. (2004) regarding Japan and China and Holmes et
al. (2004) regarding North America). The choice of the cantons as geographical base units has
been of practical nature. More detailed geographical divisions would require the use of a
concentration measure taking special account of randomness problems, as the Ellison-Glaeser
4 The computation relies on the most recent exhaustive employment data from the Federal Statistical Office (FSO. (2008). Recensement fédéral des enterprises 1995, 2001, 2005.). The used employment data are given in full-time equivalences in each case. They are available for 1995, 2001 and 2005 and in the form of private-only or total-aggregate employment. The provided results in this paper are exclusively based on 2005 total-aggregate employment data with regard to static computations, and based on 1995 and 2005 total-aggregate employment data with regard to dynamic computations. The fundamental computations (industry classification and cantonal key industry computation) have been conducted on the basis of all available data and showed to be robust to changes in the used base year and type of employment. Data is specified according to the NOGA General Classification of Economic Activities 2002 at a 2-digit level. A more detailed classification could not be implemented for the present report due to the latter’s comprehensiveness. However, it could be of great use to conduct further specific research on the basis of a more detailed classification. 5 The LQ is a ratio of a location’s share of industry employment to its share of total employment. Values > 1 indicate that the location has more of its employment in a particular industry than would be predicted based on its total employment share. It can be read as a measure of specialization of a location in a particular industry. The LQ is defined as follows:
LQij =Yij
Yiji=1
n
∑:
Yijj=1
m
∑
Yijj=1
m
∑i=1
n
∑,
= industry employment in particular geographical area, = total industry employment (all areas),
= total employment in particular area, =total employment (all areas).
ijY∑=
n
iYij
1
∑=
m
j
Yij1
Yijj=1
m
∑i=1
n
∑

The Economic Performance of Swiss Regions – Center for Competitiveness, 2009
14
index for example (Holmes et al., 2004). However, such measures rely on employment data at
the plant level, which are not available for Switzerland.
Table 1 shows the most and least concentrated Swiss industries according to the locational
Gini coefficient.
Table 1: Most and least concentrated Swiss industries Industry Locational Gini
coefficient 2005
Locational Gini coefficient 1995
Ten year variation
11 Crude petroleum and natural gas 0.92 0.59 +0.33 16 Manufacture of tobacco products 0.88 0.64 +0.25 62 Air transport 0.67 0.61 +0.05 23 Manufacture of coke, refined petroleum 0.62 0.52 +0.10 19 Tanning and dressing of leather; 0.60 0.54 +0.06 17 Manufacture of textiles and textile products 0.53 0.42 +0.11 18 Manufacture of wearing apparel 0.52 0.57 -0.05 61 Water transport 0.51 0.47 +0.04 24 Manufacture of chemicals 0.50 0.60 -0.10 25 Manufacture of rubber and plastic products 0.47 0.40 +0.07
91 Activities of membership organizations n.e.c. 0.15 0.14 +0.01 90 Sewage and refuse disposal, sanitation 0.15 0.19 -0.04 74 Other business activities 0.11 0.11 +0.00 45 Construction 0.11 0.09 +0.02 60 Land transport; transport via pipelines 0.10 0.13 -0.04 50 Sale and repair of motor vehicles 0.09 0.07 +0.02 80 Education 0.08 0.09 0.00 85 Health, veterinary and social work 0.07 0.08 -0.01 52Retail trade 0.06 0.05 +0.01 93 Other service activities 0.05 0.04 +0.01
Source: Personal computation based on data from FSO. (2008). Recensement fédéral des enterprises 1995, 2001, 2005.
Two more measures of the variation of industry employment across geography have been
added to the locational Gini coefficient: The share of national employment for all cantons
with LQ ≥ 1 and the mean LQ of the top five cantons ranked by LQ (Porter, 2003). The
cutoffs proposed by Porter have been established so as to draw the line between traded or
resource dependent industries on the one side, and local industries on the other. The further
distinction between traded and resource dependent industries has been made on a purely
intuitive basis. The established cutoffs and the results for traded and resource dependent
industries are summed up in Table 2.

The Economic Performance of Swiss Regions – Center for Competitiveness, 2009
15
Table 2: Industry classification
Industry
C1 C2 C3 Classification
01 Agriculture and forestry RESOURCE DEPENDENT 02 Forestry, logging and related services RESOURCE DEPENDENT05 Fishing and fish farming RESOURCE DEPENDENT11 Crude petroleum and natural gas RESOURCE DEPENDENT14 Other mining and quarrying RESOURCE DEPENDENT15 Manufacture of food products and beverages TRADED 16 Manufacture of tobacco products TRADED 17 Manufacture of textiles and textile products TRADED 18 Manufacture of wearing apparel TRADED 19 Tanning and dressing of leather; manufacture footwear TRADED 20 Manufacture of wood and of products of wood and cork TRADED 21 Manufacture of pulp, paper and paper products TRADED 23 Manufacture of coke and refined petroleum products TRADED 24 Manufacture of chemicals and chemical products TRADED 25 Manufacture of rubber and plastic products TRADED 26 Manufacture of other non-metallic mineral products TRADED 27 Manufacture of basic metals TRADED 28 Manufacture of fabricated metal products TRADED 29 Manufacture of machinery and equipment TRADED 30 Manufacture of office machinery, data processing devices TRADED 31 Manufacture of electrical machinery and apparatus TRADED 32 Manufacture of radio and communication equipment TRADED 33 Manufacture of precision instruments, watches TRADED 34 Manufacture of motor vehicles, trailers and semi-trailers TRADED 35 Manufacture of other transport equipment TRADED 36 Manufacture of furniture, jewellery and other goods TRADED 37 Recycling TRADED 40 Electricity, gas, steam and hot water supply TRADED 41 Collection, purification and distribution of water RESOURCE DEPENDENT55 Hotels and restaurants TRADED 61 Water transport RESOURCE DEPENDENT62 Air transport RESOURCE DEPENDENT65 Monetary intermediation TRADED 67 Activities auxiliary to financial intermediation TRADED 73 Research and development TRADED
Note: Criterion 1 (C1): Locational Gini coefficient ≥ 0.3. Criterion 2 (C2): Industry employment in Cantons with LQ ≥ 1 of ≥ 50% of total industry employment. Criterion 3 (C3): Mean LQ of the top five Cantons ≥ 2.
Source: Personal computation based on data from FSO. (2008). Recensement fédéral des enterprises 1995, 2001, 2005.

The Economic Performance of Swiss Regions – Center for Competitiveness, 2009
16
Figure 9 shows the composition of the Swiss economy in terms of traded, resource dependent
and local industry employment. With 67 % in local, 28 % in traded and 5 % in resource
dependent industries the outcomes for Swiss employment are comparable to the results for
U.S. employment (cf. Porter et. al, 2004). However, the composition of the economy varies
markedly between cantons. Figure 10 gives a comprehensive picture of the composition of
cantonal economies. The figure draws a profile for each canton with respect to total traded
employment, share of traded employment, CAGR of traded employment and total resource
dependent employment. There is no noticeable relationship between the share of traded
industry employment and traded industry employment CAGR. However, some patterns stand
out. The top five cantons in terms of traded industry employment CAGR (AI, ZG, NW, FR,
OW) are cantons with comparatively low total traded employment and three of them belong
to the 1st tercile of cantons ordered by share of resource dependent employment. All the
cantons belonging to this 1st tercile have a below-average patenting intensity for the 1978-
2006 period. Moreover, it is observable that the two biggest cantons in terms of population
(ZH, BE) have fairly similar profiles and are close to the average Swiss profile. The two
mountainous cantons in the south of Switzerland (GR, VS) have similar profiles as well.
Figure 9: Composition of the Swiss economy
Source: Personal computation based on data from FSO. (2008). Recensement fédéral des enterprises 1995,
2001, 2005.
28.55%
4.72%66.73%
TRADED Industries
RESOURCE DEPENDENT Industries
LOCAL Industries

The Economic Performance of Swiss Regions – Center for Competitiveness, 2009
17
Figure 10: Traded and resource dependent industries: Cantonal profiles
Notes: The bubble size represents the Canton’s total traded industry employment. : 1st tercile of Cantons ordered by share of resource dependent employment. : 2nd tercile of Cantons ordered by share of resource dependent employment. : 3rd tercile of Cantons ordered by share of resource dependent employment. : CH average Source: Personal computation based on data from FSO. (2008). Recensement fédéral des enterprises 1995,
2001, 2005.
ZH
BE
UR
SZ
OW
NW
GL
ZG
FR
SOBS
TGSH
AR
AI
SG
GRAG
BL
TI
VD
VS
NE
GE
JULU
‐2.5
‐1.25
0
1.25
20 25 30 35 40 45
Traded industry employm
ent CAGR 19952005 (%)
Share of traded industry employment 2005 (%)

The Economic Performance of Swiss Regions – Center for Competitiveness, 2009
18
Clusters of Traded Industries Spatial agglomeration of economic activities has caught the imagination of scholars and
policy makers for years. Since the late 1980s spatial issues have experienced a renaissance
within economics. Authors such as Allen Scott (1988), Michael Porter (1990) and Paul
Krugman (1991) laid the foundations for a comprehensive economic analysis of potential
efficiency benefits of industrial clustering. In the course of what is now known as the “New
Economic Geography”, industrial clusters have become a well-established concept in various
fields of economic theory.
According to Michael Porter, the presence of clusters, or geographic concentrations of linked
industries (Porter, 2003) is one of the most striking features of regional economies. Porter
defines clusters as “a geographically proximate group of interconnected companies, suppliers,
service providers and associated institutions in a particular field, linked by externalities of
various types” (Porter, 2003). Academic researches and empirical evidences have showed that
clusters enhance regional competitiveness as they increase productivity and efficiency, boost
innovation and favor the attraction of new firms and start-ups (Porter, 1998). Hence, it is an
integral part of the analysis of regional economic performance to detect clusters.
The basic approach of cluster-mapping goes back to Porter’s seminal work on economic
clusters (1990) and his systematic identification of clusters in the U.S. (Rosenthal, 2004). The
U.S. cluster-mapping project is the most comprehensive of its kind and forms at the same time
the basis of the European Cluster Observatory’s, the second important cluster-mapping
project in the world covering also Switzerland.
The elementary strategy of the U.S. cluster-mapping project, its adoption by the European
Cluster Observatory and the results for the Swiss regions are briefly described as follows. In a
first step of the project, concentration patterns of U.S. industry employment have been
computed. On this basis, all industries in the economy have been separated into “traded or
resource dependent” and “local” industries, with the aim of identifying a restricted subset of
industries characterized by an uneven distribution of employment in space (traded industries)
and thus likely to be clustered in particular regions (see section “Composition of Cantonal
Economies”). It is among this last class of industries that clusters have been identified, using
localization correlation of industries across geographical areas (Porter, 2003). Conjointly

The Economic Performance of Swiss Regions – Center for Competitiveness, 2009
19
clustering industries have been deduced from generally observed industry-interlinkages to
form what is called a “cluster definition”. Overall, the U.S. cluster-mapping project has
identified 41 of such cluster definitions (http://data.isc.hbs.edu/isc/). Finally specific regions
with an over-average employment proportion in a particular cluster have been identified using
a measure of regional specialization (location quotients, LQ).
The strategy of the U.S. cluster-mapping project has been adopted by the European Cluster
Observatory to establish a cluster-mapping for the European Union, covering also Switzerland
(www.clusterobservatory.eu). Two main difficulties have come up during this procedure.
First, the methodology used to identify localization correlations in the U.S. has exploited
unique characteristics of the U.S. economy, which is by far the largest economy in the world,
in which virtually every industry and cluster is present, and which consists of a large number
of distinct but interrelated regions. Such a methodology is not feasible in any other country
(Porter, 2003). Therefore, the European Cluster Observatory has decided to adopt the pre-
defined cluster definitions of the U.S. cluster-mapping project. This has led to the second
difficulty, consisting of harmonizing the European employment data to a classification level
that can be matched with the U.S. cluster definitions (DG Enterprise and Industry Report,
2007).
Table 3 sums up the top 15 clusters as they result from the mapping for Switzerland of the
European Cluster Observatory. Although the adopted strategy of the European Cluster
Observatory is comprehensible for a cluster-mapping project of such an extent, it offers the
possibility to propose complementary approaches for a small country like Switzerland. Two
potential problems are closely associated with the approach of the European Cluster
Observatory.
On the one hand, adopting pre-defined cluster definitions is problematic in two respects: First,
even if pre-defined definitions are well-matched to the conditions in the country where they
were developed, they are suspicious to underestimate the possibility of unique clustered
industry combinations in any other region. Secondly, pre-defined cluster definitions are based
on the computation of concentration patterns in a particular country (U.S. in this case).
However, it is perfectly conceivable that an industry tends to cluster in a given economy, but
not in another.

The Economic Performance of Swiss Regions – Center for Competitiveness, 2009
20
Table 3: Swiss cluster-mapping of the European Cluster Observatory
Note: Specialization is measured by the LQ. Source: DG Enterprise and Industry Report. (2007). Innovation Clusters In Europe: A Statistical Analysis and
Overview of Current Policy Support. On the other hand, a need for differentiation from the cluster-mapping of the European
Cluster Observatory results from a closer examination of its outcomes for Switzerland.
Obviously, the data of the European Cluster Observatory have been processed on a rough
regional division level. The whole cluster-mapping is conducted on the basis of NUTS 2
regions. The lines of the border of such regions are to a high degree arbitrary and do rarely
correspond to the actual extent of a cluster. The results for Switzerland leave much to be
desired with respect to this problem.6 No information is obtainable to detect whether the
indicated cluster is of major importance for the whole covered NUTS 2 region or only for a
few municipalities. Spatial connections are not visible; an indicated cluster could be
composed of many neighboring locations across, but as well of two isolated locations at the
extremities of the region. In addition, clusters of minor extent are likely to be overlooked if
they are located in a NUTS 2 region with an aggregate specialization differing heavily from
the cluster. Practitioners aiming at detecting the precise location of a cluster to design a
cluster initiative are left without advice. The indicated tobacco cluster in the Espace
6 Presumably, the situation for other countries is not less problematic. In the extreme case of Ireland no regional division is made at all. All the identified clusters appear thus to be located in the country as a whole (DG Enterprise and Industry Report, 2007).

The Economic Performance of Swiss Regions – Center for Competitiveness, 2009
21
Mittelland region sets a striking example of these shortcomings. What appears as an important
cluster in one of the biggest Swiss NUTS 2 regions turns in reality out to be limited to a few
highly specialized isolated municipalities.
In response to the aforementioned problems, the Center for Competitiveness of the University
of Fribourg, Switzerland, has developed an empirical strategy to compute a complementary,
theoretically and practically funded database on Swiss clusters, using employment data from
20057 (Keller, 2009). The concepts and some results of the Center for Competitiveness’
cluster-mapping project are described below.
The following six objectives for a Swiss cluster-mapping project have been defined:
Objective 1: Capture geographical patterns of industry location in Switzerland, in
consideration of the actual economic concentration patterns and industry interlinkages.
Objective 2: Capture geographical patterns of industry location in Switzerland, in
consideration of the potential for future clusters and cluster initiatives.
Objective 3: Abide by the elementary strategy of the U.S. cluster-mapping project and
the European Cluster Observatory to allow for comparability.
Objectives 4 & 5: Provide own cluster definitions based on concentration patterns
characteristic of the actual situation in Switzerland to allow for unique industry
interlinkages on the one hand, and to avoid considering industries, which do not
cluster in actual fact in Switzerland.
Objective 6: Geographical precision to capture the actual extent, the spatial
connections and the precise localization of Swiss clusters.
In order to achieve these objectives, the adopted computation strategy has been a multi-level
one. Beginning with preliminary computations to detect concentration patterns and to identify
clustering industries (see section “Composition of Cantonal Economies”) the strategy has
introduced the notion of cantonal key industries with a view to finally establishing two
complementary and interconnected levels of cluster definitions; broad cantonal cluster
definitions on the one hand, allowing for unique industry interlinkages, and narrow cross-
border cluster definitions on the other, focusing on maximal geographical precision.
7 Cf. Footnote 4

The Economic Performance of Swiss Regions – Center for Competitiveness, 2009
22
Cantonal key industries are those of pre-eminent importance for a canton in terms of
specialization (LQs). In practice, all the traded industries, for which a canton has a LQ ≥ 1.5
have been classified as cantonal key industries under the condition that they account for a
minimum of 500 jobs in the canton. In addition, industries have been added, for which a
canton has at the same time a LQ ≥ 1 and a CAGR exceeding the Swiss average. The
minimum employment condition has been dropped for industries with less than 10000 total
jobs in favor of a minimum condition proportional to total industry employment. A list
showing all key industries by canton is provided in the Appendix.
Broad cantonal cluster definitions have then been construed for each canton individually
around its key industries (note that not only key industries are considered, but also other
industries, including local industries). This approach is designed to a major degree to fit the
analysis of potential future clusters. The strengths of a canton in terms of its industry structure
can form the basis of a well-designed cluster initiative. In practice, the establishment of such
broad cantonal cluster definitions requires in-depth case-study knowledge of all the cantonal
economies. An example of such a broad cantonal cluster definition analysis is presented in
Figure 7. The example stems from a report of the Center for Competitiveness on the
competitiveness of Fribourg’s economy and has been designed on the basis of different earlier
case-studies and reports (Direction de l’économie et de l’emploi, 2008; RIS-WS, 2007;
Kleinewefers, 2004; Innosphere GmbH, 2003; Service de Statistique FR, 2000; Gaudard,
1999; Gaudard et al., 1996).
Given the focus on cluster initiatives, the broad cantonal cluster definitions leave much to be
desired with respect to the actual detection of existing clusters. Moreover, the arbitrary lines
of the cantonal borders contravene the requirement for geographical precision. In order to
provide a precise cross-border mapping of actual cluster occurrence, the broad individual
cluster definitions have thus to be dropped in favor of countrywide-valid cluster definitions.
In order to establish narrow cross-border cluster definitions key industry co-location has been
studied at the level of the 175 Swiss districts. The impossibility of a systematic correlation
analysis (Porter, 2003) has been bypassed by a simple intuitive approach. Frequent pairs of
industries at the district level have been shortlisted for countrywide-valid cluster definitions.
All of the shortlisted industry pairs have been tested for thematic fit, whereof eight have
eventually been proposed as potential cross-border cluster definitions. A further distinction
has been made with respect to the industry-scope of the proposed cluster definitions. For five

The Economic Performance of Swiss Regions – Center for Competitiveness, 2009
23
combinations, it has been assessed that the covered industry-scope of the definition exceeds
the desired extent for the cluster mapping. These extended clusters have to be kept in mind for
more detailed future research. The remaining industry combinations have been fixed as
narrow cross-border cluster definitions (Table 4). In addition to the newly formed definitions,
all the other traded key industries have been fixed individually as narrow cross-border cluster
definitions. Finally, concise cluster denominations have been given to all the narrow cross-
border cluster definitions. Table 5 presents the definite narrow cross-border cluster
definitions.
Table 4: Potential cross-border cluster definitions Frequent industry pairs at the district level
Potential cluster definitions
27 Basic metals / 28 Metal Products Metal clusters 28 Metal products / 29 Machinery Extended clusters: Metal - Machinery 28 Metal products / 31 Electrical machinery Extended clusters: Metal – Electrical machinery 27 Basic metals / 32 Communication equipment Extended clusters: Metal – Electronics 28 Metal products / 32 Communication equipment Extended clusters: Metal – Electronics 29 Machinery / 32 Communication equipment Extended clusters: Machinery – Electronics 31 Electrical machinery / 32 Communication equipment Electronics / Electrical machinery clusters 65 Monetary intermediation / 67 Auxiliary activities Financial clusters
Source: Personal elaboration. Table 5: Narrow cross-border cluster definitions
Clusters
Industries
Tourism clusters 55 Hotels and restaurants Financial clusters 65 Monetary intermediation / 67 Auxiliary activities Machinery clusters 29 Machinery and equipment Metal clusters 27 Basic metals / 28 Metal Products Watches / Precision instrument clusters 33 Manufacture of precision instruments, watches Chemical clusters 24 Manufacture of chemicals and chemical products Food / Beverage clusters 15 Manufacture of food products and beverages Electronics / Electrical machinery clusters 31 Electrical machinery / 32 Communication equipment Wood clusters 20 Manufacture of wood and of products of wood Plastics / Rubber clusters 25 Manufacture of rubber and plastic products Electricity / Gas clusters 40 Electricity, gas, steam and hot water supply Glass / Cement clusters 26 Manufacture of other non-metallic mineral products Research clusters 73 Research and developmentOther vehicle clusters 35 Manufacture of other transport equipment Paper / Pulp clusters 21 Manufacture of pulp, paper and paper products Textile clusters 17 Manufacture of textiles and textile products Apparel clusters 18 Manufacture of wearing apparel Motor vehicle clusters 34 Manufacture of motor vehicles and trailers Recycling clusters 37 Recycling Tobacco clusters 16 Manufacture of tobacco products Footwear / Leather clusters 19 Tanning and dressing of leather; manufacture footwearOffice machinery and data processing device clusters
30 Manufacture of office machinery, data processing devices
Petroleum and coke clusters 23 Manufacture of coke and refined petroleum products Source: Personal elaboration.

The Economic Performance of Swiss Regions – Center for Competitiveness, 2009
24
Figure 11: Example of a broad cluster definition analysis: Cleantech cluster Fribourg
Source: Personal elaboration on the basis of Gugler, P., Keller, M. & Tinguely, X. (2008). Compétitivité de l’économie fribourgeoise.
Strong industries in terms of employment (Emp.>500)
Actif Microclusters 1: Plastics microcluster 2: Security systems microcluster
Specialized industries (LQ≥1)
29 Manufacture of machinery and equipment
Traded industries
Key industries Specialized traded industries
Strong industries in terms of employment and specialization
80 Education
40 Electricity, gas and hot water supply
32 Manufacture of radio, television and communication equipment
33 Manufacture of medical, precision and optical instruments, watches
25 Manufacture of rubber and plastic products
28 Manufacture of fabricated metal products
26 Manufacture of other non-metallic mineral products
45 Construction
20 Manufacture of wood
1
2
24 Manufacture of chemicals

The Economic Performance of Swiss Regions – Center for Competitiveness, 2009
25
On the basis of the narrow cross-border cluster definitions cluster-maps have been elaborated
for each cluster. The clusters have been described in three main dimensions: First, they have
been assessed with respect to employment and concentration (measured by locational Gini
coefficient) on the basis of data from 2005. Secondly, tendencies for these two criterions have
been pointed out on the basis of data covering the period 1995-2005. Thirdly, the maps have
enabled the geographic identification of specific cluster regions.
Three categories of outstanding clusters have been derived from the clusters’ characteristics
with respect to employment and concentration. Main clusters, ranking high with respect to
both employment and concentration, employment intensive clusters, accounting for an
important share of total Swiss cluster employment but being widely dispersed over the Swiss
territory, and specialized clusters characterized by restricted employment but strong clustering
in uniquely specialized regions:
Main clusters: Financial clusters, metal clusters, watches and precision instrument
clusters, chemical clusters, electronics and electrical machinery clusters.
Employment intensive clusters: Tourism clusters, machinery clusters, food and
beverage clusters.
Specialized clusters: Textile clusters, apparel clusters, footwear and leather clusters,
tobacco clusters, petroleum and coke clusters.
A linear extrapolation of the ten-year tendency 1995-2005 has allowed looking ahead. Given
the linear representativeness of the tendency 1995-2005 for the next 20 years, Swiss clusters
will be of increased importance in 2025, in the sense that more cluster industries will rank
among one of the categories of outstanding clusters.
Finally, the cartographic analysis has enabled the detection of 24 specific cluster regions.
Figures 12-14 graphically sum up these results.

The Economic Performance of Swiss Regions – Center for Competitiveness, 2009
26
Figure 12: Main clusters, top LQs
Source: Personal computation.
Financial clusters: 1. Financial cluster Zurich.
2. Financial cluster Lugano.
3. Financial cluster Geneva.
Metal clusters: 4. Metal cluster Northern Jura.
5. Metal cluster Rheintal / Bodensee / Wil.
Chemical cluster: 6. Chemical cluster Northwestern Switzerland.
Watches cluster: 7. Watches /precision instrument cluster Jura.
Electronics clusters: 8. Electrical machinery cluster Northern Jura-Südfuss / Central
Aargau.
9. Electrical machinery cluster Zug / Zürichsee / Zürcher Oberland.
10. Electrical machinery cluster Ticino.
11. Electrical machinery cluster Lake Neuchâtel.
10
2
3
5
9
1
7
4
6 8
11
Financial clusters Metal clusters Chemical clusters Watches clusters Elec. Machinery clusters

The Economic Performance of Swiss Regions – Center for Competitiveness, 2009
27
Figure 13: Employment intensive clusters, top LQs
Note: Due to the widespread appearance of machinery clusters, no specific cluster regions have been highlighted in this map.
Source: Personal computation.
Tourism clusters: 1. Tourism cluster Valais / Berner Oberland.
2. Tourism cluster Lake Lucerne.
3. Tourism cluster Ticino.
4. Tourism cluster Grisons.
Food clusters: 5. Food cluster Fribourg / Northern Vaud.
6. Food cluster Aargau / Lucerne.
7. Food cluster Notheastern Switzerland.
1
4
2
6
5
Machinery clusters Food clusters Tourism clusters
3
7

The Economic Performance of Swiss Regions – Center for Competitiveness, 2009
28
Figure 14: Specialized clusters, top LQs
Note: Tobacco and petroleum / coke clusters are limited to a few isolated municipalities. Thus, no specific cluster regions are highlighted in this map.
Source: Personal computation.
Textile clusters: 1. Textile cluster Eastern Switzerland.
2. Textile cluster Aargau / Oberaargau / Lucerne.
Leather cluster: 3. Footwear / Leather cluster Central Jura.
Apparel clusters: 4. Apparel cluster Northeastern Switzerland.
5. Apparel cluster Aargau / Oberaargau / Lucerne.
6. Apparel cluster Ticino.
1
2
3
4
5
6
Tobacco clusters Textile clusters Petroleum / Coke clusters Footwear / Leather clusters Apparel clusters
The Economic Performance of Swiss Regions – Center for Competitiveness, 2009
29
Conclusion In this paper we have adopted Michael Porter’s framework of regional economic performance
to examine the regional economies of Switzerland. First, we have presented data on the
differences in cantonal economic performances according to several indicators. Secondly, we
have used data of industry employment across geography to decompose cantonal economies
into traded, local, and resource-dependent industries. Thirdly we have identified clusters of
traded industries in Switzerland.
We have found striking variety in the economic performance of Swiss cantons, particularly
with respect to cantonal revenues, employment growth and patenting intensity. The
composition of the Swiss economy in terms of traded, resource dependent and local industry
employment is comparable to the results for U.S. employment (cf. Porter et. al, 2004).
However, the composition of the economy varies markedly between cantons. In the third
section of the paper we have first identified the top 15 clusters of traded industries in
Switzerland according to the cluster-mapping of the European Cluster Observatory.
Secondly, two problems associated with the European Cluster Observatory’s approach have
been discussed and the Center for Competitiveness’ complementary approach has briefly been
described. Some results of the Center for Competitiveness’ cluster-mapping project have been
presented, particularly cantonal key industries, broad cantonal cluster definitions, narrow
cross-border cluster definitions and a list of specific cluster regions in Switzerland.

The Economic Performance of Swiss Regions – Center for Competitiveness, 2009
30
Bibliography BAK. (2009). BAK Basel, International Benchmarking Report 2008. Basel. Combes, P.P. & Overman, H.G. (2004). Spatial Distribution of Economic Activities in the
European Union. In: Henderson, J.V. & Thisse, J.F. (eds.). Handbook of Regional and Urban Economics, Vol 4. Elsevier, Amsterdam.
Crédit Suisse. (2008). Das verfügbare Einkommen in der Schweiz. Zürich. DG Enterprise and Industry Report. (2007). Innovation Clusters In Europe: A Statistical
Analysis and Overview of Current Policy Support, Europe INNOVA / PRO INNO Europe paper, 5.
Direction de l’économie et de l’emploi. (2008). Canton de Fribourg – Nouvelle Politique Régionale (NPR). Fribourg. Ellison, G. & Glaeser, E.L. (1997). Geographic Concentration in U.S. Manufacturing
Industries: a dartboard approach. Journal of Political Economy, 105, 889-927. FSO. (2002). NOGA, General Classification of Economic Activities 2002.
Neuchâtel. Fujita, M., Mori, T. et al. (2004). Spatial Distribution of Economic Activities in Japan and
China. In: Henderson, J.V. & Thisse, J.F. (eds.). Handbook of Regional and Urban Economics, Vol 4. Elsevier, Amsterdam.
Gaudard, G. (1999). L’économie du canton de Fribourg entre la marginalisation et
l’intégration (1848-1998). Dans Société d’histoire du canton de Fribourg Fribourg et l’Etat fédéral: intégration politique et sociale. Fribourg.
Gaudard, G., Cudré-Mauroux, C. & Etienne, P. (1996).L’évolution de l’économie fribourgeoise entre 1990 et 1995: une estimation chiffrée. Fribourg.. Gugler, P., Keller, M. & Tinguely, X. (2008). Compétitivité de l’économie fribourgeoise.
Fribourg. Holmes, T.J. & Stevens, J.J. (2004). Spatial Distribution of Economic Activities in North
America. In: Henderson, J.V. & Thisse J.F. (eds.). Handbook of Regional and Urban Economics, Vol 4. Elsevier, Amsterdam.
Innosphere GmbH. (2003). Projet “Vision 2020” pour le canton de Fribourg – Vision et stratégie de mise en oeuvre. Fribourg. Jayet, J. (1993). Analyse Spatiale Quantitative: Une Introduction. Economica, Paris. Keller, M. (2009). Swiss Cluster-Mapping Project: An Empirical Report. Fribourg. Kleinewefers, H. (2004). Die Freiburger Wirtschaft Ende 2004: Besserung auf tiefem Niveau. Fribourg.

The Economic Performance of Swiss Regions – Center for Competitiveness, 2009
31
Krugman, P. (1991a). Geography and Trade, The MIT Press, Cambridge MA. Krugman, P. (1991b). Increasing Returns and Economic Geography. Journal of Political
Economy, 99, 483-499. Porter, M. E. (2003). The Economic Performance of Regions. Regional Studies. No 37, 6&7. Porter, M. E. (1998). On Competition. Harvard Business School Press, Boston. Porter, M. E. (1990). The Competitive Advantage of Nations. Free Press, New York.
Porter, M. E., Ketels, C., Miller, K. & Bryden, R. (2004). Competitiveness in Rural U.S. Regions: Learning and Research Agenda. Harvard Business School Press, Boston.
Rosenthal, S.S. & Strange, W.C. (2004). Evidence on the Nature and Sources of
Agglomeration economies. In: Henderson, J.V. & Thisse J.F. (eds.). Handbook of Regional and Urban Economics, Vol 4. Elsevier, Amsterdam.
Scott, A.J. (1988). New Industrial Spaces. Pion, London. Service de Statistique FR, (2000). Analyse du revenu cantonal fribourgeois. Fribourg. World Economic Forum. (2009). The Global Competitiveness Report 2009-2010. Geneva. Internet: European Cluster Observatory. (www.clusterobservatory.eu). US Cluster Mapping Project. (http://data.isc.hbs.edu/isc/). Data: BAK. (2009). BAK Basel, International Benchmarking Report 2008. FCA. (2008). ). Federal Customs Administration, Exportations – Groupe de marchandises
1999, 2000, 2001, 2002, 2003, 2004, 2005, 2006, 2007. FSO. (2008). Federal Statistical Office, Revenus cantonaux selon les bénéficiaires (série
actuelle reposantsur les calculs des comptes nationaux selon SEC 95). FSO. (2008). Federal Statistical Office, Recensement fédéral des entreprises 1995, 2001,
2005. FSO. (2008). Federal Statistical Office, Enquête biannuelle sur la structure des salaires 1998,
2000, 2002, 2004, 2006, 2008. FSO. (2008). Federal Statistical Office, Démographie des entreprises 2003, 2004, 2005. OECD. (2008). REGPAT Database.

The Economic Performance of Swiss Regions – Center for Competitiveness, 2009
32
Appendix: Additional Indicators of Regional Economic Performance
Appendix Figure 1: GDP per employee 2005, in1000 USD PPP 1997, 2000 prices
Source : Personal elaboration on the basis of data from BAK. (2009). International Benchmarking Report 2008. & FSO. (2008). Recensement fédéral des entreprises 1995, 2001, 2005.
Appendix Figure 2: GDP per employee CAGR 1995-2005, in %
Source : Personal elaboration on the basis of data from BAK. (2009). International Benchmarking Report 2008. & FSO. (2008). Recensement fédéral des entreprises 1995, 2001, 2005.
0
10
20
30
40
50
60
70
80
90
100
OW VS AI TG FR NE LU SO GR SG JU UR SH AG BE VD TI SZ AR GL CH NW BL ZG GE ZH BS
0
0.5
1
1.5
2
2.5
3
AI UR NE SH NW AG SO VD SG OW JU TG VS GE ZG LU GR BE FR CH GL BL SZ TI ZH AR BS

The Economic Performance of Swiss Regions – Center for Competitiveness, 2009
33
Appendix Figure 3: Export value per employee 2005, in CHF
Source : Personal elaboration on the basis of data from FCA. (2008). Exportations - Groupe de marchandises 1999, 2000, 2001, 2002, 2003, 2004, 2005, 2006, 2007. & FSO. (2008). Recensement fédéral des entreprises 1995, 2001, 2005.
Appendix Figure 4: Export value per employee CAGR 2001-2005, in %
Source : Personal elaboration on the basis of data from FCA. (2008). Exportations - Groupe de marchandises 1999, 2000, 2001, 2002, 2003, 2004, 2005, 2006, 2007. & FSO. (2008). Recensement fédéral des entreprises 1995, 2001, 2005.
0150003000045000600007500090000105000120000135000150000165000180000195000210000225000240000255000270000285000
AI VS GR ZH BE SZ UR JU LU OW NW VD AG TG TI GL SG CH BL SH GE AR SO FR NE ZG BS
GLNE
URNW
ZHVS SZ AG
JU SOBE
TG ZG LU
FR SG CH AR SHOW
BL TI GE
GRAI
BS
VD
‐6‐5‐4‐3‐2‐10123456789101112

The Economic Performance of Swiss Regions – Center for Competitiveness, 2009
34
Appendix Figure 5: Regional disposable income 2008, CH = index 0
Source : Crédit Suisse. (2008). Das verfügbare Einkommen in der Schweiz.
Appendix Figure 6: New establishments between 2003 and 2005 per 1000 employees in 2005
Source : Personal elaboration on the basis of data from FSO. (2008). Démographie des entreprises 2003, 2004, 2005.
‐11357911131517192123252729313335
UR BE LU GL BS JU OW SO GR VS NE AG SG SH FR CH VD ZH BL TG TI GE AR AI NW SZ ZG

The Economic Performance of Swiss Regions – Center for Competitiveness, 2009
35
Appendix Table 1: Cantonal key industries
Canton Key Industries (LQ; Employment) Share of key industry employment Lake Geneva + Ticino GE 19 Tanning and dressing of leather; manufacture of footwear (3.20; 392)
65 Monetary intermediation (2.37; 17344) 67 Activities auxiliary to financial intermediation (2.24; 3335) 33 Manufacture of medical and precision instruments, watches (1.54; 7708)
13. 23 %
VD 73 Research and development (1.66; 1947) 33 Manufacture of medical and precision instruments, watches (1.06; 6404)
3.17 %
VS 23 Manufacture of coke, refined petroleum products (8.94; 217) 27 Manufacture of basic metals (3.42; 1629) 24 Manufacture of chemicals and chemical products (2.58; 5524) 40 Electricity, gas, steam and hot water supply (2.34; 1687) 55 Hotels and restaurants (2.04; 12141) 20 Manufacture of wood and of products of wood and cork (1.75; 2060)
21.18 %
TI 18 Manufacture of wearing apparel; dressing and dyeing of fur (8.64; 1713) 19 Tanning and dressing of leather; manufacture footwear (4.60; 380) 31 Manufacture of electrical machinery and apparatus n.e.c. (1.82; 2730) 27 Manufacture of basic metals (1.77; 1128) 65 Monetary intermediation (1.55; 7632) 36 Manufacture of furniture, jewellery, musical instruments and other goods (1.53; 1532) 55 Hotels and restaurants (1.50; 11650) 67 Activities auxiliary to financial intermediation (1.42; 1430) 33 Manufacture of medical and precision instruments, watches (1.07; 3604) 40 Electricity, gas, steam and hot water supply (1.04; 999)
22.36 %
Espace Mittelland BE 23 Manufacture of coke, refined petroleum products (2.25; 210)
30 Manufacture of office machinery, data processing devices (2.60; 614) 28 Manufacture of fabricated metal products (1.25; 12628) 26 Manufacture of other non-metallic mineral products (1.18; 2583)
3.8 %
FR 32 Manufacture of radio, television and communication equipment (2.33; 1301) 15 Manufacture of food products and beverages (2.27; 3515) 20 Manufacture of wood and of products of wood and cork (1.67; 1640) 26 Manufacture of other non-metallic mineral products (1.58; 753) 40 Electricity, gas, steam and hot water supply (1.06; 640)
8.57 %
JU 16 Manufacture of tobacco products (23.14; 502) 33 Manufacture of medical and precision, watches (5.97; 3934) 27 Manufacture of basic metals (4.86; 603) 32 Manufacture of radio, television and communication equipment (3.80; 663) 28 Manufacture of fabricated metal products (2.93; 2015)
27. 02 %
NE 16 Manufacture of tobacco products (21.73; 1172) 23 Manufacture of coke, refined petroleum products (14.78; 232) 33 Manufacture of medical and precision instruments, watches (5.97; 9774) 32 Manufacture of radio, television and communication equipment (2.34; 1017) 27 Manufacture of basic metals (2.05; 632) 31 Manufacture of electrical machinery and apparatus n.e.c. (1.83; 1328) 28 Manufacture of fabricated metal products (1.61; 2744) 20 Manufacture of wood and of products of wood and cork (1.15; 870)
21.61 %

The Economic Performance of Swiss Regions – Center for Competitiveness, 2009
36
SO 21 Manufacture of pulp, paper and paper products (5.03; 1796) 27 Manufacture of basic metals (3.40; 1412) 33 Manufacture of medical and precision instruments, watches (2.59; 5699) 28 Manufacture of fabricated metal products (2.10; 4828) 31 Manufacture of electrical machinery and apparatus n.e.c. (1.81; 1772) 40 Electricity, gas, steam and hot water supply (1.74; 1093) 29 Manufacture of machinery and equipment n.e.c. (1.65; 4575)
22.15 %
Nortwestern Switzerland + Zurich AG 31 Manufacture of electrical machinery and apparatus n.e.c. (3.72; 8297)
32 Manufacture of radio, television and communication equipment (2.73; 3632) 25 Manufacture of rubber and plastic products (2.40; 3740) 73 Research and development (1.97; 1919) 21 Manufacture of pulp, paper and paper products (1.93; 1567) 24 Manufacture of chemicals and chemical products (1.85; 7881) 37 Recycling (1.81; 428) 27 Manufacture of basic metals (1.74; 1648) 40 Electricity, gas, steam and hot water supply (1.72; 2473) 15 Manufacture of food products and beverages (1.39; 5133)
16.84 %
BL 73 Research and development (3.78; 1692) 24 Manufacture of chemicals and chemical products (3.14; 6153) 31 Manufacture of electrical machinery and apparatus n.e.c. (1.59; 1637) 27 Manufacture of basic metals (1.53; 668) 36 Manufacture of furniture, jewellery, musical instruments and other goods (1.43; 981)
11.09 %
BS 24 Manufacture of chemicals and chemical products (6.38; 16050) 73 Research and development (3.80; 2188) 35 Manufacture of other transport equipment (1.47; 731)
14.7 %
ZH 65 Monetary intermediation (2.07; 43462) 67 Activities auxiliary to financial intermediation (1.71; 7299) 35 Manufacture of other transport equipment (1.66; 4000)
8.79
Eastern Switzerland AI 55 Hotels and restaurants (1.97; 597)
10.68 % AR 17 Manufacture of textiles and textile products (19.65; 1104)
31 Manufacture of electrical machinery and apparatus n.e.c. (6.07; 1117)
12.35 %
GL 26 Manufacture of other non-metallic mineral products (6.35; 501) 25 Manufacture of rubber and plastic products (5.20; 564) 29 Manufacture of machinery and equipment n.e.c. (2.87; 1263)
15.34 %
GR 55 Hotels and restaurants (2.78; 12664) 40 Electricity, gas, steam and hot water supply (1.71; 944) 35 Manufacture of other transport equipment (1.58; 510)
16.85 %
SG 17 Manufacture of textiles and textile products (4.08; 2551) 25 Manufacture of rubber and plastic products (3.25; 4659) 34 Manufacture of motor vehicles, trailers and semi-trailers (2.91; 767) 30 Manufacture of office machinery, data processing devices (2.16; 242) 28 Manufacture of fabricated metal products (2.06; 9946) 29 Manufacture of machinery and equipment n.e.c. (1.90; 11053) 21 Manufacture of pulp, paper and paper products (1.83; 1371) 27 Manufacture of basic metals (1.75; 1520) 26 Manufacture of other non-metallic mineral products (1.53; 1597) 15 Manufacture of food products and beverages (1.50; 5079) 32 Manufacture of radio, television and communication equipment (1.27; 1550)
20.13 %

The Economic Performance of Swiss Regions – Center for Competitiveness, 2009
37
SH 25 Manufacture of rubber and plastic products (3.74; 835) 24 Manufacture of chemicals and chemical products (2.79; 1699) 29 Manufacture of machinery and equipment n.e.c. (2.10; 1904) 15 Manufacture of food products and beverages (1.99; 1050) 33 Manufacture of medical and precision instruments, watches (1.76; 1269)
21.61 %
TG 34 Manufacture of motor vehicles, trailers and semi-trailers (6.79; 790) 25 Manufacture of rubber and plastic products (2.82; 1785) 26 Manufacture of other non-metallic mineral products (2.69; 1237) 36 Manufacture of furniture, jewellery, musical instruments and other goods (2.35; 1423) 28 Manufacture of fabricated metal products (2.30; 4895) 35 Manufacture of other transport equipment (2.17; 742) 29 Manufacture of machinery and equipment n.e.c. (1.94; 4988) 15 Manufacture of food products and beverages (1.89; 2826) 17 Manufacture of textiles and textile products (1.82; 503) 20 Manufacture of wood and of products of wood and cork (1.70; 1610) 21 Manufacture of pulp, paper and paper products (1.58; 521)
24.09 %
Central Switzerland LU 16 Manufacture of tobacco products (4.15; 476)
36 Manufacture of furniture, jewellery, musical instruments and other goods (2.19; 2258) 35 Manufacture of other transport equipment (1.88; 1097) 20 Manufacture of wood and of products of wood and cork (1.83; 2949) 15 Manufacture of food products and beverages (1.47; 3760) 26 Manufacture of other non-metallic mineral products (1.32; 1038) 21 Manufacture of pulp, paper and paper products (1.31; 739)
8.16 %
NW 35 Manufacture of other transport equipment (23.03; 1366) 8.88 %
OW 31 Manufacture of electrical machinery and apparatus n.e.c. (8.79; 1189) 15 Manufacture of food products and beverages (2.30; 514) 55 Hotels and restaurants (1.73; 1244)
22.29 %
SZ 36 Manufacture of furniture, jewellery, musical instruments and other goods (2.06; 689) 28 Manufacture of fabricated metal products (2.03; 2393) 20 Manufacture of wood and of products of wood and cork (2.02; 1062) 25 Manufacture of rubber and plastic products (1.57; 551) 29 Manufacture of machinery and equipment n.e.c. (1.27; 1806)
13.25 %
UR 31 Manufacture of electrical machinery and apparatus n.e.c. (4.13; 535) 29 Manufacture of machinery and equipment n.e.c. (1.91; 702) 55 Hotels and restaurants (1.65; 1138)
18.74 %
ZG 32 Manufacture of radio, television and communication equipment (8.83; 3280) 67 Activities auxiliary to financial intermediation (2.23; 929) 29 Manufacture of machinery and equipment n.e.c. (1.39; 2452) 33 Manufacture of medical and precision instruments, watches (1.28; 1795)
13.90 %

The Economic Performance of Swiss Regions – Center for Competitiveness, 2009
38
ANARCHY IS ORDER